the Creative Commons Attribution 4.0 License.
the Creative Commons Attribution 4.0 License.
 | 18 Nov 2020
The growth of faults and fracture networks in a mechanically evolving, mechanically stratified rock mass: a case study from Spireslack Surface Coal Mine, Scotland
Billy James Andrews
Zoe Kai Shipton
Richard Lord
Lucy McKay
Fault architecture and fracture network evolution (and resulting bulk hydraulic properties) are highly dependent on the mechanical properties of the rocks at the time the structures developed. This paper investigates the role of mechanical layering and pre-existing structures on the evolution of strike–slip faults and fracture networks. Detailed mapping of exceptionally well exposed fluvial–deltaic lithologies at Spireslack Surface Coal Mine, Scotland, reveals two phases of faulting with an initial sinistral and later dextral sense of shear with ongoing pre-faulting, syn-faulting, and post-faulting joint sets. We find fault zone internal structure depends on whether the fault is self-juxtaposing or cuts multiple lithologies, the presence of shale layers that promote bed-rotation and fault-core lens formation, and the orientation of joints and coal cleats at the time of faulting. During ongoing deformation, cementation of fractures is concentrated where the fracture network is most connected. This leads to the counter-intuitive result that the highest-fracture-density part of the network often has the lowest open fracture connectivity. To evaluate the final bulk hydraulic properties of a deformed rock mass, it is crucial to appreciate the relative timing of deformation events, concurrent or subsequent cementation, and the interlinked effects on overall network connectivity.
- Article
(43473 KB) - Full-text XML
-
Supplement
(3163 KB) - BibTeX
- EndNote


Differences in the mechanical properties (mechanical stratigraphy) of rock layers have long been recognised as influencing the style and evolution of faults (Anderson, 1951; Donath, 1961; Ranalli and Yin, 1990; Ferrill et al., 2017). However, work has tended to focus particularly on normal faults, with the effect of mechanical layers in sand–shale sequences (e.g. van der Zee and Urai, 2005; Schmatz et al., 2010), interbedded limestones and marls (e.g. Ferrill and Morris, 2003, 2008; Long and Imber, 2011; Ferrill et al., 2012), and ignimbrites (Soden and Shipton, 2013) receiving particular attention. The lithology being cut by the fault influences fault dip, e.g. strands in competent layers have steeper dips than those in incompetent layers (Ferrill and Morris, 2008), with important consequences for vein geometry and mineralisation potential (Dunham, 1948). The ratio of competent to incompetent lithologies thus affects fault style and displacement profiles (Ferrill et al., 2017; Ferrill and Morris, 2008). Fault-related folding of thin competent layers (e.g. limestones) is common in successions otherwise dominated by incompetent lithologies (e.g. shale) (Ferrill and Morris, 2008; Lăpădat et al., 2017). The presence of incompetent lithologies also restricts fault growth with strands terminating at incompetent beds and leads to formation of faults with high length to height ratios orientated parallel to the strike of bedding (e.g. Nicol et al., 1996; Soliva and Benedicto, 2005; Roche et al., 2013).
Pre-existing weaknesses (e.g., joints and faults) also play an important role in the nucleation, orientation, and length of later faults (Crider and Peacock, 2004; Peacock, 2001; Walsh et al., 2002). The mechanical response of a pre-existing joint to faulting will depend on its orientation relative to far field stress (Moir et al., 2010), the ratio of principal stresses (Lunn et al., 2008; Healy et al., 2006; Moir, 2010; Chang and Haimson, 2000; Haimson and Chang, 2000), and local variations in the stress field due to the interaction of joints in the pre-existing network (Crider and Peacock, 2004; Kattenhorn et al., 2000; Moir et al., 2010; Peacock, 2001). Where joints or cleats are orientated perpendicular to the growth direction of faults, they can act as a strength contrast and restrict fault growth (Wilkins and Gross, 2002). Alternatively, where pre-existing joints are orientated favourably, they can act as a plane of weakness and be reactivated to form faulted joints (e.g. Crider and Peacock, 2004; Cruikshank et al., 1991; Wilkins et al., 2001).
Veins are often associated with faulting, providing evidence of the paleo-fluid flow through a fracture network (Bons et al., 2012; Oliver and Bons, 2001; Peacock and Sanderson, 2018) and may act as a baffle to post-cementation basinal fluid flow (e.g. Skurtveit et al., 2015). Additionally, the strength of a rock mass can vary depending on the strength ratio between the host-rock and veins, along with the mineralogy, thickness, and orientation of veins relative to the maximum compressive stress (e.g. Shang et al., 2016; Turichshev and Hadjigeorgiou, 2016, 2017; Virgo et al., 2014). Therefore, the cementation of faults and joints can influence subsequent deformation of the rock mass (Caputo and Hancock, 1998; Holland and Urai, 2010; Ramsay, 1980; Virgo et al., 2013, 2014).
This study utilises an exceptional succession of faulted fluvial–deltaic exposures of the Limestone Coal Formation exhumed at the Spireslack Surface Coal Mine, Scotland. Coal-bearing, fluvial–deltaic sequences are commonly mechanically stratified. Fluvial–deltaic sequences are characterised by cyclical sequences of limestone, sandstone, siltstone, seat earth (paleosols that are often found beneath coal seams), shale, and coal (Thomas, 2013, and references therein). The competent lithologies in the sequence (limestone and sandstone) commonly contain joints. Coal has a distinctive blocky texture due to the presence of two roughly perpendicular fracture sets referred to as cleats (Laubach et al., 1998). Cleats form in coal beds during diagenesis and act as pre-existing weaknesses that can influence the location, orientation, and length of faults. We investigate how the internal structure of strike–slip faults at Spireslack Surface Coal Mine depends on the lithology, presence of pre-existing weaknesses (e.g., joints, cleats), and synchronous cementation. Our observations contrast small offset, self-juxtaposing faults and faults with larger offsets that cut multiple lithologies.
Spireslack Surface Coal Mine is located in the Midland Valley of Scotland, a 90 km wide, 150 km long, ENE-trending basin that opened during the Late Devonian to Early Carboniferous in response to back-arc extension within the Laurussian Plate (Leeder, 1982, 1988). This was followed by a period of thermal subsidence that continued throughout Namurian and Westphalian times, leading to the deposition and preservation of thick coal measures across much of the UK (Fig. 1a) (Leeder, 1982).
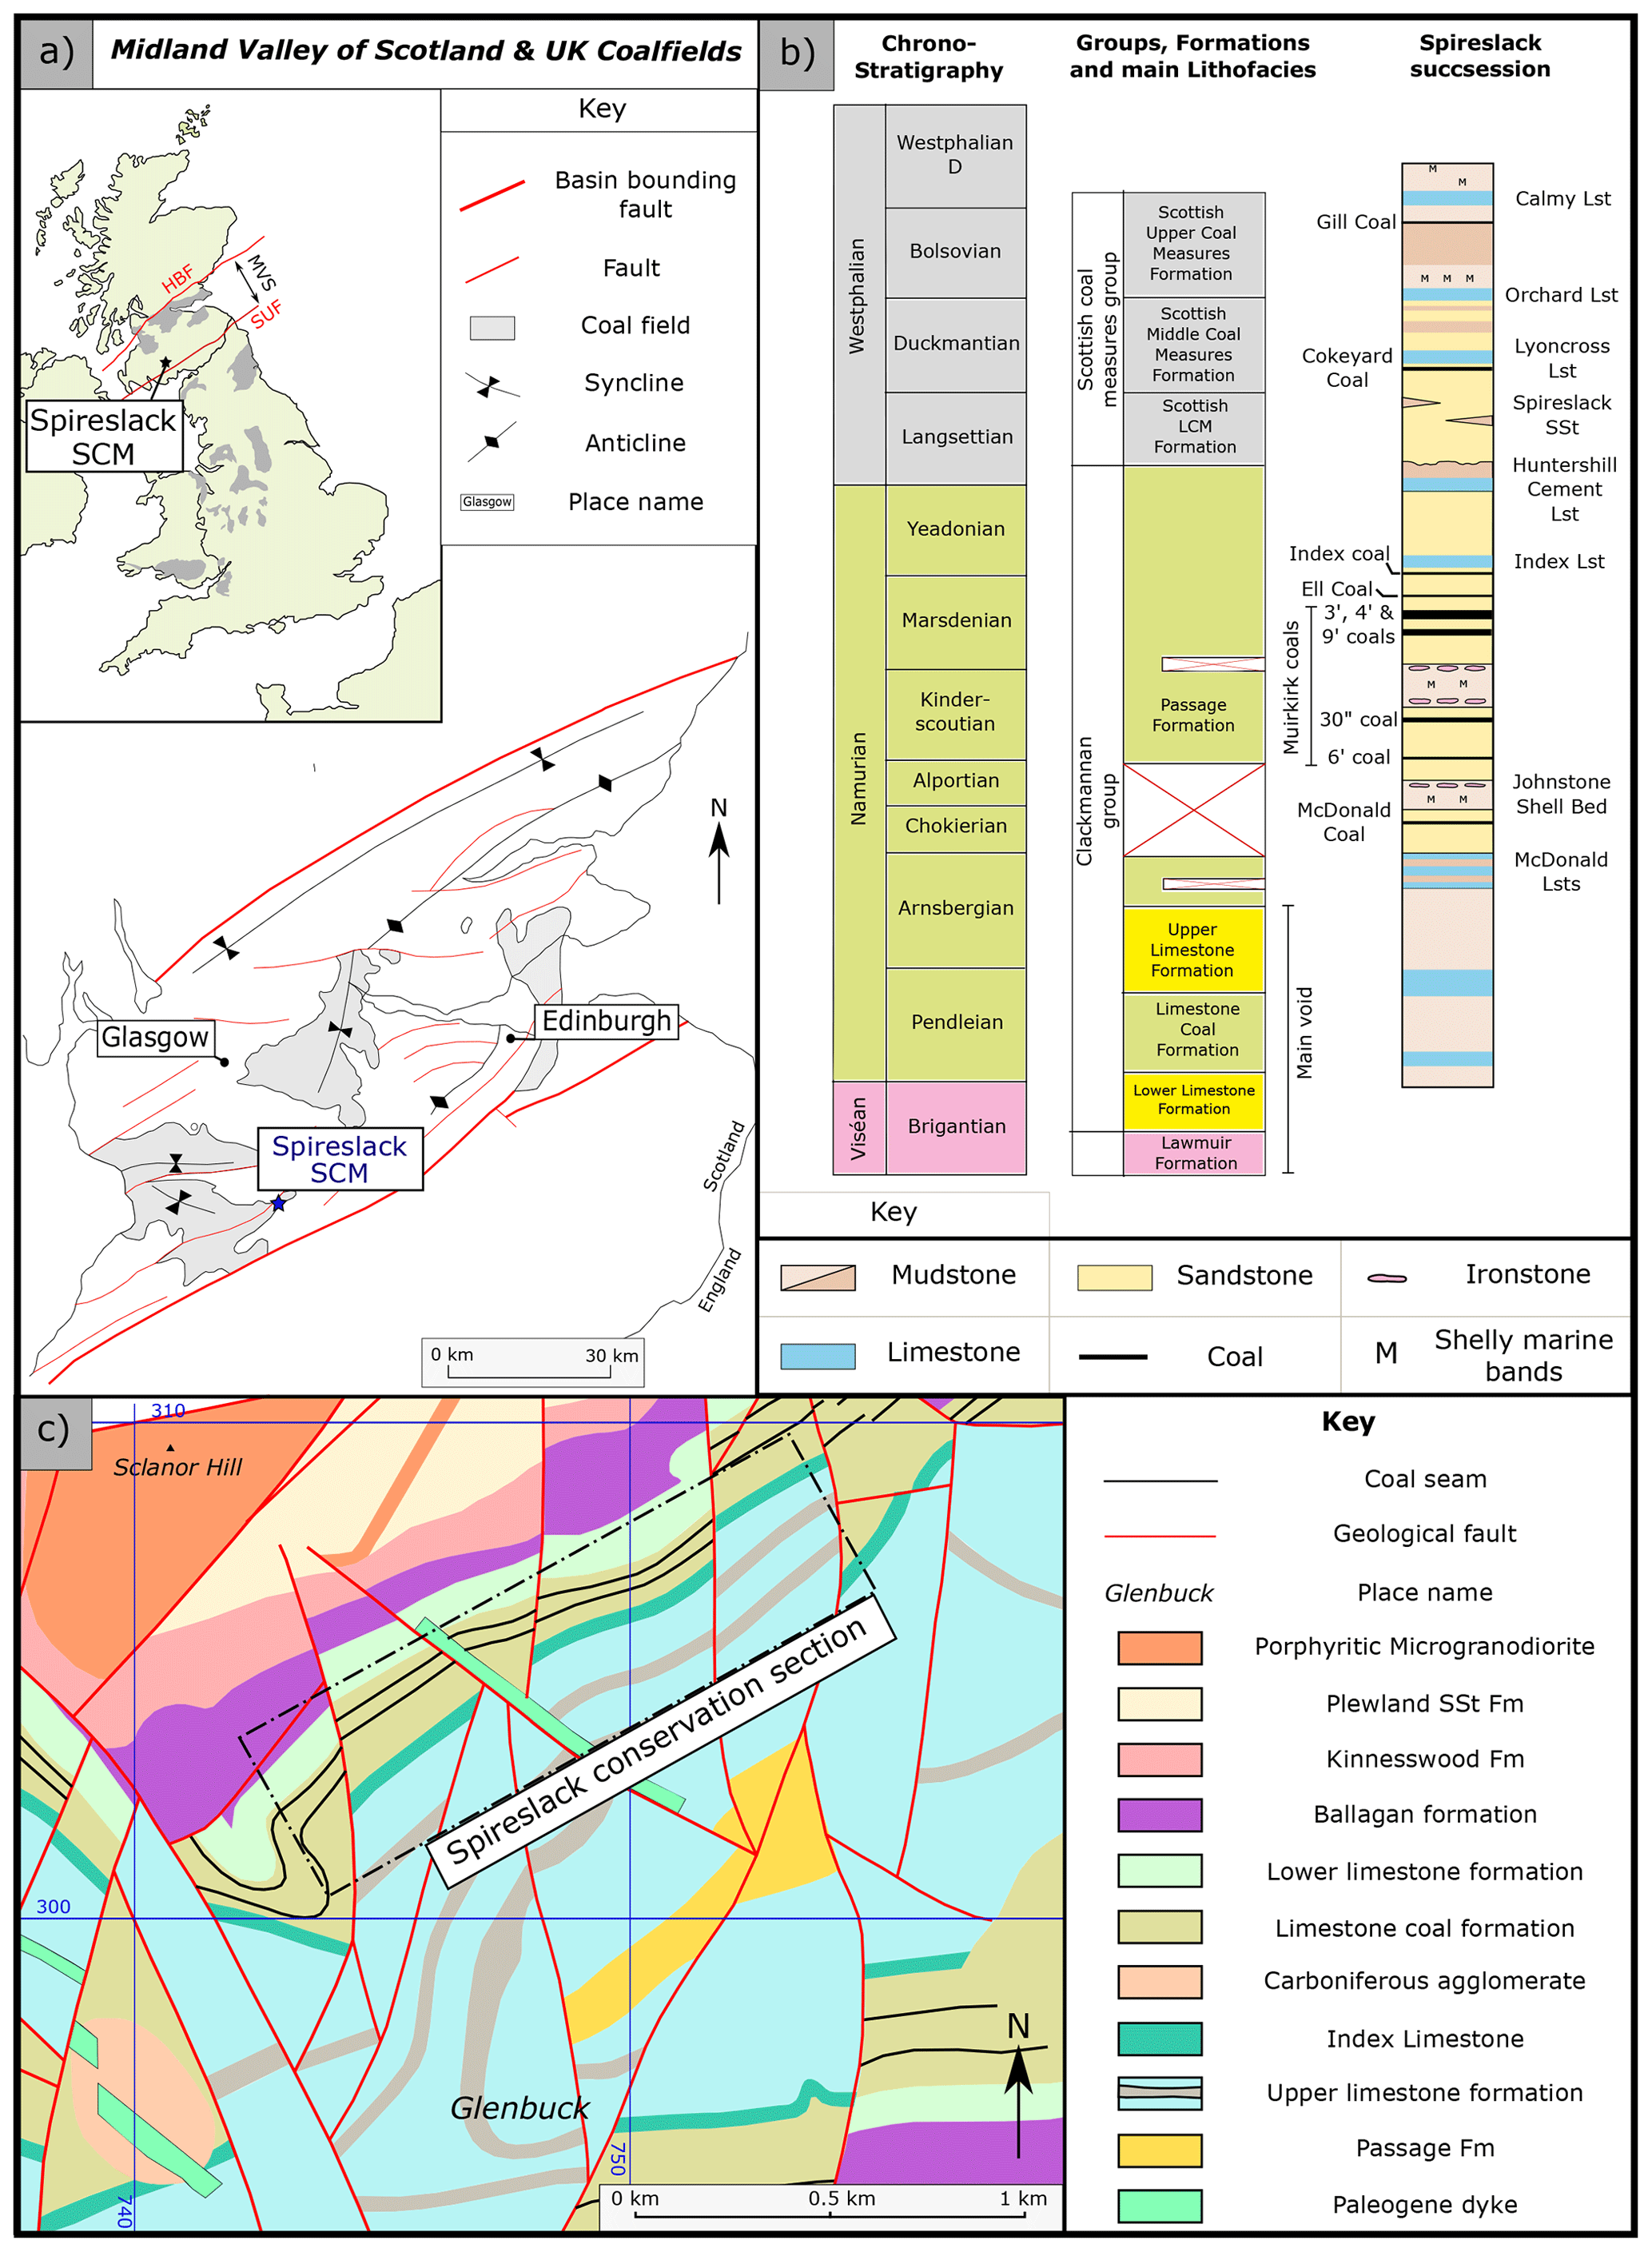
Figure 1(a) Map of UK coalfields (adapted from Donnelly, 2006) showing the location of Spireslack Surface Coal Mine (SCM) and structural features of the Midland Valley of Scotland. (b) Regional geology and (c) stratigraphy of Spireslack Surface Coal Mine (following Ellen et al., 2019).
The Midland Valley is bound by two major faults: the Southern Upland Fault to the south and Highland Boundary Fault to the north (Fig. 1a) (Bluck, 1984). Carboniferous basins that have axes oblique to the main trend of the Midland Valley (e.g. Central Scottish Coalfield; Francis, 1991) can reach over 6 km in thickness (Dean et al., 2011). Faults with associated, localised folding have a complex history of reactivation caused by sinistral strike and oblique-slip movement during the Tournaisian and dextral strike and oblique-slip movement during Viséan to Westphalian times (Browne and Monro, 1987; Rippon et al., 1996; Ritchie et al., 2003; Underhill et al., 2008).
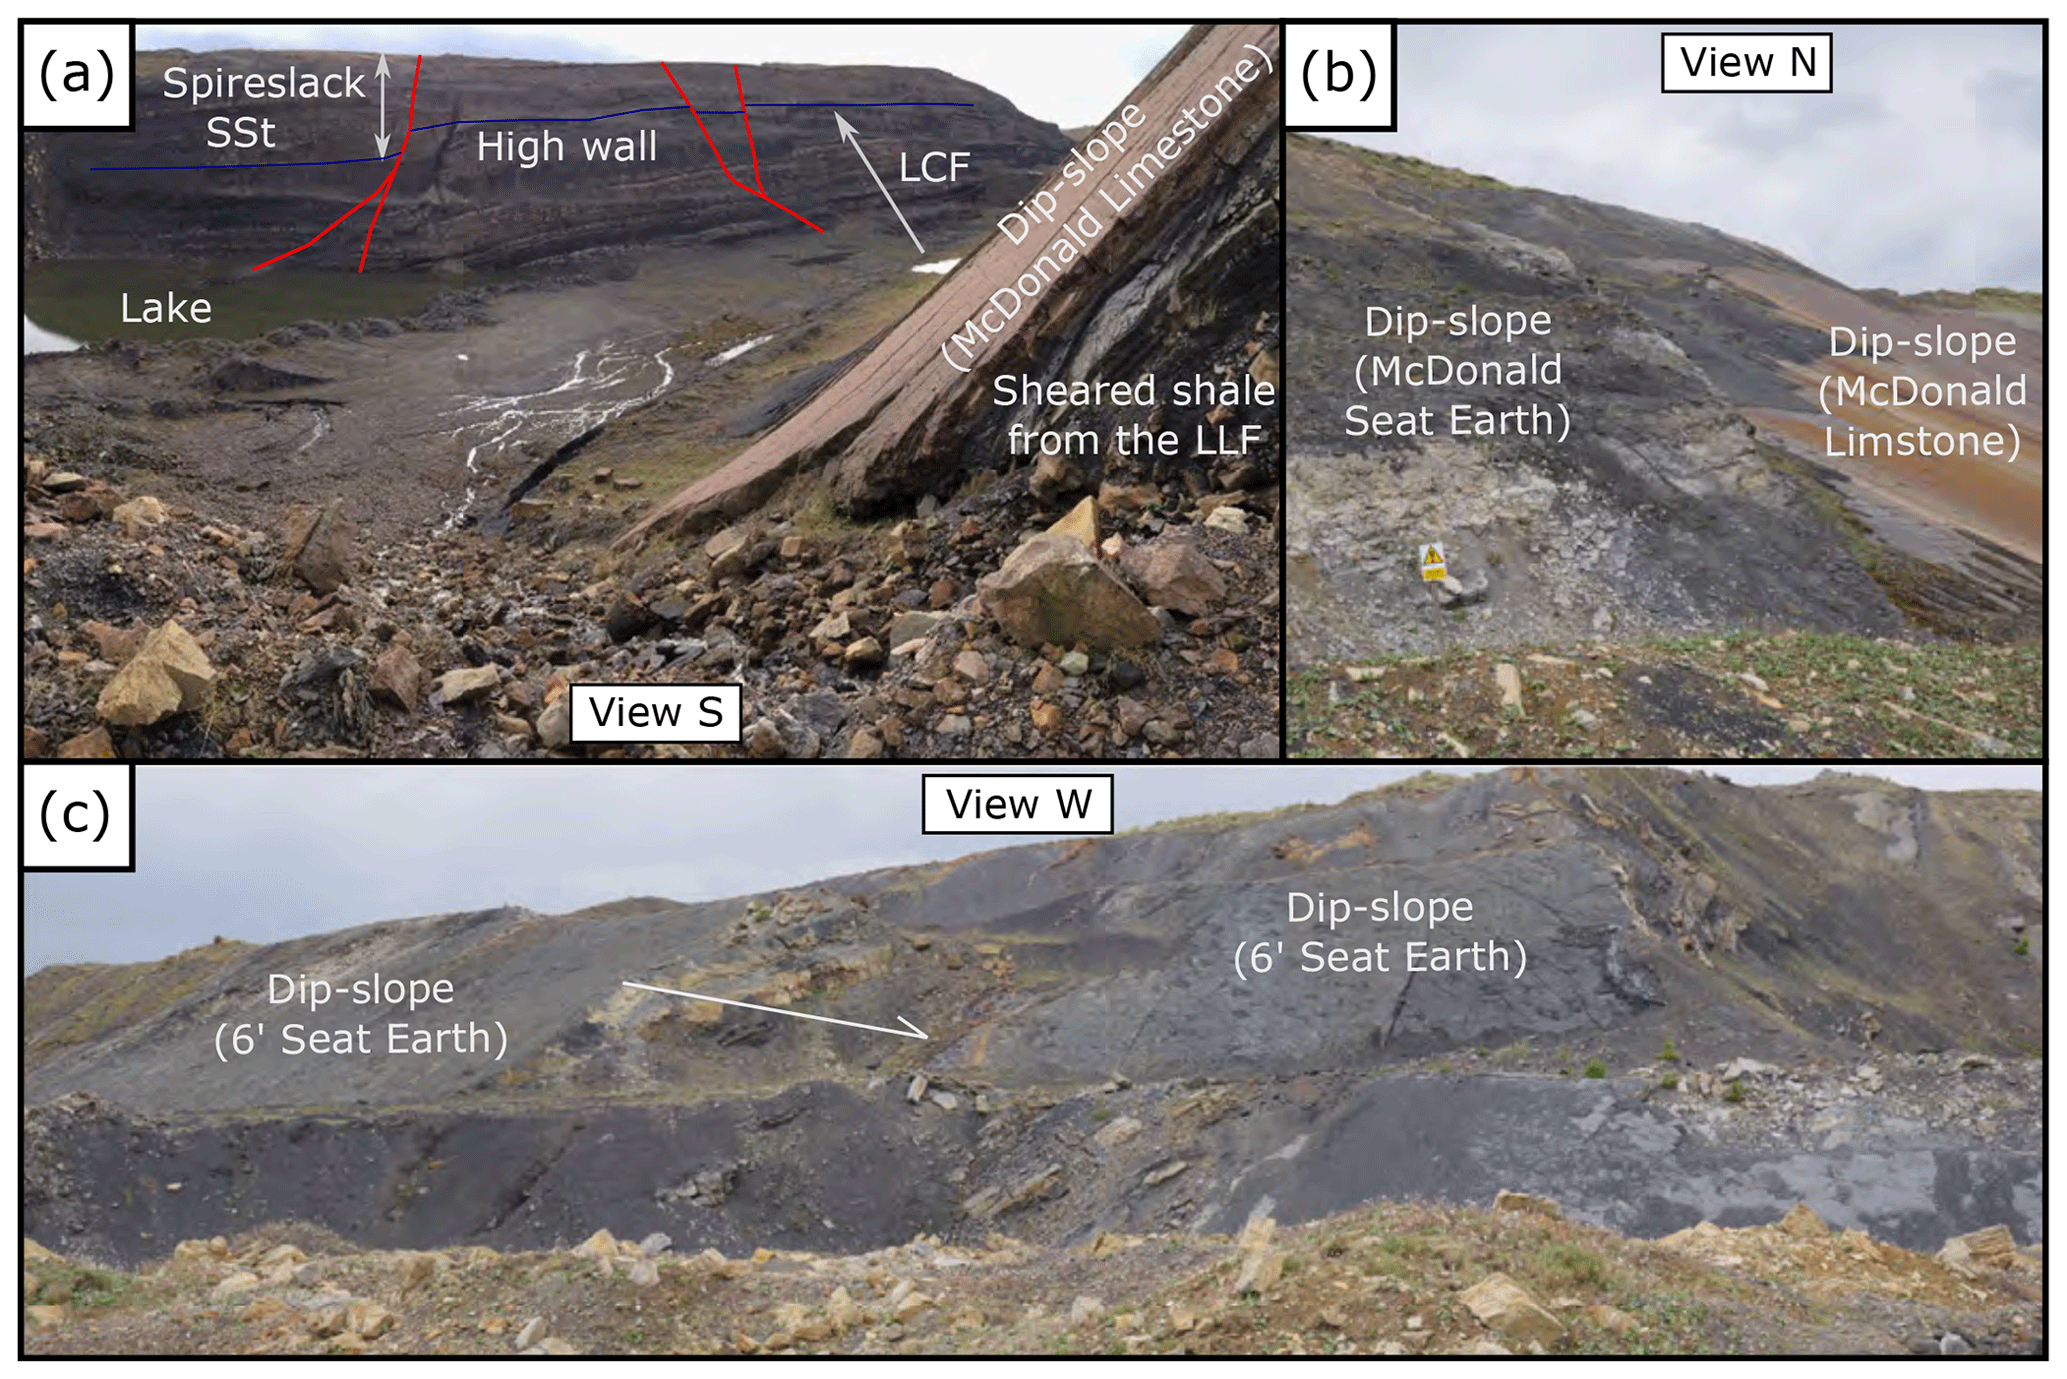
Figure 2Overview photographs of Spireslack SCM: (a) photograph from the east of the site of the high wall with the McDonald Limestone dip slope visible to the right in the foreground (LCF stands for Limestone Coal Formation); (b) photograph looking down the McDonald Limestone pavement from the entrance roadway; (c) photograph of the Six Foot Seat Earth exposed in the dip-slope to the west of the site.
2.1 Spireslack Surface Coal Mine
Spireslack Surface Coal Mine (SCM), next to the now abandoned coal mining village of Glenbuck in South Ayrshire, Scotland (Fig. 1a), provides an exceptional exposure of Carboniferous rocks in a 1 km long residual void (Figs. 2 and 1c). Shallow, southerly dipping (20–40∘) bedding planes (dip-slopes) end in a <130 m high working face (the high wall) (Fig. 2). The high wall represents the unexcavated working face exposed through the opencast operations, with bedding planes (e.g. the McDonald Limestone) used as the void's dip-slopes.
The stratigraphy is comprised of a continuous succession of Viséan to Namurian strata, including a complete section through the Limestone Coal Formation (LCF) (Fig. 1b, c) (Ellen et al., 2016, 2019). Bituminous coal is found in cyclical fluvial–deltaic sequences that outcrop across much of the dip-slope and high wall, bounded by the Upper and Lower Limestone Formations. The Lower Limestone Formation represents more marine-influenced facies, including extensive, fossil-rich limestone units (e.g. the McDonald Limestone) (Davis, 1972). The Spireslack Sandstone is exposed above the Limestone Coal Formation and is comprised of one channelised and two tabular sandstone beds (Ellen et al., 2019).
Several faults with shallow slip vectors and variably complex internal structures offset the stratigraphy. Additionally, at least five Paleogene basaltic dykes are observed trending NW–SE to WNW–ESE, which Leslie et al. (2016) suggest intrude along pre-existing faults. The rocks exposed at Spireslack SCM are part of the southern limb of the upright, WSW–ENE-trending Muirkirk Syncline that formed in response to mid- to late- Carboniferous sinistral transpression (Davis, 1972; Leslie et al., 2016). Leslie et al. (2016) attribute the faulting and folding observed at Spireslack SCM to this deformation, and have observed no evidence at the site of the later widespread dextral deformation found elsewhere in the Midland Valley (e.g. Underhill et al., 2008).
3.1 Field mapping
Geological mapping of the dip-slopes captured all sandstone and shale units below the McDonald Limestones and the sandstone bed above the Muirkirk Six Foot Coal. Mapping was undertaken at a 1:1000 scale onto printed aerial photography from Bing Maps (Microsoft, 2017). All faults with >0.2 m stratigraphic separation were recorded. When considering the effect of lithology on fault structure we attempt to apply the terminology used in fault-sealing studies in which a self-juxtaposing fault is a fault where the offset is small enough with respect to the layer thickness that the same layer is present on either side (e.g. Gibson and Bentham, 2003; Knai and Knipe, 1998; Pei et al., 2015; Yielding et al., 2011). Printed field photographs were used to collect more detailed observations at several key sites.
3.2 Lineament mapping and network analysis
One way to describe the topology of a fault or fracture network is as a series of branches and nodes (e.g. Manzocchi, 2002; Sanderson and Nixon, 2015, 2018). A branch is a fracture trace with a node at each end. Nodes can occur where a fracture terminates into rock (I-node), abuts against another fracture (Y-node), or crosses another fracture (X-node). The proportion of different node types (I, Y, and X) can then be plotted on a triangular diagram to characterise the connectivity of the network (Manzocchi, 2002; Sanderson and Nixon, 2015). In this work we recorded faults and fractures as orientation sets and report fracture and branch trace length (tl), 2D fracture intensity (I), and the percentage of connected branches (Pc, see Eq. 1).
Fault and fracture mapping were undertaken using two datasets: (i) a drone-derived photomontage of the McDonald Limestone bedding plane, provided by Dave Healy of Aberdeen University, and (ii) an auto-rectified photomontage of the high wall collected by the British Geological Survey. In order to understand the geometry, topological properties and cross-cutting relationships of fault strands and joint sets, interpretation areas were selected from both the dip-slope and high wall for analysis. Due to its instability, the high wall is generally unsafe to access, so any interpretations of the high wall are made principally on the photomontage. We outline our workflow in detail below.
-
Lineament mapping. Field mapping was undertaken by the lead author at a scale of 1:30 for the dip-slope and 1:50 for the high wall. Scanned field maps were georeferenced and scaled in ArcGIS. Digitisation of the mapped lineaments and correlation of features between well-exposed areas were undertaken by the same person to limit the effect of subjective bias (Andrews et al., 2019; Scheiber et al., 2015). The faults and the fractures were digitised into separate GIS layers, with reference to field notebooks and maps to ensure that interpretations honoured the field data. While in the detailed field investigation areas it was possible to distinguish shear fractures from joints, this was not possible for much of the area. Therefore, both potential shear fractures and joints were included in the “joint” dataset when in inaccessible areas. The fault and joint datasets were then merged in ArcGIS to create a third dataset: the “combined network”. The fault, joint, and combined datasets were then investigated separately, using a network analysis outlined in steps 2 to 4.
-
Define sets. Six “interpretation boxes” that cover a range of deformation styles and fracture intensity were defined as shape files in ArcGIS (three along the dip-slope and three along the high wall). The orientation of faults and fractures within them were then analysed. Length-weighted rose diagrams with 5∘ bin widths were used to interpret the orientation sets in the network using the NetworkGT toolbox (Nyberg et al., 2018).
-
Branch and nodes. The topology of the network was then extracted using the “Branch and Node” tool in NetworkGT, which splits the fracture trace poly-line file into individual branches and assigns I, Y, or X nodes as separate point-files (Nyberg et al., 2018). The resulting network was visually checked for errors (e.g. incorrectly assigned nodes) and manually adjusted in ArcGIS to remove spurious nodes and branches. Data were then exported to Excel for further analysis.
The digitisation and analysis of the fault network separately from the “joint” dataset meant that where faults terminated against pre-existing joints (i.e. a Y-node in the combined network), this was classified as an isolated node. This was done to provide the network properties (i.e. connectivity, trace length and fracture intensity) of the “active” fault network where evidence of shear and mineralisation is present. Because the mineralised fault network will be sealing to flow and therefore not hydrologically connected to the joint network, it is not appropriate to classify joint–fault abutting relationships as connected nodes. Therefore, where a joint terminates against a pre-existing fault in the “joint” dataset this was also classified as an I-node. The combined network represents the fault–fracture network that is typically digitised and analysed for topological analysis.
-
Network analysis. For each network, the following data were extracted:
-
Network connectivity: For each dataset, with the data not split into sets, the node and branch proportions were assessed using a triangular diagram (see Sanderson and Nixon, 2015). From the number of I (Ni), Y (Ny), and X (Nx) nodes, the proportion of connected branches was then calculated using Eq. (1) (Sanderson and Nixon, 2015):
-
Trace length. The trace length of digitised networks and sets within each sample area were assessed using trace length distributions (Priest and Hudson, 1981), with the minimum, maximum, and median trace length values used to compare analysis.
-
2D fracture intensity. We compared the intensity of the networks and sets within the network using 2D fracture intensity (Eq. 2) (P21; Dershowitz and Einstein, 1988; Rohrbaugh et al., 2002).
-
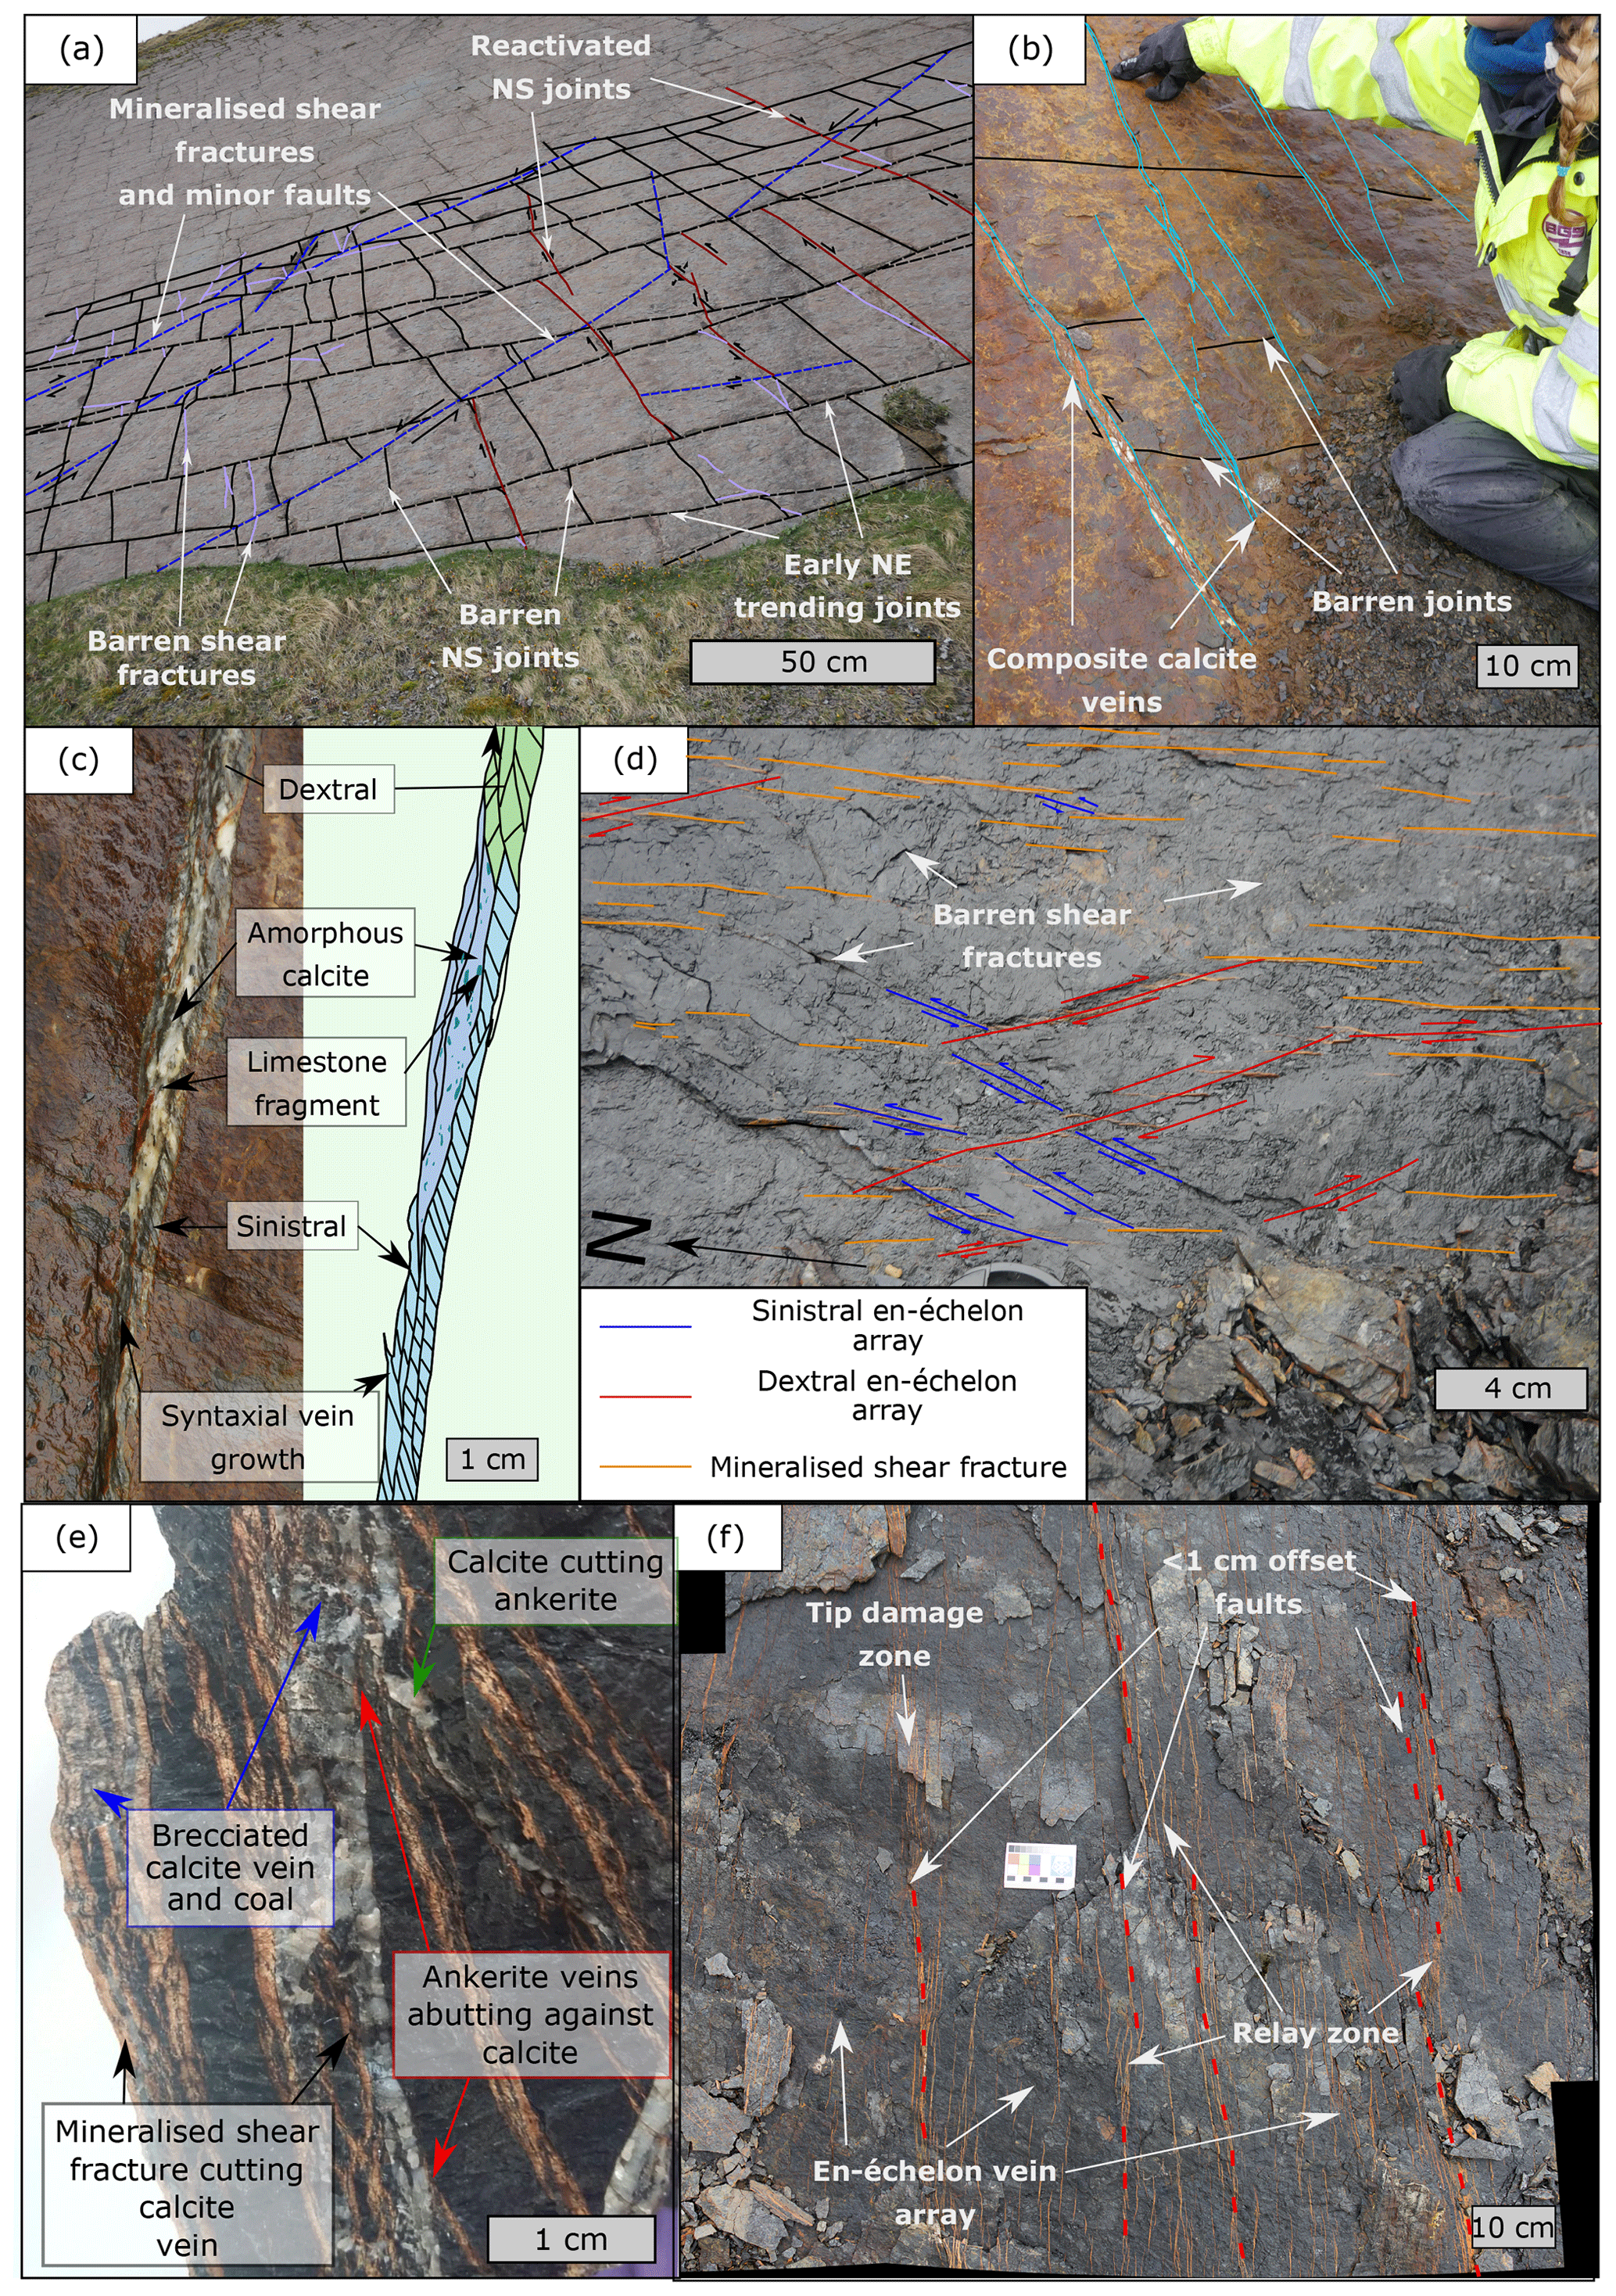
Figure 3Typical fracture properties for McDonald Limestone and McDonald Coal: (a) joints observed away from faults across the southerly dipping (ca. 40∘) McDonald Limestone bedding plane; (b) Mineralised N–S trending calcite veins, offsetting abutting E–W ladder joints on the bedding plane of the McDonald Limestone; (c) annotated field photograph and interpretation of a multi-phase composite calcite vein exposed in the vicinity of a small stratigraphic separation fault along the McDonald Limestone Pavement; (d) bedding plane exposure of mineralised fractures present within the Muirkirk Six Foot Coal; (e) annotated hand specimen displaying the vein relationships present during the faulting of the Muirkirk Six Foot Coal; and (f) the larger-scale mineralisation pattern as you move towards small stratigraphic separation faults in the Muirkirk Six Foot Coal.
4.1 General fracture observations
Fractures at Spireslack SCM can be classified as either joints (barren open mode fractures), faulted joints (joints that show evidence of reactivation, e.g., mineralisation or cataclasis), or shear fractures, with the latter two often found in proximity to faults. In this study “shear fractures” refer to a fracture with displacement below map scale and can be either mineralised or barren. Cross-cutting relationships are often complex and display several age sets. For example, in the McDonald Limestone bedding plane (Fig. 3a) there are two generations of joints: an early set of NE–SW trending joints (dashed black in Fig. 3a) and a later set of N–S trending joints (black) that abut the earlier set. Both generations represent the pre-existing fracture set at the time of faulting. These pre-existing joints are then cut by a set of NNE–SSW-trending mineralised shear fractures (dashed blue) that are restricted by favourably orientated joints and are locally associated with new barren shear fractures (lilac). Finally, several of the N–S-trending joints become reactivated (maroon) and are interpreted as faulted joints (cf. Zhao and Johnson, 1992).
Calcite mineralisation at Spireslack SCM (Fig. 3b, c), which is often found associated with faults, occurs as two styles: (1) amorphous, where no growth structures are present and occasional fragments of limestone are observed within the vein, or (2) with syntaxial growth textures suggesting both sinistral and dextral motion during the mineralisation of a single vein (Fig. 3c). Along fault planes and within a few metres of faults, composite veins commonly occur, with multiple growth stages and evidence of reactivation (Fig. 3c).
Fractures in the coal layers are commonly filled with a buff to orange-coloured mineral, identified in the field as ankerite (iron-rich carbonate) (Fig. 3d–f). Fractures in coal occur as the following features.
-
Coal cleats. Ubiquitous in all coals, cleats are orthogonal opening-mode fractures that develop during burial diagenesis (Laubach et al., 1998). Cleat spacing (typically <2 cm) is dependent on bed thickness, coal quality, and the presence of clastic material (e.g. shale partings).
-
Mineralised shear fractures. Typically 2 to 15 cm long, but increase to greater than 1 m long as stratigraphic separation increases. Fractures less than 15 cm long abut against E–W-trending cleats, with trace length restricted by cleat spacing. Longer fractures cut through the cleats. The thickness of planar ankerite veins increases with the length of the vein.
-
En-échelon arrays. En-échelon ankerite veins display both sinistral and dextral motion (Fig. 3d). Dextral arrays can occur both simultaneously with, or later than, sinistral arrays.
-
Barren shear fractures. In addition to the cleat network, fractures that abut against all other fractures are often curved and have trace lengths typically between 5 and 15 cm. These may propagate from the tip of pre-existing mineralised shear fractures (Fig. 3d).
Other lithologies observed in Spireslack SCM display a strongly developed fracture stratigraphy (cf. Laubach et al., 2009). For example, the McDonald Seat Earth exposed in the dip-slope towards the west of the site (Fig. 4a) lacks a well-developed joint pattern. Instead, shear fractures are observed in relation to small stratigraphic offset, strike–slip faults (Fig. 5a, b). Fractures are only found in close proximity to fault strands and are either sub-parallel to fault strands in the hanging wall block or oblique to the fault strands in relay zones and fault tips. Fractures commonly display small sinistral and dextral stratigraphic offsets (mm to cm) and are typically barren, although occasionally pyrite is found along the fracture plane. Sandstones display bed-bound joint sets in a similar manner to the McDonald Limestone. However, there was limited bed-parallel exposure to explore the age and orientation of fracture sets in sandstone lithologies. In contrast to the dip-slope, seat earth in the high wall displays a well-developed bed-bound fracture network. This suggests that mine-related stresses may have caused deformation of these lithologies and that the natural network has been altered by both subsurface and surface mining activities.
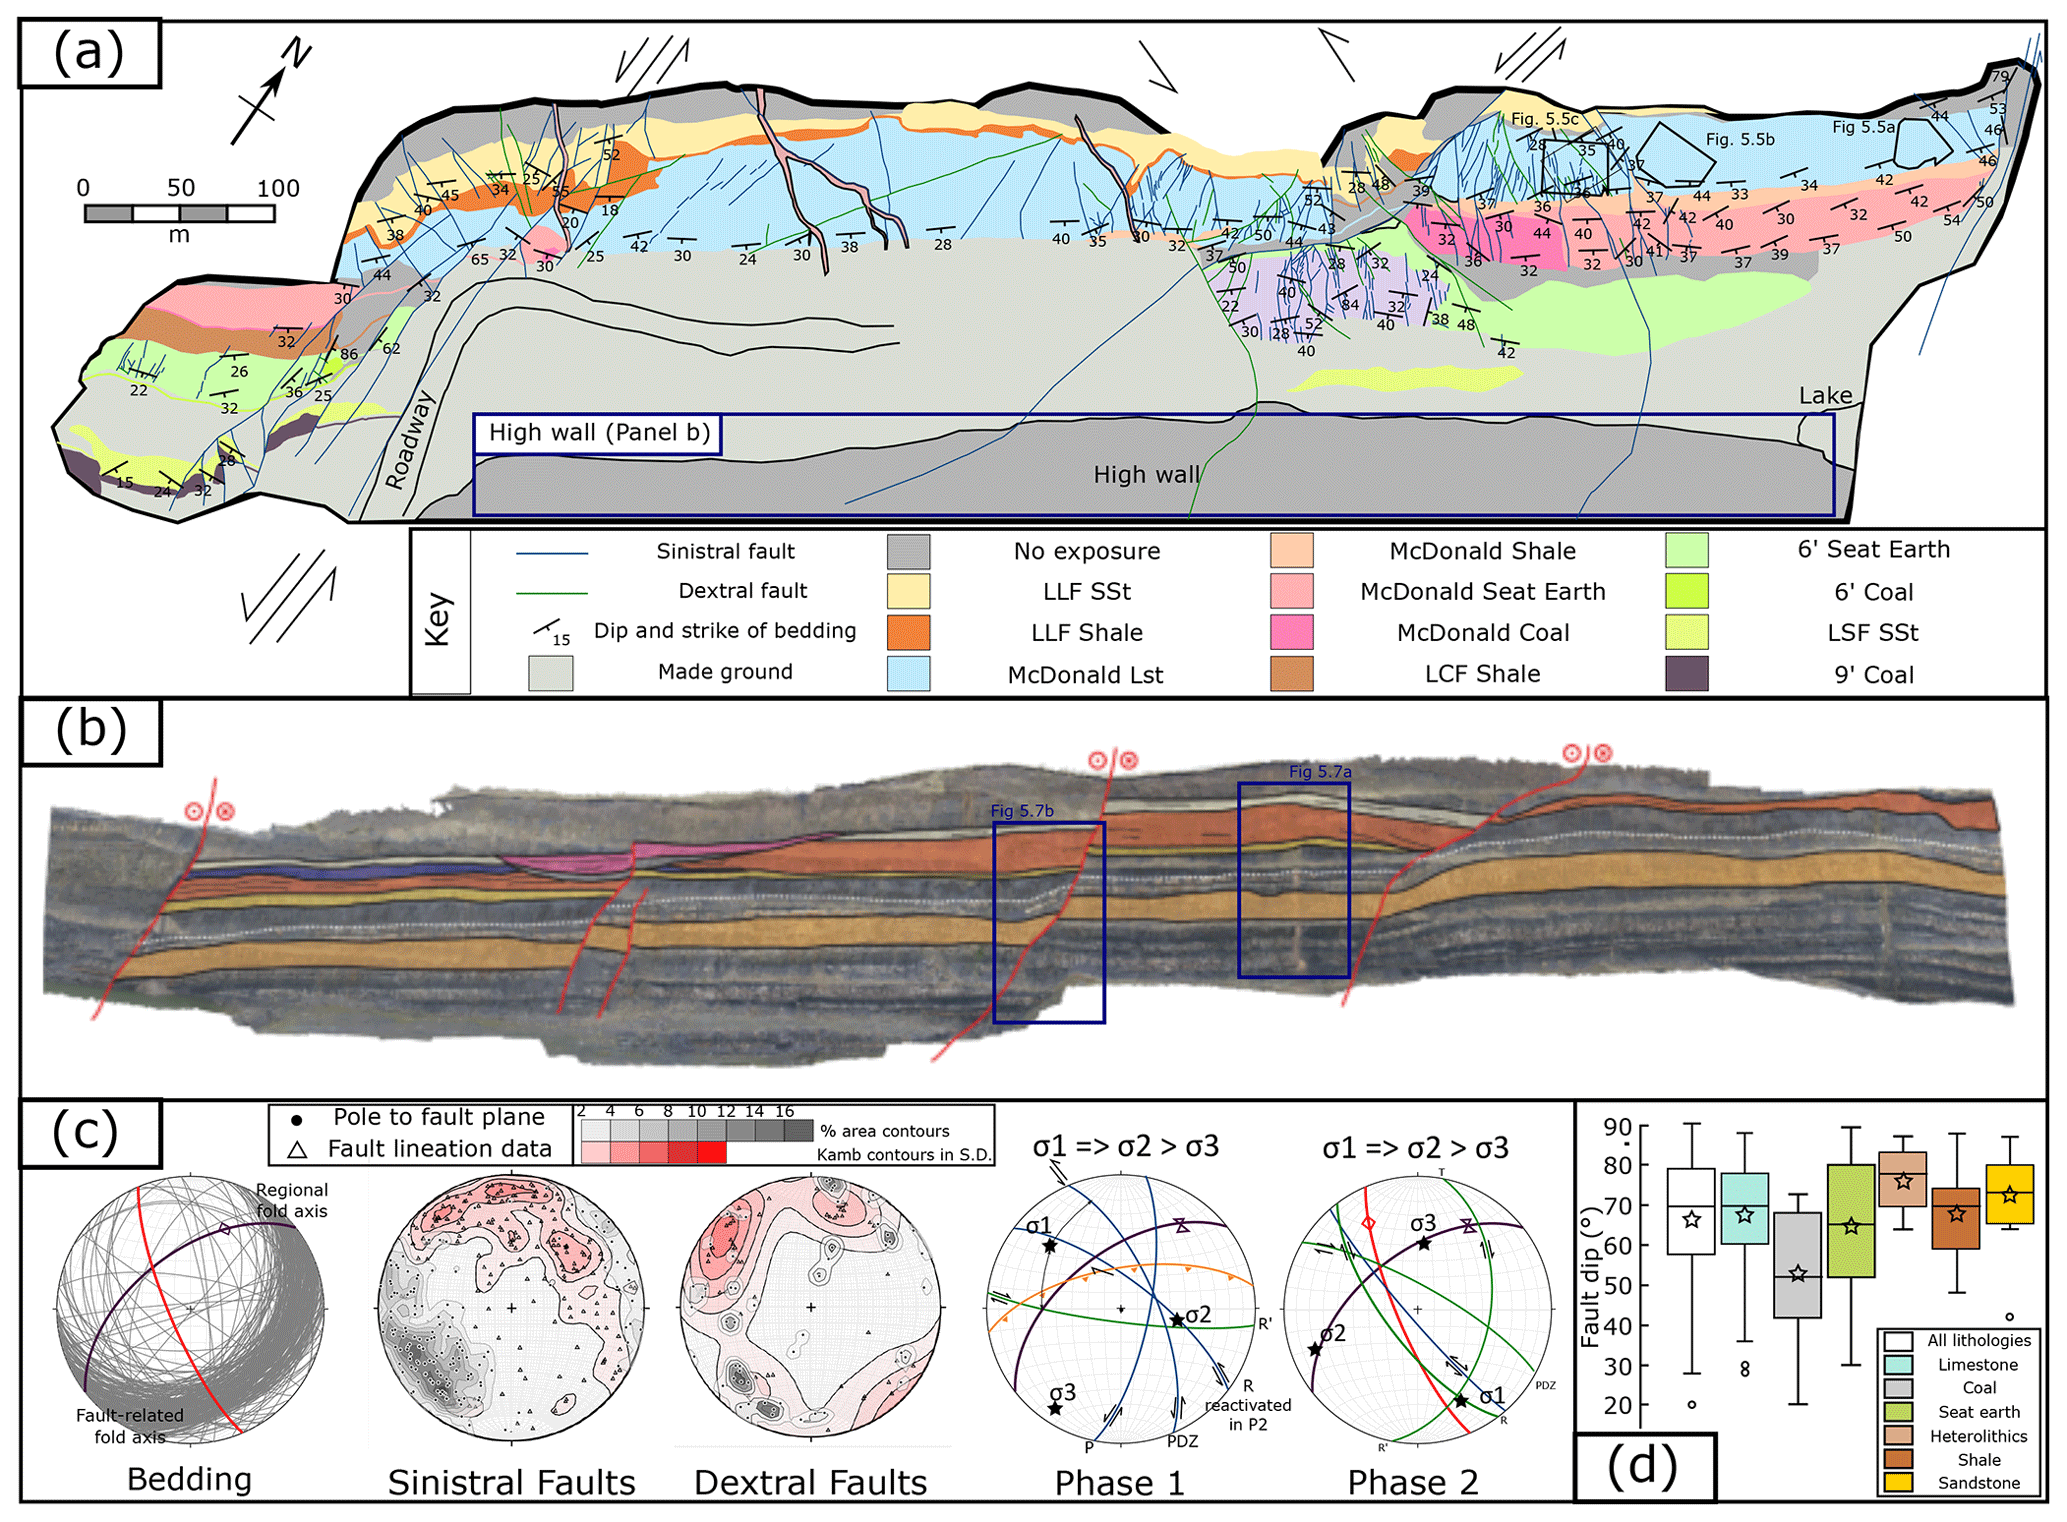
Figure 4Geological map of Spireslack SCM: (a) geological map undertaken as part of this study, displaying the locations of the detailed map-view fracture maps shown in Fig. 8; (b) annotated photogrammetry of the high wall displaying the key stratigraphic horizons and faults (Ellen et al., 2019); (c) fault kinematics by lithology. Stereographic projections were created using Stereonet 10.1 and contours represent 1 % area; and (d) box-and-whisker plots for fault dip by lithology.
4.1.1 Order of fractures within the Muirkirk Six Foot Coal
Like the McDonald Limestone bedding plane (Fig. 3a–c), a complex chronology of fractures can be observed in the Muirkirk Six Foot Coal (Fig. 3d–f). In Fig. 3d, dextral en-échelon vein arrays (red) cross-cut earlier sinistral sets (blue), with the former abutting against mineralised shear fractures. Barren shear fractures then abut against both sets displaying a curvature indicative of a dextral fracture array. Abutting relationships suggest the barren shear fractures likely formed at the same time as the dextral en échelon vein array; however, given the lack of mineralisation it is likely they were isolated from the source of mineral-rich fluids.
In Fig. 3e, multiple phases of mineralisation and reactivation of veins can be observed. Veinlets of ankerite both abut against and cut through the calcite vein associated with a nearby small (<5 cm) stratigraphic offset fault. Brecciation of coal and calcite is also observed, with undisrupted ankerite veinlets cutting through the breccia. This requires a minimum of four stages of mineralisation and deformation.
-
Ankerite veinlets formed along the N–S striking face-cleats.
-
Faulting led to the development of coal breccia and calcite veining, which either cut across or abut against pre-existing structures.
-
Brecciation of the calcite vein and coal led to the development of a chaotic fault breccia (following the classification of Woodcock and Mort, 2008). The breccia contains angular clasts of coal and calcite within an amorphous calcite matrix.
-
Finally, mineralisation returned to ankerite with dextral en-échelon arrays developed alongside barren tip-damage zones.
These observations suggest that initial deformation and associated mineralisation occurred over a wide zone of en-échelon arrays (Fig. 3d), which was strongly influenced by the pre-existing cleat network (Fig. 3e). En-échelon arrays then began to interact leading to the development of localised mineralised shear fractures (Fig. 3f). As the trace length of the shear fracture increased so did the thickness of the zone, leading to the formation of a dense array of small stratigraphic offset (<1 cm) strands that interacted through the development of relay zones. A later dextral stress state, demonstrated by reactivated features (Fig. 3e), led to another phase of en-échelon vein formation (Fig. 3c), which also locally developed into mineralised shear fractures.
4.2 Fault observations
In order to understand the role of lithology on faulting style, we describe and compare fault characteristics between faults that cut the same lithology (self-juxtaposing faults) and faults that juxtapose multiple lithologies of the stratified sequence. Additionally, in order to elucidate the role of pre-existing joints on faulting style, we focus on the interaction between faults and fractures within the McDonald Limestone formation because of exceptional, laterally extensive bed-parallel exposure on the dip-slope.
Faulting at Spireslack SCM formed either under early sinistral (Phase 1) or late dextral (Phase 2) shear (Fig. 4c). Phase 1 dextral faults are interpreted as having formed concurrently with normal faults in the Six Foot Seat Earth and thrusts in the shale. The south-dipping bedding is consistent with the regional fold axis inferred from British Geological Survey (BGS) maps (40∘/80∘ N) and also fits within the sinistral phase of deformation. Faulting that cuts the earlier structures (e.g. the oblique sinistral fault and NW-trending dextral fault strands) does not fit within the expected fault geometries of Phase 1 faults and likely formed under a later period of dextral shear (Phase 2) (Fig. 4c). In addition to the two phases of strike–slip tectonics, dykes (probably Paleogene) exploit pre-existing N–W trending fault strands. These locally display pods of edge brecciation similar to that developed along faults in limestone, and show dip–slip lineations suggesting there could have been a late stage of normal faulting.

4.2.1 Self-juxtaposing faults
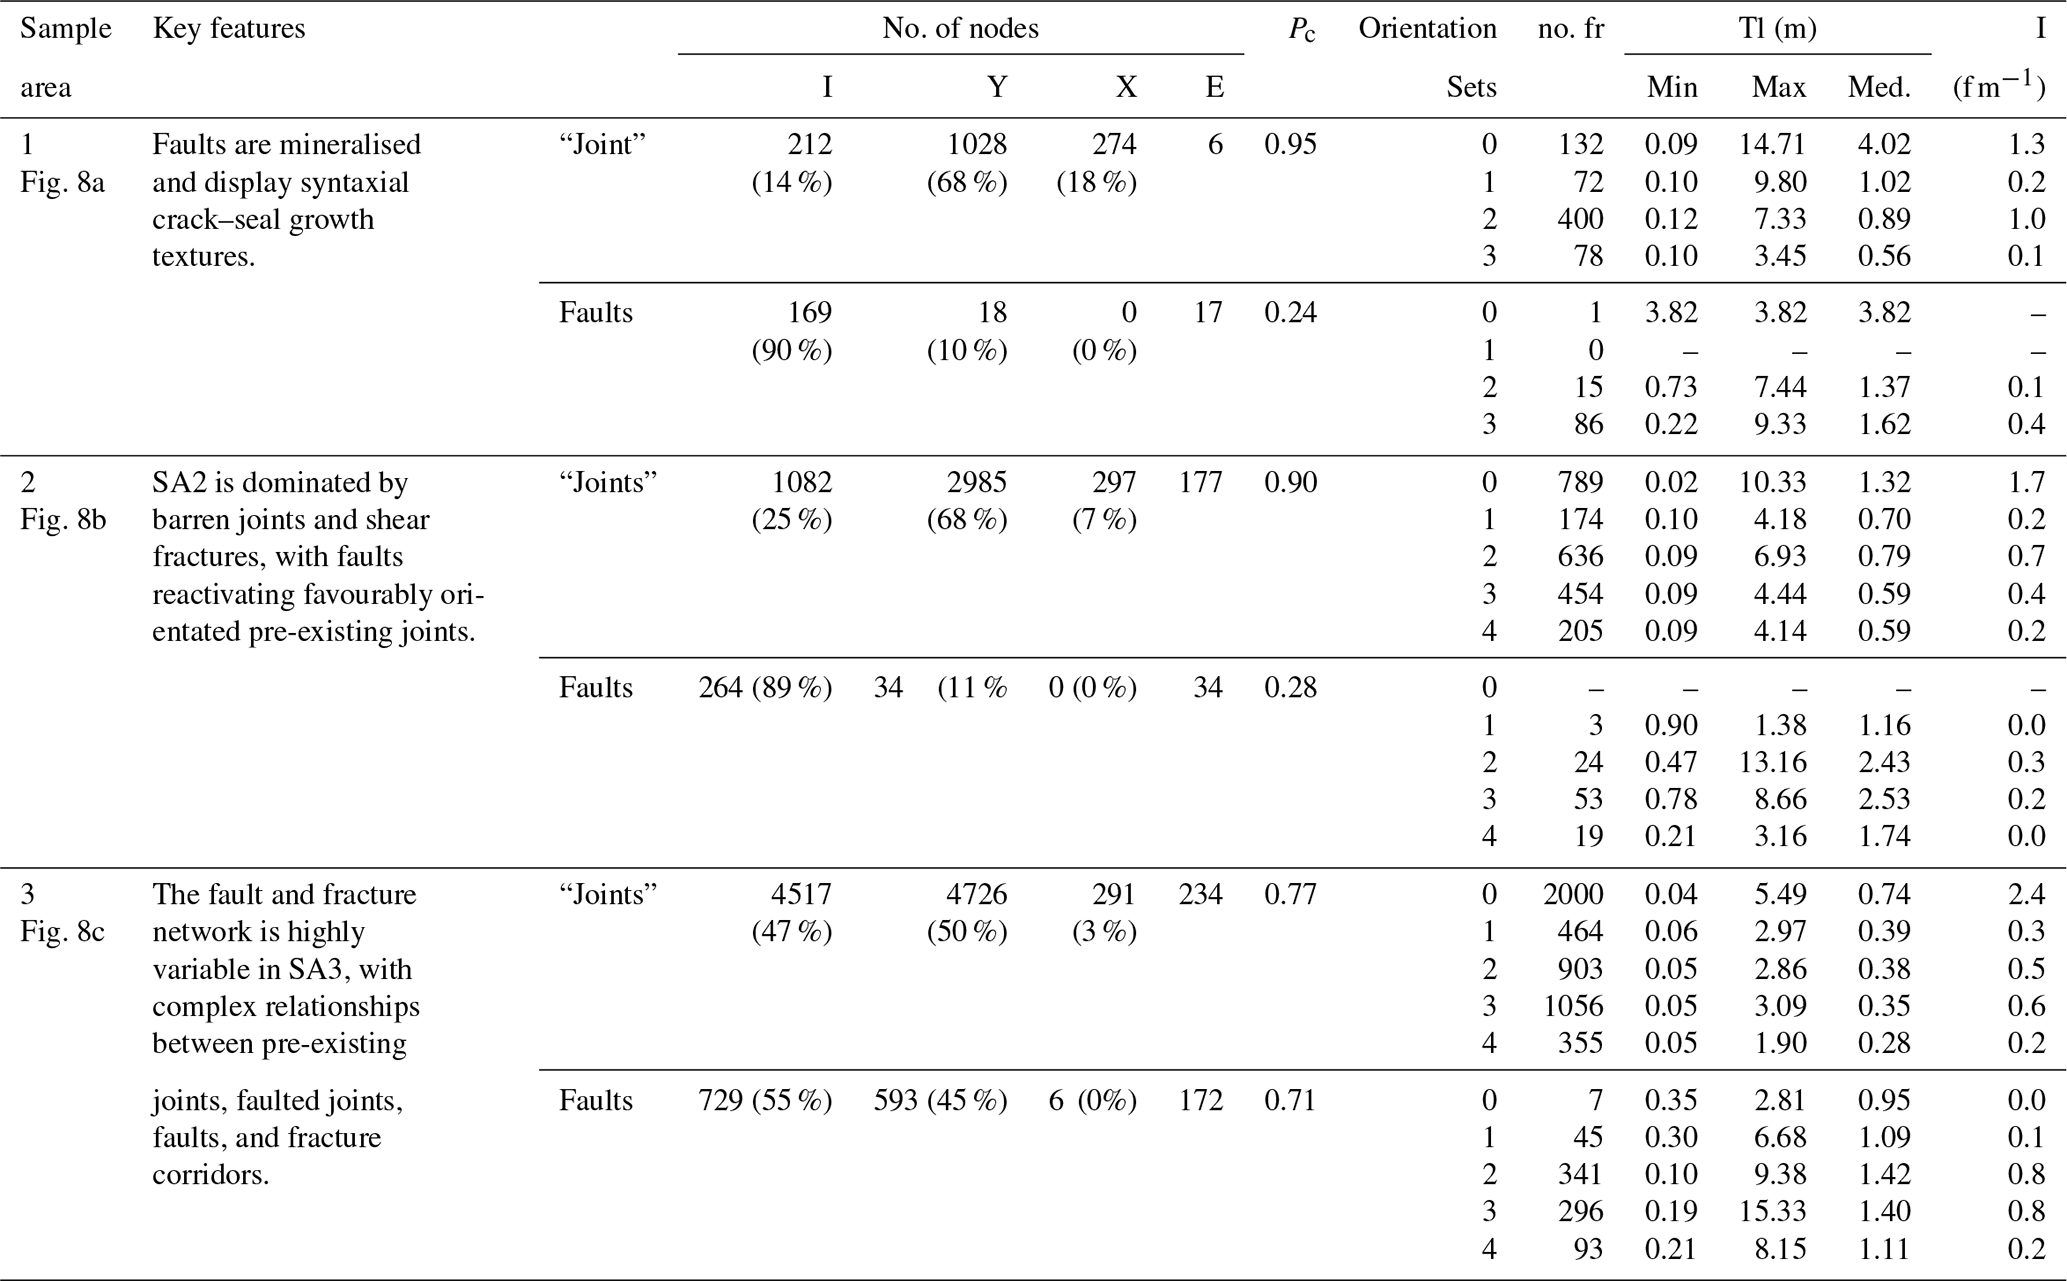
Self-juxtaposing faults with small stratigraphic offset (<3 m) form either isolated strands (e.g. west of the void) or a network of sinistral and dextral strands (e.g. near the centre of the void) (Fig. 3). The internal structure of self-juxtaposing faults depends on the lithology that the fault strand cuts (Table 1, Fig. 4). Self-juxtaposing limestones behave in a predominantly brittle manner with a fracture network decreasing in intensity away from the fault, whereas shale behaves in a more ductile manner and can lead to considerable bed rotation and bed-parallel folding adjacent to the fault.
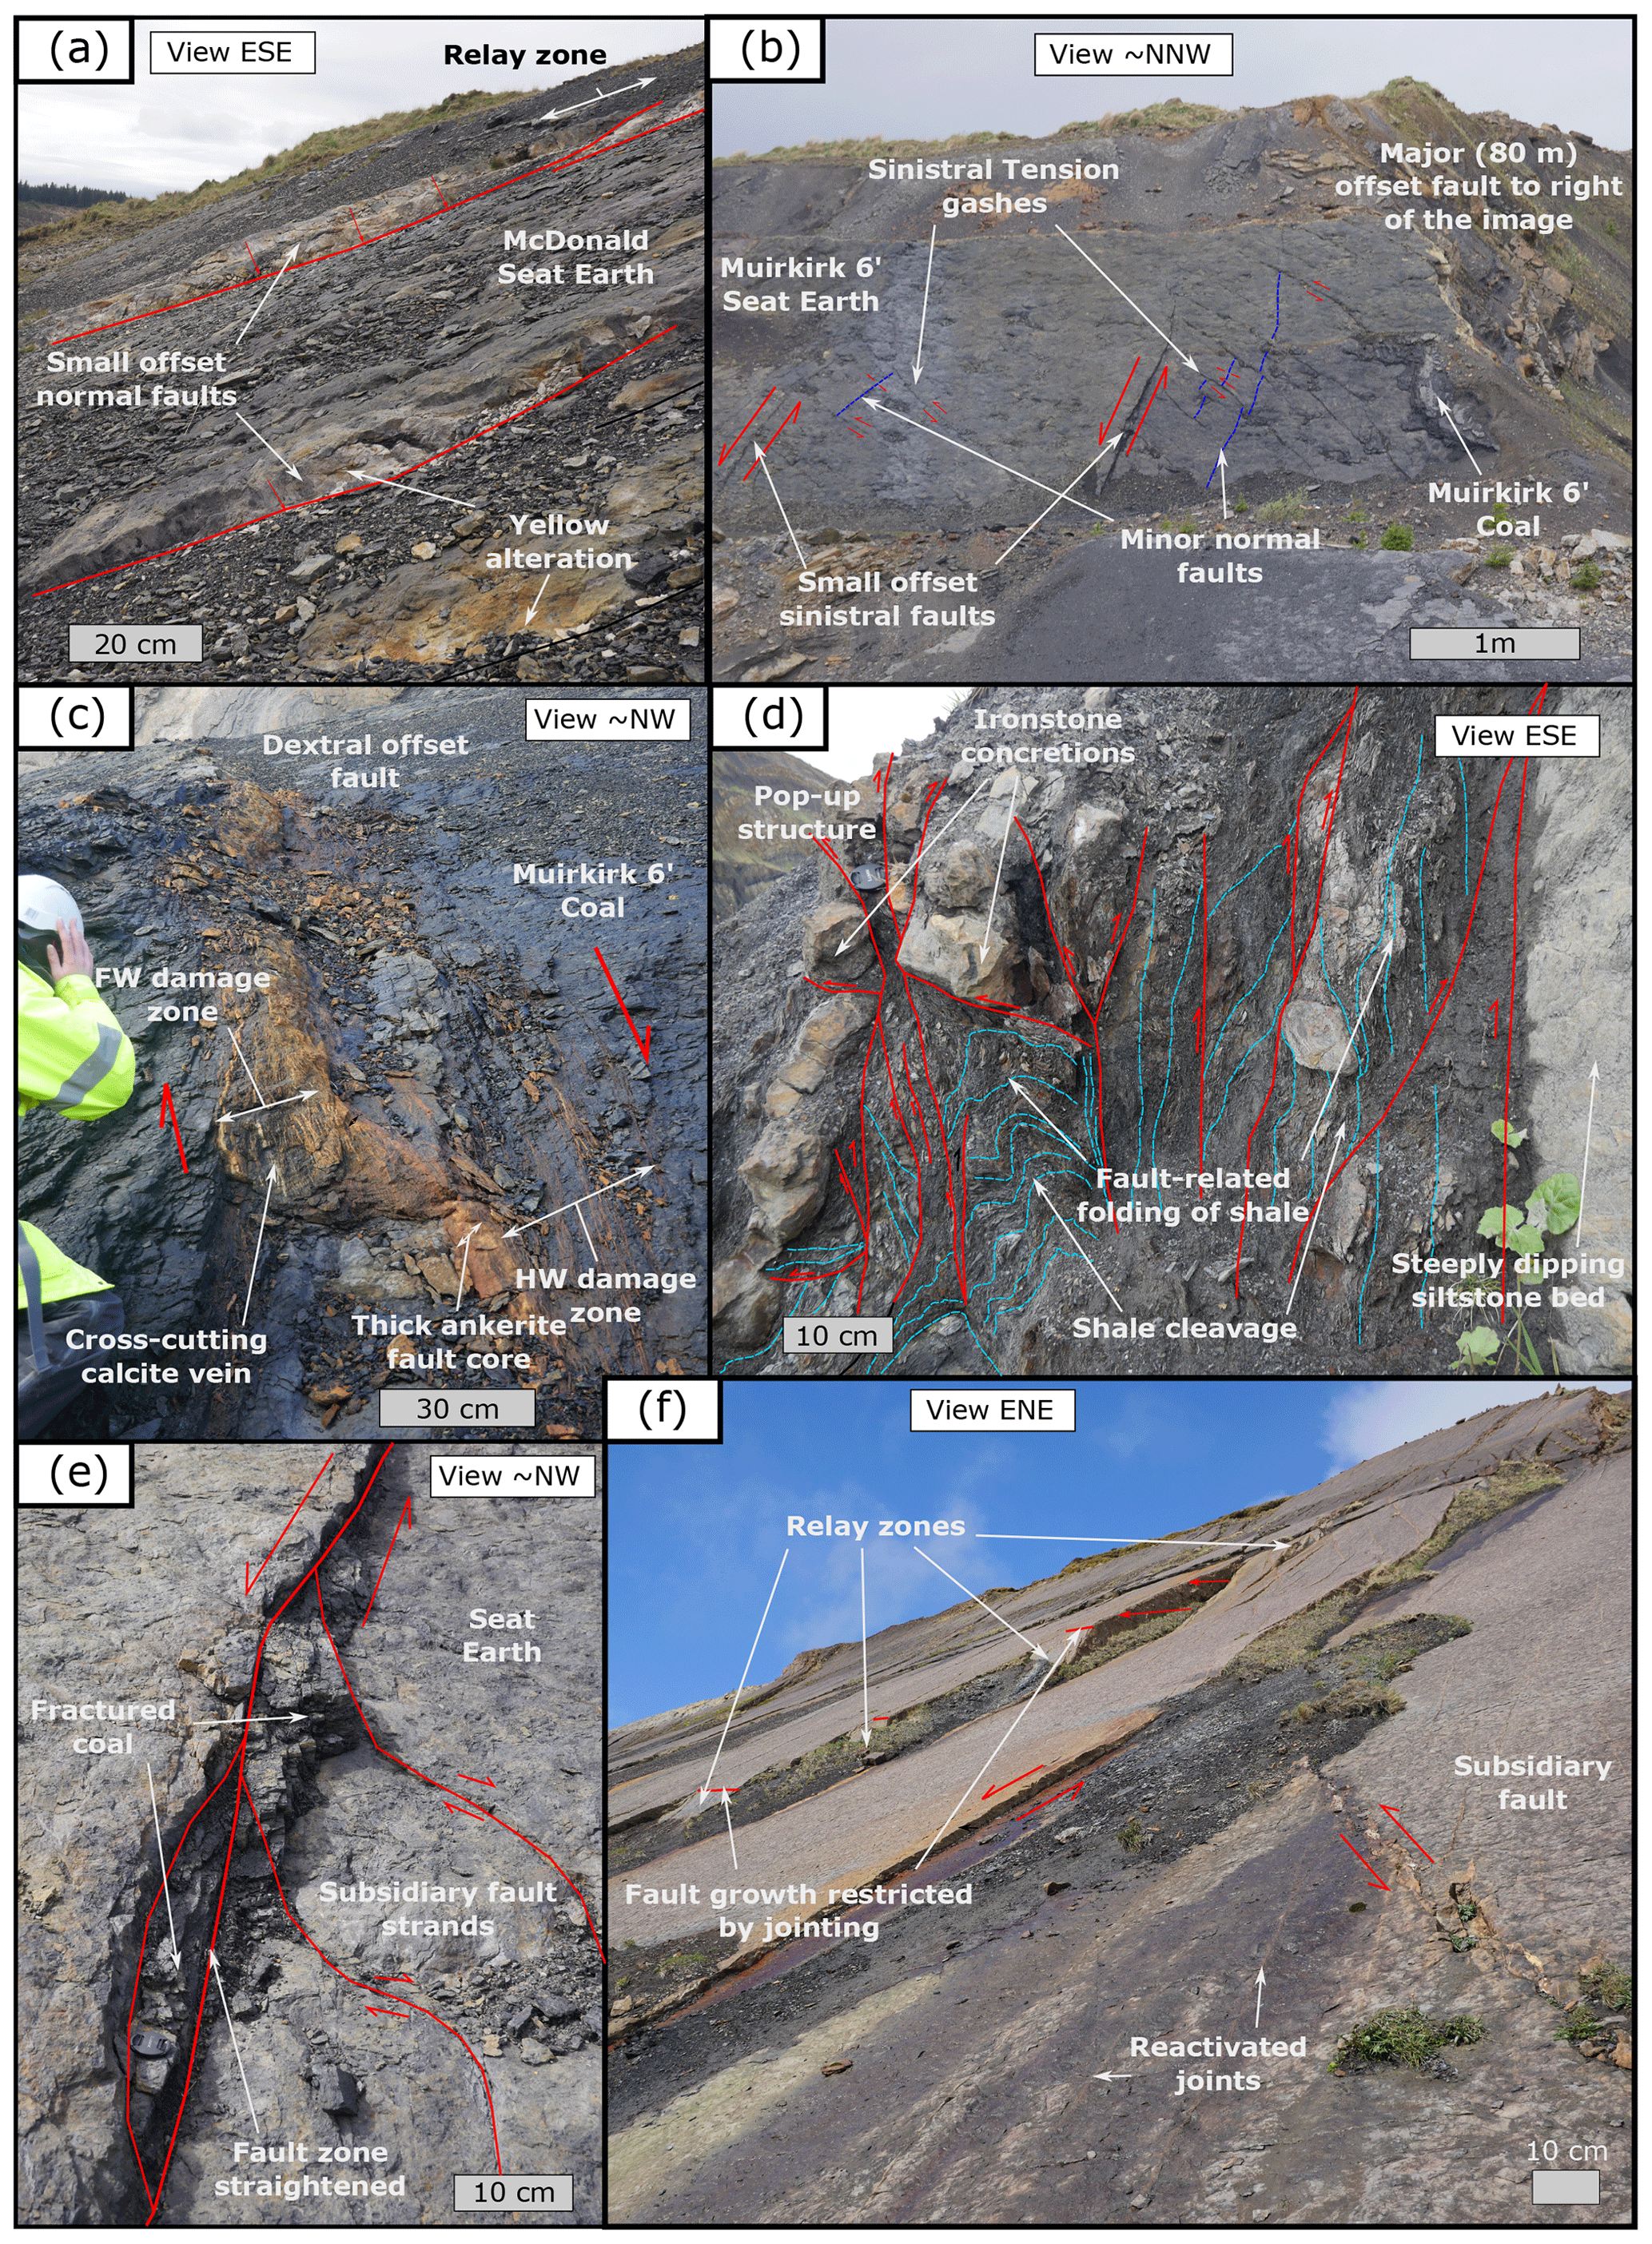
Figure 5Characteristic observations of self-juxtaposed faults: (a) small stratigraphic offset (ca. 15 cm) fault strands and relay structures and (b) tension gashes and small stratigraphic offset normal faults exposed within the McDonald Seat Earth in seat earth exposed to the far west of Spireslack SCM. (c) Symmetric damage zone and thick zone of ankerite mineralisation along a ca. 40 cm stratigraphic separation dextral fault cutting the Muirkirk Six Foot Coal (FW stands for footwall, and HW stands for hanging wall). (d) Bed-parallel thrusts and folding developed within the shale that underlies the McDonald Limestone to the NE of the site. (e) The development of small pods of fractured McDonald Coal along a small stratigraphic offset sinistral fault exposed to the SW of the site. (f) The interaction between faults and joints along the southerly dipping bedding plane of the McDonald Limestone.
The fault dip depends on the lithology cut by the fault. Dips in the McDonald Limestone range from 45 to 88∘ (mean = 69.1∘; n=47); however, in coal seams fault dips range from 20 to 73∘ (mean = 49∘; n=24). In the shale interbeds, layer bound, bed-parallel thrusts (e.g. 40∘ to 70∘ SE) with centimetre- to metre-scale stratigraphic offsets and associated folding can be picked out where they cut ironstone layers (Fig. 5d). The McDonald Seat Earth in the west of the site displays dip-slip slickensides (50 to 60∘) but only in faults with stratigraphic separation <1 m.

Figure 6Characteristics of faults that cut multiple lithologies. (a) Complex fault mesh (following Sibson, 1996) consisting of multiple strands of sinistral and dextral strike–slip fault planes (stratigraphic separation marked with arrows) picked out by shallow striations and the offset of the McDonald Limestone bedding plane. (b) Field photograph of a ∼3 m stratigraphic separation fault strand within the complex fault mesh (a) that displays multiple generations of fault striations, with local dextral reactivation separating striations belonging to set 2. (c) Fault architecture and (d) view along a ∼50 m strike length of a highly segmented fault zone, displaying 3 to 5 m stratigraphic separation exposed along the southerly dipping bedding dip-slope. Fault architecture of the same 5 m stratigraphic separation fault-cutting (e) lithologies surrounding the McDonald Seat Earth and (g) interbedded sandstones, siltstones, and shales of the Lower Limestone Coal Formation. (f) Primary slip plane of the ∼80 m stratigraphic separation fault that cuts the west of the site; (h) Shallowly dipping, sinistral dip-slip fault plane within a ∼2 m thick sandstone bed of the Limestone Coal Formation.
4.2.2 Faults that juxtapose multiple lithologies
Key features observed along faults that juxtapose multiple lithologies (i.e. that are not self-juxtaposing) are summarised in Table 2. Based on cross-cutting relationships, we observe two phases of faulting at Spireslack SCM.
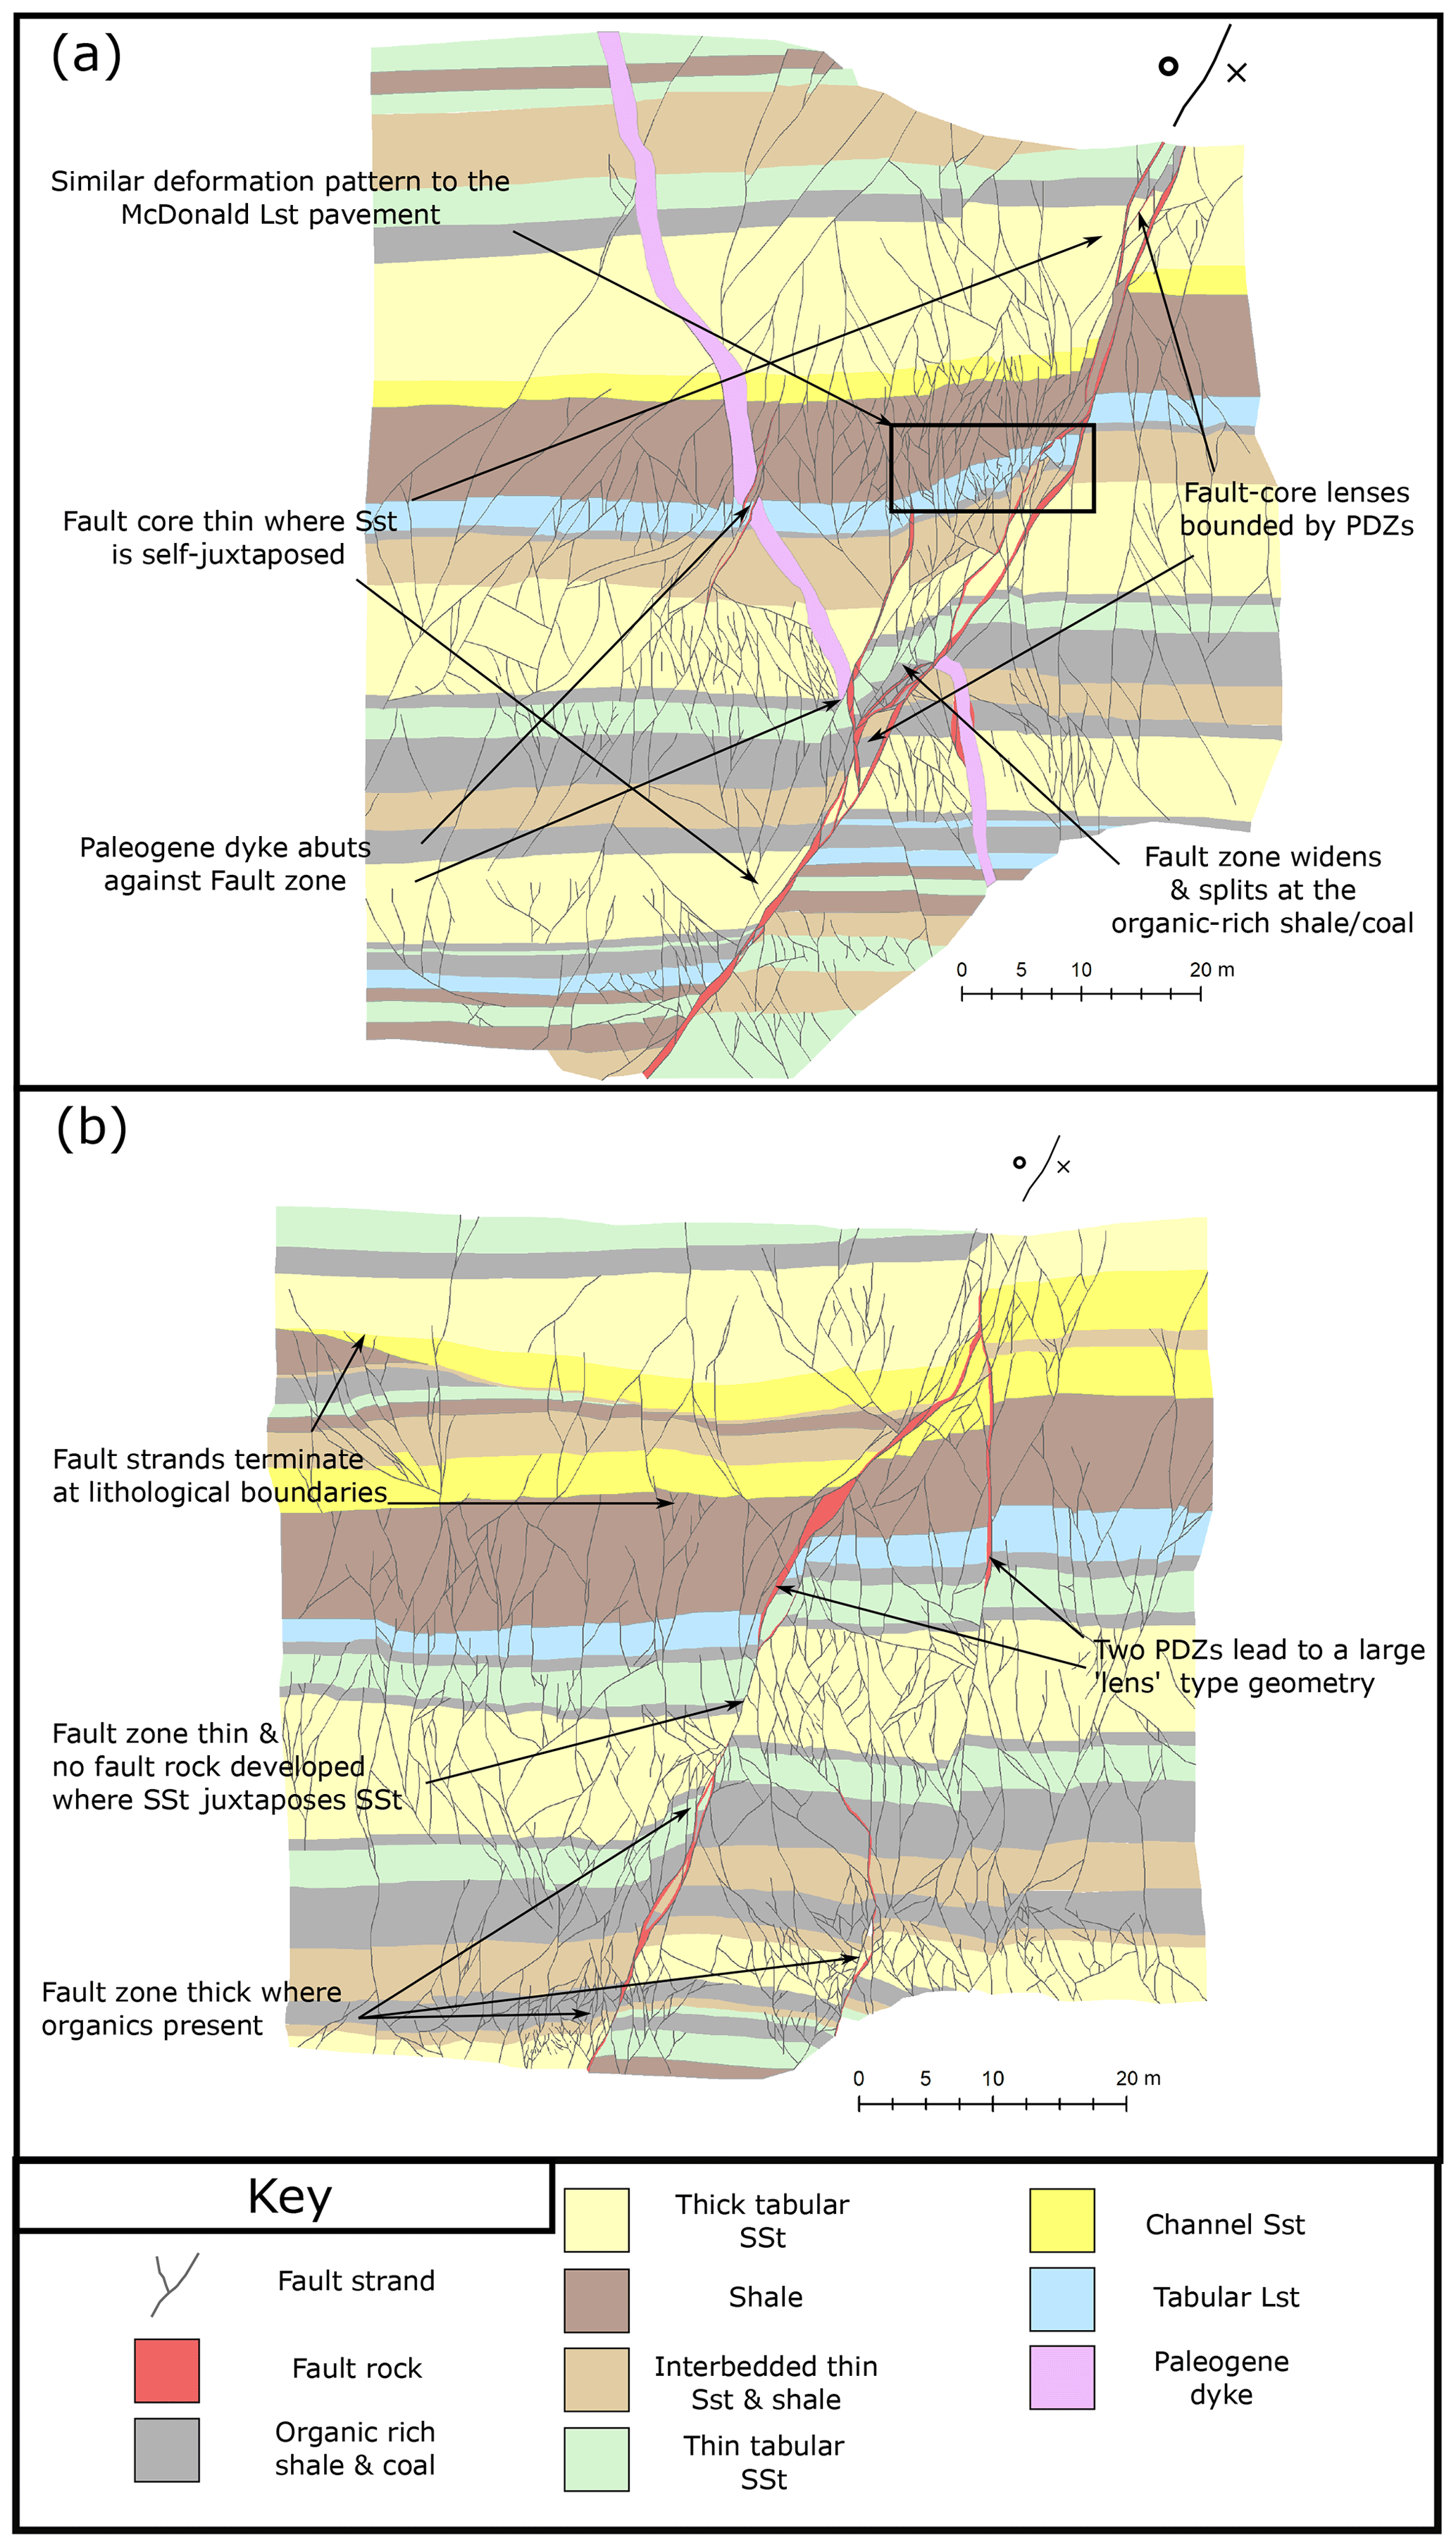
Figure 7Digitised fault strands of sinistral faults cutting the Limestone Coal Formation exposed along the high wall. (a) Sinistral fault that displays between 2 and 5 m of apparent (vertical) throw. A later Paleogene dyke, associated with the British Tertiary Igneous Province, intrudes across the fault; however, no evidence of white trap or dyke material is observed in the fault core (see Table 4 for discussion). (b) Sinistral fault that displays between 2 and 8 m apparent (vertical) throw along two principle displacement zones (PDZs). SSt stands for sandstone, and LSt stands for limestone. Photomontage provided courtesy of the British Geological Survey (BGS).
Table 2Summary of the key features observed along faults that juxtapose multiple lithologies. Please see S3 for full field descriptions. LLF stands for Lower Limestone Formation, and LCF stands for Limestone Coal Formation.
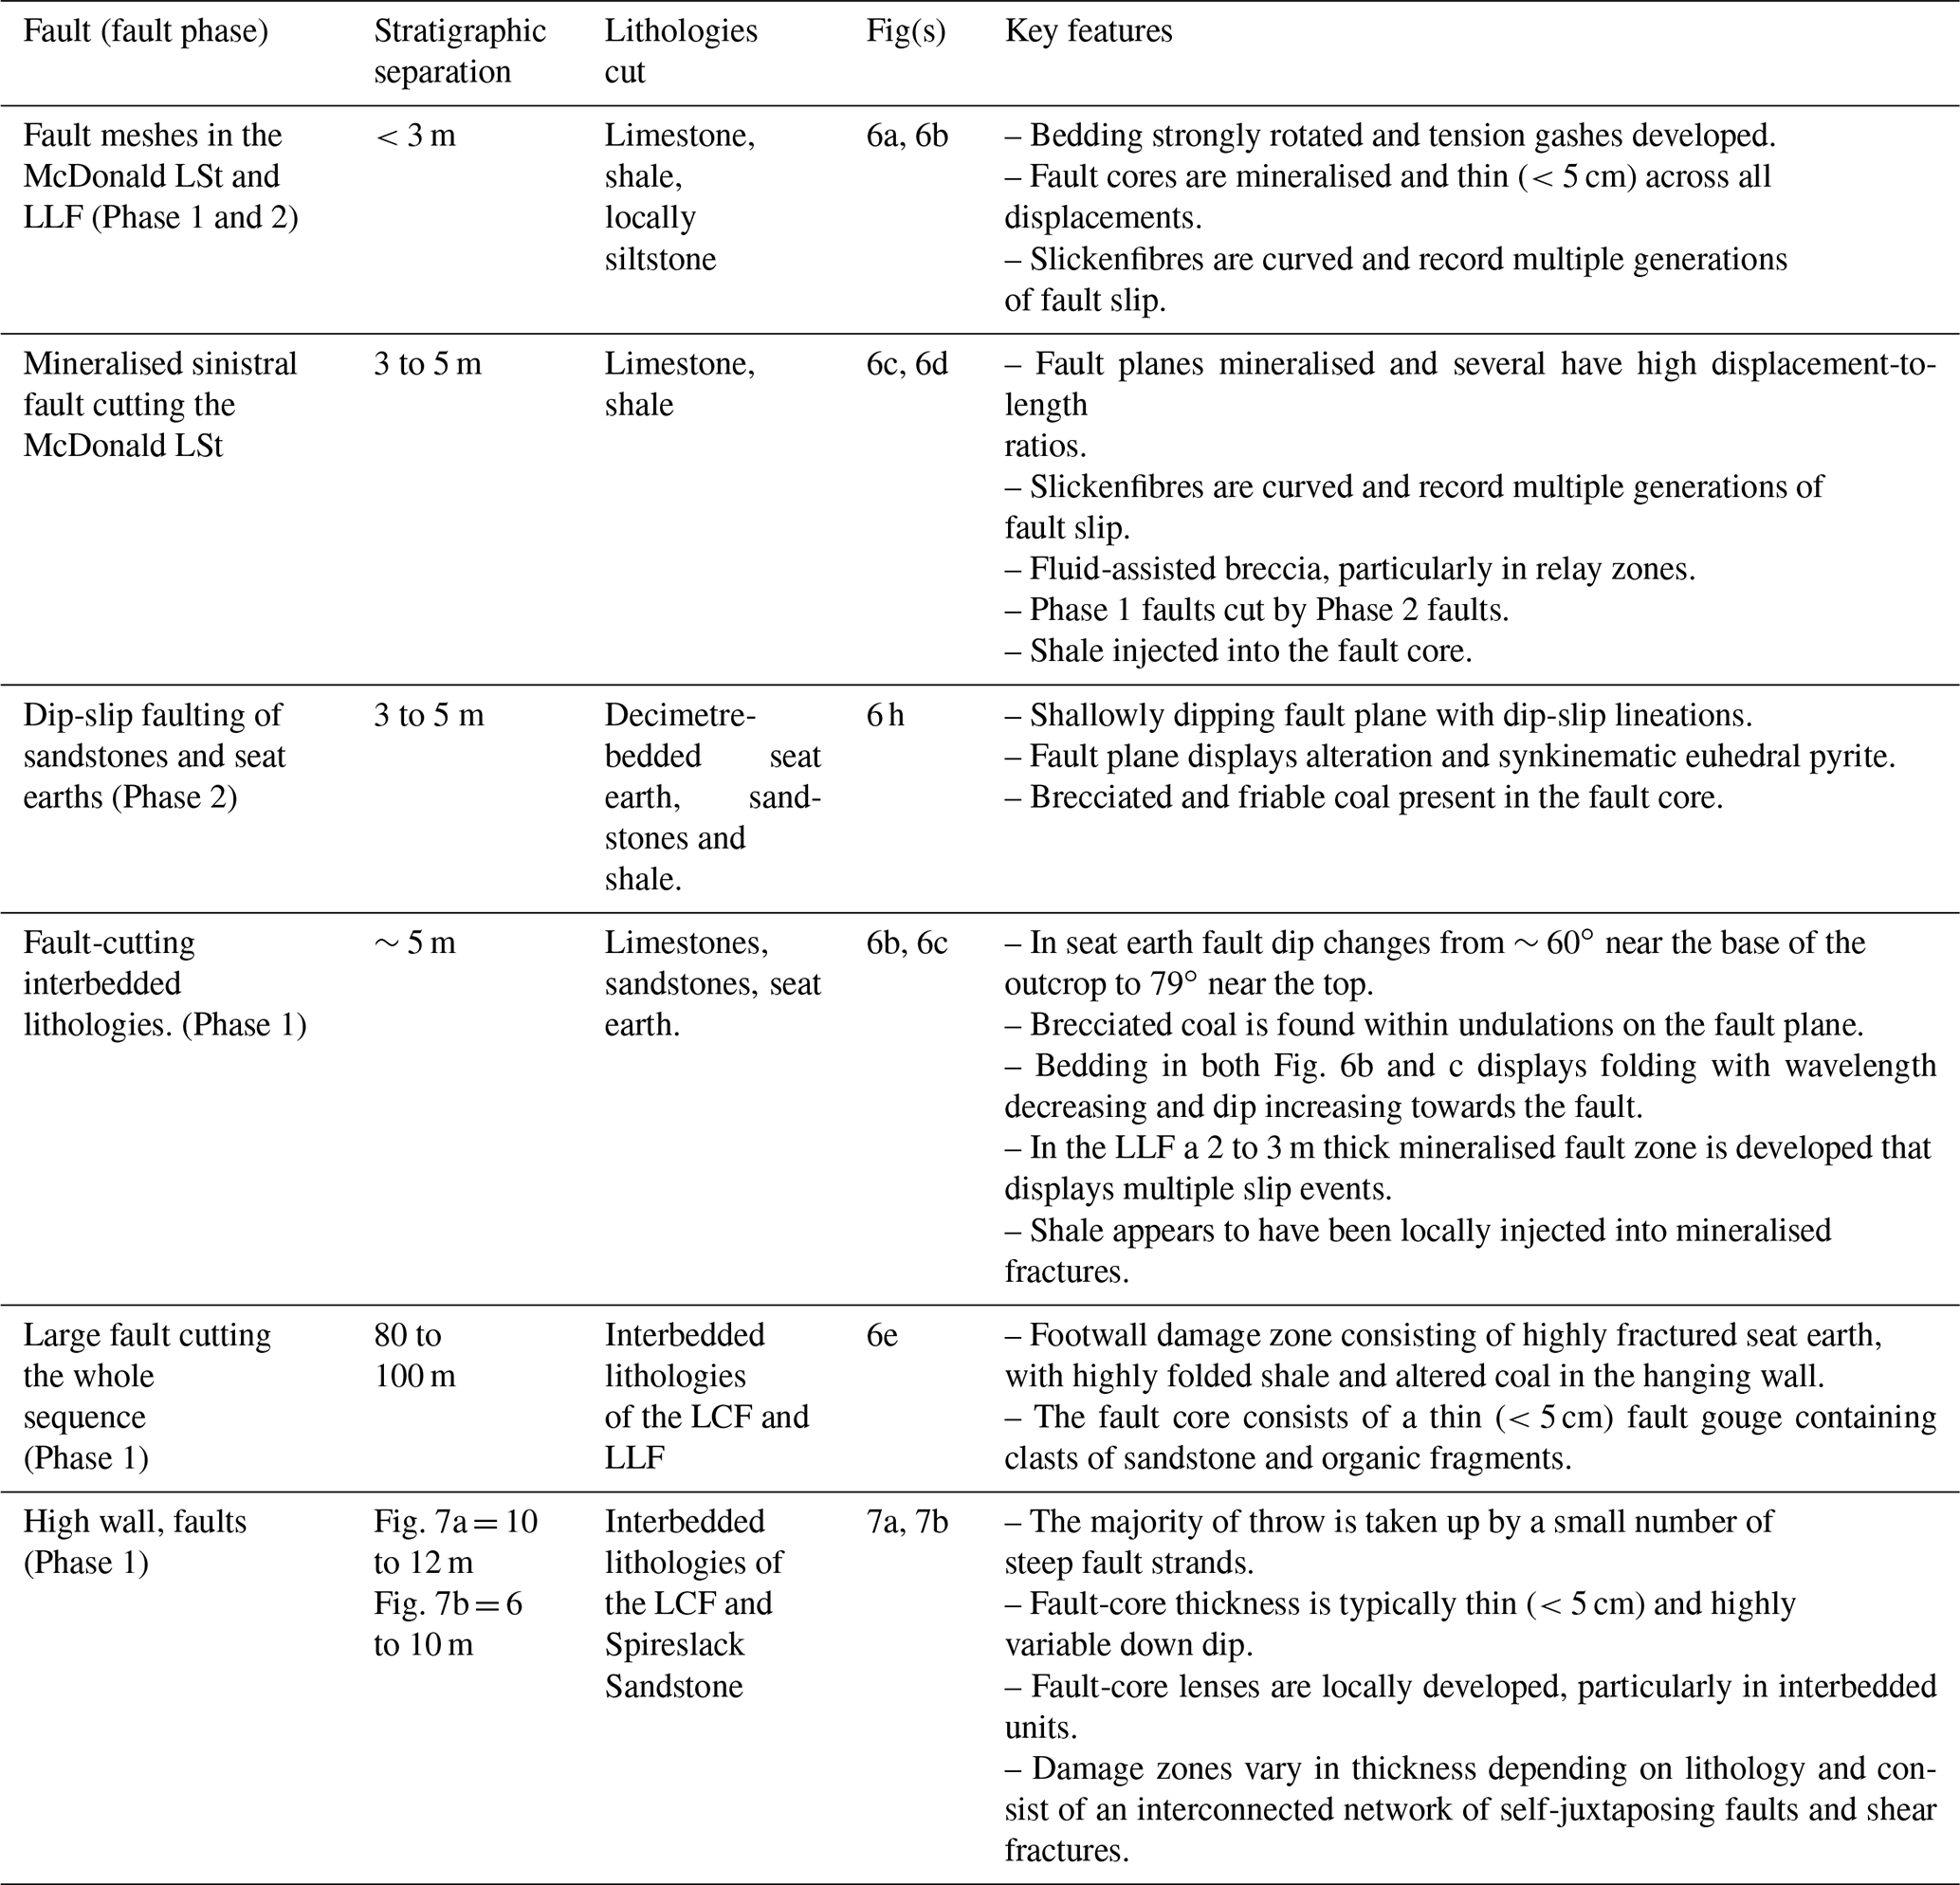
Larger stratigraphic offset (>5 m) faults that cut multiple lithologies display complex deformation styles (Figs. 6, 7; Table 2) that depend on (a) the lithologies cut by the fault, (b) the plane of observation (i.e. map in Fig. 4 vs. high wall in Fig. 7), and the phase of faulting (Figs. 4, 5, and 6). Fault dips vary considerably between different lithologies, with steeper dips observed in competent lithologies (Fig. 4d), as well as varying down dip along a single fault plane (Fig. 6e, g; Table 2). Variations in fault dip causes bed rotation and the development of fault-core lenses consisting of sandstone and seat earth that are elongated parallel to fault strike lenses (Figs. 4a, 6). Bedding is folded towards the faults (Figs. 4 and 6), with folding more intense in interbedded lithologies (Figs. 6g, 7) and shale (Fig. 6f). The majority of throw on faults with over 5 m stratigraphic separation is accommodated along one (Figs. 6b, c and 7a) or two (Fig. 7b) principal slip zones. Principal slip zones, particularly for Phase 1 faults, are typically straight and steep (>70∘) (Figs. 6 and 7) and are surrounded by a variably thick damage zone of shear fractures and self-juxtaposing faults (Fig. 7), with thickness that varies between lithologies.
Fault core thickness is typically low (<5 cm) and displays a highly variable internal structure both along strike and down dip (Table 2, Fig. 7). All faults display strike-parallel corrugations (Fig. 6d, e, h) that often display brecciated coal (Fig. 6e). Phase 1 faults are often mineralised with calcite (Fig. 6c), display multiple slip events (Fig. 6c), and locally display evidence of shale injected along the fault plane (Table 2). Conversely, Phase 2 faults rarely display calcite mineralisation and instead show evidence of syntectonic pyrite mineralisation (Fig. 6h). Where Phase 1 and 2 faults interact, for example in the centre of the void (Fig. 4a), a complex fault mesh is developed with displacement distributed over several sinistral and dextral fault strands (Figs. 3 and 6a, b).
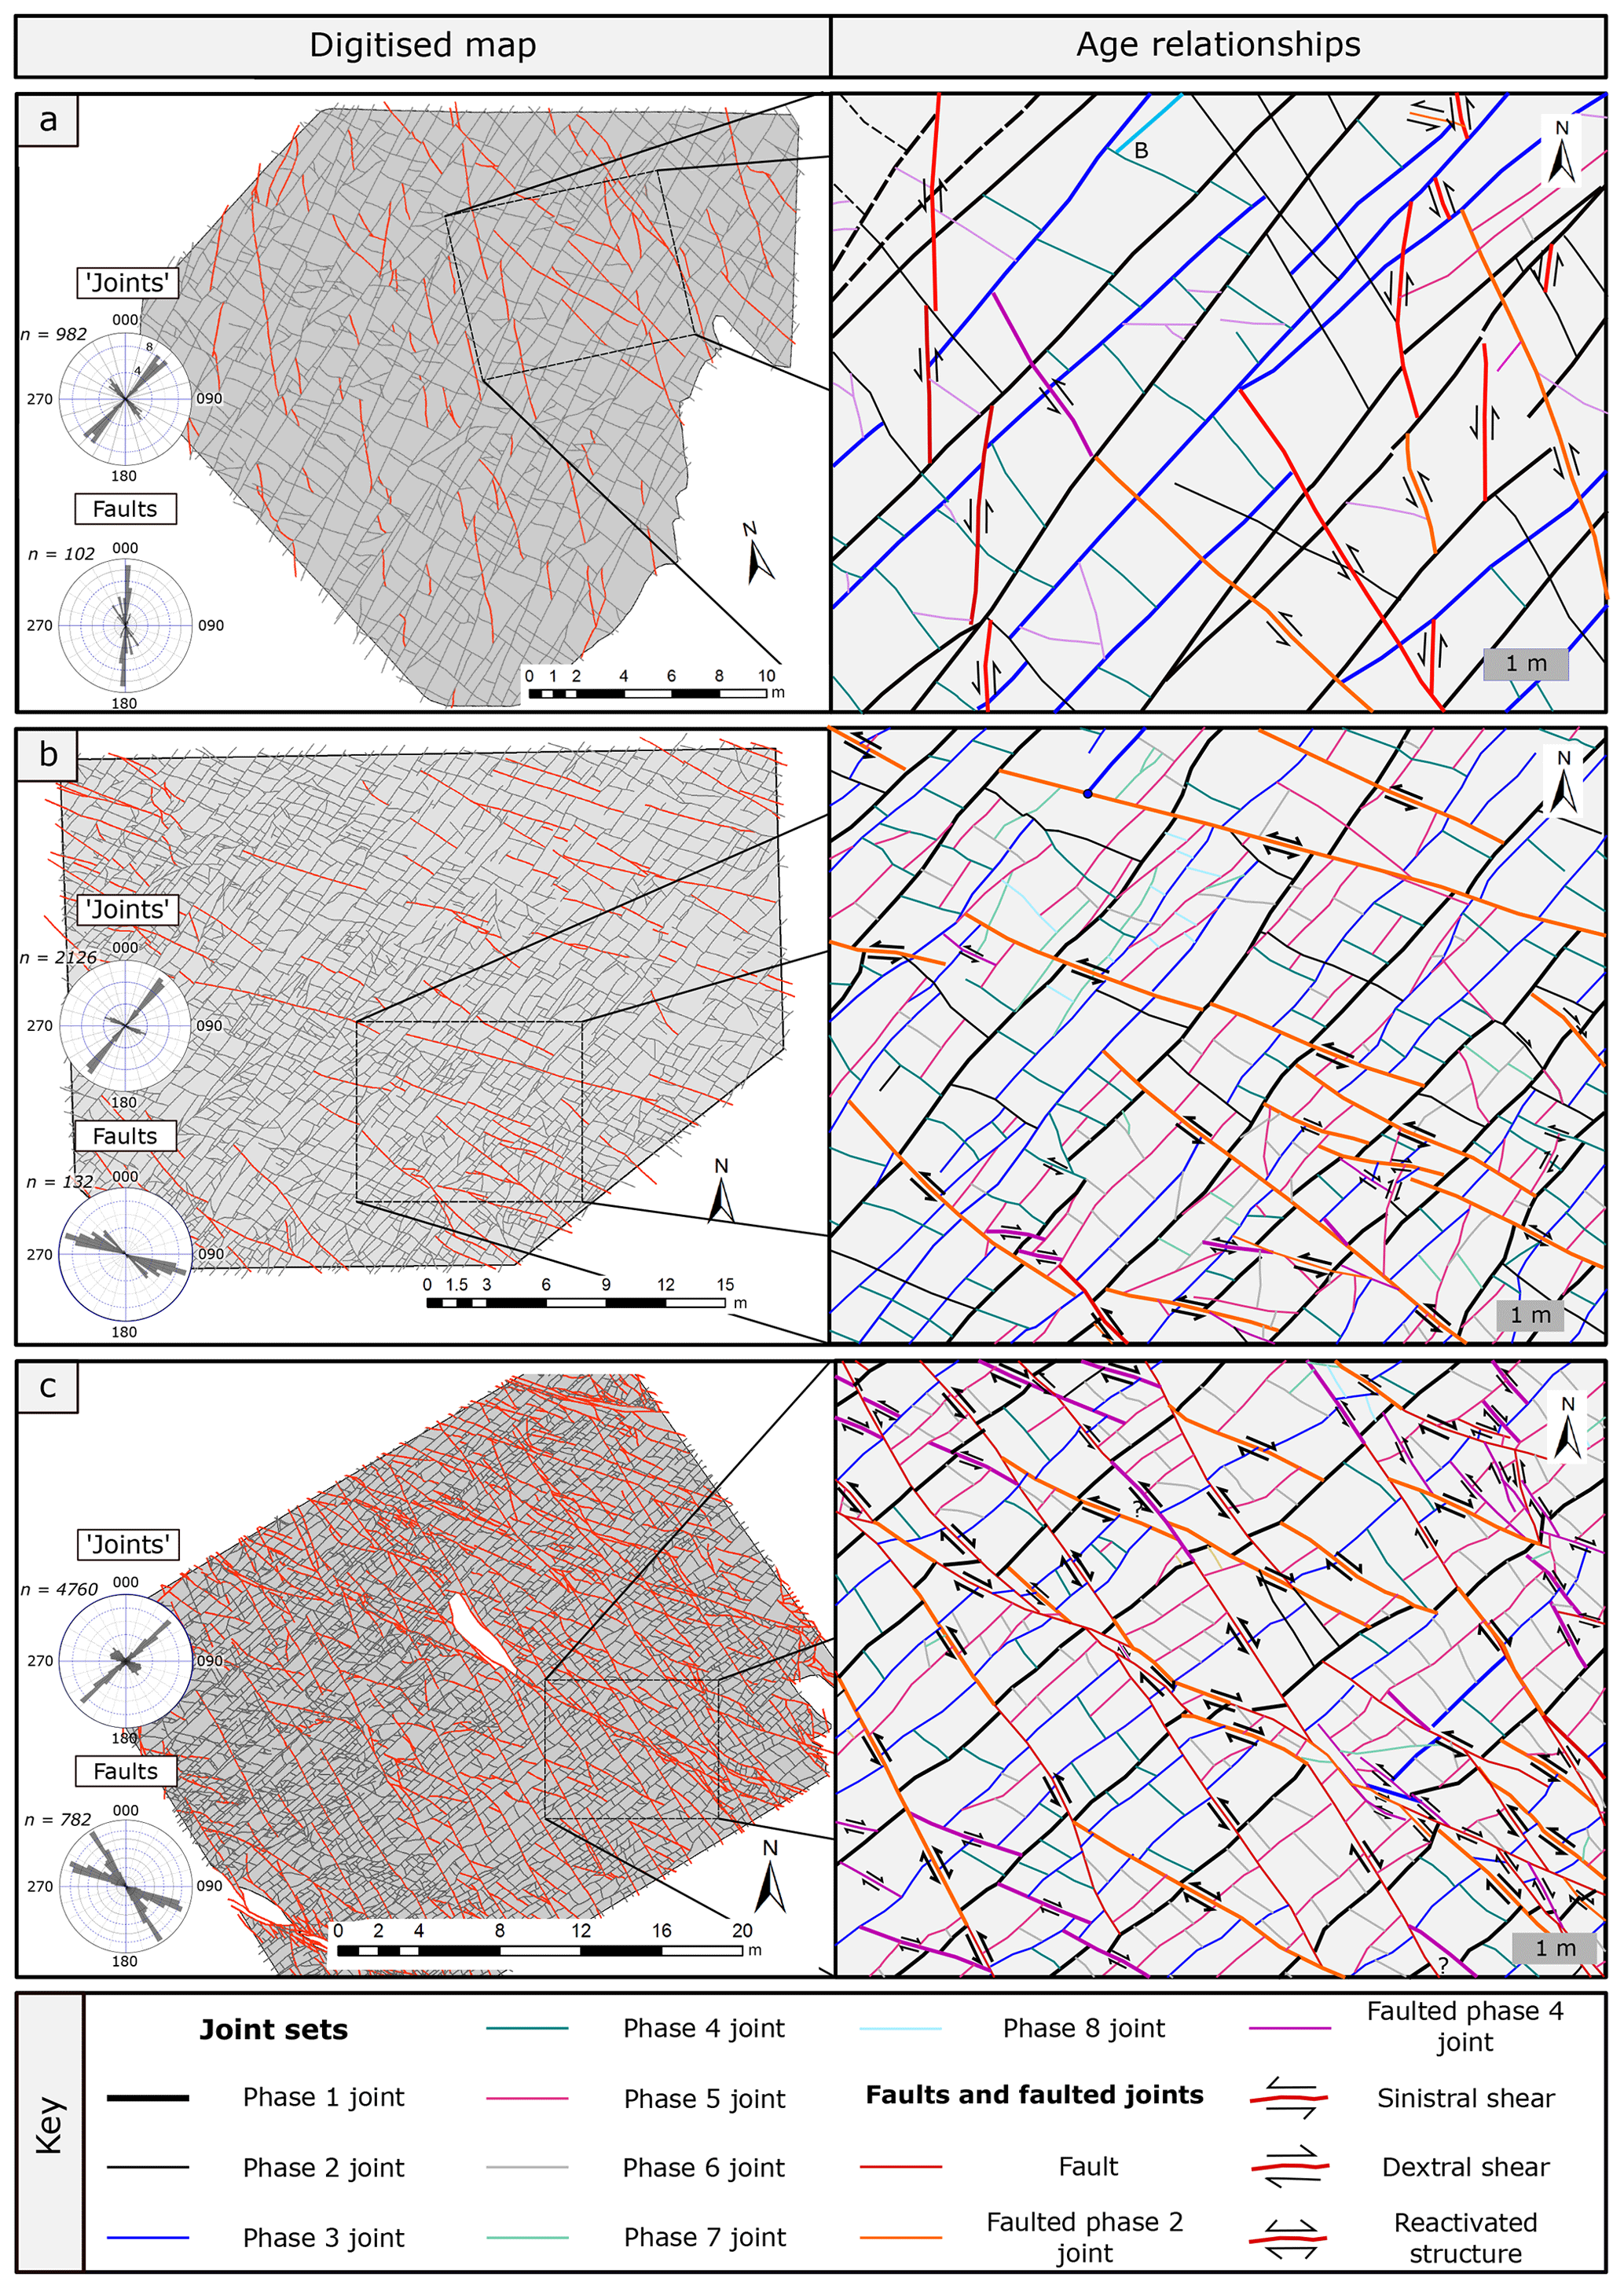
Figure 8Fracture maps with increasing intensity of faulting. For each digitised map the exported fault (red lines) and “joint” (dark grey lines) maps, along with the interpretation areas used for the analysis (light grey), are provided. Please note that while it is possible some joint's and/or faults acted as trailing segments (cf. Nixon et al., 2014), no direct field evidence was observed.
4.2.3 Interaction between faults and fractures within the McDonald Limestone
The style of the fault and fracture network in the McDonald Limestone changes across the site (Fig. 8) with the chronology and network properties of each sample area described below. In this section mineralised shear fractures, which are often faulted joints, are classified as faults for the network analysis.
Table 3Network characteristics of the joint and fault datasets presented for the three sample areas outlined in Fig. 8. Please note that because the fault network is superimposed onto the joint network, I-nodes (i.e. where a fault terminates) can represent a Y-node in the combined network. Similarly, where a joint terminated against a fault, due to the sealing properties of the fault, it is no longer appropriate to classify this as a connected branch and as such is classified as an I-node in the “joint network”. The percentage of each node classification is provided in brackets following the number of node counts. Trace length data are presented as orientation sets that were derived following visual assessment of length-weighted rose diagrams and do not relate to the age sets outlined in Fig. 8. For the combined network fracture statistics and trace length distributions for all datasets please refer to Fig. S2.
Fracture relationships at low fault intensity
The interpretation area in Fig. 8a is dominated by large trace-length NE-trending joints and smaller trace-length NNW-trending joints. Abutting relationships suggest these formed as four distinct phases, with two phases occurring at each orientation. The fault network displays two orientation sets (N and NNW) of sinistral faults with low connectivity, trace length, and intensity (Table 3). Both fault sets abut against favourably orientated Phase 1 or Phase 3 joints, indicating they formed later. Abutting relationships of Phase 3 joints against NNW-trending faults suggesting Phase 2 joints were reactivated as faulted joints (following Zhao and Johnson, 1992) during the first phase of faulting. Phase 5 and 6 joints, which display variable orientations in Fig. 8a, abut against the faults, suggesting that they formed later.
Fracture relationships where joints are favourably orientated for reactivation
The interpretation area in Fig. 8b, which is located slightly closer to the NW-trending dextral fault zone that cuts the middle of the site (Fig. 4), displays a similar intensity of faulting (I = 0.5 f m−1), however, joint intensity is higher (I = 2.8 f m−1). Joints from Phases 1 to 4 are observed in this panel; however, faulting caused the segmentation of NNW-trending Phase 1 and 3 joints such that the recorded trace length of these joints in this panel is decreased compared to Fig. 8a. Unlike Fig. 8a, where only sinistral faults were observed, both sinistral and dextral offsets are present in Fig. 8b. Fault orientations were typically either ENE or NE with the number of northerly faults significantly decreased (Table 3). Abutting relationships of faults in this panel suggests that the majority of strands represent reactivated Phase 2 (orange) or Phase 4 (purple) joints. The majority of faulted Phase 2 joints display sinistral offset or evidence of reactivation, while Phase 4 joints display predominantly dextral offsets. Abutting relationships suggest that faulting occurred as two phases, with joint development occurring both between (Phase 5 and 6) and following (Phase 7 and 8) the formation of dextral faults.
Fracture relationships where both phases of faulting is present
The interpretation area in Fig. 8c is located close to the major NW-trending dextral fault (Fig. 4) and includes two self-juxtaposing faults towards the bottom and top of the studied section (Fig. 8c). The panel displays a complex fracture evolution; however, many of the features observed in the previous panels are visible. Phase 1 to 4 joints are still easily identified; however, their trace length has further decreased due to increased fault intensity (I = 1.9 f m−1). Unlike Fig. 8a and b, the fault network is well connected in this panel (Pc = 0.71), with individual fault strands linking to form locally complex relay zones (e.g. the bottom left of Fig. 8c). Abundant sinistral, dextral, and reactivated fault strands are observed, with Phase 2 and 4 joints regularly becoming reactivated and linked by new fault strands. Locally, Phase 6 joints are also reactivated in a dextral sense (e.g., the relay zone in the NE of Fig. 8c). The number of joints that abut against faults and the pre-existing joint sets (Phase 1 to 4) is greatly increased in this panel, with several Phase 7 and 8 joints identified.
Summary of structures
As fault intensity increases, the complexity of age relationships in the fault-fracture network also increases (Fig. 8). Phase 1 to 4 joints are identified across all three panels and are interpreted as the “pre-existing” joint network. As fault intensity increases, these “pre-existing” features become segmented through faulting and their recorded trace length decreases. While fault intensity is similar in Fig. 8a and b, faults with a N–S strike are only present in Fig. 8a. This is probably due to the subtle anticlockwise rotation of the pre-existing joints relative to the stress field that enabled the reactivation of Phase 2 and 4 as faulted joints (Fig. 8b, c) and promoted the formation of Phase 5 and 6 joints (orange and purple lines in Fig. 8). The number of faulted joints drastically increases with increased fault intensity, with joints becoming linked through the formation of new fault strands. In agreement with the void-scale mapping (Fig. 4), two phases of faulting have been identified in Fig. 8b and c, with an earlier sinistral and later dextral phase. The sinistral phase appears to preferentially reactivate Phase 2 joints, whereas the dextral phase preferentially reactivated both Phase 2 and 4 joints. The increase in reactivated joints and two clear phases of faulting in Fig. 8c explain the large increase in joint intensity in this panel (I = 4 f m−1, compared to I = 2.6 f m−1 in Fig. 8a). While age relationships are reasonably consistent across this section of the limestone pavement, as fault meshes begin to form, age relationships become increasingly complex and spatially variable (Fig. 6a). This may be due to the development of “trailing segments” (i.e. sections of a previous structure reactivated during subsequent deformation; cf. Nixon et al., 2014); however, no direct field evidence was observed as part of this study (e.g. mineralisation and/or evidence of shear). This suggests deformation occurred in a highly heterogeneous stress field, which was rotated relative to locally active fault strands. An increase in fault throw also affects the intensity, trace length, and connectivity of the network.
Table 4Summary of the structural features observed at Spireslack SCM. References in the table are as follows: (1) Leeder (1982); (2) Underhill et al. (2008); (3) Haszeldine (1984); (4) Ellen et al. (2019); (5) Coward, (1993); (6) Anderson (1951); (7) Soper et al. (1992); (8) Browne et al. (1999); (9) Read et al. (2002); (10) George, (1978); (11) Thomas (2013); (12) O'Keefe et al. (2013); (13) Rippon et al. (2006); (14) Ritchie et al. (2003); (15) Leslie et al. (2016); (16) Caldwell and Young (2013); (17) Emeleus and Gyopari (1992); and (18) Mykura (1965).
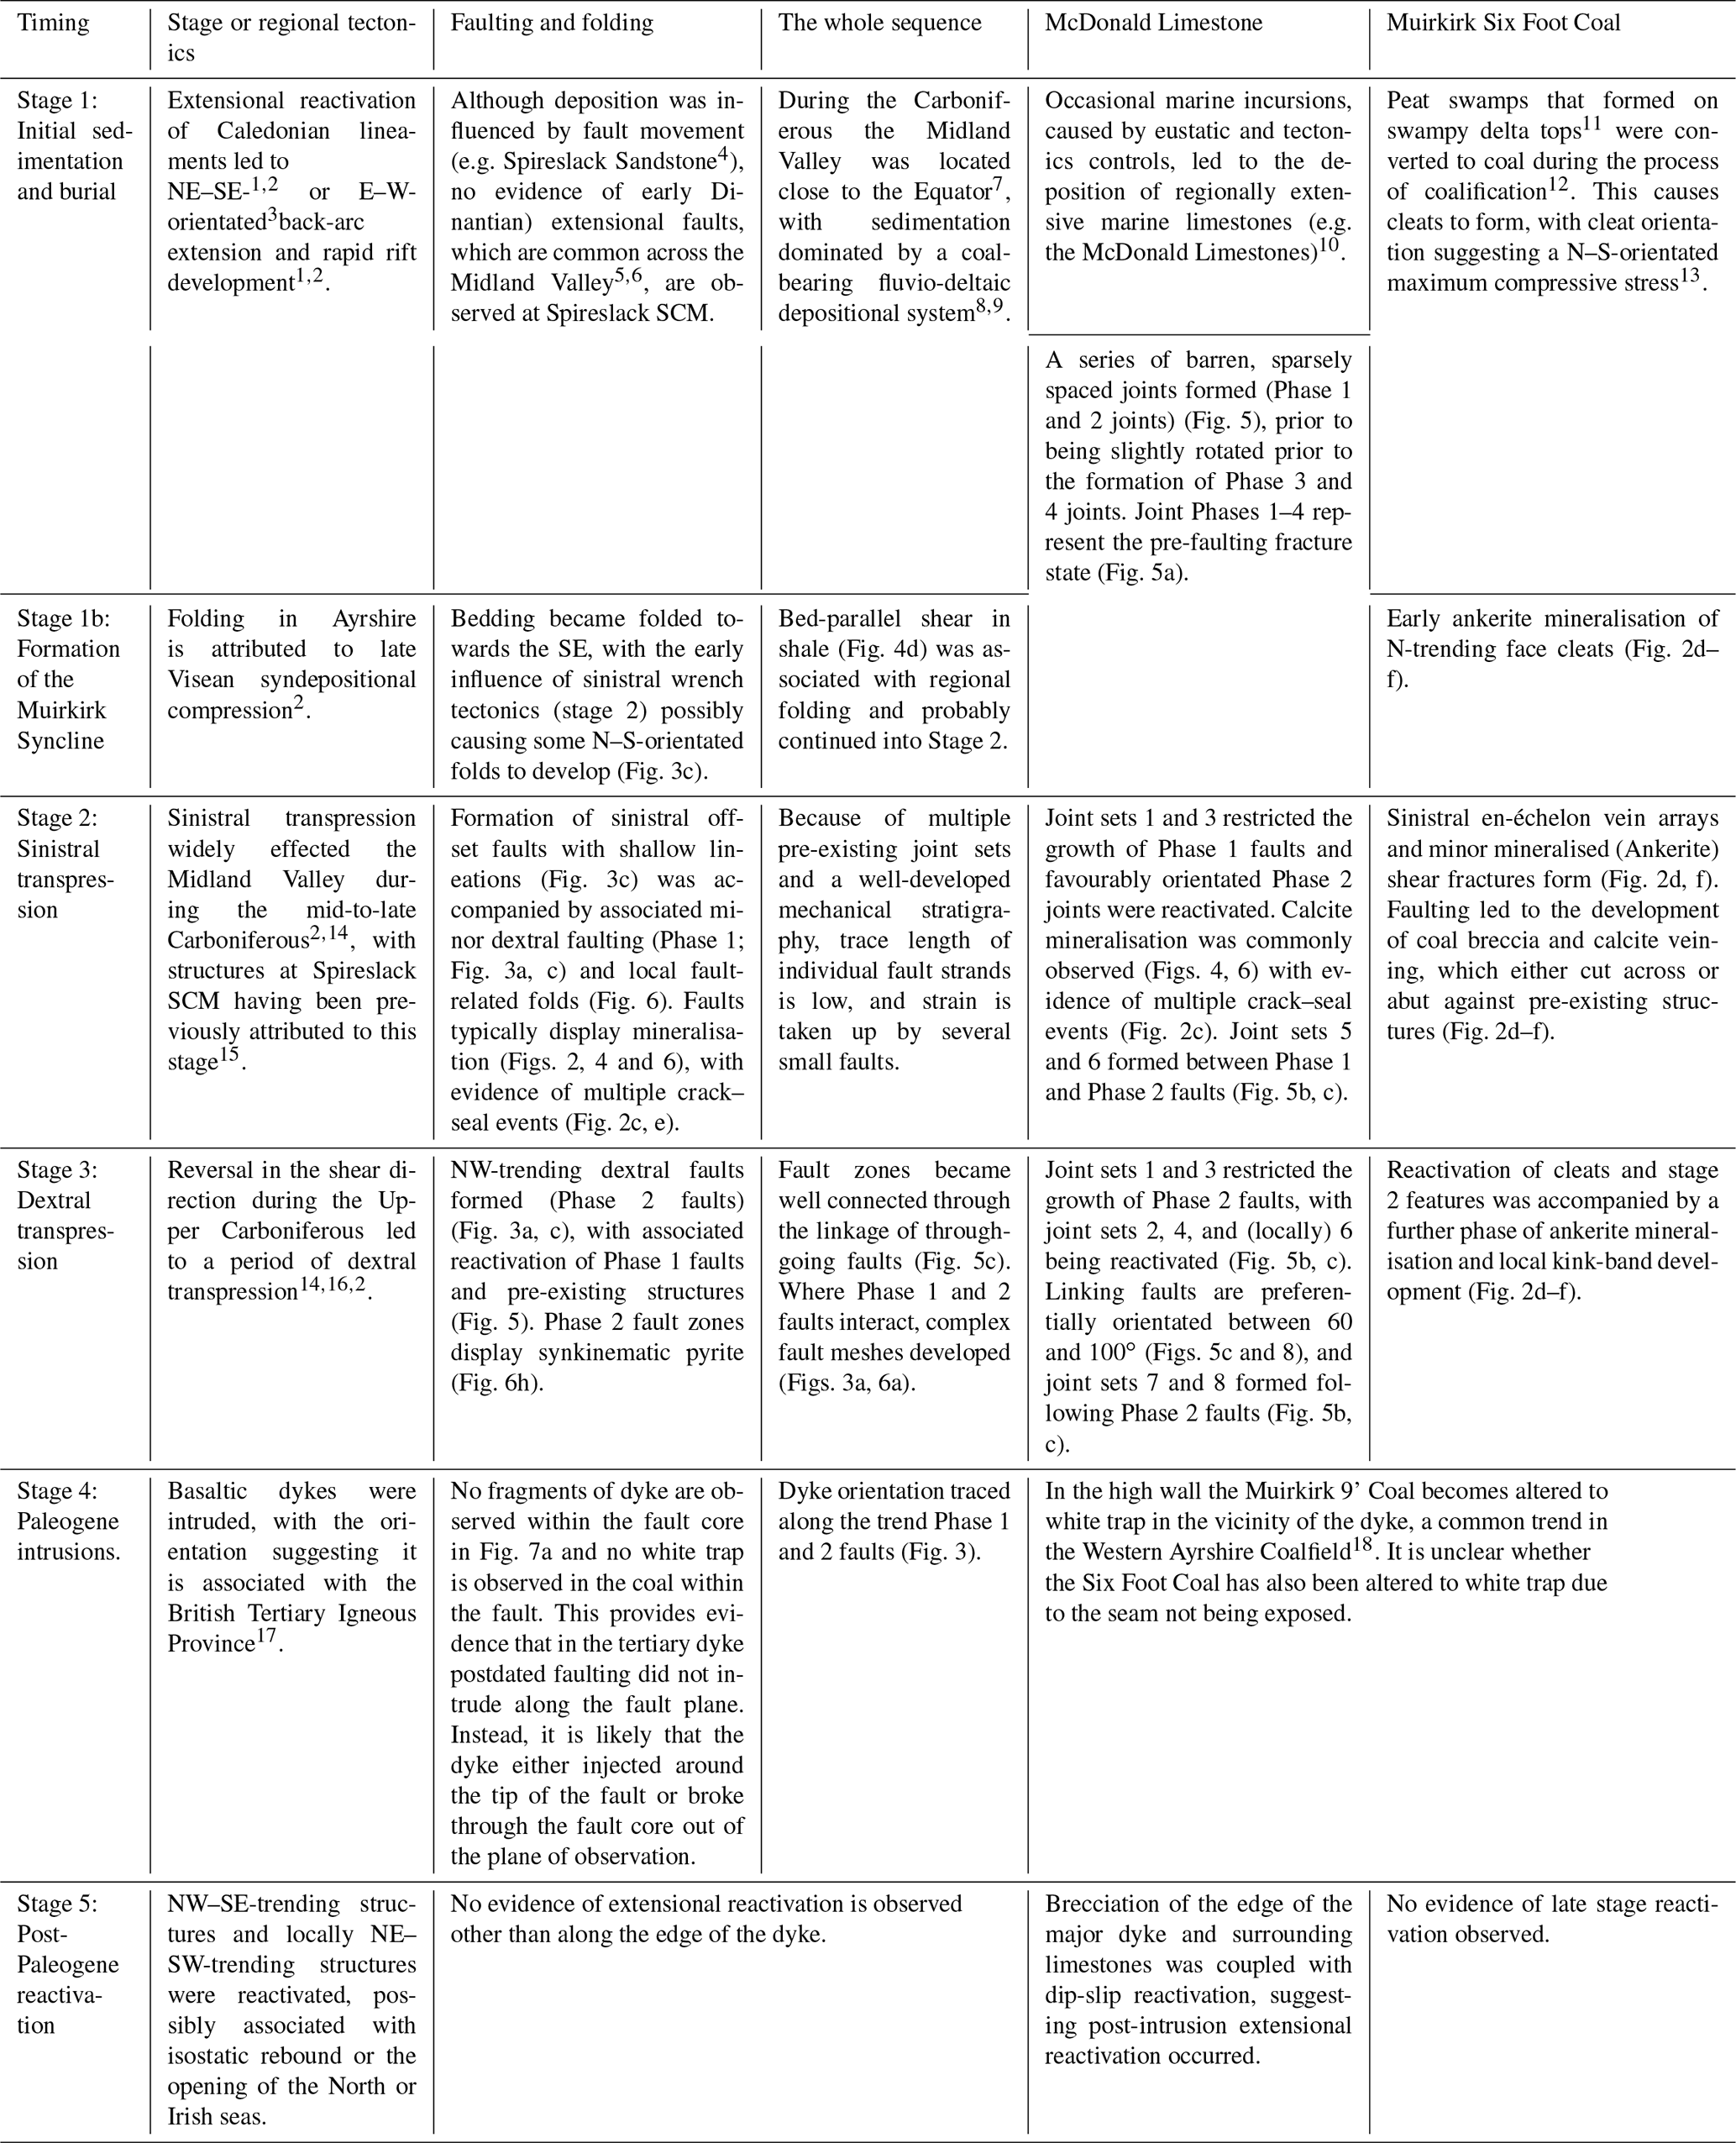
The exceptional 3D exposures of the Limestone Coal Formation and surrounding lithologies have informed a five-stage conceptual model for the development of the structures (Table 4). While this model is based on observations from Spireslack SCM, the model could be improved by utilising data from nearby open-cast sites (Leslie et al., 2016), legacy subsurface data as introduced in Ellen et al. (2016), and additional correlation with the larger-scale structures observed in the Midland Valley of Scotland.
6.1 The effect pre-existing joints and coal cleats on subsequent deformation and network connectivity
The mechanically stratified succession at Spireslack SCM has led to the development of a fracture stratigraphy (Laubach et al., 2009). While joints across the site locally display two “orientation sets” (Fig. 8, insets), abutting relationships discussed in Sect. 4.4.3 identified 8 “age sets” punctuated by two phases of faulted joints (Fig. 8). Different orientation sets have previously been attributed to separate tectonic events (e.g. Vitale et al., 2012) or situations where the intermediate (σ2) and minimum (σ3) principal stresses are nearly identical and can therefore easily switch between each other (Caputo, 1995; Caputo and Hancock, 1998). It is likely the latter that contributes to the rapid switching between ∼ NNW-trending (Phase 1, 3, 5, and 7) and ∼ NE-trending (Phase 2, 4, 6, and 8) joint sets observed in Fig. 8.
There are several examples of joints or cleats influencing fault growth at Spireslack SCM (Figs. 3, 5, 8). Jones and Tanner (1995) found that transpressional strain can often become partitioned across pre-existing structures. At Spireslack, joints appear to be accommodating the shear-strain component, with pure shear accommodated through the tightening of the Muirkirk Syncline. Throughout both deformation phases, faults abutted against NE-trending joint sets. However, during the sinistral phase of faulting, larger trace length N- to NNW-trending cleats and joints (e.g. Phase 2 joints, Fig. 5a) were reactivated. As the principal stress orientation changed to enable the formation of phase 2 dextral faults (Fig. 4c), faulted joints associated with the first phase of faulting became reactivated (Fig. 8c), with Phase 4 joints preferentially reactivated (Fig. 8b, c). Phase 2 joints only became reactivated in the vicinity of self-juxtaposing dextral faults (NW–SE-trending feature cutting Fig. 8c). The preferential reactivation of specific joint sets could be due to the following reasons.
Changes in the mechanical properties of lithologies at Spireslack SCM due to mineralisation associated with Phase 1 faults. For example, coal cleats, which previously acted as a weakness in the rock (Li et al., 2016), now act as strength inclusions following ankerite mineralisation, enabling barren shear fractures to develop (Fig. 3d).
Subtle differences in joint orientation between sets (Fig. 8, inset) change the relative orientation of features to the stress field (e.g. Moir et al., 2010; Zhao and Johnson, 1992) and alter the stress ratio across the fracture (Chang and Haimson, 2000; Haimson and Chang, 2000).
Differences in mechanical properties of the fracture surface, e.g. due to their longer trace length or fracture roughness (Nasseri et al., 2009; Tsang and Witherspoon, 1983), could increase in Phase 1 joints in comparison to smaller trace length Phase 3 or 5 joints (Reed et al., 2008).
The fact that some joints show evidence of preferential reactivation and subsequent cementation, while others remain barren, suggests that certain joint sets indicate the past connectivity of mineral rich fluids through the network, which at Spireslack SCM was dominated by faults (Fig. 8). Barren joints typically post-date mineralisation (Peacock, 2001; Peacock and Sanderson, 2018); however, Phase 1 and 3 joints at Spireslack are often offset by faults or reactivated as faulted joints (Fig. 8). This suggests joints were present at the time of faulting; however, not all joints sets were hydraulically connected to the mineralising fluids. This could be either due to fluid flow being dominated by vertical flow associated with fault–valve behaviour during slip events (Sibson, 1990, 1992), micro-cataclasite and/or mineralisation along joints that were not visible during field observations or had been weathered out during subsequent groundwater flow, or mineralisation that occurred under a stress-induced flow pattern that had a relatively high stress ratio (k<3). This would result in flow becoming channelised along favourably orientated features, while those that are sub-optimally orientated are not dilated and therefore contain no (or very little) flow (Baghbanan and Jing, 2008).
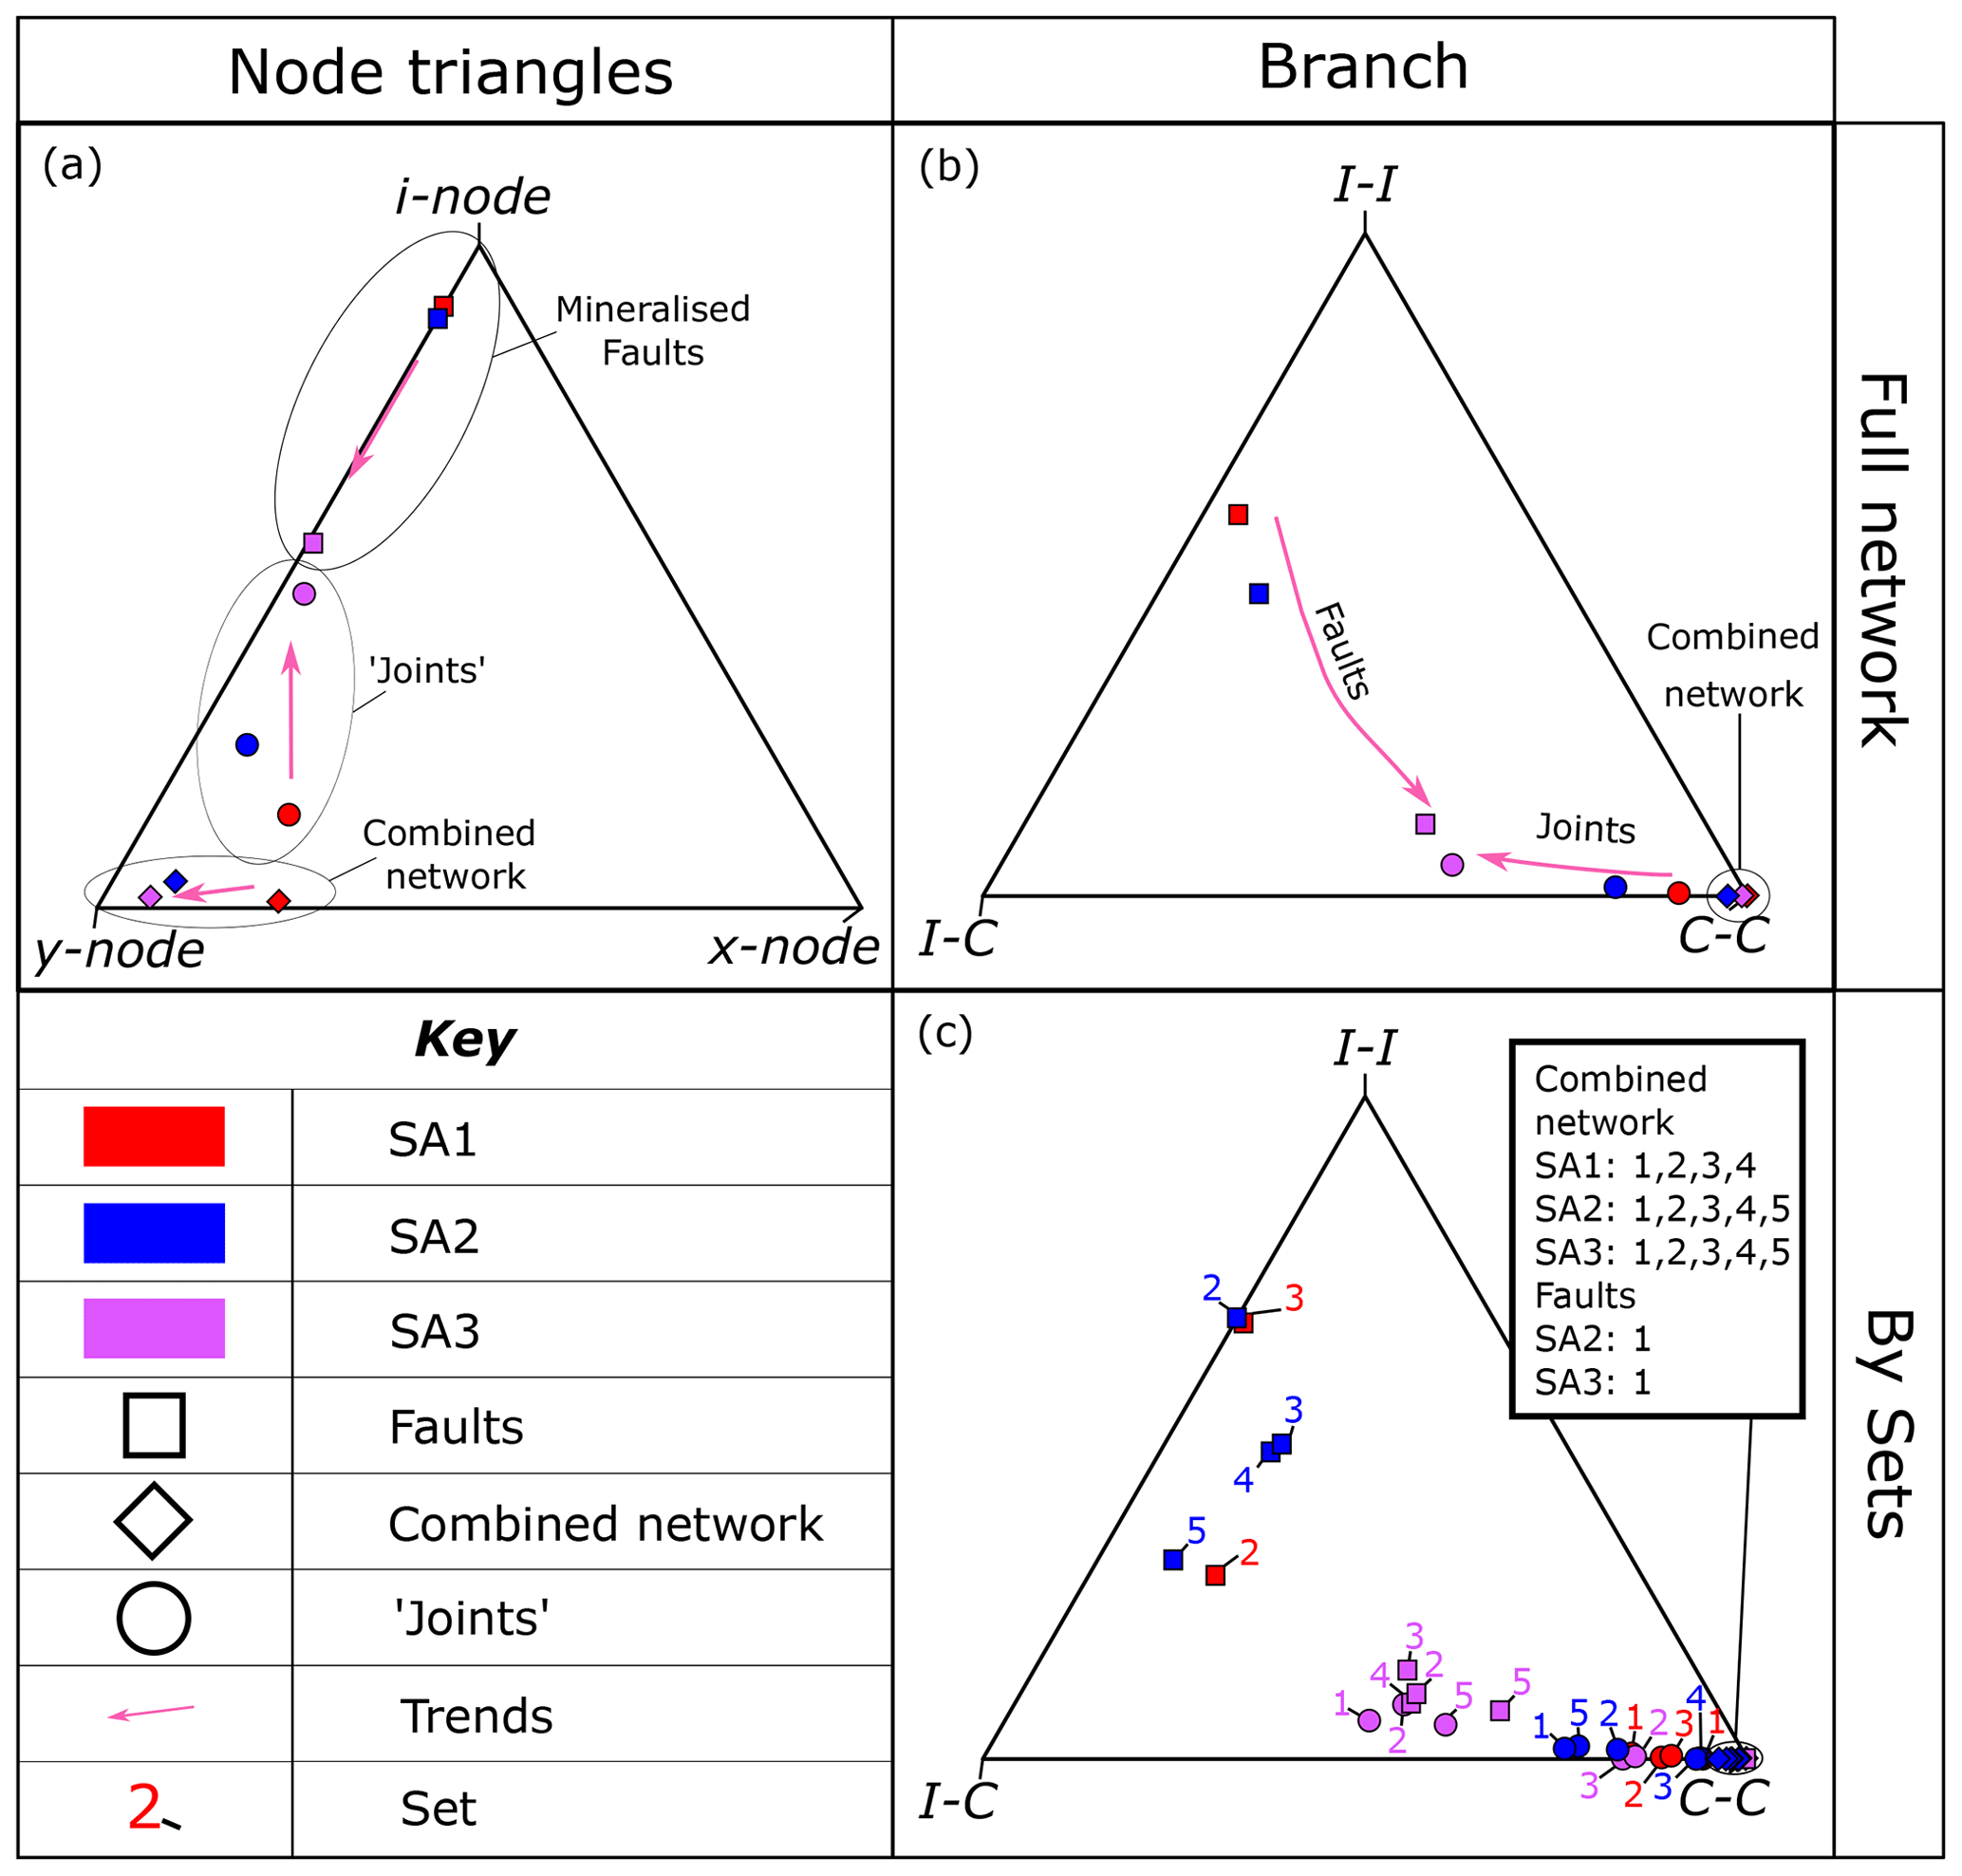
Figure 9Network topology data. Node and branch triangle (following Sanderson and Nixon, 2015) for the joint, fault, and combined fracture networks for the three sample areas shown in Fig. 8: (a) node and (b) branch data presented by sample area for the fault, joint, and combined networks, and (c) branch data by set, as outlined in S2, to investigate the directionality of network connectivity. Please see the main text for a description of the main trends.
Groundwater flow within Carboniferous aquifers is dominated by bed-parallel fracture flow (Dochartaigh et al., 2015). While the combined fault–fracture network across the McDonald Limestone displays very high network connectivity (Pc = 0.99 to 1.00) and high fracture density (D = 3.1 to 5.9 f m−2) (Figs. 9, S2), mineralised faults (Figs. 5, 6) may act as a baffle or barrier to flow (e.g. Skurtveit et al., 2015). It is therefore more appropriate to consider the “joint network” when assessing the modern-day network connectivity at the site. While joint intensity increases as fault intensity increases (Table 3), this is not the case for connectivity. Where faulting intensity was low, joints are well connected (SA1, Pc = 0.95). However, as fault intensity increased and the number of faulted joints increases (SA2), connectivity drops to Pc = 0.90. In SA3, where fault intensity is 1.9 f m−1, the connectivity of the joint network drops to Pc = 0.77. Additionally, connectivity depends on the orientation of the fractures, with NW-trending features being the most connected (Table 3, Fig. 9c). The modern-day stress orientation in Scotland (roughly northerly trending maximum compressive stress; Baptie, 2010; Heidbach et al., 2008) would act to reduce the aperture of these large trace length joint sets and further reduce the permeability of the network
The drop on connected joints is shown in the trends (pink arrows) on Fig. 9 and is caused by the gradual increase in abutting relationships between faults and joints. As more joints become reactivated as faults, the fault network becomes more connected as splays (i.e. Y-nodes; Fig. 8) develop, whilst reducing the number of connected joints (i.e. X- and Y- nodes in the “joint” dataset) (Fig. 8). Similarly, as the intensity and connectivity of the fault network increases, the number of abutting relationships between joints and faults increases. The increases the number of I-nodes in the joint network and gradually decreases the number of connected branches as the intensity of faulting increases. This leads to the counter-intuitive observation that although joint intensity increases in areas associated with faulting (Table 3), the cementation of faults and faulted joints causes the connectivity of the modern-day network in these areas to be lower (Fig. 9).
6.2 The role of lithology on faulting style: the importance of lithological juxtaposition
The internal structure of faults at Spireslack SCM is greatly affected by the level of lithological juxtaposition, with different properties observed for self-juxtaposing faults (Sect. 4.2.1) and those that cut multiple lithologies (Sect. 4.2.2). Self-juxtaposing fault strands cutting lithologies without pre-existing joints are typically relatively planar, develop relay zones, and only display local iron staining along fault planes (e.g. the Six Foot seat earth; Fig. 5a, b). Conversely, in lithologies where pre-existing weaknesses influence the growth of faults, multiple sets of lineations on fault planes and the presence of compound veins provide evidence for multiple slip events (McDonald Limestone; Figs. 3a, c, 6b and 8). This suggests that faults in these lithologies initiated as a segmented fault–fracture mesh (Sibson, 1996), with field evidence suggesting mineralising fluid flow in the McDonald Limestone and coal occurred as multiple crack–seal events (Fig. 3c, e). This implies that self-juxtaposing faults cutting the McDonald Limestone and Six Foot Coal at Spireslack behaved in a similar manner to other faults in carbonates with fluid pathways only remaining open for a small amount of time and probably closing following fault slip (cf. Billi et al., 2003; Sibson, 1990, 1992). Mineralised Phase 1 faults that cut multiple lithologies also display multiple slip events (Fig. 6c) and matrix-supported (calcite) fault breccias located within relay zones (Fig. 6d), intersections between Phase 1 and 2 faults (Fig. 6c), and asperities along the principle slip zone (Fig. 6a). This suggests fault valve behaviour was also present along non-self-juxtaposing faults (Peacock et al., 2019; Sibson, 1990).
Where faults cut multiple lithologies, shale accommodates the rotation of bedding, leading to rotated blocks and multiple generations of curved slickensides (Fig. 6). As shale is buried and compressive stresses increase, the ratio of pre-consolidation stress and compaction-related stresses control the behaviour or shales and mud rocks (Yuan et al., 2017; Nygård et al., 2006). As a general rule, shales are ductile during burial and brittle during exhumation, where they experience stresses below the maximum stress they have encountered. Ductile behaviour of the shales at the time of faulting suggests that both phases of faulting occurred prior to maximum burial, which is estimated at <3000 m at around 60 Ma for the Limestone Coal Formation (Monaghan, 2014).
Fault cores at Spireslack SCM also differ between self-juxtaposing faults (Fig. 5) and those that cut multiple lithologies (Table 2). Wilkins et al. (2001), studying growth of normal faults through jointed lithologies, found similar observations to those at Spireslack SCM with little fault rock development (Fig. 3a, 5f) and considerably smaller displacement-to-length ratios than expected for faults that do not cut jointed lithologies (Figs. 5f, 6a, d). While the fault core at Spireslack SCM is typically thin (Table 2), similar to previous studies (e.g. McKay et al., 2019; De Rosa et al., 2018) thickness was found to be highly heterogeneous both along strike and down dip. Much of this variability is caused by the lithological juxtapositions observed across the fault (Fig. 7), asperities on the principal slip zone (Fig. 6), the degree of folding (Fig. 6), and the presence of fault core lenses (Fig. 7). In agreement with the fault growth model of Childs et al. (2009), the highly segmented network of self-juxtaposing faults (Fig. 8) and differences in fault dip between lithologies (Fig. 4d) contribute to the heterogeneity observed in the fault cores of faults that cut multiple lithologies.
Our data demonstrate that the evolution of faults and fault zone structure, and therefore the bulk hydraulic properties of the rock mass at Spireslack SCM, varied both through time and as faults cut multiple lithologies. The abundance of faults within competent lithologies that cannot be traced into shale interbeds suggests faults at Spireslack SCM initiated as segmented fault strands within competent lithologies (e.g. limestones) and the coals (Figs. 5, 8). Shale interbeds acted to restrict fault growth and instead accommodated ductile deformation. Despite faulting being dominantly strike slip, the oblique orientation of faults to bedding across the site meant that many fault growth models derived from observations and modelling of normal faults in mechanically layered sequences appear to be valid (e.g. Childs et al., 1996; Ferrill et al., 2017; Schöpfer et al., 2006, 2007, 2016). However, it is also clear that the initial segmented fault network within the competent layers was strongly controlled by the presence and evolution of the joints and mineralised fault zones (Fig. 8). It is therefore helpful to consider the concept of lithological juxtaposition, the presence and behaviours of shale interbeds, and the relative timing of deformation, when considering the growth and internal structure of fault growth in mechanically layered sequences.
The exceptional exposures of the Limestone Coal Formation at Spireslack SCM provides an excellent opportunity to examine the role of lithology and pre-existing structures on fault evolution, internal structure, and connectivity. Careful mapping to unpick cross-cutting relationships has revealed a five-stage, complex geological evolution for the Spireslack SCM succession consisting of two phases of faulting and eight phases of joint development.
-
Stage 1. Pre-existing weaknesses developed in the fluvial deltaic sequences at Spireslack SCM as cleats and joints formed during burial of the fluvial–deltaic host rocks and formation of the regional Muirkirk Syncline (Stage 1b).
-
Stage 2. Sinistral transpression caused the formation of Phase 1 faults, with self-juxtaposing faults laterally restricted by NE-trending cleats and Phase 1 and 3 joints. The same transpression preferentially reactivates Phase 2 joints to form faulted joints. Larger faults, which cut multiple lithologies, developed a complex mineralised fault core with multiple slip events.
-
Stage 3. Dextral transpression caused the formation of NW-trending Phase 2 faults with self-juxtaposing faults restricted by pre-existing joints or cleats, and larger faults restricted by Phase 1 faults. Phase 2 faults led to the reactivation of Phase 3 joints and reactivated Phase 1 faulted joints. Where Phase 1 and Phase 2 faults interact, complex zones of deformation develop.
-
Stage 4. Paleogene dykes cut across the site, preferentially exploiting Phase 2 faults, and display post intrusion extensional reactivation (Stage 5).
While the overall fracture density increases around the larger faults, counter-intuitively the modern-day network connectivity decreases in these areas due to the cementation of faults and joints.
We find that the fault zone internal structure at Spireslack SCM depends on (a) whether the fault is self-juxtaposing or cuts multiple lithologies; (b) the presence and ductility of shale layers, which in turns leads to bed rotation and fault-core lens formation; and (c) the orientation of open and mineralised joints or coal cleats at the time of faulting. Self-juxtaposing faults are strongly affected by the orientation and mineralisation of pre-existing joint sets and coal cleats, causing them to grow as multiple segmented fault strands within competent lithologies. Self-juxtaposing faults only become well connected where fault intensity is high. Faults that cut multiple lithologies are strongly affected by the presence of shale interbeds and display a complex and heterogenous fault structure with fault length limited by the presence of pre-existing faults. Therefore, it is crucial to appreciate the relative timing of deformation events, concurrent or subsequent cementation, and the degree of lithological juxtaposition when considering the mechanical and hydraulic properties of a mechanically stratified succession.
The data and metadata associated with this publication are available from the University of Strathclyde KnowledgeBase at https://doi.org/10.15129/4556163e-e417-4bd4-94d2-fc96ba9eb725, (last access: 11 November 2020, Andrews, 2020).
The supplement related to this article is available online at: https://doi.org/10.5194/se-11-2119-2020-supplement.
Initial discussions and planning of the paper were undertaken by all authors. BJA, ZKS, and RL were involved with conceptualization. BJA and LMcK undertook the collection of field data, with BJA undertaking lineament mapping and data analysis. The paper was prepared by BJA, with contributions from all authors. Funding and supervision of the project was provided by ZKS and RL.
The authors declare that they have no conflict of interest.
This article is part of the special issue “Faults, fractures, and fluid flow in the shallow crust”. It is not associated with a conference.
This work was funded through BJA's PhD studentship, supported by the Environmental and Physical Sciences Research Council (EPSRC, award no. EP/L016680/1). LMcK is supported by a University of Strathclyde Environmental and Physical Science Research Council (EPSRC) Doctoral Training Partnership (DTP) award (reference no. 1904102). We would like to thank Dave Healy for the use of the high-resolution photomontage of the McDonald Limestone dip slope and the British Geological Society for the use of the photomontage of the high wall. The authors would like to thank Bailey Lathrop and David Sanderson for their detailed reviews that helped greatly improve the quality and clarity of the manuscript.
This research has been supported by the Environmental and Physical Sciences Research Council (EPSRC) (grant no. EP/L016680/1) and the University of Strathclyde Environmental and Physical Science Research Council (EPSRC) Doctoral Training Partnership (DTP) (grant no. 1904102).
This paper was edited by Fabrizio Balsamo and reviewed by David Sanderson and Bailey Lathrop.
Anderson, E. M.: The dynamics of faulting and dyke formation with applications to Britain, Oliver and Boyd, Edinburgh, Pp. xii + 191, 1951.
Andrews, B. J., Roberts, J. J., Shipton, Z. K., Bigi, S., Tartarello, M. C., and Johnson, G.: How do we see fractures? Quantifying subjective bias in fracture data collection, Solid Earth, 10, 487–516, https://doi.org/10.5194/se-10-487-2019, 2019.
Andrews, B. J.: Supplementary information for “The growth of faults and fracture networks in a mechanically evolving, mechanically stratified rock mass: A case study from Spireslack Surface Coal Mine, Scotland”, https://doi.org/10.15129/4556163e-e417-4bd4-94d2-fc96ba9eb725, last access: 11 November 2020.
Baghbanan, A. and Jing, L.: Stress effects on permeability in a fractured rock mass with correlated fracture length and aperture, Int. J. Rock Mech. Min. Sci., 45, 1320–1334, https://doi.org/10.1016/j.ijrmms.2008.01.015, 2008.
Baptie, B.: Seismogenesis and state of stress in the UK, Tectonophysics, 482, 150–159, https://doi.org/10.1016/j.tecto.2009.10.006, 2010.
Billi, A., Salvini, F., and Storti, F.: The damage zone-fault core transition in carbonate rocks: implications for fault growth, structure and permeability, Journal of Structural Geology, 25, 1779–1794, 2003.
Bluck, B. J.: Pre-Carboniferous history of the Midland Valley of Scotland, Trans. R. Soc. Edinb. Earth Sci., 75, 275–295, https://doi.org/10.1017/S0263593300013900, 1984.
Bons, P. D., Elburgm, M., and Gomez-Rivas, E.: A review of the formation of tectonic veins and their microstructures, J. Struct. Geol., 43, 33–62, https://doi.org/10.1016/j.jsg.2012.07.005, 2012.
Browne, M. A. E. and Monro, S. K.: Evolution of the coal basins of Central Scotland, in Congreìs International de Stratigraphie et de Geìologie du Carbonifeìre, Nanjing University Press, Nanjing, Beijing, 1–19, 1987.
Browne, M. A. E., Dean, M. T., Hall, I. H. S., McAdam, A. D., Monro, S. K., and Chisholm, J. I.: A lithostratigraphical framework for the Carboniferous rocks of the Midland Valley of Scotland, Keyworth, Nottingham: British Geological Survey, 30 pp., 1999.
Caldwell, W. G. E. and Young, G. M.: The Cumbrae Islands: A structural Rosetta Stone in the western offshore Midland Valley of Scotland, Scottish J. Geol., 49, 117–132, https://doi.org/10.1144/sjg2011-462, 2013.
Caputo, R.: Evolution of orthogonal sets of coeval extension joints, Terra Nov., 7, 479–490, https://doi.org/10.1111/j.1365-3121.1995.tb00549.x, 1995.
Caputo, R. and Hancock, P. L.: Crack-jump mechanism and its implications for stress cyclicity during extension fracturing, J. Geodyn., 27, 45–60, https://doi.org/10.1016/S0264-3707(97)00029-X, 1998.
Chang, C. and Haimson, B.: True triaxial strength and deformability of the German Continental Deep Drilling Program (KTB) deep hole amphibolite, J. Geophys. Res.-Sol. Ea., 105, 18999–19013, https://doi.org/10.1029/2000jb900184, 2000.
Childs, C., Nicol, A., Walsh, J. J., and Watterson, J.: Growth of vertically segmented normal faults, J. Struct. Geol., 18, 1389–1397, https://doi.org/10.1016/S0191-8141(96)00060-0, 1996.
Childs, C., Manzocchi, T., Walsh, J. J., Bonson, C. G., Nicol, A., and Schöpfer, M. P. J.: A geometric model of fault zone and fault rock thickness variations, J. Struct. Geol., 31, 117–127, https://doi.org/10.1016/j.jsg.2008.08.009, 2009.
Coward, M. P.: The effect of Late Caledonian and Variscan continental escape tectonics on basement structure, Paleozoic basin kinematics and subsequent Mesozoic basin development in NW Europe, in: Petroleum Geology Conference Proceedings, Geol. Soc. Lond., 4, 1095–1108, https://doi.org/10.1144/0041095, 1993.
Crider, J. G. and Peacock, D. C. P.: Initiation of brittle faults in the upper crust: A review of field observations, J. Struct. Geol., 26, 691–707, https://doi.org/10.1016/j.jsg.2003.07.007, 2004.
Cruikshank, K. M., Zhao, G., and Johnson, A. M.: Analysis of minor fractures associated with joints and faulted joints, J. Struct. Geol., 13, 865–886, https://doi.org/10.1016/0191-8141(91)90083-U, 1991.
Davis, A.: Carboniferous rocks of the Muirkirk, Gass Water and Glenmuir areas of Ayrshire, Bull. Geol. Surv. GB, 40, 1–49, 1972.
De Rosa, S., Shipton, Z., Lunn, R., Kremer, Y., and Murry, T.: Along-strike fault core thickness variations of a fault in poorly lithified sediments, Miri (Malaysia), J. Struct. Geol., 116, 189–206, https://doi.org/10.1016/j.jsg.2018.08.012, 2018.
Dean, M. T., Browne, M. A. E., Waters, C. N., and Powell, J. H.: A lithostratigraphical framework for the Carboniferous successions of northern Great Britain (onshore), Br. Geol. Surv. Res. Rep., RR/10/07, 174, 2011.
Dershowitz, W. S. and Einstein, H.: Characterizing Rock Joint Geometry with Joint System Models, Rock Mech. Rock Eng., 21, 21–51, https://doi.org/10.1007/BF01019674, 1988.
Dochartaigh, B. É. Ó., Macdonald, A. M., Fitzsimons, V., and Ward, R.: Scotland's aquifers and groundwater bodies, Br. Geol. Surv. Res. Rep., OR/15/028, 63, available at: https://www2.bgs.ac.uk/gsni/ (last access: 11 October 2019), 2015.
Donath, F. A.: Experimental study of shear failure in anisotropic rocks, Geol. Soc. Am. Bull., 72, 985–990, https://doi.org/10.1130/0016-7606(1961)72[985:ESOSFI]2.0.CO;2, 1961.
Donnelly, L. J.: A review of coal mining induced fault reactivation in Great Britain, Q. J. Eng. Geol. Hydrogeol., 39, 5–50, https://doi.org/10.1144/1470-9236/05-015, 2006.
Dunham, K. C.: Geology of the Northern Pennine Orefield Volume 1 Tyne to Stainmore, HMSO, London, UK, 1948.
Ellen, R., Callaghan, E., Leslie, A. G., and Browne, M. A. E.: The rocks of Spireslack surface coal mine and its subsurface data: an introduction, Br. Geol. Surv. Res. Rep., OR/16/053, 38, 2016.
Ellen, R., Browne, M. A., Mitten, A., Clarke, S. M., Leslie, A. G., and Callaghan, E.: Sedimentology, architecture and depositional setting of the fluvial Spireslack Sandstone of the Midland Valley, Scotland: insights from the Spireslack surface coal mine, Geol. Soc. London, Spec. Publ., 488, SP488-2, https://doi.org/10.1144/SP488.2, 2019.
Emeleus, C. H. and Gyopari, M. C.: British Tertiary Igneous Province, Chapman and Hall, London, UK, xii + 259 pp, 1992.
Ferrill, D. A. and Morris, A. P.: Dilational normal faults, J. Struct. Geol., 25, 183–196, https://doi.org/10.1016/S0191-8141(02)00196-7, 2003.
Ferrill, D. A. and Morris, A. P.: Fault zone deformation controlled by carbonate mechanical stratigraphy, Balcones fault system, Texas, Am. Assoc. Pet. Geol. Bull., 92, 359–380, https://doi.org/10.1306/10290707066, 2008.
Ferrill, D. A., McGinnis, R. N., Morris, A. P., and Smart, K. J.: Hybrid failure: Field evidence and influence on fault refraction, J. Struct. Geol., 42, 140–150, https://doi.org/10.1016/j.jsg.2012.05.012, 2012.
Ferrill, D. A., Morris, A. P., McGinnis, R. N., Smart, K. J., Wigginton, S. S., and Hill, N. J.: Mechanical stratigraphy and normal faulting, J. Struct. Geol., 94, 275–302, https://doi.org/10.1016/j.jsg.2016.11.010, 2017.
Francis, E. H.: Carboniferous: in CRAIG, in The Geology of Scotland, Scottish Academic Press, Edinburgh, 253–296, 1991.
George, T. N.: Eustasy and tectonics: Sedimentary rhythms and stratigraphical units in British Dinantian correlation, in: Proceedings of the Yorkshire Geological Society, 42, 229–262, https://doi.org/10.1144/pygs.42.2.229, 1978.
Gibson, R. G. and Bentham, P. A.: Use of fault-seal analysis in understanding petroleum migration in a complexly faulted anticlinal trap, Columbus Basin, offshore Trinidad, Am. Assoc. Pet. Geol. Bull., 87, 465–478, https://doi.org/10.1306/08010201132, 2003.
Haimson, B. and Chang, C.: A new true triaxial cell for testing mechanical properties of rock, and its use to determine rock strength and deformability of Westerly granite, in: International Journal of Rock Mechanics and Mining Sciences, 37, 285–296, https://doi.org/10.1016/S1365-1609(99)00106-9, 2000.
Haszeldine, R. S.: Carboniferous North Atlantic palaeogeography: Stratigraphic evidence for rifting, not megashear or subduction, Geol. Mag., 121, 443–463, https://doi.org/10.1017/S0016756800029988, 1984.
Healy, D., Jones, R. R., and Holdsworth, R. E.: Three-dimensional brittle shear fracturing by tensile crack interaction, Nature, 439, 64–67, https://doi.org/10.1038/nature04346, 2006.
Heidbach, O., Tingay, M., Barth, A., Reinecher, J., Kurfeß, D., and Müller, B.: The world stress map database release, WSM, Rel2008(9), https://doi.org/10.1594/GFZ, 2008.
Holland, M. and Urai, J. L.: Evolution of anastomosing crack–seal vein networks in limestones: Insight from an exhumed high-pressure cell, Jabal Shams, Oman Mountains, J. Struct. Geol., 32, 1279–1290, https://doi.org/10.1016/j.jsg.2009.04.011, 2010.
Jones, R. and Tanner, P. W. G.: Strain partitioning in transpression zones, J. Struct. Geol., 17, 793–802, https://doi.org/10.1016/0191-8141(94)00102-6, 1995.
Kattenhorn, S. A., Aydin, A., and Pollard, D. D.: Joints at high angles to normal fault strike: An explanation using 3-D numerical models of fault-perturbed stress fields, J. Struct. Geol., 22, 1–23, https://doi.org/10.1016/S0191-8141(99)00130-3, 2000.
Knai, T. A. and Knipe, R. J.: The impact of faults on fluid flow in the Heidrun Field, Geol. Soc. Spec. Publ., 147, 269–282, https://doi.org/10.1144/GSL.SP.1998.147.01.18, 1998.
Lăpădat, A., Imber, J., Yielding, G., Iacopini, D., McCaffrey, K. J. W., Long, J. J., and Jones, R. R.: Occurrence and development of folding related to normal faulting within a mechanically heterogeneous sedimentary sequence: A case study from Inner Moray Firth, UK, Geol. Soc. Special Publ., 439, 373–394, https://doi.org/10.1144/SP439.18, 2017.
Laubach, S. E., Marrett, R. A., Olson, I. E., and Scott, A. R.: Characteristics and origins of coal cleat: a review, Int. J. Coal Geol., 35, 175–207, https://doi.org/10.1016/S0166-5162(97)00012-8, 1998.
Laubach, S. E., Olson, J. E., and Cross, M. R.: Mechanical and fracture stratigraphy, Am. Assoc. Pet. Geol. Bull., 93, 1413–1426, https://doi.org/10.1306/07270909094, 2009.
Leeder, M. R.: Upper Palaeozoic basins of the British Isles-Caledonide inheritance versus Hercynian plate margin processes, J. Geol. Soc. Lond. 139, 479–491, https://doi.org/10.1144/gsjgs.139.4.0479, 1982.
Leeder, M. R.: Recent developments in Carboniferous geology: a critical review with implications for the British Isles and N.W. Europe, Proc. Geol. Assoc., 99, 79–100, https://doi.org/10.1016/S0016-7878(88)80001-4, 1988.
Leslie, A. G., Browne, M. A. E., Cain, T., and Ellen, R.: From threat to future asset – The legacy of opencast surface-mined coal in Scotland, Int. J. Coal Geol., 164, 123–133, https://doi.org/10.1016/j.coal.2016.06.017, 2016.
Li, Y. W., Zhang, J., and Liu, Y.: Effects of loading direction on failure load test results for Brazilian tests on coal rock, Rock Mech. Rock Eng., 49, 2173–2180, https://doi.org/10.1007/s00603-015-0841-8, 2016.
Long, J. J. and Imber, J.: Geological controls on fault relay zone scaling, J. Struct. Geol., 33, 1790–1800, https://doi.org/10.1016/j.jsg.2011.09.011, 2011.
Lunn, R. J., Willson, J. P., Shipton, Z. K., and Moir, H.: Simulating brittle fault growth from linkage of preexisting structures, J. Geophys. Res.-Sol. Ea., 113, B07403, https://doi.org/10.1029/2007JB005388, 2008.
Manzocchi, T.: The connectivity of two-dimensional networks of spatially correlated fractures, Water Resour. Res., 38, 1-1-1–20, https://doi.org/10.1029/2000WR000180, 2002.
McKay, L., Shipton, Z. K., Lunn, R. J., Andrews, B. J., Raub, T., and Boyce, A. J.: Detailed Internal Structure and Along-Strike Variability of the Core of a Plate Boundary Fault: The Highland Boundary Fault, Scotland, J. Geol. Soc. Lond., 177, 238–296, https://doi.org/10.1144/jgs2018-226, 2019.
Microsoft: “Glenbuck, Aryshire” [1:2,000] (Map). Bing Maps., Aer. Photogr., available at: https://www.bing.com/maps/, 2017.
Moir, H.: Modelling fault zone evolution?: the effect of heterogeneity, University of Strathclyde, 185 pp., 2010.
Moir, H., Lunn, R. J., Shipton, Z. K., and Kirkpatrick, J. D.: Simulating brittle fault evolution from networks of pre-existing joints within crystalline rock, J. Struct. Geol., 32, 1742–1753, https://doi.org/10.1016/j.jsg.2009.08.016, 2010.
Monaghan, A.: The Carboniferous shales of the Midland Valley of Scotland?: geology and resource estimation, British Geological Survey for Department of Energy and Climate Change, London, UK, 105 pp., 2014.
Mykura, W.: White trap in some Ayrshire Coals, Scottish J. Geol., 1, 176–184, https://doi.org/10.1144/sjg01020176, 1965.
Nasseri, M. H. B., Tatone, B. S. A., Grasselli, G., and Young, R. P.: Fracture toughness and fracture roughness interrelationship in thermally treated westerly granite, Pure Appl. Geophys., 166, 801–822, https://doi.org/10.1007/s00024-009-0476-3, 2009.
Nicol, A., Watterson, J., Walsh, J. J., and Childs, C.: The shapes, major axis orientations and displacement patterns of fault surfaces, J. Struct. Geol., 18, 235–248, https://doi.org/10.1016/S0191-8141(96)80047-2, 1996.
Nixon, C. W., Sanderson, D. J., Dee, S. J., Bull, J. M., Humphreys, R. J., Swanson, M. H.: Fault interactions and reactivation within a normal-fault network at Milne Point, Alaska, AAPG Bull., 98, 2081–2107, https://doi.org/10.1306/04301413177, 2014.
Nyberg, B., Nixon, C. W., and Sanderson, D. J.: NetworkGT: A GIS tool for geometric and topological analysis of two-dimensional fracture networks, Geosphere, 14, 1618–1634, https://doi.org/10.1130/GES01595.1, 2018.
Nygård, R., Gutierrez, M., Bratli, R. K., and Høeg, K.: Brittle-ductile transition, shear failure and leakage in shales and mudrocks, Mar. Pet. Geol., 23, 201–212, https://doi.org/10.1016/j.marpetgeo.2005.10.001, 2006.
O'Keefe, J. M. K., Bechtel, A., Christanis, K., Dai, S., DiMichele, W. A., Eble, C. F., Esterle, J. S., Mastalerz, M., Raymond, A. L., Valentim, B. V., Wagner, N. J., Ward, C. R., and Hower, J. C.: On the fundamental difference between coal rank and coal type, Int. J. Coal Geol., 118, 58–87, https://doi.org/10.1016/j.coal.2013.08.007, 2013.
Oliver, N. H. S. and Bons, P. D.: Mechanisms of fluid flow and fluid–rock interaction in fossil metamorphic hydrothermal systems inferred from vein-wallrock patterns, geometry and microstructure, Geofluids, 1, 137–162, https://doi.org/10.1046/j.1468-8123.2001.00013.x, 2001.
Peacock, D. C. P.: The temporal relationship between joints and faults, J. Struct. Geol., 23, 329–341, https://doi.org/10.1016/S0191-8141(00)00099-7, 2001.
Peacock, D. C. P. and Sanderson, D. J.: Structural analyses and fracture network characterisation: Seven pillars of wisdom, Earth-Science Rev., 184, 13–28, https://doi.org/10.1016/j.earscirev.2018.06.006, 2018.
Peacock, D. C. P., Rotevatn, A., and Sanderson, D. J.: Brecciation driven by changes in fluid column heights, Terra Nov., 31, 76–81, https://doi.org/10.1111/ter.12371, 2019.
Pei, Y., Paton, D. A., Knipe, R. J., and Wu, K.: A review of fault sealing behaviour and its evaluation in siliciclastic rocks, Earth-Sci. Rev., 150, 121–138, https://doi.org/10.1016/j.earscirev.2015.07.011, 2015.
Priest, S. D. and Hudson, J. A.: Estimation of discontinuity spacing and trace length using scanline surveys, Int. J. Rock Mech. Min. Sci., 18, 183–197, https://doi.org/10.1016/0148-9062(81)90973-6, 1981.
Ramsay, J. G.: The crack-seal mechanism of rock deformation, Nature, 284, 135–139, 1980.
Ranalli, G. and Yin, Z. M.: Critical stress difference and orientation of faults in rocks with strength anisotropies: the two-dimensional case, J. Struct. Geol., 12, 1067–1071, https://doi.org/10.1016/0191-8141(90)90102-5, 1990.
Read, W. A., Browne, M. A., Stephenson, D., and Upton, B. J.: Carboniferous, in: The Geology of Scotland, edited by: Trewin, N. H., Geol. Soc. Lond., London, UK, 251–300, 2002.
Reed, B. W., Kumar, M., Minich, R. W., and Rudd, R. E.: Fracture roughness scaling and its correlation with grain boundary network structure, Acta Mater., 56, 3278–3289, https://doi.org/10.1016/j.actamat.2008.03.019, 2008.
Rippon, J., Read, W. A., and Park, R. G.: The Ochil Fault and the Kincardine basin: Key structures in the tectonic evolution of the Midland Valley of Scotland, J. Geol. Soc. Lond., 153, 573–587, https://doi.org/10.1144/gsjgs.153.4.0573, 1996.
Rippon, J. H., Ellison, R. A., and Gayer, R. A.: A review of joints (cleats) in British Carboniferous coals?: indicators of palaeostress orientation, Proc. Yorksh. Geol. Soc., 56, 15–30, https://doi.org/10.1144/pygs.56.1.15, 2006.
Ritchie, J. D., Johnson, H., Browne, M. A. E., and Monaghan, A. A.: Late Devonian-Carboniferous tectonic evolution within the Firth of Forth, Midland Valley: As revealed from 2D seismic reflection data, Scottish J. Geol., 39, 121–134, https://doi.org/10.1144/sjg39020121, 2003.
Roche, V., Homberg, C., and Rocher, M.: Fault nucleation, restriction, and aspect ratio in layered sections: Quantification of the strength and stiffness roles using numerical modeling, J. Geophys. Res.-Sol. Ea., 118, 4446–4460, https://doi.org/10.1002/jgrb.50279, 2013.
Rohrbaugh, J. B., Dunne, W. M., and Mauldon, M.: Estimating fracture trace intensity, density, and mean length using circular scan lines and windows, Am. Assoc. Pet. Geol. Bull., 86, 2089–2104, https://doi.org/10.1306/61EEDE0E-173E-11D7-8645000102C1865D, 2002.
Sanderson, D. J. and Nixon, C. W.: The use of topology in fracture network characterization, J. Struct. Geol., 72, 55–66, https://doi.org/10.1016/j.jsg.2015.01.005, 2015.
Sanderson, D. J. and Nixon, C. W.: Topology, connectivity and percolation in fracture networks, J. Struct. Geol., 115, 167–177, https://doi.org/10.1016/j.jsg.2018.07.011, 2018.
Scheiber, T., Fredin, O., Viola, G., Jarna, A., Gasser, D., and Łapińska-viola, R.: Manual extraction of bedrock lineaments from high-resolution LiDAR data?: methodological bias and human perception, GFF, 137, https://doi.org/10.1080/11035897.2015.1085434, 2015.
Schmatz, J., Vrolijk, P. J., and Urai, J. L.: Clay smear in normal fault zones – The effect of multilayers and clay cementation in water-saturated model experiments, J. Struct. Geol., 32, 1834–1849, https://doi.org/10.1016/j.jsg.2009.12.006, 2010.
Schöpfer, M. P. J., Childs, C., and Walsh, J. J.: Localisation of normal faults in multilayer sequences, J. Struct. Geol., 28, 816–833, https://doi.org/10.1016/j.jsg.2006.02.003, 2006.
Schöpfer, M. P. J., Childs, C. and Walsh, J. J.: Two-dimensional distinct element modeling of the structure and growth of normal faults in multilayer sequences: 2. Impact of confining pressure and strength contrast on fault zone geometry and growth, J. Geophys. Res. Solid Earth, 112(10), https://doi.org/10.1029/2006JB004903, 2007.
Schöpfer, M. P. J., Childs, C., Walsh, J. J. and Manzocchi, T.: Evolution of the internal structure of fault zones in three-dimensional numerical models of normal faults, Tectonophysics, 666, 158–163, https://doi.org/10.1016/j.tecto.2015.11.003, 2016.
Shang, J., Hencher, S. R., and West, L. J.: Tensile Strength of Geological Discontinuities Including Incipient Bedding, Rock Joints and Mineral Veins, Rock Mech. Rock Eng., 49, 4213–4225, https://doi.org/10.1007/s00603-016-1041-x, 2016.
Sibson, R. H.: Conditions for fault-valve behaviour, edited by: Knipe, R. J. and Rutter, E., Geol. Soc. Lond. Spec. Publ., 54, 15–28, https://doi.org/10.1144/GSL.SP.1990.054.01.02, 1990.
Sibson, R. H.: Implications of fault-valve behaviour for rupture nucleation and recurrence, Tectonophysics, 211, 283–293, https://doi.org/10.1016/0040-1951(92)90065-E, 1992.
Sibson, R. H.: Structural permeability of fluid-driven fault-fracture meshes, J. Struct. Geol., 18, 1031–1042, https://doi.org/10.1016/0191-8141(96)00032-6, 1996.
Skurtveit, E., Torabi, A., Alikarami, R., and Braathen, A.: Fault baffle to conduit developments: reactivation and calcite cementation of deformation band fault in aeolian sandstone, Pet. Geosci., 21, 3–16, https://doi.org/10.1144/petgeo2014-031, 2015.
Soden, A. M. and Shipton, Z. K.: Dilational fault zone architecture in a welded ignimbrite: The importance of mechanical stratigraphy, J. Struct. Geol., 51, 156–166, https://doi.org/10.1016/j.jsg.2013.02.001, 2013.
Soliva, R. and Benedicto, A.: Geometry, scaling relations and spacing of vertically restricted normal faults, J. Struct. Geol., 27, 317–325, https://doi.org/10.1016/j.jsg.2004.08.010, 2005.
Soper, N. J., Strachan, R. A., Holdsworth, R. E., Gayer, R. A., and Greiling, R. O.: Sinistral transpression and the Silurian closure of Iapetus, J. Geol. Soc. Lond., 149, 871–880, https://doi.org/10.1144/gsjgs.149.6.0871, 1992.
Thomas, L.: Coal Geology, Second, Wiley-Blackwell, Chichester, 456 pp., 2013.
Tsang, Y. W. and Witherspoon, P. A.: The dependence of fracture mechanical and fluid flow properties on fracture roughness and sample size, J. Geophys. Res., 88, 2359, https://doi.org/10.1029/JB088iB03p02359, 1983.
Turichshev, A. and Hadjigeorgiou, J.: Triaxial compression experiments on intact veined andesite, Int. J. Rock Mech. Min. Sci., 86, 179–193, https://doi.org/10.1016/j.ijrmms.2016.04.012, 2016.
Turichshev, A. and Hadjigeorgiou, J.: Quantifying the effects of vein mineralogy, thickness, and orientation on the strength of intact veined rock, Eng. Geol., 226, 199–208, https://doi.org/10.1016/j.enggeo.2017.06.009, 2017.
Underhill, J. R., Monaghan, A. A., and Browne, M. A. E.: Controls on structural styles, basin development and petroleum prospectivity in the Midland Valley of Scotland, Mar. Pet. Geol., 25, 1000–1022, https://doi.org/10.1016/j.marpetgeo.2007.12.002, 2008.
van der Zee, W. and Urai, J. L.: Processes of normal fault evolution in a siliciclastic sequence: A case study from Miri, Sarawak, Malaysia, J. Struct. Geol., 27, 2281–2300, https://doi.org/10.1016/j.jsg.2005.07.006, 2005.
Virgo, S., Abe, S., and Urai, J. L.: Extension fracture propagation in rocks with veins: Insight into the crack-seal process using Discrete Element Method modeling, J. Geophys. Res.-Sol. Ea., 118, 5236–5251, https://doi.org/10.1002/2013JB010540, 2013.
Virgo, S., Abe, S., and Urai, J. L.: The evolution of crack seal vein and fracture networks in an evolving stress field: Insights from Discrete Element Models of fracture sealing, J. Geophys. Res. Sol.-Ea., 119, 8709–8727, https://doi.org/10.1002/2014JB011520, 2014.
Vitale, S., Dati, F., Mazzoli, S., Ciarcia, S., Guerriero, V., and Lannace, A.: Modes and timing of fracture network development in poly-deformed carbonate reservoir analogues, Mt. Chianello, southern Italy, J. Struct. Geol., 37, 223–235, https://doi.org/10.1016/j.jsg.2012.01.005, 2012.
Walsh, J. J., Nicol, A., and Childs, C.: An alternative model for the growth of faults, J. Struct. Geol., 24, 1669–1675, https://doi.org/10.1016/S0191-8141(01)00165-1, 2002.
Wilkins, S. J. and Gross, M. R.: Normal fault growth in layered rocks at Split Mountain, Utah: Influence of mechanical stratigraphy on dip linkage, fault restriction and fault scaling, J. Struct. Geol., 24, 1413–1429, https://doi.org/10.1016/S0191-8141(01)00154-7, 2002.
Wilkins, S. J., Gross, M. R., Wacker, M., Eyal, Y., and Engelder, T.: Faulted joints: Kinematics, displacement-length scaling relations and criteria for their identification, J. Struct. Geol., 23, 315–327, https://doi.org/10.1016/S0191-8141(00)00098-5, 2001.
Woodcock, N. H. and Mort, K.: Classification of fault breccias and related fault rocks, Geol. Mag., 145, 435–440, https://doi.org/10.1017/S0016756808004883, 2008.
Yielding, G., Lykakis, N., and Underhill, J. R.: The role of stratigraphic juxtaposition for seal integrity in proven CO2 fault-bound traps of the Southern North Sea, Pet. Geosci., 17, 193–203, https://doi.org/10.1144/1354-0793/10-026, 2011.
Yuan, Y. S., Jin, Z. J., Zhou, Y., Liu, J. X., Li, S. J., and Liu, Q. Y.: Burial depth interval of the shale brittle–ductile transition zone and its implications in shale gas exploration and production, Pet. Sci., 14, 637–647, https://doi.org/10.1007/s12182-017-0189-7, 2017.
Zhao, G. and Johnson, A. M.: Sequence of deformations recorded in joints and faults, Arches National Park, Utah, J. Struct. Geol., 14, 225–236, https://doi.org/10.1016/0191-8141(92)90059-6, 1992.