the Creative Commons Attribution 4.0 License.
the Creative Commons Attribution 4.0 License.
 | 04 Mar 2020
Tectonic inheritance controls nappe detachment, transport and stacking in the Helvetic nappe system, Switzerland: insights from thermomechanical simulations
Dániel Kiss
Thibault Duretz
Stefan Markus Schmalholz
Tectonic nappes have been investigated for more than a hundred years. Although geological studies often refer to a “nappe theory”, the physical mechanisms of nappe formation are still disputed. We apply two-dimensional numerical simulations of shortening of a passive margin to investigate the thermomechanical processes of detachment (or shearing off), transport and stacking of nappes. We use a visco-elasto-plastic model with standard creep flow laws, Drucker–Prager and von Mises yield criteria. We consider tectonic inheritance with two initial mechanical heterogeneities: (1) lateral heterogeneity of the basement–cover interface due to half-grabens and horsts and (2) vertical heterogeneities due to layering of mechanically strong and weak sedimentary units. The model shows detachment and horizontal transport of a thrust nappe that gets stacked on a fold nappe. The detachment of the thrust sheet is triggered by stress concentrations around the sediment–basement contact and the resulting brittle–plastic shear band that shears off the sedimentary units from the sediment–basement contact. Horizontal transport is facilitated by a basal shear zone just above the basement–cover contact, composed of thin, weak sediments that act as a décollement. Fold nappe formation occurs by a dominantly ductile closure of a half-graben and the associated extrusion of the half-graben fill. We apply our model to the Helvetic nappe system in western Switzerland, which is characterized by stacking of the Wildhorn thrust nappe above the Morcles fold nappe. The modeled structures, the deformation rates and the temperature field agree with data from the Helvetic nappe system. Mechanical heterogeneities must locally generate effective viscosity (i.e., ratio of stress to viscoplastic strain rate) contrast of about 3 orders of magnitude to model nappe structures similar to the ones of the Helvetic nappe system. Our results indicate that the structural evolution of the Helvetic nappe system was controlled by tectonic inheritance and that material softening mechanisms are not essential to reproduce the first-order nappe structures.
- Article
(11074 KB) - Full-text XML
-
Supplement
(10595 KB) - BibTeX
- EndNote


Tectonic nappes were discovered more than a hundred years ago and are considered typical tectonic features of orogenic belts (e.g., Price and McClay, 1981), particularly in the Alps (e.g., Lugeon, 1902; Termier, 1906; Argand, 1916; Tollmann, 1973; Trümpy, 1980; Escher et al., 1993; Pfiffner, 2014). Several definitions of a nappe have been proposed (see discussion in Price and McClay, 1981), for example, after Termier (1922): “A nappe is a rock packet not in its place, resting on a substratum that is not its original one”. Two end-member types of nappes are commonly distinguished, namely fold nappes and thrust nappes, or thrust sheets (e.g., Termier, 1906; Price and McClay, 1981; Epard and Escher, 1996). Fold nappes are recumbent folds exhibiting large-scale stratigraphic inversion, typically with amplitudes that exceed several kilometers. In contrast, thrust sheets are allochthonous sheets with a prominent shear zone or thrust at their base but without a prominent overturned limb. The importance of tectonic nappes for orogeny, especially for collisional orogens, is nowadays well established; however, the physical mechanisms of nappe detachment (or shearing off), transport and stacking are still disputed.
We focus here on the Helvetic nappe system in western Switzerland (see next section for a geological overview), which is one of the birthplaces of the concept of tectonic nappes. In 1841, Arnold Escher mentioned a nappe (he used “Decke” in German) and a colossal overthrust (“colossale Überschiebung”) during the presentation of a geological map of the canton of Glarus, eastern Switzerland (Escher von der Linth, 1841). Escher did not dare to publish his interpretation but explained it in the field to Roderick Murchinson, who published the overthrust interpretation in 1849 (Murchison, 1849), crediting Escher for the original observation. Bertrand (1884) argued also convincingly for an overthrust nappe (he used “masse de recouvrement” and “lambeaux de recouvrement” instead of nappe) in the Glarus region, so that finally also Heim (1906) accepted the overthrust interpretation instead of the earlier preferred double-fold interpretation (“Überschiebungsfalte” instead of “Doppelfalte”). Although the important controversies and observations supporting tectonic nappes are related to the Glarus region, which is part of the Helvetic nappe system, the true birth date of the nappe concept in the Alps, according to Trümpy (1991), is the publication by Schardt (1893) who worked in the Prealps, belonging to the Penninic domain (e.g., Escher et al., 1993). Schardt (1893) realized that Jurassic breccias have been thrust over Tertiary flysch and that large regions of the Prealps have been actually emplaced as a major overthrust. After decades of controversy, the existence of nappes was generally accepted approximately a century ago, revolutionizing tectonics, Alpine geology and orogeny in general (for historical reviews, see Bailey, 1935; Masson, 1976; Merle, 1998; Trümpy, 1991; Dal Piaz, 2001; Schaer, 2010).
Since then, a considerable effort has been made in mapping the present-day structure of the Helvetic nappe system (e.g., Steck, 1999; Pfiffner et al., 2011). Structural and paleogeographic reconstructions have provided valuable insight into the kinematics of nappe formation (e.g., Gillcrist et al., 1987; Epard and Escher, 1996; Herwegh and Pfiffner, 2005; Bellahsen et al., 2012; Boutoux et al., 2014). Therefore, the geometrical structure and kinematic evolution of the Helvetic nappe system is reasonably well understood. There are also theoretical and analogue modeling studies investigating the formation of fold-and-thrust belts and nappes (e.g., Bucher, 1956; Rubey and King Hubbert, 1959; Dietrich and Casey, 1989; Merle, 1989; Casey and Dietrich, 1997; Wissing and Pfiffner, 2003; Bauville et al., 2013; Poulet et al., 2014; Erdős et al., 2014; Jaquet et al., 2014; Ruh et al., 2014; Bauville and Schmalholz, 2017). However, the controlling physical processes of nappe detachment, transport and stacking, and the associated dominant rock deformation mechanism are still disputed. An overview of suggested driving forces and deformation mechanisms for nappe formation is given in Merle (1998, chap. 3). For example, for fold nappes, many interpretations favor distributed shearing and dominantly ductile deformation mechanisms, such as dislocation or grain-size-sensitive diffusion creep (e.g., Ramsay et al., 1983; Gillcrist et al., 1987; Ebert et al., 2008; Bauville et al., 2013). However, there are also interpretations arguing for localized thrusting and dominantly brittle–plastic deformation mechanisms, such as fracturing related to fluid pressure (e.g., Boyer and Elliott, 1982; Granado and Ruh, 2019). Furthermore, the presumed driving forces of nappe transport are either external surface forces, due to tectonic compression, or internal body forces, due to gravity. Heterogeneous shearing due to buttressing in a general compressional regime is an example of deformation driven by external forces (e.g., Ramsay et al., 1983; Epard, 1990; Bauville et al., 2013; Boutoux et al., 2014). Gravity gliding and spreading are an example of deformation driven by body forces (e.g., Durney, 1982; Merle, 1989; Merle and Guillier, 1989). For thrust sheets, the prominent low-angle thrust planes are likely controlled by mechanical heterogeneities, such as the orientation of the basement–cover interface and of mechanically weak shale-rich or evaporite layers, as has been suggested for the Helvetic nappe system (e.g., Pfiffner, 1993; Steck, 1999; Pfiffner et al., 2011; Bauville and Schmalholz, 2017). Several softening mechanisms have been proposed to localize deformation at the base of the thrust sheet, such as reduction of the effective stress due to pore fluid pressure causing a reduction of the effective friction angle (e.g., King Hubbert and Rubey, 1959; Rubey and King Hubbert, 1959) or a dominantly ductile deformation mechanism (e.g., Smoluchowski, 1909; Goguel, 1948; Voight, 1976), presumably in combination with thermally, chemically or mechanically activated softening mechanisms (e.g., Poirier, 1980; Ebert et al., 2008; Poulet et al., 2014).
To make another step towards understanding the physical process of nappe formation, we investigate the detachment, transport and stacking of nappes with two-dimensional (2-D) numerical simulations based on continuum mechanics. To keep the model relatively simple, we focus here on thermomechanical processes on the macro scale, larger than the typical size of mineral grains. Hence, we do not consider hydrochemical couplings, such as fluid release by carbonate decomposition (e.g., Poulet et al., 2014), and microscale processes, such as microstructural grain size evolution with secondary phases (e.g., Herwegh et al., 2011). The numerical algorithm is based on the finite-difference method. We consider a standard visco-elasto-plastic deformation behavior, heat transfer and thermomechanical coupling by shear heating and temperature-dependent viscosities. We also apply velocity boundary conditions that are standard for modeling accretionary or orogenic wedges (e.g., Buiter et al., 2006). For the comparison between model results and natural observations, we consider a geological section across the Helvetic nappe system in western Switzerland. This section is characterized by two deformed basement massifs, the Aiguilles Rouges and Mont Blanc massifs, a fold nappe, the Morcles nappe, and a thrust nappe, the Wildhorn super-nappe, that has been overthrust, or stacked, above the underlying fold nappe (Fig. 1). In our models, we consider the tectonic inheritance of the Mesozoic passive margin formation in the form of simple half-grabens and horsts, because the Helvetic nappe system resulted from the inversion of the pre-Alpine European passive margin (e.g., Trümpy, 1980). We consider two main orientations of inherited mechanical heterogeneities: (1) a lateral variation of mechanical strength due to the lateral alternation of basement and sediments associated with the half-graben structure and (2) a vertical variation of strength due to (i) the basement–cover interface, (ii) the alternation of strong carbonate with weak shale-rich units (so-called mechanical stratigraphy after Pfiffner, 1993) and (iii) the pressure and temperature sensitivity of rock strength and effective viscosity, respectively.
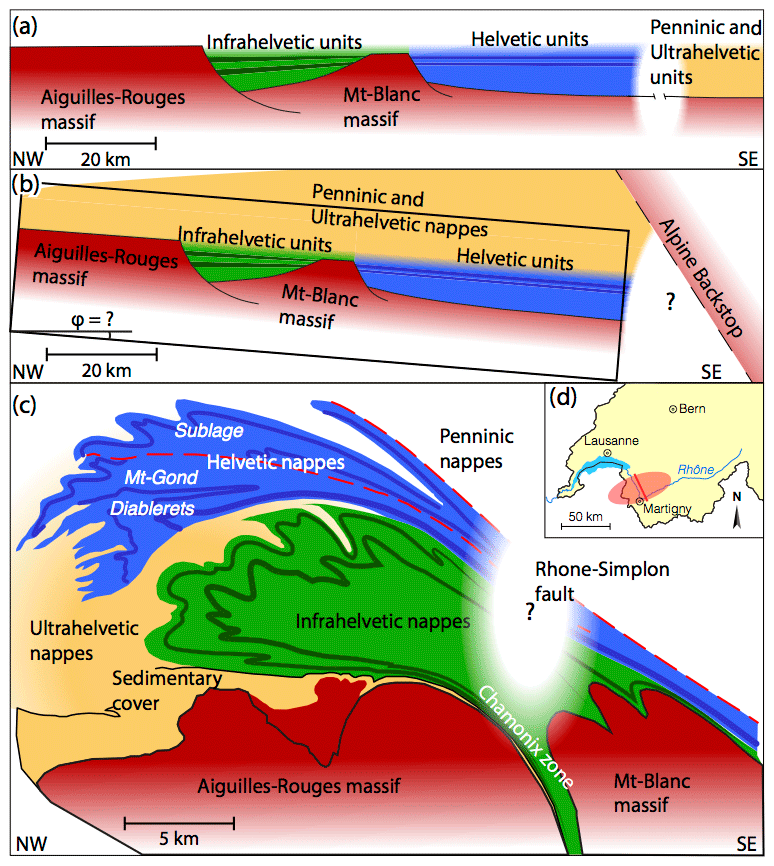
Figure 1(a) Simplified geological reconstruction of the Mesozoic, pre-Alpine European passive margin. (b) Simplified geological reconstruction of the Alpine orogenic wedge, after emplacement of the Penninic and Ultrahelvetic units and before the Helvetic nappe stacking. The black rectangle represents the model domain of the numerical simulations. (c) Simplified geological reconstruction of the present-day structure of the Helvetic nappe system. (d) The locations of the study area (red ellipse) and the cross section (red line) are indicated on the map of Switzerland.
The main aim of this study is to show that a thermomechanical model based on the theory of continuum mechanics (i) with a well-established visco-elasto-plastic rheology based on standard flow laws, (ii) with mechanical heterogeneities mimicking pre-Alpine extensional heritage and stratigraphic layering and (iii) with a wedge-type compressional configuration can self-consistently explain the first-order features of nappe detachment, transport and stacking in the Helvetic nappe system.
The Helvetic nappe system is commonly subdivided into Infrahelvetic, Helvetic and Ultrahelvetic units (Fig. 1c) (e.g., Masson et al., 1980; Escher et al., 1993; Pfiffner et al., 2011). The nappes consist mainly of Jurassic to Paleogene sediments that were deposited on the Mesozoic European passive margin before the Alpine orogeny (Fig. 1a). This passive margin inherited half-grabens and horsts from the Mesozoic, pre-Alpine extensional phase (e.g., Masson et al., 1980; Escher et al., 1993). The stratigraphy of the nappes is generally characterized by shale-rich units, totaling several kilometers in thickness, and two major units of massive platform carbonates, the so-called Quinten (Malm) and Urgonian (Lower Cretaceous) limestones, with a thickness of several hundred meters (e.g., Masson et al., 1980; Pfiffner, 1993; Pfiffner et al., 2011).
In the studied section, along the Rhône Valley near Martigny (Switzerland), the Infrahelvetic units form the Morcles fold nappe (e.g., Steck, 1999). This recumbent fold nappe is strongly deformed but is still connected to its original position of deposition, the Mesozoic half-graben between the Aiguilles Rouges and the Mont Blanc massifs (Fig. 1a). Therefore, the Morcles nappe is considered as a parautochthonous unit and its root zone is termed the Chamonix zone (Fig. 1c). The sediments forming the Helvetic nappes have been deposited on more distal regions of the European passive margin than the units forming the Morcles nappe. The original regions of deposition of the Infrahelvetic and the Helvetic units have been presumably separated by a horst or basement high (Fig. 1a). The Helvetic nappes have been thrust above the Infrahelvetic units. In the studied region, the Helvetic nappe is termed the Wildhorn super-nappe, because it can be subdivided into the Diablerets, Mont Gond and Sublage nappes (Fig. 1c; Escher et al., 1993). Due to the Rhône Valley being associated with the Rhône–Simplon fault, the Helvetic nappes cannot be continuously traced back to their original position of deposition (Fig. 1c). The Ultrahelvetic units have been deposited on more distal regions than the Helvetic units (Fig. 1a). Today, the Ultrahelvetic units are found in front of and between the Morcles and Wildhorn nappes (Fig. 1c).
During the Alpine continental collision, the Ultrahelvetic units and the Penninic nappes, originating from more distal positions, have been thrust above the original deposition regions of the sediments forming the Morcles and Wildhorn nappes today (Fig. 1b) (e.g., Epard and Escher, 1996). These sediments were subsequently sheared off from their original position of deposition and were transported several tens of kilometers towards the foreland, along a northwest transport direction (e.g., Epard and Escher, 1996; Ebert et al., 2007). The present-day nappe structure represents a thick-skinned tectonic style because the crystalline basement of the Aiguilles Rouges and Mont Blanc massifs exhibits significant deformation (Fig. 1c).
The above tectonic scenario is supported by peak metamorphic temperatures of the Helvetic nappe system, which range between 250 and 385 ∘C (Kirschner et al., 1996, 1995; Ebert et al., 2007, 2008), increasing downwards and towards the root zone. The maximal depth of burial of the Morcles nappe has most likely exceeded 10 km and was achieved between 29 and 24 Ma (Fig. 1b) (Kirschner et al., 1996, 1995). In the studied section, the carbonate layers are strongly folded, indicating significant internal ductile deformation of the nappes (Fig. 1c). The Morcles fold nappe is characterized by strong parasitic folding in its frontal part and by an approximately 20 km long, highly stretched inverse limb. The Wildhorn super-nappe also exhibits significant internal deformation, such as the isoclinal fold separating the Diablerets and Mont Gond nappes (Fig. 1c). These observations indicate that in the studied region ductile deformation was significant during formation of the nappes.
3.1 Mathematical model
Our mathematical model is based on the concept of continuum mechanics (e.g., Mase and Mase, 1970; Turcotte and Schubert, 2014). We assume slow (no inertial forces), incompressible deformation under gravity. Heat production and transfer by conduction and advection are considered. Thermal evolution and deformation are coupled by temperature-dependent viscosities and shear heating; that is, dissipative deformation is converted into heat to conserve energy. The governing system of partial differential equations is solved numerically. The applied equations are described in detail in Schmalholz et al. (2019). The applied numerical algorithm is based on the finite-difference/marker-in-cell method (e.g., Gerya and Yuen, 2003). The diffusive terms in the force balance and heat transfer equations are discretized on an Eulerian staggered grid, with a resolution of 3001×1001 (width by height). Advection and rotation terms are treated explicitly using a set of Lagrangian markers and a fourth-order-in-space/first-order-in-time Runge–Kutta scheme. The topography in the model is a material interface defined by a contour line with Lagrangian coordinate points, which is advected with the computed velocity field (Duretz et al., 2016). With ongoing deformation, the distance between neighboring points can increase and achieve the size of the numerical finite-difference cells. In such a case, this contour line is locally remeshed by adding additional points in the deficient contour line segments.
We consider a visco-elasto-plastic deformation behavior and assume a Maxwell viscoelastic model and Drucker–Prager and von Mises yield criteria (see details in Schmalholz et al., 2019). In the applied creep flow laws, we add a constant pre-factor f to the dislocation creep flow laws:
where the expression to the right of f corresponds to the effective viscosity from standard dislocation creep flow laws determined by rock deformation experiments. In Eq. (1), is the square root of the second invariant of the dislocation creep strain rate (s−1), and T is temperature (K). All other parameters are explained and listed in Table 1.
Table 1The list of the reference model parameters, where f is a custom pre-factor, A is the pre-exponential factor, n is the power-law exponent, Q is the activation energy, λ is the thermal conductivity, ρref is the density at reference pressure (Pref=0 Pa) and temperature (), Qr is the radioactive heat production, C is the cohesion, and ϕ is the friction angle. Some parameters have constant values: is the heat capacity, G=1010 Pa is the shear modulus, is the thermal expansion coefficient, is the compressibility, and is a geometry factor (needed to convert flow law parameters from axial compression experiments into an invariant form).
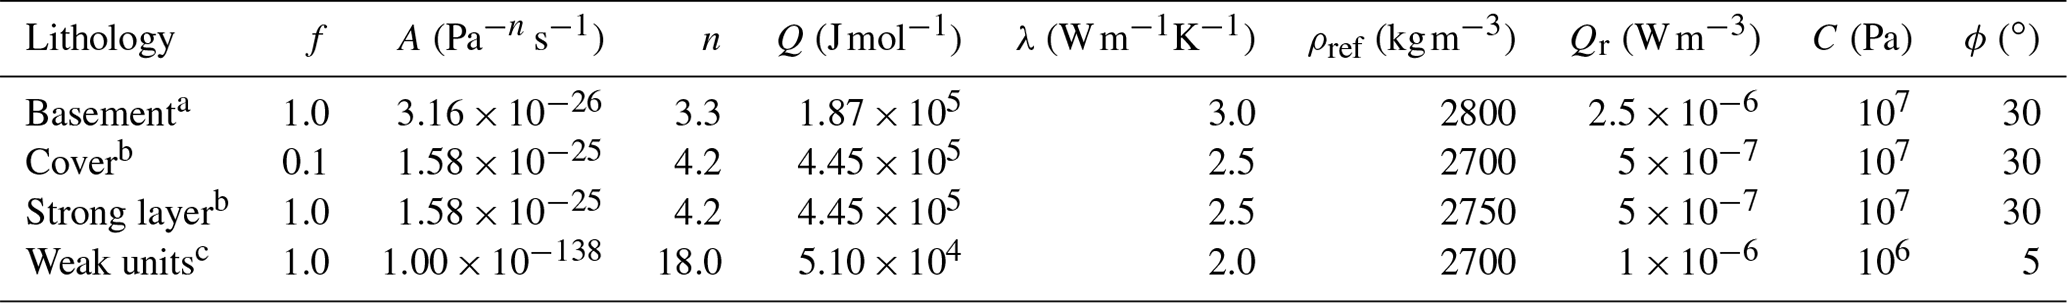
The creep flow law parameters (A, n and Q) are a Westerly granite (Hansen and Carter, 1983), b calcite (Schmid et al., 1977) and c mica (Kronenberg et al., 1990).
3.2 Model configuration
The applied model configuration mimics a 200 km long section of the upper crustal region of a simplified passive margin (Fig. 2). We consider four model units with distinct mechanical properties, namely basement, cover, strong layer and weak unit. The basement unit represents the crystalline basement, the cover unit represents the Ultrahelvetic and Penninic nappes, the strong layer represents the main carbonate layers (Malm and Urgonian), and the weak unit represents the shale-rich units. The initial geometry of the basement unit represents the crystalline upper crust of a passive continental margin with 15 km thickness, tapering down to 5 km thickness (Fig. 2). The Infrahelvetic basin is represented by an idealized half-graben that is 5 km deep and 25 km wide. The Infrahelvetic and the more distal (right side of the model) Helvetic basin are separated by an idealized horst structure. We cover the entire passive margin structure with sediments to obtain a total (basement plus sediments) model thickness of 25 km. The model stratigraphy consists of three units (cover, strong layer and weak units) and each unit has homogenous material parameters. Both the half-graben and the basin are filled with weak units up to a depth of 13.5 km. On top of the weak units, we place a 1.5 km thick strong layer. Our initial geometry represents the stage during the Alpine orogeny, when the proximal passive margin, including the Infrahelvetic and Helvetic basins, was still relatively undeformed, but the Ultrahelvetic and Penninic units have been already thrust on top of it (Fig. 1b). We consider the overthrust units by adding a 10 km thick, homogenous unit of cover sediments (without distinction between the Ultrahelvetic and Penninic units) on top of the model basement and basins (Fig. 2). Adding this 10 km thick unit is important to achieve pressure and temperature conditions that are close to the recorded ones, because those control the brittle–plastic yield strength and the temperature-dependent effective viscosities.
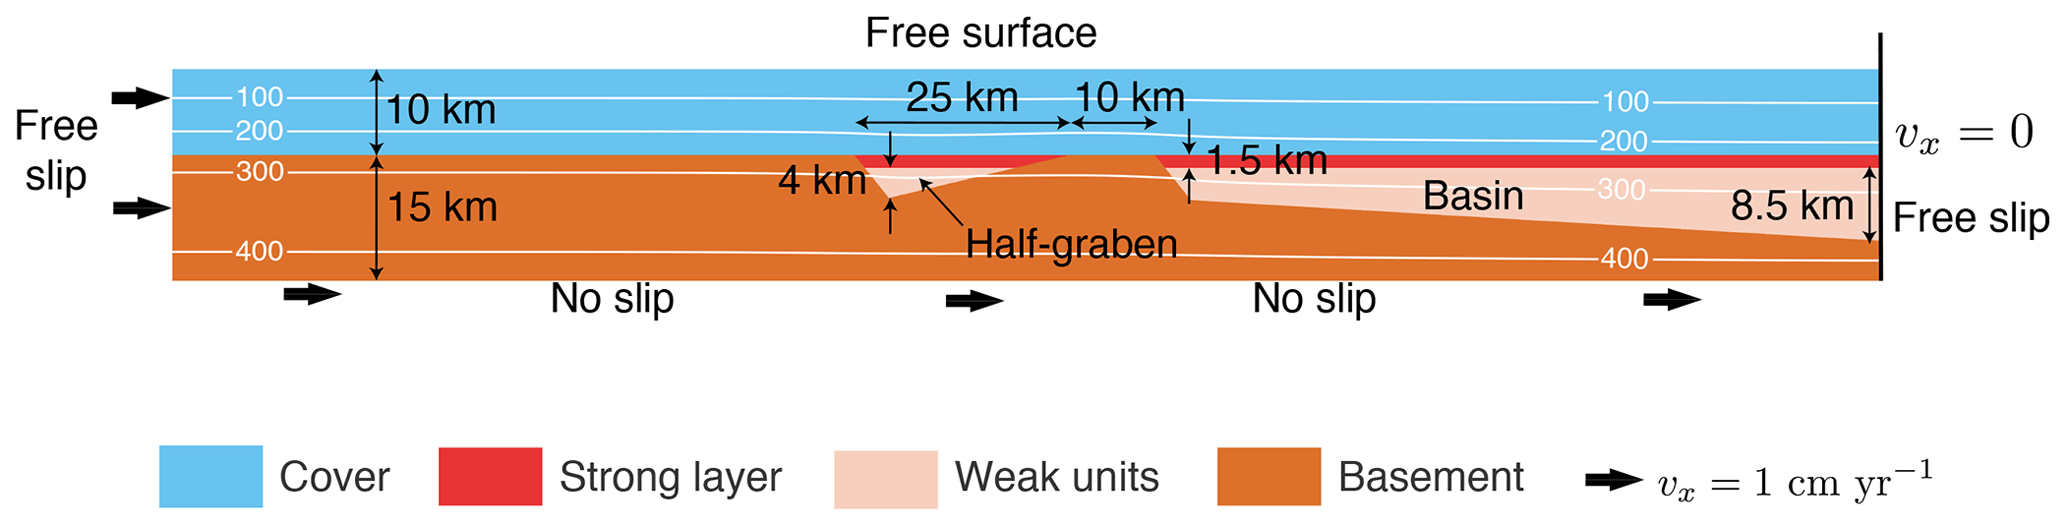
Figure 2Reference model configuration. The white contours show isotherms and the labels are the corresponding temperatures in ∘C.
We apply boundary conditions that are similar to sandbox experiments of fold-and-thrust belts and orogenic wedges (Fig. 2). The left lateral model boundary moves to the right with a constant horizontal velocity of 1 cm yr−1, while the right lateral boundary does not move horizontally. There are no shear stresses at the vertical model boundaries (i.e., free-slip boundary conditions). The bottom boundary also moves with a horizontal velocity of 1 cm yr−1 but does not move vertically. This velocity boundary condition generates a velocity discontinuity at the bottom right corner of the model, which is typical for sandbox experiments and numerical simulations of accretionary wedges (e.g., Buiter et al., 2006). The top boundary is a free surface, using the algorithm of Duretz et al. (2016). We apply constant temperature boundary conditions of 10 ∘C at the top and 420 ∘C at the bottom of the model. There is no heat flux across the lateral model boundaries. We apply an initially equilibrated temperature field which results in an approximately 16 initial geothermal gradient. Applied parameters are listed in Table 1.
First, we present the main results of a reference simulation for the configuration described above and then results of simulations in which some parameters are varied. All simulations show some common, general features. With increasing bulk shortening, the initially flat topography is increasing, mostly around the right model boundary, representing a “back stop” (Fig. 3). The models develop a wedge shape with a topography tilting towards the left side of the model. With progressive shortening, the increasing topography reaches the left model boundary and the topographic slope diminishes, generating again a flatter topography. Also, basement deformation occurs initially around the bottom right corner and progressively propagates towards the left (Fig. 3). With progressive shortening, the model thickens, and the sedimentary units above the basement become relatively thicker than the underlying basement because the sediments are thrust above the basement. The thickened sedimentary cover results in increasing basement temperatures, hence decreasing its viscosity. The temperature increase at the top of the basement is documented in Fig. 3 by the position of the 300 ∘C isotherm. Such basement temperature increase and the related shift to thick-skinned deformation were also reported by Bauville and Schmalholz (2015) in their numerical models of fold-and-thrust belts. Basement deformation results in the partial or total closure of the half-graben and associated extrusion of the basin fill. The specific model evolution, however, depends on the applied flow laws and model stratigraphy, which will be discussed in comparison with the reference simulation.
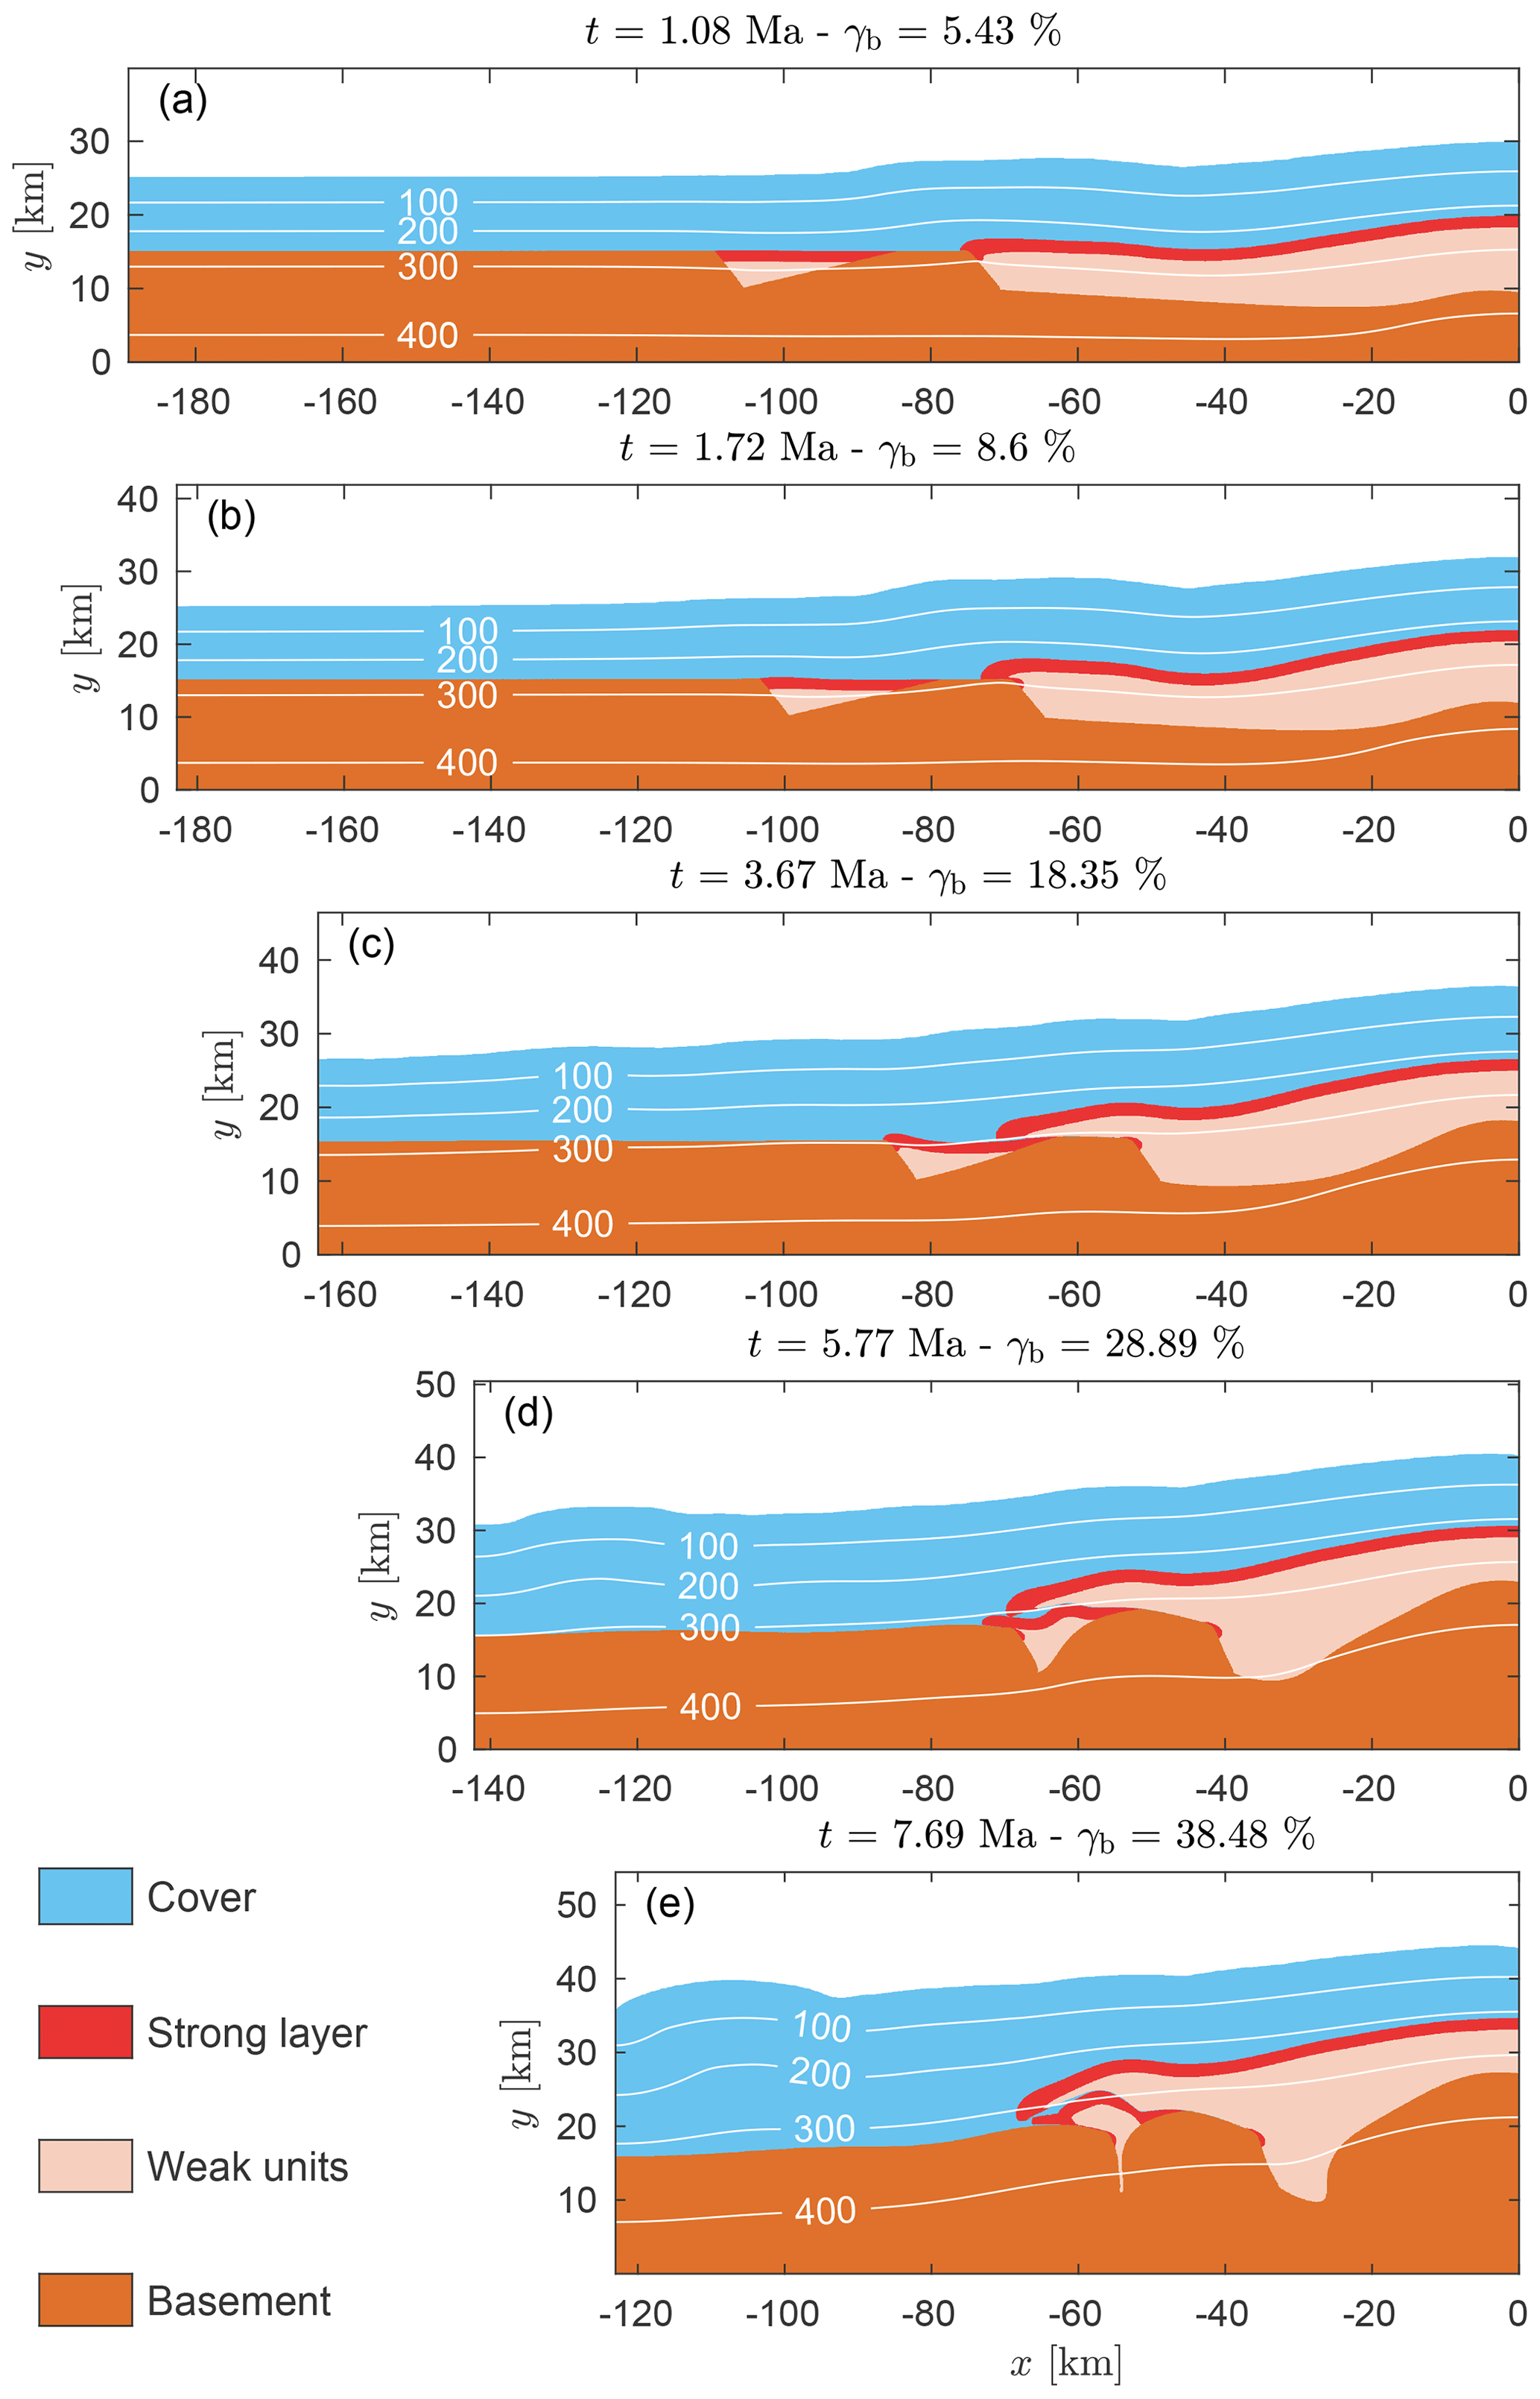
Figure 3Structural and thermal evolution of the reference model for different times, t, and bulk shortening, γb. The white contours show isotherms and the labels are the corresponding temperatures in ∘C. An animation, showing the full time evolution of the reference model, can be found in the Supplement.
4.1 Reference model
We apply the configuration and parameters described in the previous section and displayed in Fig. 2 to generate a reference simulation (Figs. 3 and 4). Initially, elastic stress builds up over a few hundred thousand years until the brittle–plastic yield stress and the steady-state ductile creep stress are reached. The brittle–ductile transition occurs at about 6–8 km depth. We quantify deviatoric stress magnitudes with the square root of the second invariant of the deviatoric stress tensor, τII, and maximal deviatoric stresses reach approximately 250 MPa at the brittle–ductile transition (Fig. 4). Maximal strain rates in the developing shear zones are between 10−13 and 10−12 s−1, in broad agreement with strain rate estimates for natural shear zones (e.g., Pfiffner and Ramsay, 1982; Boutonnet et al., 2013; Fagereng and Biggs, 2018). The largest stresses develop around the brittle–ductile transition in the cover, whereas stresses in the basement and in the strong layer are significantly smaller (Fig. 4).
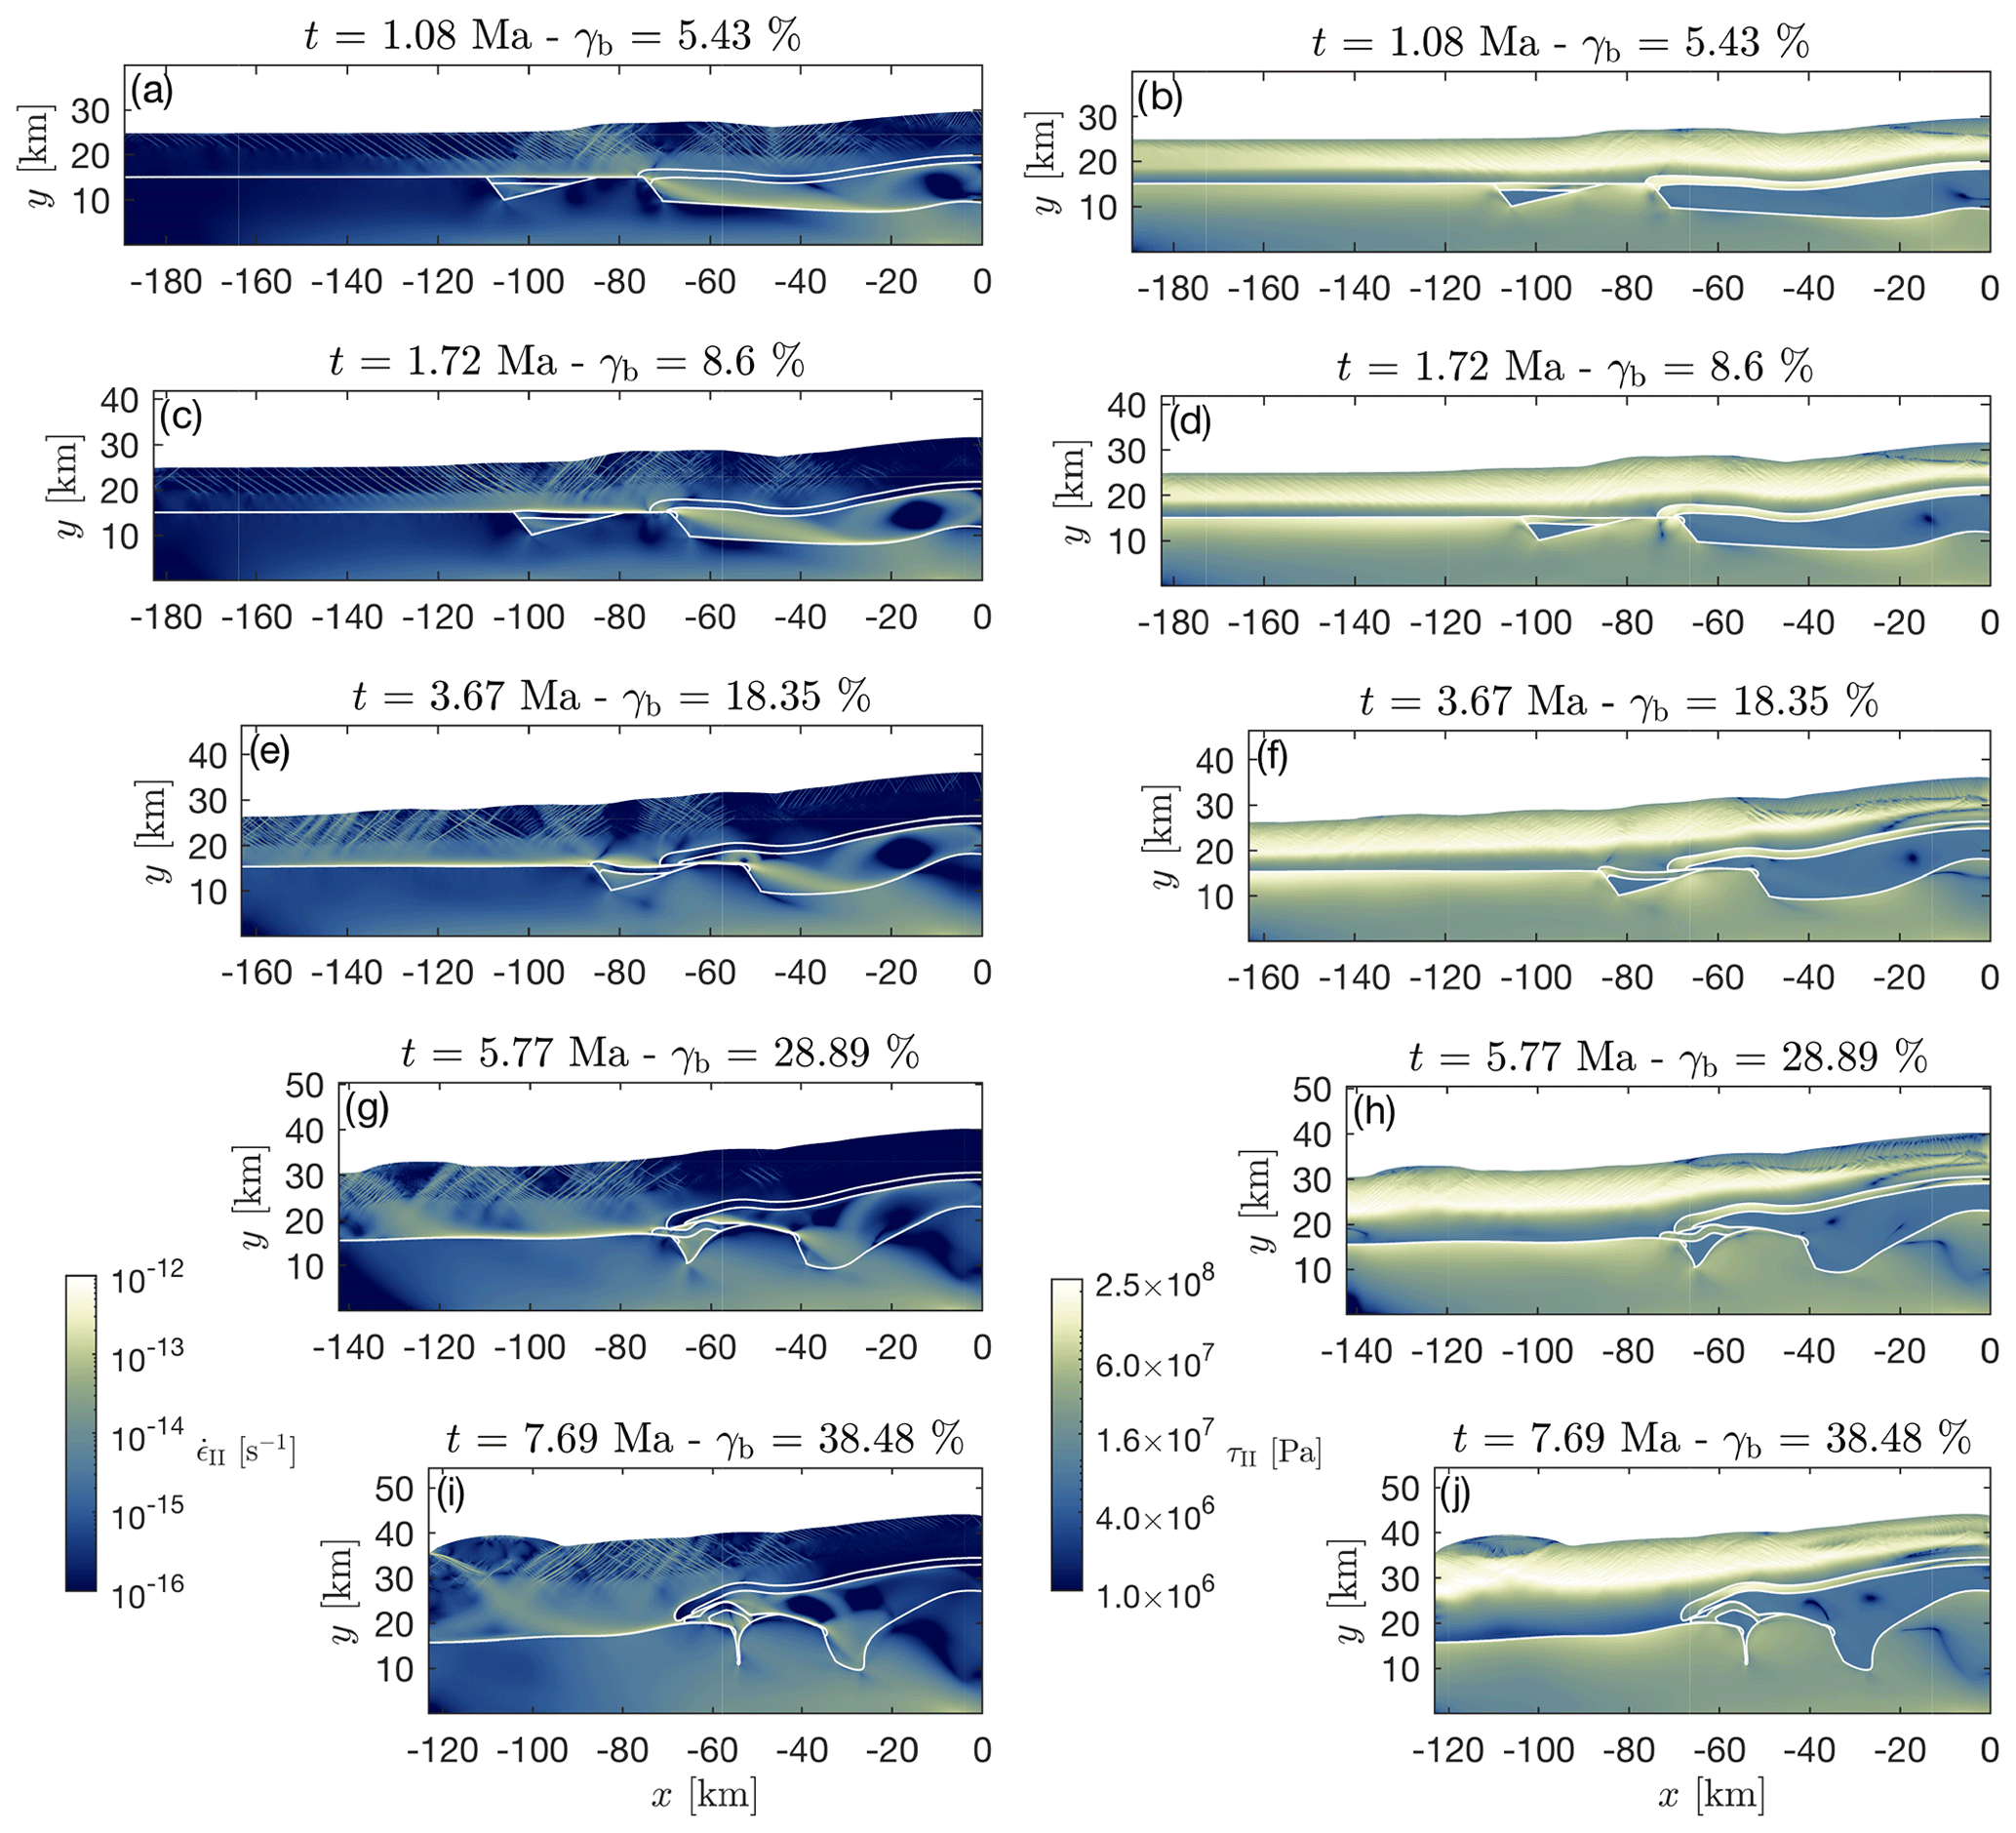
Figure 4Evolution of the strain rate (left column) and deviatoric stress (right column) fields of the reference model for different times, t, and bulk shortening, γb. Strain rate and deviatoric stress are quantified with the square root of the second invariant of the strain rate, , and deviatoric stress, τII, tensor, respectively. Magnitudes of and τII are displayed with logarithmic color scale. Color maps are from Crameri (2018).
The model shows several key phases of formation of a nappe stack:
-
detachment of sedimentary units from their substratum as observed on the basin on the right, which mimics the Helvetic basin (Figs. 3a and b, and 4a and c);
-
significant horizontal transport of approximately 30 km with little internal deformation indicated by the relatively undeformed strong layer in the detached unit (Figs. 3b to d, and 4b to c);
-
formation of a fold nappe due to the closure and ductile drag of the left half-graben, mimicking the Infrahelvetic basin, and associate extrusion of the sedimentary half-graben fill (Figs. 3c to e); and
-
a major thrust nappe stacked on top of a fold nappe (Figs. 3d and e).
During the initial stages of deformation, the strong layer of the right basin is gently folding, or buckling (Fig. 3a). Stress becomes concentrated around the contact of this strong layer and around the basement horst (Fig. 5m), causing increased strain rates in this region. With progressive deformation, a localized shear zone dominated by brittle–plastic deformation develops across the strong layer, eventually detaching it from the basement (Fig. 5j–l). This shear zone develops within the strong layer so that a small piece of the strong layer remains attached to the basement (Fig. 5t). The detachment of the strong layer causes a significant stress drop in the strong layer and the basement (Fig. 5m–p). Once detached, the strong layer and parts of the underlying weak unit passively move subhorizontally over the horst, initiating the horizontal nappe transport. Quantification of elastic strain rates shows that elastic deformation is active during the detachment process; hence, elastic stresses are not completely relaxed through viscoplastic deformation (Fig. 5e–h).
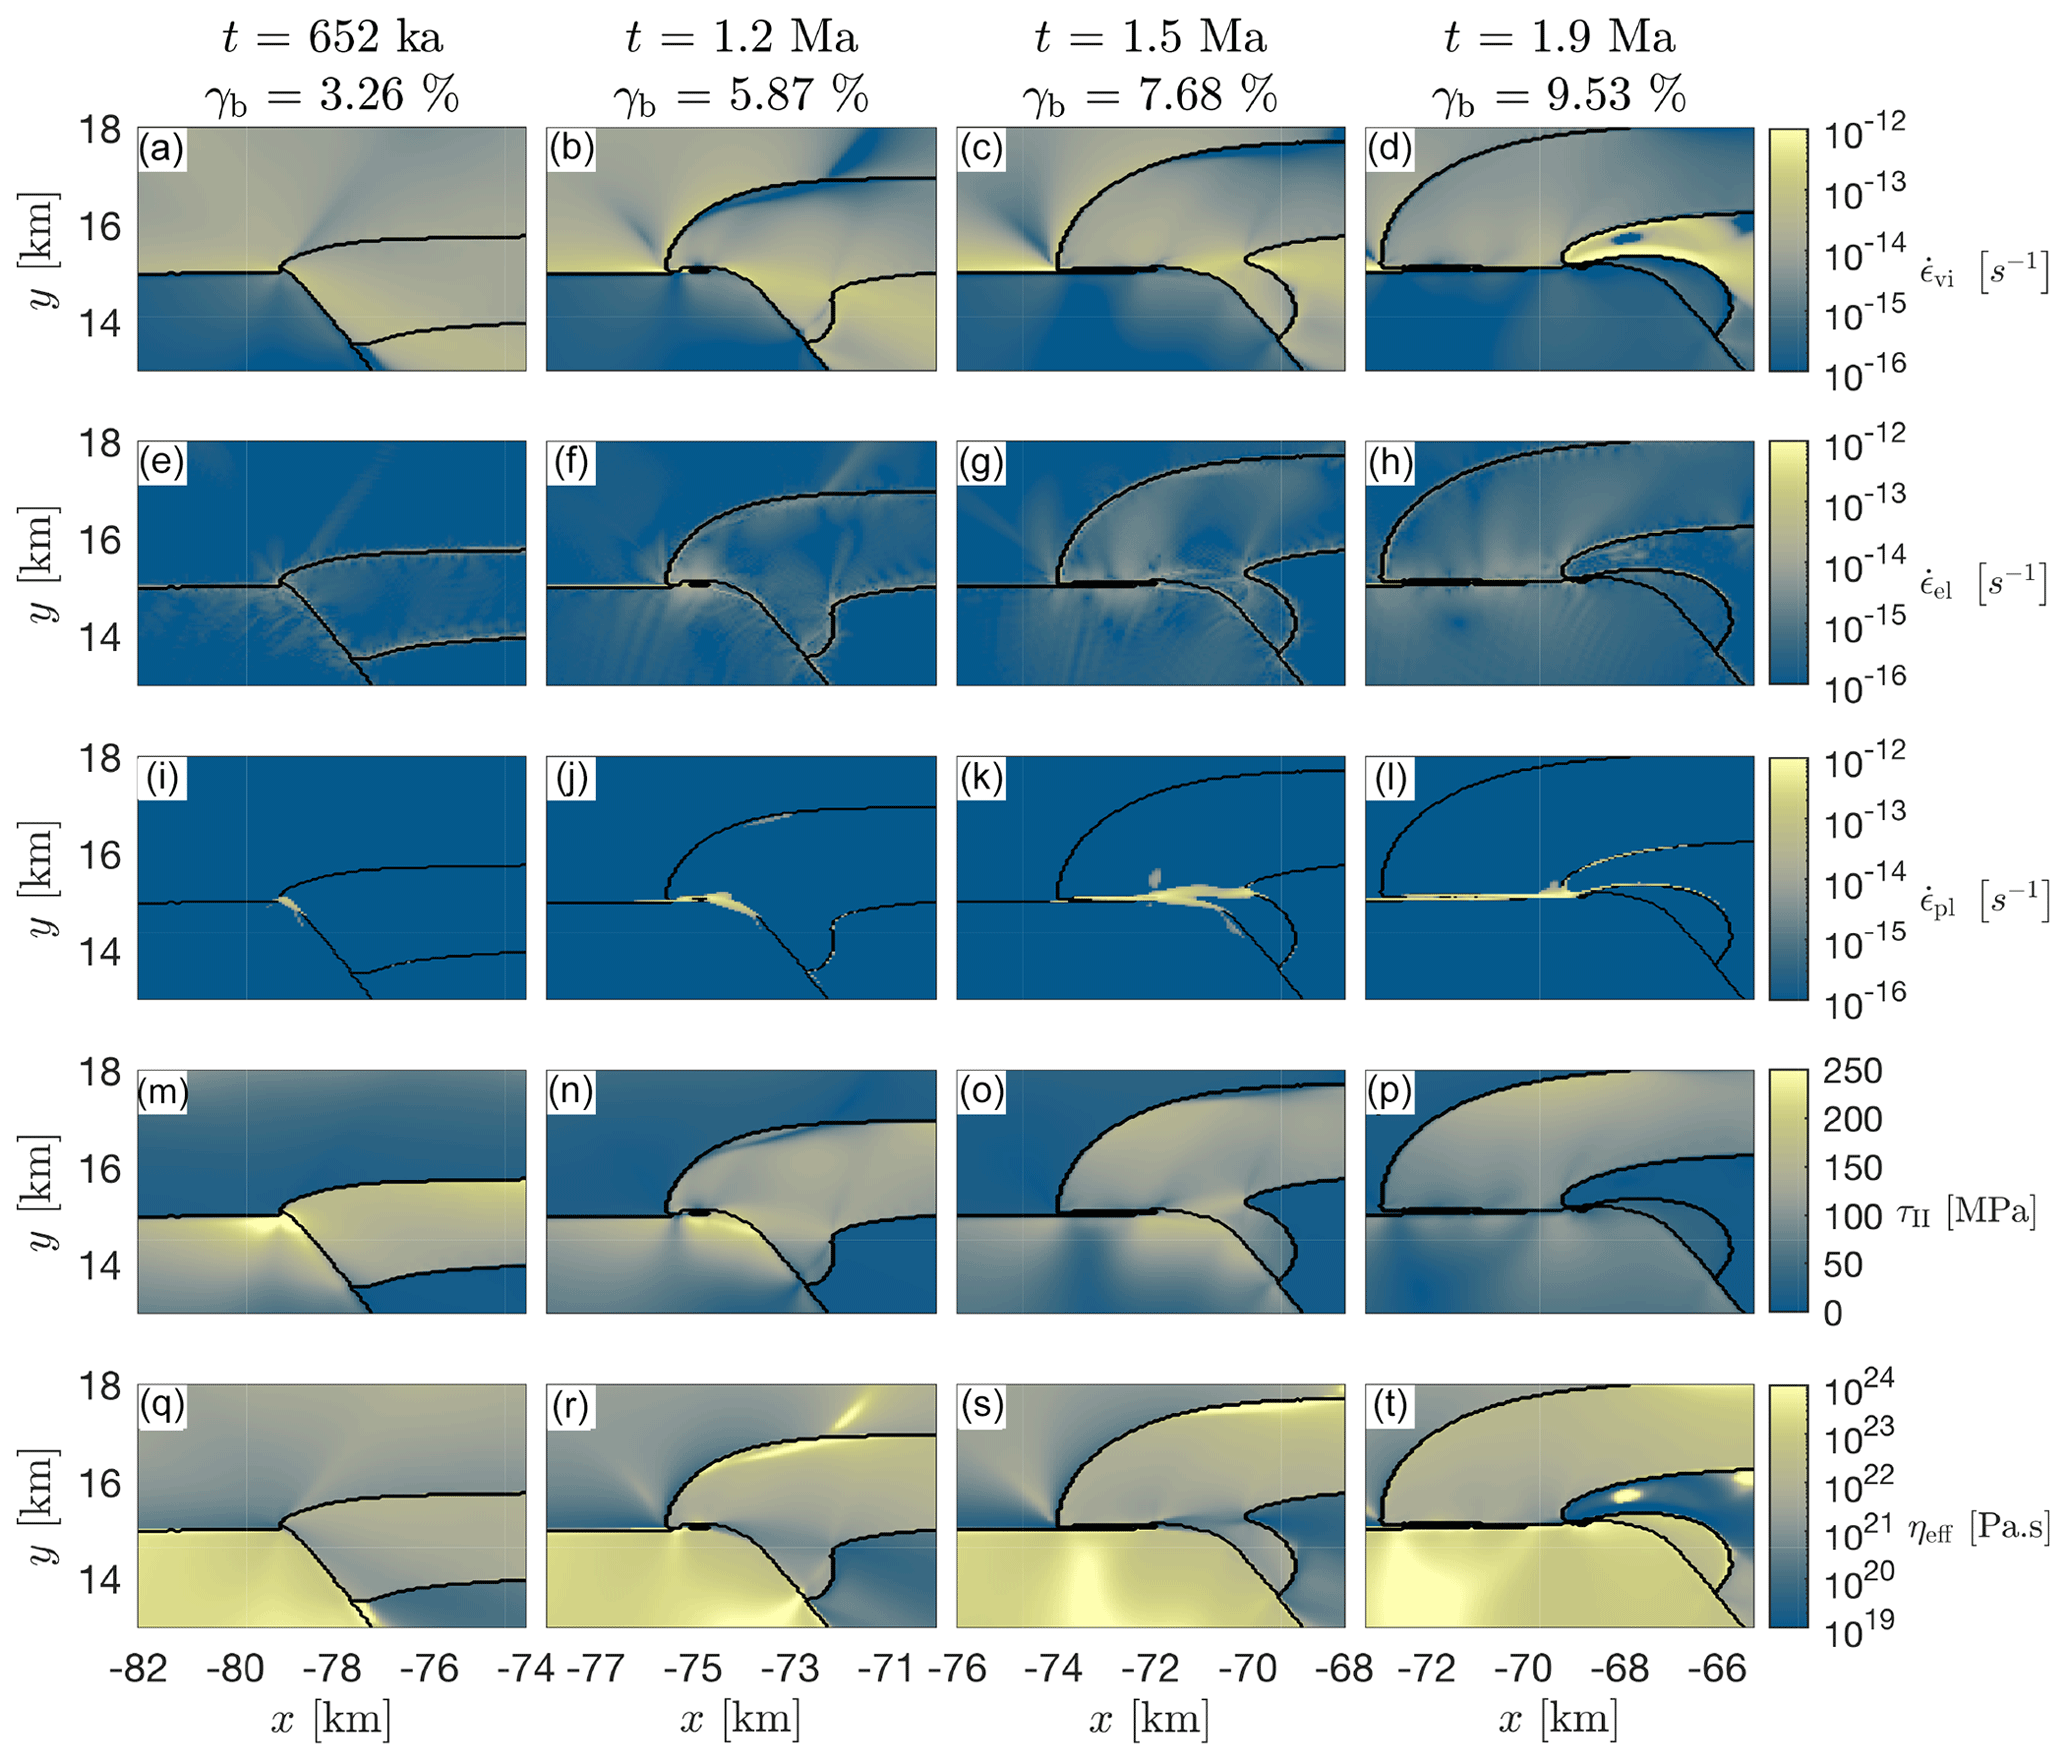
Figure 5Enlargement of different stages of the detachment of the strong layer from the basement horst for different times, t, and bulk shortening, γb (see Fig. 4 for entire model domain). Color plots of viscous strain rates (a–d), elastic strain rates (e–h), plastic strain rates (i–l), deviatoric stresses (m–p) and effective viscosities (g–t) are displayed. For all strain rate and stress tensor quantities, we display their corresponding square root of the second invariants.
During the detachment, some parts of the weak cover, originally residing above the strong layer, are dragged below the detaching strong layer (Fig. 5). During the horizontal transport, the detached unit, consisting of the strong layer and some weak units, is displaced above the cover material. Significant horizontal transport is facilitated because the underlying basement and the strong layer of the left half-graben are significantly more competent than the weak units at the base of the overthrusting nappe.
While the detached unit from the basin on the right is overthrusting the fill of the left half-graben, this fill is also sheared out of the half-graben due to (i) shear stresses generated by the overthrusting unit and (ii) closure of the half-graben due to ductile deformation of basement units. During overthrusting, some parts of the cover units are incorporated between the overthrusting unit and the fill of the left half-graben. Finally, a nappe consisting of the fill from the basin on the right has been stacked above a fold nappe made of materials from the left half-graben. The entire process of nappe detachment, transport and stacking occurs during approximately 8 Myr for the applied bulk shortening velocity of 1 cm yr−1. At the end of the simulation, the temperature of the strong layer ranges between 250 ∘C at the top and 350 ∘C in the root zone of the fold nappe. The final bulk shortening was approximately 38 % after approximately 8 Myr.
4.2 Impact of varying strength contrast
We performed three simulations with the same initial geometry and final bulk shortening as the reference simulation but with modified pre-factors, f, in the applied flow laws. In a first simulation, we used a smaller effective viscosity for the basement only (f=0.33). Here, the basement is weak enough to deform significantly from the onset of shortening. Yield stresses are not reached at the contact of the basement horst with the strong layer (Fig. 6a). The strong layer does not detach from the basement and overthrusting does not take place. Instead, a several-kilometer large fold nappe develops in the strong layer of the basin on the right. Due to the highly distributed basement deformation, the half-graben closes only partially, resulting in a moderate buckling of the strong layer but not in the formation of a fold nappe. Also, a nappe stack does not form in this simulation.
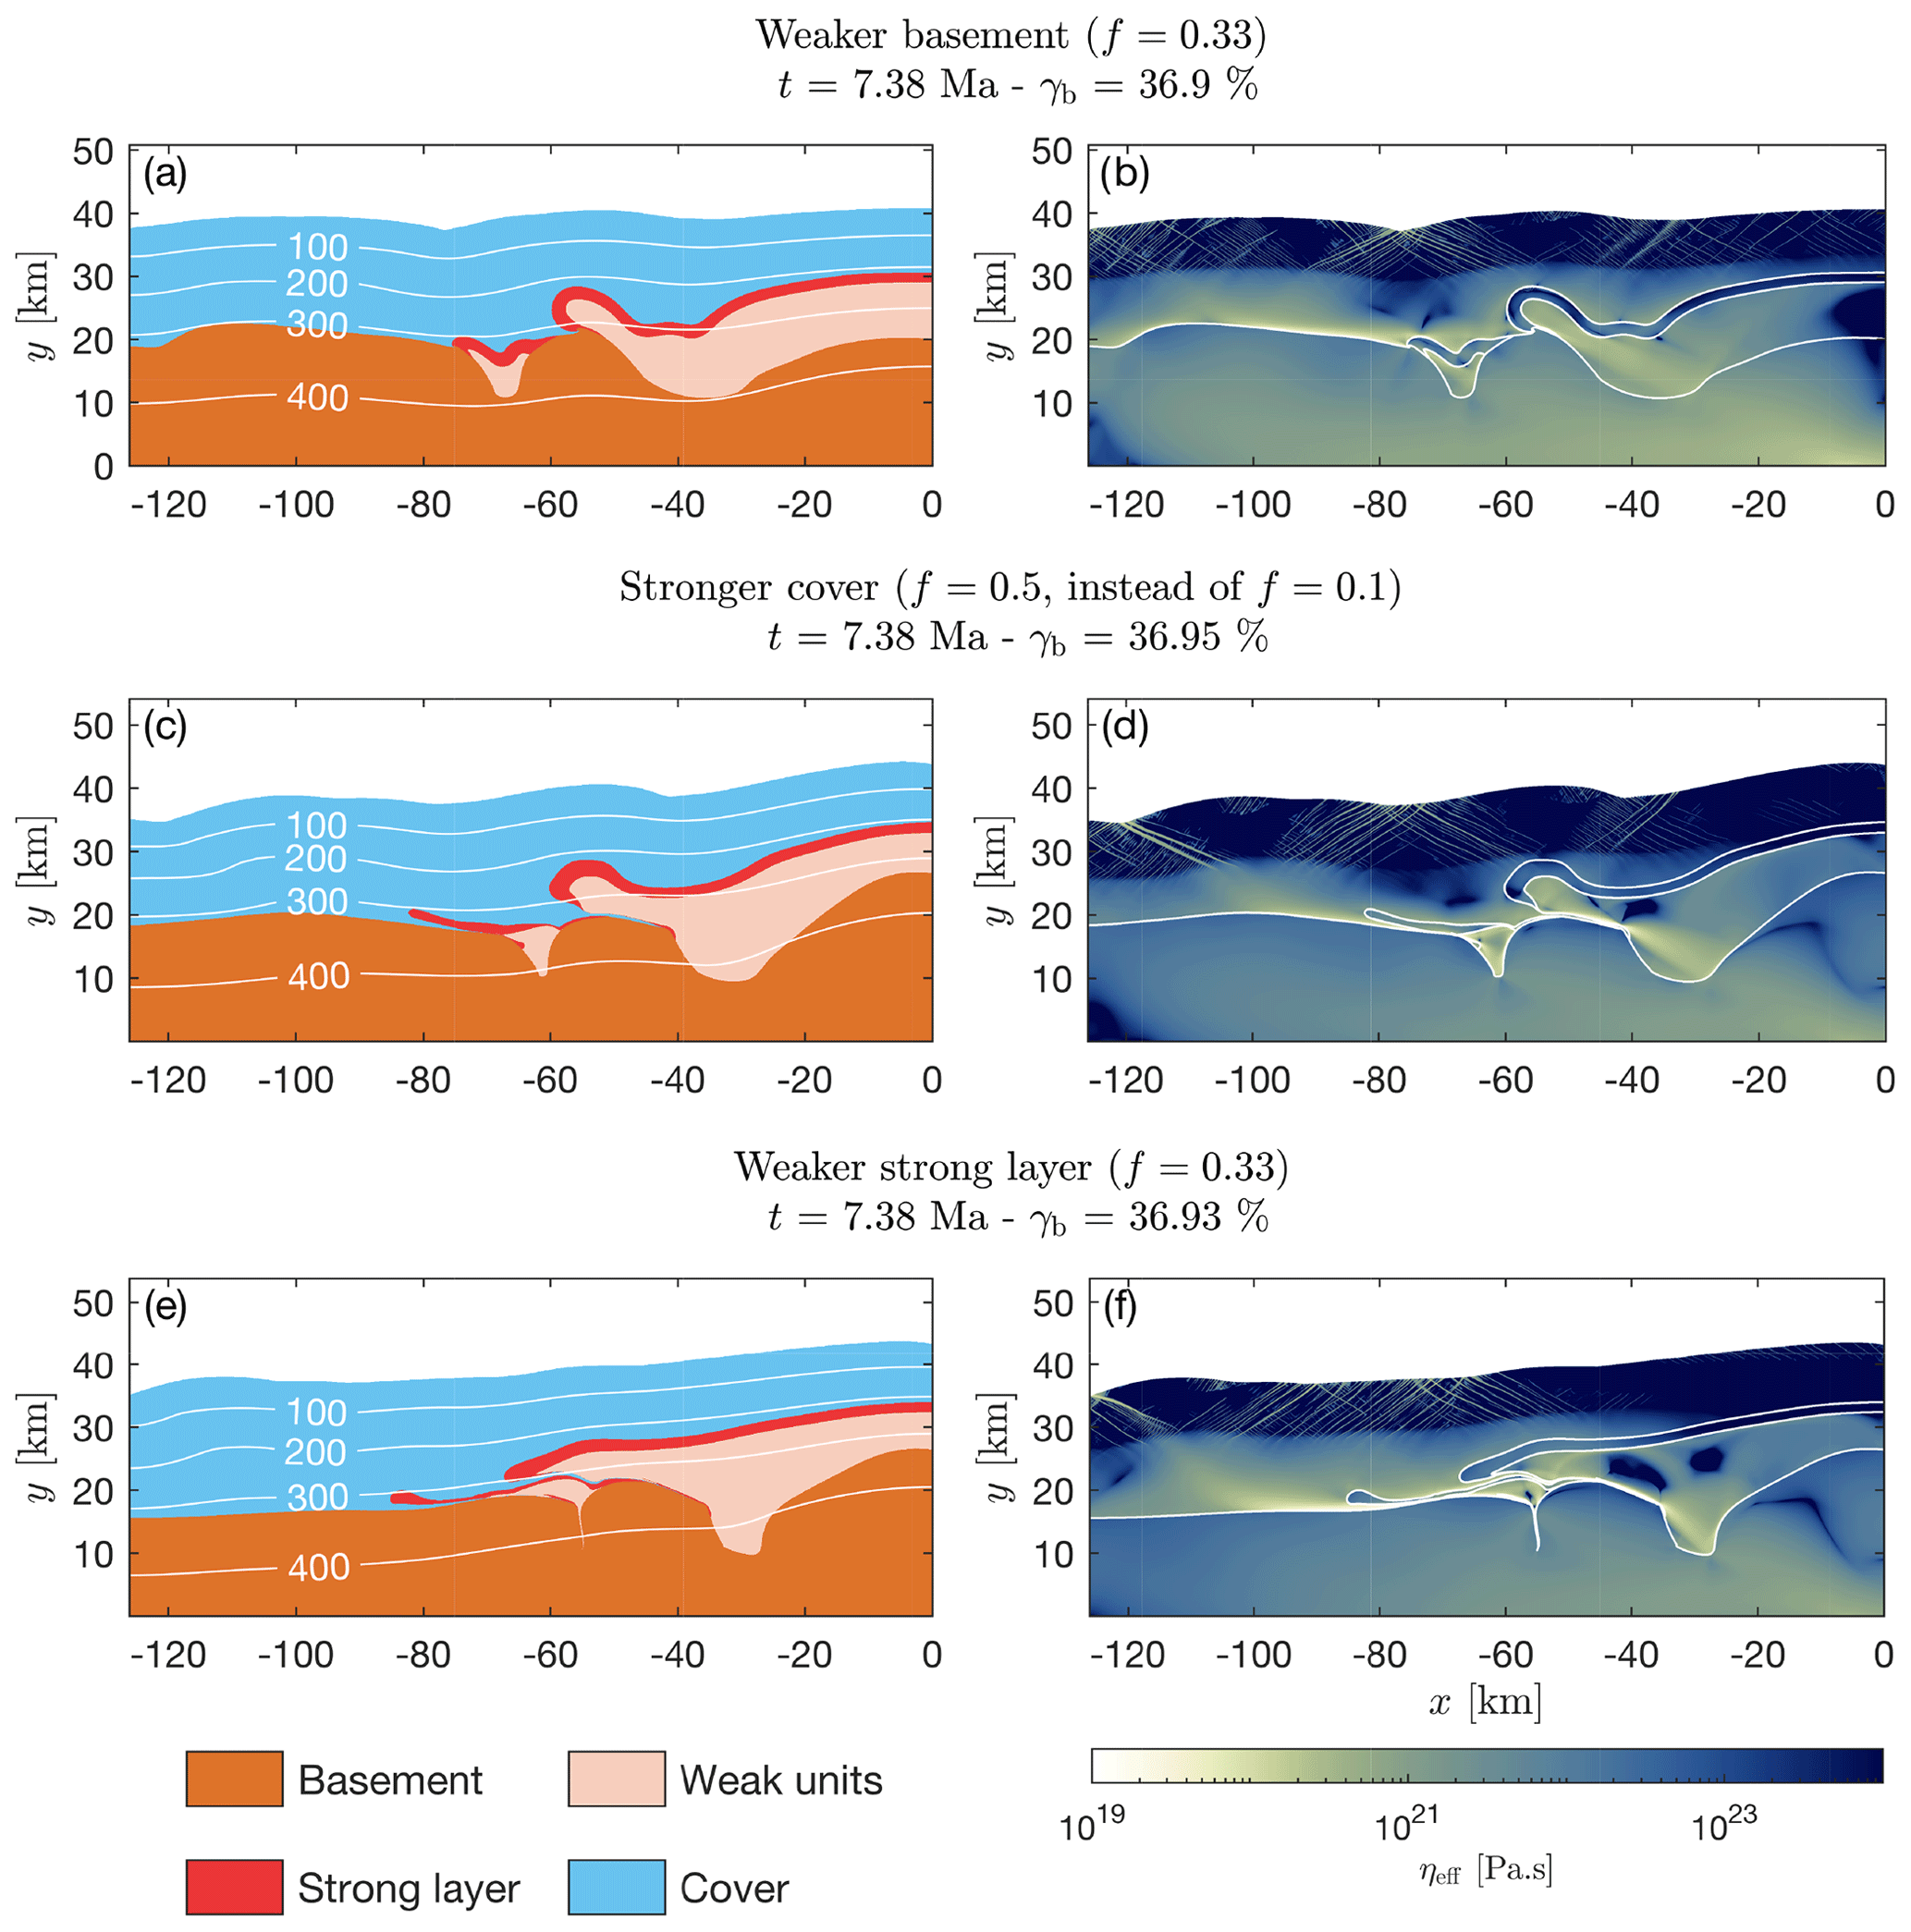
Figure 6The final geometry, temperature and viscosity fields of three simulations with different f factor for certain model units (see figure titles).
In a second simulation, we used a stronger cover (f=0.5 instead of f=0.1). The effective viscosities of basement and cover are similar; as a result, a mostly evenly distributed thick-skinned deformation takes place (Fig. 6c and d). A large-scale fold develops above the horst, but the overturned limb eventually detaches from the basement by necking. Although the overthrusting stage results in a significant horizontal displacement, this displacement is only half that observed in the reference simulation and not sufficient to form a nappe stack. Due to the stronger shear drag from the top, the strong layer of the half-graben on the left is almost entirely sheared out. The strong layer of the left half-graben forms an overthrust nappe with significant horizontal displacement and with significant internal extension.
In a third simulation, we used weaker strong layers (f=0.33). The development of the sediment units of the basin is largely similar to that in the reference model (Fig. 6). The only notable difference is that before the strong layer is detached from the basement, it forms a shear fold that is on the scale of a few kilometers. The development of the units of the left half-graben is largely different compared to the reference simulation. Since the strong layer is weaker, the drag from the overriding units is sufficient to detach the strong layer from its left contact with the basement and displace it several tens of kilometers to the left. Due to significant horizontal displacements, a nappe stack forms with two thrust sheets on top of each other. However, the strong layer from the left half-graben is displaced considerably further towards the left than the strong layer from the basin on the right.
The final result of the three simulations differs significantly from the result of the reference simulation, although the effective viscosities of individual model units have been modified by factors of only 3–5 (Fig. 6). The results indicate that the effective viscosity contrast between the model units has a first-order impact on the results.
At the onset of nappe formation, after approximately 5 % bulk shortening, the reference simulation and the three simulations with different f factors exhibit different distributions and magnitudes of effective viscosity (Fig. 7). The effective viscosity at the top of the basement is on the order of 1024 Pa s and the viscosity of the cover directly above the basement is at least 1 order of magnitude smaller. The strong layers have locally similar maximal effective viscosities than the top basement on the order of 1024 Pa s. The effective viscosity contrast between strong layer and weak units in the basin on the right is approximately 3 orders of magnitude (Fig. 7a). The above-mentioned viscosity ratios between model units are required to generate the nappe detachment, transport and stacking in the reference simulation. In the three models with different f factors in some model units, one of these viscosity ratios is different; hence, the final result differs from the one of the reference simulation (Fig. 7). In other terms, slight changes in effective viscosity distribution lead to different outcomes.
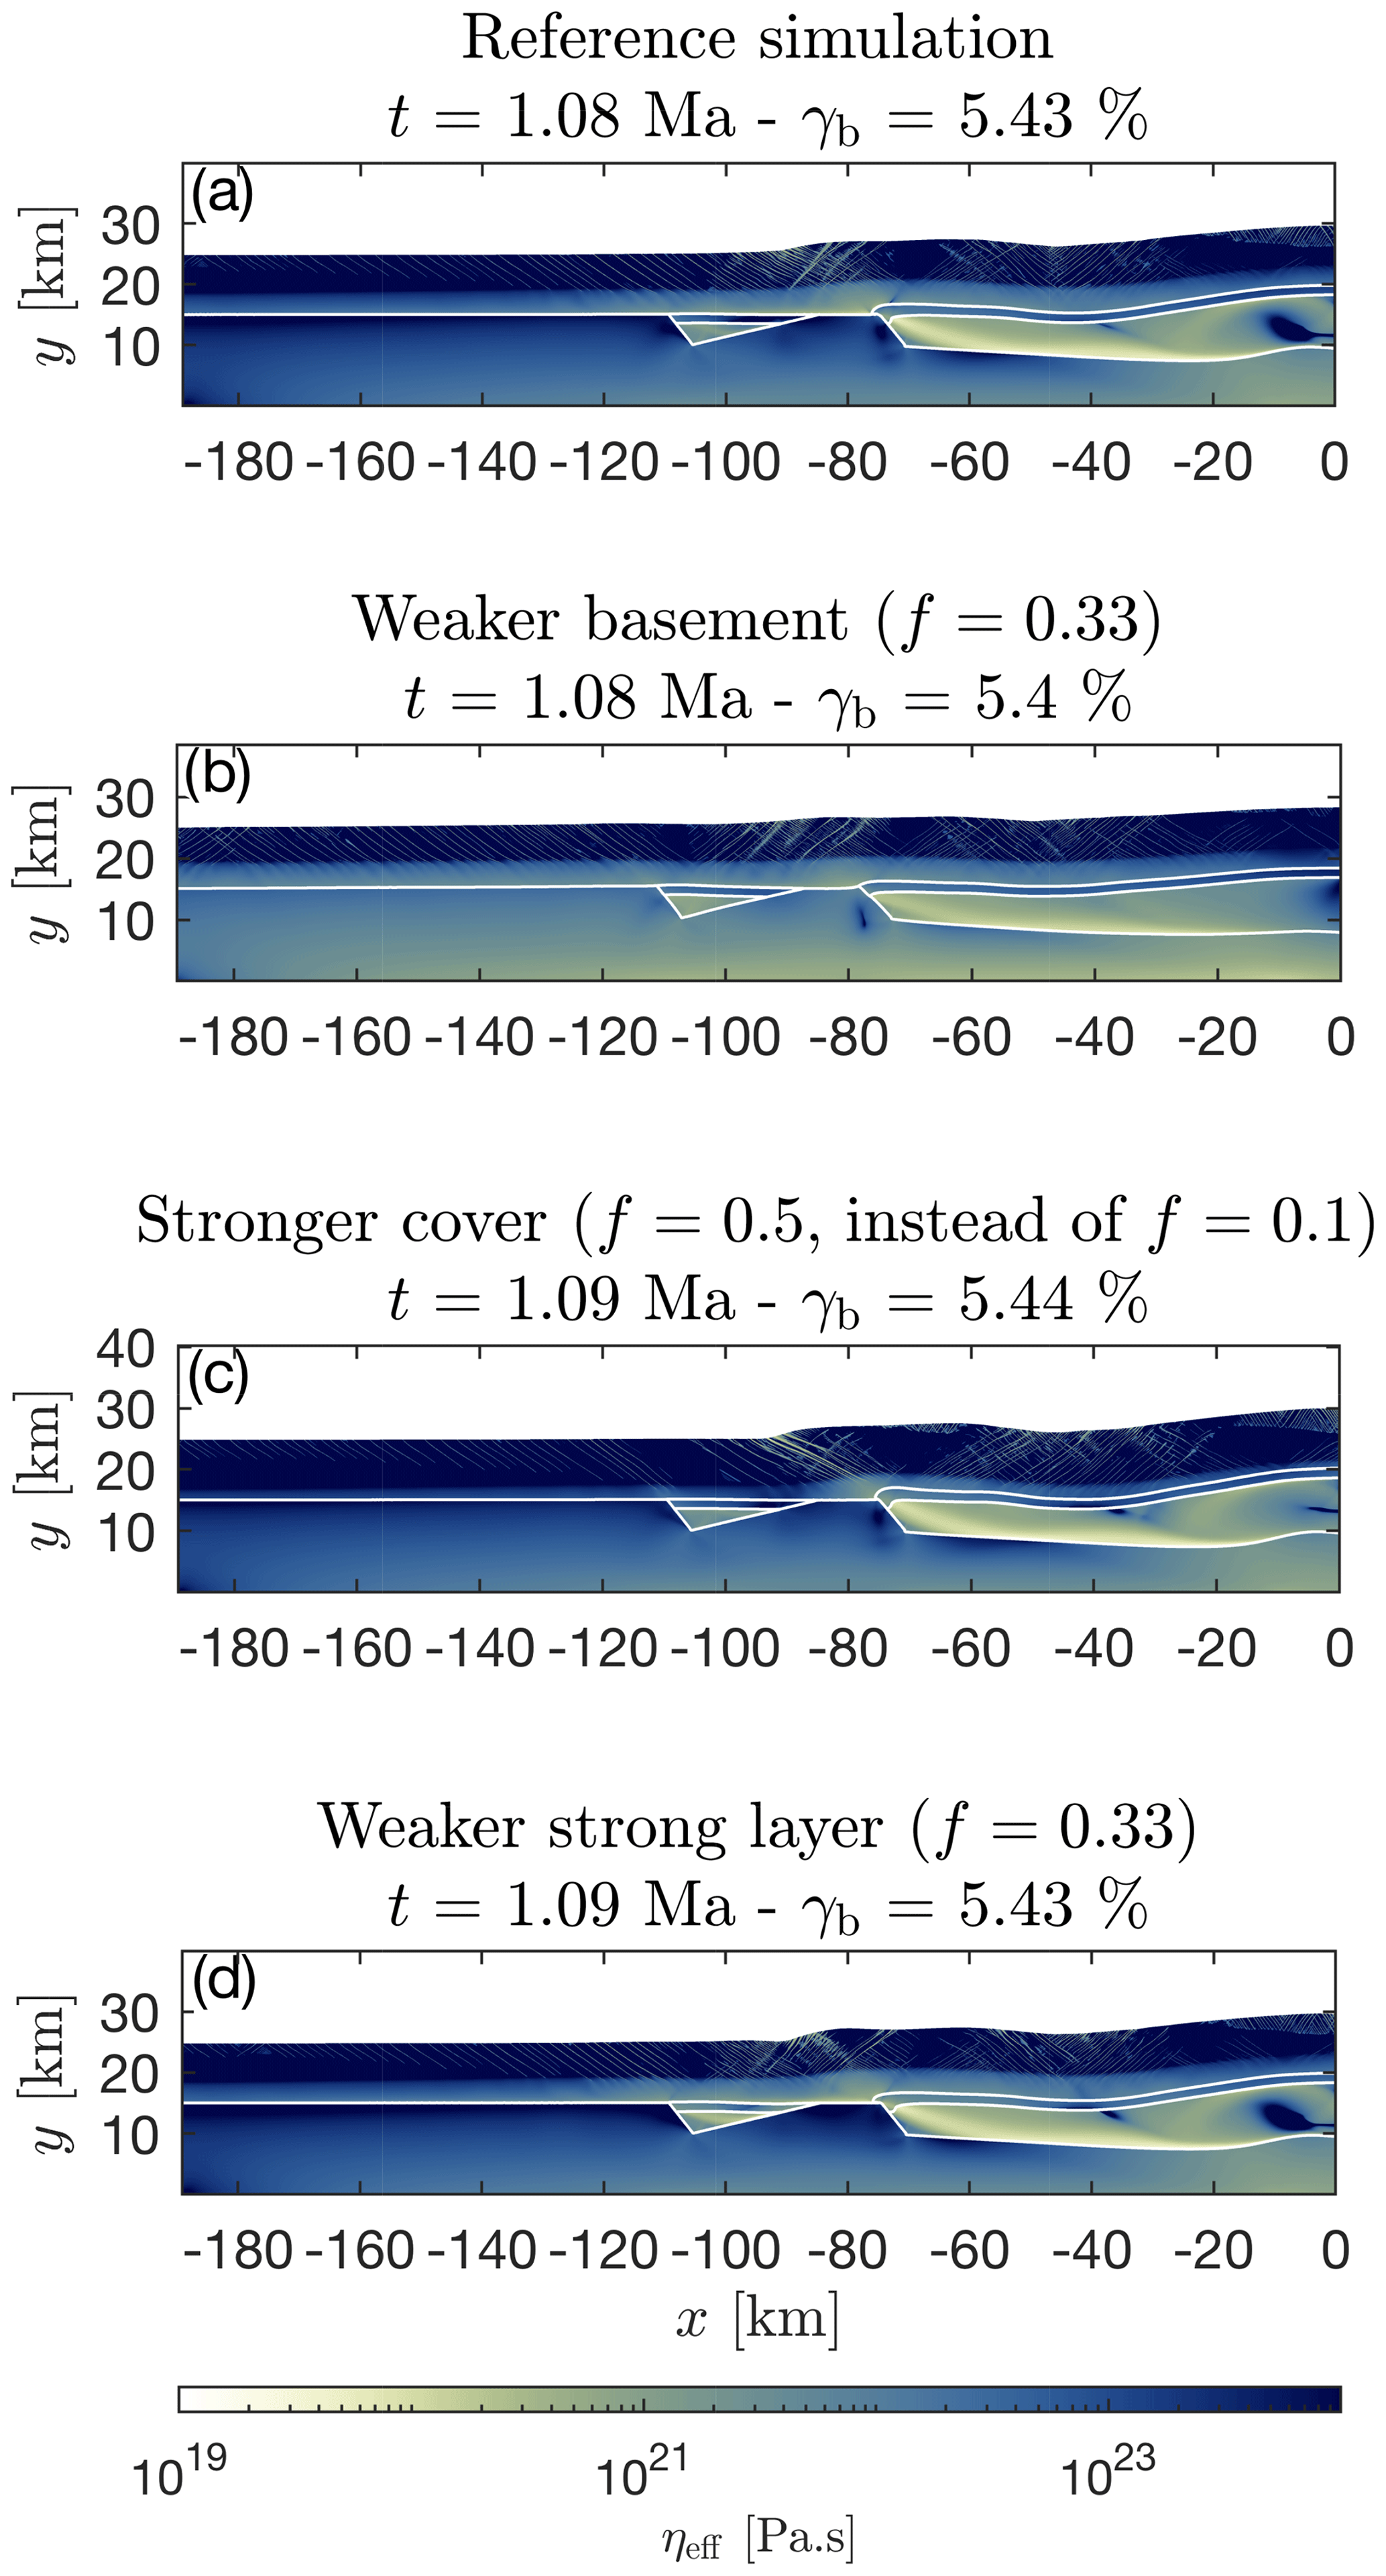
Figure 7Effective viscosity for four simulations with different f factors for certain model units after a bulk shortening of approximately 5.4 %. Below the brittle–ductile transition, the effective viscosity (i.e., ratio of stress and viscoelastic strain rate) essentially equals the viscosity calculated from the dislocation creep flow law (Eq. 1). Panel (a) displays the reference simulation and panels (b–d) display the three simulations shown in Fig. 6.
4.3 Impact of stress limiters in the basement
To test the impact of the vertical strength distribution in the basement, we performed four simulations with the same configuration as the reference model, but we limit the deviatoric stress in the basement to 25, 50, 75 and 100 MPa, respectively (Fig. 8a–d). The stress limitation is achieved by setting, in the basement only, the cohesion (C) to the stress limit and the friction angle to zero. A zero friction angle simulates effectively a pressure-insensitive von Mises yield criterion, which can mimic low temperature plasticity, such as Peierls creep. In all four simulations, the detachment of the strong layers from the basement in the distal basin is caused by a plastic shear zone that cuts through the edge of the horst and shears off a small basement sliver (Fig. 8a–d). At the half-graben, however, the deformational style depends on the value of the cohesion (C). For C=25 MPa, the strong layer in the half-graben is scratching off the top of the left basement and forms a thrust nappe (Fig. 8a). For C=50 MPa, the strong layer still scratches off a bit of the basement top but now forms a fold nappe. For increasing values of C, the amount of strain in the basement decreases; hence, the shape of the nappe from the half-graben becomes more similar to the shape in the reference simulation (Fig. 8b–d).
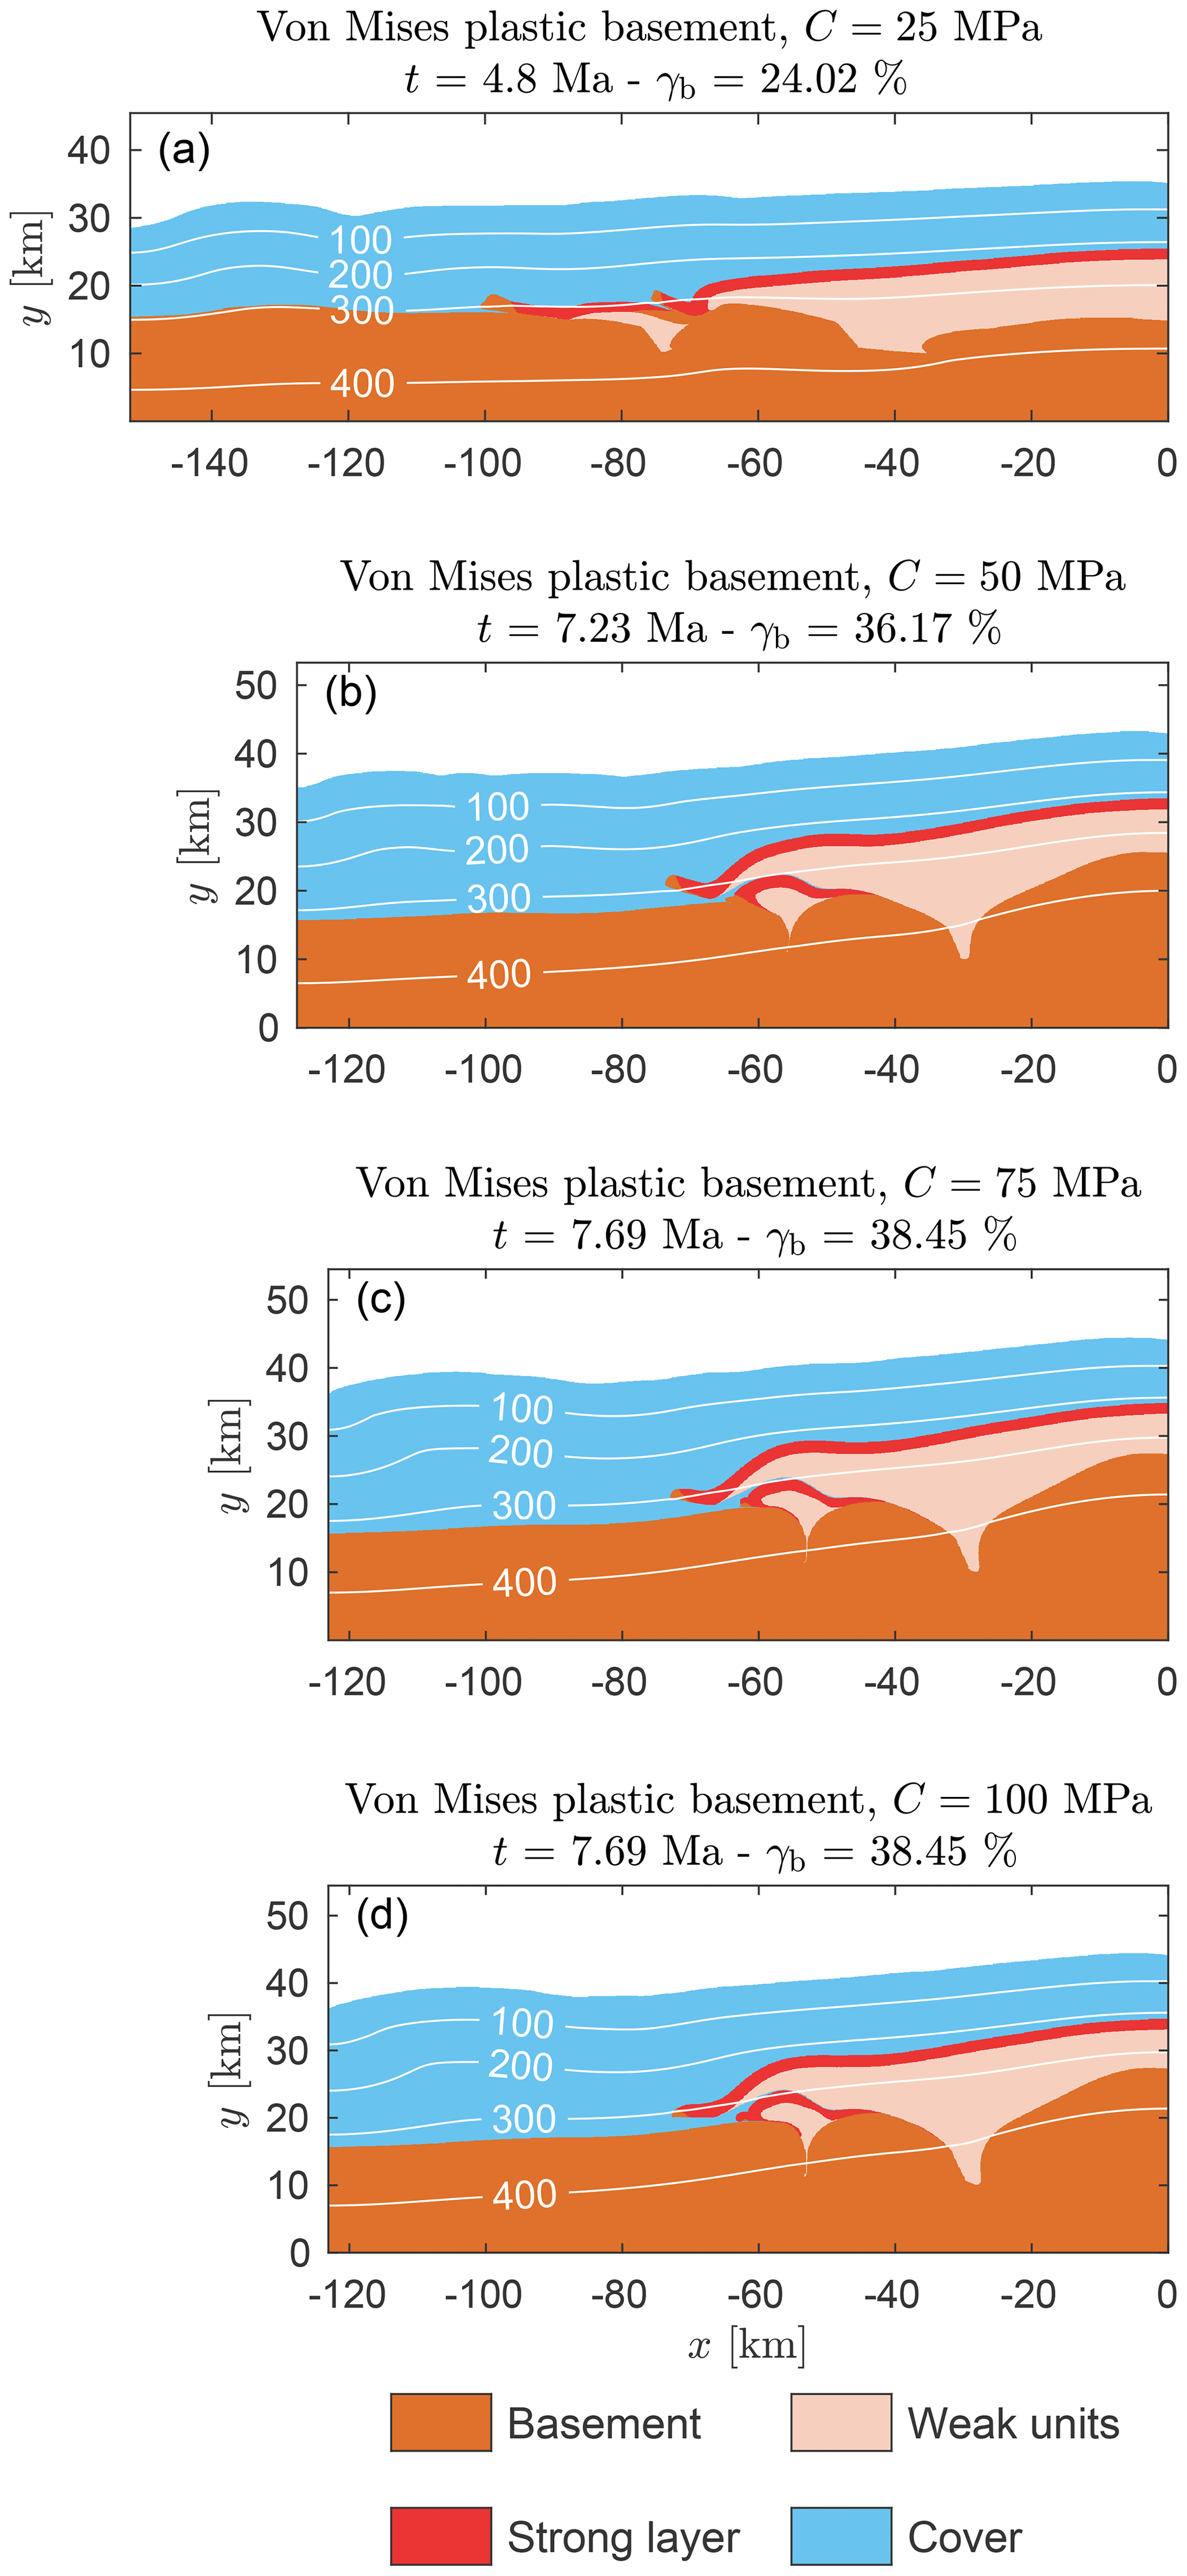
Figure 8The final geometry and temperature fields of three simulations with different von Mises yield criteria (see figure titles). The simulation with C=25 MPa has been terminated earlier, as the results (the sedimentary units are bulldozing off huge pieces of the crystalline basement) are totally different from geological observations.
4.4 Impact of multiple layers
We also run simulations in which we replaced the single strong layer in the reference model with two thinner ones that are separated by weak units. We run three simulations with different initial thickness distributions of the two strong layers and alternating weak units. The initial thickness configuration is displayed on the right of the three panels in Fig. 9. The material parameters of every unit are the same as in the reference model. The basement deformation agrees with the one in the reference model. The deformation of the strong layers is different.
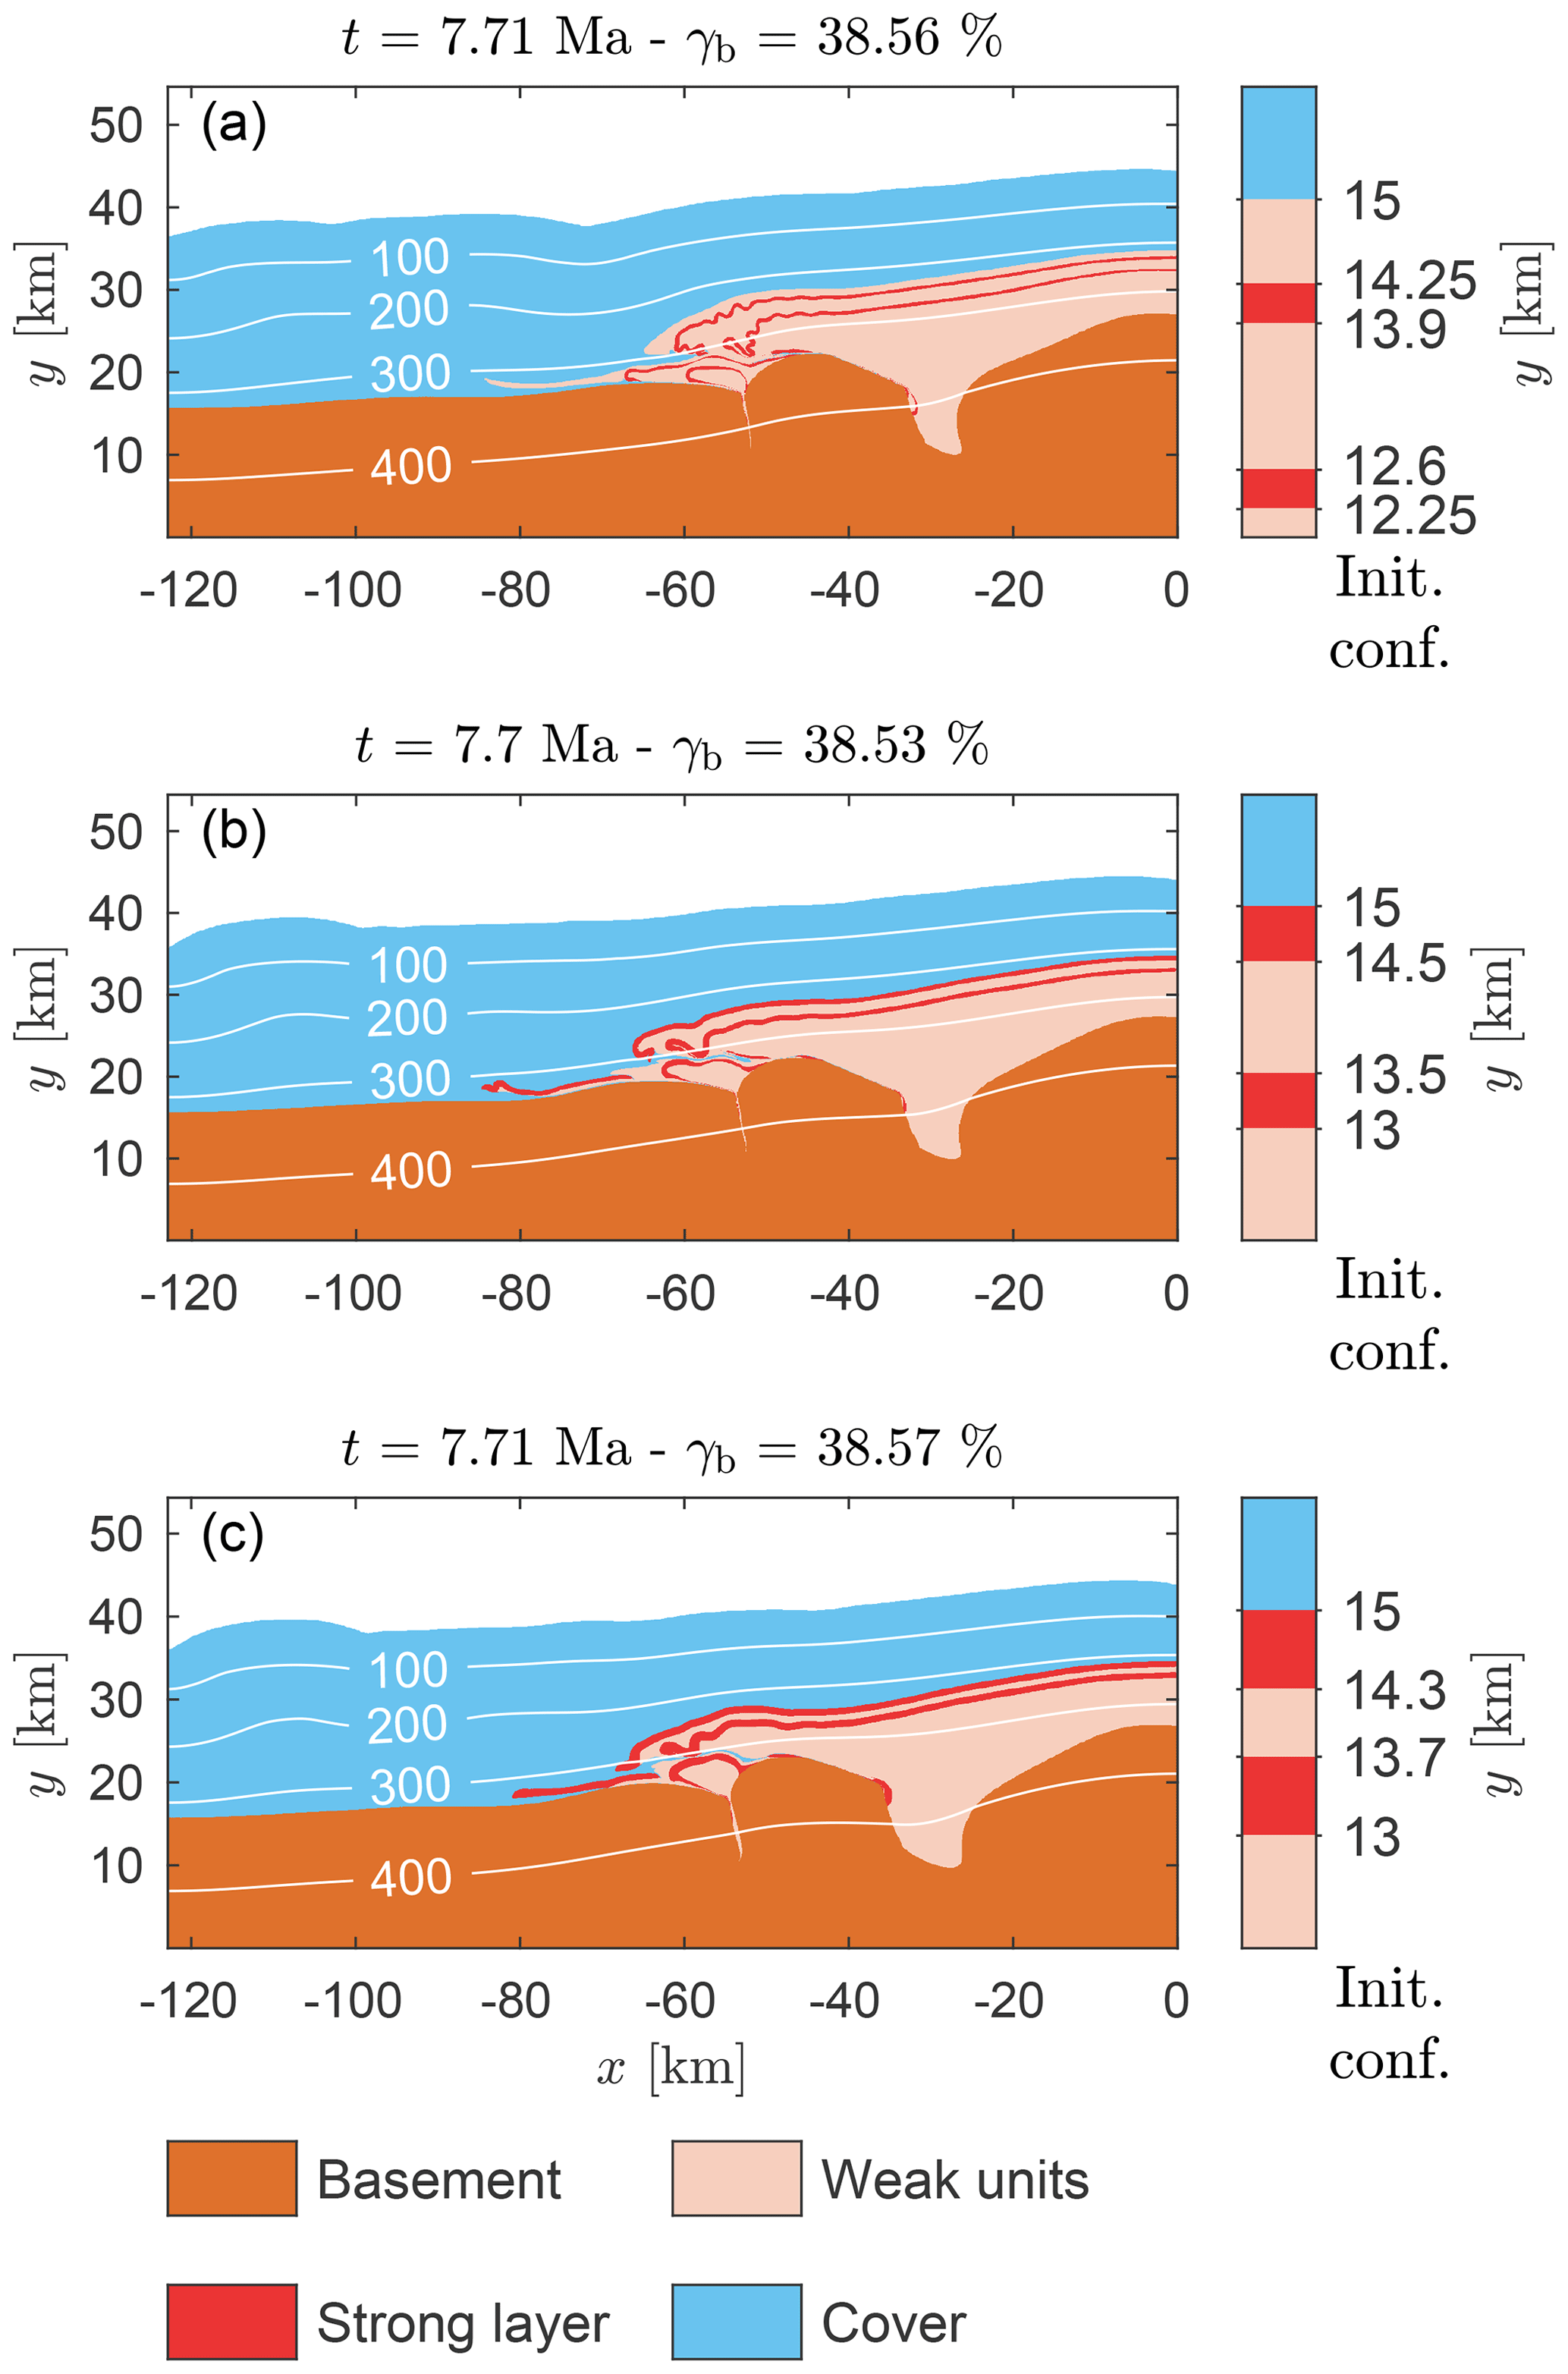
Figure 9The final geometry of three simulations with two strong layers with the isotherms of the corresponding temperature field. The initial model stratigraphy around the upper region of the half-graben and basin is displayed on the right of each panel. The model stratigraphy is laterally homogenous, so the overall initial configuration is similar to that in Fig. 2.
On the right side, the strong layers form initially shorter wavelength (due to their smaller thickness) buckle folds, in agreement with the dominant wavelength theory (e.g., Biot, 1961; Schmalholz and Mancktelow, 2016). In the simulations, where the upper strong layer rests directly below the cover (Fig. 9b, c), the top layer is being detached and transported in a similar fashion as in the reference model. The lower layer, on the other hand, forms a fold nappe first, with an extremely thinned inverse limb. Eventually, this inverse limb develops boudinage, and once necking takes place, it detaches from the basement. In the simulation, in which a weak unit is located between the upper strong layer and the cover (Fig. 9a), both layers form folds and detach from the basement horst by necking in the inverse limb.
Around the half-graben on the left, the deformation of the units is similar to the reference model, when weak units are located between the upper strong layer and the cover (Fig. 9a). The main difference with the reference simulation is that the weak unit located on top of the half-graben is sheared out, and both strong layers form a fold nappe with a more intensely stretched inverse limb. In the models, in which the upper strong layer is in direct contact with the cover (Fig. 9b, c), the drag from the overriding unit is sufficient to displace this layer considerably horizontally. Drag from the top shears the upper strong layer of the left half-graben above the basement to the left and it detaches the layer from the half-graben. As a result, buckle and shear folds form around the left tip of the layer (Fig. 9b). The upper strong layer starts moving subhorizontally without considerable internal deformation and eventually forms a rootless nappe. The lower strong layer of the half-graben stays mostly in place until the weak units are extruded from the half-graben due to its closure. Then, the lower strong layer forms a fold nappe, with a highly stretched inverse limb (Fig. 9b, c).
4.5 Impact of softening mechanisms
We also test the impact of two different softening mechanisms, activated in the reference simulation, that can enhance strain localization (Fig. 10). The first mechanism is thermal softening by shear heating due to the conversion of mechanical work into heat and the resulting decrease of the temperature-dependent viscosity (e.g., Yuen et al., 1978; Kaus and Podladchikov, 2006; Jaquet and Schmalholz, 2017; Kiss et al., 2019). Although this mechanism is activated in all simulations, for the applied 1 cm yr−1 convergence velocity, its impact on structure development is negligible. However, with 5 cm yr−1 convergence velocity, thermal softening is sufficient to cause spontaneous shear zone formation (Kiss et al., 2019). In the higher-velocity simulation, prominent ductile shear zones are formed in the cover that also promote more localized brittle deformation zones (Fig. 10a). Heat production in the ductile shear zone raises the temperature of the units close to the “back stop” on the right side of the model. Thus, at this location, the basement deformation is more intense, whereas the left half-graben in the basement is not being closed and the sediment fill is not being squeezed out (Fig. 10a).
Figure 10The geometry and the strain rate field of three simulations after approximately 30 % bulk shortening, with various softening mechanisms. Panels (a) and (b) show results of a simulation with a convergence rate of 5 cm yr−1, in which thermal softening has a significant impact. Panels (c) and (d) show results of a simulation with strain softening that reduces friction angle from the initial 30 to 5∘. Panels (e) and (f) show results of a simulation with strain softening that reduces friction angle from the initial 15 to 5∘.
The other considered softening mechanism is frictional–plastic strain softening. Such softening is frequently applied in numerical models of crustal deformation in order to enforce highly localized brittle deformation by decreasing the friction angle as a function of accumulated plastic strain (e.g., Buiter et al., 2006). Such softening algorithm induces mesh dependence of load-bearing capacities, but we apply it here for comparison (e.g., Buiter et al., 2006; Erdős et al., 2014; Ruh et al., 2014). We used two different parameter sets to model strain softening. In the first case (Fig. 10b), we start with a friction angle of 30∘ that we linearly decrease to 5∘ between an accumulated plastic strain of 0.5 and 1.5, which is a strain interval typically considered in geodynamic models with frictional strain softening (e.g., Erdős et al., 2014). Compared to the reference simulation, we observe strongly localized brittle deformation that is characterized by high angle (≫0∘ from horizontal) and small displacement (<10 km) overthrusts. This is the only simulation, where a strong back thrust forms over the right basin that also deforms the strong layer. In the second case (Fig. 10c), we start with a friction angle of 15∘ that we linearly decrease to 5∘ between accumulated plastic strain of 0.5 and 1.5. Such initially lower friction angle is often suggested to mimic fluid-pressure reduced effective friction angles (e.g., Erdős et al., 2014). In this simulation, the detachment mechanism of the strong layer from the right side of the horst is different from that in the reference simulation. The initial buckling and folding phase is entirely missing, and plastic yielding dominates from the beginning of deformation. Initially, the angle of thrusting is approximately 35∘ from the horizontal. Once a sufficient amount of weak units are sheared on top of the horst, the transport direction is subhorizontal. Similarly to the other simulations with significant softening mechanisms, the basement around the half-graben is only deformed to a small degree and the half-graben is not closed.
5.1 Numerical robustness
We investigated the impact of different numerical resolutions on the model results to test the robustness of these results. Such a test is important, because of weak and thin material between strong material can cause mechanical decoupling but only when resolved numerically. We compare the reference model with an original resolution of 3001 × 1001 (width × height) numerical grid points (initially 66 × 25 m grid spacing) with two simulations that have identical configuration and parameters but smaller resolutions of 1501 × 501 (initially 133 × 50 m) and 751 × 251 (initially 267 × 100 m). The resulting structures after 38 % of bulk shortening are essentially identical (Fig. 11). Similarly, the strain rate fields below the brittle–ductile transition are similar too. However, the strain rate distribution in the brittle part and around the brittle–ductile transition is resolution dependent (Fig. 11). This is typical for the applied non-associated plasticity scheme with the Drucker–Prager yield criterion, which is merely a stress limiter, inhibiting the stresses to exceed the failure limit. Thus, the exact geometry of the brittle–plastic shear bands is resolution dependent, but the effective load-bearing capacity of the brittle layer converges with increasing resolution (Yamato et al., 2019, their Appendix). Keeping in mind these limitations regarding the brittle–plastic deformation, the results in our main area of interest, that is, the ductile nappe stacking, are essentially independent on the resolution within the studied range. Hence, our results are numerically robust concerning the detachment, transport and stacking of nappes under dominantly ductile deformation.
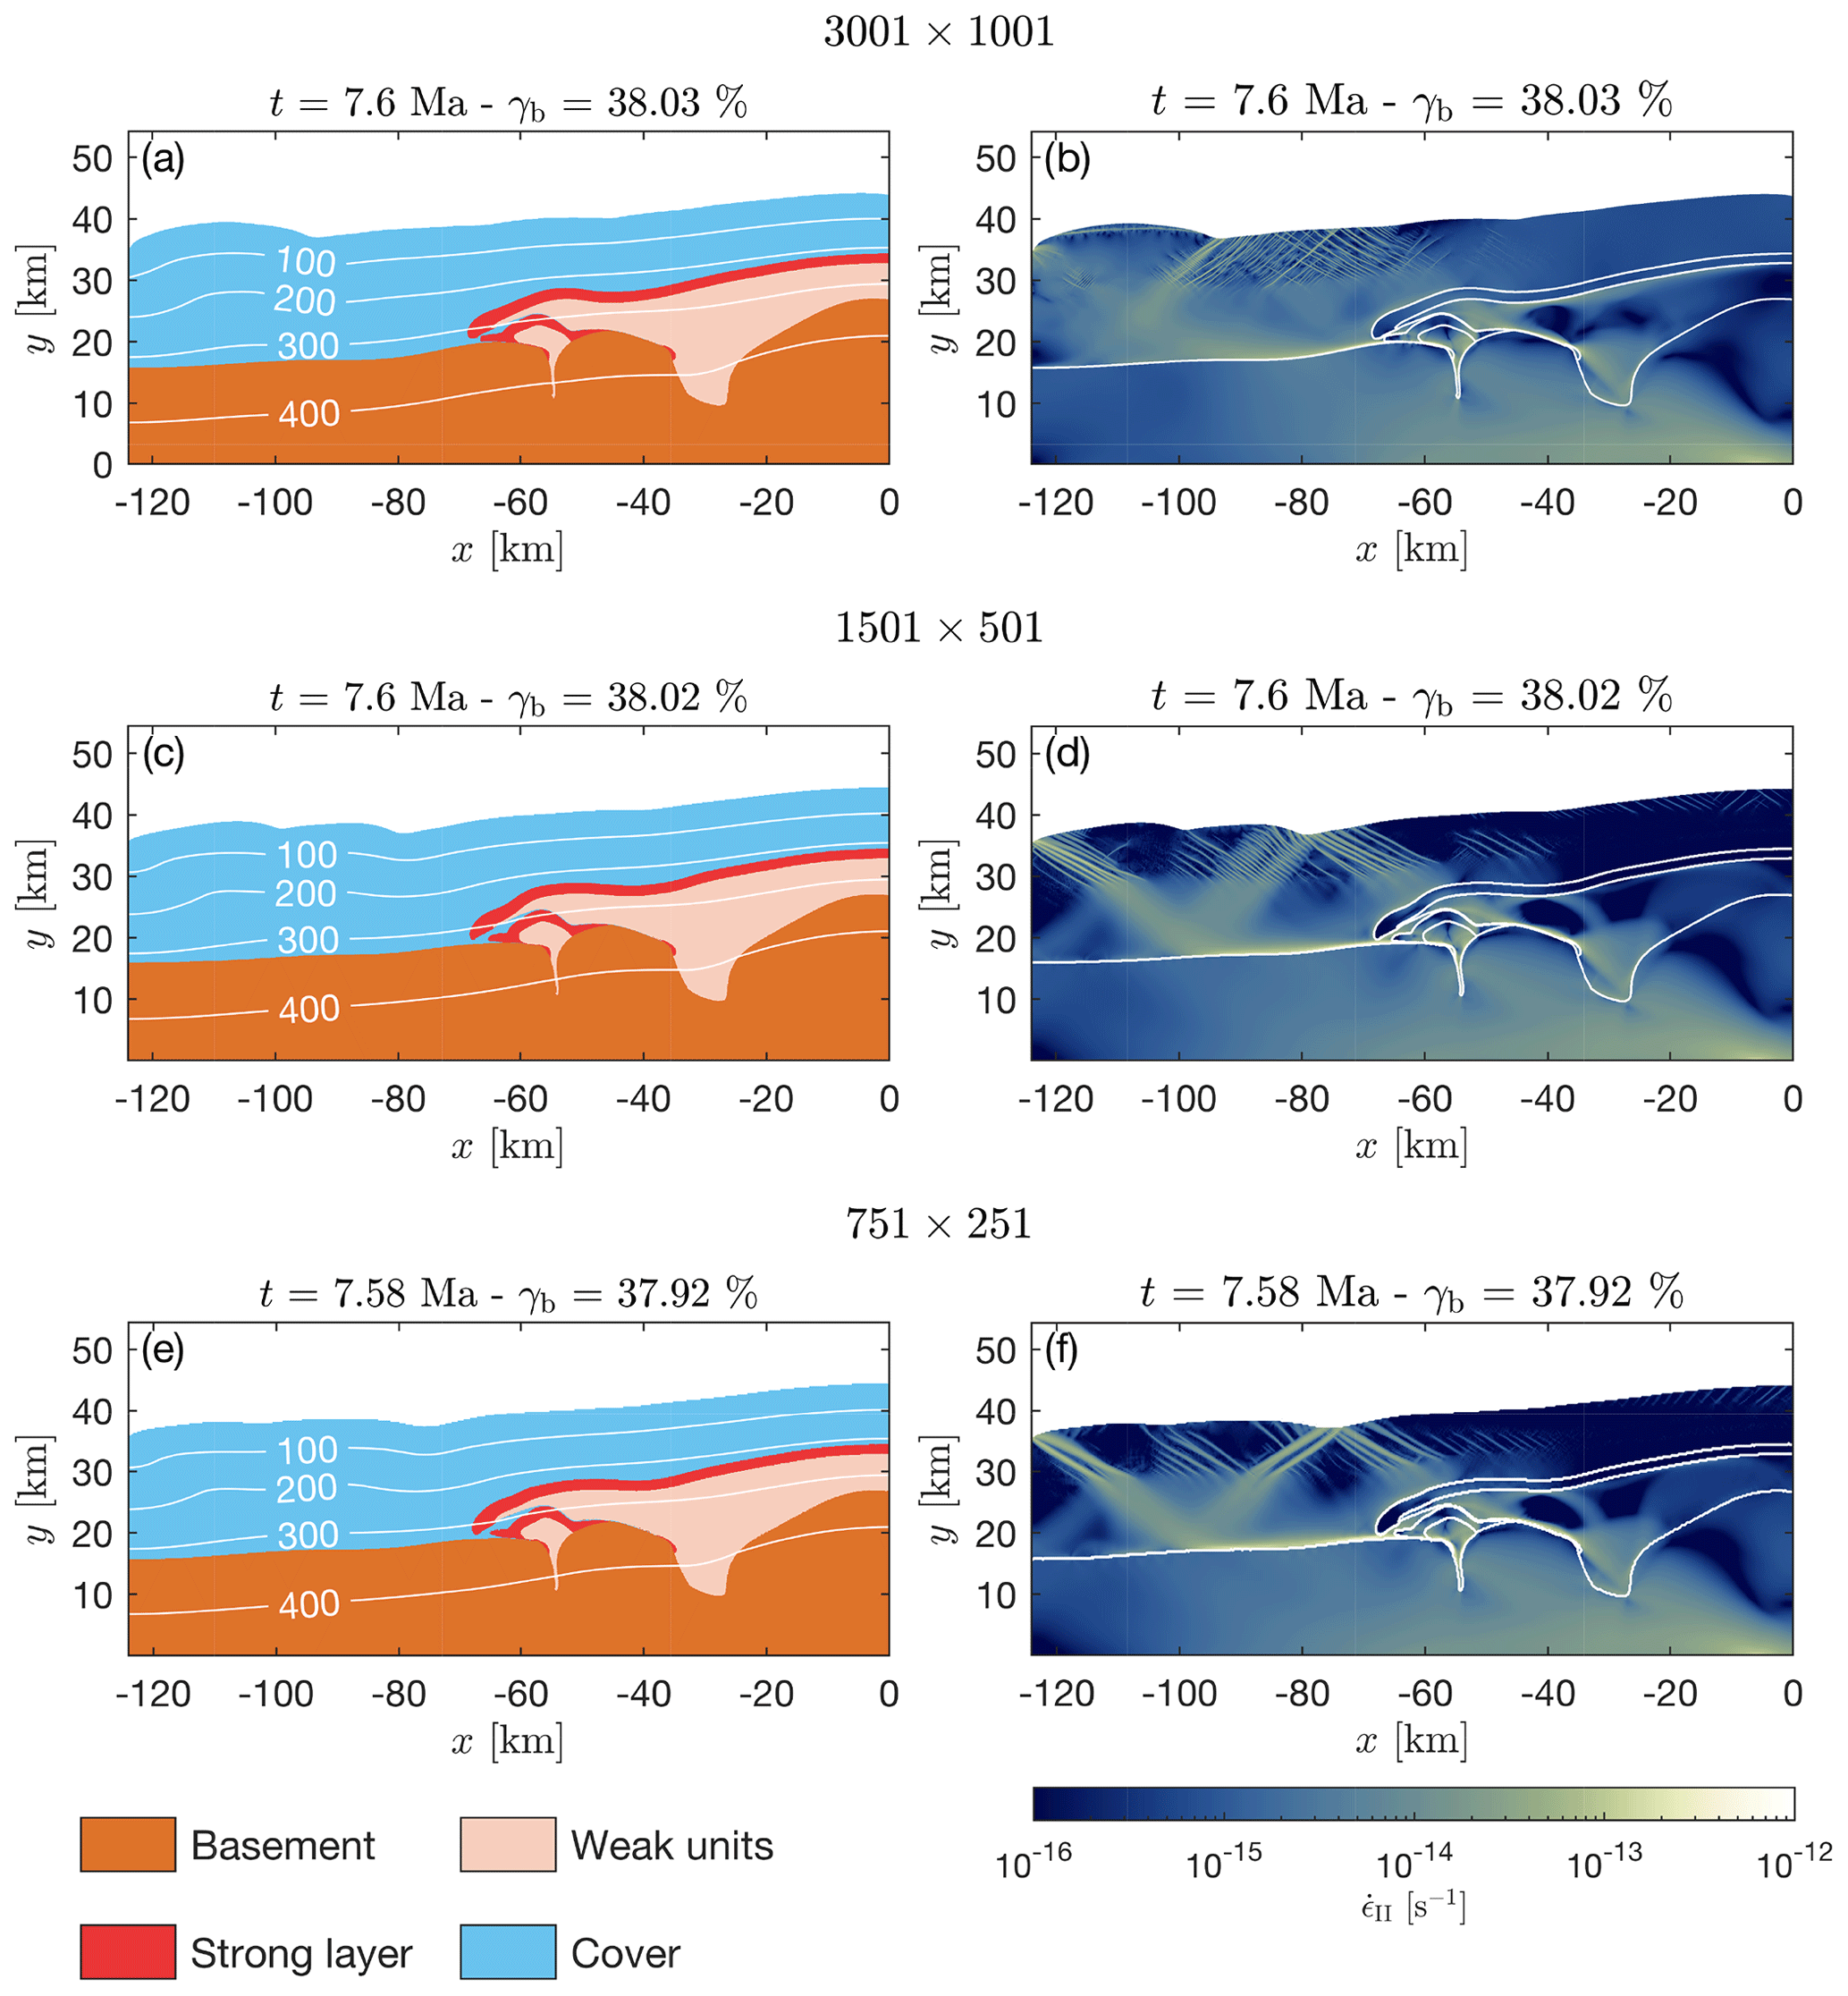
Figure 11The geometry and the strain rate field of three simulations after approximately 38 % bulk shortening for different numerical resolutions.
5.2 Comparison of the model results with the geological observations
There are several features of the Helvetic nappe system that we could successfully reproduce in our thermomechanical model. Similarly to Bauville and Schmalholz (2015), a structure resembling a fold nappe has been formed by the extrusion of the sedimentary fill from a half-graben. During formation of this fold nappe, the half-graben has been closed and the sediments squeezed between the two basements resemble the structure of the Chamonix zone located between the Aiguilles Rouges and Mont Blanc massifs (Fig. 1c). Hence, our model generated the first-order structural features (i.e., features larger than the applied numerical resolution of 66 × 25 m) of the Infrahelvetic complex in western Switzerland, namely a recumbent fold nappe with a root located between two deformed basement massifs. Additionally, our model reproduced the detachment and subhorizontal transport of sedimentary units from a passive margin. The thrust nappe, which originates from the basin on the right in our model, resembles the Wildhorn super-nappe. The horizontal transport of this thrust nappe is on the order of 30 km in the model. Furthermore, in the model, this thrust sheet is stacked above the fold nappe and the final model structure resembles a thrust nappe that is stacked above a fold nappe, as observed in the Helvetic nappe system. Moreover, there is a considerable amount of cover units entrapped between the fold nappe and the thrust sheet. The entrapped lower region of the cover unit resembles the Ultrahelvetic units, so that our model can explain how these Ultrahelvetic units have been entrapped between the Morcles fold nappe and the Wildhorn super-nappe (Fig. 1c). At the end of the simulated formation of the nappe system, the maximum temperature in the nappe system ranges between 250 and 350 ∘C. The Wildhorn nappe exhibits peak temperatures between 250 and 300 ∘C and the underlying Morcles nappe hotter peak temperatures between 290 and 350 ∘C, which is in broad agreement with the metamorphic peak temperatures of the Helvetic nappe system reported by Kirschner et al. (1996) and Ebert et al. (2007). In the simulations, the nappe stack is formed within approximately 8 Myr, which is also in broad agreement with the estimated time span of main formation of the Morcles fold nappe from approximately 28 to 17 Ma (Kirschner et al., 1995). The simulations with two thin strong layers, separated by weak units, can explain the significant parasitic, or second-order, folding of the two main carbonate units (Quinten and Urgonian limestone formations) which is observed in the Wildhorn super-nappe.
Some features of the Helvetic nappe system are not reproduced by the simulations. In the frontal part of the fold nappe, originating from the left half-graben, the front is first thrust out of the half-graben and the overturned limb develops subsequently. This deformation generates a “nose-like” structure in the frontal part of the fold nappe, which is not observed. However, a stress limiter in the basement favors the formation of a fold nappe without the “nose-like” structure, indicating that the stress contrast between the basement top and the strong layer has a first-order control on the developing fold nappe geometry. Also, in all simulations, the fold nappe has only a minor second-order folding, in contrast to the prominent parasitic folds of the Morcles nappe. In the numerical models, we likely overestimated the amount of shale-rich sediments in the basin on the right, mimicking the Helvetic basin, as the total volume of the Wildhorn super-nappe south of the Morcles nappes is much thinner than in the simulations. There was also a likely significant amount of vertical flattening, and presumably pressure solution related volume decrease, after the main phase of nappe formation and during the exhumation of the nappe system, which is not modeled in our simulations. Moreover, several basement shear zones have been mapped in the Aiguilles Rouges and in the Mont Blanc massifs, which are not present in the simulations. This is likely because (i) the straight bottom boundary of the model may prohibit any significant vertical displacement of the basement units and hence inhibit significant shear zone formation; (ii) the model basement is mechanically homogeneous and there are no heterogeneities that can trigger shear zone localization; and (iii) the amount of brittle–plastic deformation is underestimated in the basement. We considered a horizontal model base while during natural nappe formation the overall basement–cover interface was likely dipping, or tilting, in the direction of subduction (i.e., direction of basal velocity), so that a model base gently dipping towards the subduction direction zone be more realistic. The deformation at the base of our model is viscous, and the surface slope for evolving crustal wedges with a viscous base depends on the viscous shear stress at the base, whereby larger shear stresses are related to higher surface slopes (e.g., Ruh et al., 2012). Keeping the basal viscous shear stress the same, a tilting of the model base towards the subduction zone would reduce the surface slope. Therefore, in our models, the surface slopes towards the foreland (left) region represent high end-member surface slopes so that effects of gravity-related forces directed towards the foreland region are on the higher end.
Finally, the applied “numerical sandbox” model configuration and velocity boundary conditions constrain the deformation in the model domain. During the large-scale dynamics of Alpine orogenic wedge formation, the straight bottom and right model boundaries do not exist. Processes such as laterally varying vertical isostatic adjustment, flexure due to subduction and back thrusting, or back folding generate geodynamic conditions for the formation of the Helvetic nappe system which are clearly more dynamic and complex than implied by the considered model configuration. Lithospheric scale numerical models can self-consistently model the generation of orogenic wedges and major crustal shear zones, including effects of isostasy, flexure and back folding (e.g., Erdős et al., 2014, 2019; Jaquet et al., 2018; Jourdon et al., 2019). With higher numerical resolution, such lithosphere models may eventually be able to resolve the upper crustal deformation with a resolution as applied in our model. Hence, the impact of isostasy and flexure on the presented results and the formation of the Helvetic nappe system can be tested eventually with larger-scale models.
5.3 Tectonic inheritance, mechanical heterogeneities and potential softening mechanisms
Geological reconstructions of the Helvetic nappe system showed the correlation of the nappes with their original positions along the pre-Alpine European passive margin, which was characterized by half-grabens and horsts (e.g., Epard, 1990; Boutoux et al., 2014). In agreement with previous modeling studies (e.g., Beaumont et al., 2000; Wissing and Pfiffner, 2003; Bellahsen et al., 2012; Lafosse et al., 2016; Bauville and Schmalholz, 2017), our results suggest that tectonic inheritance in the form of half-grabens and horsts has a strong impact on the development of fold and thrust nappes during crustal deformation. Our results indicate that two types of tectonic inheritance are important, namely the geometry and the magnitude of mechanical heterogeneities. The geometry of half-grabens and horsts controls the location of nappe initiation (Bauville and Schmalholz, 2017). The basement and sediments must, of course, have different mechanical strength; otherwise, the geometry of the basement would be unimportant. Our results suggest that tectonic inheritance was necessary to the evolution of the Helvetic nappe system but not sufficient. The results show that specific strength contrast between basement and sediments and within the sediments is required to model nappe structures resembling those of the Helvetic nappe system (Figs. 6 and 7). The reference simulation exhibits an effective viscosity contrast between weak units and strong layer and basement on the order of 3–4 orders of magnitude (Fig. 7a). Although the effective viscosity in the basement and strong layer is on the order of 1024 Pa s, the stresses in the basement and strong layer are far below the brittle–plastic yield stress and typically smaller than 100 MPa (Fig. 4). If the effective viscosity contrast between strong layer and basement is not large enough, then the sediments of the basin on the right side are not detached in the manner of a thrust sheet (Fig. 6a). One possibility to enforce detachment for smaller viscosity contrasts is the application of plastic strain softening and/or initially reduced friction angles (Fig. 10b and c). Application of strain softening favors the formation of thrust sheets in the models but prohibits the formation of fold nappes (Fig. 10b and c). The importance of tectonic inheritance and the pre-Alpine configuration on the nappe formation underlines the importance of considering geological field work and associated geological reconstructions for the model configuration, because only such field-based reconstructions can provide estimates for the pre-Alpine configurations. Our results are consistent with those of Duretz et al. (2011), which showed that inherited mechanical heterogeneities, promoting large lateral strength contrast, are essential to trigger exhumation of lower crustal granulites as observed in the Bohemian Massif. Generally, our results are consistent with a variety of studies, which show the importance of structural inversion of extensional systems during compressional deformation and are based on geological field observation, analogue deformation experiments and numerical models (e.g., Gillcrist et al., 1987; Buiter and Adrian Pfiffner, 2003; Buiter et al., 2009; Bellahsen et al., 2012; Bonini et al., 2012; Lafosse et al., 2016; Granado and Ruh, 2019).
For the model configuration, a significant localization due to thermal softening does not occur for a convergence velocity of 1 cm yr−1, but it does for 5 cm yr−1. Average convergence velocities during the Alpine orogeny are typically estimated to be on the order of 1 cm yr−1 (Schmid et al., 1996). However, some short periods with higher convergence velocities cannot be excluded. So, if there were short periods during the formation of the Helvetic nappe system with convergence velocities larger than approximately 5 cm yr−1, then thermal softening might have been important.
There is field evidence for grain size reduction associated with mylonitic shear zones at the base of nappes in the Helvetic nappe system (e.g., Ebert et al., 2007, 2008). We did not consider the microscale grain size reduction in our models for several reasons. First, the major mylonitic shear zones with significant grain size reduction have a thickness on the order of 10 m. Although we use high-resolution models, we have a numerical grid size of approximately 66×25 m; hence, this resolution is still not large enough to resolve the internal deformation within shear zones having thickness of 10 m. Second, recent numerical simulations including grain size reduction and combined diffusion and dislocation creep flow laws suggest that grain size reduction does not have a dramatic impact on strain localization (Schmalholz and Duretz, 2017), which is in agreement with theoretical results of Montési and Zuber (2002). The reason is that a piezometer-type stress to grain size relation, when substituted into a grain-size-sensitive diffusion creep flow law, generates a power-law-type flow law with stress exponents similar to the one of the corresponding dislocation creep flow law (e.g., Montési and Zuber, 2002). However, other studies argue that microscale processes such as coupled grain evolution and damage mechanisms can generate significant strain localization and that these mechanisms have been responsible for generating subduction and plate tectonics (e.g., Bercovici and Ricard, 2014). Therefore, future simulations should consider such coupled microscale processes in order to quantify their importance on the first-order tectonic nappe detachment, overthrusting and stacking.
Our 2-D thermomechanical simulations support geological interpretations arguing that tectonic and structural inheritance controlled the tectonic evolution and resulting first-order structures in the Helvetic nappe system. We show that both the geometry and magnitude of mechanical heterogeneities, representing the tectonic and structural inheritance, control the nappe formation. The two main heterogeneities are caused by the laterally varying basement–cover interface, which is characterized by half-grabens and horsts, and by the vertical alternation of sedimentary layers with different mechanical strength. If these heterogeneities are included in numerical simulations, based on continuum thermomechanics, with standard creep flow laws and with Drucker–Prager and von Mises yield criteria, then the simulations can produce the first-order features of nappe detachment, transport and stacking in the Helvetic nappe system. In our models, an effective viscosity contrast of approximately 3–4 orders of magnitude between weak sediments and strong sediments and basement is essential to reproduce the first-order tectonic features. Furthermore, our results suggest that it is not essential to consider additional rock mechanic processes, in addition to the applied creep and brittle–plastic deformation, such as grain size evolution, frictional strain softening or pore fluid pressurization in order to explain these first-order features, although all these additional processes most likely occurred during the formation of the Helvetic nappe system. Therefore, our model requires likely the least amount of assumptions concerning rock deformation mechanisms for the explanation of the first-order features of the Helvetic nappe system.
Based on the first-order agreement between our model results and natural data, we propose a thermomechanics-based interpretation for the tectonic evolution of the Helvetic nappe system of western Switzerland. The pre-Alpine European passive margin was characterized by significant mechanical heterogeneities due to a basement–cover contact with half-grabens and horst, and due to the alternation of mechanically strong and weak sediment units. During the continental collision, the passive margin was deformed by external compressive stresses. During deformation, mechanical heterogeneities, and not material softening mechanisms, control the detachment, transport and stacking of nappes. Detachment of sedimentary units of the Wildhorn super-nappe is caused by stress concentrations around the contact between basement and sediments. The transport of the Wildhorn super-nappe was facilitated by weak shale-rich units and weak Ultrahelvetic units, which have been entrapped from above to below the Wildhorn super-nappe. Formation of the Morcles fold nappe is associated with the closing of a half-graben, bounded by basement massifs that form now the Aiguilles Rouges and Mont Blanc massifs, and the associated squeezing out of sediments from this half-graben. Closing of the half-graben occurred by an overall distributed deformation without major reactivation of earlier half-graben normal faults and without major localized thrusting in the basement.
The data used in this paper are available upon request by Daniel Kiss.
The supplement related to this article is available online at: https://doi.org/10.5194/se-11-287-2020-supplement.
DK carried out the numerical simulations, visualized and interpreted the results, and prepared the first draft. TD developed the numerical algorithm, implemented the model configuration, and contributed to the visualization, interpretation and presentation of the results. SMS designed the original research project and contributed to the visualization, interpretation and presentation of the results.
The authors declare that they have no conflict of interest.
We are grateful for the constructive reviews by Luca Dal Zilio and Patrice Rey. This work was supported by SNF grant no. 200020-149380 and the University of Lausanne.
This research has been supported by the Swiss National Science Foundation (grant no. 200020-149380) and the University of Lausanne.
This paper was edited by Patrice Rey and reviewed by Luca Dal Zilio and Patrice Rey.
Argand, E.: Sur l'arc des Alpes occidentales, edited by: Bridel, G., 1916. a
Bailey, E. B.: Tectonic essays: mainly Alpine, edited by: Clarendon, P., 1935. a
Bauville, A. and Schmalholz, S. M.: Transition from thin-to thick-skinned tectonics and consequences for nappe formation: Numerical simulations and applications to the Helvetic nappe system, Switzerland, Tectonophysics, 665, 101–117, 2015. a, b
Bauville, A. and Schmalholz, S. M.: Tectonic inheritance and kinematic strain localization as trigger for the formation of the Helvetic nappes, Switzerland, Swiss J. Geosci., 110, 523–534, 2017. a, b, c, d
Bauville, A., Epard, J.-L., and Schmalholz, S. M.: A simple thermo-mechanical shear model applied to the Morcles fold nappe (Western Alps), Tectonophysics, 583, 76–87, 2013. a, b, c
Beaumont, C., Muñoz, J. A., Hamilton, J., and Fullsack, P.: Factors controlling the Alpine evolution of the central Pyrenees inferred from a comparison of observations and geodynamical models, J. Geophys. Res.-Sol. Ea., 105, 8121–8145, 2000. a
Bellahsen, N., Jolivet, L., Lacombe, O., Bellanger, M., Boutoux, A., Garcia, S., Mouthereau, F., Le Pourhiet, L., and Gumiaux, C.: Mechanisms of margin inversion in the external Western Alps: Implications for crustal rheology, Tectonophysics, 560, 62–83, 2012. a, b, c
Bercovici, D. and Ricard, Y.: Plate tectonics, damage and inheritance, Nature, 508, 513, 2014. a
Bertrand, M.: Rapports de structure des Alpes de Glaris et du bassin houiller du Nord, B. Soc. Geol. Fr., 3, 318–330, 1884. a
Biot, M. A.: Theory of folding of stratified viscoelastic media and its implications in tectonics and orogenesis, Geol. Soc. Am. Bull., 72, 1595–1620, 1961. a
Bonini, M., Sani, F., and Antonielli, B.: Basin inversion and contractional reactivation of inherited normal faults: A review based on previous and new experimental models, Tectonophysics, 522, 55–88, 2012. a
Boutonnet, E., Leloup, P. H., Sassier, C., Gardien, V., and Ricard, Y.: Ductile strain rate measurements document long-term strain localization in the continental crust, Geology, 41, 819–822, 2013. a
Boutoux, A., Bellahsen, N., Lacombe, O., Verlaguet, A., and Mouthereau, F.: Inversion of pre-orogenic extensional basins in the external Western Alps: structure, microstructures and restoration, J. Struct. Geol., 60, 13–29, 2014. a, b, c
Boyer, S. E. and Elliott, D.: Thrust systems, Aapg Bull., 66, 1196–1230, 1982. a
Bucher, W. H.: Role of gravity in orogenesis, Geol. Soc. Am. Bull., 67, 1295–1318, 1956. a
Buiter, S. J. and Adrian Pfiffner, O.: Numerical models of the inversion of half-graben basins, Tectonics, 22, 2003. a
Buiter, S. J., Babeyko, A. Y., Ellis, S., Gerya, T. V., Kaus, B. J., Kellner, A., Schreurs, G., and Yamada, Y.: The numerical sandbox: comparison of model results for a shortening and an extension experiment, Geological Society, London, Special Publications, 253, 29–64, 2006. a, b, c, d
Buiter, S. J., Pfiffner, O. A., and Beaumont, C.: Inversion of extensional sedimentary basins: A numerical evaluation of the localisation of shortening, Earth Planet. Sc. Lett., 288, 492–504, 2009. a
Casey, M. and Dietrich, D.: Overthrust shear in mountain building, in: Evolution of Geological Structures in Micro-to Macro-scales, Springer, 119–142, 1997. a
Crameri, F.: Scientific colour-maps, 2018. a
Dal Piaz, G. V.: History of tectonic interpretations of the Alps, J. Geodynam., 32, 99–114, 2001. a
Dietrich, D. and Casey, M.: A new tectonic model for the Helvetic nappes, Geological Society, London, Special Publications, 45, 47–63, 1989. a
Duretz, T., Kaus, B., Schulmann, K., Gapais, D., and Kermarrec, J.-J.: Indentation as an extrusion mechanism of lower crustal rocks: Insight from analogue and numerical modelling, application to the Eastern Bohemian Massif, Lithos, 124, 158–168, https://doi.org/10.1016/j.lithos.2010.10.013, 2011. a
Duretz, T., May, D., and Yamato, P.: A free surface capturing discretization for the staggered grid finite difference scheme, Geophys. J. Int., 204, 1518–1530, https://doi.org/10.1093/gji/ggv526, 2016. a, b
Durney, D.: Some observations concerning the question of gravity gliding and hinterland compression in the Western Helvetic nappes, in: Int. Conf. on Planar and Linear Fabrics of Deformed Rocks, Zurich, Abstract, p. 92, 1982. a
Ebert, A., Herwegh, M., Evans, B., Pfiffner, A., Austin, N., and Vennemann, T.: Microfabrics in carbonate mylonites along a large-scale shear zone (Helvetic Alps), Tectonophysics, 444, 1–26, 2007. a, b, c, d
Ebert, A., Herwegh, M., Berger, A., and Pfiffner, A.: Grain coarsening maps for polymineralic carbonate mylonites: a calibration based on data from different Helvetic nappes (Switzerland), Tectonophysics, 457, 128–142, 2008. a, b, c, d
Epard, J. L.: La nappe de Morcles au sud-ouest du Mont-Blanc, Ph.D. thesis, Université de Lausanne, 1990. a, b
Epard, J.-L. and Escher, A.: Transition from basement to cover: a geometric model, J. Struct. Geol., 18, 533–548, 1996. a, b, c, d
Erdős, Z., Huismans, R. S., van der Beek, P., and Thieulot, C.: Extensional inheritance and surface processes as controlling factors of mountain belt structure, J. Geophys. Res.-Sol. Ea., 119, 9042–9061, 2014. a, b, c, d, e
Erdős, Z., Huismans, R. S., and van der Beek, P.: Control of increased sedimentation on orogenic fold-and-thrust belt structure – insights into the evolution of the Western Alps, Solid Earth, 10, 391–404, https://doi.org/10.5194/se-10-391-2019, 2019. a
Escher, A., Masson, H., and Steck, A.: Nappe geometry in the western Swiss Alps, J. Struct. Geol., 15, 501–509, 1993. a, b, c, d, e
Escher von der Linth, A.: Geologische Carte des cantons Glarus und seiner Umgebung, nebst Profilen, Verhandlungen der Naturforschenden Gesellschaft in Zürich, 52–62, 1841. a
Fagereng, Å. and Biggs, J.: New perspectives on ‘geological strain rates’ calculated from both naturally deformed and actively deforming rocks, J. Struct. Geol., 2018. a
Gerya, T. V. and Yuen, D. A.: Characteristics-based marker-in-cell method with conservative finite-differences schemes for modeling geological flows with strongly variable transport properties, Phys. Earth Planet. In., 140, 293–318, 2003. a
Gillcrist, R., Coward, M., and Mugnier, J.-L.: Structural inversion and its controls: examples from the Alpine foreland and the French Alps, Geodin. Acta, 1, 5–34, 1987. a, b, c
Goguel, J.: Introduction à l'étude mécanique des déformations de l'écorce terrestre: par Jean Goguel, 2e édition, Impr. nationale, 1948. a
Granado, P. and Ruh, J. B.: Numerical modelling of inversion tectonics in fold-and-thrust belts, Tectonophysics, 763, 14–29, 2019. a, b
Hansen, F. D. and Carter, N. L.: Semibrittle creep of dry and wet Westerly granite at 1000 MPa, in: The 24th US Symposium on Rock Mechanics (USRMS), American Rock Mechanics Association, 1983. a
Heim, A.: Die vermeintliche “Gewölbeumbiegung des Nordflügels der Glarner Doppelfalte” südlich vom Klausenpass, eine Selbstkorrektur, Vjsch. Natf. Ges. Zurich., 51, 403–431, 1906. a
Herwegh, M. and Pfiffner, O.-A.: Tectono-metamorphic evolution of a nappe stack: A case study of the Swiss Alps, Tectonophysics, 404, 55–76, 2005. a
Herwegh, M., Linckens, J., Ebert, A., Berger, A., and Brodhag, S.: The role of second phases for controlling microstructural evolution in polymineralic rocks: A review, J. Struct. Geol., 33, 1728–1750, 2011. a
Jaquet, Y. and Schmalholz, S. M.: Spontaneous ductile crustal shear zone formation by thermal softening and related stress, temperature and strain rate evolution, Tectonophysics, 2017. a
Jaquet, Y., Bauville, A., and Schmalholz, S. M.: Viscous overthrusting versus folding: 2-D quantitative modeling and its application to the Helvetic and Jura fold and thrust belts, J. Struct. Geol., 62, 25–37, 2014. a
Jaquet, Y., Duretz, T., Grujic, D., Masson, H., and Schmalholz, S. M.: Formation of orogenic wedges and crustal shear zones by thermal softening, associated topographic evolution and application to natural orogens, Tectonophysics, 746, 512–529, 2018. a
Jourdon, A., Le Pourhiet, L., Mouthereau, F., and Masini, E.: Role of rift maturity on the architecture and shortening distribution in mountain belts, Earth Planet. Sc. Lett., 512, 89–99, 2019. a
Kaus, B. J. and Podladchikov, Y. Y.: Initiation of localized shear zones in viscoelastoplastic rocks, J. Geophys. Res.-Sol. Ea., 111, 2006. a
King Hubbert, M. and Rubey, W. W.: Role of Fluid Pressure in Mechanics of Overthrust Faulting, Geol. Soc. Am. Bull., 70, 115, https://doi.org/10.1130/0016-7606(1959)70[115:ROFPIM]2.0.CO;2, 1959. a
Kirschner, D. L., Sharp, Z. D., and Masson, H.: Oxygen isotope thermometry of quartz-calcite veins: Unraveling the thermal-tectonic history of the subgreenschist facies Morcles nappe (Swiss Alps), Geol. Soc. Am. Bull., 107, 1145–1156, 1995. a, b, c
Kirschner, D. L., Cosca, M. A., Masson, H., and Hunziker, J. C.: Staircase 40Ar ∕ 39Ar spectra of fine-grained white mica: Timing and duration of deformation and empirical constraints on argon diffusion, Geology, 24, 747–750, 1996. a, b, c
Kiss, D., Podladchikov, Y., Duretz, T., and Schmalholz, S. M.: Spontaneous generation of ductile shear zones by thermal softening: Localization criterion, 1D to 3D modelling and application to the lithosphere, Earth Planet. Sc. Lett., 519, 284–296, 2019. a, b
Kronenberg, A. K., Kirby, S. H., and Pinkston, J.: Basal slip and mechanical anisotropy of biotite, J. Geophys. Res.-Sol. Ea., 95, 19257–19278, 1990. a
Lafosse, M., Boutoux, A., Bellahsen, N., and Le Pourhiet, L.: Role of tectonic burial and temperature on the inversion of inherited extensional basins during collision, Geol. Mag., 153, 811–826, 2016. a, b
Lugeon, M.: Les grandes nappes de recouvrement des Alpes du Chablais et de la Suisse, B. Soc. Geol. Fr., 4, 723, 1902. a
Mase, G. E. and Mase, G.: Continuum mechanics, Vol. 970, McGraw-Hill New York, 1970. a
Masson, H.: Un siècle de géologie des Préalpes: de la découverte des nappes à la recherche de leur dynamique, Eclogae Geol. Helv., 69, 527–575, 1976. a
Masson, H., Herb, R., Steck, A., and Ayrton, S. N.: Helvetic Alps of Western Switzerland. Société helvétique des sciences naturelles, Commission géologique, Wepf and Company, in: Geology of Switzerland: Geological excursions, edited by: Trümpy, R., Aubert, D., and Bernoulli, D., Vol. 10, Wepf, 1980. a, b, c
Merle, O.: Strain models within spreading nappes, Tectonophysics, 165, 57–71, 1989. a, b
Merle, O.: Emplacement mechanisms of nappes and thrust sheets, Vol. 9, Springer Science & Business Media, 1998. a, b
Merle, O. and Guillier, B.: The building of the Central Swiss Alps: an experimental approach, Tectonophysics, 165, 41–56, 1989. a
Montési, L. G. and Zuber, M. T.: A unified description of localization for application to large-scale tectonics, J. Geophys. Res.-Sol. Ea., 107, 2002. a, b
Murchison, R. I.: On the Geological Structure of the Alps, Apennines and Carpathians, more especially to prove a transition from Secondary to Tertiary rocks, and the development of Eocene deposits in Southern Europe, Q. J. Geol. Soc., 5, 157–312, 1849. a
Pfiffner, O. A.: The structure of the Helvetic nappes and its relation to the mechanical stratigraphy, J. Struct. Geol., 15, 511–521, 1993. a, b, c
Pfiffner, O. A.: Geology of the Alps, John Wiley & Sons, 2014. a
Pfiffner, O.-A. and Ramsay, J.: Constraints on geological strain rates: arguments from finite strain states of naturally deformed rocks, J. Geophys. Res.-Sol. Ea., 87, 311–321, 1982. a
Pfiffner, O.-A., Burkhard, M., Hänni, R., Kammer, A., Kligfield, R., Mancktelow, N., Menkveld, J., Ramsay, J., Schmid, S., and Zurbriggen, R.: Structural map of the Helvetic zone of the Swiss Alps, including Vorarlberg (Austria) and Haute Savoie (France), 2011. a, b, c, d
Poirier, J.: Shear localization and shear instability in materials in the ductile field, J. Struct. Geol., 2, 135–142, 1980. a
Poulet, T., Veveakis, M., Herwegh, M., Buckingham, T., and Regenauer-Lieb, K.: Modeling episodic fluid-release events in the ductile carbonates of the Glarus thrust, Geophys. Res. Lett., 41, 7121–7128, 2014. a, b, c
Price, N. J. and McClay, K. R.: Thrust and nappe tectonics, Geol. Soc. Lond., 1981. a, b
Ramsay, J. G., Casey, M., and Kligfield, R.: Role of shear in development of the Helvetic fold-thrust belt of Switzerland, Geology, 11, 439–442, 1983. a, b
Rubey, W. W. and King Hubbert, M.: Role of fluid pressure in mechanics of overthrust faulting: II. Overthrust belt in geosynclinal area of western Wyoming in light of fluid-pressure hypothesis, Geol. Soc. Am. Bull., 70, 167–206, 1959. a, b
Ruh, J. B., Kaus, B. J., and Burg, J.-P.: Numerical investigation of deformation mechanics in fold-and-thrust belts: Influence of rheology of single and multiple décollements, Tectonics, 31, 2012. a
Ruh, J. B., Gerya, T., and Burg, J.-P.: 3D effects of strain vs. velocity weakening on deformation patterns in accretionary wedges, Tectonophysics, 615, 122–141, 2014. a, b
Schaer, J.-P.: Swiss and Alpine geologists between two tectonic revolutions, Part 1: from the discovery of nappes to the hypothesis of continental drift, Swiss J. Geosci., 103, 503–522, 2010. a
Schardt, H.: Sur l'origine des Préalpes romandes Zone du Chablais et du Stockhorn, 1893. a, b
Schmalholz, S. M. and Duretz, T.: Impact of grain size evolution on necking in calcite layers deforming by combined diffusion and dislocation creep, J. Struct. Geol., 103, 37–56, 2017. a
Schmalholz, S. M. and Mancktelow, N. S.: Folding and necking across the scales: a review of theoretical and experimental results and their applications, Solid Earth, 7, 1417–1465, https://doi.org/10.5194/se-7-1417-2016, 2016. a
Schmalholz, S. M., Duretz, T., Hetényi, G., and Medvedev, S.: Distribution and magnitude of stress due to lateral variation of gravitational potential energy between Indian lowland and Tibetan plateau, Geophys. J. Int., 216, 1313–1333, 2019. a
Schmid, S., Boland, J., and Paterson, M.: Superplastic flow in finegrained limestone, Tectonophysics, 43, 257–291, 1977. a
Schmid, S. M., Pfiffner, O.-A., Froitzheim, N., Schönborn, G., and Kissling, E.: Geophysical-geological transect and tectonic evolution of the Swiss-Italian Alps, Tectonics, 15, 1036–1064, 1996. a
Smoluchowski, M.: II. – Some Remarks on the Mechanics of Overthrusts, Geol. Mag., 6, 204–205, 1909. a
Steck, A.: Carte tectonique des Alpes de Suisse occidentale et des régions avoisinantes, Service hydrologique et géologique national, 1999. a, b, c
Termier, P.: La synthèse géologique des Alpes, 1906. a, b
Termier, P.: A la glorie de la terre: souvenirs d'un geologue, 1922. a
Tollmann, A.: Grundprinzipien der alpinen Deckentektonik, Deuticke, 1973. a
Trümpy, R.: Geology of Switzerland: An outline of the geology of Switzerland, Interbook, 1980. a, b
Trümpy, R.: The Glarus nappes: A controversy of a century ago, in: Modern Controversies in Geology, Proceedings of the Hsu Symposium, edited by: Muller, D. W., McKenzie, J. A., and Weissert, H., Academic Press, London, 385–404, 1991. a
Turcotte, D. and Schubert, G.: Geodynamics, Cambridge university press, 2014. a
Voight, B.: Mechanics of thrust faults and decollement, Vol. 32, Halsted Press, 1976. a
Wissing, S. and Pfiffner, O.-A.: Numerical models for the control of inherited basin geometries on structures and emplacement of the Klippen nappe (Swiss Prealps), J. Struct. Geol., 25, 1213–1227, 2003. a, b
Yamato, P., Duretz, T., and Angiboust, S.: Brittle/ductile deformation of eclogites: insights from numerical models, Geochem. Geophy. Geosy., 2019. a
Yuen, D., Fleitout, L., Schubert, G., and Froidevaux, C.: Shear deformation zones along major transform faults and subducting slabs, Geophys. J. Int., 54, 93–119, 1978. a