the Creative Commons Attribution 4.0 License.
the Creative Commons Attribution 4.0 License.
Fault reactivation by gas injection at an underground gas storage off the east coast of Spain
Antonio Villaseñor
Robert B. Herrmann
Beatriz Gaite
Arantza Ugalde
During September–October of 2013 an intense swarm of earthquakes occurred off the east coast of Spain associated with the injection of the base gas in an offshore underground gas storage. Two weeks after the end of the injection operations, three moderate-sized earthquakes (Mw 4.0–4.1) occurred near the storage. These events were widely felt by the nearby population, leading to the indefinite shut-down of the facility. Here we investigate the source parameters (focal depth and mechanism) of the largest earthquakes in the sequence in order to identify the faults reactivated by the gas injection and to help understand the processes that caused the earthquakes. Our waveform modeling results indicate that the largest earthquakes occurred at depths of 6–8 km beneath the sea floor, significantly deeper than the injection depth (∼1800 m). Although we cannot undoubtedly discriminate the fault plane from the two nodal planes of the mechanisms, most evidence seems to favor a NW–SE-striking fault plane. We propose that the gas injection reactivated faults in the Paleozoic basement, with regional orientation possibly inherited from the opening of the Valencia Trough.
- Article
(3532 KB) - Full-text XML
-
Supplement
(1683 KB) - BibTeX
- EndNote
Induced seismicity is a growing hazard, as industrial activities that involve the injection and/or extraction of fluids become more common and closer to populated areas. A recent episode of induced seismicity (September–October 2013) occurred at the CASTOR underground gas storage (UGS). The CASTOR UGS was redeveloped in the depleted Amposta oil field (Seeman et al., 1990) located 22 km off the east coast of Spain, south of the Ebro Delta (Fig. 1). Water depth at the location of the storage is 61 m. At the time of the earthquake sequence, the seismic monitoring network for the facility consisted only of two short-period stations located inland (>25 km distance from the UGS) and was complemented by existing stations from other regional networks (Fig. 1). No ocean bottom seismometer (OBS) was located close to the platform. This poor monitoring configuration, lacking nearby stations, made it difficult to locate earthquakes accurately and particularly to constrain their focal depths. A previous study (Cesca et al., 2014) found shallow focal depths for most of the earthquakes (approximately 2 km), consistent with the injection depth of ∼1.8 km. More recently Gaite et al. (2016) obtained new locations using a 3-D model developed for the study region and refined arrival time picks through waveform cross correlation. As a result of this analysis they obtained focal depths centered at 6 km. Saló et al. (2017) have also obtained focal mechanisms whose depths are similar to those of Gaite et al. (2016). Finally Juanes et al. (2017) found depths slightly shallower than 5 km using a 1-D flat layered model and a range of deeper depths when using a 3-D model. This discrepancy between studies is small considering the errors associated with locations based on arrival times alone, particularly when there are no nearby stations to the earthquakes as in this case. However, the difference is significant in terms of the processes responsible for the seismicity and for the identification of the reactivated faults. Shallow focal depths could indicate that the earthquakes were induced directly by the gas injection. On the other hand, deeper focal depths would suggest that the events were triggered in more distant faults that were critically stressed, either by pore-pressure changes or other mechanisms (Ellsworth, 2013; Bhattacharya and Viesca, 2019). While deeper events represent a lower hazard for the seal of the storage, they could potentially be of larger magnitude and affect the facility and nearby population.
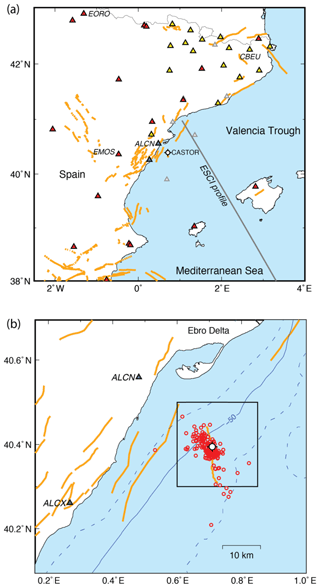
Figure 1(a) Location of the CASTOR UGS (white circle) and permanent seismic stations in the study region. Blue triangles: Ebro Observatory (network code EB); red triangles: IGN (ES); yellow triangles: ICGC (CA); grey triangles: permanent stations not used (not available, not operating at the time, or with instrumentation problems). Station codes of stations cited in the text are labeled. (b) Zoom-in of the region of the CASTOR UGS showing bathymetry in meters (dashed lines are every 25 m), and earthquake locations of the 2013 sequence (red circles), relocated by Gaite et al. (2016). The black box indicates the region shown in Fig. 6.
Therefore, in order to better constrain focal depths, we have used the sensitivity of seismic waveforms to focal depth. We first determined moment tensors for the largest earthquakes in the sequence using full-waveform inversion and then modeled high-frequency crustal reverberations in seismograms recorded at a nearby station.
For this study, we collected digital seismograms for the largest events in the earthquake sequence recorded on all existing stations in the region. This included all broadband stations in Spain including the Balearic Islands and also short-period stations near the CASTOR UGS (Fig. 1). The broadband data set consists mainly of stations from permanent networks operated by the Instituto Geográfico Nacional (IGN, network code ES, Instituto Geográfico Nacional, 1999) and the Institut Cartogràfic i Geològic de Catalunya (ICGC, network code CA, Institut Cartogràfic i Geològic de Catalunya, 2000). We also benefited from the temporary stations of the TOPO-IBERIA project that were still deployed in northern Spain (Díaz et al., 2009; ICTJA-CSIC, 2007). The short-period data set consists of two stations operated by the Ebro Observatory to monitor the seismicity in the vicinity of the UGS (blue triangles in Fig. 1).
Seismic waveforms and earthquake focal depths inferred from them are very sensitive to the Earth's velocity structure. Because the study region is an oil-producing basin, there is a wealth of geophysical information on the structure of the subsurface, including reflection and refraction seismic profiles, seismic velocities, and other petrophysical data obtained from wells. This information is often only available for the upper 2 km where the potential oil bearing formations are located. In addition to this information, mostly vintage in age, a 3-D seismic survey was conducted in 2005 in the area of the CASTOR UGS in order to characterize the geometry of the storage and nearby faults (Juanes et al., 2017). Unfortunately, these data were not available to us and, therefore, were not used in this study. In spite of all the existing geophysical data in the region, because the focus was on the shallow structure (i.e., upper 2–3 km), important parameters of the deeper seismic structure such as the total sediment thickness, depth of the crystalline basement, and crustal thickness are relatively poorly known. Constraints on these parameters are provided by the ESCI and other wide-angle profiles (Dañobeitia et al., 1992; Gallart et al., 1994; Vidal et al., 1998), although these were located slightly to the north of the study region (see Fig. 1a for location of the ESCI profile).
Because the available information on Earth structure was not adequate for our study, we derived new velocity models for the region. First, we obtained a 1-D model based on surface-wave dispersion measurements and teleseismic P-wave receiver functions at seismic stations near the UGS to represent average wave propagation at distances of 50–650 km. This model was used to compute synthetic low-frequency waveforms for moment tensor inversion. Then, another refined 1-D model, also based on surface-wave dispersion combined with well data, was developed to model high-frequency waveforms at local distances (less than 40 km). Here we describe in more detail how both models were obtained.
3.1 Velocity model for moment tensor determination
Determination of moment tensors in the time domain requires a velocity model that can predict the character of the waveforms in the desired frequency band (0.02 to 0.1 Hz in our case). The requirements on the model are fewer if frequencies lower than 0.02 Hz are used or if observations at short distances are available. However, for small events, signal-to-noise ratio for low frequencies can be low, precluding the use of waveforms to obtain regional moment tensors.
Fortunately, about a dozen of the larger earthquakes in the sequence were well recorded in the Iberian Peninsula. For these earthquakes we measured Rayleigh- and Love-wave group velocities using a multiple filter technique (Herrmann, 1973) that is implemented in the Computer Programs in Seismology (Herrmann, 2013). To these observations we added Rayleigh-wave dispersion estimates (group and phase velocities) obtained from ambient noise tomography. This was done by summing the group and phase delays for each source-station path through the dispersion maps of Palomeras et al. (2017). The purpose of the second step was to obtain additional independent constraints to determine the velocity model, particularly phase velocities of Rayleigh waves (Fig. 2b). Combining the dispersion measurements obtained from earthquakes and ambient noise tomography we determined the mean value of group and phase velocity for each period and used the standard deviation as an estimate of the uncertainty.
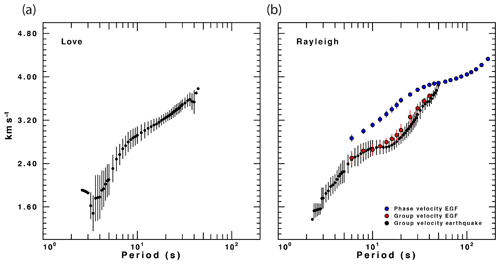
Figure 2Dispersion measurements used to obtain the VALEN 1-D model for waveform inversion. Group velocities from earthquakes are shown as black circles, group velocities from noise as red circles, and phase velocities from noise shown as blue circles. Vertical error bars indicate measurement uncertainty (standard deviation). For phase velocities some error bars are smaller than the symbol size. (a) Love-wave dispersion measurements, and (b) Rayleigh-wave dispersion measurements.
Figure 2 shows the obtained dispersion curves with their uncertainties. For Love waves we obtained group velocities from earthquake measurements, and for Rayleigh waves we obtained group velocities from earthquakes and ambient noise, and phase velocities from ambient noise. The standard deviations of the phase velocities are smaller than those of group velocities, and for periods greater than 20 s they are smaller than the symbol size. For Rayleigh-wave group velocities there is good agreement between the measurements obtained from ambient noise tomography and from earthquakes. The advantage of the earthquake data is that the dispersion curves can be extended to shorter periods; in our case, it also provides Love-wave dispersion measurements (Fig. 2a). The derived dispersion curves thus represent an average propagation velocity to stations in the eastern Iberian Peninsula within about 650 km from the CASTOR UGS.
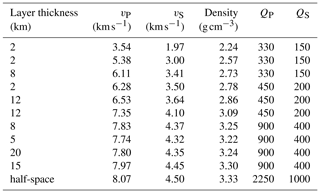
To create a simple 1-D velocity model to be used for source inversion, we inverted jointly the dispersion data shown in Fig. 2 together with teleseismic P-wave receiver functions for station EMOS (40.36∘ N, 0.47∘ W), which is approximately 100 km west of the earthquakes studied (see Fig. 1 for location). The joint inversion was performed using the code of Herrmann (2013). The initial velocity model was the global model ak135 (Kennett et al., 1995), modified in the upper 50 km to have a constant velocity (that of ak135 at 50 km depth). The purpose of this choice was to have a smooth model that made no a priori assumptions about the sharpness or depth of the Moho. We then simplified the model by combining layers with similar velocities and truncated it to a depth of 90 km to have a simple velocity model for modeling the waveforms. The resulting model, denoted VALEN, is given in Table 1.
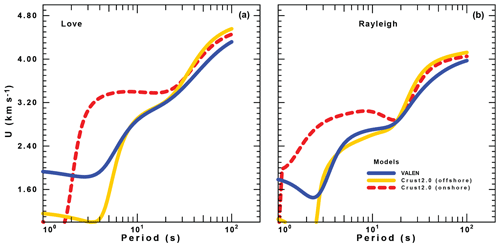
Figure 3Predicted group velocities for different models discussed in the text. VALEN is the model used for waveform inversion, CRUST2.0 offshore is the grid point of CRUST2.0 closest to the CASTOR UGS, and CRUST2.0 onshore is the grid point immediately to the west, located in the eastern Iberian Peninsula. Love-wave group velocities are shown in (a) and Rayleigh-wave group velocities in (b).
Figure 3 compares the group velocity dispersion predicted by the VALEN model with predictions from other velocity models. The group velocities describe the shape of the temporal waveform, which is what moment tensor inversion of waveforms must match. If the velocity model cannot match the observed dispersion, then the inversion suffers (Herrmann et al., 2011). The other models shown in Fig. 3 correspond to two 2∘ × 2∘ cells from the global model CRUST2.0 (Bassin et al., 2000) located in the vicinity of the CASTOR UGS. One of the cells is the one containing the CASTOR UGS (labeled offshore in Fig. 3), and the other one is located further inland (labeled onshore). Since our moment tensor inversion used the 16–50 s period range, we can quickly reject the use of the CRUST2.0 onshore model. The CRUST2.0 offshore model could be used, except that the waveform synthetics would still be affected by the very low velocities at short periods.
3.2 Velocity model for forward modeling of crustal reverberations
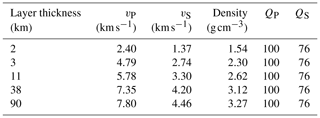
For modeling high-frequency body waves, we initially considered the 3-D vS model of Gaite et al. (2016), evaluated at the nearest grid point to the CASTOR UGS. In order to reproduce the reverberations recorded at the nearest station ALCN (see Fig. 1 for location), we had to introduce a shallow layer with low velocity that was not resolvable using our surface wave data set. Results from marine reflection and refraction experiments in nearby geologic environments similar to our study region indicate a large velocity contrast between Cenozoic and Mesozoic sediments (e.g., Dañobeitia et al., 1992; Torné et al., 1992; Vidal et al., 1998). The average depth of the top of the Mesozoic sediments, formed by Cretaceous limestones, is approximately 2 km in accordance with several borehole stratigraphic columns in the area. Therefore, we added to the top of our model a 2 km thick layer with a P-wave velocity of 2.4 km s−1, representative of the Cenozoic sediments. The velocity value of this first layer is selected from results of refraction and wide-angle reflection profiles recorded with OBS and land stations that cross the continental platform north of the Ebro Delta (Profile I in Dañobeitia et al., 1992). This velocity is lower than the average value obtained from velocity logs closer to the area (vP around 2.8–3.0 km s−1 for the first 2 km from Castellon C-3 well); however it fits better the observed waveforms. The complete 1-D model (vP, vS, density, P and S attenuation) used to compute high-frequency ground motion was constructed considering a vP∕vS ratio of 1.75, the density–velocity relationship (Berteussen, 1977), a QS value of 100 (Ugalde et al., 1999), and QP=0.76QS (Mancilla et al., 2012) (Table 2).
We analyzed all earthquakes in the IGN catalog with reported magnitudes mbLg≥3.5. From all the events studied we obtained reliable mechanisms for 14 earthquakes with Mw ranging between 3.0 and 4.1 (Table 3).
Table 3Source parameters obtained in this study for the largest earthquakes in the vicinity of the CASTOR gas storage.
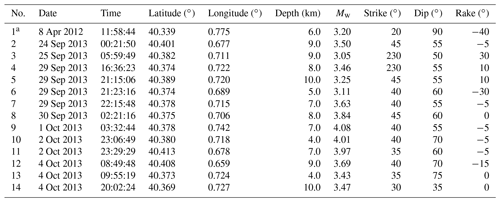
a This event occurred before the 2013 seismic sequence.
The waveform inversion method used here is described in detail by Herrmann et al. (2011) and will only be briefly summarized. Three-component waveforms were converted to velocity and rotated to radial, transverse, and vertical components. Next the seismograms were bandpass filtered between 0.02 and 0.06 Hz (16–50 s) to evaluate their quality. We selected waveforms that showed retrograde motion for the fundamental model Rayleigh wave, good signal-to-noise ratio, and finite signal duration.
The inversion method uses a grid search approach that samples over strike, dip, and rake angles in 5∘ increments and source depth in 1 km increments, in order to determine the shear dislocation (double couple) that best fits the observed data. A feature of the implementation of the grid search is an efficient method for adjusting the predicted waveforms for time shifts that arise because of uncertainties in the assumed origin time and epicentral coordinates, the sampling of the Green's functions with distance, and differences between the actual wave propagation and that of the 1-D model used.
Since the largest signals observed in the frequency band used for inversion are surface waves, and since the initial P-wave signal usually fades into background noise at larger distances, we used a window that extended from 30 s before to 60 s after a group velocity arrival of 3.3 km s−1. Finally, we filtered both the observed and Green's function ground velocities by applying a three-pole high-pass Butterworth filter at 0.03 Hz and a three-pole low-pass filter at 0.06 Hz. For the larger events, we used a high-pass filter at 0.02 Hz and for small events a low pass at 0.1 Hz. The objective of the filtering was to use as wide a frequency range as possible, to have a good signal-to-noise ratio, and yet to use low frequencies so that errors in the 1-D velocity model would be minimized. Although there are mixed water–land paths to the stations, the 1-D model is assumed adequate because water depth is small (maximum of ∼60 m), and most of the paths are continental. We searched source depths from 1 to 29 km in increments of 1 km to represent depth below the base of the water.
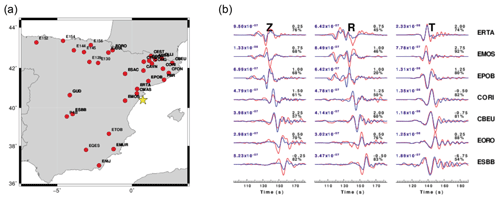
Figure 4Regional moment tensor determined for the largest earthquake of the sequence, which occurred on 1 October 2013, 03:32 UTC, with Mw=4.08. (a) Location of the earthquake (yellow star) and of broadband stations that were used to determine this moment tensor (red circles). (b) Waveform fits for the optimum solution of the moment tensor for this earthquake. Z indicates vertical component, R radial, and T transverse. Observed (red) and predicted (blue) ground velocities for the optimum solution are shown for seven selected stations.
As an example of the processing, we present the results for the largest event, the Mw=4.08 earthquake of 1 October 2013 at 03:32 UTC. Figure 4a shows the location of the event and the stations used for the source modeling. The data set has an epicentral distance range from 50 to 650 km and covers an azimuth range slightly over 180∘. Unfortunately, many of the stations share similar azimuths and thus provide redundant information. Figure 4b presents the observed and predicted waveforms for the optimal solution at selected stations at distances between 70 and 405 km. The low-frequency part of the signals is modeled fairly well, as are some of the earlier P-wave arrivals. We do not expect the fits to be perfect given the variability of structure from the source region to the individual stations. The fits are judged adequate on the basis of the relatively small time shifts and because of the low frequency used. The waveform comparison shown in Fig. 4b indicates an excellent fit to the transverse component at EORO, while the corresponding vertical and radial components are not as well fit because this station is near a minimum (nodal plane) of the radiation pattern. The difference in the durations of the Rayleigh wave and the Love wave at CBEU reflects the difference in the dispersion curves – the Rayleigh-wave group velocities flatten out a bit in Fig. 2, which gives rise to a pulse in the synthetics and observed seismograms.
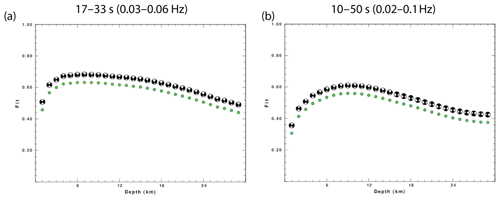
Figure 5(a) Normalized goodness of fit versus focal depth for the earthquake shown in Fig. 4 (1 October 2013, 03:32 UTC, Mw=4.08) using a frequency band of 0.03–0.06 Hz. Perfect fit corresponds to a value of 1. For each depth, the best-fitting focal mechanism is shown. (b) Same as (a) but for the frequency band of 0.02 to 0.1 Hz.
Figure 5 presents the best fitting solution as a function of source depth for two different frequency bands. Our best solution for the frequency band 0.03–0.06 Hz (Fig. 5a), which is suitable for most of the events analyzed, has a source depth of 7 km, a moment magnitude of 4.08, and strike, dip, and rake angles of 40, 55, and −5, respectively. The data fit is relatively good but does not show a sharp peak in depth; rather it shows a broad maximum between 4 and 12 km. Although the uncertainty in depth is high, we can certainly reject depths less than 3 km or greater than 15 km. Although not indicated on the plot, the estimated moment magnitude increases with depth because the material properties increase with depth in the model.
When we extended the frequency band from 0.03–0.06 to 0.02–0.1 Hz, the goodness of fit was slightly reduced, but the source depth peaked more sharply at the slightly deeper depth of 9 km (Fig. 5b). We repeated this exercise for the three largest events and found that in all cases the higher frequency band led to a source depth of about 2 km deeper with a sharper indication of depth.
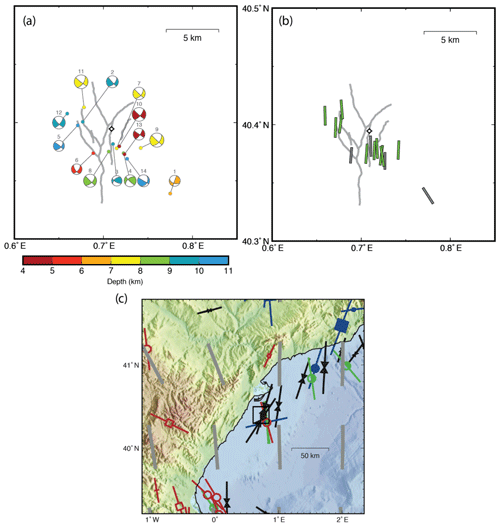
Figure 6Focal mechanisms obtained in this study. (a) Nodal planes projected in the lower hemisphere of the focal sphere. Colored quadrants correspond to compression, and the color represents focal depth according to the legend. Numbers above each beach ball correspond to the solution listed in Table 3. Thick grey lines indicate the traces of main faults in the area at 1700 m depth (Geostock, 2010). (b) Orientation of the P axes of the mechanisms shown in panel (a). Green indicates predominantly strike-slip mechanism, and grey mixed type. (c) Stress measurements and mean SHmax orientations in the region of the CASTOR UGS from the current update of World Stress Map (Heidbach et al., 2016). Grey bars are the mean SHmax orientations on a 1∘ grid estimated with a 250 km search radius and weighted by data quality and distance to the grid point. For other symbols see the legend in Heidbach et al. (2016).
Table 3 summarizes the source parameters determined in this study (epicenters are taken from Gaite et al., 2016). In Fig. 6a we show the focal mechanisms for all the earthquakes that we were able to process successfully. Most of them correspond to strike-slip mechanisms with a small component of normal faulting. Almost all the events exhibit a well-constrained near-vertical nodal plane that strikes NW–SE, with more variability in the orientation of the other nodal plane. Figure 6b shows the orientation of the P axis of the focal mechanisms, which is predominantly N–S. The only exception is the easternmost event (No. 1 in Table 3), which occurred on 8 April 2012 before the beginning of the injection activities at the CASTOR UGS. In Fig. 6b we have plotted the orientation of the P axis, color-coded according to the relative proportions of thrust, strike-slip, and normal component of the mechanism (Frohlich, 1992). Most of the mechanisms have a proportion of 60 % or more of strike-slip motion (shown as green bars in Fig. 6b), while the rest do not have a predominant component (grey bars). In Fig. 6c we show measurements and the average direction of the maximum compressive stress axis SHmax (see Zoback, 1992) in the region of the CASTOR UGS according to the recent update of the World Stress Map (Heidbach et al., 2016). The calculated average direction of SHmax (grey bars) and the measurements from borehole data (Schindler et al., 1998) coincide extremely well with the orientation of the P axis of the focal mechanisms obtained for the largest earthquakes in the sequence.
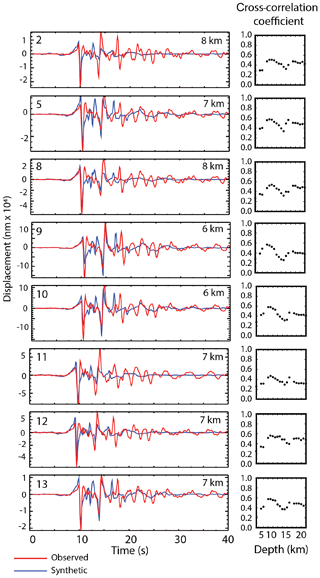
Figure 7Transverse component of the S-wave ground displacement (in nanometers) for eight of the largest earthquakes in the sequence recorded at station ALCN (see Fig. 1 for location). Red lines are the observed data, and blue lines are the synthetic waveforms for the best fitting depth. Event number according to Table 3 is indicated in the upper left of each seismogram, and best fitting focal depth in the upper right. The right panels show the cross-correlation coefficient between the observed and synthetic displacement seismograms as a function of depth. All events show low cross-correlation values for shallow depths (less than 2–4 km) and a clear maximum between 6 and 8 km.
A noticeable feature in the short-period seismograms recorded at short distances are several relatively high-amplitude phases arriving after the direct S phase, clearly observed on the transverse component (Fig. 7). We interpret these arrivals as crustal reverberations generated when the source is near a velocity boundary, and significant amounts of energy are trapped in the uppermost layers. The amplitude and temporal separation of these reverberation phases are very sensitive to focal depth, so by modeling them we expect to obtain additional constraints on the focal depths of the largest earthquakes in the sequence. We modeled these ground motion displacements using the program FK (Zhu and Rivera, 2002), following the approach described in Frohlich et al. (2014).
We computed the synthetic ground motion generated by the largest earthquakes of the sequence at the closest station location (ALCN), at approximately 15 km distance (Fig. 1). We used the epicentral locations calculated by Gaite et al. (2016) obtained using a 3-D model and the seismic moment tensor solutions computed in the previous section from full-waveform inversion. As a velocity model, we considered the 1-D model based on ambient noise tomography combined with well data described in Sect. 3.2 and listed in Table 2.
We computed synthetic seismograms of the transverse component of ground displacement for focal depths varying from 1 to 22 km in 1 km increments. Both the synthetic and observed seismograms were band-pass filtered between 0.2 and 2 Hz and integrated to displacement for comparison. To measure the goodness of the fit we calculated the cross-correlation coefficient between the observed and synthetic seismograms. The most likely focal depth was chosen as the one that provided the largest value of the cross-correlation coefficient between the observed and synthetic seismograms.
For all the earthquakes analyzed the focal depths that resulted in a higher cross-correlation coefficient were in the range between 6 and 8 km. (Fig. 7). This is in accordance with the average ∼6 km depth obtained by Gaite et al. (2016) using a 3-D velocity model and refined picks using waveform similarity.
We will now discuss the implications of our results (focal mechanisms and focal depths) for the identification of the faults reactivated during this episode of induced seismicity and the process responsible for this reactivation.
We will first examine the similarities and differences of our results with previous studies. Cesca et al. (2014) performed the first seismological study of this earthquake sequence. They used catalogued arrival times, a global regionalized velocity model (CRUST2.0), and long-period spectral amplitudes to solve for the moment tensor and focal depth. Their results differ from ours in several ways. For the 12 events in common in both studies, their depths are shallow (1 to 2 km depth), their moment magnitudes are about 0.2 Mw units greater, and although one nodal plane is in the NW–SE direction, the other nodal plane dips very shallowly to the southeast. Differences might be caused by the model used (CRUST2.0 vs. our local model) and the type of data (spectral amplitudes vs. full waveforms).
Saló et al. (2017), using the waveform inversion approach of Delouis (2014), obtain mechanisms similar to ours, predominantly strike-slip, with one near-vertical nodal plane striking NW–SE, and a second nodal plane dipping to the SE. Their focal depths are also similar to ours (mostly 5–8 km depth).
Recently Juanes et al. (2017) have also obtained locations and focal mechanisms for the events in this sequence. Using a 1-D Earth model and catalogued arrival times, they obtain focal depths generally shallower than 5 km. However, when using a 3-D velocity model derived from their 3-D structural model, they obtain deeper focal depths, between 5 and 15 km, in agreement with the results of Gaite et al. (2016). This is not surprising since their detailed 3-D structural model in the vicinity of the CASTOR UGS was embedded in the regional model of Gaite et al. (2016). Their focal mechanisms, obtained using waveform fitting (Li et al., 2011), are also predominantly strike-slip with a steeply dipping NW–SE nodal plane and a vertical SW–NE nodal plane. In their report, however, they do not provide estimates of focal depth obtained from waveform fitting.
The discrepancies between these studies are, in our view, more representative of the poor configuration of the monitoring network of the CASTOR UGS than of the complexity of the structure in the region or the variability of the earthquake sources. Data from one or more ocean-bottom seismometers in the vicinity of the storage would have allowed one to discriminate between shallow (1–2 km) and deeper (>5 km) focal depths with very small uncertainty. Lacking data from reliable, nearby stations, errors in epicenter and focal depth can be too large to allow for a confident association of the seismicity with a specific fault or faults. Gaite et al. (2016) attempted to decrease the location uncertainty by creating a 3-D velocity model of the region and by obtaining precise arrival time picks exploiting the similarity of waveforms from nearby earthquakes. Using this approach, they obtained a distribution of epicenters with a predominantly NW–SE orientation and focal depths generally >5 km. Juanes et al. (2017) also obtain a NW–SE orientation of the epicenters and deeper (>5 km) focal depths when using their 3-D model, while using a 1-D model results in shallower (<5 km) focal depths. On the other hand, Cesca et al. (2014), using the 1-D model in CRUST2.0 (Bassin et al., 2000) for the source region and a waveform coherence location method (Grigoli et al., 2014), obtain very shallow locations and an approximately N–S distribution of epicenters (see their Fig. 6). Interestingly, the best constrained and therefore more consistent feature of all the focal mechanisms obtained for this sequence is the near-vertical NW–SE-striking nodal plane. This coincides with the epicenter distribution obtained by the IGN, Gaite et al. (2016), and Juanes et al. (2017). However, there is no major know active fault in the region with this orientation. The predominant orientation of active faults in the Gulf of Valencia coast is SW–NE (Garcia-Mayordomo et al., 2012) with the exception of some minor faults that splay off from main Amposta fault to the east (grey lines in Fig. 5a, b). These faults shown in Fig. 5 were obtained by Geostock (2010) from the analysis of recent, more detailed 3-D seismic studies carried out to delineate the reservoir size.
In addition to the distribution of epicenters, another important parameter to help identify causative faults is focal depth. Fortunately, the poor constraints provided by arrival time data to focal depth in absence of nearby stations are compensated by the large sensitivity of seismic waveforms to depth. By performing waveform inversion to obtain source parameters (depth, scalar moment, and focal mechanism), and by modeling high-frequency reverberations of S waves, we obtained strong constraints on focal depth. Using both approaches we determined optimum depths centered at around 6–8 km. The uncertainty of these estimates, provided by the shape of the fitting curve (e.g., Fig. 5 and right panels in Fig. 7), is relatively large, but for both approaches depths shallower than 4 km provide a poor fit to the waveform data. Saló et al. (2017) using a waveform inversion approach also obtain deeper focal depths (5–8 km), while Cesca et al. (2014) fitting amplitude spectra obtain shallow focal depths (2 km). When a good distribution of recording stations is available, waveform inversion methods should provide better sensitivity to focal depths than those based on spectral amplitudes. Also, using a velocity model that more accurately predicts the characteristics of waveform propagation in the region should provide more reliable results. This, combined with the good fit of short-period reverberations obtained in the previous section, leads us to propose that the larger events occurred at depths of 5–8 km, significantly greater than the injection depth of ∼2 km. This scenario is very frequent for fluid-injection-induced earthquakes, where the seismicity occurs in the crystalline basement and not in the sedimentary layers where the injection takes place (e.g., McNamara et al., 2015).
The association of the obtained nodal planes with causative faults of the earthquakes also presents some difficulties for this sequence. Cesca et al. (2014) do not favor any of their two nodal planes (shallow dipping to the SE and steeply dipping striking NW–SE) and propose two potential scenarios of fault reactivation. Their analysis also excludes the reactivation of the Amposta fault. On the other hand, Juanes et al. (2017) propose the reactivation of the Amposta fault, although none of the nodal planes in their mechanism dips to the NW. In all the studies reviewed here, there is not a single focal mechanism that presents a W- or NW-dipping nodal plane corresponding to the geometry of the Amposta fault in the region (which dips 40–60∘ to the NNW according to Fig. 2.2 in Juanes et al., 2017).
Although the deep structure in the region of the CASTOR UGS is not known in great detail, a depth of 6 km is most likely deeper than the Cenozoic and Mesozoic sediments and within the Hercynian (Paleozoic) extended crust beneath the Iberian margin. We will refer to this layer as the crystalline basement. The extended crust beneath this segment of the Valencia Trough was accommodated by a listric normal fault system reaching detachments depths of up to 15 km (Roca and Guimerà, 1992). This fracture network could have acted as a high-permeability pathway for pore-pressure perturbations to reach the crystalline basement and trigger faults that were critically stressed. An alternative mechanism for induced earthquake triggering could be aseismic fault slip. Using fluid-injection experiments on shallow crustal faults, Bhattacharya and Viesca (2019) show that aseismic fault slip can transmit stress changes faster and to larger distances than pore-fluid migration. Considering that small-magnitude-induced earthquakes began to occur 2 d after the injection of the base gas started and that the largest earthquakes occurred only 4 weeks later (and 2 weeks after the end of the injection), aseismic fault slip (for example at the Amposta fault) could be a viable mechanism for triggering the sequence. However, without detailed studies of geomechanical modeling, this assertion remains speculative.
Although the nodal planes of the focal mechanisms obtained for the CASTOR sequence are not consistent with the orientation of any of the main faults and structures imaged in the region of the storage, faults in the crystalline basement might have different orientation than those in shallow layers. It is not uncommon that old unmapped faults in the basement that have not shown previous seismic activity are reactivated by the injection of fluids (e.g., Yeck et al., 2016; Keranen and Weingarten, 2018). During the Middle Jurassic, the region immediately west of the CASTOR UGS was transected by a complex network of NW- and NE-trending faults (Gómez and Fernández-López, 2006), some of which could have been reactivated by the gas injection. In particular the seaward continuation of the NW-trending Vinaros fault would be compatible with the NW–SE nodal planes of the focal mechanisms obtained.
In view of the evidence presented here, we postulate that the large earthquakes in this sequence occurred in faults in the crystalline basement. We favor the NW–SE-striking nodal plane as a fault plane because it coincides with the distribution of seismicity. However, we cannot discard the SE-dipping nodal plane because it coincides with the orientation of mapped faults that affect the Cenozoic and Mesozoic sediments and presumably also could affect the crystalline basement.
Based on our consistent results of focal depths in the range of 6–8 km using different approaches, and in the absence of nodal planes compatible with the Amposta fault, we consider that it is unlikely that the largest earthquakes in this sequence occurred on the Amposta fault.
In this study, we have obtained new source parameters (focal depths and mechanisms) for the largest earthquakes in the CASTOR sequence using full-waveform inversion. The focal depths obtained range between 5 and 10 km, consistent with results from the modeling of crustal reverberations, which provide a narrower depth range (6–8 km). These depths indicate that the reactivated faults are located in the crystalline basement, significantly deeper than the injection depth (∼2 km).
Focal mechanisms correspond to strike-slip motion with a small normal fault component. The orientation of the maximum compressive stress SHmax derived from these earthquakes is N–S, in good agreement with the regional stress regime, indicating that these earthquakes occurred in critically stressed faults subject to regional stresses. None of the nodal planes obtained by this or other studies is compatible with reactivation on the Amposta fault.
In spite of our analysis, uncertainties still remain with respect to the focal depth of the earthquakes and the causative fault. This is mainly due to the poor configuration of the seismic network deployed to monitor this facility, particularly the lack of seismometers on the ocean bottom (OBSs) and in the observation wells.
The seismic data used in this study and the obtained regional centroid moment tensor solutions (including information on the velocity model and stations used for each solution, focal depth sensitivity, data fit, etc.) are publicly available in this data repository: https://doi.org/10.20350/digitalCSIC/8966 (Villaseñor et al., 2019).
The supplement related to this article is available online at: https://doi.org/10.5194/se-11-63-2020-supplement.
AV and RBH performed the regional moment tensor modeling. BG performed the analysis of the S-wave reverberations. AU provided precise earthquake locations. AV prepared the manuscript with contributions from the other co-authors.
The authors declare that they have no conflict of interest.
We thank the seismic networks that provided the waveform data used in this study: IGN (https://doi.org/10.7914/SN/ES, last access: 19 November 2019) and ICGC (https://doi.org/10.7914/SN/CA, last access: 19 November 2019).
This research has been supported by the Ministerio de Ciencia e Innovación, Spain (grant no. CGL2017-88864-R).
This paper was edited by Cristiano Collettini and reviewed by Heather DeShon and one anonymous referee.
Bassin, C., Laske, G., and Masters, G.: The Current Limits of Resolution for Surface Wave Tomography in North America, in: EOS Trans AGU, 81, F897, 2000.
Berteussen, K. A.: Moho depth determinations based on spectral-ratio analysis of NORSAR long-period P waves, Phys. Earth Planet. In., 15, 13–27, 1977.
Bhattacharya, P. and Viesca, R. C.: Fluid-induced aseismic fault slip outpaces pore-fluid migration, Science, 364, 464–468, https://doi.org/10.1126/science.aaw7354, 2019.
Cesca, S., Grigoli, F., Heimann, S., Gonzalez, A., Buforn, E., Maghsoudi, S., Blanch, E., and Dahm, T.: The 2013 September–October seismic sequence offshore Spain: a case of seismicity triggered by gas injection?, Geophys. J. Int., 198, 941–953, https://doi.org/10.1093/gji/ggu172, 2014.
Dañobeitia, J. J., Arguedas, M., Gallart, J., Banda, E., and Makris, J.: Deep crustal configuration of the Valencia trough and its Iberian and Balearic borders from extensive refraction and wide-angle reflection seismic profiling, Tectonophysics, 203, 37–55, https://doi.org/10.1016/0040-1951(92)90214-Q, 1992.
Delouis, B.: FMNEAR: Determination of Focal Mechanism and First Estimate of Rupture Directivity Using Near-Source Records and a Linear Distribution of Point Sources, B. Seismol. Soc. Am., 104, 1479–1500, https://doi.org/10.1785/0120130151, 2014.
Díaz, J., Villaseñor, A., Gallart, J., Morales, J., Pazos, A., Córdoba, D., Pulgar, J. A., García-Lobón, J. L., Harnafi, M., and Group, T.-I. S. W.: The IBERARRAY broadband seismic network: a new tool to investigate the deep structure beneath Iberia, Orfeus Newsl., 8, 1–6, 2009.
Ellsworth, W. L.: Injection-Induced Earthquakes, Science, 341, 1225942–1225942, https://doi.org/10.1126/science.1225942, 2013.
Frohlich, C.: Triangle diagrams: ternary graphs to display similarity and diversity of earthquake focal mechanisms, Phys. Earth Planet. In., 75, 193–198, https://doi.org/10.1016/0031-9201(92)90130-N, 1992.
Frohlich, C., Ellsworth, W. L., Brown, W. A., Brunt, M., Luetger, J., MacDonald, T., and Walter, S.: The 17 May 2012 M4.8 earthquake near Timpson, East Texas: An event possibly triggered by fluid injection, J. Geophys. Res.-Sol. Ea., 119, 581–593, https://doi.org/10.1002/2013JB010755, 2014.
Gaite, B., Ugalde, A., Villaseñor, A., and Blanch, E.: Improving the location of induced earthquakes associated with an underground gas storage in the Gulf of Valencia (Spain), Phys. Earth Planet. In., 254, 46–59, https://doi.org/10.1016/j.pepi.2016.03.006, 2016.
Gallart, J., Vidal, N., Dañobeitia, J. J., and Group, E.-V. T. W.: Lateral variations in the deep crustal structure at the Iberian margin of the Valencia trough imaged from seismic reflection methods, Tectonophysics, 232, 59–75, https://doi.org/10.1016/0040-1951(94)90076-0, 1994.
Garcia-Mayordomo, J., Insua-Arévalo, J. M., Martínez-Díaz, J. J., Jiménez-Díaz, A., Martín-Banda, R., Martín-Alfageme, S., Álvarez-Gómez, J. A., Rodríguez-Peces, M., Pérez-López, R., Rodríguez-Pascua, M. A., Masana, E., Perea, H., Martín-González, F., Giner-Robles, J., Nemser, E. S., and Cabral, J.: The Quaternary Active Faults Database of Iberia (QAFI v.2.0), J. Iber. Geol., 38, 285–302, https://doi.org/10.5209/rev_JIGE.2012.v38.n1.39219, 2012.
Geostock: Castor underground storage facility – seismic interpretation study – contribution to the static model, Internal Report, 2010.
Gómez, J. J. and Fernández-López, S. R.: The Iberian Middle Jurassic carbonate-platform system: Synthesis of the palaeogeographic elements of its eastern margin (Spain), Palaeogeogr. Palaeocl., 236, 190–205, https://doi.org/10.1016/j.palaeo.2005.11.008, 2006.
Grigoli, F., Cesca, S., Amoroso, O., Emolo, A., Zollo, A., and Dahm, T.: Automated seismic event location by waveform coherence analysis, Geophys. J. Int., 196, 1742–1753, https://doi.org/10.1093/gji/ggt477, 2014.
Heidbach, O., Custodio, S., Kingdon, A., Mariucci, M. T., Montone, P., Müller, B., Pierdominici, S., Rajabi, M., Reinecker, J., Reiter, K., Tingay, M., Williams, J., and Ziegler, M.: Stress Map of the Mediterranean and Central Europe, GFZ Data Service, https://doi.org/10.5880/WSM.Europe2016, 2016.
Herrmann, R. B.: Some aspects of band-pass filtering of surface waves, B. Seismol. Soc. Am., 63, 663–671, 1973.
Herrmann, R. B.: Computer Programs in Seismology: An Evolving Tool for Instruction and Research, Seismol. Res. Lett., 84, 1081–1088, https://doi.org/10.1785/0220110096, 2013.
Herrmann, R. B., Benz, H. M., and Ammon, C. J.: Monitoring the Earthquake Source Process in North America, B. Seismol. Soc. Am., 101, 2609–2625, https://doi.org/10.1785/0120110095, 2011.
ICTJA-CSIC: IberArray. International Federation of Digital Seismograph Networks, Dataset/Seismic Network, Dataset/Seismic Network, 10.7914/SN/IB, 2007.
Institut Cartogràfic i Geològic de Catalunya, S.: Catalan Seismic Network, International Federation of Digital Seismograph Networks, Dataset/Seismic Network, 10.7914/SN/CA, 2000.
Instituto Geográfico Nacional, Spain: Spanish Digital Seismic Network, International Federation of Digital Seismograph Networks, Dataset/Seismic Network, https://doi.org/10.7914/SN/ES, 1999.
Juanes, R., Castiñeira, D., Fehler, M. C., Hager, B. H., Jha, B., Shaw, J. H., and Plesch, A.: Coupled Flow and Geomechanical Modeling, and Assessment of Induced Seismicity, ath the Castor Underground Gas Storage Project, Cambridge, MA, USA, 86, 2017.
Kennett, B. L. N., Engdahl, E. R., and Buland, R.: Constraints on seismic velocities in the Earth from traveltimes, Geophys. J. Int., 122, 108–124, https://doi.org/10.1111/j.1365-246X.1995.tb03540.x, 1995.
Keranen, K. M. and Weingarten, M.: Induced Seismicity, Annu. Rev. Earth Planet. Sci., 46, 149–174, https://doi.org/10.1146/annurev-earth-082517-010054, 2018.
Li, J., Sadi Kuleli, H., Zhang, H., and Nafi Toksoz, M.: Focal mechanism determination of induced microearthquakes in an oil field using full waveforms from shallow and deep seismic networks, Geophysics, 76, WC87–WC101, https://doi.org/10.1190/geo2011-0030.1, 2011.
Mancilla, F., Pezzo, E. D., Stich, D., Morales, J., Ibañez, J., and Bianco, F.: QP and QS in the upper mantle beneath the Iberian peninsula from recordings of the very deep Granada earthquake of April 11, 2010, Geophys. Res. Lett., 39, L09303, https://doi.org/10.1029/2012GL050947, 2012.
McNamara, D. E., Benz, H. M., Herrmann, R. B., Bergman, E. A., Earle, P., Holland, A., Baldwin, R., and Gassner, A.: Earthquake hypocenters and focal mechanisms in central Oklahoma reveal a complex system of reactivated subsurface strike-slip faulting, Geophys. Res. Lett., 42, 2742–2749, https://doi.org/10.1002/2014GL062730, 2015.
Palomeras, I., Villaseñor, A., Thurner, S., Levander, A. R., Gallart, J., and Harnafi, M.: Lithospheric structure of Iberia and Morocco using finite-frequency Rayleigh wave tomography from earthquakes and seismic ambient noise, Geochem. Geophys. Geosyst., 18, 1824–1840, https://doi.org/10.1002/2016GC006657, 2017.
Roca, E. and Guimerà, J.: The Neogene structure of the eastern Iberian margin: structural constraints on the crustal evolution of the Valencia trough (western Mediterranean), Tectonophysics, 203, 203–218, 1992.
Saló, L., Frontera, T., Goula, X., Pujades, L. G., and Ledesma, A.: Earthquake static stress transfer in the 2013 Gulf of Valencia (Spain) seismic sequence, Solid Earth, 8, 857–882, https://doi.org/10.5194/se-8-857-2017, 2017.
Schindler, A., Jurado, M. J., and Müller, B.: Stress orientation and tectonic regime in the northwestern Valencia Trough from borehole data, Tectonophysics, 300, 63–77, 1998.
Seeman, U., Pümpin, V. F., and Casson, N.: Amposta oil field, in: AAPG Treatise of Petroleum Geology, Atlas of oil and gas fields A-017, edited by: Forster, N. H. and Beaumont, E. A., 1–20, 1990.
Torné, M., Pascal, G., Buhl, P., Watts, A. B., and Mauffret, A.: Crustal and velocity structure of the Valencia trough (western Mediterranean), Part I. A combined refraction/wide-angle reflection and near-vertical reflection study, Tectonophysics, 203, 1–20, https://doi.org/10.1016/0040-1951(92)90212-O, 1992.
Ugalde, A., Pujades, L. G., and Canas, J. A.: Estudio de atenuación sísmica en la costa este de la Península Ibérica, Revista Internacional de Métodos Numéricos para Cálculo y Diseño en Ingeniería, 15, 435–446, 1999.
Vidal, N., Gallart, J., and Dañobeitia, J. J.: A deep seismic crustal transect from the NE Iberian Peninsula to the western Mediterranean, J. Geophys. Res., 103, 12381–12396, https://doi.org/10.1029/98JB00076, 1998.
Villaseñor, A., Herrmann, R. B., Gaite, B., and Ugalde Aguirre, A.: Regional centroid moment tensors for earthquakes in the 2013 CASTOR gas storage seismic crisis [Dataset], DIGITAL.CSIC, https://doi.org/10.20350/digitalCSIC/8966, 2019.
Yeck, W. L., Weingarten, M., Benz, H. M., McNamara, D. E., Bergman, E. A., Herrmann, R. B., Rubinstein, J. L., and Earle, P. S.: Far-field pressurization likely caused one of the largest injection induced earthquakes by reactivating a large preexisting basement fault structure, Geophys. Res. Lett., 43, 10198–110207, https://doi.org/10.1002/2016GL070861, 2016.
Zhu, L. and Rivera, L. A.: A note on the dynamic and static displacements from a point source in multilayered media, Geophys. J. Int., 148, 619–627, 2002.
Zoback, M. L.: Stress field constraints on intraplate seismicity in eastern North America, J. Geophys. Res., 97, 11761–11782, https://doi.org/10.1029/92JB00221, 1992.


