the Creative Commons Attribution 4.0 License.
the Creative Commons Attribution 4.0 License.
 | 30 Apr 2020
Surface deformation relating to the 2018 Lake Muir earthquake sequence, southwest Western Australia: new insight into stable continental region earthquakes
Sarah Brennand
Gregory Brenn
Matthew C. Garthwaite
Jesse Dimech
Trevor I. Allen
Sean Standen
A shallow Mw 5.3 earthquake near Lake Muir in the stable continental region (SCR) crust of southwest Western Australia on the 16 September 2018 was followed on the 8 November by a proximal Mw 5.2 event. Focal mechanisms produced for the events suggest reverse and strike-slip rupture, respectively. Field mapping, guided by Sentinel-1 InSAR data, reveals that the first event produced an approximately 3 km long and up to 0.4–0.6 m high west-facing surface rupture, consistent with reverse slip on a moderately east-dipping fault. The InSAR data also show that the surface scarp relates to a subsurface rupture ∼ 5 km long, bound at its northern and southern extremities by bedrock structures. The November event produced a surface deformation envelope that is spatially coincident with that of the September event but did not result in discrete surface rupture. Almost 900 aftershocks were recorded by a temporary seismometer deployment. Hypocentre locations correlate poorly with the rupture plane of their respective mainshocks but correlate well with regions of increased Coulomb stress. The spatial and temporal relationships between the Mw>5.0 events and their aftershocks reveals dependencies with implications for how other less well-documented SCR earthquake sequences could be interpreted. Furthermore, the September Mw 5.3 Lake Muir earthquake was the ninth event documented to have produced surface rupture in Australia in historical times. These nine ruptures are located exclusively in the Precambrian non-extended SCR rocks of central and western Australia, and none could have been identified and mapped using topographic signature prior to the historical event. Consistent, though fragmentary, evidence exists from analogous regions worldwide. Our analysis of the Lake Muir earthquake sequence therefore provides constraint on models describing mechanisms for strain accumulation and localized release as earthquakes in non-extended SRC crust.
- Article
(26949 KB) - Full-text XML
-
Supplement
(1818 KB) - BibTeX
- EndNote


The works published in this journal are distributed under the Creative Commons Attribution 4.0 License. The author's copyright for this publication is transferred to the Commonwealth of Australia. The Creative Commons Attribution 4.0 License and the Commonwealth of Australia are interoperable and do not conflict with, reduce or limit each other.
© Commonwealth of Australia (Geoscience Australia) 2020
Within the stable continental regions (SCRs) of the world, defined by Johnston et al. (1994) as “areas where the continental crust is largely unaffected by currently active plate boundary processes”, large and potentially damaging earthquakes are rare (Johnston, 1994b; Schulte and Mooney, 2005). Consequently, mechanisms for strain accumulation and localized release as earthquakes are poorly understood (Talwani, 2014; Calais et al., 2016; Craig et al., 2016; Liu and Stein, 2016; Salditch et al., 2020), and the epistemic uncertainty associated with fault-displacement hazard (e.g. Moss and Ross, 2011; Moss et al., 2013) and the recurrence and fault-source model components of seismic-hazard assessments (e.g. Stein, 2007; Leonard et al., 2014; Griffin et al., 2020; Allen, 2020) is large. Constraint can be provided by the analysis of moderate-magnitude historical earthquake sequences supplemented by the palaeoseismic record of large surface-deforming events. Historical surface-deforming earthquakes are particularly valuable in this respect in that they allow for a more robust interpretation of the palaeoseismic record (e.g. through calibration of scaling relationships between surface rupture length and earthquake magnitude; Wells and Coppersmith, 1994; Clark et al., 2014b), and a broad range of tools exist with which to characterize the surface deformation and so deduce source properties (e.g. interferometric synthetic aperture radar – InSAR) and pixel tracking techniques for determining vertical and horizontal coseismic displacements; Massonnet et al., 1993; Klinger et al., 2018; Zhou et al., 2018; Gold et al., 2019).
Table 1Historical earthquake events known to have produced surface rupture in stable continental region crust (expanded after Crone et al., 1997; Clark et al., 2014b). Cells in italic font are events for which an InSAR image was produced. NT: Northern Territory; SA: South Australia; and WA: Western Australia.

a The Ungava surface rupture formed as the result of two events 0.9 sec apart (Bent, 1994), and Tennant Creek surface rupture was produced by three events in a 12 h period (Bowman, 1992). b Values in brackets estimate the surface rupture length from surface deformation (e.g. InSAR data).
Broad agreement exists that SCR crust is not homogeneous with respect to seismogenic potential (Johnston, 1994a; Mooney et al., 2012; Clark et al., 2012). The majority of historical moment release in SCR settings is preferentially located in failed rifts of Cretaceous to Paleogene age (e.g. Johnston, 1994a; Schulte and Mooney, 2005; Bonini et al., 2012; Talwani, 2014) and associated with pronounced lateral gradients in lithospheric thickness such as at the boundaries of cratons (e.g. Mooney et al., 2012) (Table 1). The largest recorded historical SCR earthquakes have occurred in failed rift settings; this includes within the Reelfoot Rift (Mueller and Pujol, 2001) and the Rann of Kachchh (Rajendran et al., 2008). While typically being characterized by a lack of significant neotectonic relief (White et al., 2009; Talwani, 2014; Goedhart and Booth, 2016; Hornsby et al., 2019), there are notable exceptions where evidence is preserved for strain localization over many seismic cycles; typically but not exclusively associated with the bounding faults of the failed rifts. Examples include the Rann of Kachchh in India (Rajendran et al., 2008; Rastogi et al., 2014), the Tapti Fault in peninsular India (Copley et al., 2014), the Reelfoot Rift in the central United States (van Arsdale, 2000; Cox et al., 2013), and the Otway, Flinders and Strzelecki ranges of eastern Australia (Sandiford, 2003a, b; Celerier et al., 2005; Quigley et al., 2006; Hillis et al., 2008; Braun et al., 2009; Clark et al., 2012) (Fig. 1).
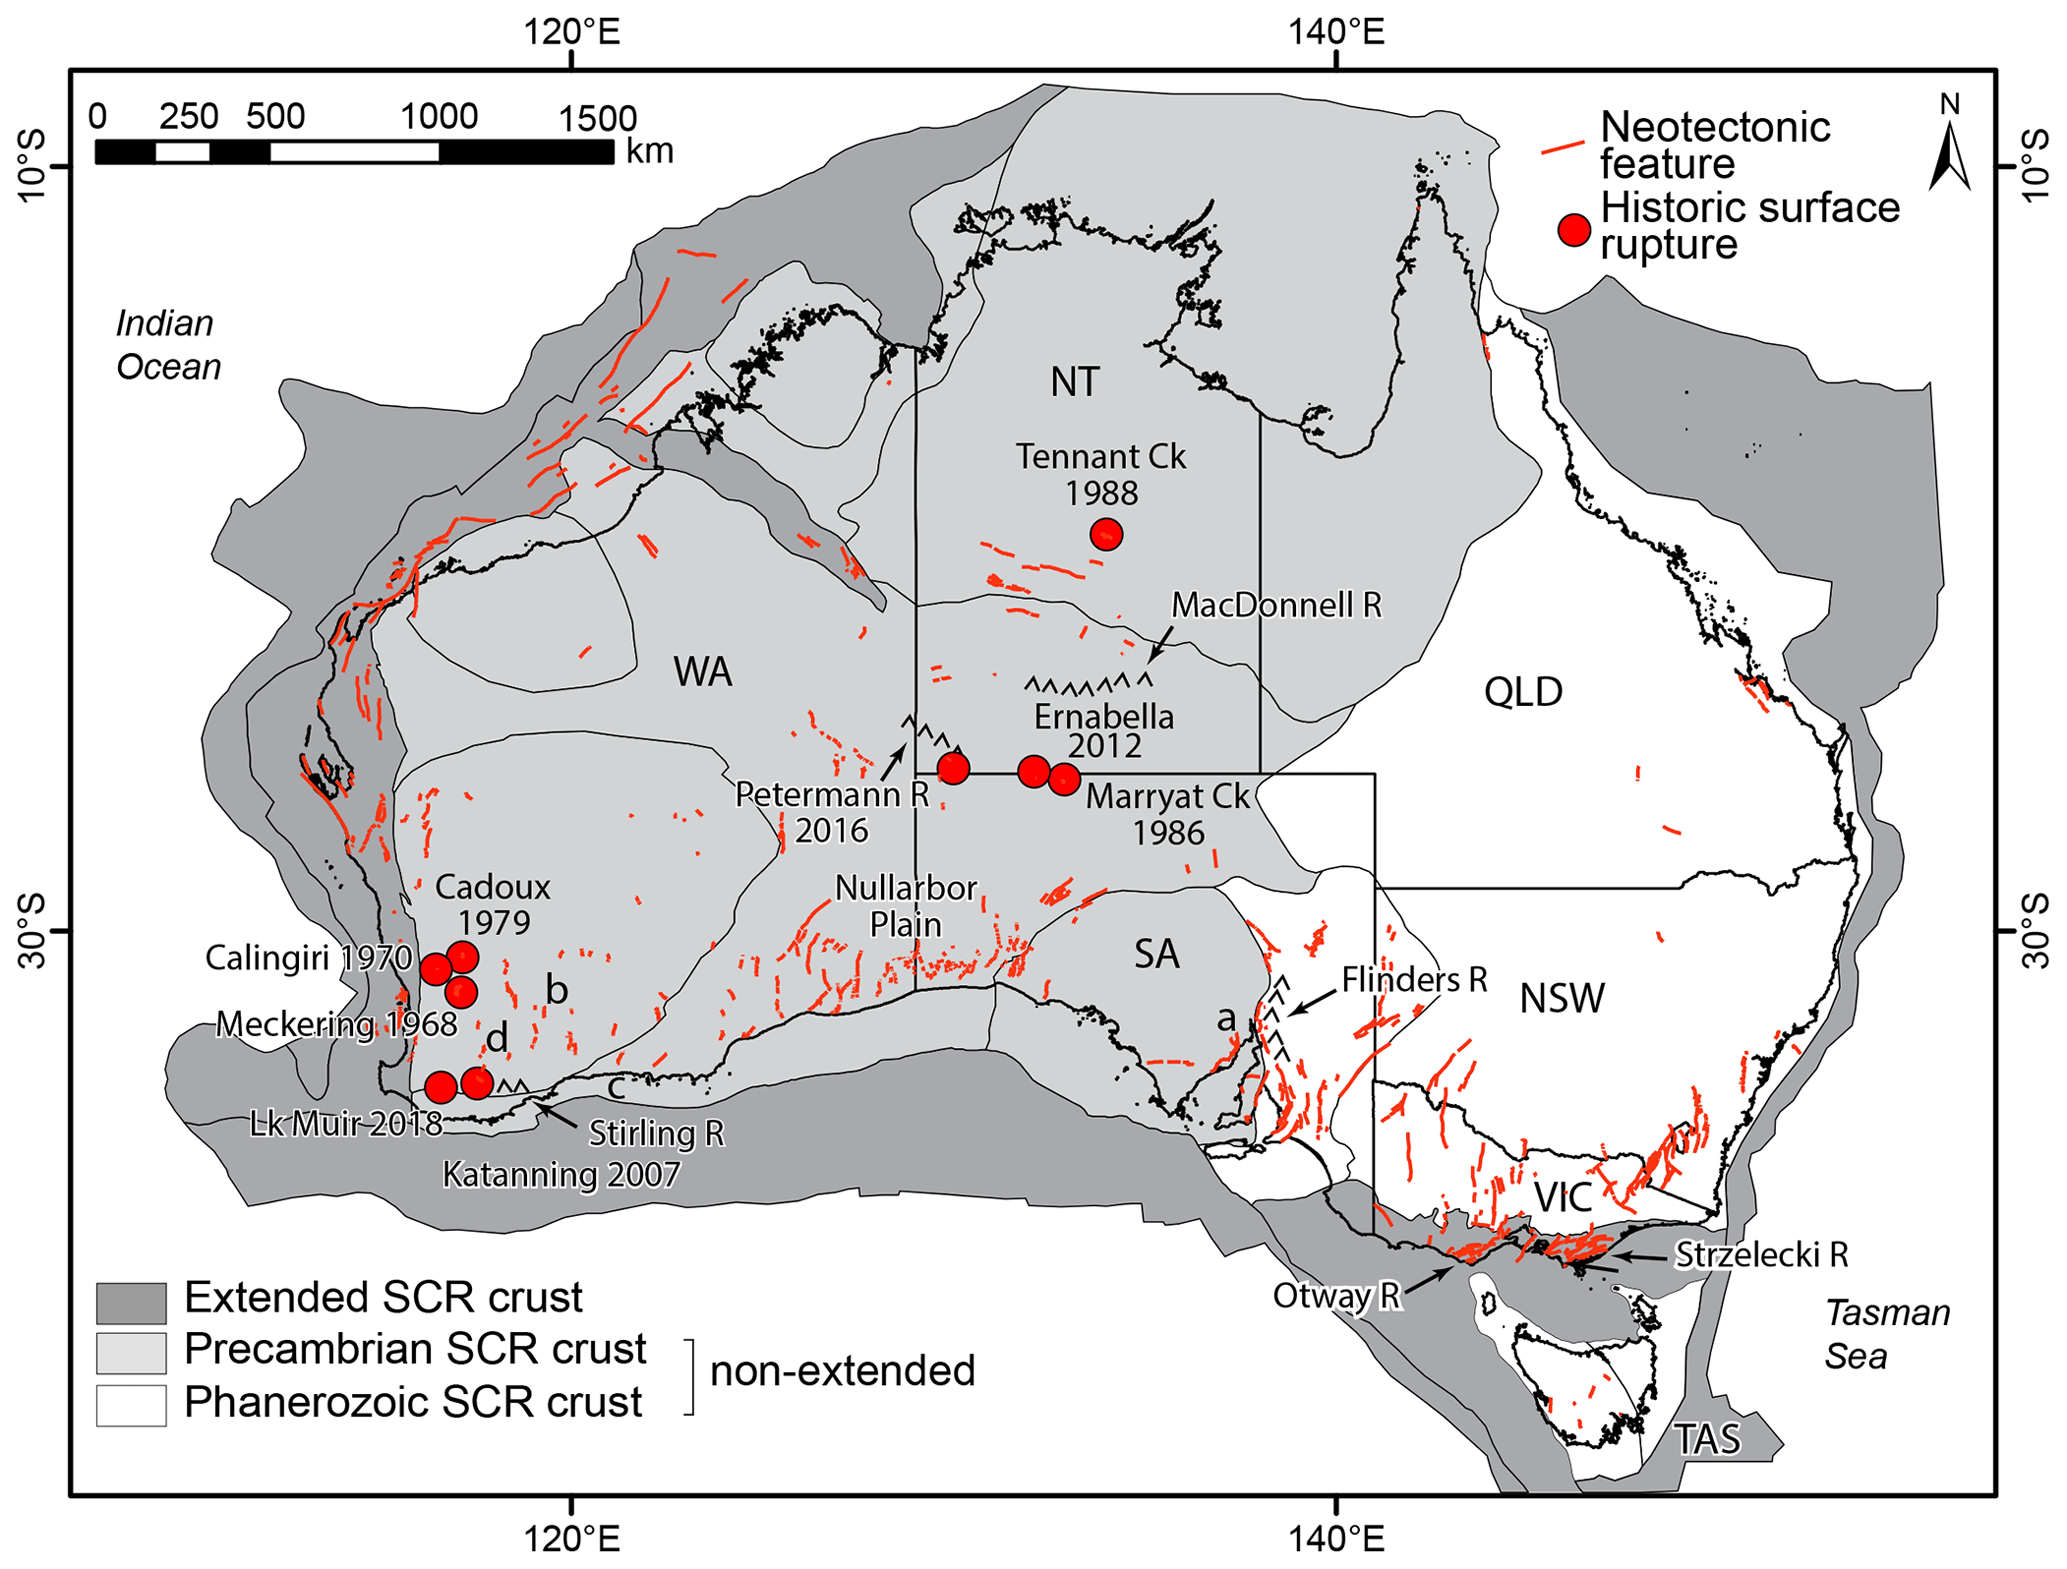
Figure 1An example of heterogeneity in seismogenic potential within stable continental region (SCR) crust from Australia. Base map shows neotectonic superdomains (after Leonard et al., 2014) and the outlines of Australian states and territories. Neotectonic features (red lines) from the Australian Neotectonic Features Database (Clark et al., 2012; Clark, 2012). Historical surface ruptures shown as red dots labelled with the year of the event. Note all historical surface ruptures have occurred in Precambrian non-extended stable continental region crust (Johnston et al., 1994). Key locations include a: Roopena scarp; b: Hyden scarp, c: Lort River scarp; and d: Dumbleyung scarp.
While accounting for less than 10 % of historical global SCR moment release (Schulte and Mooney, 2005), non-extended SCR crust accounts for more than two-thirds of the surface-deforming earthquakes documented (Table 1) and is locally associated with a rich palaeoseismic record (e.g. Crone and Machette, 1995; Rajendran et al., 1996; Crone et al., 2003; Wheeler, 2006; Clark et al., 2008, 2012, 2015; Estrada, 2009; Quigley et al., 2010; Clark, 2010; Zellman and Ostenaa, 2016). Within the Australian SCR, Leonard et al. (2014) divided the non-extended part into Precambrian and Phanerozoic elements based on differences in seismogenic potential implied by the character of neotectonic features (after Clark et al., 2012; Fig. 1). The older crust was associated with a lower seismogenic potential, consistent with the hypothesis proposed by Mooney et al. (2012) that seismogenic potential is inversely proportional to lithospheric thickness. Perhaps counterintuitively, the historical record of seismicity and surface rupture is particularly rich in the Australian Precambrian non-extended SCR (Leonard, 2008; Clark, 2010; Leonard and Clark, 2011), which has hosted nine of the 15 historical earthquakes documented to have produced surface ruptures in SCR crust globally (Table 1, Fig. 1).
In this paper we report on the geological setting and characteristics of the most recent of the nine surface rupturing earthquakes in the Australian Precambrian SCR crust; this includes the 2018 Mw 5.3 Lake Muir earthquake. The earthquake was followed by an extensive aftershock swarm and a proximal Mw 5.2 earthquake 51 d after the 16 September event, which deformed but did not break the surface. InSAR observations of surface deformation relating to both Mw>5.0 events were validated using field observations, unmanned aerial vehicle (UAV)-acquired high-resolution digital elevation data and hypocentres calculated from a local seismic network deployed in the days following the first, Mw 5.3, event. Analysis of the Lake Muir earthquake sequence provides guidance as to how other moderate- to large-magnitude SCR seismic sequences might be interpreted (e.g. Adams et al., 1992; Bent, 1994; Baumbach et al., 1994) and further constraint for models describing localized strain release as earthquakes in non-extended SCR crust worldwide.
1.1 The Lake Muir Earthquake Sequence
The Ml 5.7 (Mw 5.3) Lake Muir earthquake occurred at 04:56:24 UTC on 16 September 2018 in a rural area of southwest Western Australia, ∼60 km east of the town of Manjimup and a similar distance north of the town of Walpole (Fig. 2). Approximately 20 km from the epicentre, relatively modest Modified Mercalli Intensity (MMI) values of VI were reported (Allen et al., 2019). With the exception of one unoccupied dwelling in the immediate epicentral area, which was extensively damaged, only minor damage and no injuries were reported. The event was widely felt throughout the Perth Basin, including the Perth metropolitan region, over 300 km away. Focal mechanisms suggest a reverse faulting mechanism, with a minor dextral transcurrent component and moderately east and northwest dipping nodal planes (Fig. 2, Table 2). Geoscience Australia recorded a magnitude Ml 3.4 foreshock 3 d prior to the mainshock. A protracted aftershock sequence, comprising hundreds of located events, was punctuated by a Ml 4.6 event on 12 October at 16:31:30 UTC (Fig. 3, Table 2). Almost 2 months after the 16 September Mw 5.3 event, a Ml 5.4 (Mw 5.2) event occurred on the 8 November at 21:07:01 UTC. Within the error estimates of the original hypocentral determinations, this event was collocated with the 16 September event (see weblinks in Table 2). The focal mechanisms calculated for the November event indicate predominantly dextral strike-slip faulting, with steeply northwest and southwest dipping nodal planes. The percentage double-couple from the U.S. Geological Survey (USGS) W-phase moment tensor solution is 31 % (Fig. 2, Table 2). This event was felt much more strongly and widely than the slightly larger first event, with MMI of VII to VIII being recorded close to the epicentre. There are several factors that might explain the relatively greater number (and density) of felt reports from the 8 November earthquake, including the following:(1) the time of day, which was early morning, when people are more likely to be stationary and thus more likely to perceive ground shaking; (2) differences in the ground motion radiation pattern and/or stress drop of the earthquake that may have yielded greater shaking in population centres at perceptible frequencies; and/or (3) greater community awareness of the earthquake sequence and where to find sources of further information. Surface rupture relating to the September event was initially identified with InSAR (Fig. 2) and has been subsequently verified by ground survey (this paper).
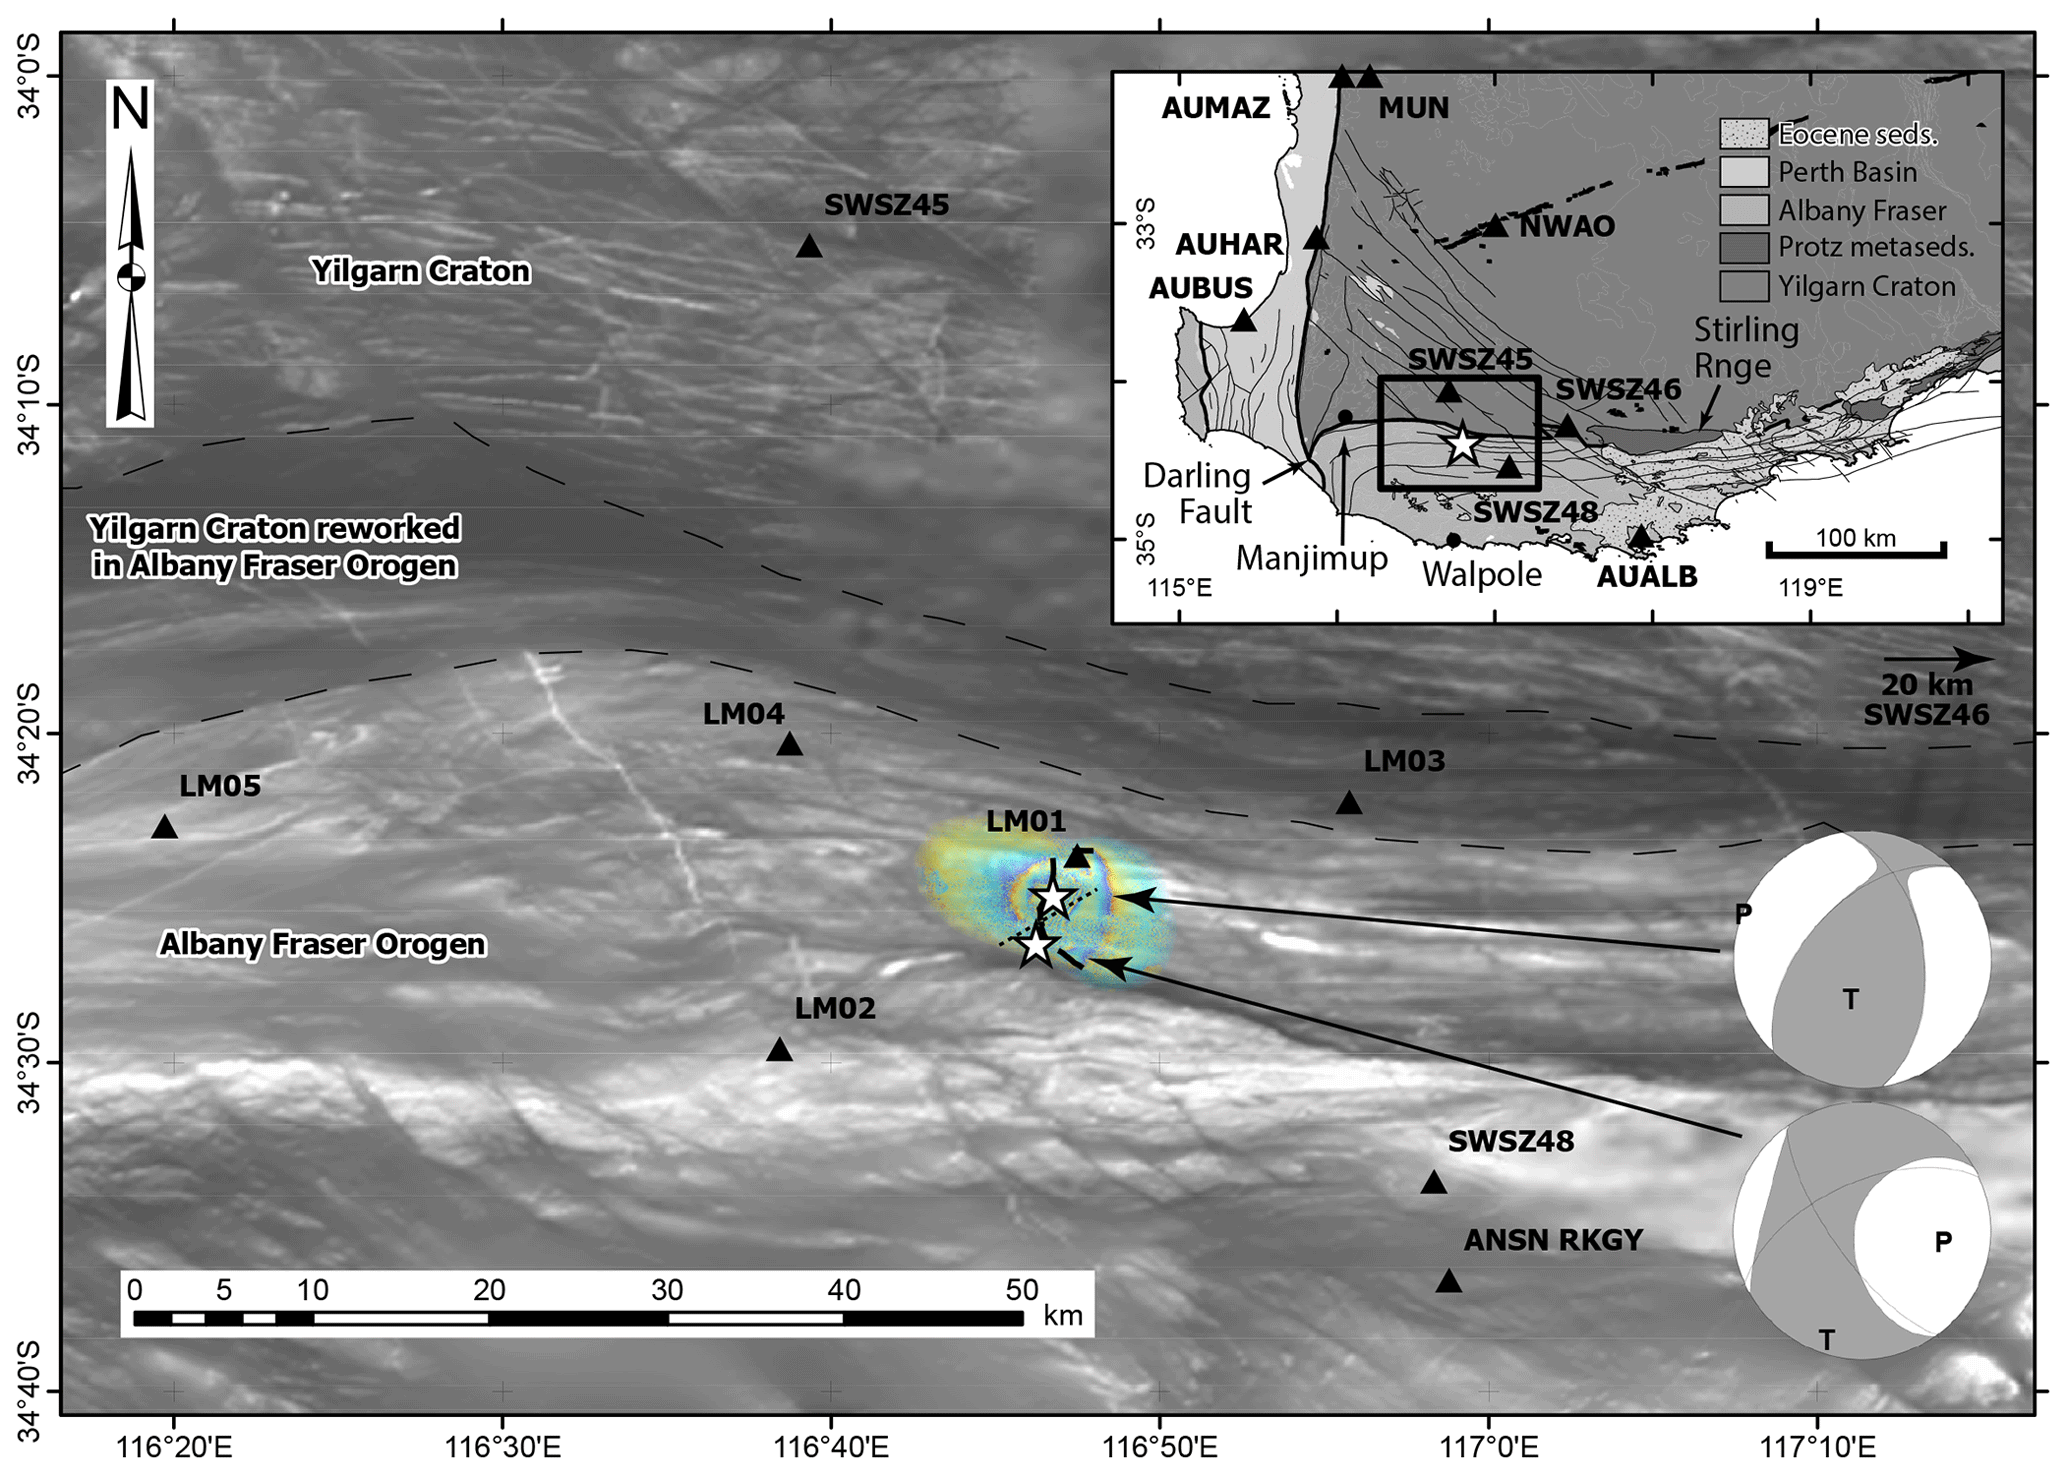
Figure 2Location and geological setting of the 2018 Lake Muir earthquake sequence in southwest Western Australia. Inset shows Precambrian basement geology and overlying Phanerozoic Perth Basin and Eocene rocks (modified after Geological Survey of Western Australia, 2016). Proterozoic and younger faults and dikes are shown as thick and thin black lines, respectively. Base map in the main frame shows reduced-to-pole total magnetic intensity data (Milligan and Nakamura, 2015). Black triangles show the locations of seismic recording stations (rapid deployment kits are prefixed with LM) and GPS stations (SWSZ prefix). The location of the two M>5 earthquake epicentres are shown by white stars, with arrows indicting the associated focal mechanisms (see Table 2 for source). The surface rupture trace from the September event and the surface deformation front from the November event are shown by solid and dashed black lines, respectively (see text for details). The InSAR phase image for the September Mw 5.3 earthquake is overlain to demonstrate the scale of surface deformation.
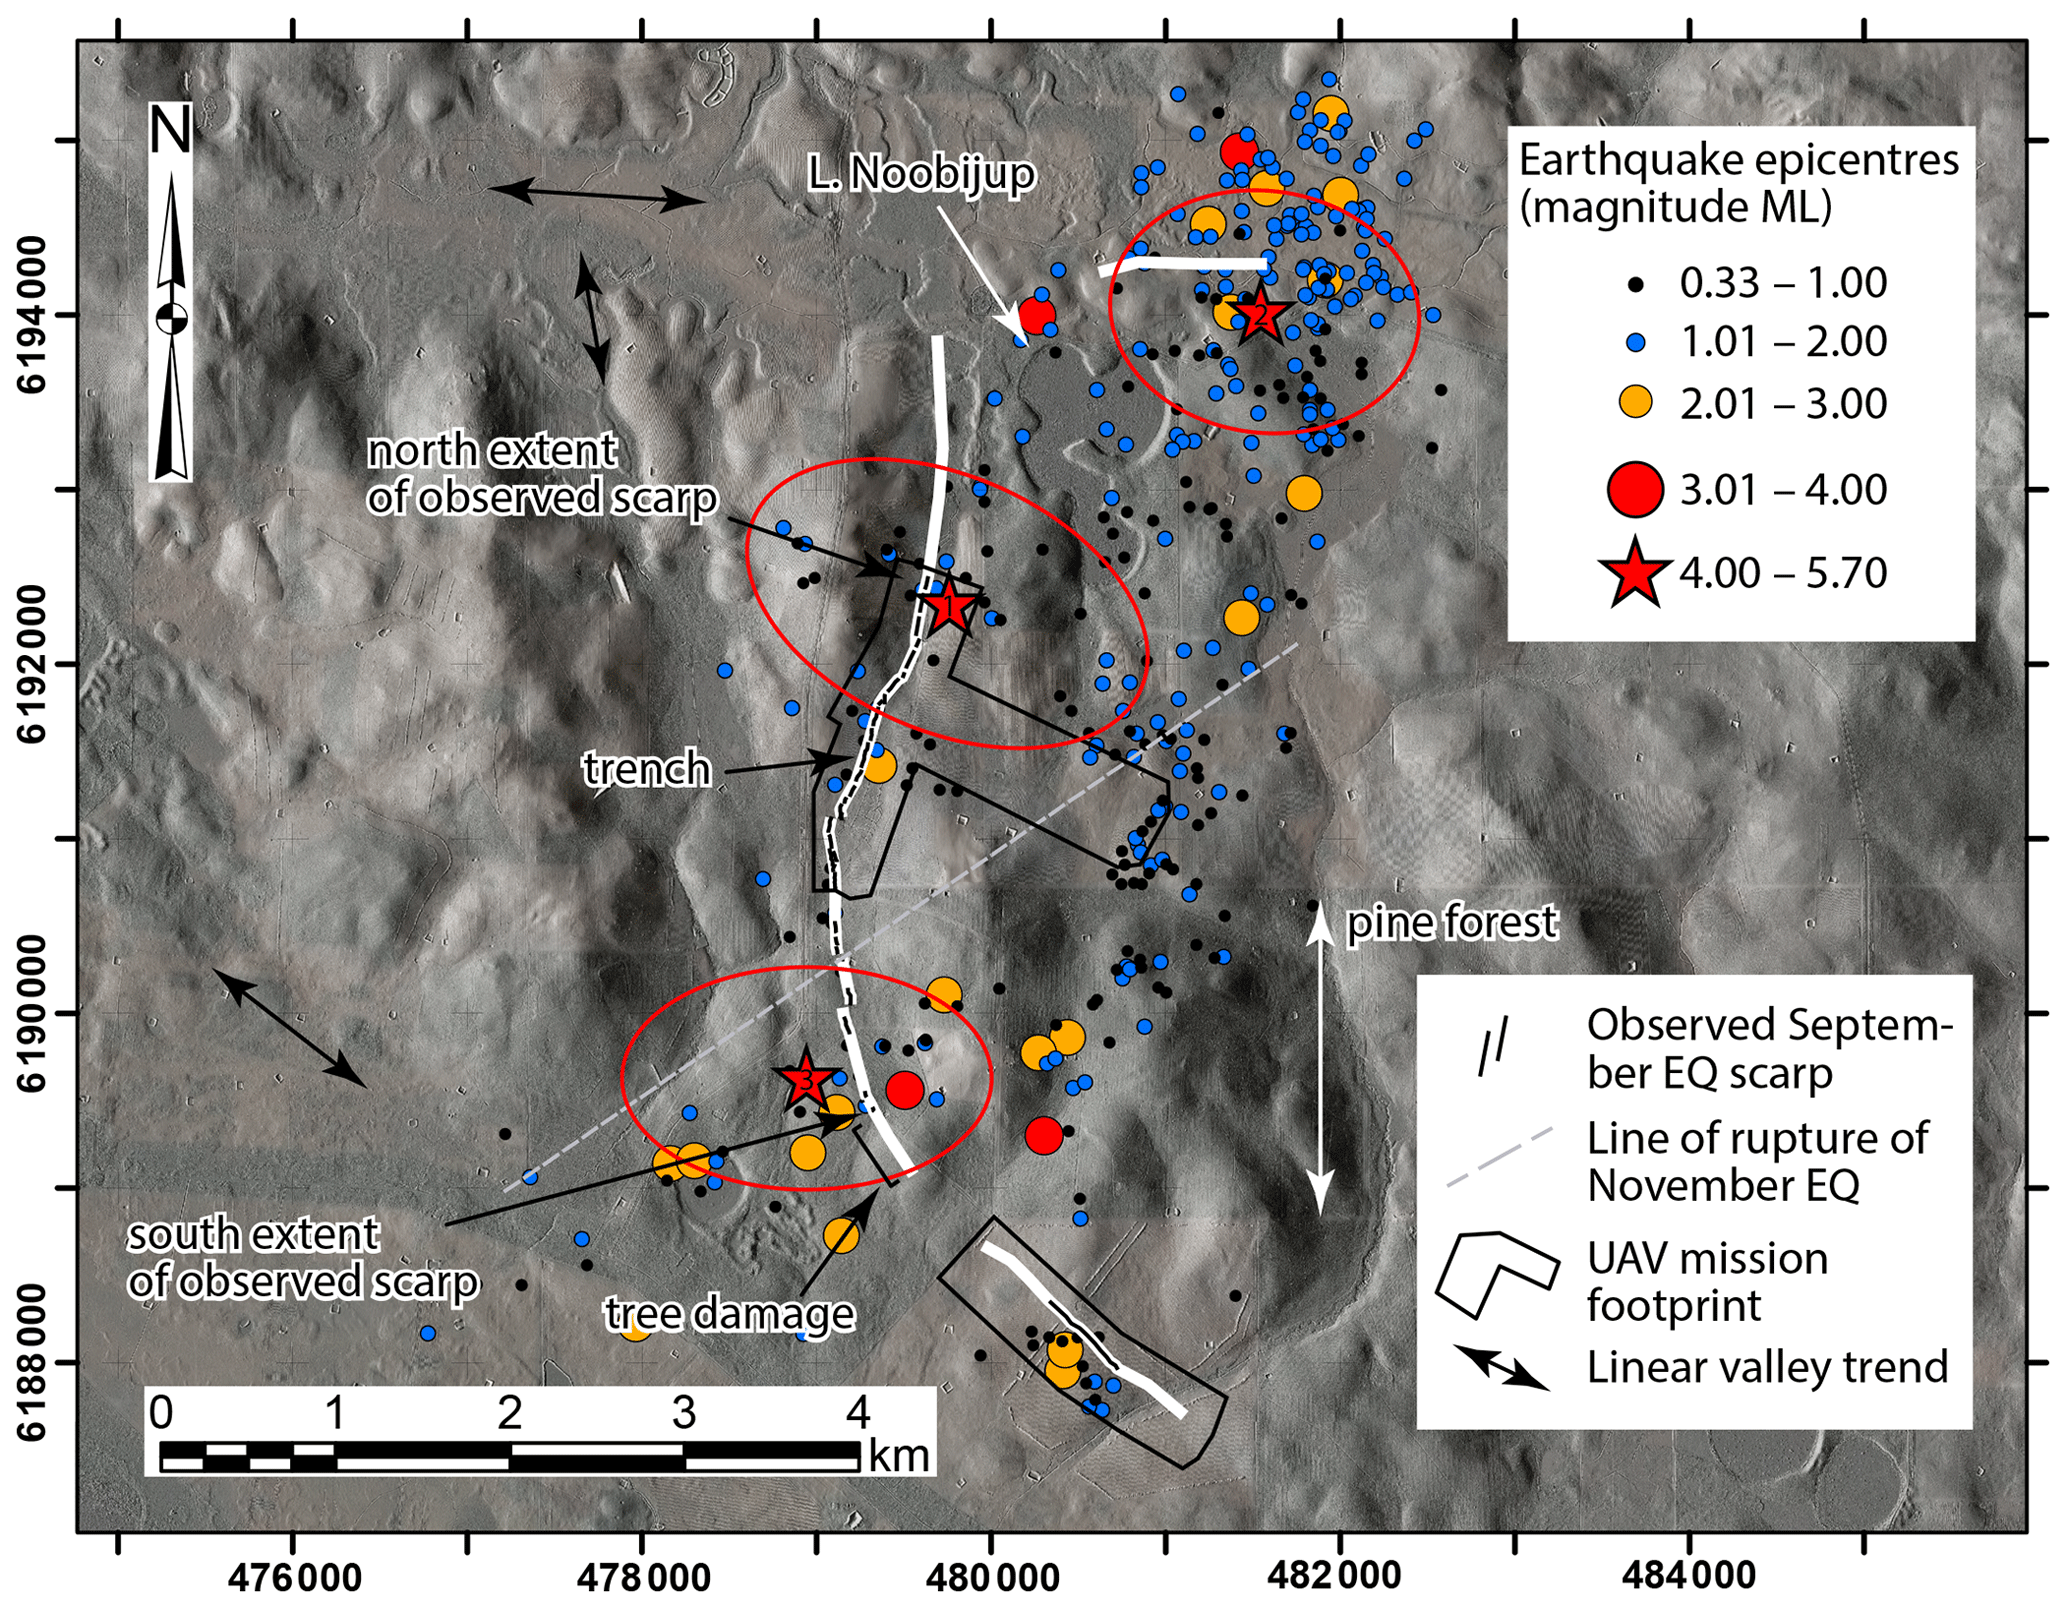
Figure 3Map of the Lake Muir surface ruptures and associated seismicity. Background map is part of the Western Australian Department of Biodiversity, Conservation and Attractions lidar holdings (https://www.dbca.wa.gov.au/contact-us, last access: 27 September 2018) with Esri world imagery overlain at 75 % transparency. White line shows the extent of the discrete surface rupture relating to the September event, as mapped from InSAR. Superposed black lines are scarp segments mapped on the ground. Grey dashed line shows the discrete line of deformation relating to the November event, as mapped from InSAR. The three largest events and their uncertainty ellipses, 16 September Mw 5.3, 12 October Ml 4.6 and 8 November Mw 5.2, are consecutively numbered (see Table 2).
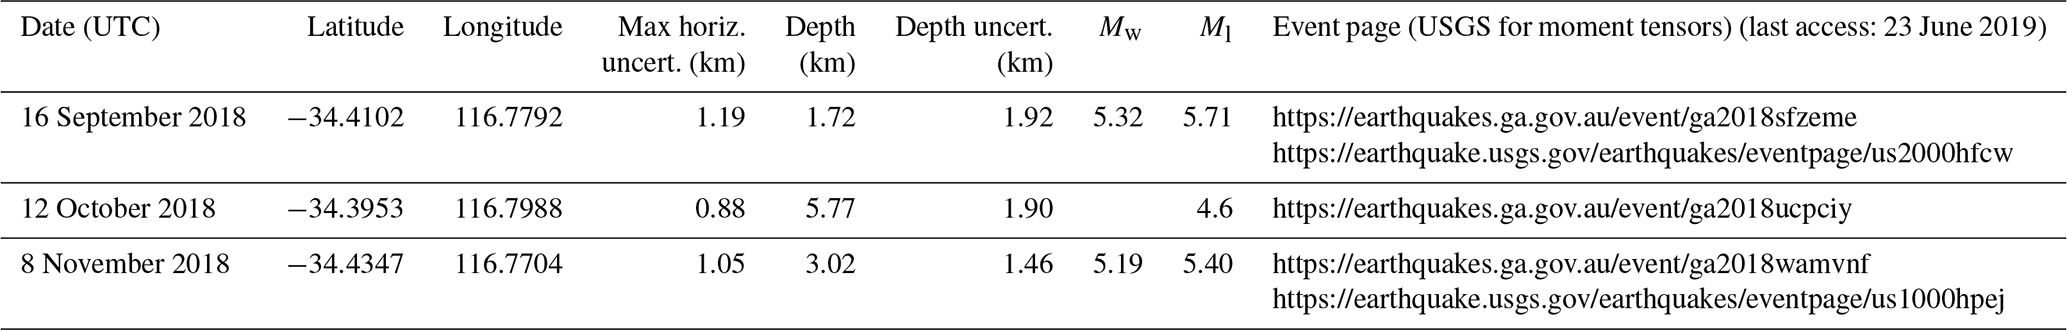
Table 2Selected source parameters and resource links for the three largest events in the Lake Muir earthquake sequence.
1.2 Geological and seismotectonic setting of the Lake Muir earthquake sequence
The Lake Muir earthquake sequence occurred within 1700–1600 Ma rocks of the Biranup Zone of the Proterozoic Albany–Fraser Orogen (Fitzsimons and Buchan, 2005; Spaggiari et al., 2009) (Fig. 2). During the Mesoproterozoic Albany–Fraser Orogeny these rocks were thrust to the north over the 3000–2600 Ma rocks of the Northern Foreland of the Albany–Fraser Orogen (the portion of the Archaean Yilgarn Craton that was reworked during the Albany–Fraser Orogeny) along moderately south-dipping faults. In the Lake Muir region, the dominant east- to east-southeast-striking structural grain is associated with the major structures bounding these thrust sheets. East-striking structural and lithological trends relating to the Albany–Fraser Orogen are transected by northwest-trending structures related to Proterozoic to earliest Phanerozoic movement on the Darling Fault Zone to the west (Janssen et al., 2003). The Boyagin dike swarm cuts across much of the southwest, including the Yilgarn Craton and Albany–Fraser Orogen (Prider, 1948; Myers, 1990; Harris and Li, 1995), and is subparallel to this structural trend. Minor north- and northeast-trending structures may relate to the Gondwana breakup or later movement focused on the Darling Fault, parallel structures to the west thereof (e.g. the Dunsborough and Busselton faults) and associated oblique structures (Harris, 1996; Olierook et al., 2015). Eocene alluvial sediments (Werillup Formation) and marine siltstone and sandstone (Pallinup Formation) locally infill topography in the crystalline basement (Wilde and Walker, 1984). Deposits have been correlated to map a Paleogene palaeo-channel system (Smith, 2010). These sediments and ferricrete developed within them are reported to be locally faulted by up to 5–7 m vertically based upon evidence from drill holes (Chakravartula and Street, 2000; Smith, 2010). The sparsity of boreholes precludes determination of fault orientation.
The Lake Muir region lies near to the southern boundary of a broad band of relatively high seismicity crossing the southwest corner of Western Australia known as the Southwest Seismic Zone (SWSZ; Doyle, 1971), which is one of the most seismically active regions in Australia (e.g. Leonard, 2008; Allen et al., 2018). Earthquake activity in the SWSZ appears to have increased significantly since the 1940s (Leonard, 2008), and it has generated five of the nine known Australian historic surface ruptures (all associated with reverse faulting, Table 1). In addition to large shallow events and scattered smaller events, the SWSZ has produced several dozen earthquake swarms in the last 40 years, including the Burakin swarm of 2000–2002 during where ∼18 000 events of mixed focal mechanism (including six events in the magnitude range Mw 4.0–4.6) were recorded in a period of only a few months (Leonard, 2002; Allen et al., 2006; Dent, 2016). While most swarm centres occur within the SWSZ, they have a broader distribution across the southwest of Western Australia (Dent, 2016), with an essentially random pattern that is similar to fault scarps relating to prehistorical events (Clark, 2010; Clark et al., 2012). The relatively uniform spatial distribution of north-trending reverse fault scarps is consistent with scarp formation under conditions imposed by the contemporary east–west oriented compressive crustal stress regime (e.g. Rajabi et al., 2017b) and suggests that seismogenic strain release is uniformly distributed over the Yilgarn Craton over the timescale recorded in the land surface (ca. 100 kyr or more) (Leonard and Clark, 2011).
1.3 Landscape context of the Lake Muir earthquake sequence
Examination of a 2012 lidar dataset (see the Supplement) revealed the presence of an alignment of valleys and ridges that mimics structural trends evident in the continental- and regional-scale magnetic data (cf. Figs. 2 and 3) (Chakravartula and Street, 2000; Milligan and Nakamura, 2015). The main ridge-line, valley and drainage trends in the study area are broadly to the east-southeast and north, with a subordinate northwest trend (black double-ended arrows in Fig. 3). Ridges are subdued, broad and undulating. Valley floors are flat-bottomed and are locally occupied by lakes and swamps, implying the presence of significant sedimentary infill (cf. Commander et al., 2001; Smith, 2010). Lunettes are developed on the east and southeast sides of most lakes, often with evidence for minor remobilization into parabolic dunes. Knickpoint retreat from a regional topographic low to the southwest occupied by Lake Muir is observed in several instances to be rejuvenating the drainage within flat-bottomed valleys, resulting in the removal of valley-fill sediments and the accentuation of structural trends evident in the alignment of adjacent linear ridges. There is no landscape evidence for sharp vertical dislocations of valley floor sediments that might relate to Late Pleistocene or Holocene surface-rupturing seismic events.
2.1 InSAR processing method
Since the 1992 Mw 7.3 Landers earthquake (Massonnet et al., 1993), remote sensing techniques have been shown to be valuable tools for observing surface deformation and damage patterns relating to earthquakes in a range of tectonic settings (e.g. Livio et al., 2017; Klinger et al., 2018; Wang et al., 2019; Gold et al., 2019; Scott et al., 2019). Interferometric Synthetic Aperture Radar (InSAR) in particular has greatly improved the detectability of surface faulting and surface deformation, especially relating to small- to moderate-sized earthquake sequences in remote or poorly instrumented areas, such as SCRs (Satyabala, 2006; Dawson et al., 2008; Amarjargal et al., 2013; Livio et al., 2017; Gardonio et al., 2018). Surface deformation relating to 11 SCR earthquakes has been imaged using InSAR (Table 1). Following the launch of Sentinel-1A and Sentinel-1B missions in 2014 and 2016, respectively, there is now a near-global coverage of SAR acquisitions every 12 d (https://sentinel.esa.int/web/sentinel/missions/sentinel-1/overview, last access: 23 June 2019). The availability of this rich dataset has enabled global systematic studies of earthquake detectability in InSAR data (e.g. Barnhart et al., 2019; Funning and Garcia, 2019) and, for the first time in an SCR setting, has allowed us to construct coseismic interferograms for two events within the same SCR seismic sequence.
For each of the two earthquake events we generated a coseismic interferogram from two Sentinel-1 interferometric wide-swath SAR images (earthquake 1: 14 and 26 September 2018; earthquake 2: 1 and 13 November 2018) using a standard interferometric SAR processing workflow implemented with the Gamma software (Wegmüller and Werner, 1997). The topographic component of the phase signal was removed using a 1 arcsec Shuttle Radar Tomography Mission (SRTM) digital elevation model (Geoscience Australia, 2011), and the orbital component was removed using precise orbital ephemerides (POE) products. Each interferogram was subsampled (multi-looked) eight times in range and two times in azimuth to reduce phase noise. An adaptive spatial filter (Goldstein and Werner, 1998) with exponent 0.5 was applied to each interferogram to further reduce phase noise prior to automatic unwrapping using a minimum-cost flow algorithm (Costantini, 1998). The automatically unwrapped interferogram for the September earthquake had significant errors due to poorer phase coherence around the surface rupture zone. A manual approach to unwrapping this interferogram was therefore applied using the branch-cut method (Goldstein et al., 1988).
2.2 Field observation and UAV digital terrain models
The epicentral regions of the earthquakes were visited over 3 d (12–14 November 2018), less than a week after the November event. The scarp produced by the September event was mapped, and evidence for rejuvenation of the scarp during the November event was assessed. A hand trench was excavated across the central section of the September scarp to assess fault dip and displacement.
Because InSAR captures a single displacement vector in the radar line of sight (LOS) and commonly decorrelates in regions close to earthquake surface ruptures where displacement gradients exceed the Nyquist sampling rate or cause pixels to no longer overlap (e.g. Hamling et al., 2017; Metzger et al., 2017; Gold et al., 2019), it is desirable to obtain independent validation data. In order to recover part of the surface vertical deformation envelope associated with the events, aerial photographs were acquired with a DJI Phantom 4 unmanned aerial vehicle (UAV) in an approximately 500 m wide swath along a 2 km length of the September event scarp. An approximately 2 km long cross line was also flown, extending eastward from the scarp across the region of most significant surface deformation indicated in the InSAR imagery (Fig. 3). Ground control was provided by an RTK GPS, with mean horizontal and vertical measurement uncertainties of 0.026±0.025 and 0.056±0.055 m, respectively. A third mission covered the southern extent of surface deformation indicated in the InSAR imagery (Fig. 3). The results of this mission are presented in the Supplement (Fig. S1).
The image dataset was processed using a structure-from-motion (SfM) and multi-view stereo approach, implemented in the software Agisoft Photoscan Pro 1.4.3 (Agisoft LCC, 2018). The resulting dense point cloud achieved a standard deviation of the location differences between it and the control points of 0.09 m in the horizontal and 0.01 m in the vertical, which is comparable to other studies using similar ground control point (GCP) densities (e.g. Gindraux et al., 2017). Several studies of factors impacting local photogrammetry-derived digital terrain model (DTM) accuracy (e.g. Tonkin and Midgley, 2016; Gindraux et al., 2017) report a vertical accuracy decrease of ∼0.1 m for every 100 m increase in the distance to the closest GCP. In our study the maximum distance from a control point is on the order of 200–300 m. A 6 cm resolution DTM was produced from the dense point cloud.
The elevation values from a lidar dataset collected by the Western Australian Government Department of Biodiversity, Conservation and Attractions in 2012 were subtracted from the UAV DTM produced in this study, to produce a DTM of difference (DoD; Williams, 2012). The average magnitude of the uncertainties associated with the elevation values for the lidar dataset is reported as 0.063±0.074 m. The combined location uncertainty in the DoD might therefore be expected to be on the order of 0.1–0.2 m. Details of the processing steps are presented in the Supplement.
The focal mechanism computed for the September earthquake (Fig. 2) indicates almost pure reverse motion. In this instance, the majority of landscape change would be expected to be vertical and so detectable in the DoD. In contrast, the November earthquake was dominantly strike-slip (Fig. 2). The deformation envelope detectible with the deployed technologies should therefore relate almost exclusively to the September reverse faulting event, with further deformation from the November event remaining largely undetected. To quantify vertical surface displacement associated with the September earthquake, we extracted swath profiles through the DoD (and the unwrapped InSAR images) parallel and perpendicular to the rupture using the swath profiler tool for Esri ArcGIS (Pérez-Peña et al., 2017). The swath profiles sample the topography perpendicular to the profile to a set on distance either side of the profile line. A range of statistics (percentiles, quartiles and max/min/mean) might then be assessed in order to account for the noisy character of the UAV-derived DTM.
2.3 Rapid deployment aftershock kits
Within 5 d of the 16 September event five seismic rapid deployment kits (RDKs) and three GPS kits were deployed in the epicentral region (Fig. 2). The seismic sensors included four short-period Lennartz LE-3Dlite seismometers and one Trillium Compact seismometer. The short-period instruments were paired with Nanometrics Titan accelerometers recording at 200 Hz to capture any strong ground motions from the aftershock sequence. The RDK locations (prefixed LM on Fig. 2) were selected to maximize azimuthal coverage of the study area, taking into account the location of one permanent Australian National Seismic Network (ANSN) station near Rocky Gully (RKGY), fortuitously located 24 km from the epicentre of the 16 September earthquake. The network geometry also considered the capture of ground-motion data at a range of source–receiver distances for subsequent attenuation studies. One RDK (LM01) was deployed at the initial epicentral location of the 16 September event. Waveform data were telemetered in real-time to the National Earthquake Alerts Centre at Geoscience Australia to support real-time aftershock detection and analysis. The RDK locations therefore required adequate connection to local 3G and 4G telecommunication networks. Additional factors considered in the deployment configuration were the local site geology, availability of sunlight to power the sensors and land access.
The three GPS kits were deployed on existing survey marks within a broader network covering the SWSZ, one of which was last occupied in 2012. The survey marks used (SWSZ45, SWSZ46 and SWSZ48) were approximately 36, 65 and 25 km away from the epicentral region, respectively (Fig. 2). Processing of the acquired GPS data from the SWSZ46 site produced an anomalous vertical displacement signal indicating 12 mm of subsidence. This signal could not be reconciled with the surface deformation related to the earthquakes, which was constrained to a near-field region smaller than 10 km from the surface rupture (Fig. 2), and so it is not discussed any further here.
3.1 Field observations
Initial reports from local residents following the September earthquake indicated the presence of west-facing fault scarps intersecting several farm tracks (e.g. Fig. 4a), loss of tension in an east–west running fence line (GDA94/MGA50; 479590 m E, 6192140 m N) and cracking in farm dam walls related to lateral spreading (Fig. 4b). Field investigation demonstrated that the track intersections could be linked to form an approximately 3 km long, concave-to-the-east, west-facing crescentic scarp (Fig. 3). In detail, the scarp comprises a series of left- and right-stepping en échelon segments 100–200 m long. In the central 2 km of the scarp, each segment is associated with up to 20–40 cm of vertical displacement (Fig. 4c, d). The morphology of individual scarp segments show little evidence for a strike-slip component to motion, varying between discrete thrust surface rupture with local fault-parallel folding and cracking and discrete thrust surface rupture with mole tracks (cf. Lin et al., 2004) and extensional fissuring associated with topographic bulges. Where the scarp crossed drainage lines, presumably associated with metres of sandy alluvial sediments, it becomes a broad warp, often associated with extensional fissuring parallel to the warp-crest and warp-perpendicular cracking at step overs.
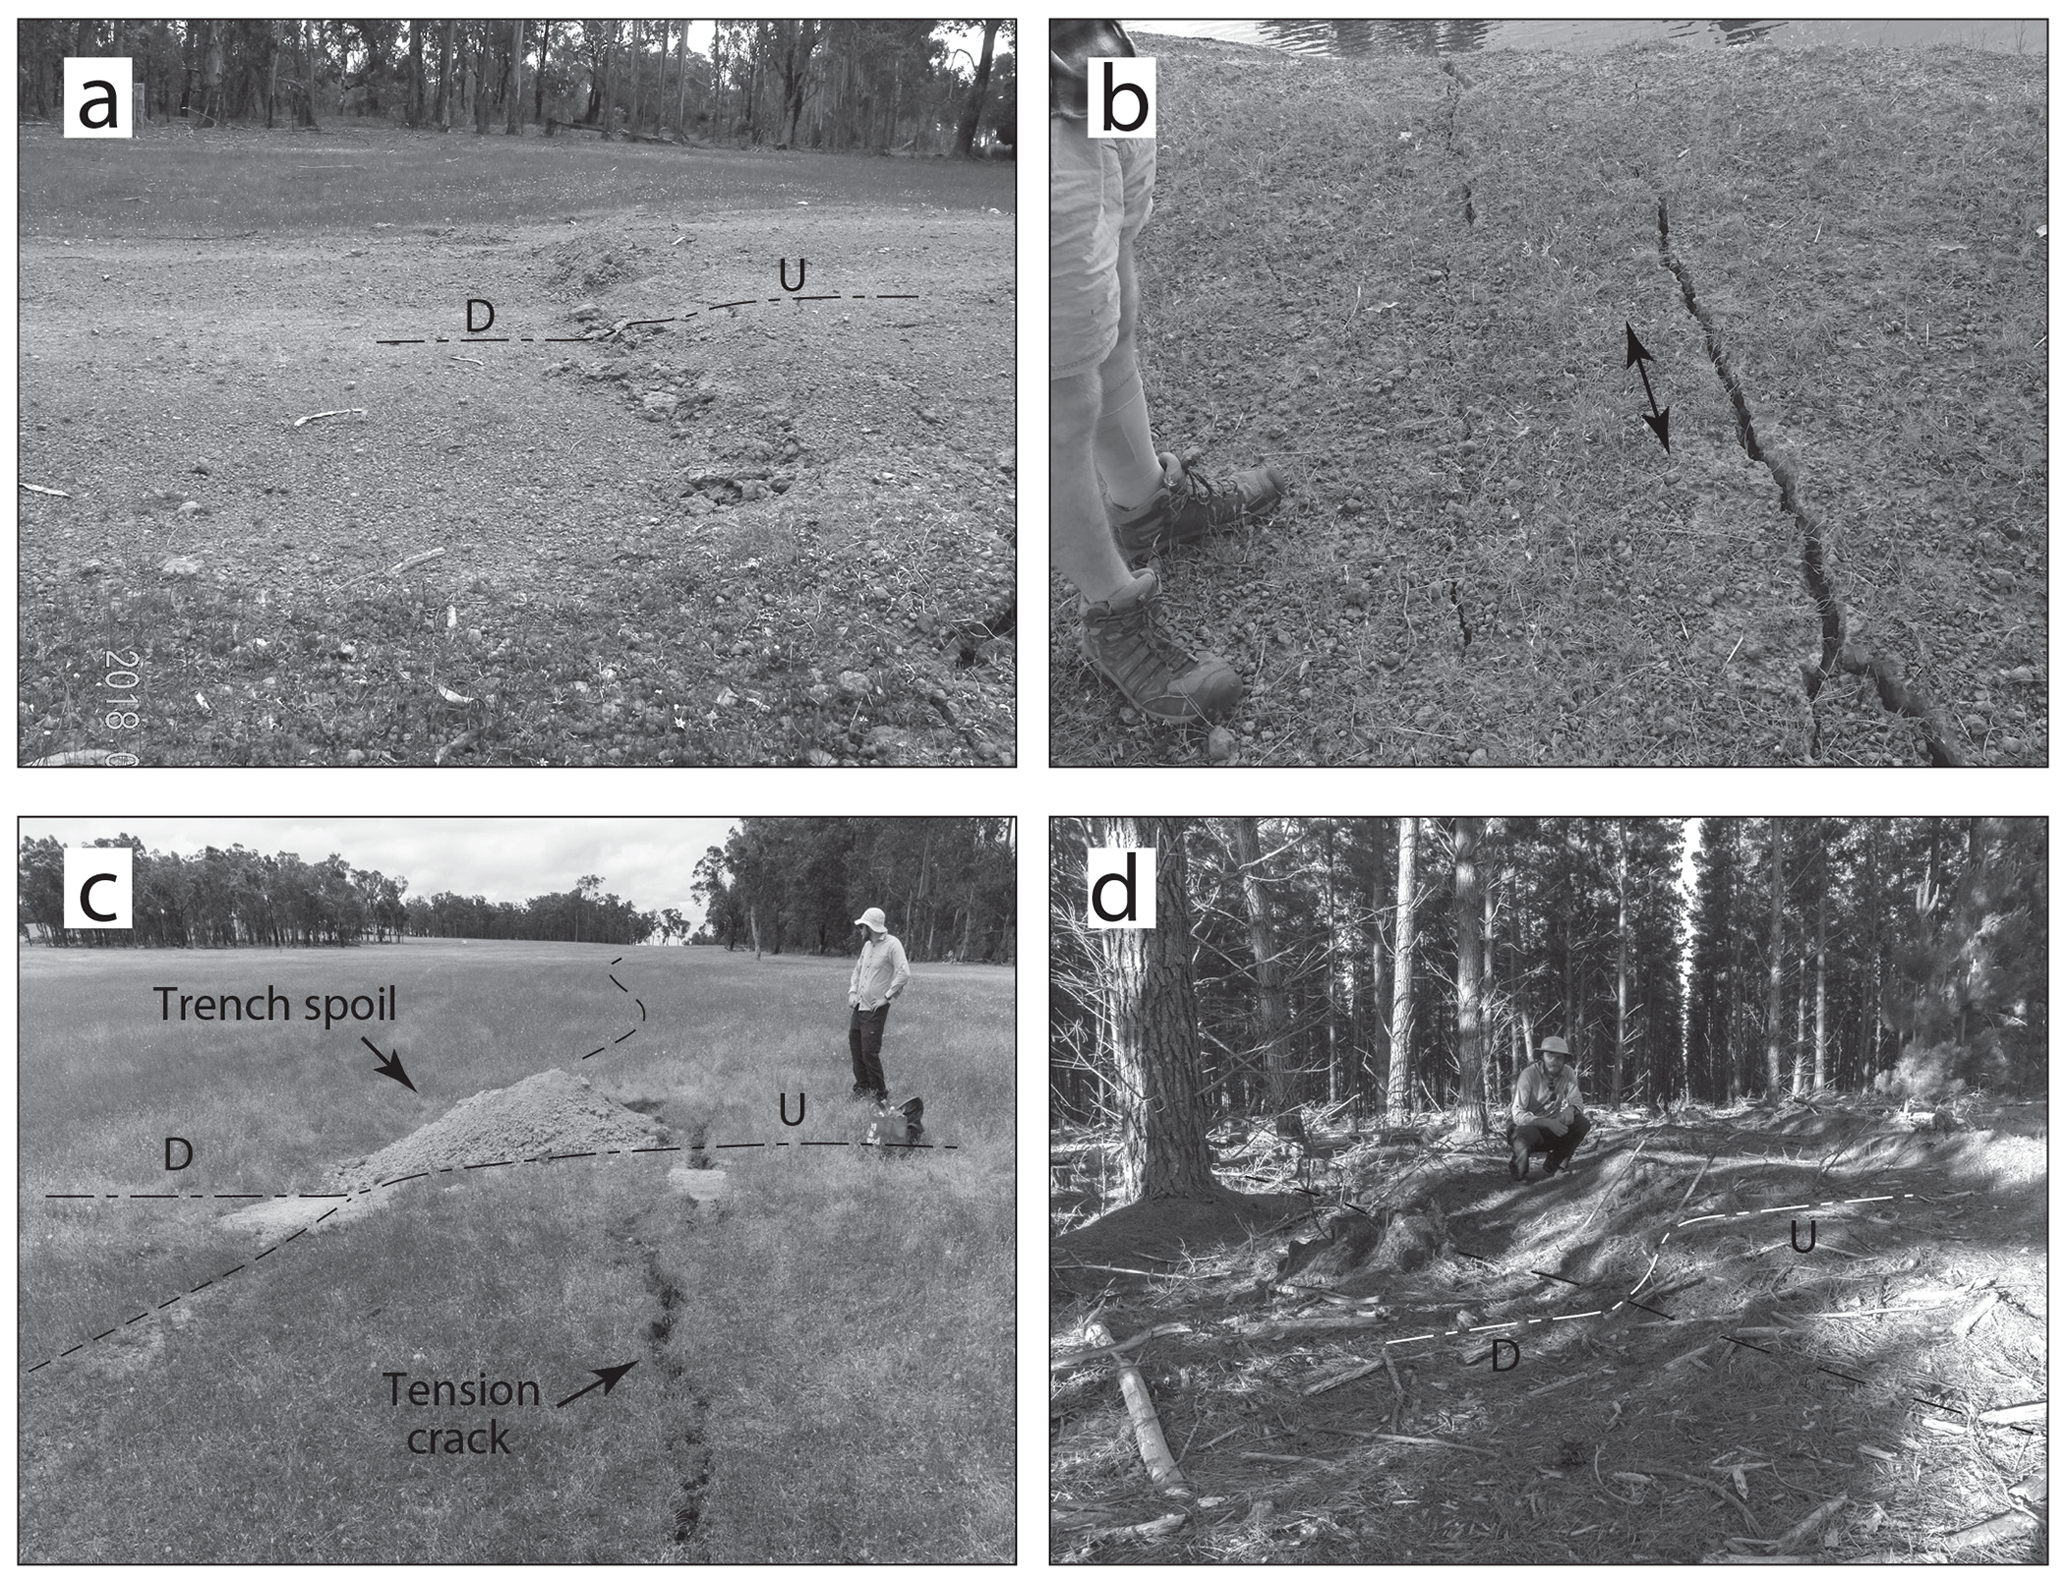
Figure 4Photographs of the surface rupture: (a) 13 cm high scarp crossing farm track. Photo taken by Roger Hearn on 27 September 2018. Looking north (479101 m E, 6190727 m N); (b) east-trending tension fissures relating to lateral spread into a farm dam (479588 m E, 6192126 m N); (c) 40 cm high scarp and hanging wall tension fissure at the hand trench location (see Fig. 5). Looking north (479285 m E, 6191496 m N); (d) 40 cm high scarp in pine plantation. Looking northeast (479112 m E, 6190422 m N). GD94/MGA50.
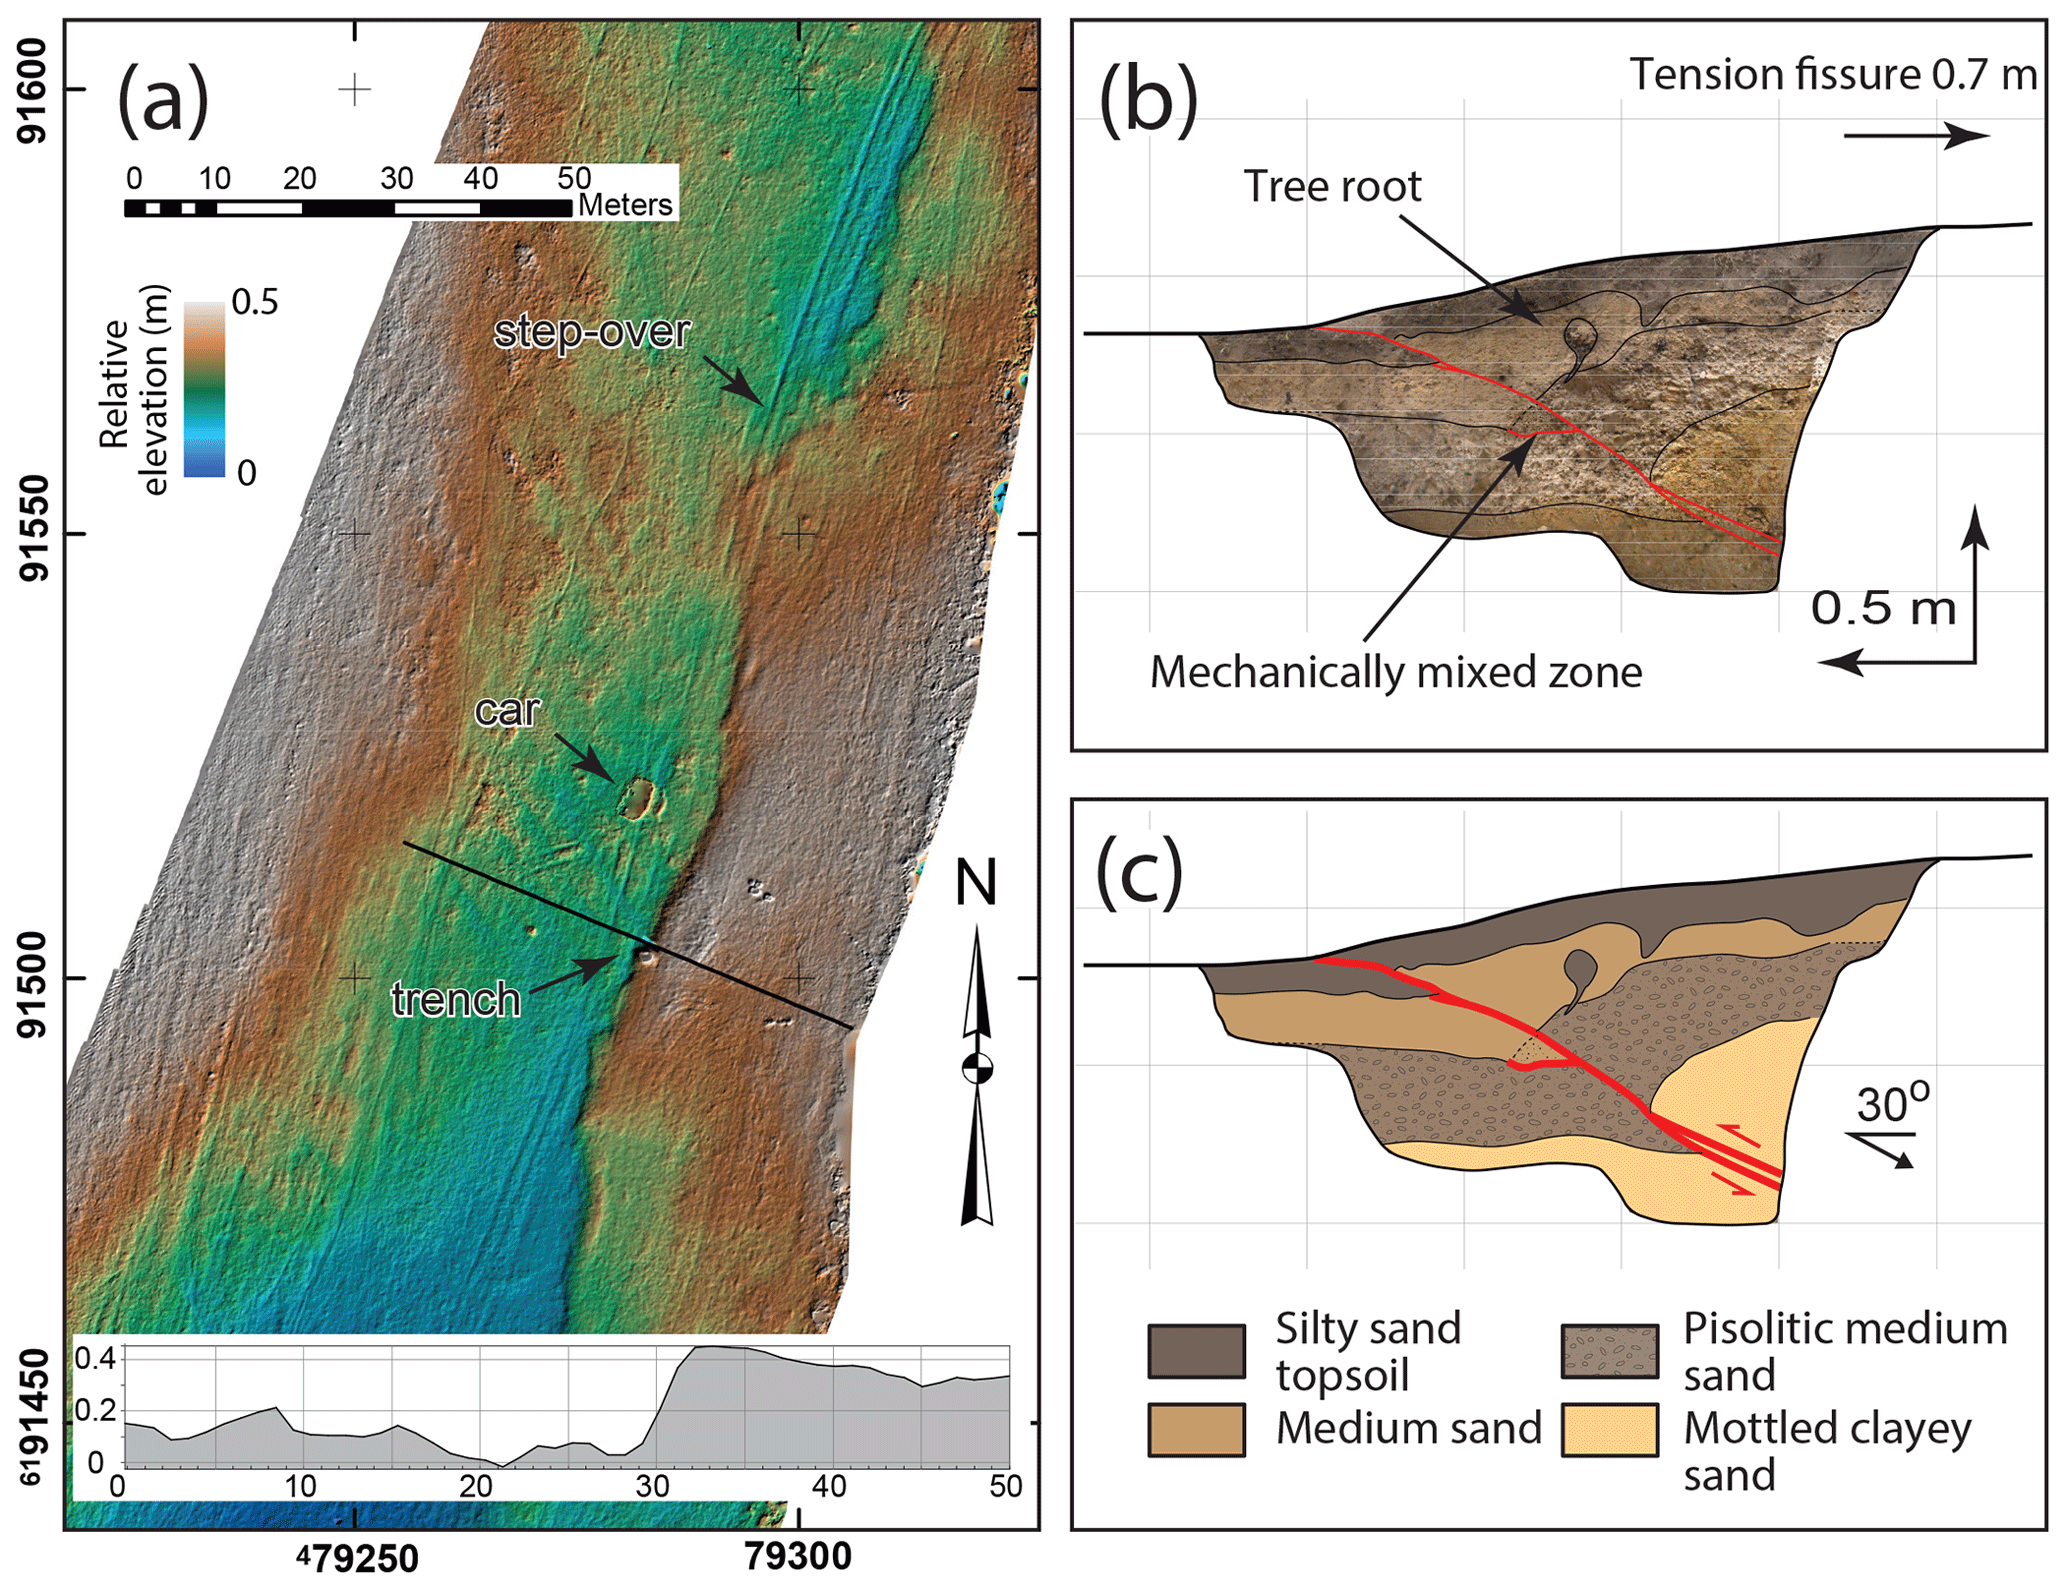
Figure 5Hand trench location (479285 m E, 6191496 m N; GDA94/MGA50). (a) Subset of the photogrammetrically-derived UAV DTM (see Fig. 3 for full footprint), with topographic section indicated by the black line. Colour drape has been tilted to remove regional topographic slope and enhance relative differences. (b) Photomosaic of the north wall of the hand trench showing folded and displaced strata and (c) interpretation of stratigraphy and structure of the north wall of the hand trench.
A hand trench 2.3 m long and 1.2 m deep was excavated perpendicular to the scarp trace at a location where the vertical displacement was on the order of 0.3–0.4 m (Figs. 4c and 5). Here, the scarp has an average trend of 25∘, and scarp segments are right stepping (GDA94/MGA50; 479290 m E, 6191500 m N). The exposed stratigraphy consists of an approximately 0.10–0.12 m thick organic-rich grey brown silty sand overlying ∼0.4 m of pale grey medium sand that becomes pisolitic with depth (Fig. 5b, c). This layer in turn overlies an orange/red mottled grey clayey sand to the bottom of the trench. We interpret the profile to reflect an in situ weathering profile developed in Albany–Fraser Orogen bedrock. Approximately 0.18–0.20 m of the pre-event organic-rich sandy soil had been over thrust along a 20∘ east-dipping reverse fault that steepened to 30∘ towards the base of the trench (Fig. 5c). A vertical scarp-parallel tension fissure ∼0.7 m east of the trench suggests that the fault dip steepens again at shallow depth (Fig. 4c). Drag of layering in the hanging wall along the fault resulted in the formation of a prominent hanging-wall fold. The total vertical deformation at this site is shared approximately equally between discrete slip across the fault plane and folding.
South of 479130 m E, 6191120 m N (GDA94/MGA50) the scarp steps 50 m to the west, the general scarp strike is 355∘, and scarp segments become left stepping. The scarp is associated with a 0.2–0.3 m vertical landscape step which extends some 400 m south from this location, before entering dense pine plantation and becoming difficult to follow due to extensive landscape disturbance (e.g. furrowing) and a thick layer of organic matter cloaking the ground surface (Fig. 4d). Within the pine forest, the scarp maintains a vertical displacement of 0.2–0.4 m, before stepping again 50 m to the west at 479190 m E, 6190050 m N (GDA94/MGA50).
The segments south of the step-over strike ∼340–350∘ and decrease in vertical displacement from ∼0.3 to ∼ 0.1 m at the most southerly intersection of the scarp with a farm track (GDA94/MGA50; 479320 m E, 6189440 m N). At this track intersection, observed after the November event, the scarp comprises dominant southeast-trending elements which are locally offset (left stepping) across east-trending lineaments. These become tensional fissures on the eastern up-thrown side of the scarp. The vertical displacement across the scarp at this location is approximately 0.1 m. Landowners report that there was a “freshening” (rejuvenation) of the scarp at this location following the November event. The presence of fine cracking details in November, given there were significant rainfall events in October, support these anecdotes. The observations are consistent with a reverse oblique (sinistral) reactivation of this segment of the scarp. South of the track intersection, the scarp is lost in bushland. However, heavy tree limb fall and the occasional toppled tree was observed along strike for a further ∼400 m to the southeast, suggesting strong localized ground shaking during the September event (Fig. 3).
3.2 Wrapped and unwrapped Sentinel-1 interferograms for both events
The wrapped interferogram for the September event shows an extent of surface deformation ∼12 km in an east–west direction and ∼8 km in a north–south direction (Figs. 2, 6a). A linear surface deformation front relating to the rupture can be traced for approximately 5 km. The central ∼3 km corresponds to the fault scarp mapped on the ground. The unwrapped interferogram (Fig. 6b) shows a broad shallow lobe of negative line of sight (LOS) change that extends from the west to the surface scarp (equivalent to ∼2.5 fringes in the wrapped image). From the east, a broad shallow lobe of positive LOS change (∼2 fringes in the wrapped image) transitions to a tight (∼1.5 km wide) band of negative LOS change characterized by at least 10 fringes. The images lose coherence in the 200–300 m east of the scarp and in proximity to Lake Noobijup (cf. Fig. 3). Coherence is also partly lost beneath an approximately 2 km wide (N–S) easterly trending band of pine forest (see Figs. 3 and 6a for location).
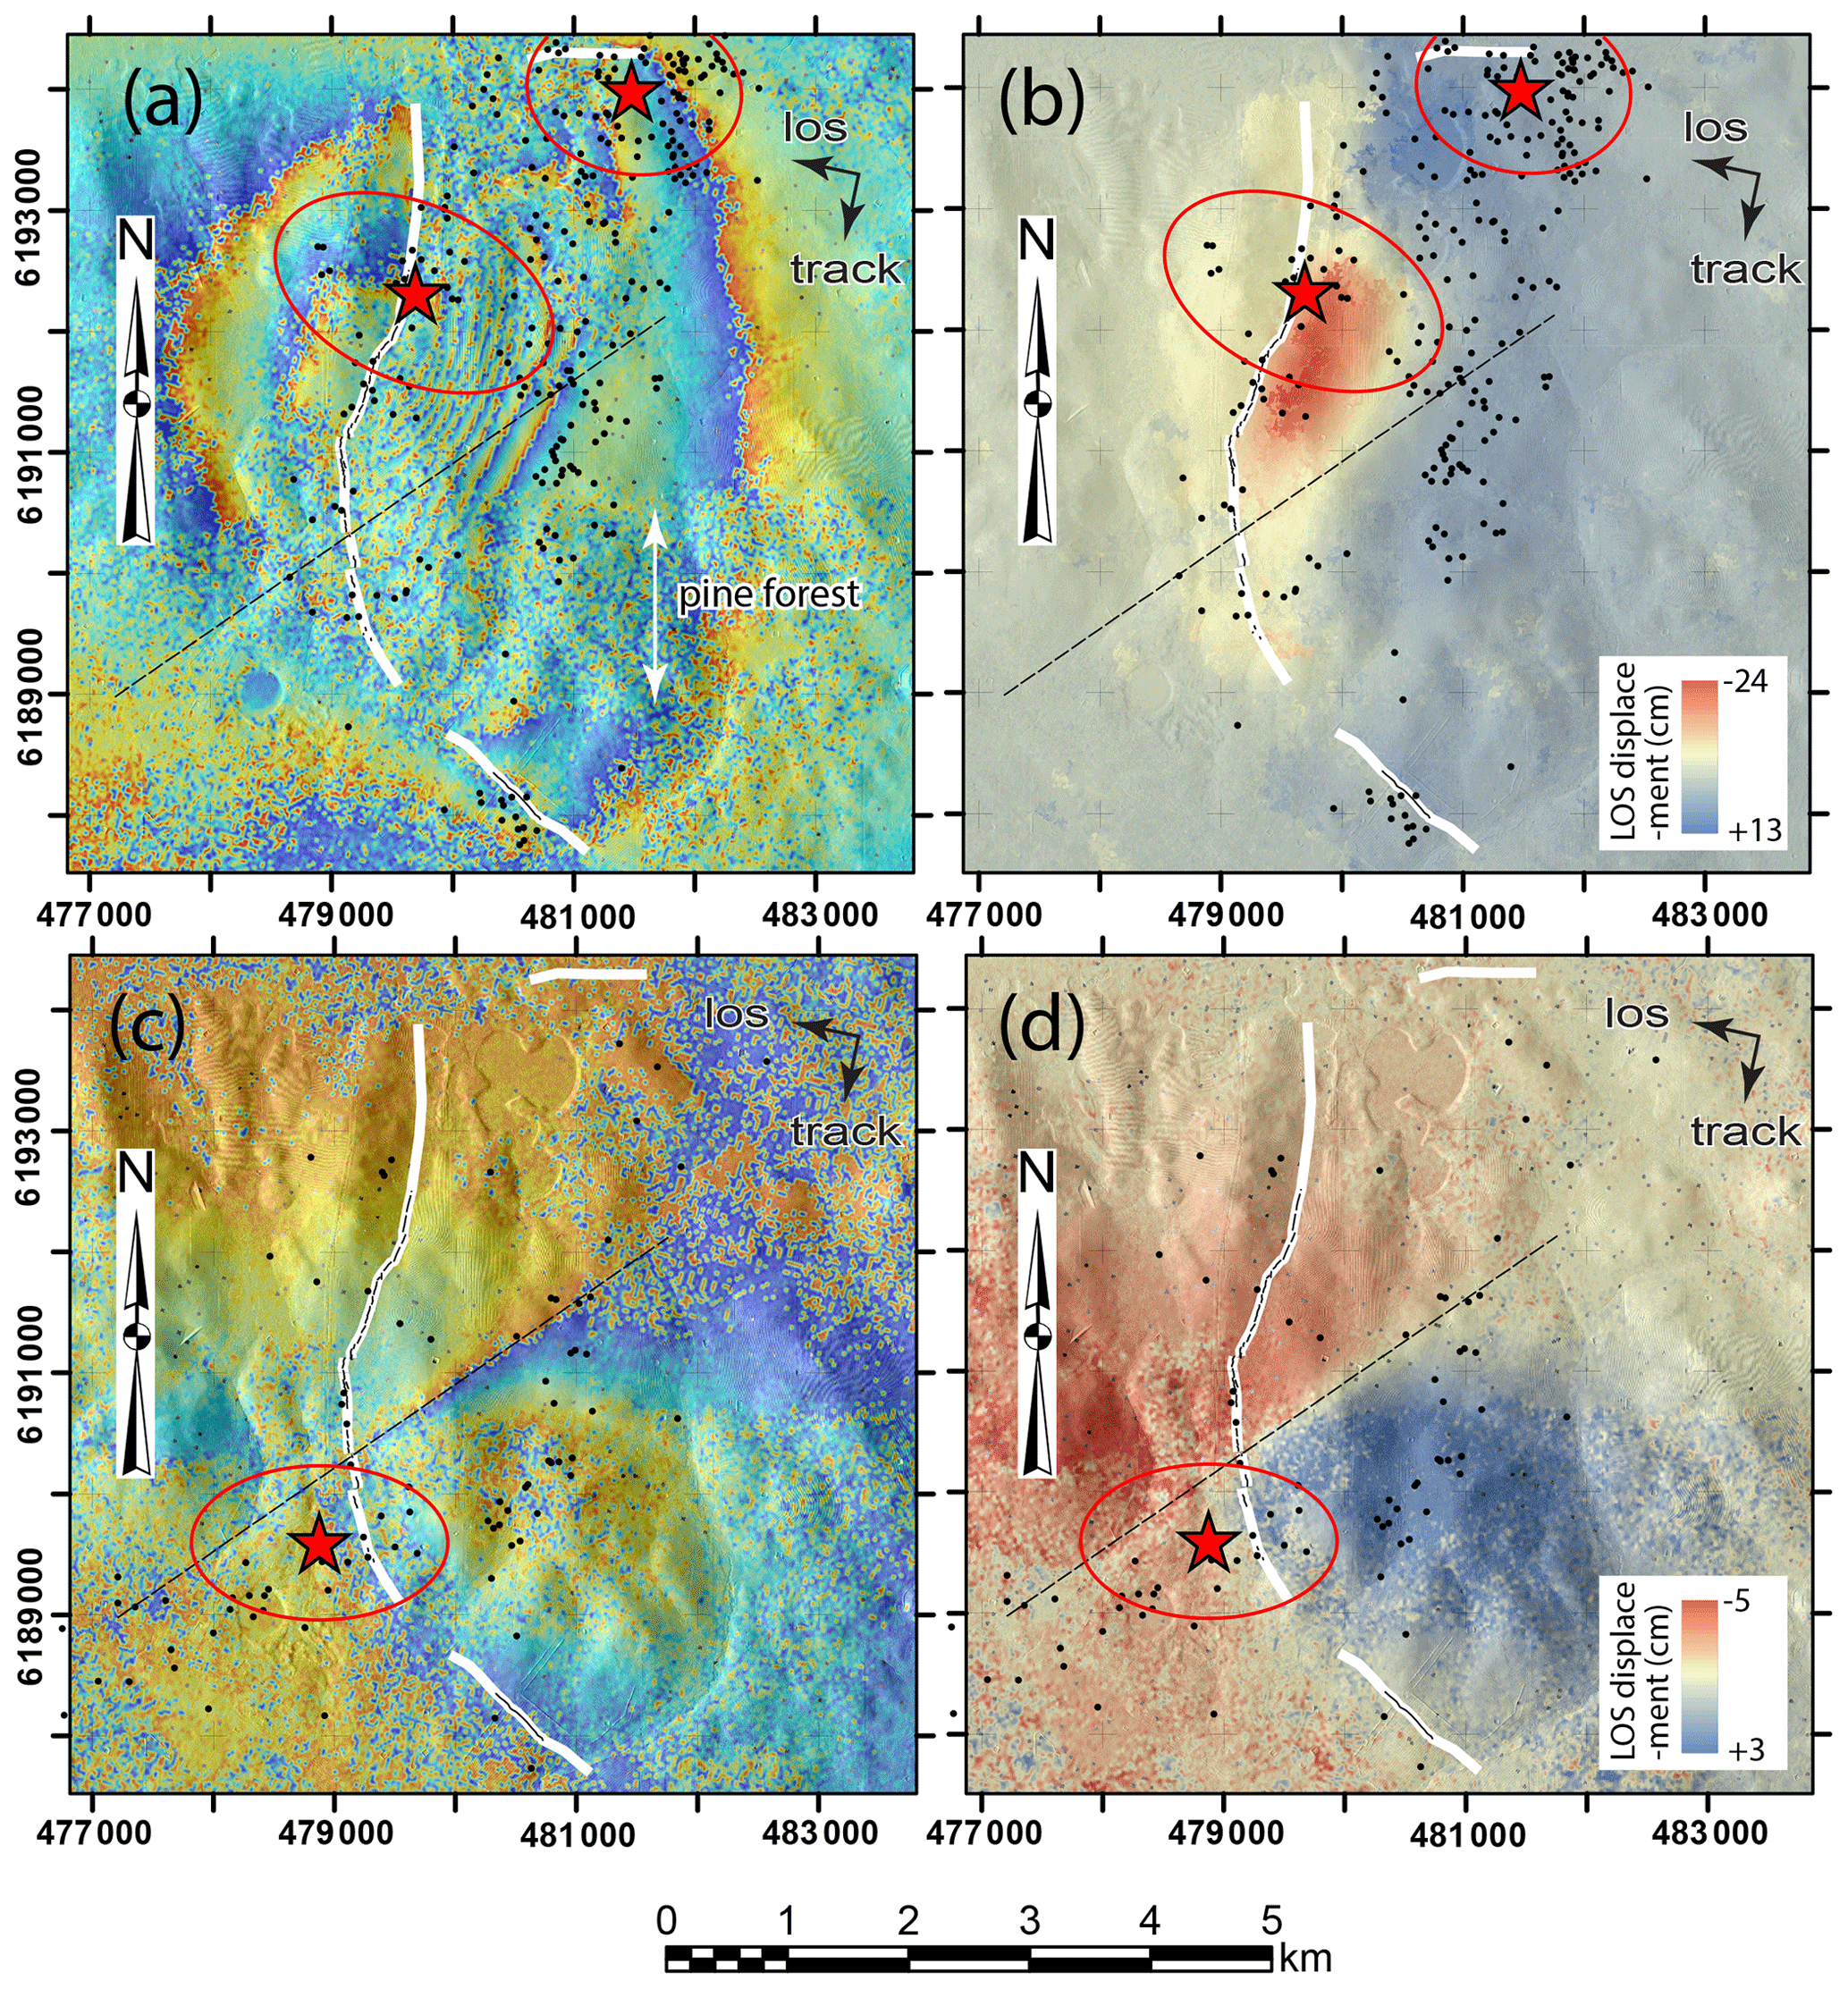
Figure 6Phase images and images of the unwrapped InSAR line of sight (LOS) displacement field for the (a, b) September Mw 5.3 and (c, d) November Mw 5.2 events. The location of the surface rupture relating to the September event is shown as a white line, with a black dashed line showing where the scarp was observed in the field. The surface deformation front relating to the November event is shown as a dashed black line. Refer to Fig. 2 for focal mechanisms. Seismicity before and after the November event is shown black dots in panels (a) and (b) and (c) and (d), respectively. The mainshocks are shown as red stars. Each fringe in panels (a) and (c) represents 2.8 cm of LOS range change. Note several unwrapping errors are evident as regions bound by a step jump at the northern and southern end of the scarp in panel (b). The north–south extent of an easterly trending band of pine forest associated with degradation of coherence is indicated with a white arrow in panel (a).
The unwrapped interferogram for the September event (Fig. 6b) shows a maximum LOS displacement towards the satellite of approximately 0.20–0.24 m along the eastern side of the central ∼1.5–2.0 km of the scarp. These values are approximately half of the maximum scarp height recorded by UAV field measurement and approximately one-third the maximum magnitude of slip along the fault plane that might be calculated from the trench exposure (see also next section). The southern 1.3 km of scarp mapped on the ground occurs mainly beneath pine forest, and the unwrapping algorithm failed to reproduce measured scarp heights of 20–40 cm in this area. Similarly, the unwrapping algorithm performed poorly in the swampy vegetated land proximal to Lake Noobijup.
The hanging wall uplift diminishes to the east of the scarp and is fringed by a broad region of positive LOS change, corresponding to depression of the land surface. The deepest region of depression of the ground surface is centred on Lake Noobijup (∼13 cm LOS increase). This area also corresponds to the highest density of aftershocks following the September mainshock (Figs. 3 and 6b). The depressed region has well-defined northern and southern extents, terminating at east- and southeast-trending structures, respectively. The areal extent of the depressed region is surprisingly large for a reverse fault rupture (cf. King et al., 1988; Ellis and Densmore, 2006).
The InSAR images for the November event (Fig. 6c, d) exhibit the classic quadrupole pattern of an almost pure strike-slip rupture and are consistent with a maximum of ∼5–8 cm of right lateral slip having occurred at the surface relating to rupture of a northeast-trending, steeply northwest dipping fault. This contrasts with the focal mechanism for the event, which suggests an oblique compressive rake (Fig. 2). Although the deformation pattern shows a sharp linear discontinuity for ∼1 km to either side of the intersection of the November failure plane with the September rupture plane, simple forward modelling using a finite rectangular elastic dislocation model (Okada, 1985) suggests that a discrete surface rupture may not have been produced (i.e. the rupture tip remained buried) (Fig. S4). Indeed, structures unambiguously relating to the main rupture were not observed in the field. Potential evidence for secondary surface deformation relating to the main failure plane of this event was seen as a series of fresh-looking east-trending left-stepping dilatational cracks expressed in a boundary track at 478970 m E, 6190390 m N (GDA94/MGA50). No vertical displacement was observed to be associated with these features.
The deformation pattern relating to the November event is also seen to be influenced by the northwest-trending structure that forms the southern termination of the September event. This lineament is discernible in the November event unwrapped InSAR from the intersection of the surface projection of the rupture planes to approximately 1.8 km southeast (Fig. 6d). Minor reverse-oblique movement on this structure during the November event may have been responsible for the reports of a local freshening of the September scarp.
3.3 Comparison of UAV-derived and InSAR-derived deformation surfaces
Part of the vertical displacement envelope resulting from the September earthquake was recovered by differencing the DTM acquired by UAV and the 2012 lidar dataset (Fig. 7; see Sect. 2.2 and the Supplement for methods). Scarp-parallel and scarp-perpendicular profiles through the resulting DTM of difference (DoD) ubiquitously show a larger displacement magnitude than the InSAR-derived LOS displacement estimates (Fig. 7b, c). However, the general form of the two deformation envelope estimates is consistent. A broad uplifted region to the east of the scarp trace in the DoD corresponds to the area of greatest uplift evident in the InSAR data (Fig. 7a). Further, the InSAR LOS phase image indicates that the eastern end of the DoD profile is located in a broad region of topographic depression relative to the far field (∼2 fringes), while the western end is raised relative to the far field (∼2.5 fringes) (cf. Fig. 7c blue line and Figs. 6a and b). This is reflected in a ∼0.3 m vertical difference between eastern and western ends of the UAV DoD profile.
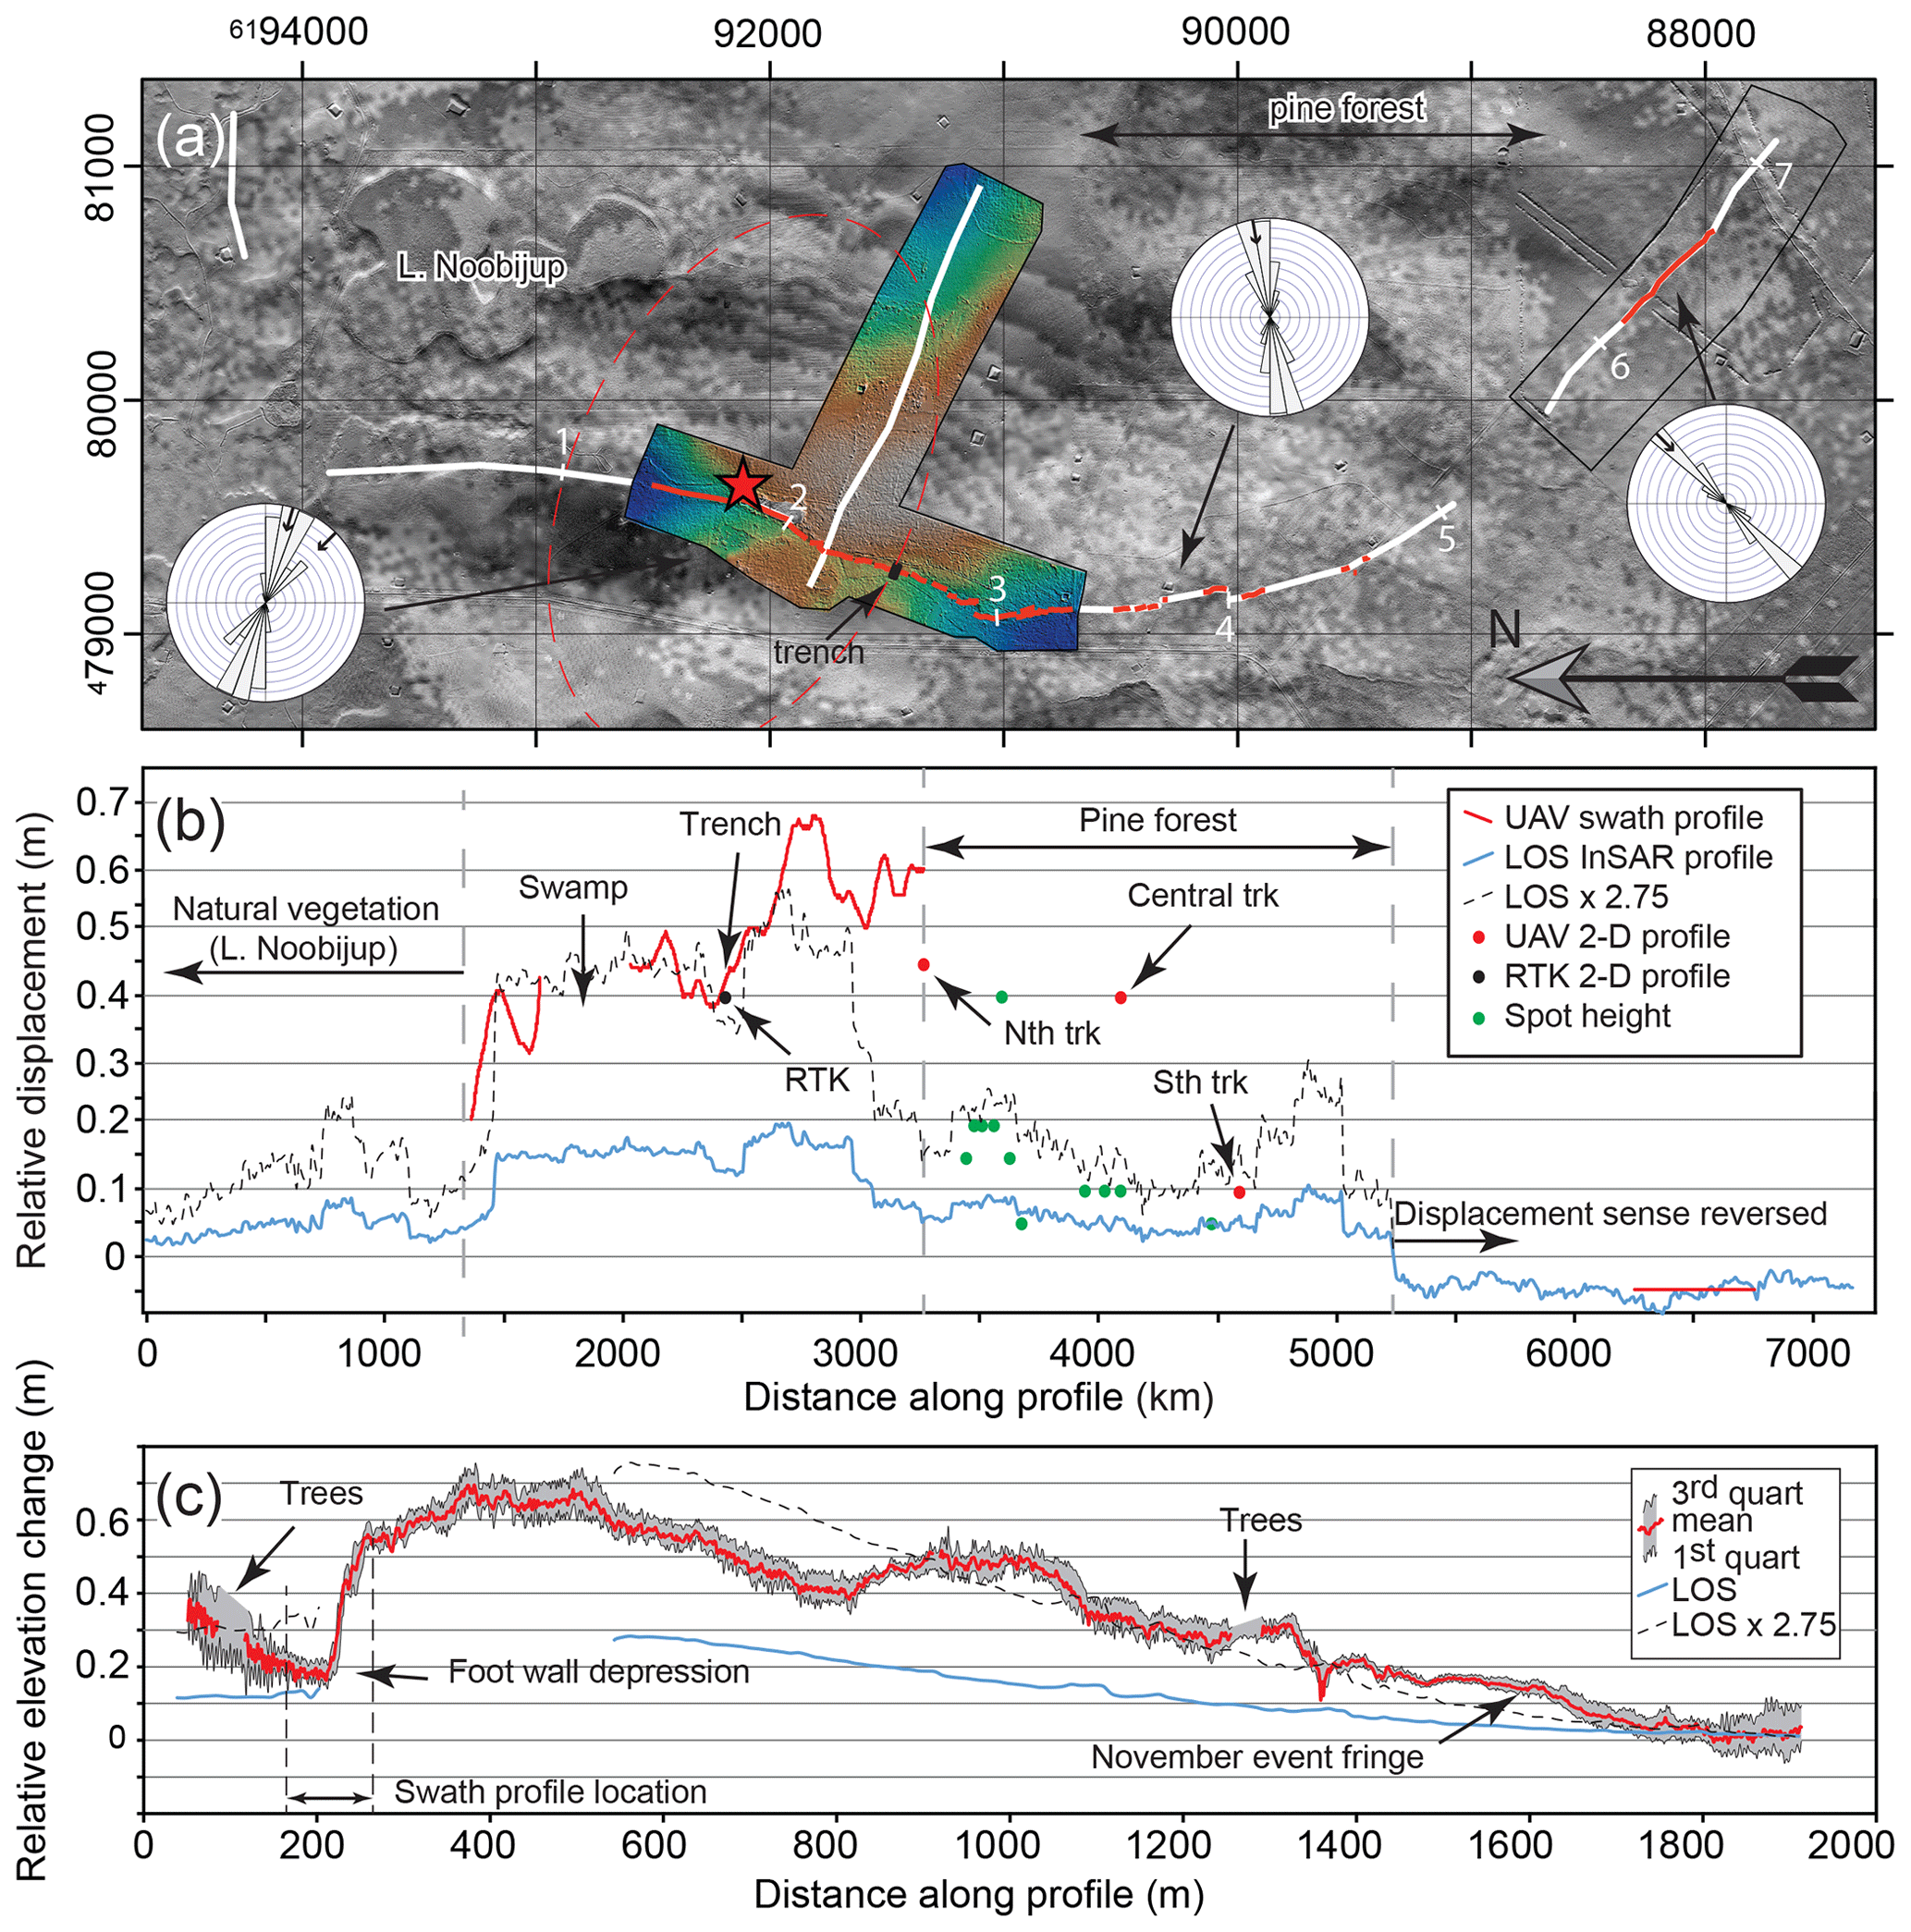
Figure 7Relative coseismic displacement swath profiles through UAV and InSAR data. (a) Location of scarp parallel and perpendicular swath profiles. Mapped scarp elements are shown in red. Length-weighted rose diagrams (north up) show orientation of scarp elements. The extents of the UAV surveys are shown as black outlines. UAV DTM differenced against lidar is shown over main scarp segment (blues are small; greys are large). Location and uncertainty ellipse for the September Mw 5.3 event is shown with a star and red dashed line, respectively. Base map is the InSAR phase image for the September event over lidar (datum/projection in GDA94/MGA50); (b) scarp-parallel profiles. UAV profiles sample a 100 m wide swath centred on the profile line and plot relative vertical displacement. The 90th percentile minus the 10th percentile value elevation value is plotted to reduce noise in the UAV data resulting from the difficulty in removing low vegetation inherent to structure from motion DTMs. UAV two-dimensional profiles plot the vertical displacement measured from single profile lines through small area UAV DTMs flown along forest trails. Spot heights were measured visually with a tape measure where the forest was too dense for other techniques to be used. InSAR swath profiles are collocated with the UAV profile lines and sample 300 m to either side of the profile line. These plot relative LOS displacement, calculated as the difference between the maximum and the minimum value in each scarp-perpendicular swath. (c) First to third quartile range of a scarp-perpendicular swath profile through the UAV data is plotted along with the mean value to demonstrate the precision of the UAV data. Variation in LOS displacement for the collocated unwrapped InSAR profile is not resolvable at the scale of the figure, so the maximum value sampled by each scarp-parallel swath is plotted. Zero relative displacement is arbitrarily pinned to the eastern end of the profile in part.
Importantly, the UAV DoD captures deformation close to the scarp trace where the InSAR images lose coherence. For example, the InSAR data did not image a ∼0.1 m deep foot-wall depression that occurs within ∼100 m to the west of the scarp trace. Along the ∼2 km length of scarp that was covered by the UAV DoD, the average height of the scarp, as measured along a 100 m wide swath profile (Fig. 7b), is 0.46±0.11 m. The landscape dislocation is shown to be sharpest in the ∼10–30 m east of the scarp trace and consistent in magnitude with that measured by RTK GPS at the location of the trench (cf. Figs. 5 and 7c). The topography then continues rising at a lower rate to a maximum vertical displacement within ∼200 m east of the scarp trace, before falling relatively smoothly over a kilometre (Fig. 7c). The fact that uplift associated with the fault tip is distributed over the ∼200 m east of the scarp trace suggests that the scarp-parallel DoD swath profile, spot measurements of scarp height (green dots in Fig. 7b) and the two-dimensional UAV profiles (red dots in Fig. 7b) all underestimate total vertical deformation to some degree. A similar result was derived for the 2018 Petermann Ranges earthquake surface rupture (Gold et al., 2019).
No surface expression or ground cracking was observed on the ground along the southeast-trending feature imaged in the InSAR-derived LOS displacement data at the southern end of the September rupture (cf. Fig. 6b). However, a DoD constructed over the area (see Fig. 7a for mission outline and Fig. S1 for results) revealed the presence of a very subtle (≤5 cm high) linear topographic feature, extending over ∼ 560 m, which was coincident with the surface displacement implied by the InSAR data (Fig. 7b).
3.4 Mainshock and aftershock relocation
In the period from 16 September to 23 November, 884 earthquakes were recorded by stations from the permanent ANSN network and the five rapid-deployment aftershock kits temporarily installed in the epicentral region. These events include the largest aftershock (12 October, Ml 4.6) and the November Mw 5.2 event. Initial locations for these events were computed using the SeisComP3 seismological software (Weber et al., 2007) and the LocSAT location algorithm (Bratt and Bache, 1988). P- and S-wave arrival times were manually picked and reviewed by Geoscience Australia seismic analysts. The mean location uncertainties in this dataset were found to be 3.39 km in the horizontal direction and 2.33 km in the up direction. To better constrain the location and pattern of aftershocks, events from this dataset were input for relocation using the HypoDD double-difference relative location algorithm (Waldhauser and Ellsworth, 2000), implemented in the software hypoDDpy (Krischer, 2015) (see the Supplement for detail). The HypoDD algorithm minimizes errors in hypocentral locations that are commonly attributed to uncertainties in Earth structure along the event-station ray path. The final relocation included a subset of 470 events from this catalogue (Figs. 3 and S2). The mean location uncertainties in the relocated dataset were found to be 63, 116 and 228 m in the east, north and up directions, respectively.
Both the largest aftershock (Ml 4.6) and the November Mw 5.2 event did not meet criteria for relocation in HypoDD using nearby seismic stations. However, both events were clearly recorded with good azimuthal coverage at regional and teleseismic distances. Based on waveforms from 19 stations in Australia, Antarctica, Kazakhstan, Mongolia and Thailand a separate relative location of these two events was calculated, together with the September Mw 5.3 mainshock, by manually aligning the distant waveforms and performing a joint hypocentre determination (Pujol, 2000; Fisk, 2002; see the Supplement for detail). The September and November earthquakes were then anchored to the Ml 4.6 aftershock location, which was well constrained in an absolute sense, as it occurred within ∼0.6 km of the LM01 seismograph station. In this way a better estimation of the absolute location of the point of initiation for both the September and November earthquakes was produced (Table 2). For calculations, the depths for all three events were fixed to 2 km. This is justified in that the calculations were performed using P phases from regional and teleseismic stations, so the epicentral solutions are fairly insensitive to depth. The depth estimates presented in Table 2 relate to the initial locations calculated using the permanent ANSN network, which was supplemented by the five rapid deployment aftershock kits for the latter two events.
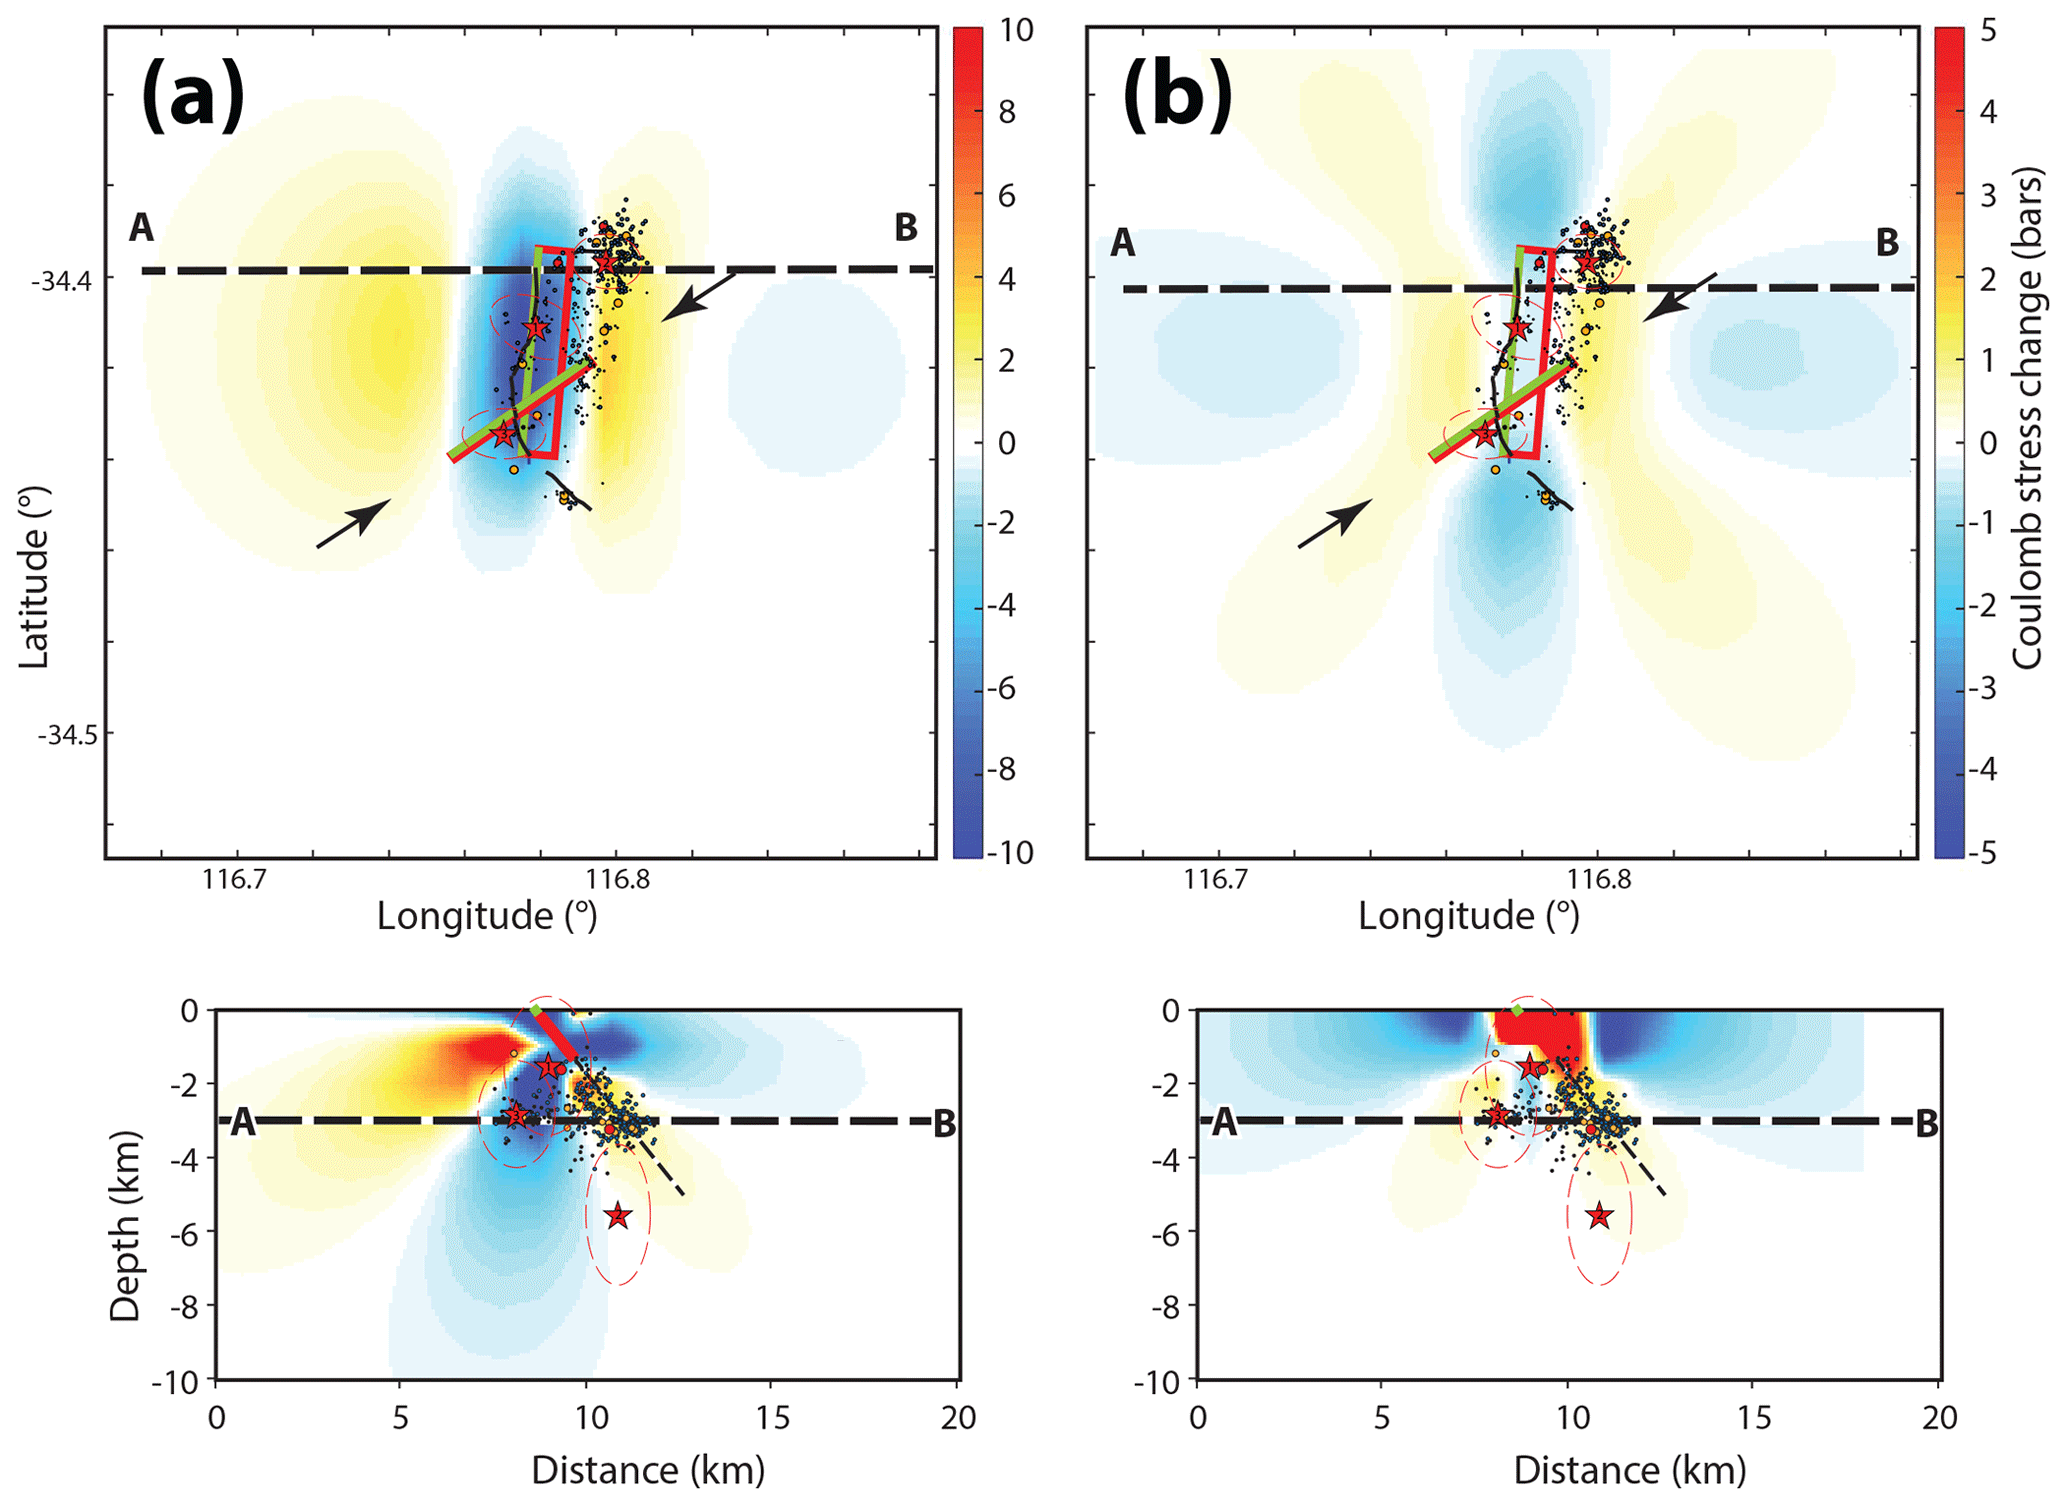
Figure 8Coulomb stress changes resulting from the September Mw 5.3 event (upper panels show a horizontal section at 3 km depth, and lower panels show a vertical section along the line A–B), (a) resolved for reverse faults parallel to the November rupture plane and (b) resolved for optimally oriented strike-slip faults. The rupture area was modelled as being 5.0 km long by 1.17 km wide to constrain seismic moment and slip and 50∘ east-dipping, consistent with the USGS focal mechanism for the event (Fig. 2, Table 2). Relocated hypocentres prior to the November mainshock are projected onto the horizontal plane in the upper panels, and onto the vertical A–B section plane in the lower panels (see Fig. 3 for seismicity legend). Black line is the surface deformation trace interpreted from ground observations and InSAR data. Black arrows in the upper panels point to the position of the November Mw 5.3 strike-slip event rupture plane.
The relocated position of the September Mw 5.3 epicentre is seen to coincide with the region of most prominent surface uplift imaged in the unwrapped InSAR image (Fig. 6b) and the greatest scarp height (Fig. 7a). Aftershock epicentres occurring in the interval between the September and November mainshocks are located predominantly east of the line of the surface rupture (Fig. 6a, b). The associated hypocentres occur between ∼1.5 and 4 km depth and below a plane extending from the trailing edge of the surface rupture dipping at 50∘ to the east (Fig. 8). Considerations of the preservation of seismic moment (i.e. M0 = shear modulus × fault area × average displacement; Hanks and Kanamori, 1979) suggest that the September rupture is unlikely to have extended beyond ∼1 km depth, implying that few if any of the aftershocks nucleated on the rupture plane. This is particularly the case for the largest aftershock (Ml 4.6) – the uncertainty ellipse for this event occurs almost entirely below the depth of other aftershocks. A linear cluster of hypocentres is located directly below the southeastern end of the rupture, parallel to the northwest–southeast oriented southern terminal structure at the surface (Fig. 6b). Similarly, a loose cluster of hypocentres, including the Ml 4.6 aftershock, underlies the east–west-trending valley bounding the northern end of the reverse rupture imaged in the InSAR data (Figs. 3 and 6a). Steep dips for terminal structures at the northern and southern ends of the reverse rupture are consistent with their orientation at a low angle to the easterly maximum horizontal compression direction (SHmax) of the extant crustal stress field (cf. Rajabi et al., 2017b).
The central ∼5 km of the September rupture, where the most significant surface displacement was observed, was modelled for Coulomb stress changes (e.g. Lin and Stein, 2004; Toda et al., 2005) (Fig. 8; see the Supplement for detail of method and parametrization). A dip of 50∘ to the east was assigned to the rupture for modelling purposes, consistent with the USGS focal mechanism for the event (Table 2), and with field data and modelling of the compressional reactivation of reverse faults (Sibson et al., 2012). The value is significantly different to the 30∘ dipping rupture plane exposed in the trench. We reconcile the two values in that the near surface may not be a good indicator of the fault dip at depth (cf. King et al., 2019, Fig. 4). This is supported by the prominent tension fissure east of the scarp at the trench location, which indicates a steeper rupture dip at depth at least locally (Fig. 4c). As the focal mechanisms of the aftershocks are not known, results are presented with stresses resolved for both reverse and strike-slip (Fig. 8a and b, respectively). In both cases, increases in Coulomb stress are modelled to have occurred down dip of the trailing edge of the rupture plane and to a lesser degree in the footwall block at depth. The majority of aftershock hypocentre locations show excellent correlation with the volume of increased Coulomb stress downdip of the rupture plane. Hypocentres in the footwall block only occur in regions of increased Coulomb stress if it is resolved for optimal strike-slip faults (Fig. 8b). A broad region of shallow stress relief above the trailing edge of the rupture corresponds with a landscape depression imaged in the InSAR (cf. Fig. 6b).
As mentioned in Sect. 3.2, simple forward modelling using a finite rectangular elastic dislocation model (Okada, 1985) (Fig. S4) suggests that a discrete surface rupture may not have been produced during the November strike-slip event. Based upon the InSAR surface deformation envelope (cf. Fig. 6c), a rupture ∼4 km long and extending from 1.0 to 2.5 km depth is preferred (Figs. S3 and S4). If Coulomb stress changes resulting from the September rupture are resolved for optimally oriented strike-slip receiver faults, the plane of the November rupture is seen to be positively stressed over more than half of its area (Fig. S4b). The case might then be made that the November event was triggered by static stress changes associated with the September event (cf. Mohammadi et al., 2019). However, additional factors may be involved as the stress increase is only on the order of 0.1–0.2 MPa in the region of nucleation of the November earthquake.
The November Mw 5.2 mainshock is located within a diffuse elongated cluster of dependant aftershock hypocentres at ∼3–4 km depth, which trends parallel to the northeast–southwest orientation of the surface deformation front imaged in the InSAR data, offset to the southeast by 0.25–1.5 km (Figs. 6c, d). Hypocentres predominantly occur at a greater depth than the preferred November event rupture plane (Fig. S4b).
4.1 Characteristics of the Lake Muir surface rupture sequence
The comparison of field observations, InSAR imagery and aftershock earthquake catalogue has permitted exploration of the surface and subsurface deformation field related to the Lake Muir earthquake sequence in unprecedented resolution. The September rupture, as mapped using traditional palaeoseismological means, is revealed to be part of a more extensive deformed region, involving both uplift and depression of broad areas proximal to the surface rupture. Furthermore, the spatial and temporal relationship between September and November Mw>5.0 events reveals a dependency with implications for how other earthquake swarms could be interpreted.
4.1.1 Reconciling UAV vertical displacement and InSAR LOS displacement measurements
InSAR measures displacement in the one-dimensional LOS of the SAR sensor. Three-dimensional displacements of the ground surface are therefore mapped into a one-dimensional geometry. If InSAR data from different viewing geometries (e.g. ascending and descending orbital passes of the SAR satellite) are available, then vertical and horizontal components of displacement can be resolved (Fuhrmann and Garthwaite, 2019). Unfortunately, this is not the case for the Lake Muir earthquake, where only descending-pass Sentinel-1 SAR data are available. Displacement measurements derived from InSAR analysis of this data must therefore be interpreted in the LOS, and horizontal and vertical signals cannot be unambiguously separated.
This is problematic when attempting to reconcile the single-geometry InSAR LOS data with the absolute elevation changes captured by the UAV (e.g. Fig. 7b and c). However, the descending orbit of the Sentinel-1 data used here has a ground azimuth of 196∘, and the SAR sensor looks perpendicularly to the right of this orbit direction (i.e. 286∘). The LOS of the SAR sensor is very close to the P axis of the focal mechanism of the September earthquake (288∘). If the earthquake resulted in almost pure thrust motion along the line of the P axis, as suggested by the focal mechanism (±10∘), the single InSAR viewing geometry should be sensitive to the full surface deformation field. The geometry problem is thus reduced approximately to a vertical plane containing the LOS vector and the slip vector.
We use the above understanding to empirically derive a multiplicative factor of 2.75, which produces a generally good match between the forms of both scarp-perpendicular and scarp-parallel InSAR LOS and UAV vertical displacement profiles (Fig. 7b and c, dashed black lines). This factor is consistent with our assumption of a 50∘ fault dip, given the ∼41∘ side-look angle of the Sentinel-1 sensor at our field location. It is useful to apply this factor to “correct” the InSAR profile to enable a comparison of the UAV and InSAR data. There are two locations on the profiles where the match is poor. Firstly, the corrected InSAR LOS profile underestimates the vertical displacement compared to the UAV profile from 2750 to 3250 m along the profile in Fig. 7b. This region corresponds to a 50 m left step in the scarp and a 25∘ change in strike direction (Fig. 7a). The assumption that the InSAR LOS direction is parallel to the slip vector breaks down here. Secondly, the InSAR profile has not resolved the narrow footwall depression that is apparent in the UAV DoD (Fig. 7c). Much of the region occupied by the proximal footwall was masked as the result of lack of coherence of the InSAR signal.
4.1.2 Character of surface deformation
The average magnitude of vertical surface deformation along the discrete surface rupture trace, as indicated by the UAV DoD data, and locally validated by the corrected InSAR LOS displacement profile (Fig. 7b), is 0.46±0.11 m over the central 2 km of the rupture. The corrected InSAR LOS displacement profile suggests that displacement tails off smoothly to the north from this central plateau (Fig. 7b). To the south of the central plateau, there is a step to higher vertical displacement where the scarp changes orientation (2750–3250 m along the profile) and then a fall to the southern extremity. The exact shape of the southern tail, defined by point measurements and two-dimensional UAV profiles, is largely obscured beneath pine forest. The scarp-perpendicular profile through the UAV and corrected InSAR data (Fig. 7c) shows that very little subsidence has occurred in the footwall of the fault (i.e. it is absent in the corrected InSAR data and seen as a very narrow trough in the UAV DoD) and that the hanging wall uplift relating to the rupture tails off over the ∼1.0–1.5 km to the east of the scarp, falling to a broad area of subsidence up to ∼0.3 m below the foot wall level. The rupture is bound to the north and south by highly orthogonal structures that are likely steeply dipping and in the case of the southern structure accommodated dominantly tear or strike-slip displacement during the September event. These structures bracket the broad region of ground subsidence that occurred to the east of the uplifted hanging wall region (e.g. Fig. 6b). Elastic dislocation modelling indicates that for shallow to moderate reverse fault dips, subsidence should occur above the buried trailing edge of the fault rupture (Okada, 1985; King et al., 1988; Ellis and Densmore, 2006). The area of footwall subsidence observed, an area ∼1.5 times that of the uplifted region, is surprisingly large compared to what might be expected given our preferred fault dip of 50∘. Further, the region of greatest subsidence at the northern end of the rupture, coincident with Lake Noobijup, is not predicted by simple modelling. While rupture complexity relating to an interaction between the rupture plane and the northern bounding structure could explain this result, a plausible alternative is settlement relating to the sedimentary materials filling the Lake Noobijup basin. As field observations failed to find any obvious surface structural development or cracking in this region, the presence of subsidence may not have been recognized if not for the InSAR data.
In the generally low-relief landscapes typical of intraplate regions, such depressions may have significant impacts on surface and subsurface hydrology. A potential analogue is the “back-scarp zone” mapped in the hanging wall of the 1968 Meckering surface rupture (Gordon and Lewis, 1980) (see Fig. 1 for location; Table 1). The back-scarp zone is an arcuate convex-to-the-east band of normal faulting and slumping that is ∼3 km wide and joins the tips of the concave-to-the-east reverse fault rupture. A single levelling line across the back-scarp zone identified a 0.3 m depression of the land surface, contrasting to the ∼1.5–2.0 m of throw across the scarp ∼10 km to the west (Gordon and Lewis, 1980). Changes in hydraulic gradient raised the flood level at Meckering town site by an estimated 12 cm, forcing the relocation of the town to higher ground. In the case of the September Lake Muir event, the hydrology of the important wetland habitat of Lake Noobijup (e.g. Smith, 2010) may be permanently affected by a combination of subsidence and re-plumbing of the local fractured rock hydrology.
4.1.3 Collocation of thrust and strike-slip surface deformation envelopes
In statistical seismology the uncertainties attached to the calculated locations of small- to moderate-sized events forming part of a sequence typically preclude analysis of the detailed temporal, spatial and/or structural relationships between failure surfaces, even with dense instrument networks and sophisticated techniques such as double-difference or joint hypocentre relocation (Waldhauser and Ellsworth, 2000). For the Lake Muir sequence, the InSAR data provide compelling evidence for collocation of the surface deformation envelopes relating to the two largest events (Fig. 6), and the quadrupole surface deformation pattern for the November event allows the geometry of the source fault to be confidently interpreted, which would not have been the case given only the focal mechanism. Our temporary seismograph network has allowed us to achieve hypocentral location uncertainties of better than 300 m (see Sect. 3.4) for all bar the three largest events (see Sect. 3.4; Table 2). The combination of InSAR, aftershock data, field observations and regional aeromagnetic data (cf. Chakravartula and Street, 2000; Milligan and Nakamura, 2015) therefore provides an opportunity, unprecedented in Australia, to examine the relationships between the two Mw>5.0 events, the associated smaller-magnitude seismicity and host geological structures.
The inferred 50∘ easterly dip of the rupture plane associated with the September mainshock is steeper than might be expected presuming fault formation or reactivation at optimal orientations with respect to a horizontal σ1 in a simple Andersonian compressional stress regime (Anderson, 1905, 1951). However, the value is not unreasonable (cf. Sibson et al., 2012) as it is likely that the very shallow Lake Muir rupture reactivated pre-existing structures evident as north to northeast valley trends in the lidar (Fig. 3) overlying minor lineament trends in the magnetic data (Fig. 2). Aftershock hypocentre locations do not define the rupture plains for the Lake Muir sequence, whereas this is the expectation (e.g. Henry and Das, 2001; Yabe and Ide, 2018) and commonly the case where explored (Bowman et al., 1990; Gupta et al., 1998; King et al., 2018). Aftershock hypocentres predominantly occur deeper than the trailing edge of the rupture and within a volume of positive Coulomb stress change downdip of the rupture plane (Fig. 8). The greatest density of aftershocks, including the largest aftershock (Ml 4.6), occurs where this volume of positive Coulomb stress change underlies the linear valley bounding the northern end of the rupture, potentially where the positive stress volume intersects the steep structures imaged in the magnetics underlying the valley. Similarly, aftershocks underlying the southern terminal structure of the rupture occur where Coulomb stress increased but well below the expected extent of the rupture plane.
As best as can be determined given the uncertainty in modelling the depth extent and dimensions of the September and November rupture planes (Figs. 8, S3 and S4), they appear to be spatially distinct, despite coincidence of the surface deformation envelopes (Fig. 6). Further, static stress modelling suggests that while over half of the November Mw 5.2 rupture plane was promoted towards strike-slip failure by the September Mw 5.3 event, the nucleation point for the November rupture does not appear to be in the most highly stressed region proximal to the trailing edge of the September rupture (Fig. S4) (for other examples, see Steacy et al., 2013; Mohammadi et al., 2019). The September and November rupture planes are certainly near enough for dynamic stress triggering to be considered as a mechanism for the November failure (cf. Gomberg and Johnson, 2005). However, the memory of fault gouge softening resulting from dynamic strains, termed “slow dynamics” (Johnson and Jia, 2005), typically only extends over several hours or days after the wave energy has disappeared. Prolonged triggered sequences require a multistage process such as continued triggering through a secondary cascade (Felzer et al., 2003; Johnson and Jia, 2005; Brodsky and Elst, 2014; Meier et al., 2014; Mohammadi et al., 2019). In this context the Ml 4.6 aftershock might be important. Permeability enhancement leading to drainage or pore pressure redistribution on faults (Hill et al., 1993; Townend and Zoback, 2000; Brodsky et al., 2003) is an alternative possibility that might have a long time constant appropriate to the Lake Muir sequence. Redistribution of pore fluid pressure might also explain the location of the minority of aftershock hypocentres in regions modelled to have experienced static Coulomb stress reductions as a result of the September mainshock (e.g. Fig. 8). This could be the topic for a future, more focused study.
A further contributing factor to the spatial mismatch between November hypocentre and the region of highest positive Coulomb stress change might be found in an examination of the character of the regional stress field. The modelled trajectory of the maximum horizontal compressive stress (SHmax) in the southwest of Western Australia is roughly east–west (88±18∘, Rajabi et al., 2017b). This orientation is consistent with the principal compressive axis (P axis) orientations for both Lake Muir mainshocks (Fig. 2), allowing for the poorly quantified uncertainties in moment tensor solutions (cf. Valentine and Trampert, 2012). The similarity in P-axis trends implies that the stress drop associated with the September Mw 5.3 event was small compared to the extant differential stress (σ1–σ3; e.g. Hardebeck and Okada, 2018) and that the change in stress regime between events relates to transposition of the intermediate and minimum principal stress axes. Rajabi et al. (2017a) model the stress regime in the Lake Muir region to favour thrust faulting close to the surface (∼1 km) and to favour a progressively greater strike-slip component to failure with depth. The transposition of principal stress axes between ruptures and the apparent location of the nucleation point of the November strike-slip event near the base of the rupture plane may relate to this changing depth character of the stress field.
4.2 Stress triggering and moderate to large-magnitude, non-extended SCR earthquake sequences
Whereas there is an emerging body of literature concerning human-induced/triggered earthquake sequences in SCRs (e.g. Keranen et al., 2013; Skoumal et al., 2015; Peterie et al., 2018), relatively little has been published on natural earthquake sequences (e.g. Chiu et al., 1984; Špičák, 2000; Allen et al., 2006). The latter appear to be an important component of intraplate seismicity, especially in non-extended SCR crust (e.g. Lopes et al., 2010; Clark et al., 2014a; Dent, 2016). Evidence for the spatial coincidence of similar-magnitude moderate- to large-sized earthquakes as part of these sequences, often with mixed focal mechanisms such as the Lake Muir sequence, is rare but not unprecedented. For example, the 1988 Mw 6.76 Tennant Creek earthquake sequence (Fig. 1; Table 1) began with three surface rupturing earthquakes of similar reverse mechanism within a 12 h period (Choy and Bowman, 1990; Bowman, 1992; Crone et al., 1997). Static stress triggering can account for the progression of events within the sequence (Mohammadi et al., 2019), with the rupture planes for the three largest events occurring well within a fault length of each other (cf. Caskey and Wesnousky, 1997). The sequence continues to this day, producing occasional events sufficiently large to deform the Earth's surface (Table 1). Of seven focal mechanisms constructed for the sequence, five are reverse faulting events with a similar P-axis orientation, and two are normal faulting events with tension axes coinciding with the compression axes of the reverse events (Clark and Leonard, 2003). The normal faulting events may relate to viscoelastic relaxation or adjustment (cf. DeVries et al., 2016). Similar normal faulting events were recorded in the aftershock sequence relating to the 1993 Killari (Latur) earthquake (Gupta et al., 1998).
In the Precambrian eastern Canadian Shield, the 1989 Mw 6.5 Ungava earthquake sequence involved a reverse-mechanism surface rupture followed after 0.9 s by a larger strike-slip rupture approximately 5.2 km away (Adams et al., 1991; Bent, 1994). The focal mechanisms for the events share a common P-axis orientation (Bent, 1994), similar to the Lake Muir mainshocks. Pre-existing bedrock faults were assumed to have hosted the ruptures, but the spatial relationship between rupture planes was not determined, ostensibly because a surface rupture relating to the larger strike-slip event was not observed. One potential explanation proposed by Bent (1994) was that the focus of the strike-slip event was deeper, and so the event did not result in surface rupture.
A comparable sequence is documented from central Australia. The reverse mechanism surface-rupturing 2012 Mw 5.4 Ernabella earthquake (Clark et al., 2014b; Fig. 1) was followed 15 months later by the strike-slip 2013 Mw 5.4 Mulga Park earthquake, which caused extensive surface cracking but no observed surface rupture (Clark and McPherson, 2013). The surface expressions relating to these events indicate that they were likely proximal (≤10 km separation) rather than collocated (Clark and McPherson, 2013). The first event occurred in the hanging wall of the crustal-scale Woodroffe Thrust fault (cf. Camacho et al., 1995; Camacho and McDougall, 2000; Lin et al., 2005), and the second event occurred in the foot wall, potentially at a depth of ∼10 km (Kevin McCue, personal communication, 2013). Again, both events share a common P-axis orientation (Clark and McPherson, 2013). In common with the Lake Muir sequence, the moment tensor for the strike-slip event had a low-percentage double couple, indicating rupture complexity.
The above examples comprise a class of seismicity in non-extended Precambrian SCR crust characterized by multiple moderate to large mainshocks sharing common compression axes. The similarity in P-axis trends of the focal mechanisms implies that the stress drop associated with each event was small compared to the extant differential stress (σ1–σ3; e.g. Hardebeck and Okada, 2018), despite the sometimes large magnitude of the mainshocks. The time interval between the largest events in a sequence varies greatly, as does the separation between rupture planes. Mohammadi et al. (2019) explored these relationships in the context of the Tennant Creek earthquake sequence and concluded that the time between two dependant events is proportional to the magnitude of the static Coulomb stress increase on the receiver fault plane (not necessarily at the hypocentral location), which in turn relates to the trigger-rupture magnitude and distance from the receiver fault. Multiple triggering mechanisms are required to explain time lags spanning several orders of magnitude (cf. Townend and Zoback, 2000; Gomberg and Johnson, 2005; Johnson and Jia, 2005; Meier et al., 2014).
The September 2000 to June 2002 Burakin earthquake swarm, located ∼20 km north of the 1979 Cadoux surface rupture (Fig. 1), is perhaps an example of a different class of seismicity to the sequences discussed above. Focal mechanisms were generated for the largest six of the approximately 18 000-event swarm (Leonard, 2002), spanning a magnitude range from Mw 4.1 to 4.6 (Leonard et al., 2002; Allen et al., 2006). These indicate a mixture of thrust and strike-slip ruptures and one pure normal faulting rupture, with diverse compression axis orientations and all within a ∼5 km radius. Preliminary joint hypocentre relocation suggests that these events and several thousand smaller events may have originated from as few as three to four source areas (Mark Leonard, personal communication, 2018). Aeromagnetic data (Milligan and Nakamura, 2015) indicate that the Burakin swarm area is characterized by a high lineament density, with major trends to the east, northeast and north. Static and dynamic stress interactions or block motion following moderate events may have stressed intersections between these trends, triggering further events with an eclectic mix of mechanisms with diverse P-axis orientations (cf. Talwani, 1988, 2014; Dentith and Featherstone, 2003). This behaviour, in contrast to the sequences that include larger events with focal mechanisms showing consistent P axes (e.g. Lake Muir), may occur preferentially in regions of extremely heterogeneous geological structure, where high stress concentration around numerous cracks and faults within the structured volume results in failure on many local fractures at low stress (Mogi, 1963), thus reducing the probability of failure on a single large fracture.
4.3 One-off ruptures from moderate- to large-magnitude earthquakes in non-extended SCR
The Lake Muir sequence resulted in the production of a surface rupture and more subtle landscape change (i.e. depression of Lake Noobijup) that might be expected to be persistent in the landscape for thousands of years (cf. Quigley et al., 2010; Clark, 2010; Leonard and Clark, 2011). Questions of whether Lake Noobijup may have a seismogenic origin aside, there is no landscape evidence for Late Pleistocene to Holocene surface rupture on the structures that failed during the 2018 sequence (Sect. 1.3). Similarly, no evidence was found for more than the 2018 displacement across in situ weathered materials in the hand trench (Fig. 5). Further, no sharp landscape dislocations are evident that might relate to recent faulting of Paleogene palaeo-channel sediments (Sect. 1.2). If moderate to large earthquakes are assumed to recur on the faults that comprise the 2018 Lake Muir rupture, the long-term average uplift rate (i.e. the vertical component of the slip rate) is limited by the very low regional bedrock erosion rates of 1–5 m Myr−1 (e.g. Chappell, 2006).
The September Mw 5.3 Lake Muir earthquake was the ninth event documented to have produced surface rupture in the Australian SCR in historical times (Fig. 1, Table 1). These ruptures are located exclusively in the Precambrian SCR crust of central and western Australia (Fig. 1), and none could have been identified and mapped using topographic signature prior to the historical event (see references in Table 1). For example, Crone et al. (1997) excavated trenches across the 1986 Marryat Creek and 1988 Tennant Creek ruptures and found that while each rupture in part exploited pre-existing bedrock faults, there was no unequivocal geomorphic, stratigraphic or structural evidence to suggest a penultimate event in the preceding 50–100 kyr or more. A similar conclusion was made on the basis of trenching investigations of the 1968 Meckering surface rupture (see Clark and Edwards, 2018, and references therein).
Palaeoseismological investigations of several faults in the same Precambrian SCR tectonic setting provide evidence for limited recurrence of large earthquakes, with up to four events documented on an individual fault within the last ca. 100 kyr (Crone et al., 2003; Clark et al., 2008; Estrada, 2009). These scarps – Roopena, Hyden, Lort River and Dumbleyung (see Fig. 1 for locations) – all overlie simple through-going faults imaged in aeromagnetic data (Milligan and Nakamura, 2015). The two to five Quaternary events documented on the Hyden (Clark et al., 2008) and Lort River (Estrada, 2009) scarps are all that are evident across Late Neogene duricrust. While shallow trenches across the 2–5 m high Roopena scarp exposed Precambrian bedrock on both sides of the fault (Crone et al., 2003), nearby scarps are associated with an extended Neogene to recent history of movement (Miles, 1952; McCormack, 2006; Weatherman, 2006). For example, the Randell and Poynton Faults, immediately to the south of the Roopena scarp, are associated with 30–70 m of Pliocene and younger vertical displacement (McCormack, 2006). Scarps developed in the ca. 15 Ma surface of the Nullarbor Plain (Fig. 1), which overlies Neoproterozoic mobile belt basement, are associated with up to 15–30 m of vertical surface displacement (Hillis et al., 2008; Clark et al., 2012), implying the recurrence of a dozen or so neotectonic events per fault at most. In general, scarps developed within Archean and Palaeoproterozoic crust tend to be more modest in height, less well connected (i.e. spatially isolated) and more complex in plan than scarps in Mesoproterozoic and Neoproterozoic crust (Clark et al., 2012). A pattern is emerging in Australian Precambrian non-extended SCR where “one-off” ruptures, as evidenced by the historic surface-breaking earthquakes, are filling the spaces between mapped multi-event neotectonic scarps (Fig. 1).
Elsewhere in Precambrian non-extended SCRs the record is consistent with the Australian examples but more fragmentary. Seeber et al. (1993, 1996) excavated two trenches across the 1993 Killari earthquake rupture in peninsular India. These authors found no evidence for a pre-exiting fault zone but observe that the rupture followed foliation in Cretaceous basalt country rocks, which were estimated to be several hundred metres thick. A third trench revealed a section of the rupture that exploited a pre-existing fault zone in the basalts, which coincided with a lineament evident in satellite imagery (Rajendran et al., 1996). However, no evidence was found in the topography at all three trench sites or along the lineament for a Late Pleistocene to Holocene prior rupture. The Ungava rupture in the Canadian Precambrian shield was found to be controlled by compositional layering and foliation within crystalline rocks containing concordant ductile high-strain zones (Adams et al., 1992), similar to the 2016 Petermann Ranges rupture in Australia (King et al., 2018). Although the landscape record was short, being in a recently de-glaciated region, the authors found no evidence to suggest that the Ungava rupture occurred on a fault that has hosted prior reactivation in the Phanerozoic.
The preponderance of one-off and limited-recurrence faults suggests caution in applying a traditional elastic strain accumulation model to non-extended Precambrian SCR crust (cf. Braun et al., 2009; Clark, 2010). Indeed, over the last few decades, permanent and campaign GPS studies have failed to detect a tectonic deformation signal from which a strain budget could be calculated across all classes of SCR crust; this includes in Australia (e.g. Tregonning, 2003), the central and eastern United States (Calais et al., 2005), eastern Canada (Mazzotti and Adams, 2005) and central Africa (Gardonio et al., 2018). Similar studies have used these observations, amongst others (e.g. Calais et al., 2005), to propose that one-off events and clusters of large events deplete long-lived pools of “fossil” lithospheric stress (Liu and Stein, 2016; Calais et al., 2016) and/or there is an orders of magnitude difference in the timescales of elastic strain accumulation and seismogenic strain release (e.g. Clark et al., 2015; Craig et al., 2016). Hence, the underpinning assumption that a “long-term slip rate” is a meaningful concept in all classes of intraplate crust, as per the prevailing plate margin paradigm, remains to be fully tested. Preliminary indications are that the concept may be useful for extended SCR crust worldwide (Sandiford, 2003b; Quigley et al., 2006; Cox et al., 2013; Copley et al., 2014; Rastogi et al., 2014) and for the non-extended Phanerozoic SCR crust of eastern Australia (Fig. 1), where faults with up to a few hundreds of metres of neotectonic slip occur (cf. Sandiford, 2003a; Clark et al., 2015, 2017). However, faults studied thus far in the Phanerozoic SCR crust of the eastern United States (Crone and Luza, 1990; Crone and Machette, 1995; Zellman and Ostenaa, 2016; Hornsby et al., 2019) and Mongolia (Amarjargal et al., 2013) seem more akin to the limited recurrence faults in Precambrian non-extended SCR, cautioning against a blanket application.
Conceptually, for the purposes of probabilistic seismic hazard assessment, a fault source is a seismogenic fault that has produced earthquakes in the past and can be expected to continue doing so (Musson, 2012). Our results therefore urge caution when building “active” faults into seismic hazard assessments in SCRs. Furthermore, in the absence of meaningful recurrence of large events, building relations for fault displacement hazard using rupture traces from Precambrian Australia is also fraught (cf. Boncio et al., 2018; Livio et al., 2019). Another implication for seismic hazard assessment involving the “Lake Muir” class of seismicity discussed herein, perhaps most significantly demonstrated by the 1989 Ungava rupture (Adams et al., 1991; Bent, 1994), is that the palaeoseismic and neotectonics records of large earthquakes may be missing significant seismic moment in that not all mainshocks within a sequence produce recognizable surface deformation.
A shallow Mw 5.3 earthquake near Lake Muir in southwest Western Australia on the 16 September 2018 was followed on the 8 November by a proximal Mw 5.2 event. Focal mechanisms produced for the events suggest reverse and strike-slip rupture, respectively. InSAR data have allowed for the mapping of the surface deformation fields relating to both earthquakes in unprecedented detail, and these are shown to be partly coincident. Field mapping, guided by the InSAR data, reveals that the first event produced an approximately 3 km long and up to 0.4–0.6 m high west-facing surface rupture, consistent with slip on a moderately east-dipping fault. Interpretation of InSAR data shows that the surface scarp relates to a subsurface rupture ∼5 km long, bound at its northern and southern extremities by terminal structures and to the east by a broad zone of landscape depression. The November event did not produce surface rupture. Almost 900 aftershocks were recorded by a temporary seismometer deployment. Hypocentre locations correlate poorly with the rupture plane of their respective mainshocks but well with regions of modelled increase in Coulomb stress. The Lake Muir sequence is typical of a class of seismicity within non-extended Precambrian SCR crust involving multiple moderate to large mainshocks with focal mechanisms sharing common compression axes. Multiple triggering mechanisms must be invoked to explain time lags between mainshocks spanning several orders of magnitude. In some cases, more than half of the seismic moment release relating to sequences of this kind has no surface expression and hence leaves no landscape record, despite typically very shallow hypocentres.
The September Mw 5.3 Lake Muir earthquake was the ninth event documented to have produced surface rupture in Australia in historical times (Fig. 1, Table 1). These ruptures are located exclusively in the non-extended Precambrian SCR rocks of central and western Australia, and none could have been identified and mapped using topographic signature prior to the historical event. A consistent, more fragmentary record exists from analogous crust worldwide. The pattern is repeated with ruptures from the palaeoseismic record, which show only very limited evidence for recurrence. Hence, the underpinning assumption that a long-term slip rate is a meaningful concept in all classes of intraplate crust, as per the prevailing plate margin paradigm, remains to be fully tested. Within non-extended Precambrian SCR crust, one-off or “limited recurrence” ruptures may be the norm, with obvious implications for seismic hazard assessment.
Source parameters of the earthquakes prior to relocation were obtained from the Geoscience Australia catalogue https://earthquakes.ga.gov.au/ (last access: 8 February 2019). The original and relocated datasets are obtainable from the Geoscience Australia GitHub repository https://github.com/GeoscienceAustralia/GA-neotectonics/tree/master/Lake_Muir_Solid_Earth_data (Geoscience Australia, 2019). Focal mechanisms for the three largest events were obtained from https://earthquake.usgs.gov/earthquakes/ (United States Geological Survey, 2019) as per Table 2. The UAV DTM of difference GeoTIFF files are also obtainable from the Geoscience Australia GitHub repository, using the above link. The DCBA lidar dataset was used under licence and cannot be provided to third parties. The Sentinel-1 SAR data are available from https://copernicus.nci.org.au/sara.client/#/home (SARA hub consortium, 2018), and the precise orbital ephemerides products used to correct the InSAR data are available from https://qc.sentinel1.eo.esa.int/aux_poeorb/ (Sentinel-1 Quality Control, 2018).
The supplement related to this article is available online at: https://doi.org/10.5194/se-11-691-2020-supplement.
DJC and SS designed the field experiments and executed them. GB relocated the aftershock data and wrote related sections of the paper and the Supplement. JD relocated the mainshocks and wrote related sections of the paper and the Supplement. TIA curated the seismological data and cowrote related sections of the paper. SB acquired and processed the InSAR data. MCG assisted SB in writing up related sections of the paper. DJC prepared the paper with contributions from all coauthors.
The authors declare that they have no conflict of interest.
Thanks to Roger Hearn of Manjimup for conducting the initial field reconnaissance and taking the first photos of the scarp. Thanks also to Rob De Campo and Mark Muir for providing access to their properties to conduct fieldwork. Guorong Hu of Geoscience Australia kindly processed the GPS data. Jasmine Rutherford from the Western Australia DBCA is warmly thanked for providing access to their lidar data. Cristiano Collettini and an anonymous reviewer are thanked for their comments, which greatly improved the quality of the paper. This paper is published with the permission of the CEO of Geoscience Australia.
This paper was edited by Cristiano Collettini and reviewed by one anonymous referee.
Adams, J., Wetmiller, R., Hasegawa, H., and Drysdale, J.: The first surface faulting from a historical earthquake in North America, Nature, 352, 617619, https://doi.org/10.1038/352617a0, 1991.
Adams, J., Percival, J., Wetmiller, R., Drysdale, J., and Robertson, P.: Geological controls on the 1989 Ungava surface rupture a preliminary interpretation, Geological Survey of Canada Paper, 92C, 147155, https://doi.org/10.4095/132858, 1992.
Agisoft LCC: Agisoft PhotoScan Pro 1.4.3, available at: http://www.agisoft.com, last access: November 2018.
Allen, T. I.: Seismic hazard estimation in stable continental regions: does PSHA meet the needs for modern engineering design in Australia?, Bulletin of the New Zealand Society for Earthquake Engineering, 53, 22–36, 2020.
Allen, T. I., Dhu, T., Cummins, P. R., and Schneider, J. F.: Empirical Attenuation of Ground-Motion Spectral Amplitudes in Southwestern Western Australia, B. Seismol. Soc. Am., 96, 572–585, 2006.
Allen, T. I., Leonard, M., Ghasemi, H., and Gibson, G.: The 2018 National Seismic Hazard Assessment for Australia – earthquake epicentre catalogue, Geoscience Australia Record 2018/30, https://doi.org/10.11636/Record.2018.030, 2018.
Allen, T. I., Clark, D., Lawrie, S., Brenn, G., Dimech, J., Garthwaite, M., Glanville, H., Kemp, T., Lintvelt, C., Lumley, D., Pejic, T., Sayin, E., and Standen, S.: The 2018 Lake Muir earthquakes: Australia's ninth surface rupturing earthquake sequence in 50 years, Seismol. Res. Lett., 90, p. 951, https://doi.org/10.1785/0220190061, 2019.
Amarjargal, S., Kato, T., and Furuya, M.: Surface deformations from moderate-sized earthquakes in Mongolia observed by InSAR, Earth Planets Space, 65, 713–723, https://doi.org/10.5047/eps.2012.12.015, 2013.
Anderson, E. M.: The dynamics of faulting, Transactions of the Edinburgh Geological Society, 8, 387–402, 1905.
Anderson, E. M.: The Dynamics of Faulting and Dyke Formation with applications to Britain, 2nd edn., Oliver and Boyd, Edinburgh, UK, 1951.
Barnhart, W. D., Hayes, G. P., and Wald, D. J.: Global Earthquake Response with Imaging Geodesy: Recent Examples from the USGS NEIC, Remote Sens., 11, 1357, https://doi.org/10.3390/rs11111357, 2019.
Bates, D. A.: Geological effects of the (Accra) earthquake, Gold Coast Geological Survey Bulletin, 13, 18–41, 1941.
Baumbach, M., Grosser, H., Schmidt, H. G., Paulat, A., Rietbrock, A., Ramakrishna Rao, C. V., Raju, P. S., Sarkar, D., and Mohan, I.: Study of the foreshocks and aftershocks of the intraplate Latur earthquake of September 30, 1993, India, in: Latur Earthquake, edited by: Gupta, H. K., Memoir of the Geological Society of India, Geological society of India, Bengaluru, India, 35, 33–63, 1994.
Bent, A. L.: The 1989 (Ms 6.3) Ungava, Quebec, Earthquake: a Complex Intraplate Event, B. Seismol. Soc. Am., 84, 1075–1088, 1994.
Boncio, P., Liberi, F., Caldarella, M., and Nurminen, F.-C.: Width of surface rupture zone for thrust earthquakes: implications for earthquake fault zoning, Nat. Hazards Earth Syst. Sci., 18, 241–256, https://doi.org/10.5194/nhess-18-241-2018, 2018.
Bonini, M., Sani, F., and Antonielli, B.: Basin inversion and contractional reactivation of inherited normal faults: A review based on previous and new experimental models, Tectonophysics, 522–523, 55–88, 2012.
Bowman, J. R.: The 1988 Tennant Creek, Northern Territory, earthquakes: a synthesis, Aust. J. Earth Sci., 39, 651–669, 1992.
Bowman, J. R., Gibson, G., and Jones, T.: Aftershocks of the 1988 January 22 Tennant Creek, Australia intraplate earthquakes: evidence for a complex thrust-fault geometry, International Geophysical Journal, 100, 87–97, 1990.
Bratt, S. R. and Bache, T. C.: Locating events with a sparse network of regional arrays, B. Seismol. Soc. Am., 78, 780–798, 1988.
Braun, J., Burbidge, D., Gesto, F., Sandiford, M., Gleadow, A., Kohn, B., and Cummins, P.: Constraints on the current rate of deformation and surface uplift of the Australian continent from a new seismic database and low-T thermochronological data, Aust. J. Earth Sci., 56, 99–110, 2009.
Brodsky, E. E. and Elst, N. J. v. d.: The Uses of Dynamic Earthquake Triggering, Annu. Rev. Earth Pl. Sc., 42, 317–339, https://doi.org/10.1146/annurev-earth-060313-054648, 2014.
Brodsky, E. E., Roeloffs, E., Woodcock, D., Gall, I., and Manga, M.: A mechanism for sustained groundwater pressure changes induced by distant earthquakes, J. Geophys. Res.-Sol. Ea., 108, 317–339, https://doi.org/10.1029/2002jb002321, 2003.
Calais, E., Mattioli, G., DeMets, C., Nocquet, J. M., and Stein, S.: Tectonic strain in plate interiors?, Nat. Geosci., 438, E9–E10, 2005.
Calais, E., Camelbeeck, T., Stein, S., Liu, M., and Craig, T. J.: A New Paradigm for Large Earthquakes in Stable Continental Plate Interiors, Geophys. Res. Lett., 43, 10621–10637, https://doi.org/10.1002/2016GL070815, 2016.
Camacho, A. and McDougall, I.: Intracratonic, strike-slip partitioned transpression and the formation and exhumation of eclogite facies rocks: An example from the Musgrave Block, central Australia, Tectonics, 19, 978–996, 2000.
Camacho, A., Vernon, R. H., and Fitzgerald, J. D.: Large volumes of anhydrous pseudotachylyte in the Woodroffe Thrust, eastern Musgrave Ranges, Australia, J. Struct. Geol., 17, 371–383, 1995.
Caskey, S. J. and Wesnousky, S. G.: Static stress changes and earthquake triggering during the 1954 Fairview Peak and Dixie Valley earthquakes, central Nevada, B. Seismol. Soc. Am., 87, 521–527, 1997.
Celerier, J., Sandiford, M., Hansen, D. L., and Quigley, M.: Modes of active intraplate deformation, Flinders Ranges, Australia, Tectonics, 24, TC6006, https://doi.org/10.1029/2004TC001679, 2005.
Chakravartula, P. N. and Street, G.: Hydrogeological interpretation of airborne geophysical data Lake Muir–Unicup catchment, Western Australia, Unpublished Agraria Limited report, 45 pp., available at: https://library.dbca.wa.gov.au/static/FullTextFiles/000308.pdf (last access: 12 February 2020), 2000.
Chappell, J.: Australian landscape processes measured with cosmogenic nuclides, in: Regolith Geochronology and Landscape Evolution, edited by: Pillans, B., CRC LEME, Perth, Australia, 19–26, 2006.
Chiu, J.-M., Johnston, A. C., Metzger, A. G., Haar, L., and Fletcher, J.: Analysis of analog and digital records of the 1982 Arkansas earthquake swarm, B. Seismol. Soc. Am., 74, 1721–1742, 1984.
Choy, G. L. and Bowman, J. R.: Rupture process of a multiple main shock sequence; analysis of teleseismic, local, and field observations of the Tennant Creek, Australia, earthquakes of January 22, 1988, J. Geophys. Res.-Solid, 95, 6867–6882, 1990.
Clark, D. J.: Identification of Quaternary scarps in southwest and central west Western Australia using DEM-based hill shading: application to seismic hazard assessment and neotectonics, Int. J. Remote Sens., 31, 6297–6325, 2010.
Clark, D. J.: Neotectonic Features Database, Geoscience Australia, Canberra, available at: http://pid.geoscience.gov.au/dataset/ga/74056 (last access: 23 August 2019), 2012.
Clark, D. J. and Edwards, M.: 50th anniversary of the 14th October 1968 Mw 6.5 (Ms 6.8) Meckering earthquake, Australian Earthquake Engineering Society Pre-conference Field Trip, Meckering, 15 November 2018, Geoscience Australia Record, 2018/39, 47, 2018.
Clark, D. J. and Leonard, M.: Principal stress orientations from multiple focal plane solutions: new insight in to the Australian intraplate stress field, in: Evolution and dynamics of the Australian Plate, edited by: Hillis, R. R., and Muller, D., Geol. Soc. Am. Spec. Pap., 372, 91–105, 2003.
Clark, D. J. and McPherson, A.: A tale of two seisms: Ernabella 23/03/2012 (Mw 5.4) and Mulga Park 09/06/2013 (Mw 5.6), Australian Earthquake Engineering Society Newsletter, 2013/3, 7–11, 2013.
Clark, D. J., Dentith, M., Wyrwoll, K. H., Yanchou, L., Dent, V., and Featherstone, C.: The Hyden fault scarp, Western Australia: paleoseismic evidence for repeated Quaternary displacement in an intracratonic setting, Aust. J. Earth Sci., 55, 379–395, 2008.
Clark, D. J., McPherson, A., and Van Dissen, R.: Long-term behaviour of Australian Stable Continental Region (SCR) faults, Tectonophysics, 566–567, 1–30, https://doi.org/10.1016/j.tecto.2012.07.004, 2012.
Clark, D. J., McPherson, A., and Allen, T.: Intraplate earthquakes in Australia, in: Intraplate Earthquakes, edited by: Talwani, P., Cambridge University Press, New York, USA, 8–49, 2014a.
Clark, D. J., McPherson, A., Allen, T., and De Kool, M.: Co-seismic surface deformation relating to the March 23, 2012 Mw 5.4 Ernabella (Pukatja) earthquake, central Australia: implications for cratonic fault scaling relations, B. Seismol. Soc. Am., 104, 24–39, https://doi.org/10.1785/0120120361, 2014b.
Clark, D. J., McPherson, A., Cupper, M., Collins, C. D. N., and Nelson, G.: The Cadell Fault, southeastern Australia: a record of temporally clustered morphogenic seismicity in a low-strain intraplate region, in: Geological Society, London, Special Publication, Seismicity, Fault Rupture and Earthquake Hazards in Slowly Deforming Regions, edited by: Landgraf, A., Kuebler, S., Hintersburger, E., and Stein, S., London, UK, 2015.
Clark, D. J., McPherson, A., Pillans, B., White, D., and Macfarlane, D.: Potential geologic sources of seismic hazard in Australia's south-eastern highlands: what do we know?, Australian Earthquake Engineering Society 2017 Conference, 24–26 November 2017, Canberra, ACT, available at: http://aees.org.au/wp-content/uploads/2018/02/420-Dan-Clark.pdf (last access: 28 April 2020), 2017.
Commander, P., Schoknecht, N., Verboom, B., and Caccetta, P.: The Geology, Physiology and soils of Wheatbelt Valleys, Proceedings of the Wheatbelt Valleys Conference, Perth, Australia, 28 pp., 2001.
Copley, A., Mitra, S., Sloan, R. A., Gaonkar, S., and Reynolds, K.: Active faulting in apparently stable peninsular India: Rift inversion and a Holocene-age great earthquake on the Tapti Fault, J. Geophys. Res.-Sol. Ea., 119, 6650–6666, https://doi.org/10.1002/2014jb011294, 2014.
Costantini, M.: A novel phase unwrapping method based on network programming, IEEE T. Geosci. remote, 36, 813–821, https://doi.org/10.1109/36.673674, 1998.
Cox, R. T., Van Arsdale, R., Clark, D., Hill, A., and Lumsden, D.: A Revised Paleo-Earthquake Chronology on the Southeast Reelfoot Rift Margin near Memphis, Tennessee, Seismol. Res. Lett., 84, 402–408, https://doi.org/10.1785/0220120142, 2013.
Craig, T. J., Calais, E., Fleitout, L., Bollinger, L., and Scotti, O.: Evidence for the release of long-term tectonic strain stored in continental interiors through intraplate earthquakes, Geophys. Res. Lett., 43, 6826–6836, https://doi.org/10.1002/2016GL069359, 2016.
Crone, A. J. and Luza, K. V.: Style and timing of Holocene surface faulting on the Meers Fault, southwestern Oklahoma, Geol. Soc. Am. Bull., 102, 1–17, 1990.
Crone, A. J. and Machette, M. N.: Holocene faulting on the Cheraw Fault, southeastern Colorado another hazardous late Quaternary fault in the stable continental interior, EOS supplement, 76, F362, 1995.
Crone, A. J., Machette, M. N., and Bowman, J. R.: Geologic investigations of the 1988 Tennant Creek, Australia, earthquakes – implications for paleoseismicity in stable continental regions, United States Geological Survey Bulletin, 2032-A, 51 pp., United States Government Printing Office, Washington, USA, 1992.
Crone, A. J., Machette, M. N., and Bowman, J. R.: Episodic nature of earthquake activity in stable continental regions revealed by palaeoseismicity studies of Australian and North American Quaternary faults, Aust. J. Earth Sci., 44, 203–214, 1997.
Crone, A. J., de Martini, P. M., Machette, M. N., Okumura, K., and Prescott, J. R.: Paleoseismicity of Two Historically Quiescent Faults in Australia: Implications for Fault Behavior in Stable Continental Regions, B. Seismol. Soc. Am., 93, 1913–1934, 2003.
Dawson, J., Cummins, P., Tregoning, P., and Leonard, M.: Shallow intraplate earthquakes in Western Australia observed by Interferometric Synthetic Aperture Radar, J. Geophys. Res., 113, B11408, https://doi.org/10.1029/2008JB005807, 2008.
Dent, V. F.: A preliminary map of cluster locations in southwest Western Australia, 1990–2016, Joint Conference of the Australian Earthquake Engineering Society and the Asian Seismological Commission, 25–27 November 2016, Melbourne, Australia, Paper 391, 2016.
Dentith, M. C. and Featherstone, W. E.: Controls on intra-plate seismicity in southwestern Australia, Tectonophysics, 376, 167–184, 2003.
DeVries, P. M. R., Krastev, P. G., and Meade, B. J.: Geodetically constrained models of viscoelastic stress transfer and earthquake triggering along the North Anatolian fault, Geochem. Geophy. Geosy., 17, 2700–2716, https://doi.org/10.1002/2016gc006313, 2016.
Doyle, H. A.: Seismicity and structure in Australia, B. Roy. S. N. Z., 9, 149–152, 1971.
Ellis, M. A. and Densmore, A. L.: First-order topography over blind thrusts, in: Tectonics, Climate, and Landscape Evolution, edited by: Willett, S. D., Hovius, N., Brandon, M. T., and Fisher, D. M., Geological Society of America Special Paper 398, Penrose Conference Series, 251–266, https://doi.org/10.1130/2006.2398(15), 2006.
Estrada, B.: Neotectonic and palaeoseismological studies in the southwest of Western Australia, PhD, School of Earth and Environment, The University of Western Australia, Perth, Australia, 2009.
Felzer, K. R., Abercrombie, R. E., and Ekström, G. R.: Secondary Aftershocks and Their Importance for Aftershock Forecasting, B. Seismol. Soc. Am., 93, 1433–1448, https://doi.org/10.1785/0120020229, 2003.
Fisk, M. D.: Accurate Locations of Nuclear Explosions at the Lop Nor Test Site Using Alignment of Seismograms and IKONOS Satellite Imagery, B. Seismol. Soc. Am., 92, 2911–2925, https://doi.org/10.1785/0120010268, 2002.
Fitzsimons, I. C. W. and Buchan, C.: Geology of the western Albany–Fraser Orogen, Western Australia – a fi eld guide, Western Australia Geological Survey, Boulder, CO, USA, Record 2005/11, 32 pp., 2005.
Fuhrmann, T. and Garthwaite, M. C.: Resolving Three-Dimensional Surface Motion with InSAR: Constraints from Multi-Geometry Data Fusion, Remote Sens., 11, 241, https://doi.org/10.3390/rs11030241, 2019.
Funning, G. J. and Garcia, A.: A systematic study of earthquake detectability using Sentinel-1 Interferometric Wide-Swath data, Geophys. J. Int., 216, 332–349, 2019.
Gardonio, B., Jolivet, R., Calais, E., and Leclère, H.: The April 2017 Mw6.5 Botswana Earthquake: An Intraplate Event Triggered by Deep Fluids, Geophys. Res. Lett., 45, 8886–8896, https://doi.org/10.1029/2018gl078297, 2018.
Geological Survey of Western Australia: 1 : 500 000 State interpreted bedrock geology of Western Australia, 2016, Perth, Western Austalia, Austalia, 2016.
Geoscience Australia: Geoscience Australia, 1 second SRTM Digital Elevation Model (DEM), Bioregional Assessment Source Dataset, available at: http://data.bioregionalassessments.gov.au/dataset/9a9284b6-eb45-4a13-97d0-91bf25f1187b (last access: November 2018), 2011.
Geoscience Australia: Lake_Muir_Solid_Earth_data, electronic repository, Geoscience Australia Community Safety Branch, Commonwealth of Australia, available at: https://github.com/GeoscienceAustralia/GA-neotectonics/tree/master/Lake_Muir_Solid_Earth_data, last access: 23 August 2019.
Gindraux, S., Boesch, R., and Farinotti, D.: Accuracy Assessment of Digital Surface Models from Unmanned Aerial Vehicles' Imagery on Glaciers, Remote Sens., 9, 186, https://doi.org/10.3390/rs9020186, 2017.
Goedhart, M. L. and Booth, P. W. K.: A palaeoseismic trench investigation of early Holocene neotectonic faulting along the Kango Fault, southern Cape Fold Belt, South Africa – Part I: stratigraphic and structural features, S. Afr. J. Geol., 119, 545–568, https://doi.org/10.2113/gssajg.119.3.545, 2016.
Gold, R. D., Clark, D., Barnhart, W. D., King, T., Quigley, M., and Briggs, R. W.: Surface rupture and distributed deformation revealed by optical satellite imagery: The intraplate 2016 Mw 6.0 Petermann Ranges earthquake, Australia, Geophys. Res. Lett., 46, 10394–10403, https://doi.org/10.1029/2019GL084926, 2019.
Goldstein, R. M. and Werner, C. L.: Radar interferogram filtering for geophysical applications, Geophys. Res. Lett., 25, 4035–4038, https://doi.org/10.1029/1998GL900033, 1998.
Goldstein, R. M., Zebker, H. A., and Werner, C. L.: Satellite radar interferometry: Two-dimensional phase unwrapping, Radio Sci., 23, 713–720, 1988.
Gomberg, J. and Johnson, P.: Dynamic triggering of earthquakes, Nature, 437, 830–830, https://doi.org/10.1038/437830a, 2005.
Gordon, F. R. and Lewis, J. D.: The Meckering and Calingiri earthquakes October 1968 and March 1970, Western Australia Geological Survey Bulletin, 126, 229 pp., The Geological Survey of Western Australia, Perth, Australia, 1980.
Griffin, J. D., Allen, T. I., and Gerstenberger, M. C.: Seismic Hazard Assessment in Australia: Can Structured Expert Elicitation Achieve Consensus in the “Land of the Fair Go”?, Seismol. Res. Lett., 91, 859–873, https://doi.org/10.1785/0220190186, 2020.
Gupta, H. K., Rastogi, B. K., Mohan, I., Rao, C. V. R. K., Sarma, S. V. S., and Rao, R. U. M.: An investigation into the Latur earthquake of September 29, 1993 in southern India, Tectonophysics, 287, 299–318, https://doi.org/10.1016/S0040-1951(98)80075-9, 1998.
Hamling, I. J., Hreinsdóttir, S., Clark, K., Elliott, J., Liang, C., Fielding, E., Litchfield, N., Villamor, P., Wallace, L., Wright, T. J., D'Anastasio, E., Bannister, S., Burbidge, D., Denys, P., Gentle, P., Howarth, J., Mueller, C., Palmer, N., Pearson, C., Power, W., Barnes, P., Barrell, D. J. A., Van Dissen, R., Langridge, R., Little, T., Nicol, A., Pettinga, J., Rowland, J., and Stirling, M.: Complex multifault rupture during the 2016 Mw 7.8 Kaikōura earthquake, New Zealand, Science, 356, eaam7194, https://doi.org/10.1126/science.aam7194, 2017.
Hanks, T. C. and Kanamori, H.: A moment magnitude scale, J. Geophys. Res., 84, 2348–2350, 1979.
Hardebeck, J. L. and Okada, T.: Temporal Stress Changes Caused by Earthquakes: A Review, J. Geophys. Res.-Sol. Ea., 123, 1350–1365, https://doi.org/10.1002/2017jb014617, 2018.
Harris, L. B.: Polyphase faulting in the Perth Basin and Yilgarn Craton margin, Western Australia: relationship to Upper Palaeozoic-Mesozoic tectonics of Gondwanaland, Gondwana nine. Ninth International Gondwana Symposium, 10–14 January 1994, Hyderabad, India, A.A. Balkema, Rotterdam, the Netherlands, vol. 2, 1051–1060, 1996.
Harris, L. B. and Li, Z.-X.: Palaeomagnetic dating and tectonic significance of dolerite intrusions in the Albany Mobile Belt, Western Australia, Earth Planet. Sc. Lett., 131, 143–164, https://doi.org/10.1016/0012-821X(95)00013-3, 1995.
Henry, C. and Das, S.: Aftershock zones of large shallow earthquakes: fault dimensions, aftershock area expansion and scaling relations, Geophys. J. Int., 147, 272–293, https://doi.org/10.1046/j.1365-246X.2001.00522.x, 2001.
Hill, D. P., Reasenberg, P. A., Michael, A., Arabaz, W. J., Beroza, G., Brumbaugh, D., Brune, J. N., Castro, R., Davis, S., dePolo, D., Ellsworth, W. L., Gomberg, J., Harmsen, S., House, L., Jackson, S. M., Johnston, M. J. S., Jones, L., Keller, R., Malone, S., Munguia, L., Nava, S., Pechmann, J. C., Sanford, A., Simpson, R. W., Smith, R. B., Stark, M., Stickney, M., Vidal, A., Walter, S., Wong, V., and Zollweg, J.: Seismicity Remotely Triggered by the Magnitude 7.3 Landers, California, Earthquake, Science, 260, 1617–1623, https://doi.org/10.1126/science.260.5114.1617, 1993.
Hillis, R. R., Sandiford, M., Reynolds, S. D., and Quigley, M. C.: Present-day stresses, seismicity and Neogene-to-Recent tectonics of Australia's “passive” margins: intraplate deformation controlled by plate boundary forces, in: The Nature and Origin of Compression in Passive Margins, edited by: Johnson, H., Doré, A. G., Gatliff, R. W., Holdsworth, R., Lundin, E. R., and Ritchie, J. D., Geological Society, London, Special Publications, London, UK, 71–90, 2008.
Hornsby, K. T., Streig, A. R., Bennett, S. E. K., Chang, J. C., and Mahan, S.: Neotectonic and Paleoseismic Analysis of the Northwest Extent of Holocene Surface Deformation along the Meers Fault, Oklahoma, B. Seismol. Soc. Am., 110, 49–66, https://doi.org/10.1785/0120180148, 2019.
Janssen, D. P., Collins, A. S., and Fitzsimons, I. C. W.: Structure and tectonics of the Leeuwin Complex and Darling Fault Zone, southern Pinjarra Orogen, Western Australia – a field guide, Geological Survey of Western Australia Record, Perth, Australia, 2003/15, 33 pp. 2003.
Johnson, P. A. and Jia, X.: Nonlinear dynamics, granular media and dynamic earthquake triggering, Nature, 437, 871–874, https://doi.org/10.1038/nature04015, 2005.
Johnston, A. C.: Seismotectonic interpretations and conclusions from the stable continental region seismicity database, in: The earthquakes of stable continental regions – v. 1, Assessment of large earthquake potential, edited by: Johnston, A. C., Coppersmith, K. J., Kanter, L. R., and Cornell, C. A., Electric Power Research Institute, Palo Alto, California, USA, 4-1–4-103, 1994a.
Johnston, A. C.: The stable continental region database, in: The earthquakes of stable continental regions – v. 1, Assessment of large-earthquake potential, edited by: Johnston, A. C., Coppersmith, K. J., Kanter, L. R., and Cornell, C. A., Electric Power Research Institute, Palo Alto, California, USA, 3-1–3-80, 1994b.
Johnston, A. C., Coppersmith, K. J., Kanter, L. R., and Cornell, C. A.: The earthquakes of stable continental regions, Electric Power Research Institute Report, Electric Power Research Institute, Palo Alto, California, USA, TR102261V1, 1994.
Keranen, K. M., Savage, H. M., Abers, G. A., and Cochran, E. S.: Potentially induced earthquakes in Oklahoma, USA: Links between wastewater injection and the 2011 Mw 5.7 earthquake sequence, Geology, 41, 699–702, https://doi.org/10.1130/G34045.1, 2013.
King, G. C., Stein, R. S., and Rundle, J. B.: The Growth of Geological Structures by Repeated Earthquakes 1. Conceptual Framework J. Geophys. Res., 93, 13307–13318, 1988.
King, T., Quigley, M. C., and Clark, D.: Surface effects produced by the Mw 6.1 20th May 2016 Petermann earthquake (Australia) and their use in Environmental Seismic Intensity evaluation, Tectonophysics, 747–748, 357–372, 2018.
King, T. R., Quigley, M., and Clark, D.: Surface-Rupturing Historical Earthquakes in Australia and Their Environmental Effects: New Insights from Re-Analyses of Observational Data, Geosciences, 9, 408, https://doi.org/10.3390/geosciences9100408, 2019.
Klinger, Y., Okubo, K., Vallage, A., Champenois, J., Delorme, A., Rougier, E., Lei, Z., Knight, E. E., Munjiza, A., Satriano, C., Baize, S., Langridge, R., and Bhat, H. S.: Earthquake Damage Patterns Resolve Complex Rupture Processes, Geophys. Res. Lett., 45, 10279–10287, https://doi.org/10.1029/2018gl078842, 2018.
Krischer, L.: hypoDDpy: hypoDDpy 1.0 Zenodo, https://doi.org/10.5281/zenodo.18907, 2015.
Langer, C. J., Bonilla, M. G., and Bollinger, G. A.: Aftershocks and surface faulting associated with the Guinea, West Africa, earthquake of 22 December 1983, Seismological Society of America Bulletin, 77, 1579–1601, 1987.
Leonard, M.: The Burrakin WA earthquake sequence Sept 2000–June 2002, Australian Earthquake Engineering Society Conference – Total Risk Management in the Privatised Era, 17–18 October 2002, Adelaide, Australia, Paper 22, 2002.
Leonard, M.: One hundred years of earthquake recording in Australia, B. Seismol. Soc. Am., 98, 1458–1470, 2008.
Leonard, M. and Clark, D.: A record of stable continental region earthquakes from Western Australia spanning the late Pleistocene: Insights for contemporary seismicity, Earth Planet. Sc. Lett., 309, 207–212, 2011.
Leonard, M., Ripper, I. D., and Li, Y.: Australian earthquake fault plane solutions, Geoscience Australia Record, Canberra, Australia, 2002/19, 2002.
Leonard, M., Burbidge, D. R., Allen, T. I., Robinson, D. J., McPherson, A., Clark, D., and Collins, C. D. N.: The Challenges of Probabilistic Seismic Hazard Assessment in Stable Continental Interiors: An Australian Example B. Seismol. Soc. Am. 104, 3008–3028, https://doi.org/10.1785/0120130248, 2014.
Lewis, J. D., Daetwyler, N. A., Bunting, J. A., and Moncrieff, J. S.: The Cadoux earthquake, Western Australia, Geological Survey Report, Perth, Australia, 1981/11, 133, 1981.
Lin, A., Guo, J., and Fu, B.: Co-seismic mole track structures produced by the 2001 Ms 8.1 Central Kunlun earthquake, China, J. Struct. Geol., 26, 1511–1519, 2004.
Lin, A., Maruyama, T., Aaron, S., Michibayashi, K., Camacho, A., and Kano, K.: Propagation of seismic slip from brittle to ductile crust: Evidence from pseudotachylyte of the Woodroffe thrust, central Australia, Tectonophysics, 402, 21–35, 2005.
Lin, J. and Stein, R. S.: Stress triggering in thrust and subduction earthquakes and stress interaction between the southern San Andreas and nearby thrust and strike-slip faults, J. Geophys. Res.-Sol. Ea., 109, B02303, https://doi.org/10.1029/2003JB002607, 2004.
Liu, M. and Stein, S.: Mid-continental earthquakes: Spatiotemporal occurrences, causes, and hazards, Earth-Sci. Rev., 162, 364–386, https://doi.org/10.1016/j.earscirev.2016.09.016, 2016.
Livio, F., Serva, L., and Gürpinar, A.: Locating distributed faulting: Contributions from InSAR imaging to Probabilistic Fault Displacement Hazard Analysis (PFDHA), Quaternary Int., 451, 223–233, https://doi.org/10.1016/j.quaint.2016.09.034, 2017.
Livio, F., Kettermann, M., Reicherter, K., and Urai, J. L.: Growth of bending-moment faults due to progressive folding: Insights from sandbox models and paleoseismological implications, Geomorphology, 326, 152–166, https://doi.org/10.1016/j.geomorph.2018.02.012, 2019.
Lopes, A. E. V., Assumpção, M., Do Nascimento, A. F., Ferreira, J. M., Menezes, E. A. S., and Barbosa, J. R.: Intraplate earthquake swarm in Belo Jardim, NE Brazil: reactivation of a major Neoproterozoic shear zone (Pernambuco Lineament), Geophys. J. Int., 180, 1303–1312, https://doi.org/10.1111/j.1365-246X.2009.04485.x, 2010.
Machette, M. N., Crone, A. J., and Bowman, J. R.: Geologic investigations of the 1986 Marryat Creek, Australia, earthquake – implications for paleoseismicity in stable continental regions, USGS Bulletin, Boulder, CO, USA, 2032-B, 29 pp., 1993.
Massonnet, D., Rossi, M., Carmona, C., Adragna, F., Peltzer, G., Feigl, K., and Rabaute, T.: The displacement field of the Landers earthquake mapped by radar interferometry, Nature, 364, 138–142, https://doi.org/10.1038/364138a0, 1993.
Mazzotti, S. and Adams, J.: Rates and uncertainties on seismic moment and deformation in eastern Canada, J. Geophys. Res., 110, B09301, https://doi.org/10.1029/2004JB003510, 2005.
McCormack, B. J.: Quaternary Fault Scarps on the North-eastern Eyre Peninsula, South Australia; Geomorphic constraints on age and faulting history by investigation of knickpoint retreat, BSc (Hons), Department of Earth Sciences, University of Melbourne, Melbourne, Australia, 85 pp., 2006.
Meier, M.-A., Werner, M. J., Woessner, J., and Wiemer, S.: A search for evidence of secondary static stress triggering during the 1992 Mw 7.3 Landers, California, earthquake sequence, J. Geophys. Res.-Sol. Ea., 119, 3354–3370, https://doi.org/10.1002/2013jb010385, 2014.
Metzger, S., Schurr, B., Ratschbacher, L., Sudhaus, H., Kufner, S.-K., Schöne, T., Zhang, Y., Perry, M., and Bendick, R.: The 2015 Mw 7.2 Sarez Strike-Slip Earthquake in the Pamir Interior: Response to the Underthrusting of India's Western Promontory, Tectonics, 36, 2407–2421, https://doi.org/10.1002/2017tc004581, 2017.
Miles, K. R.: Tertiary faulting in northeastern Eyre Peninsula, T. Roy. Soc. South Aust., 75, 89–96, 1952.
Milligan, P. R. and Nakamura, A.: Total Magnetic Intensity (TMI) Image of Australia with Variable Reduction to Pole (VRTP) greyscale, Geoscience Australia dataset, https://doi.org/10.4225/25/561C7CFA2F230, 2015.
Mogi, K.: Some discussions on aftershocks, foreshocks and earthquake swarms – the fracture of a semi-infinite body caused by an inner stress origin and its relation to the earthquake phenomena (Third Paper), Bulletin of the Earthquake Research Institute, Tokyo University, 41, 615–658, 1963.
Mohammadi, H., Quigley, M., Steacy, S., and Duffy, B.: Effects of source model variations on Coulomb stress analyses of a multi-fault intraplate earthquake sequence, Tectonophysics, 766, 151–166, https://doi.org/10.1016/j.tecto.2019.06.007, 2019.
Mooney, W. D., Ritsema, J., and Hwang, Y. K.: Crustal seismicity and the earthquake catalog maximum moment magnitude (Mcmax) in stable continental regions (SCRs):Correlation with the seismic velocity of the lithosphere, Earth Planet. Sc. Lett., 357–358, 78–83, 2012.
Moss, R. E. S. and Ross, Z. E.: Probabilistic fault displacement hazard analysis for reverse faults, B. Seismol. Soc. Am., 101, 1542–1553, https://doi.org/10.1785/0120100248, 2011.
Moss, R. E. S., Stanton, K. V., and Buelna, M. I.: The impact of material stiffness on the likelihood of fault rupture propagating to the ground surface, Seismol. Res. Lett., 84, 485–488, 2013.
Mueller, K. and Pujol, J.: Three-Dimensional Geometry of the Reelfoot Blind Thrust: Implications for Moment Release and Earthquake Magnitude in the New Madrid Seismic Zone, B. Seismol. Soc. Am., 91, 1563–1573, https://doi.org/10.1785/0120000276, 2001.
Musson, R. M. W.: Interpreting intraplate tectonics for seismic hazard: a UK historical perspective, J. Seismol., 16, 261–273, https://doi.org/10.1007/s10950-011-9268-1, 2012.
Myers, J. S.: Albany-Fraser Orogen, in: Geology and mineral resources of Western Australia, Western Australia Geological Survey Memoir, 3, 255–263, 1990.
Okada, Y.: Surface deformation due to shear and tensile faults in a half-space, B. Seismol. Soc. Am., 75, 1135–1154, 1985.
Olierook, H. K. H., Timms, N. E., Merle, R. E., Jourdan, F., and Wilkes, P. G.: Paleodrainage and fault development in the southern Perth Basin, Western Australia during and after the breakup of Gondwana from 3D modelling of the Bunbury Basalt, Aust. J. Earth Sci., 62, 289–305, https://doi.org/10.1080/08120099.2015.1030774, 2015.
Pérez-Peña, J. V., Al-Awabdeh, M., Azañón, J. M., Galve, J. P., Booth-Rea, G., and Notti, D.: SwathProfiler and NProfiler: Two new ArcGIS Add-ins for the automatic extraction of swath and normalized river profiles, Comput. Geosci., 104, 135–150, https://doi.org/10.1016/j.cageo.2016.08.008, 2017.
Peterie, S. L., Miller, R. D., Intfen, J. W., and Gonzales, J. B.: Earthquakes in Kansas Induced by Extremely Far-Field Pressure Diffusion, Geophys. Res. Lett., 45, 1395–1401, https://doi.org/10.1002/2017gl076334, 2018.
Polcari, M., Albano, M., Atzori, S., Bignami, C., and Stramondo, S.: The Causative Fault of the 2016 Mwp 6.1 Petermann Ranges Intraplate Earthquake (Central Australia) Retrieved by C- and L-Band InSAR Data, Remote Sens., 10, 1311, https://doi.org/10.3390/rs10081311, 2018.
Prider, R. T.: The geology of the Darling scarp at Ridge Hill, J. R. Soc. West. Aust., 32, 105–129, 1948.
Pujol, J.: Joint Event Location – The JHD Technique and Applications to Data from Local Seismic Networks, in: Advances in Seismic Event Location, edited by: Thurber, C. H. and Rabinowitz, N., Springer Netherlands, Dordrecht, the Netherlands, 163–204, 2000.
Quigley, M. C., Cupper, M. L., and Sandiford, M.: Quaternary faults of south-central Australia: palaeoseismicity, slip rates and origin, Aust. J. Earth Sci., 53, 285–301, 2006.
Quigley, M. C., Clark, D., and Sandiford, M.: Tectonic geomorphology of Australia, Geological Society of London Special Publication, 346, 243–265, 2010.
Qureshi, I. R. and Sadig, A. A.: Earthquakes and associated faulting in central Sudan, Nature, 215, 263–265, 1967.
Rajabi, M., Heidbach, O., Tingay, M., and Reiter, K.: Prediction of the present-day stress field in the Australian continental crust using 3D geomechanical–numerical models, Aust. J. Earth Sci., 64, 435–454, https://doi.org/10.1080/08120099.2017.1294109, 2017a.
Rajabi, M., Tingay, M., Heidbach, O., Hillis, R., and Reynolds, S.: The present-day stress field of Australia, Earth-Sci. Rev., 168, 165–189, https://doi.org/10.1016/j.earscirev.2017.04.003, 2017b.
Rajendran, C. P., Rajendran, K., and John, B.: The 1993 Killari (Latur), central India, earthquake: an example of fault reactivation in the Precambrian crust, Geology, 24, 651–654, 1996.
Rajendran, C. P., Rajendran, K., Thakkar, M., and Goyal, B.: Assessing the previous activity at the source zone of the 2001 Bhuj earthquake based on the near-source and distant paleoseismological indicators, J. Geophys. Res., 113, B05311, https://doi.org/10.1029/2006JB004845, 2008, 2008.
Rastogi, B., Mandal, P., and Biswas, S.: Seismogenesis of earthquakes occurring in the ancient rift basin of Kachchh, Western India, in: Intraplate Earthquakes, edited by: Talwani, P., Cambridge University Press, Cambridge, UK, 126–161, 2014.
Salditch, L., Stein, S., Neely, J., Spencer, B. D., Brooks, E. M., Agnon, A., and Liu, M.: Earthquake supercycles and Long-Term Fault Memory, Tectonophysics, 774, 228289, https://doi.org/10.1016/j.tecto.2019.228289, 2020.
Sandiford, M.: Neotectonics of southeastern Australia: linking the Quaternary faulting record with seismicity and in situ stress, in: Evolution and dynamics of the Australian Plate edited by: Hillis, R. R., and Muller, D., Geological Society of Australia Special Publication, 101–113, https://doi.org/10.1130/0-8137-2372-8.107, 2003a.
Sandiford, M.: Geomorphic constraints on the late Neogene tectonics of the Otway Ranges, Aust. J. Earth Sci., 50, 69–80, 2003b.
Satyabala, S. P.: Coseismic ground deformation due to an intraplate earthquake using synthetic aperture radar interferometry: The Mw 6.1 Killari, India, earthquake of 29 September 1993, J. Geophys. Res.-Sol. Ea., 111, B02302, https://doi.org/10.1029/2004jb003434, 2006.
Schmidt, D. A. and Bürgmann, R.: InSAR constraints on the source parameters of the 2001 Bhuj earthquake, Geophys. Res. Lett., 33, L02315, https://doi.org/10.1029/2005gl025109, 2006.
Schulte, S. M. and Mooney, W. D.: An updated global earthquake catalogue for stable continental regions: reassessing the correlation with ancient rifts, Geophys. J. Int., 161, 707–721, 2005.
Scott, C., Champenois, J., Klinger, Y., Nissen, E., Maruyama, T., Chiba, T., and Arrowsmith, R.: The 2016 M7 Kumamoto, Japan, Earthquake Slip Field Derived From a Joint Inversion of Differential Lidar Topography, Optical Correlation, and InSAR Surface Displacements, Geophys. Res. Lett., 46, 6341–6351, https://doi.org/10.1029/2019gl082202, 2019.
Seeber, L., Jain, S. K., Murty, C. V. R., and Chandak, N.: Surface rupture and damage patterns in the Ms = 6.4, September 29, 1993 Killari (Latur) earthquake in central India, National Centre for Earthquake Engineering Research Bulletin, 7, p. 12, 1993.
Seeber, L., Ekstrom, G., Jain, S. K., Murty, C. V. R., Chandak, N., and Armbruster, J. G.: The 1993 Killari earthquake in central India: A new fault in Mesozoic basalt flows?, J. Geophys. Res., 101, 8543–8560, 1996.
Sentinel Australasia Regional Access (SARA) hub consortium: Search SARA catalogue, electronic repository, Sentinel Australasia Regional Access (SARA) Hub, available at: https://copernicus.nci.org.au/sara.client/#/home, last access: 30 November 2018.
Sentinel-1 Quality Control: POD Precise Orbit Ephemerides, electronic repository, Sentinel-1 Quality Control repository, available at: https://qc.sentinel1.eo.esa.int/aux_poeorb, last access: 30 November 2018.
Sibson, R. H., Healy, D., Butler, R. W. H., Shipton, Z. K., and Sibson, R. H.: Reverse fault rupturing: competition between non-optimal and optimal fault orientations, in: Faulting, Fracturing and Igneous Intrusion in the Earth's Crust, edited by: Healy, D., Butler, R. W. H., Shipton, Z. K., and Sibson, R. H., Geological Society of London, Special Publications 367, 39–50, 2012.
Skoumal, R. J., Brudzinski, M. R., and Currie, B. S.: Earthquakes Induced by Hydraulic Fracturing in Poland Township, Ohio, B. Seismol. Soc. Am., 105, 189–197, https://doi.org/10.1785/0120140168 2015.
Smith, M. G.: Hydrogeology of the Lake Muir–Unicup Catchment, Western Australia: an ecologically important area experiencing hydrologic change, PhD, Department of Applied Geology, Curtin University, Perth, Australia, 2010.
Spaggiari, C. V., Bodorkos, S., Barquero-Molina, M., Tyler, I. M., and Wingate, M. T. D.: Interpreted bedrock geology of the south Yilgarn and central Albany-Fraser orogen, Western Australia, Geological survey of Western Australia, Record, Perth, Australia, 2009/10, 84 pp., 2009.
Špičák, A.: Earthquake Swarms and Accompanying Phenomena in Intraplate Regions: A Review, Stud. Geophys. Geod., 44, 89–106, https://doi.org/10.1023/A:1022146422444, 2000.
Steacy, S., Jiménez, A., and Holden, C.: Stress triggering and the Canterbury earthquake sequence, Geophys. J. Int., 196, 473–480, https://doi.org/10.1093/gji/ggt380, 2013.
Stein, S.: Approaches to continental intraplate earthquake issues, Geol. Soc. Am. Spec. Pap., 425, 1–16, https://doi.org/10.1130/2007.2425(01), 2007.
Talwani, P.: The intersection model for intraplate earthquakes, Seismol. Res. Lett., 59, 305–310, 1988.
Talwani, P.: Chapter 11. Unified model for intraplate earthquakes, in: Intraplate Earthquakes, edited by: Talwani, P., Cambridge University Press, Cambridge, UK, 275–302, 2014.
Toda, S., Stein, R. S., Richards-Dinger, K., and Bozkurt, S. B.: Forecasting the evolution of seismicity in southern California: Animations built on earthquake stress transfer, J. Geophys. Res.-Sol. Ea., 110, B05S16, https://doi.org/10.1029/2004jb003415, 2005.
Tonkin, T. N. and Midgley, N. G.: Ground-Control Networks for Image Based Surface Reconstruction: An Investigation of Optimum Survey Designs Using UAV Derived Imagery and Structure-from-Motion Photogrammetry, Remote Sens., 8, 1–8, 2016.
Townend, J. and Zoback, M. D.: How faulting keeps the crust strong, Geology, 28, 399–402, 2000.
Tregonning, P.: Is the Australian Plate deforming? A space geodetic perspective, Geolical Society of Australia Special Publication, 22 and Geological Society of America Special Publication, 372, 41–48, 2003.
United States Geological Survey: Search earthquake catalogue, electronic dataset, United States Geological Survey Earthquake Hazard Program, available at: https://earthquake.usgs.gov/earthquakes/, last access: 23 August 2019.
Valentine, A. P. and Trampert, J.: Assessing the uncertainties on seismic source parameters: Towards realistic error estimates for centroid-moment-tensor determinations, Phys. Earth Planet. In., 210–211, 36–49, https://doi.org/10.1016/j.pepi.2012.08.003, 2012.
van Arsdale, R.: Displacement history and slip rate on the Reelfoot fault of the New Madrid seismic zone, Eng. Geol., 55, 219–226, 2000.
Waldhauser, F. and Ellsworth, W. L.: A Double-Difference Earthquake Location Algorithm: Method and Application to the Northern Hayward Fault, California, B. Seismol. Soc. Am., 90, 1353–1368, https://doi.org/10.1785/0120000006, 2000.
Wang, S., Xu, W., Xu, C., Yin, Z., Burgmann, R., Liu, L., and Jiang, G.: Changes in Groundwater Level Possibly Encourage Shallow Earthquakes in Central Australia: The 2016 Petermann Ranges Earthquake, Geophys. Res. Lett., 46, 3189–3198, https://doi.org/10.1029/2018GL080510, 2019.
Weatherman, M.: Basement Control on Distribution of Active Faults on North-eastern Eyre Peninsula, and some seismic implications, BSc (Hons), School of Earth Sciences, The University of Melbourne, Melbourne, Australia, 77 pp., 2006.
Weber, B., Becker, J., Hanka, W., Heinloo, A., Hoffmann, M., Kraft, T., Pahlke, D., Reinhardt, J., Saul, J., and Thoms, H.: SeisComP3 – automatic and interactive real time data processing, General Assembly European Geosciences Union (EGU), 15–20 April 2007, Vienna, Austria, Geophysical Research Abstracts, 9, 09219, SRef-ID: 1607-7962/gra/EGU2007-A-09219, 2007.
Wegmüller, U. and Werner, C.: GAMMA SAR processor and interferometry software, in: Proceedings of the 3rd ERS Symposium, 18–21 March 1997, Florence, Italy, 1686–1692, 1997.
Wells, D. L. and Coppersmith, K. J.: New empirical relationships among magnitude, rupture length, rupture width, rupture area, and surface displacement, B. Seismol. Soc. Am., 84, 974–1002, 1994.
Wheeler, R. L.: Quaternary tectonic faulting in the Eastern United States, Eng. Geol., 82, 165–186, 2006.
White, S., Stollhofen, H., Stanistreet, I. G., and Lorenz, V.: Pleistocene to Recent rejuvenation of the Hebron Fault, SW Namibia, 316, 293–317, https://doi.org/10.1144/SP316.18, 2009.
Wilde, S. A. and Walker, I. W.: Pemberton - Irwin Inlet (SI/50-10, SI/50-14) 1 : 250 000 scale geological series map, Geological Survey of Western Australia, Perth, Australia, 1984.
Williams, R.: Section`2.3.2: DEMs of difference, in: Geomorphological Techniques (Online Edition), edited by: Cook, S. J., Clarke, L. E., and Nield, J. M., British Society for Geomorphology, London, UK, ISSN 2047-0371, 2012.
Yabe, S. and Ide, S.: Why Do Aftershocks Occur Within the Rupture Area of a Large Earthquake?, Geophys. Res. Lett., 45, 4780–4787, https://doi.org/10.1029/2018gl077843, 2018.
Yarwood, D. R. and Doser, D. I.: Deflection of oceanic transform motion at a continental margin as deduced from waveform inversion of the 1939 Accra, Ghana earthquake, Tectonophysics, 172, 341–349, 1990.
Zellman, M. S. and Ostenaa, D.: Geophysical and Paleoseismic Investigation of the Cheraw Fault, Southeastern Colorado, Final Technical Report, U.S. Geological Survey National Earthquake Hazards Reduction Program Award Number G15AP000026, 54 pp., available at: https://www.researchgate.net/publication/299656892_Geophysical_and_Paleoseismic_Investigation_of_the_Cheraw_Fault_Southeastern_Colorado (last access: 29 April 2020), 2016.
Zhou, Y., Parsons, B. E., and Walker, R. T.: Characterizing Complex Surface Ruptures in the 2013 Mw 7.7 Balochistan Earthquake Using Three-Dimensional Displacements, 123, 10191–10211, https://doi.org/10.1029/2018jb016043, 2018.