the Creative Commons Attribution 4.0 License.
the Creative Commons Attribution 4.0 License.
 | 19 May 2021
Seismic imaging across fault systems in the Abitibi greenstone belt – an analysis of pre- and post-stack migration approaches in the Chibougamau area, Quebec, Canada
Saeid Cheraghi
Alireza Malehmir
Mostafa Naghizadeh
David Snyder
Lucie Mathieu
Pierre Bedeaux
Two high-resolution seismic reflection profiles acquired north and south of Chibougamau, located in the northeast of the Abitibi subprovince of Canada, help understand historic volcanically hosted massive sulfide (VMS) deposits and hydrothermal Cu–Au mineralization found there. Major faults crossed by the profiles include the Barlow fault in the north and the Doda fault and the Guercheville fault in the south, all targets of this study that seeks to determine spatial relationships with a known metal endowment in the area. Common-offset DMO corrections and common-offset pre-stack time migrations (PSTMs) were considered. Irregularities of the trace midpoint distribution resulting from the crooked geometry of both profiles and their relative contribution to the DMO and PSTM methods and seismic illumination were assessed in the context of the complex subsurface architecture of the area. To scrutinize this contribution, seismic images were generated for offset ranges of 0–9 km using increments of 3 km. Migration of out-of-plane reflections used cross-dip element analysis to accurately estimate the fault dip. The seismic imaging shows the thickening of the upper-crustal rocks near the fault zones along both profiles. In the northern seismic reflection section, the key geological structures identified include the Barlow fault and two diffraction sets imaged within the fault zone that represent potential targets for future exploration. The south seismic reflection section shows rather a complicated geometry of two fault systems. The Guercheville fault observed as a subhorizontal reflector connects to a steeply dipping reflector. The Doda fault dips subvertical in the shallow crust but as a steeply dipping reflection set at depth. Nearby gold showings suggest that these faults may help channel and concentrate mineralizing fluids.
- Article
(26210 KB) - Full-text XML
- BibTeX
- EndNote


Acquiring and processing a high-resolution seismic data set over Archean greenstone belts comprised of crystalline rocks characterized by steeply dipping reflectors, point scatters, and multiple folded or faulted structures challenges basic assumptions of the technique (Adam et al., 2000, 2003). During the past 30 years, pre-stack normal moveout (NMO) and dip moveout (DMO) corrections followed by post-stack migration represented the conventional method used in most crystalline rock case studies globally, with different success rates for both 2D and 3D data sets (Malehmir et al., 2012, and references therein). The post-stack migration method has provided sharp images in many case studies (Juhlin, 1995; Juhlin et al., 1995, 2010; Bellefleur et al., 1998, 2015; Perron and Calvert, 1998; Ahmadi et al., 2013); however, all these studies indicate low signal-to-noise () ratios and scattering rather than a coherent reflection of the seismic waves. Petrophysical measurements, where available, complemented with reflectivity or velocity models of the shallow crust, i.e., < 1000 m, permit a more accurate correlation of reflections to geological structures (Perron et al., 1997; Malehmir and Bellefleur, 2010). The Kirchhoff pre-stack time or depth migration (PSTM or PSDM) method has also been utilized in crystalline rock environments (e.g., Malehmir et al., 2011; Singh et al., 2019), but computational complexity and the requirement of a detailed velocity model limited the wide application of a PSTM algorithm (Fowler, 1997). In addition, strong scattering of seismic waves, low ratios, and small-scale changes in acoustic impedance within crystalline rock environments rendered both PSTM and PSDM algorithms less popular in a crystalline rock environment (Salisbury et al., 2003; Heinonen et al., 2019; Singh et al., 2019; Braunig et al., 2020). An important, somewhat neglected issue is the effect of survey geometry on processing results and whether it is possible to adjust the processing flow to compensate for underperformance caused by the survey geometry, for example the effect of crooked survey. An optimized processing flow appears essential in order to image deep mineral deposits and structures such as faults that host base or precious metal deposits (Malehmir et al., 2012, and references therein).
Apart from the type of migration method (i.e., post-stack migration, PSTM, or PSDM), the survey design parameters, such as survey length, orientation, number of shots and receivers, and shot and receiver spacing, are major factors that affect the seismic illumination for both 2D and 3D surveys (Vermeer, 1998). A seismic study in Brunswick, Canada, showed that 2D seismic surveys provided high-resolution seismic images of the upper crust, but a 3D survey acquired over the same area failed to provide more details mostly because of survey design (Cheraghi et al., 2011, 2012). Typically, crystalline rock seismic surveys in forested regions use crooked-line profiling along forest tracks or logging roads for logistic and ultimately economic or environmental considerations. Whereas 2D seismic processing algorithms are designed to work on straight survey lines with regular offset distribution of trace midpoint (CMPs), the crooked surveys violate those assumptions and need compensating strategies such as dividing the crooked survey into several straight lines, 3D swath processing, or cross-dip analysis (Adam et al., 1998, 2000; Milkereit and Eaton, 1998; Schmelzbach et al., 2007; Kashubin and Juhlin, 2010). More specifically, the offset distribution affects seismic illumination during processing steps such as common-offset DMO corrections or common-offset Kirchhoff PSTM algorithm (Fowler, 1997, 1998). The proficiency of both these methods demands a regular distribution of source–receiver offsets because of their sensitivity to a constructive contribution of offset planes (Canning and Gardner, 1998; Cheraghi et al., 2012; Bellefleur et al., 2019; Braunig et al., 2020).
This case study focuses on seismic sections along two 2D high-resolution profiles, herein named the south and north surveys (Fig. 1), both acquired in 2017 in the Chibougamau area, Quebec, Canada. These profiles were acquired to aid upper-crustal-scale studies of metal-endowed fault structures. The Chibougamau area mostly hosts volcanically hosted massive sulfide (VMS) (e.g., Mercier-Langevin et al., 2014) and Cu–Au magmatic–hydrothermal mineralization (Pilote et al., 1997; Mathieu and Racicot, 2019). Orogenic Au mineralization also documented in this area (Leclerc et al., 2017) typically relates to crustal-scale faults, hence the importance to document the geometry of major faults during exploration (Groves et al., 1998; Phillips and Powell, 2010). In order to image fault systems in the Chibougamau area, we generated DMO stacked migrated sections as well as images generated with a PSTM algorithm. We inclusively investigated the surveys' acquisition geometries and their effects on the DMO and PSTM to optimize these processing flows according to the specific geometry. We compare the results from both methods. We show that strategy and criteria used to design our processing flow favor the specific acquisition geometries of each profile in order to enhance coherency of the seismic reflections in both shallow and deeper crust. To accomplish this goal, we (1) apply pre-stack DMO corrections followed by post-stack migration along both profiles; (2) analyze the application of a PSTM algorithm on both surveys; (3) specifically test the CMP offset distribution and its contribution to DMO corrections and PSTM with an offset range of 0–9 km; and (4) address the effect of cross-dip offsets and their relevant time shifts on the imaged reflections. Our optimized application of DMO and PSTM contributes information on the geometry of the faults in the Chibougamau area, which is essential to understand mineralization potential in the area and to target regions of higher prospectivity. In this study we emphasize the adjustments of the processing flow that increase the seismic illumination of reflectors associated with fault systems. The interpretation of the fault kinematics requires inclusive field measurements and tectonic studies beyond the scope of this study. Mathieu et al. (2020b) interpreted the regional seismic profile that encompasses our sections (Fig. 1) regarding the geological structure and tectonic evolution down to Moho depth (∼ 36 km).
The Chibougamau area is located in the northeast portion of the Neoarchean Abitibi subprovince (Fig. 1). The oldest rocks in the study area (> 2760 Ma; David et al., 2011) include mafic and felsic lava flows as well as volcanoclastic deposits of the Chrissie and Des Vents formations (Fig. 1, see Leclerc et al., 2017; Mathieu et al., 2020b). These rocks are overlain by sedimentary and volcanic rocks of the Roy Group, emplaced between 2730 and 2710 Ma and which constitute most of the covered bedrock (Leclerc et al., 2017; Mathieu et al., 2020b). The Roy Group includes a thick (2–4 km) pile of mafic and intermediate volcanic rocks topped by a thinner assemblage of lava flows and pyroclastic and sedimentary units (volcanic cycle 1, Leclerc et al., 2012, 2015), as well as a pile of mafic lava flows capped by a thick (2–3 km in the north to 0.5 km in the south) succession of intermediate to felsic lava flows and fragmental units interbedded with sedimentary rocks (volcanic cycle 2). The Roy Group is overlain by sandstone and conglomerate of the 2700–2690 Ma Opémisca Group, which accumulated in two sedimentary basins (Mueller et al., 1989; Leclerc et al., 2017). The main rock exposures of the Roy Group, observed along the southern profile, consist of pelitic to siliciclastic sedimentary rocks of the basin-restricted Caopatina Formation (volcanic cycle 1 or Opémisca Group) and mafic to intermediate lava flows of the Obatogamau Formation (volcanic cycle 1).
The rock units around the north profile include the Bruneau Formation (mafic lava flows), the Blondeau Formation (intermediate to felsic, volcanic, volcanoclastic, and sedimentary deposits), and the Bordeleau Formation (volcanoclastic deposits, arenite, conglomerate) of volcanic cycle 2, as well as sedimentary rocks of the Opémisca Group (Dimroth et al., 1995; Leclerc et al., 2012). The major intrusions relevant in the study area are the ultramafic to mafic sills of the Cummings Complex, which intrude into the lower part of the Blondeau Formation (Bédard et al., 2009).
Several east-trending fault zones and synclinal or anticlinal structures are associated with Neoarchean deformation events in the Chibougamau area (Dimroth et al., 1986; Daigneault et al., 1990; Leclerc et al., 2012, 2017). The main faults, folds, and associated schistosity and metamorphism relate to a Neoarchean N–S shortening event (Mathieu et al., 2020b, and references therein). The north survey lies nearly perpendicular to the major regional structures. It crosses the west-striking Barlow fault zone, a shallowly to steeply south-dipping fault zone (Sawyer and Ben, 1993; Bedeaux et al., 2020). The field observations imply that the Barlow fault zone is a high-strain, back-thrust fault which separates sedimentary rocks of the Opémisca Group from volcanic rocks of the Roy Group (Bedeaux et al., 2020). The north survey also crosses the Waconichi syncline and the steeply dipping, east-to-west-striking faults of the Waconichi Tectonic Zone (Fig. 1). The south survey passes through the Guercheville fault zone, which intersects the Druillettes syncline (Fig. 1), and north of the east-striking Doda fault zone. The Doda fault zone appears subvertical at the surface (Daigneault, 1996); the Guercheville fault dips northward at 30–60∘ but was mapped locally as a subvertical fault (Daigneault, 1996). Most of these faults form early basin-bounding faults (Opémisca basins) reactivated during the main shortening event (Dimroth, 1985; Mueller et al., 1989).
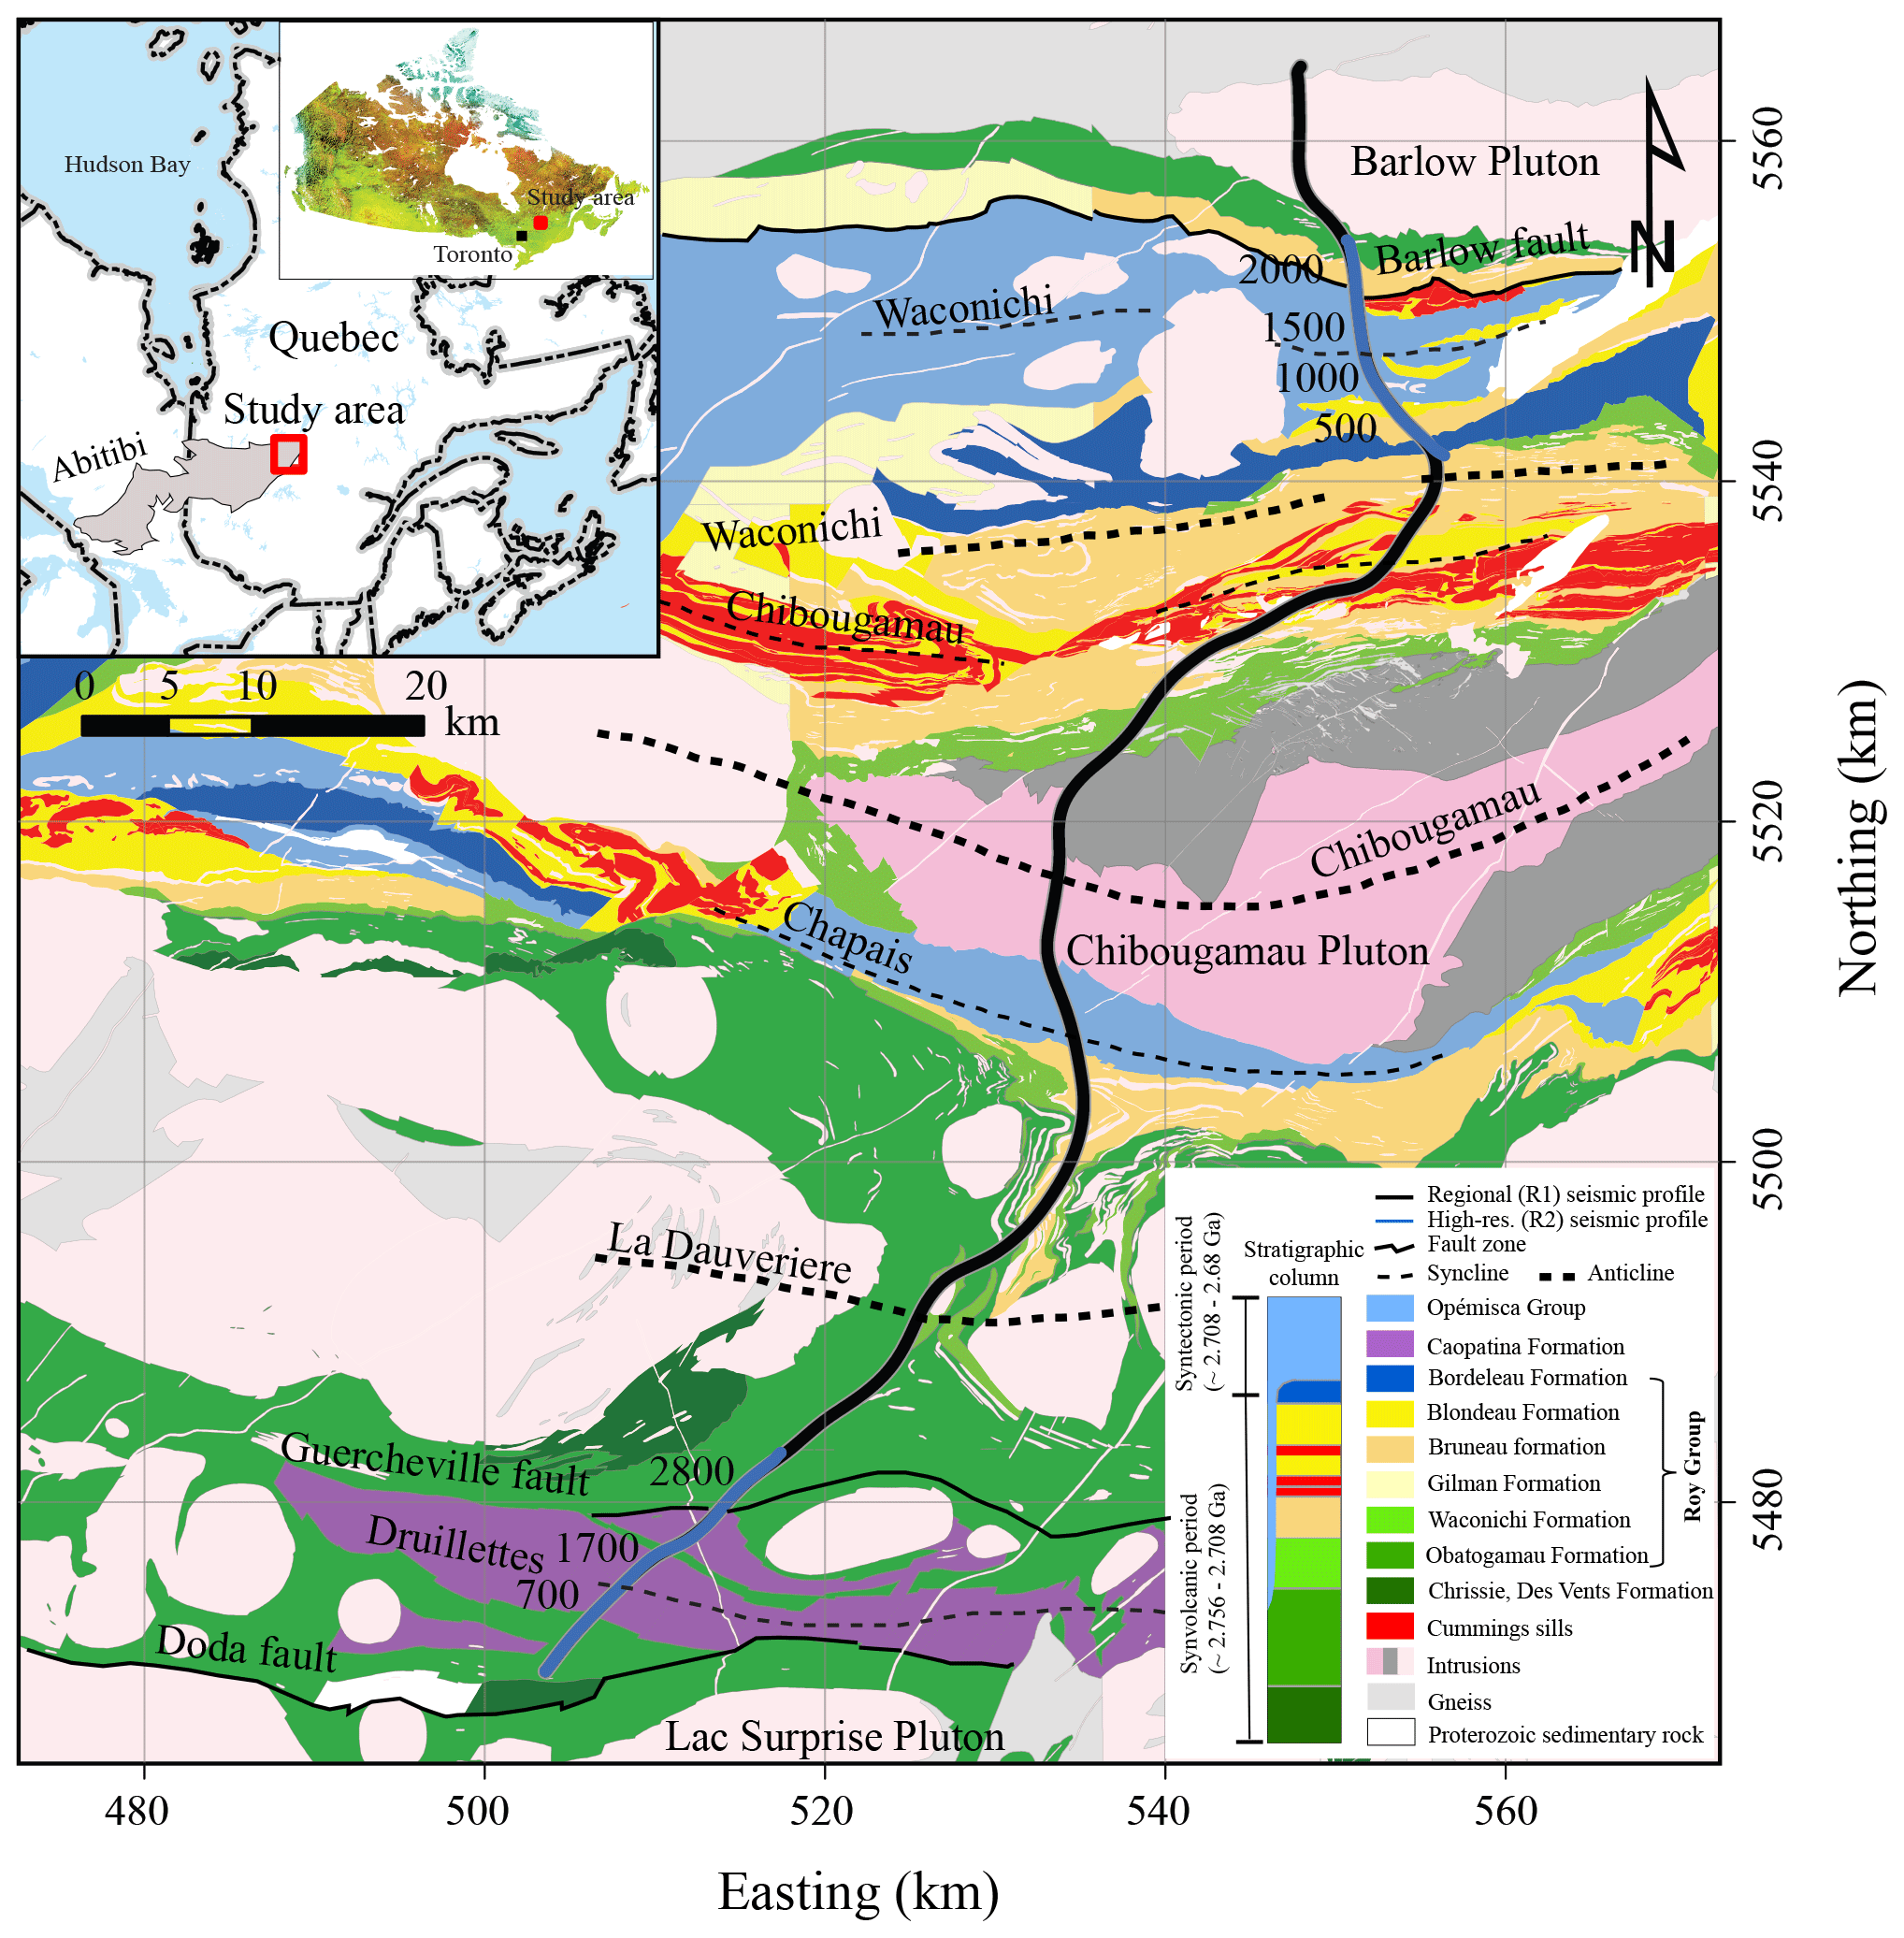
Figure 1The geological map of the Chibougamau study area on which major fault zones in the vicinity of the high-resolution seismic profiles are marked. The regional seismic survey and the high-resolution seismic surveys in the north and south of the area are located and some of the CDP locations are marked. The inset shows the location of the study area within Canada and the Abitibi subprovince.
The 2017 seismic survey in the Chibougamau area forms part of the Metal Earth exploration project in the Abitibi greenstone belt (Naghizadeh et al., 2019). High-resolution seismic segments in the north and south coincide with and augment a regional seismic line that crosses the main geological structures of the area (Fig. 1). Cheraghi et al. (2018) demonstrated that the Chibougamau regional survey capably imaged reflections in both the upper and lower crust (down to Moho depth). Mathieu et al. (2020b) interpreted the regional seismic survey to map major faults and structures in relation to geodynamic processes and potential metal endowment.
The high-resolution surveys in the Chibougamau area form the focus of this study. In total, the survey acquired 2281 vibrator points (VPs) along the north survey and 3126 VPs along the south survey (Fig. 1). Consistent with other high-resolution surveys in the Metal Earth project (Naghizadeh et al., 2019), shot and receiver spacing were set at 6.25 and 12.5 m, respectively, with a sampling rate of 2 ms. Detailed attributes of both surveys are shown in Table 1.
Table 1Data acquisition summary of the high-resolution Chibougamau north and south surveys (year 2017).

a North survey. b South survey.
3.1 Offset distribution for Kirchhoff PSTM and DMO corrections
Based on the analysis shown in Appendix A, both profiles could record alias-free P-wave energy at velocities necessary for seismic imaging in crystalline rock environments, i.e., greater than 5000 ms−1. Our analysis also indicates that both profiles are alias-free for shear waves and low-velocity noise, e.g., ground roll. We investigated the Chibougamau profiles to evaluate irregularity and optimize the application of PSTM and DMO corrections. The offset distribution forms our main criterion with which to investigate the relative quality of pre- and post-stacked migrated images in the Chibougamau area based on common-offset PSTM (Fowler, 1997) and common-offset DMO correction (Hale, 1991; Fowler, 1998). In Appendix A we show the necessity of regular offset distribution when using common-offset DMO or PSTM (Fig. A1). Other methods of DMO or PSTM, such as common-azimuth PSTM (Fowler, 1997) and common-azimuth DMO corrections, should theoretically provide results equal to those assuming common offset (Fowler, 1997, 1998). Our study did not analyze common-azimuth algorithms. Besides the effect of regularity/irregularity of the survey, we also explain in Appendix A that not necessarily all CMPs contribute to the DMO process (DMO illumination concept). Optimized DMO illumination can be investigated during survey design by testing different subsurface models or survey geometries (Beasley, 1993). The common-offset DMO and common-offset PSTM utilize similar algorithms for migration (Fowler, 1997, 1998) and the illumination concept applies to PSTM as well.
The maximum offset in these Chibougamau surveys is 10 km. We evaluated whether specific offset values contribute constructively or destructively in the resulting PSTM or whether they generate artifacts during the DMO corrections. We also investigated PSTM- and DMO-corrected images at different offsets to find the offset range that optimizes subsurface illumination (Vermeer, 1998).
For the Chibougamau profiles, we evaluated CMP distributions within common-depth-point (CDP) bins (6.25 m, Table 2) along each survey. Figures 2 and 3 present examples of CMP offset and azimuth distribution along the north and south surveys, respectively. Some of the CDP bins show a regular offset distribution, for example, Fig. 2b and c from the north profile or Fig. 3b from the south profile (note that bins located in the middle of the survey have short and long offsets equally mapped north and the south of the bin center). The azimuth distribution of these CDP bins also shows a symmetric pattern relative to the CDP line directions, for example, Fig. 2f and g from the north profile and Fig. 3e from the south profile; however, some of the CDP bins present irregular offset and asymmetric azimuth distributions, for example, Fig. 2a, d, e, and h from the north profile, and Fig. 3c and f from the south profile. These CDP bins show that longer offsets are mapped unevenly in the bins resulting in an asymmetric azimuth distribution pattern. The analysis indicates that most of the irregularity of offset distribution occurs due to a lack of longer offsets in those bins.
Based on the analysis shown in Figs. 2 and 3 and evaluating the distribution pattern of offset for the north and south profiles, we predict that an irregular distribution of CMPs would be a challenge for 2D PSTM and DMO corrections. Another challenge is whether CMPs of profiles acquired in the Chibougamau area contribute constructively in DMO or PSTM towards subsurface illumination considering the geometry of specific reflectors, i.e., dip and strike (more details in Appendix A). We designed offset planes with offset ranges of 0–3, 0–6, and 0–9 km in order to study the survey geometry (Fig. 4). We chose these offset ranges based on the analysis shown in Figs. 2 and 3 and testing the effect of various offset ranges on the process of post-stacked DMO and PSTM images (see Table 2 for the processing details). Offsets greater than 9 km did not increase the image quality. In the north profile, CMPs with offsets ≤6 km cluster along the survey line (Fig. 4a, b), whereas many CMPs with offsets greater than 6 km do not (Fig. 4c). The CMPs of the south profile lies along the survey line for all offset ranges (Fig. 4d, e, f) due to the less crooked pattern of the south profile compared to the north profile (Fig. 4).

Figure 2CMP offset and azimuth distribution from the north survey. The offset distribution is shown for (a) CDP 500, (b) CDP 1000, (c) CDP 1500, and (d) CDP 2000. See Figs. 1 and 4 for the location of the CDPs. The negative values for CMP distance in graphs (a–d) indicate CMP is located in the south of the bin center and the positive values imply that CMP is located in the north of the bin center. The azimuth distribution is shown for (e) CDP 500, (f) CDP 1000, (g) CDP 1500, and (h) CDP 2000. For each diagram shown in (e–h) the CDP line direction is presented. The CDP bin is perpendicular to the CDP line.
Table 2Processing parameters and attributes for the Chibougamau surveys.
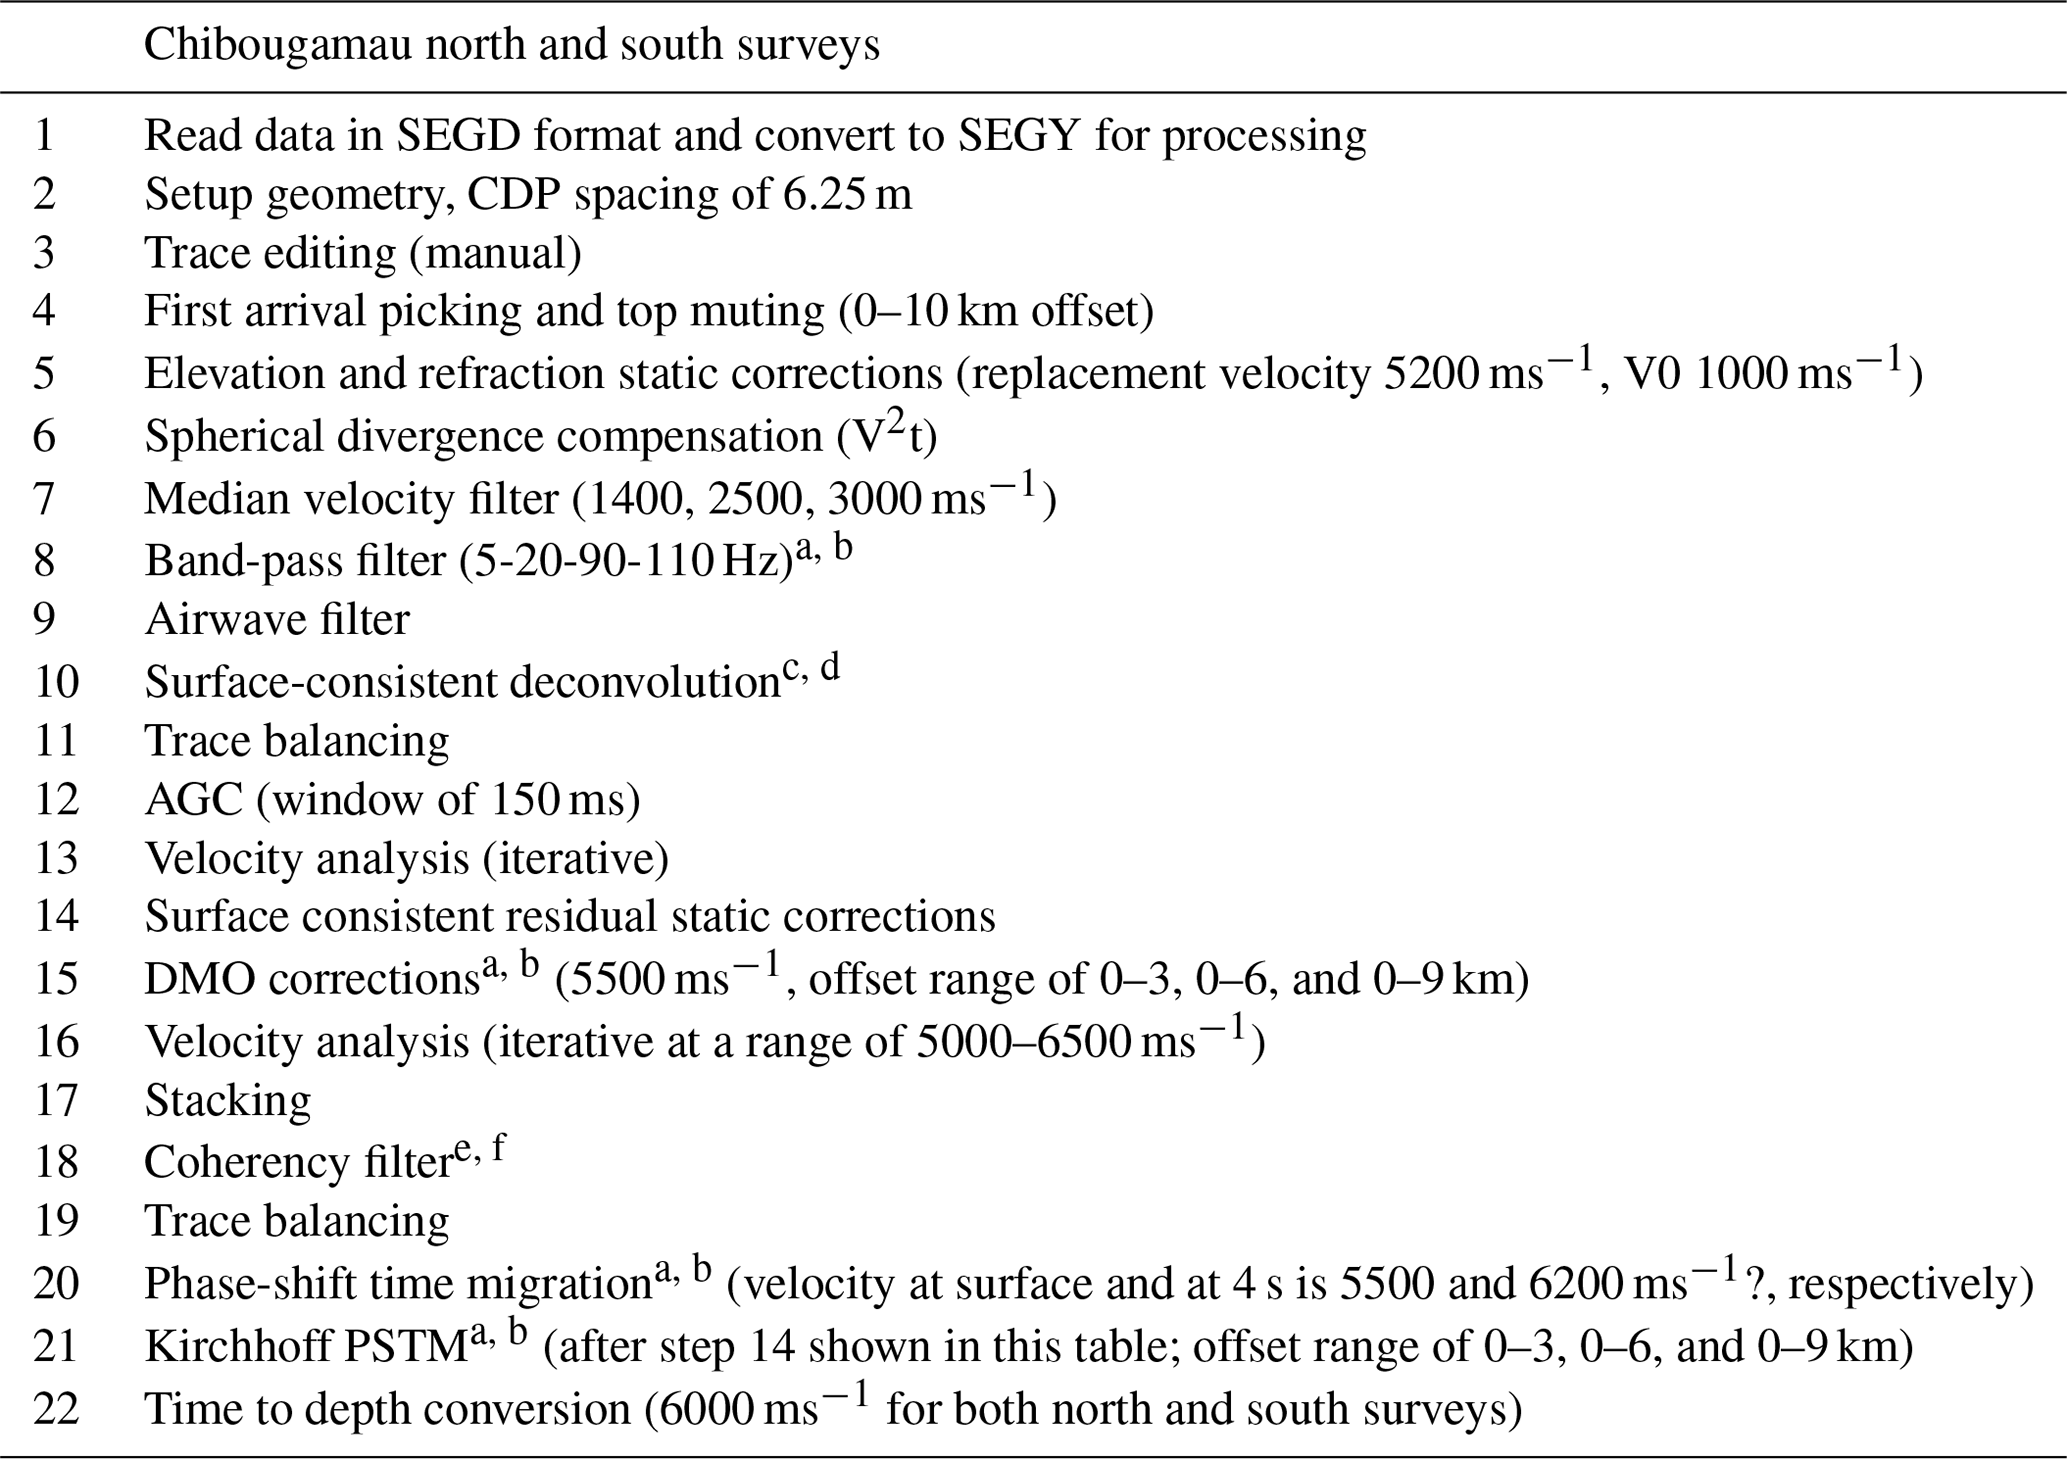
a, b This is applied to both north and south surveys. c North survey: the filter length and gap are 100 and 16 ms, respectively. d South survey: the filter length and gap are 100 and 18 ms, respectively. e North survey: F–X deconvolution; filter length of 39 traces. f South survey: F–X deconvolution; filter length of 19 traces.
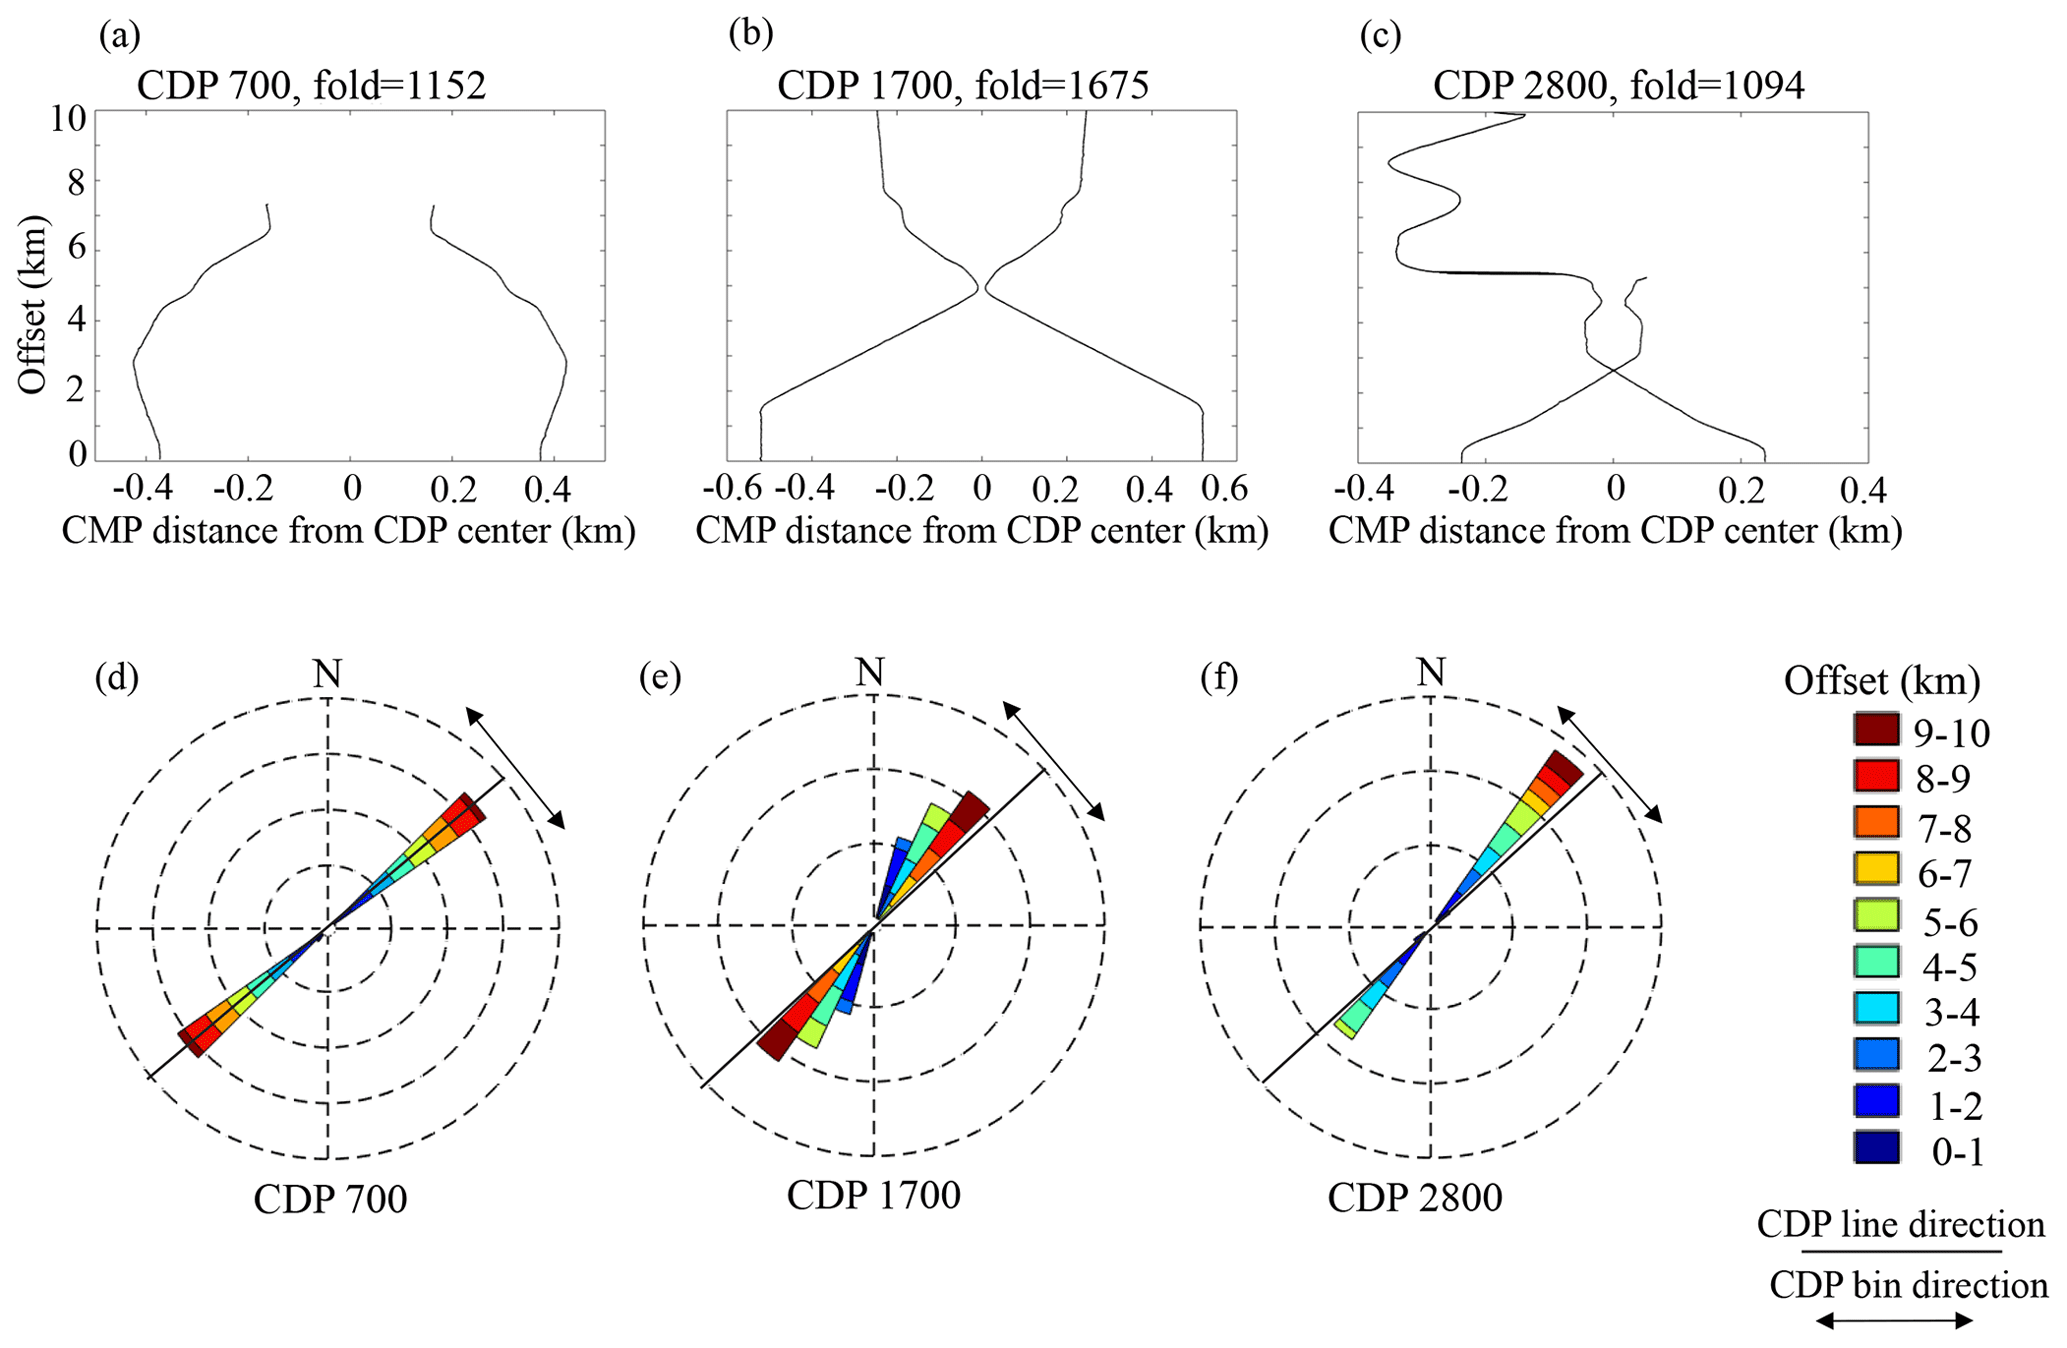
Figure 3CMP offset and azimuth distribution from the south survey. The offset distribution is shown for (a) CDP 700, (b) CDP 1700, and (c) CDP 2800. See Figs. 1 and 4 for the location of the CDPs. The negative values for CMP distance in graphs (a–c) indicate CMP is located in the south of the bin center and the positive values imply that CMP is located in the north of the bin center. The azimuth distribution is shown for (d) CDP 700, (e) CDP 1700, and (f) CDP 2800. For each diagram shown in (d–f) the CDP line direction is presented. The CDP bin is perpendicular to the CDP line.
We considered a pre- and post-stack processing workflow for both the north and south profiles similar to that applied by Schmelzbach et al. (2007) and generated migrated DMO-corrected stacked sections as well as Kirchhoff PSTM sections (Table 2). The CMP distribution of the Chibougamau south survey lies mostly along a straight line; hence a linear CDP processing line was designed (Fig. 4). The CMP coverage along the north profile follows a crooked pattern; hence a curved CDP line that smoothly follows this geometry was used (Fig. 4). The main processing steps included attenuation of coherent and/or random noise, refraction, residual static corrections, sharpening the seismic data using a deconvolution filter, and a top mute to remove first arrivals.
Based on the aforementioned analysis, we considered offset ranges of 0–3, 0–6, and 0–9 km, for DMO corrections and the PSTM. The following steps were also deemed necessary:
-
Reflection residual static corrections were applied to all shot gathers prior to the DMO corrections and PSTM application (steps 1–14 in Table 2).
-
Constant DMO corrections with a velocity of 5500 ms−1 were applied for both the north and south surveys. This chosen velocity derived from several tests using various constant velocities between 5000 and 6500 ms−1, with step range of 100 ms−1.
-
After DMO corrections, velocity analysis with constant stacking velocity in the range of 5000–6500 ms−1 helped to design an optimized velocity model for NMO corrections and the stacking (Table 2).
-
Choosing a velocity model for PSTM was a time consuming procedure performed on the basis of trial and error. We tried constant velocity models at a range of 5000–6500 ms−1 (step rate of 100 ms−1) as well as the velocity model applied for the DMO–NMO correction (see above). The best model adopted velocities within 90 %–110 % of the DMO velocity model.
The DMO-corrected migrated stacked sections and PSTM sections of the north and south survey appear in Figs. 5 and 6, respectively. The offset range of 0–3 km reveals the most coherent reflections for both methods (Figs. 5a, b, 6a, b); the velocity analysis after DMO corrections significantly improved the coherency of the reflections for the sections with an offset range of 0–3 km (Figs. 5a and 6a). The migrated sections generated from offset ranges of 0–6 and 0–9 km (Figs. 5c–f, and 6c–f) failed to improve the stacked sections. The stacked sections from the longer offsets (Figs. 5c, e and 6c, e) utilized a velocity model similar to the one applied to Figs. 5a and 6a for stacking after DMO correction.
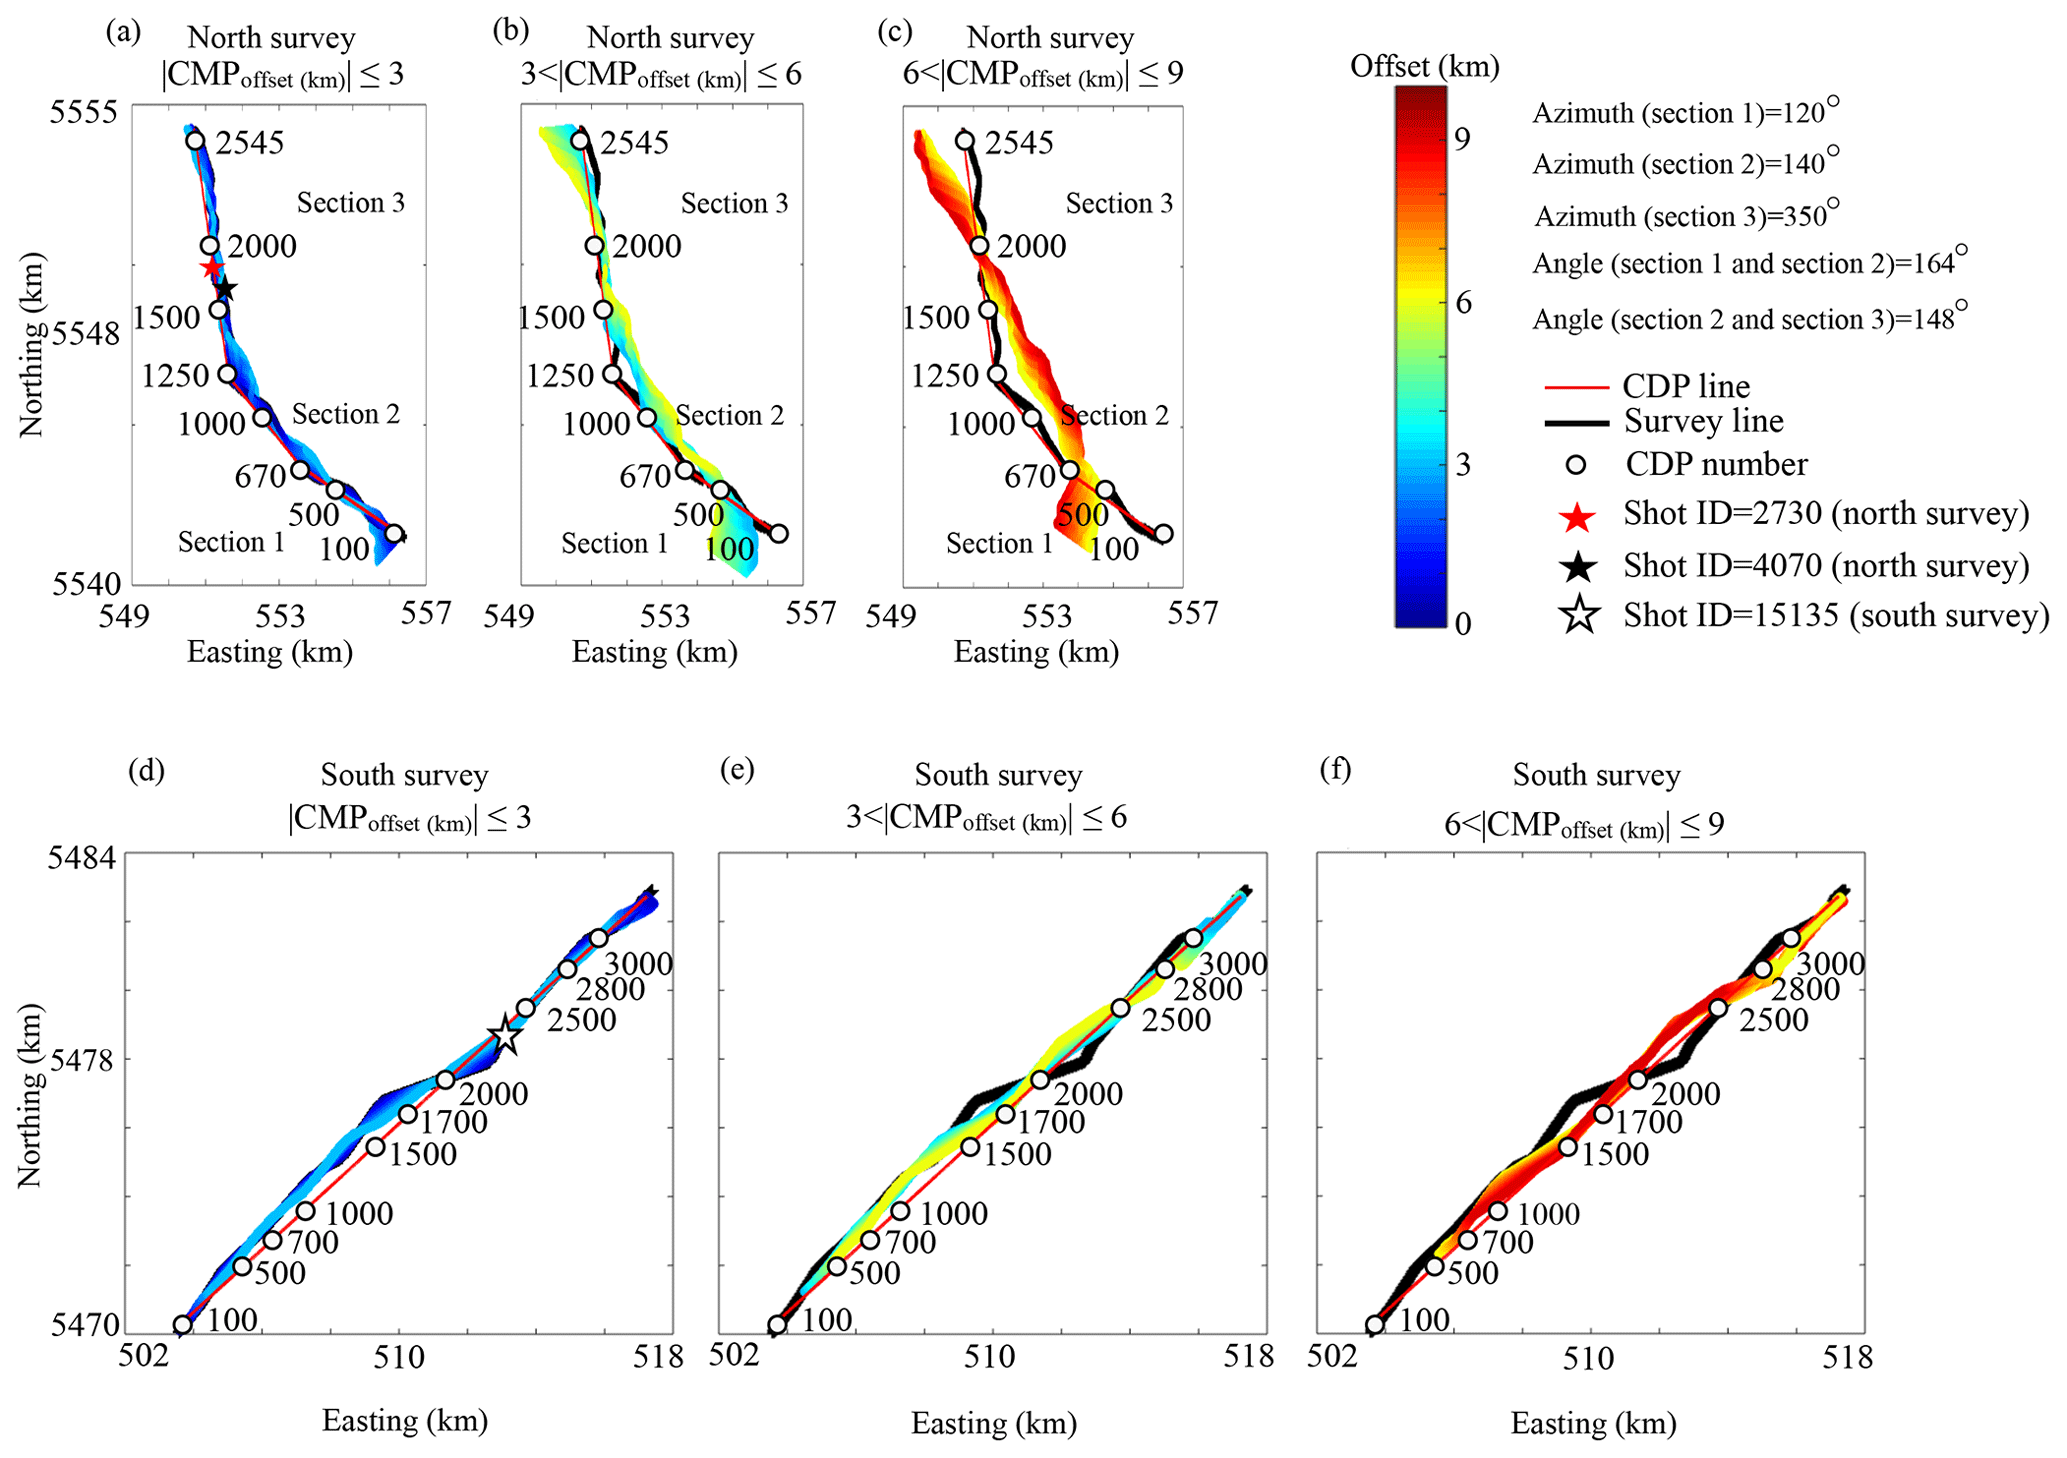
Figure 4CMP offset distribution at a range of 0–10 km for the north and the south survey in the Chibougamau area. The distribution for the north survey is shown for (a) |CMPoffset(km)|≤3, (b) , and (c) , and for the south survey it is shown for (d) |CMPoffset(km)|≤3, (e) , and (f) . The CDP line and the survey line are shown in the figure. Some shot and CDP locations are also shown. The azimuth of each section of the CDP line from the north survey and the angle between two sequential sections are presented.
The design of the north survey CDP line used three segments: CDPs 100–670 have an azimuth of 120∘, CDPs 670–1250 have an azimuth of 140∘, and CDPs 1250–2545 have an azimuth of 350∘ (Fig. 4). Table 3 indicates geometrical attributes of key reflections imaged along the north profile. The first segment, ending at the contact between sedimentary rocks of the Bordeleau Formation and mafic rocks of the Bruneau Formation, appears seismically transparent without any prominent reflections (Fig. 5a, b). Labeled in Fig. 5, chn1, chn2, and chn3 mark the major reflections imaged in the upper crust. The most prominent reflection package of the north survey is chn3, with an apparent width of approximately 3 km on the surface and an apparent thickness of approximately 2 km (see Table 3 for detailed attributes). Reflections chn4, chn5, and chn6 imaged at depths greater than 2 km could be related to a structure at the southern boundary of the Barlow pluton (Fig. 1). The horizontal reflection chn_diff, with a horizontal length of approximately 1 km, appears in the DMO stacked migrated section (Fig. 5a) and also weakly in the PSTM section (Fig. 5b). Reflection chn_diff intersects the chn4 reflections. The apparent geometry of the chn_diff reflection in the migrated sections would suggest a curved feature or else a diffracted wave that collapsed to a horizontal reflection after the migration.
The Chibougamau south survey mostly traverses mafic to intermediate lava flows of the Obatogamau Formation and sedimentary rocks of the Caopatina Formation (Fig. 6). The DMO stacked migrated (Fig. 6a) and PSTM sections (Fig. 6b) both show steeply dipping and subhorizontal reflections in the upper crust, but upper-crustal reflections in the DMO stack section (Fig. 6a) show more coherency than those of the PSTM (Fig. 6b). Therefore, the DMO stack facilitates correlation with the surface geology. Reflection packages chs1, chs2, and chs3 mark the most prominent features in the upper crust imaged along the south survey. The deeper reflections include reflection chs4 at depths greater than 2 km and two packages of steeply dipping reflections chs5 and chs6 at depths greater than 6 km, together extending along 18 km length of the survey. Table 3 summarizes the geometrical attributes of these reflections.
The analysis performed on offset distribution indicated that selecting a proper offset range, here 0–3 km, was crucial for both DMO corrections and PSTM. Another factor that could affect the imaging involves CMP locations relative to CDP bin centers. For the Chibougamau surveys, the maximum CMP offset perpendicular to the CDP line was about ±0.4 km when an offset range of 0–3 km is considered for processing (Fig. 4a and d). The 3D nature of subsurface geology around a crooked-line survey requires that out-of-plane features be evaluated, accounting for the time shifts from these features. When out-of-plane CMPs scatter or reflect seismic waves from steep structures off the CDP line (cross-dip direction), cross-dip analysis addresses time shifts of those structures and adjusts accordingly (for example, Larner et al., 1979; Bellefleur et al., 1995; Nedimovic and West, 2003; Rodriguea-Tablante et al., 2007; Lundberg and Juhlin, 2011; Malehmir et al., 2011). Calculated time delays, called cross-dip moveout (CDMO) and treated as static shifts, can be applied to both NMO- or DMO-corrected sections (Malehmir et al., 2011; Ahmadi et al., 2013). CDMO is sensitive to both velocity and the cross-dip angle applied; however, the variation in the angle appears more crucial for hard rock data (Nedimovic and West, 2003).
In this Chibougamau case study, we used DMO-corrected sections (constant velocity of 5500 ms−1, Table 2) for CDMO analysis, similar to a study by Malehmir et al. (2011). First, the CMP offset relevant to a bin center and perpendicular to the CDP line was calculated (Fig. 4). CDMO calculated for dip angles varying from 40∘ to the west to 40∘ to the east with a step rate of 2∘ was then applied to DMO-corrected CMPs. Finally, we stacked DMO–CDMO-corrected traces using a velocity model designed from the one applied after DMO corrections during standard processing (Table 2). Further velocity analysis checked whether the coherency of the reflections could be improved, but the new velocity model, where different, showed less than ±5 % changes from the input model. An example of the CDMO analysis applied to the Chibougamau surveys appears in Figs. 7–9. Table 3 summarizes which CDMO elements (i.e., toward east or west or no cross dip) increase the coherency of the reflections when considering time delays associated with out-of-plane reflections.
In the Chibougamau north survey, most of the seismic reflectivity is observed at CDPs 700–2500 (Figs. 4 and 5), which include segments 2 and 3 of the processing line; as such, we have performed the CDMO analysis for those two sections, separately. In segment 2 (CDPs 670–1250, Fig. 4), reflections chn1, chn2, and chn3 appear with no cross-dip element applied (Fig. 7c). The CDMO analysis of segment 2 (Fig. 7) did not reveal any significant reflectivity in the deeper part of the section, i.e., 2–4 s (∼ 6–12 km, mid-crust). The CDMO analysis along segment 3 is shown as Fig. 8. Applying the westward CDMO increased the coherency of diffraction chn_diff. A diffraction package imaged at depths lesser than 1 s (dashed area in Fig. 8c) is not imaged in the migrated sections (Fig. 5). One horizontal reflection at a depth of approximately 11 km (∼ 3.5 s) between CDPs 1600–2000 located within reflection package chn6 shows almost equal coherency independent of the applied cross dip to the east or west (Fig. 8).
The CDMO analysis in the south profile was more challenging because of interfering reflections that dip steeply to the north and to the south (Fig. 6). The CDMO analysis results for the south survey appear in Fig. 9 and Table 3. The reflection chs2 displays a complicated CDMO analysis (Fig. 9). With cross dip towards the west assumed, reflection chs2 becomes less steep (Fig. 9). Assuming a cross dip of 30∘ to the west, chs2 dips 20∘ to the south (Fig. 9a), whereas with no CDMO correction it dips 40∘ to the south and features less continuity (Fig. 9c). With any cross-dip element towards the east applied, chs2 dips more steeply. Reflection chs2 dips 50∘ to the south with a cross-dip element of 40∘ to the east applied (Fig. 9f). CDMO analysis for reflection chs3 presents another complicated scenario. This reflection shows the same dip (40∘) and its coherency improves with an increasing west cross-dip element (Fig. 9a–c). On the other hand, with an east cross-dip element applied, reflection chs3 becomes less steep (for example 20∘ in Fig. 9e versus 40∘ in Fig. 9c), and its coherency decreases (Fig. 9c–f).
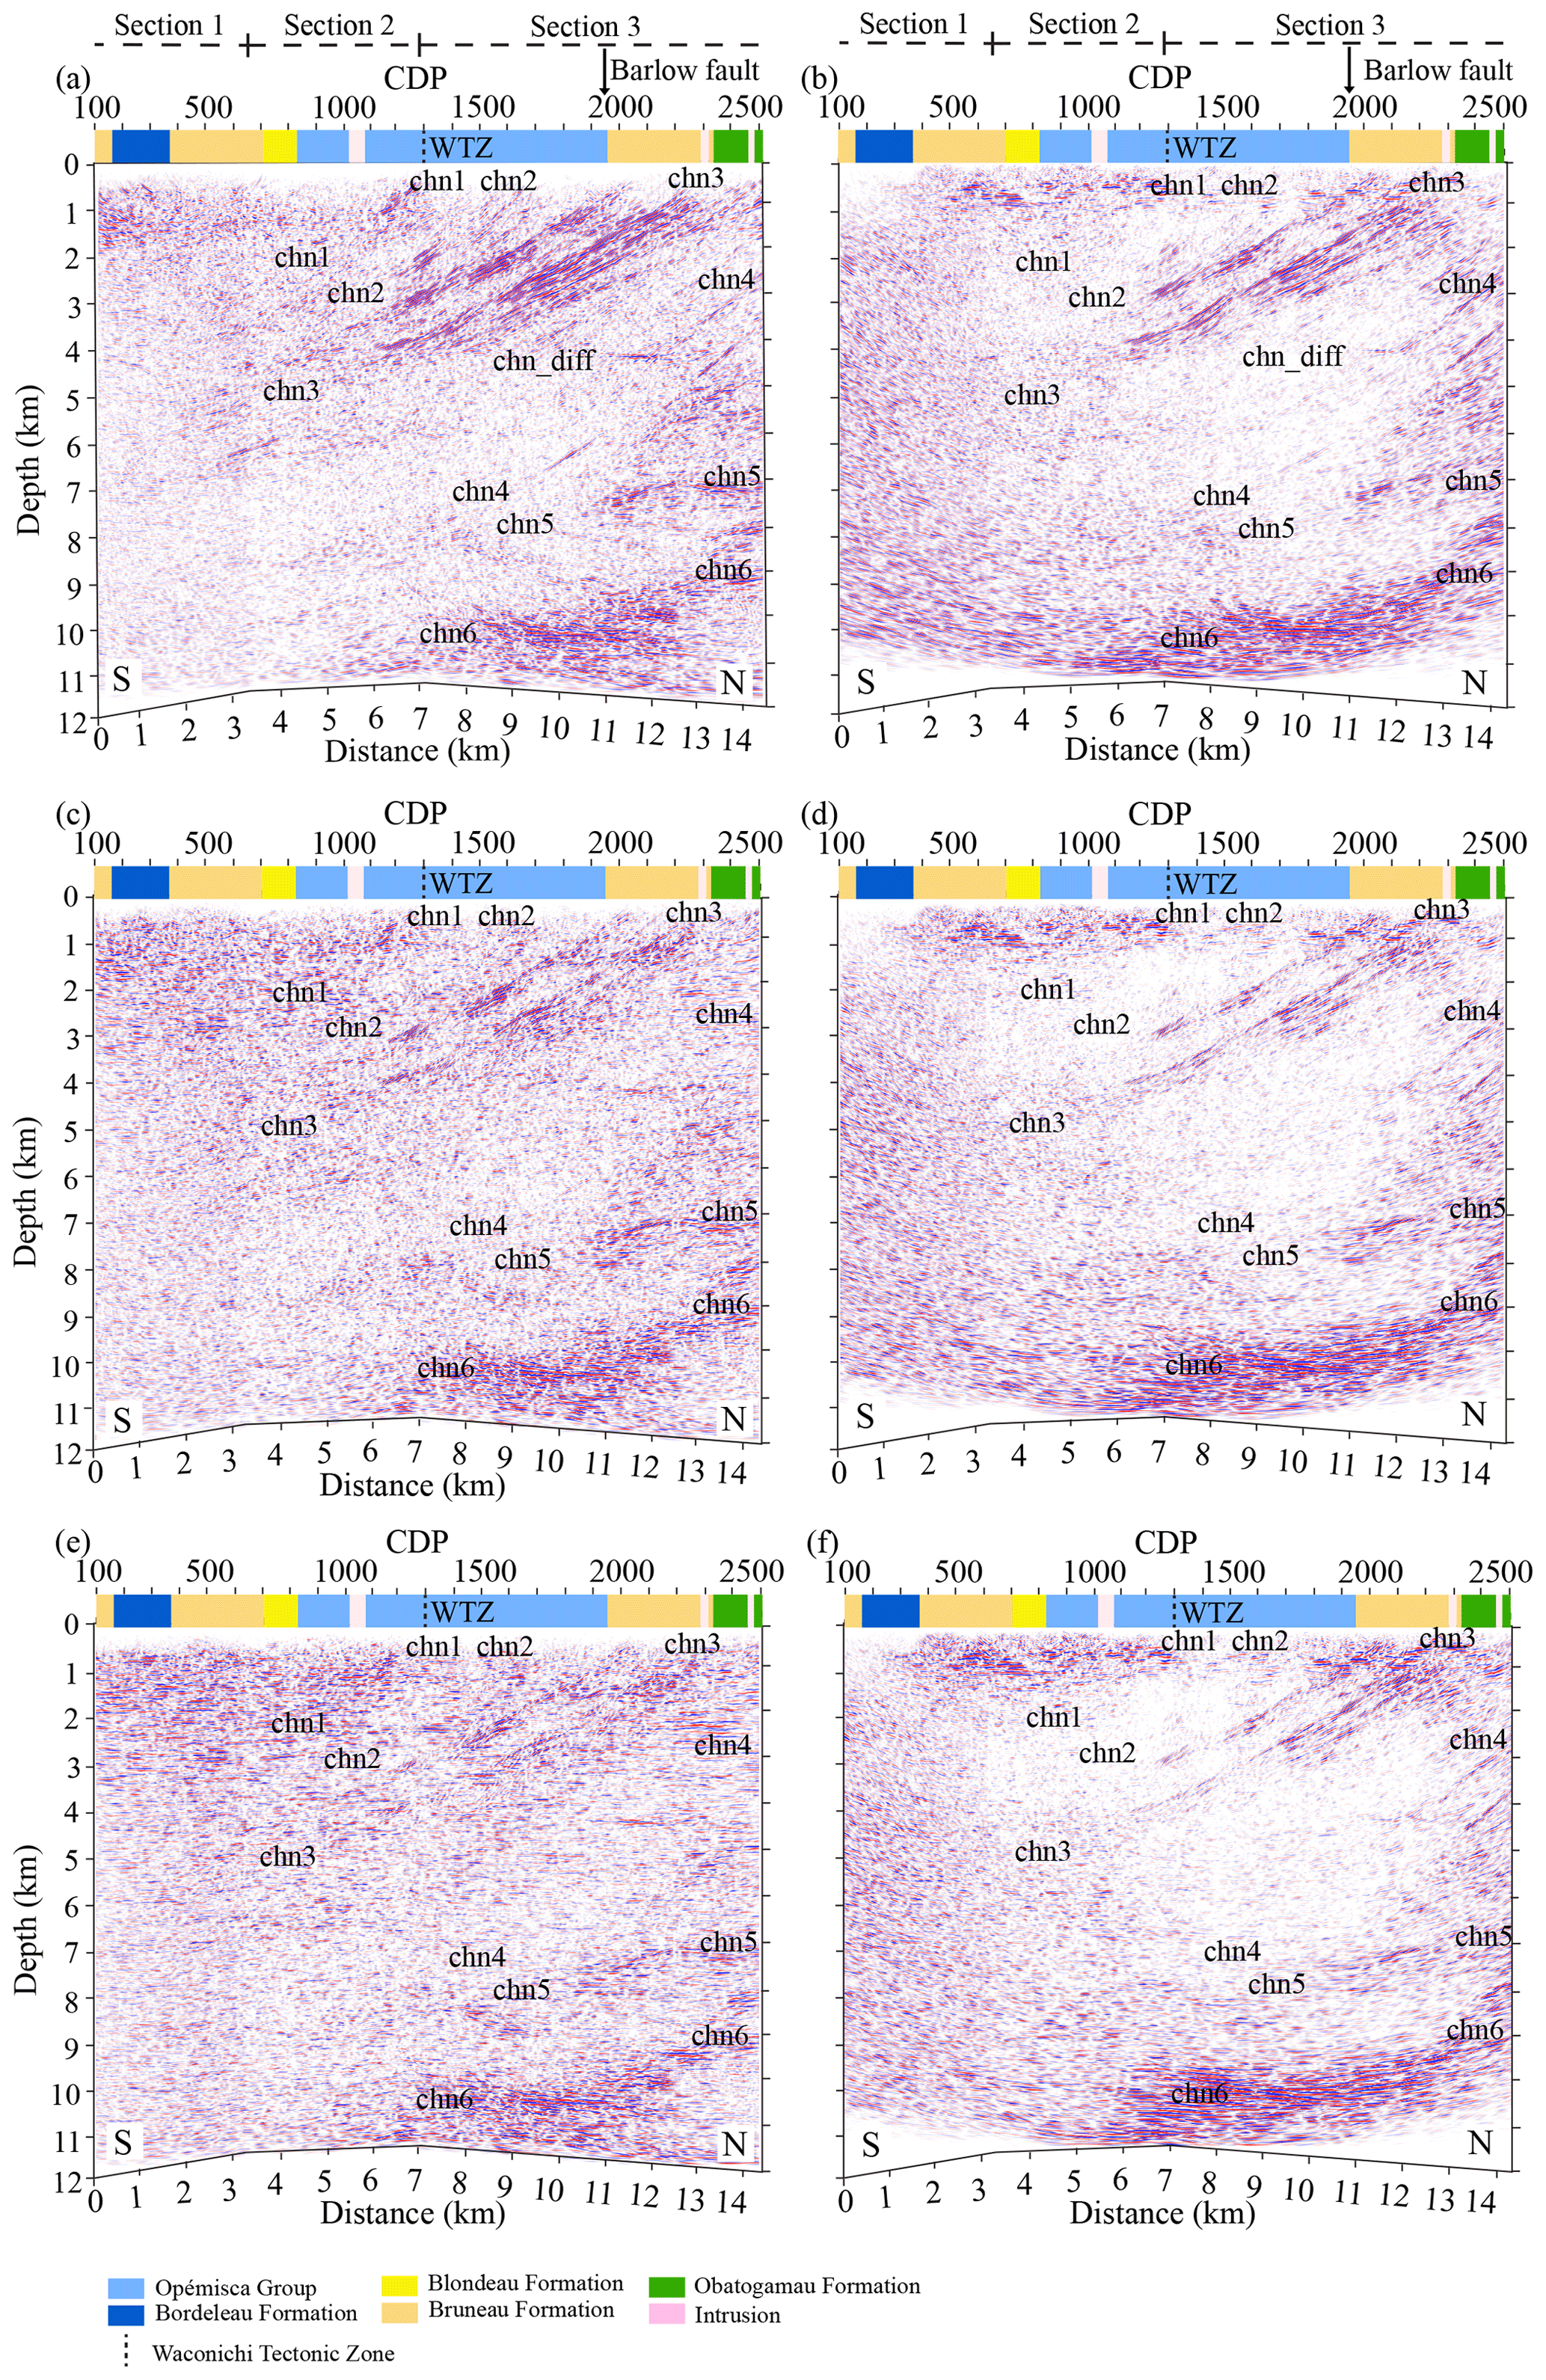
Figure 5Migrated sections from the north survey considering an offset plane at a range of 0–9 km. DMO-corrected migrated section and PSTM section shown in (a) and (b), respectively, for an offset plane of 0–3 km, in (c), (d), respectively, for an offset plane of 0–6 km, and in (e) and (f), respectively, for an offset plane of 0–9 km. Prominent reflections are imaged in shallow and deep zones of the sections. For the interpretation of chn1, chn2, chn3, chn4, chn5, chn6, and chn_diff, see text. The survey includes three sections which are projected at the top of the image. The rock units along the survey path are projected at the top of each section with no dip in the contacts implied. The surface location of the Barlow fault is marked at the top of the section.
Table 3Geometrical attributes of reflections imaged in the Chibougamau area.
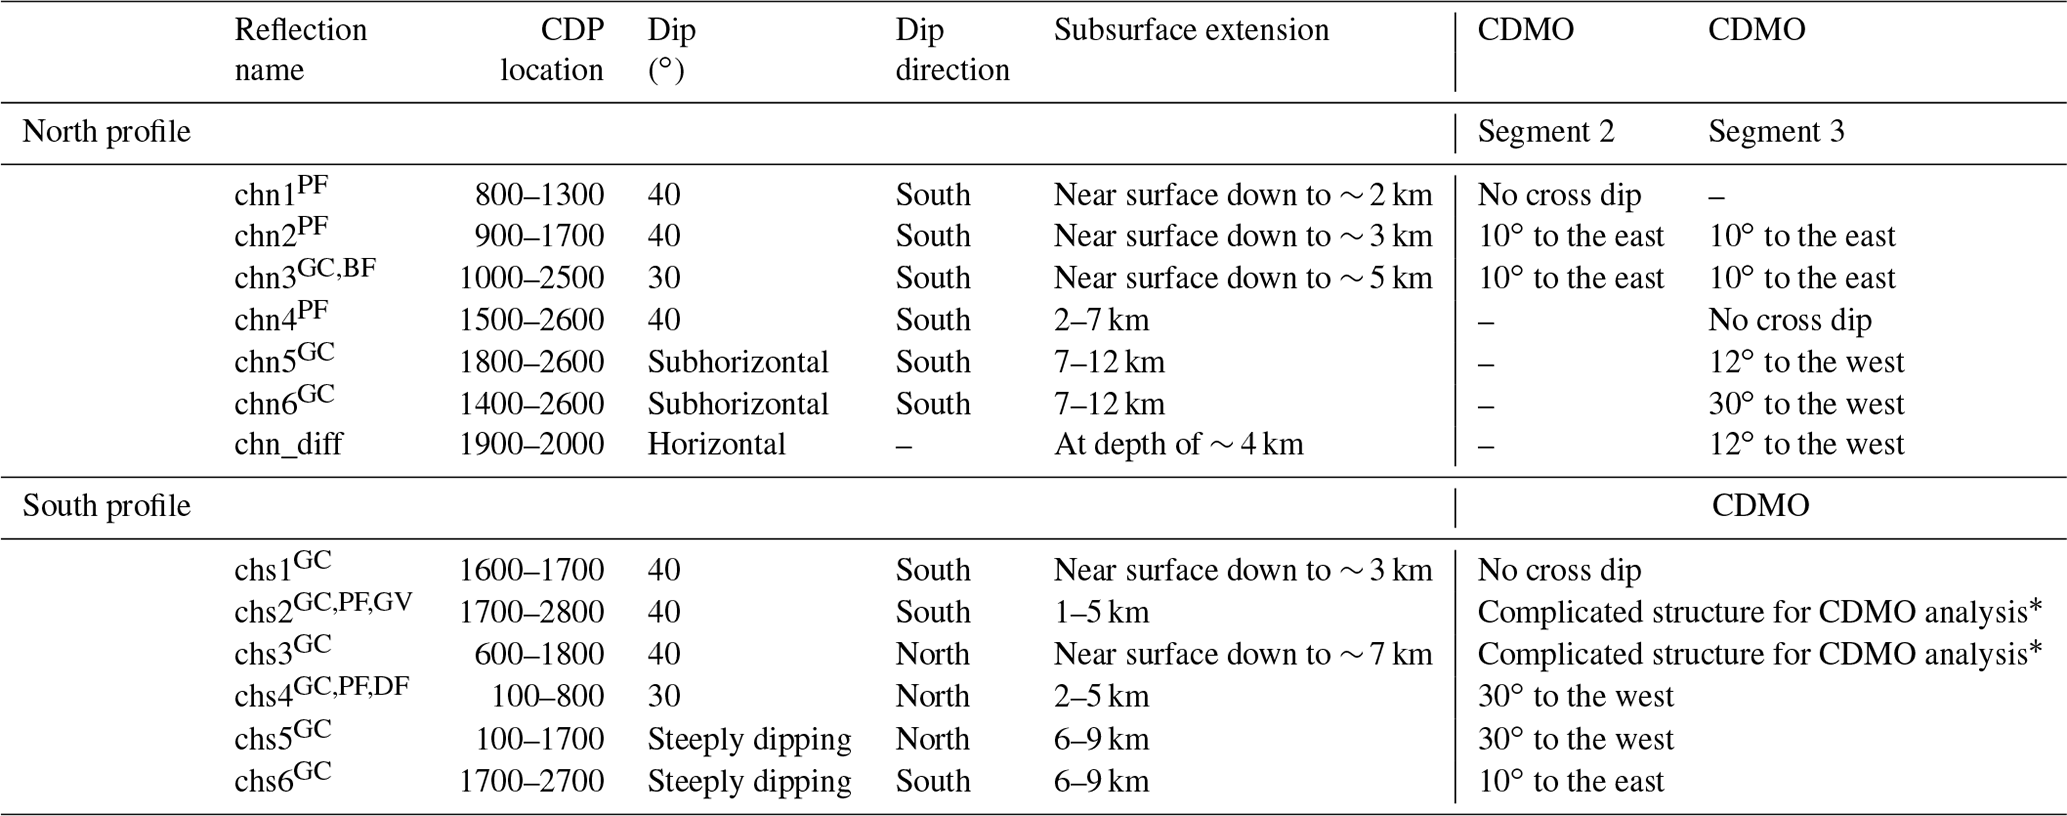
∗ The reflection package shows varying dip with cross dip to the east or west
applied. See text for more details.
GC The geological contact. PF The possible fault. BF The
Barlow fault.
GV The Guercheville fault DF The Doda fault.
The high-resolution seismic profiles acquired in the Chibougamau area present an essential case study to address the challenges of the application of the method in a crystalline rock environment. One goal of our research was to adjust the processing flow to improve subsurface illumination. To achieve this, we analyzed the performance of common-offset DMO and PSTM. Another aspect of our research involved geologic interpretation of the seismic sections, especially around the fault zones, that could unravel potential zones for detailed mineral exploration. Detailed study of fault zones including age, kinematics, and alteration could provide more insight about mineral exploration but requires inclusive field investigation and petrography beyond the scope of our present study.
6.1 The effect of survey geometry on seismic imaging
The analysis performed on common-offset DMO and PSTM sections showed the importance of offset range and CMP distribution on CDP bins and whether CMP offsets at ranges of 0–10 km could all contribute constructively in the resulting images (Figs. 5 and 6). The analysis summarized in Figs. 2 and 3 indicates that the survey geometry resulted in irregular offset distribution in CDP bins, especially for longer offsets. The immediate effect of this irregularity was underperformance of DMO and PSTM for the longer offsets (Figs. 5 and 6). We explain in Appendix A that several factors including spatial attributes of the reflectors (i.e., dip and strike) and survey geometry (i.e., shot and receiver location) define the DMO illumination. Ideally, the impact of known subsurface architecture on DMO illumination should be analyzed before data acquisition at the survey design stage (Beasley, 1993; Ferber, 1997). In our study, the DMO illumination criteria can be extended to the PSTM process because common-offset DMO correction and common-offset PSTM utilize similar algorithms for migration (Fowler, 1997, 1998).

Figure 6Migrated sections from the south survey considering an offset plane at a range of 0–9 km. DMO-corrected migrated section and PSTM section shown in (a) and (b), respectively, for an offset plane of 0–3 km, in (c) and (d), respectively, for an offset plane of 0–6 km, and in (e) and (f), respectively, for an offset plane of 0–9 km. Prominent reflections are imaged in shallow and deep zones of the sections. For the interpretation of chs1, chs2, chs3, chs4, chs5, and chs6, see text. The rock units along the survey path are projected at the top of each section with no dip in the contacts implied. The surface location of the Guercheville fault is marked at the top of the section.
In the Chibougamau area, our strategy adjusted DMO and PSTM to find an offset range that better serves the concept of regularity. We performed detailed velocity analysis to design a velocity model producing the highest illumination. The DMO and PSTM images with an offset range of 0–3 km provided the most convincing images for both profiles when considering only reflection coherency (Figs. 5a, b and 6a, b). Artifacts in the form of subhorizontal features appear in DMO sections where the longer offsets (0–6, and 0–9 km) are used to create the images (Figs. 5c, e, 6c, e). Such artifacts disguise the DMO images of the surveys, especially in the upper crust at depths less than 6 km, and indicate a destructive contribution of CMPs in the DMO process as previously recognized in other surveys acquired in crystalline rock environments (Cheraghi et al., 2012). PSTM images of the both profiles (Figs. 5b, d, f and 6b, d, f) had less capability to image steeply dipping reflection at depths less than 6 km. This could relate to either a lack of a detailed velocity model or an inadequate contribution of CMPs, especially for longer offsets. PSTM images of longer offsets do show an adequate capability of preserving deeper reflections, for example, reflection chn6 in Fig. 5d and f (cf. Fig. 5c and e, respectively) and reflections chs5 and chs6 in Fig. 6d and f (cf. Fig. 6c and e, respectively).
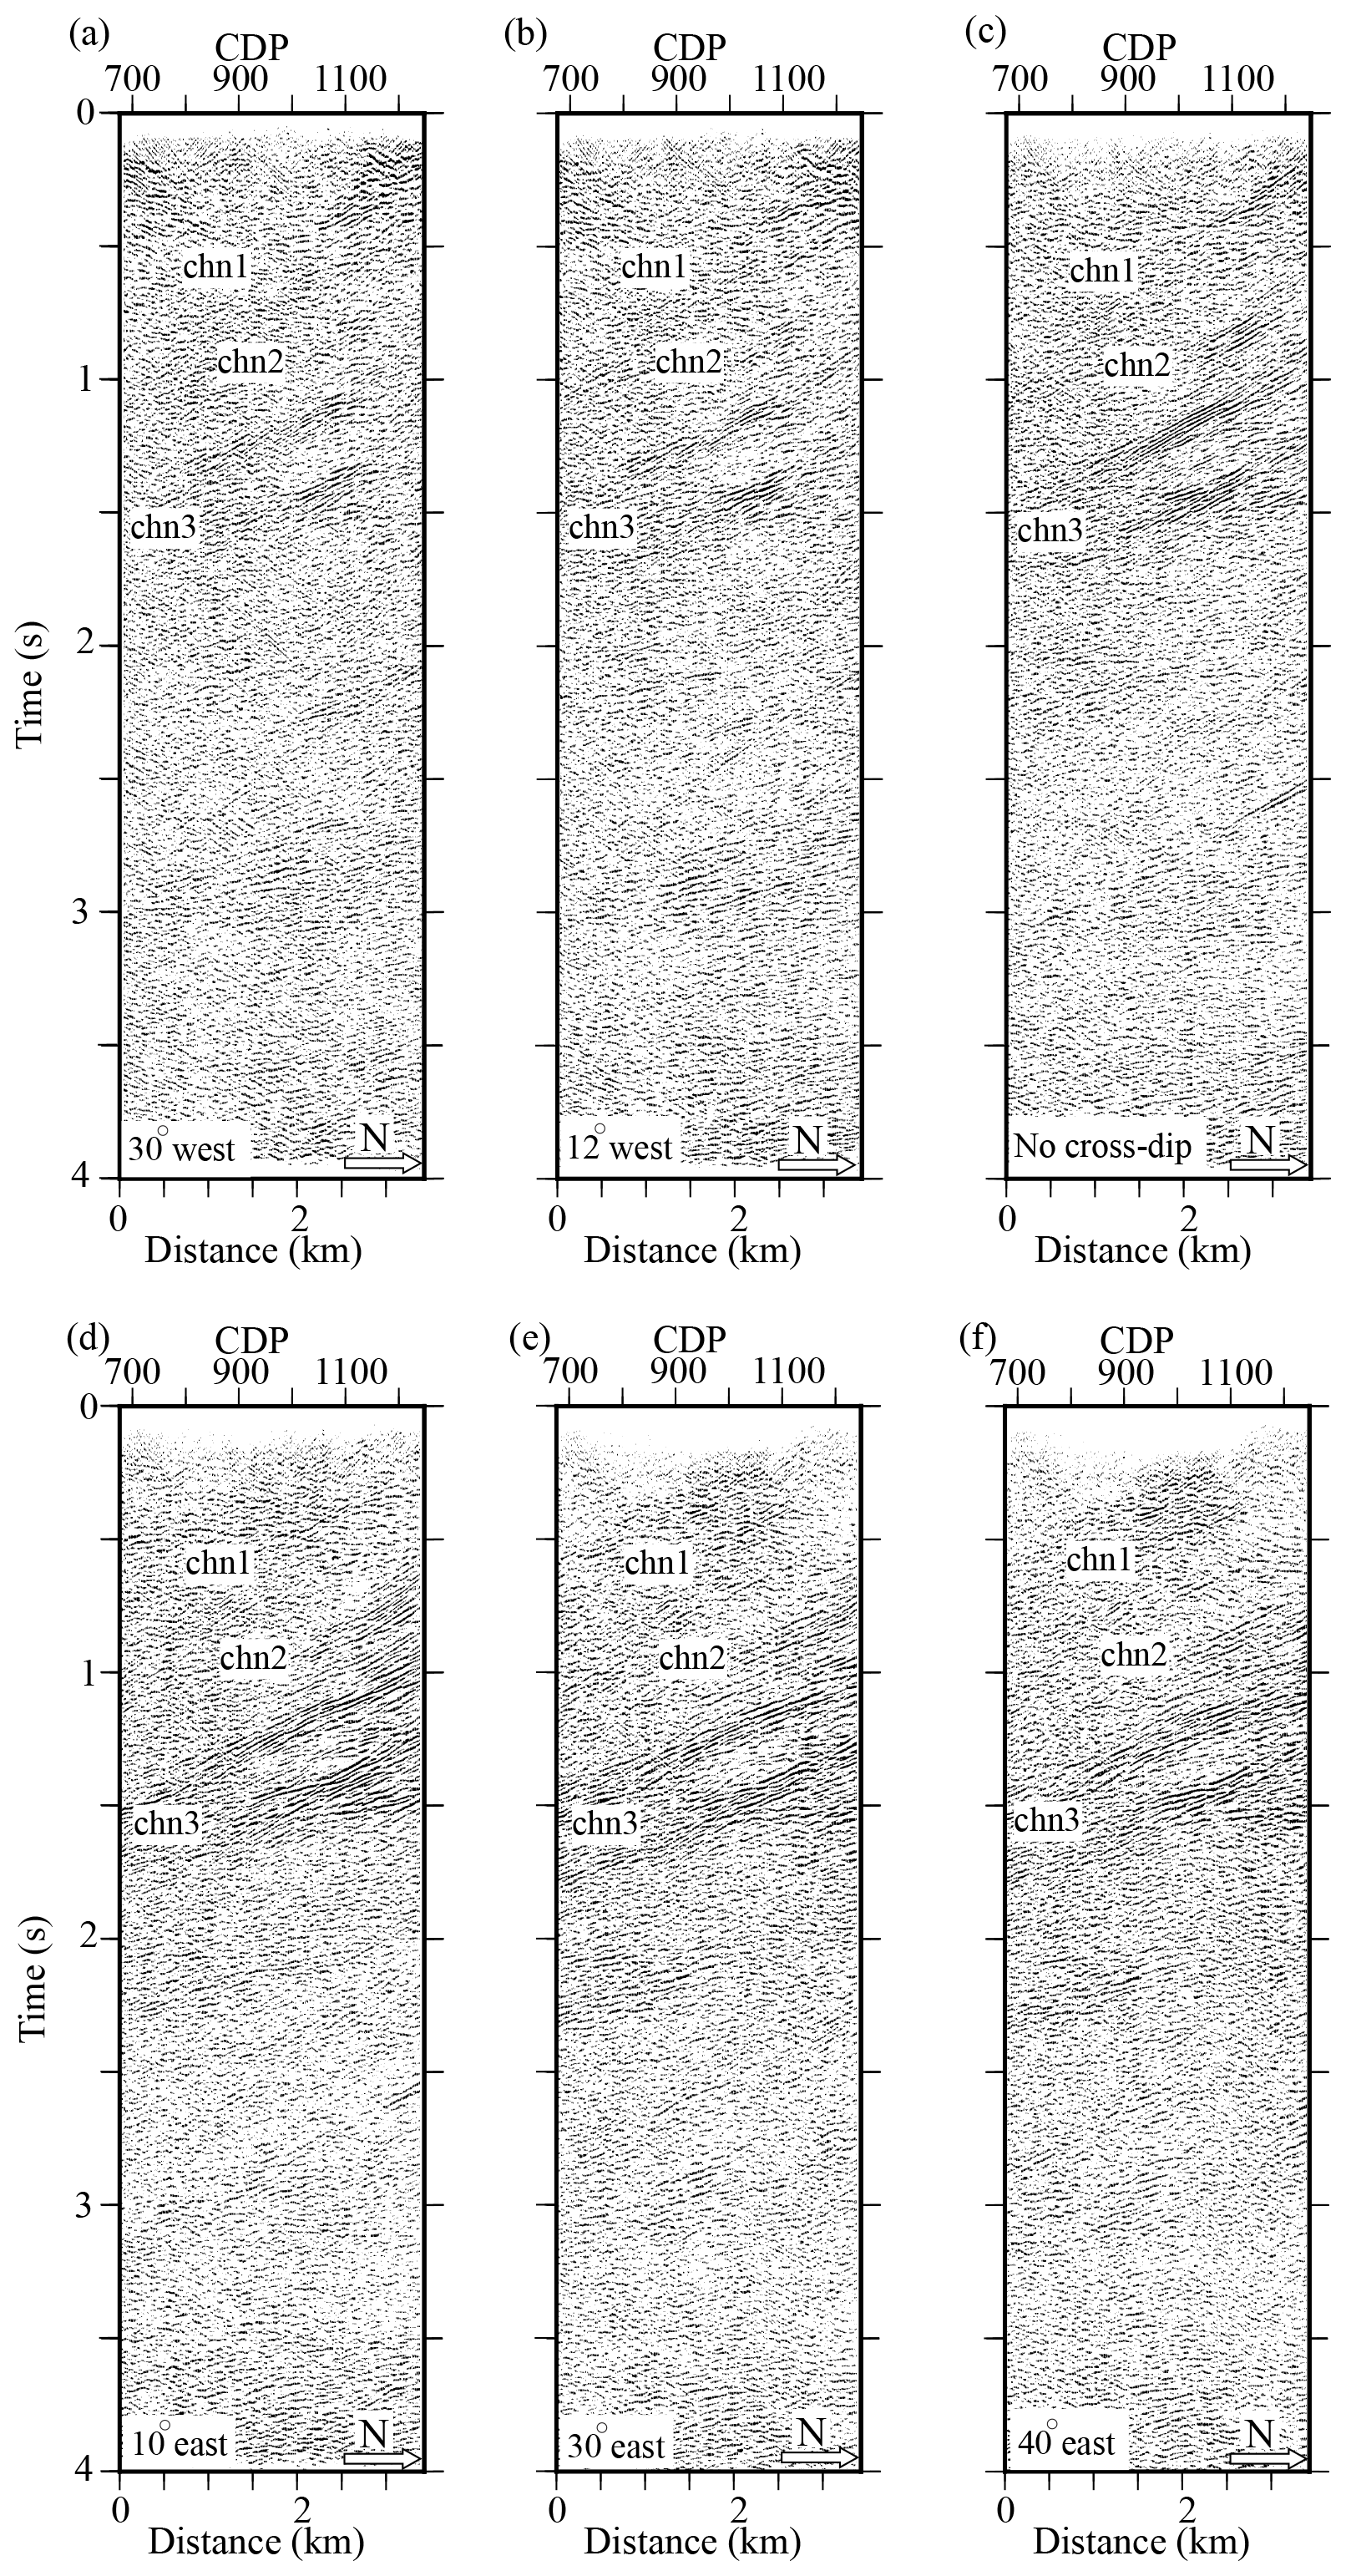
Figure 7CDMO analysis for the north survey along Sect. 2 (see Fig. 4 for the location of the section). (a) DMO-corrected stacked section with cross-dip element of 30∘ to the west applied. (b) DMO-corrected stacked section with cross-dip element of 12∘ to the west applied. (c) DMO-corrected stacked section with no cross-dip element applied. (d) DMO-corrected stacked section with cross-dip element of 10∘ to the east applied. (e) DMO-corrected stacked section with cross-dip element of 30∘ to the east applied. (f) DMO-corrected stacked section with cross-dip element of 40∘ to the east applied. See text for the interpretation of marked reflections.
6.2 Seismic interpretation in the Chibougamau area
Both surveys imaged several packages of reflections from the near-surface down to 12 km (upper crust, Figs. 5 and 6). As noted before, DMO stacked migrated sections and PSTM images with an offset range of 0–3 km presented more coherent reflections; thus our interpretation used the images shown in Figs. 5a and b and 6a and b. The geometrical attributes of the reflections are shown in Table 3. The geological map (Fig. 1) shows several fault zones in the Chibougamau area intersected by each profile. Both profiles show reasonable correlations of seismic reflections to the surface geology at depths less than 6 km. Some imaged reflectors may match known faults. Here, the aim is to get geometrical attributes on the planar structures being imaged and to discuss possible relationships to mapped faults (Fig. 1) without further investigation of the kinematics, alteration, age, and mineralogy, which are not within the scope of this study. This helped us to map the major fault zones and interpret the seismic sections. The CDMO analysis also served as a tool to investigate the out-of-plane apparent dip of the reflection packages. The interpretation of each seismic profile follows.
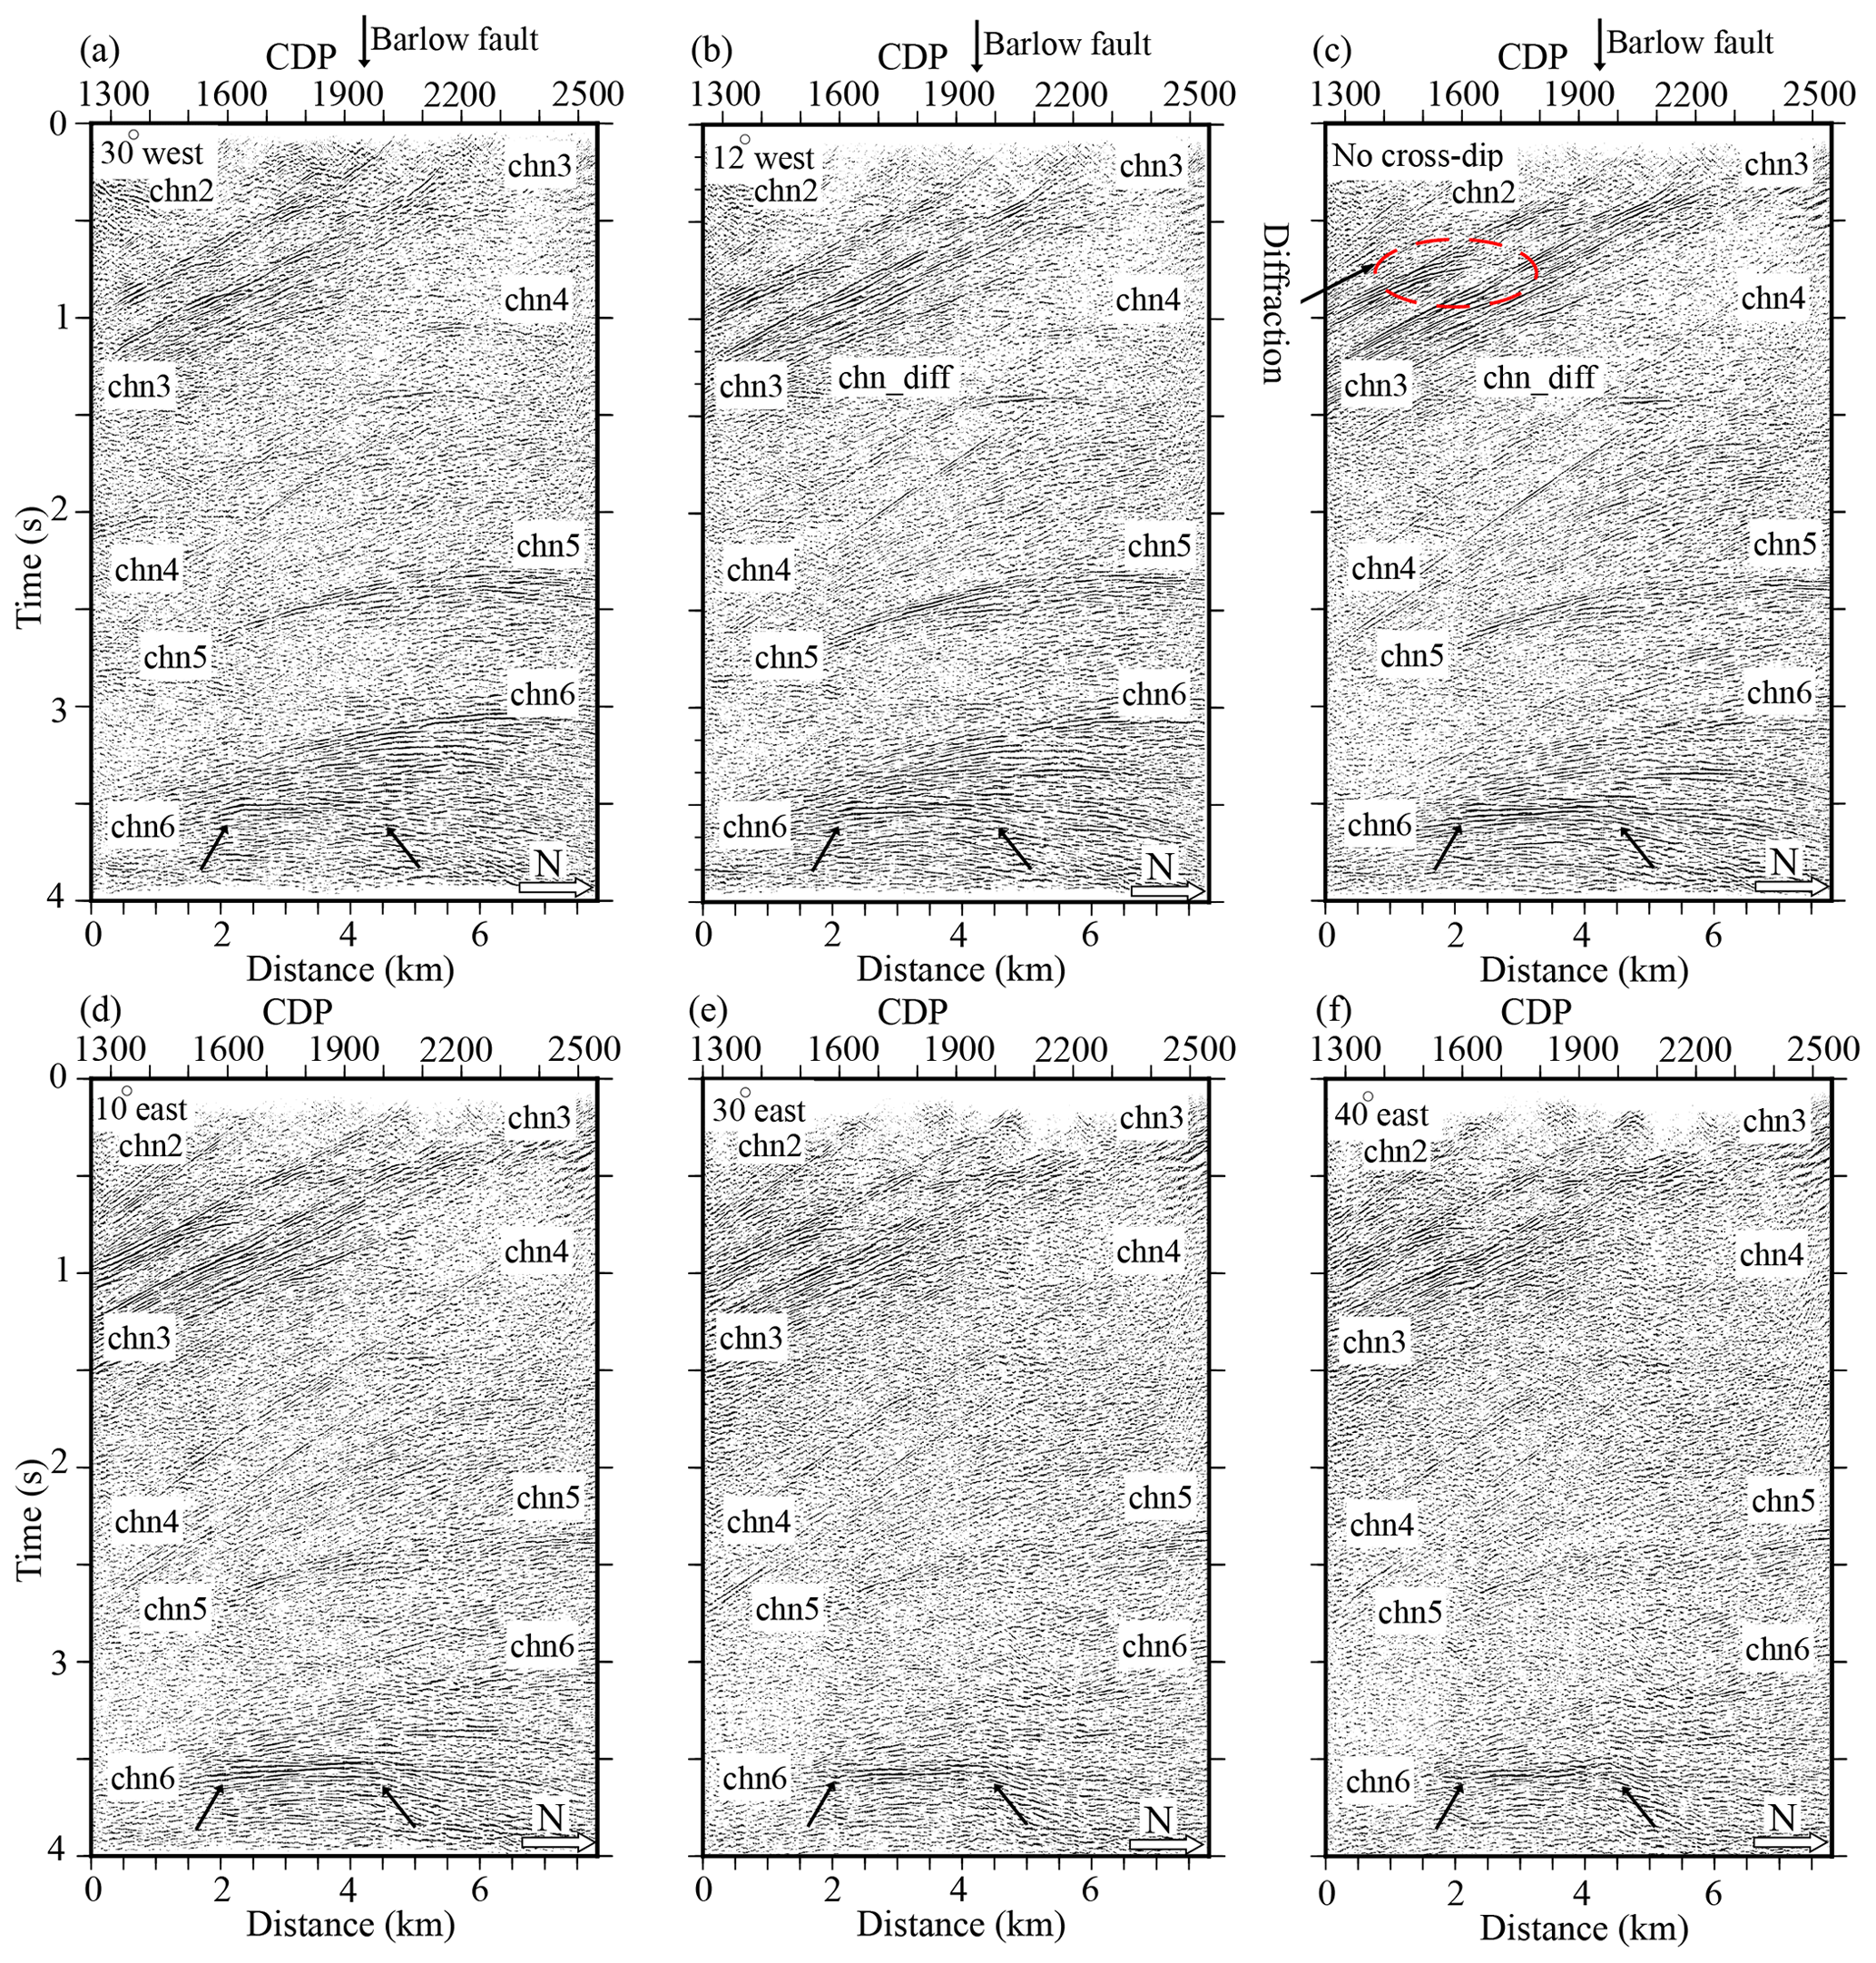
Figure 8CDMO analysis for the north survey along Sect. 3 (see Fig. 4 for the location of the section). (a) DMO-corrected stacked section with cross-dip element of 30∘ to the west applied. (b) DMO-corrected stacked section with cross-dip element of 12∘ to the west applied. (c) DMO-corrected stacked section with no cross-dip element applied. (d) DMO-corrected stacked section with cross-dip element of 10∘ to the east applied. (e) DMO-corrected stacked section with cross-dip element of 30∘ to the east applied. (f) DMO-corrected stacked section with cross-dip element of 40∘ to the east applied. See text for the interpretation of marked reflections and diffractions. The surface location of the Barlow fault is presented at the top of the section.
6.2.1 Seismic interpretation along the north profile
Migrated sections of the north profile (Fig. 5) show a general trend of south-dipping reflectors without any conflicting dips in the upper crust (depths less than 6 km). The contact of the Bruneau Formation (mafic volcanic rocks) with the Opémisca Group (sedimentary rocks) and Obatogamau Formation (mafic to intermediate volcanic rocks) is likely the major cause of the reflectivity in the upper crust (chn1, chn2, chn3, and probably chn4 in Fig. 5). The reflection chn4 lies within a seismically transparent zone and also separates the deeper subhorizontal reflections sets (chn5 and chn6, Fig. 5) from the upper-crust steeply dipping reflections. The thickening of the upper-crust rocks around the reflection set chn3 correlates with the Barlow fault and the regional Waconichi syncline cored by a successor (Opémisca) basin (Fig. 5) (Matthieu et al., 2020b).
Reflection chn1 (Fig. 5, Table 3) at CDP 1300 projects to the surface within the sandstones and conglomerates of the Opémisca Group and may correspond to internal structure such as an unconformity or small fault that is part of the Waconichi Tectonic Zone or lithological variations inside the Opémisca Group. Similar to reflection chn1, reflection chn2 (Fig. 5, Table 3) correlates with a local structure, i.e., a small fault or mafic and/or ultramafic lithology in outcrops of Opémisca Group rocks.

Figure 9CDMO analysis for a part of the south survey around the Guercheville fault. (see Fig. 4 for the location). (a) DMO-corrected stacked section with cross-dip element of 30∘ to the west applied. (b) DMO-corrected stacked section with cross-dip element of 12∘ to the west applied. (c) DMO-corrected stacked section with no cross-dip element applied. (d) DMO-corrected stacked section with cross-dip element of 10∘ to the east applied. (e) DMO-corrected stacked section with cross-dip element of 30∘ to the east applied. (f) DMO-corrected stacked section with cross-dip element of 40∘ to the east applied. The surface location of the Guercheville fault is shown at the top of the section. See text for the interpretation of marked reflections.
Reflection package chn3 occupies 3 km of the seismic section (Fig. 5 and Table 3) and helps to interpret both the Barlow fault and geological contacts in the north of the Chibougamau area (Figs. 1 and 5). At CDP 1950, reflections within chn3 (see Table 3 for geometric attributes) correlate to the contact between sedimentary rocks of the Opémisca Group and mafic lava flows of the Bruneau Formation. This contact is overprinted by the Barlow fault at the surface (Sawyer and Ben, 1993), and the migrated images (Fig. 5a, b) suggest that the fault dips at 30∘ to the south (Table 3; see also Bedeaux et al., 2020). The Barlow fault zone strikes east–west, and the northern seismic profile makes an angle of ∼ 130∘ where it crosses the fault zone (Fig. 1). This would suggest that the true dip of the fault zone is steeper than the apparent dip imaged in the migrated section (i.e., greater than 30∘; Fig. 5a, b). Reflections within chn3 also correlate with the contact of the Bruneau Formation (mafic rocks) and Obatogamau Formation (mafic to intermediate lava flows) at CDP 2400. We previously noted that the reflection package chn3 forms the most coherent package along the north survey in the upper crust. The CDMO analysis around reflections chn3 (Fig. 8) would suggest a 0–10∘ strike towards the east (Fig. 8c and d, Table 3). Furthermore, these reflections became weakly imaged assuming a CDMO towards the west (Fig. 8a, b) or toward the east at dips greater than 10∘ (Fig. 8e, f). Thus reflection set chn3 most likely originates within a complex structure, off the plane of the north profile. It is possible that the Cummings sills located east of the northern profile and near the Barlow fault contribute to the structures imaged as reflection package chn3. Finally, the CDMO analysis also indicates an eastward apparent dip for other upper-crustal reflection packages of the north profile (chn1 and chn2, Table 3). The seismic images shown in Figs. 5 and 8 suggest that the Barlow fault forms part of a steeply dipping structure (dip > 30∘) that dips slightly towards the east.
Unless the north profile was extended beyond CDP 2600 (Figs. 1 and 5), we cannot be sure that the reflection set chn4 correlates to surface geology. The regional survey in the Chibougamau area (Mathieu et al., 2020b) does not show any surface correlation to these reflections at depth. The CDMO analysis did not show any prominent cross-dip elements for this reflection (Table 3). We noted that reflection chn4 could be associated with the southern structure of the Barlow pluton. Deeper reflection packages (greater than 6 km) do not correlate to surface geology; subhorizontal reflections chn5 and chn6, at depths of 7–12 km, have no clear geological interpretation. These reflections show westward cross-dip elements (Table 3). Mathieu et al. (2020b) suggested that reflectors at those depths in northern Chibougamau represent imbrication between the Opatica plutonic belt and the Abitibi greenstone belt.
The DMO stacked section of the north survey and CDMO analysis also provided insights into the diffractions within the upper crust. Diffractions could be generated from spherical or elliptical (ore) bodies within fault zone structures, and they are potentially relevant to mineral exploration (Malehmir et al., 2010; Cheraghi et al., 2013; Bellefleur et al., 2019). Our analysis suggests the utility of considering DMO stacked sections with cross dips to image diffractions better. The imaged diffraction enhances our understanding of chn3 and its interest for exploring for massive sulfide deposits.
CDMO analysis revealed a more coherent image of the diffraction chn_diff assuming a cross dip of 12∘ to the west (Fig. 8b and Table 3). The diffraction chn_diff shows a larger width (∼ 2 km in the plane of the DMO stacked section) compared to the diffraction within reflection package of chn3 (Fig. 8c). The shallower diffraction appears clearer with no cross-dip element (dashed area in Fig. 8c) and thus seems to be located in the plane of the seismic profile with no lateral dip. It is not imaged in the migrated section (Fig. 5a) mainly because its low amplitude did not survive a migration that collapsed diffraction energy.
In order to scrutinize the diffraction imaging capability, we compare an enlarged section of the upper crust of the Chibougamau north survey (shallower than 1.5 s) with no cross dip applied (Fig. 8c) with a section with cross dip 12∘ to the west applied (Fig. 8b) in Figs. 10 and 11, respectively. Figure 10a clearly shows the diffraction tail imaged within reflection package chn3 at CDP 1600 (marked with red dashed ellipse).
A zoomed view of the diffraction chn_diff in a section with a cross-dip element of 12∘ to the west is shown in Fig. 11. Similar to the analysis shown in Fig. 10, we visually checked the shot gathers around CDP locations where chn_diff was imaged (CDPs 1900–2200). Shot gather 2730 (Fig. 4a for location) is shown as an example. This shot gather imaged a package of reflections interpreted as chn3 and also diffracted events at approximately 1.5 s in CDP locations where chn_diff was expected to be imaged (see CDP 2088 marked as the apex of the diffraction in Fig. 11b).
Diffractions are easy to miss and require a focused visual inspection of DMO stacked sections and shot gathers (Malehmir et al., 2010; Cheraghi et al., 2013). The analysis of DMO/CDMO stacked images shown in Figs. 5 and 8 helped to image both out-of-plane and planar diffractions (Fig. 8b, c, respectively) near the Barlow fault. In particular, the CDMO stack image enhanced the illumination of diffraction chn_diff (Fig. 8b). These diffractions can be considered a target of more detailed exploration.
6.2.2 Seismic interpretation along the south profile
The south profile shows more complexity in the upper crust where both north- and south-dipping reflections are imaged (Fig. 6). It seems that the lithological contact of the Obatogamau Formation (intermediate to mafic rocks) and the Caopatina Formation (sedimentary rocks) is the main cause of the reflectivity along the south profile in the upper crust (Fig. 6). The volcanic–sedimentary reflection packages in the upper crust (chs1, chs2, and chs3) and deeper reflection packages (chs4, chs5, chs6) depict a synform structure along the south profile. The geometry of this structure includes the south-dipping reflection in the north of the profile and north-dipping reflection in the south (Fig. 6). Similar to the north profile (Fig. 5), the upper-crustal rocks around the reflection sets chs1, chs2, chs3, and chs4 (Fig. 6) are approximately 6 km thick.
Reflection chs1 (Fig. 6, Table 3) at CDP 1700 likely correlates with the contact between pelitic to siliciclastic sedimentary rocks of the basin-restricted Caopatina Formation and mafic to intermediate lava flows of the Obatogamau Formation.
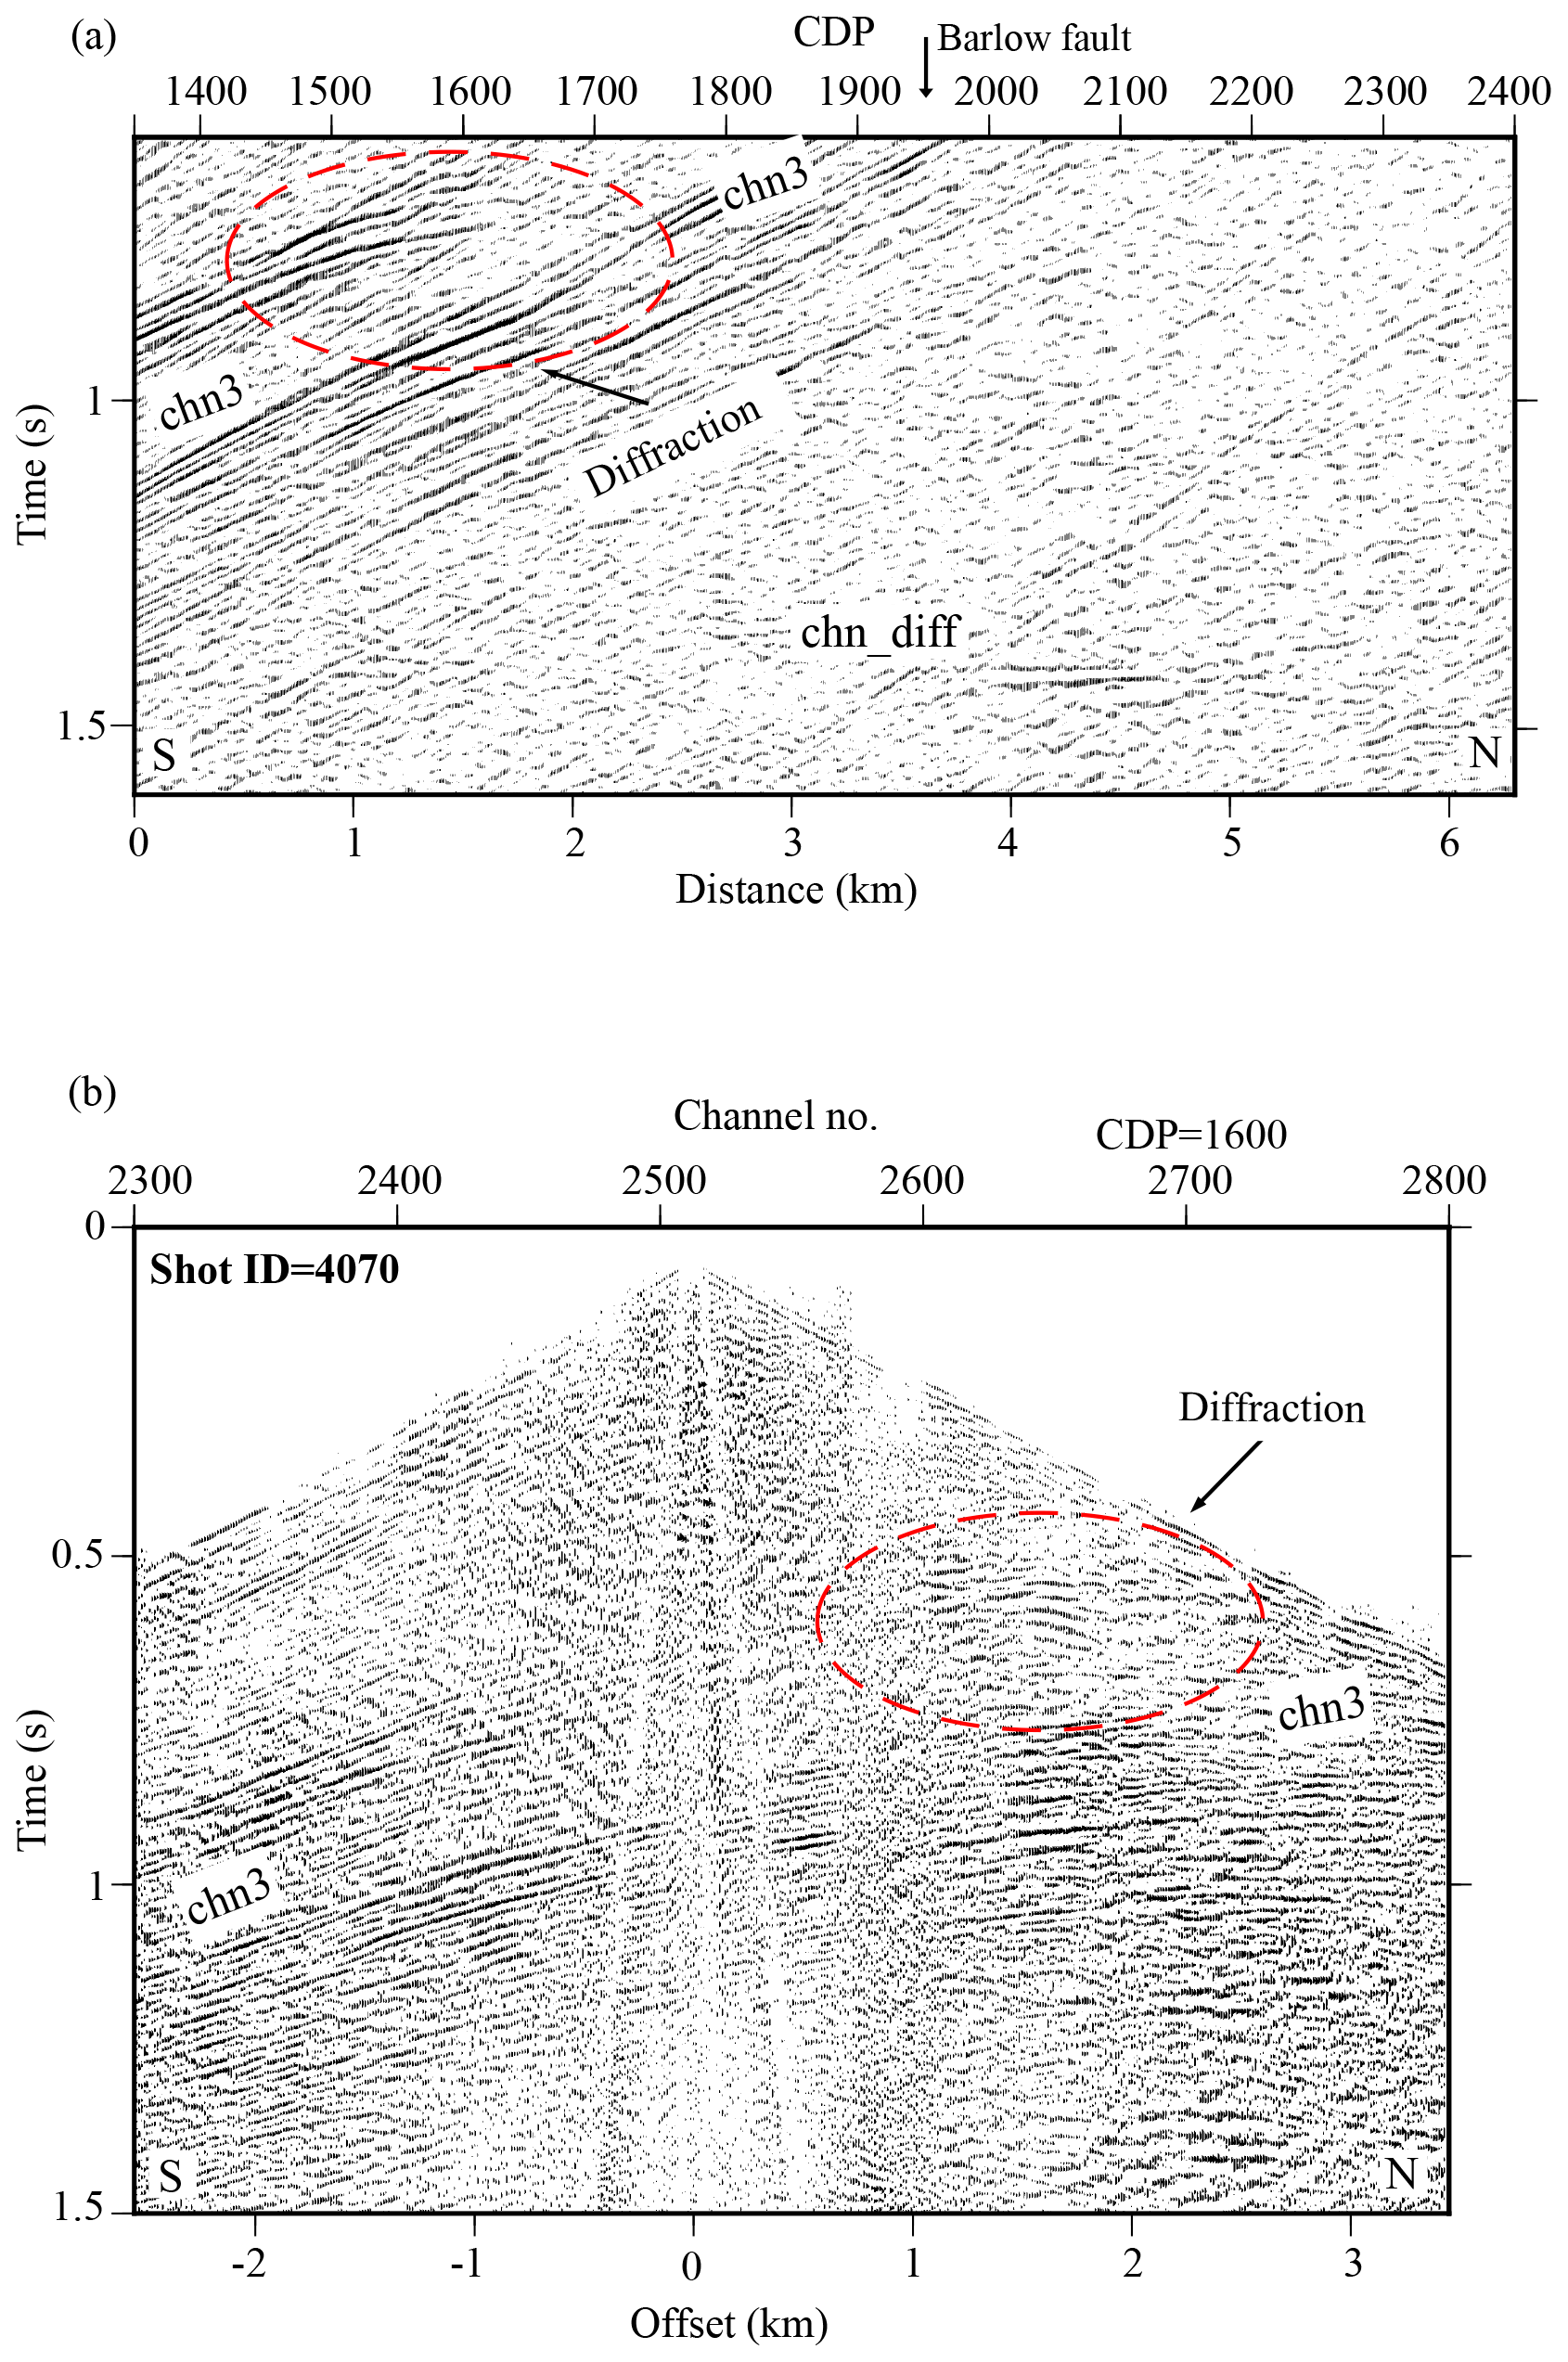
Figure 10(a) A zoomed view from Fig. 8c (DMO stacked section with no cross-dip element applied) around the diffraction imaged. (b) Shot 4070 (see Fig. 4 for the location) acquired for the north survey, which shows the signal from the diffraction around CDP 1600 in (a). The location of CDP 1600 is shown in (b). See text for interpretation.
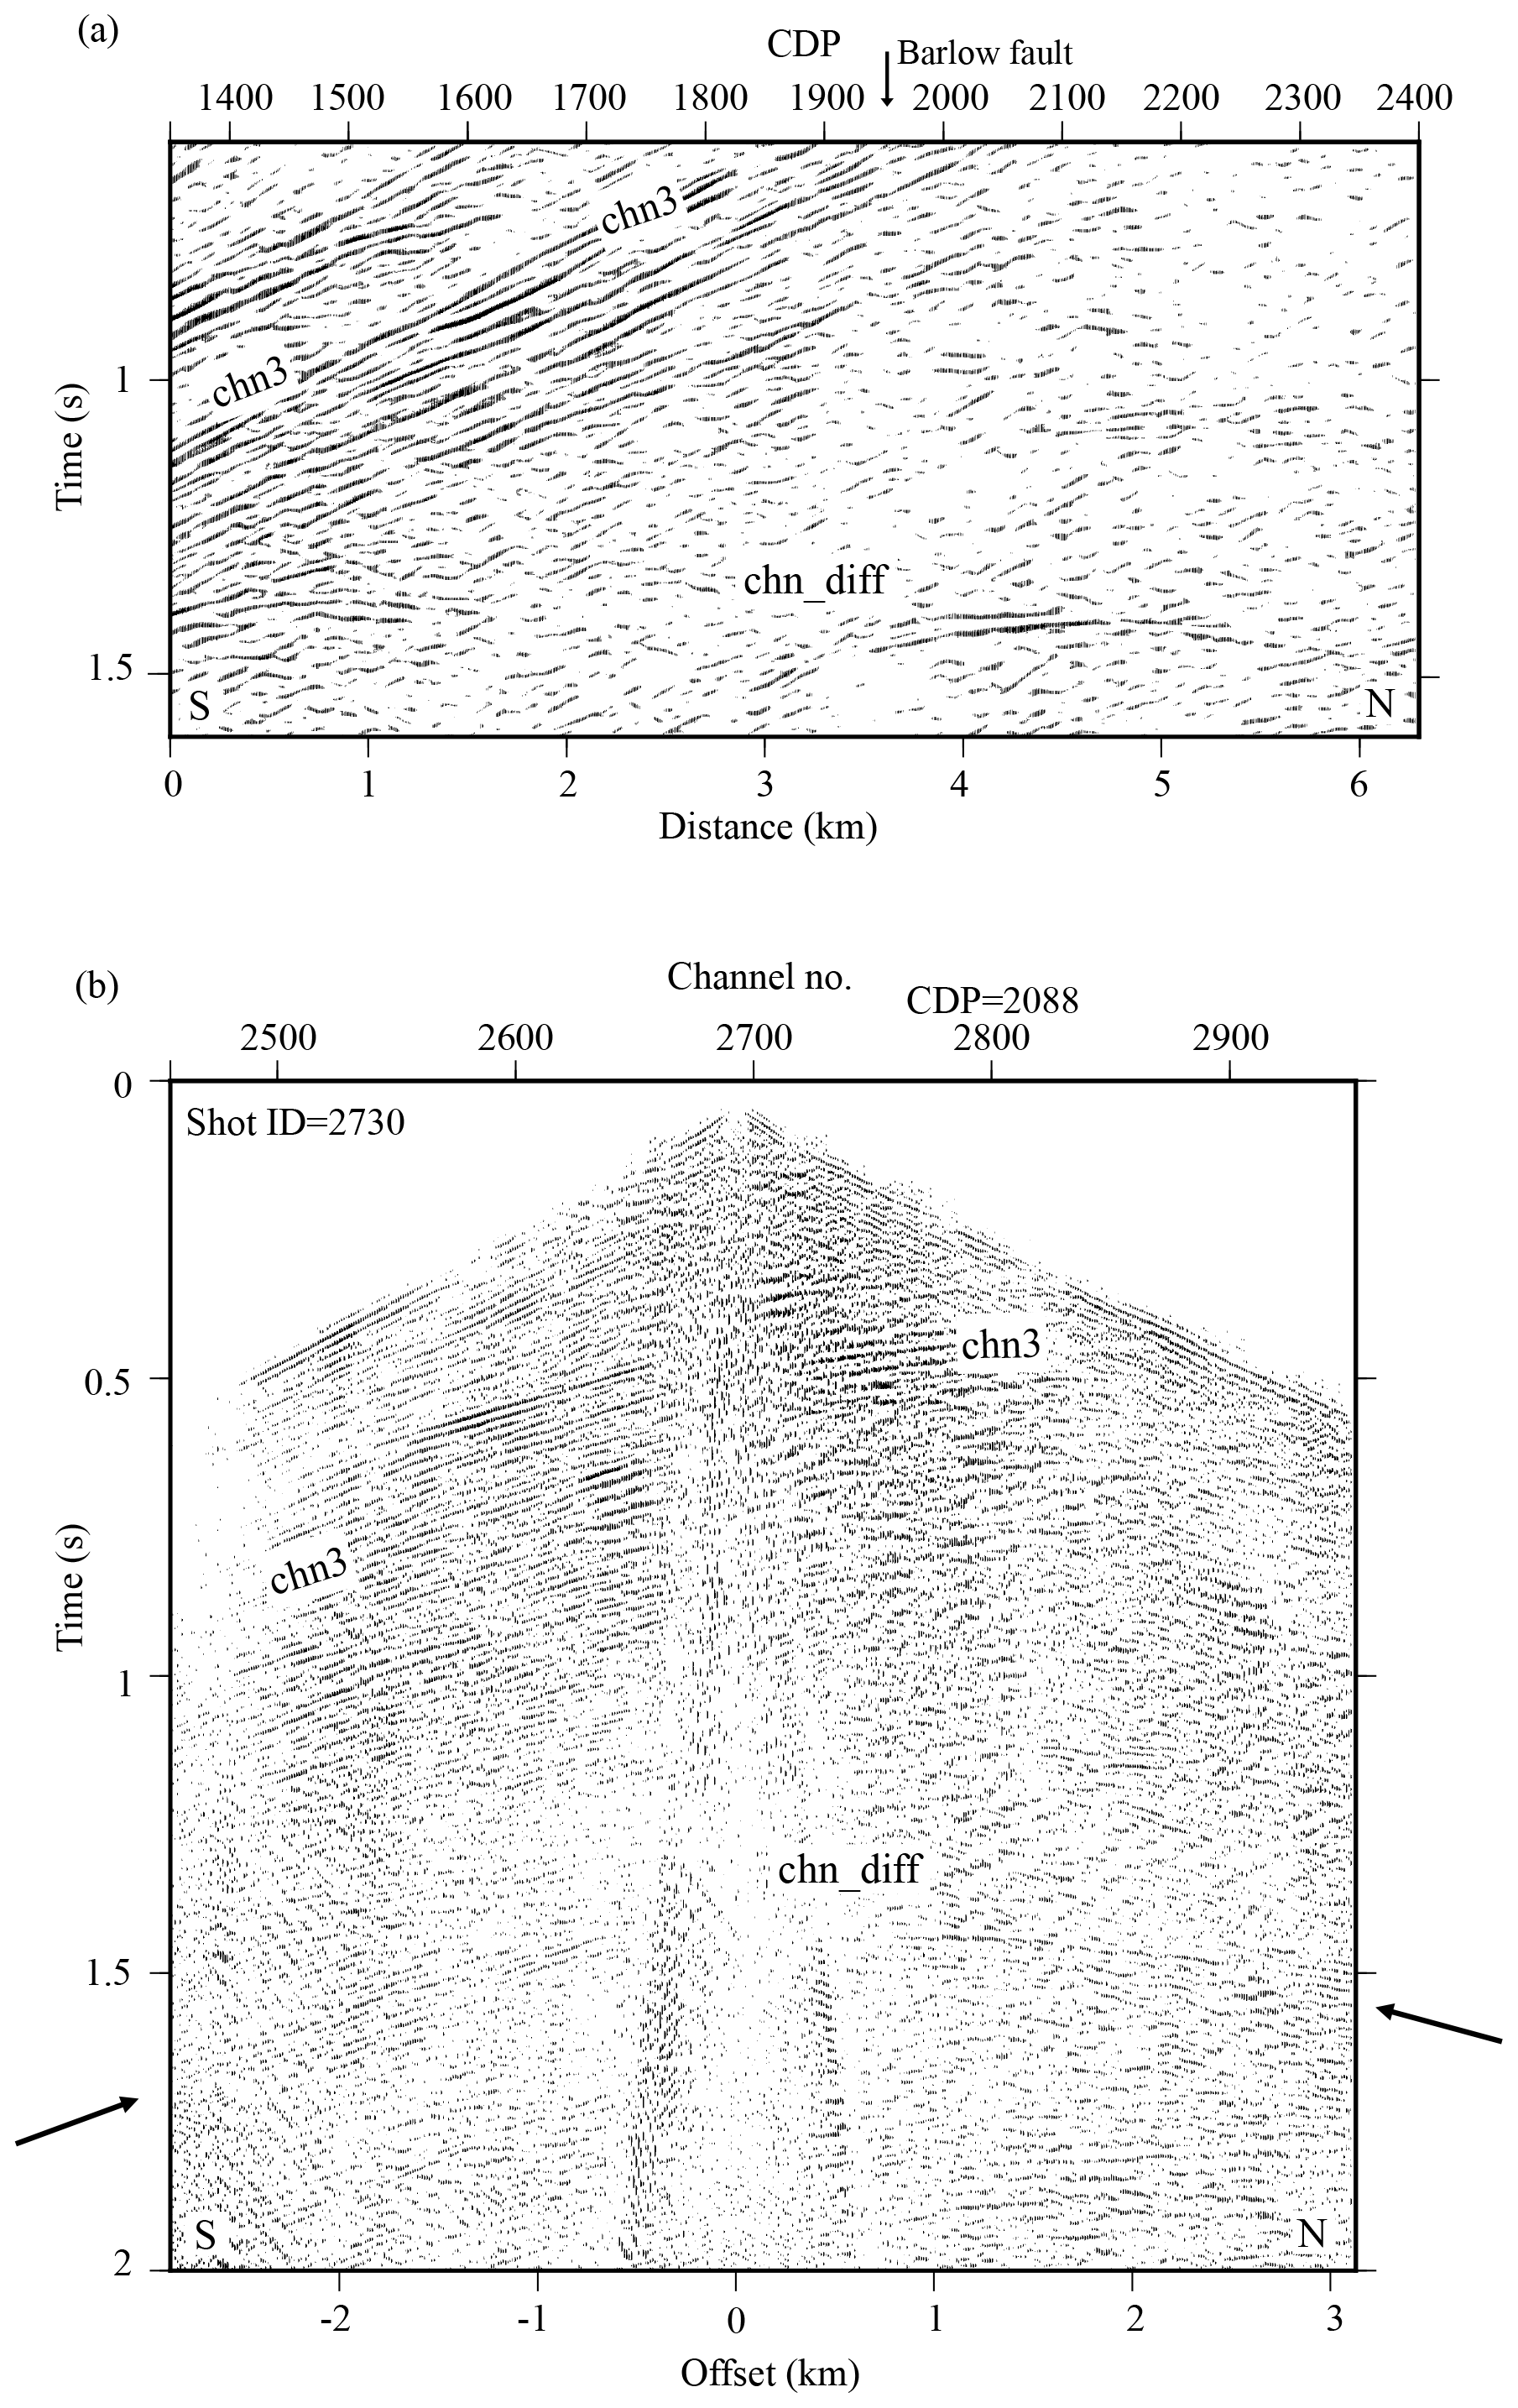
Figure 11(a) A zoomed view from Fig. 8b (DMO stacked section with cross-dip element 12∘ to the west applied) around the diffraction chn_diff. (b) Shot 2730 (see Fig. 4 for the location) acquired for the north survey, which shows the signal from the diffraction chn_diff; the apex of chn_diff is imaged around CDP 2088 in (a). The location of CDP 2088 is shown in (b). See text for interpretation.
Reflection sequence chs2 (Fig. 6, Table 3) also correlates with the contact between the Obatogamau (sedimentary rock) and Caopatina formations (mafic rocks) but includes two packages of reflectivity including a set of steeply dipping reflections and another set of subhorizontal reflections (Fig. 6). The surface geology associated with the subhorizontal set of chs2 contains mafic rocks of the Obatogamau Formation. The surface location of the Guercheville fault is marked at CDP 2400; thus the reflection set of chs2 could be associated with this fault. The Guercheville fault is described as subvertical (Daigneault, 1996). The reflection chs2 has a 40∘ dip to the south in the migrated section (Fig. 6 and Table 3), which is much less than the reported field measurements. Further knowledge about the geometry of reflection chs2, if associated with the Guercheville fault, would help to better understand the subsurface architecture and its relationship to gold deposits along strike to the east.
CDMO analysis along the south survey (Fig. 9) suggested dips for reflection chs2 varying between 20–50∘ depending on different CDMO correction values. To evaluate CDMO results around chs2, shot gather 15 135 is considered. Figure 12 shows shot gather 15 135 from the south survey (see Fig. 4d for location) that was acquired near CDP 2220 where chs2 turns from a steeply dipping reflector into a subhorizontal reflector (see Figs. 6 and 9). The chs2 reflection in this shot gather shows both subhorizontal and steeply dipping parts at approximately 1 s (see the dashed line in Fig. 12, which separates those parts). The steeply dipping part of chs2 in Fig. 12 has an associated high apparent velocity (∼ 8000 ms−1), required so that a reflector dipping ∼ 40–50∘ constructively stacks; this appears consistent with Fig. 9c (no cross dip applied) and sections with a cross-dip element to the east (Fig. 9d, e, f). These reflections are also imaged with westward CDMO (Fig. 9a, b). This uncertainty would suggest greater complexity of the Guercheville fault off the plane of the south profile. The angle between the southern profile and the strike of the Guercheville fault where the profile crosses the fault is ∼ 40∘. This means that the true dip of the fault is higher than the apparent dips imaged with reflection chs2 in Fig. 9, i.e., greater than 50∘. Both scenarios including the cross-dip element to the east or west could therefore be valid. It appears that the structure associated with the reflection chs2, the Guercheville fault, is a steeply dipping structure and shows an asymmetric anticline structure with its eastern flank steeper than its western flank, i.e., the cross dip of 40∘ to the east in Fig. 9f vs. 12∘ to the west in Fig. 9b. Using either cross dip coherently images reflection chs2 with an apparent dip of 50∘ along the profile.
Similar to reflection sets chs1 and chs2, the reflection set chs3 (Fig. 6, Table 3) correlates with the contact between the Obatogamau and Caopatina formations at CDP 500. Unlike the reflection sets chs1 and chs2, the chs3 set dips to the north (30∘, Table 3) and represents the deepest reflector associated with the contact of the Obatogamau and Caopatina formations along the south survey (Table 3). The CDMO analysis implies that the north-dipping reflector chs3 shows more coherency with westward strike (12 and 30∘ – Fig. 9b and a, respectively). The reflector chs3 is less coherent at depths shallower than 2 km. This may suggest a steeper dip that CDMO was not able to image.
Reflection chs4 (Fig. 6, Table3), located at depths of 2–5 km, dips towards the north with a westward cross-dip element. Because the seismic profile lies oblique to the strike of the mapped geological structures (Fig. 1), the true dip of this reflection is greater than 30∘ (Table 3). Reflection chs4 likely images structures off the seismic profile in the south (Fig. 1). This reflection set probably lies within mafic rocks of the Obatogamau or Waconichi formations; therefore, it most likely originates at more felsic interlayers, chert and iron formations, sulfide (VMS) accumulations, or faults within the mafic rocks. Reflection chs4 could alternatively be associated with structures from the northern border of the Lac Surprise Pluton (Fig. 1). If interpreted as a fault, reflection chs4 most likely correlates to the Doda fault. The Doda fault is measured as subvertical at surface (Daigneault, 1996). Reflection chs4 may image the extension of this fault at depths greater than 2 km.
At depths of 6–9 km, two packages of dipping reflections, chs5 to the north and chs6 to the south (Fig. 6, Table 3), suggest a syncline structure. These reflectors may correspond to the proposed basal contact of greenstones with underlying tonalite–trondhjemite–granodiorite (TTG) or tonalite–trondhjemite–diorite (TTD) intrusive rocks (Mathieu et al., 2020a). Alternatively, the reflectors may lie within these intrusive rocks as represented by outcrops of the Hébert pluton to the south of the profile (Mathieu et al., 2020b). At shallower depths, reflection sets chs3 and chs4 (north-dipping, Fig. 6, and Table 3) and chs2 (south-dipping, Fig. 6, Table 3) appear consistent with a regional syncline, perhaps the Druillettes syncline (Mathieu et al., 2020a).
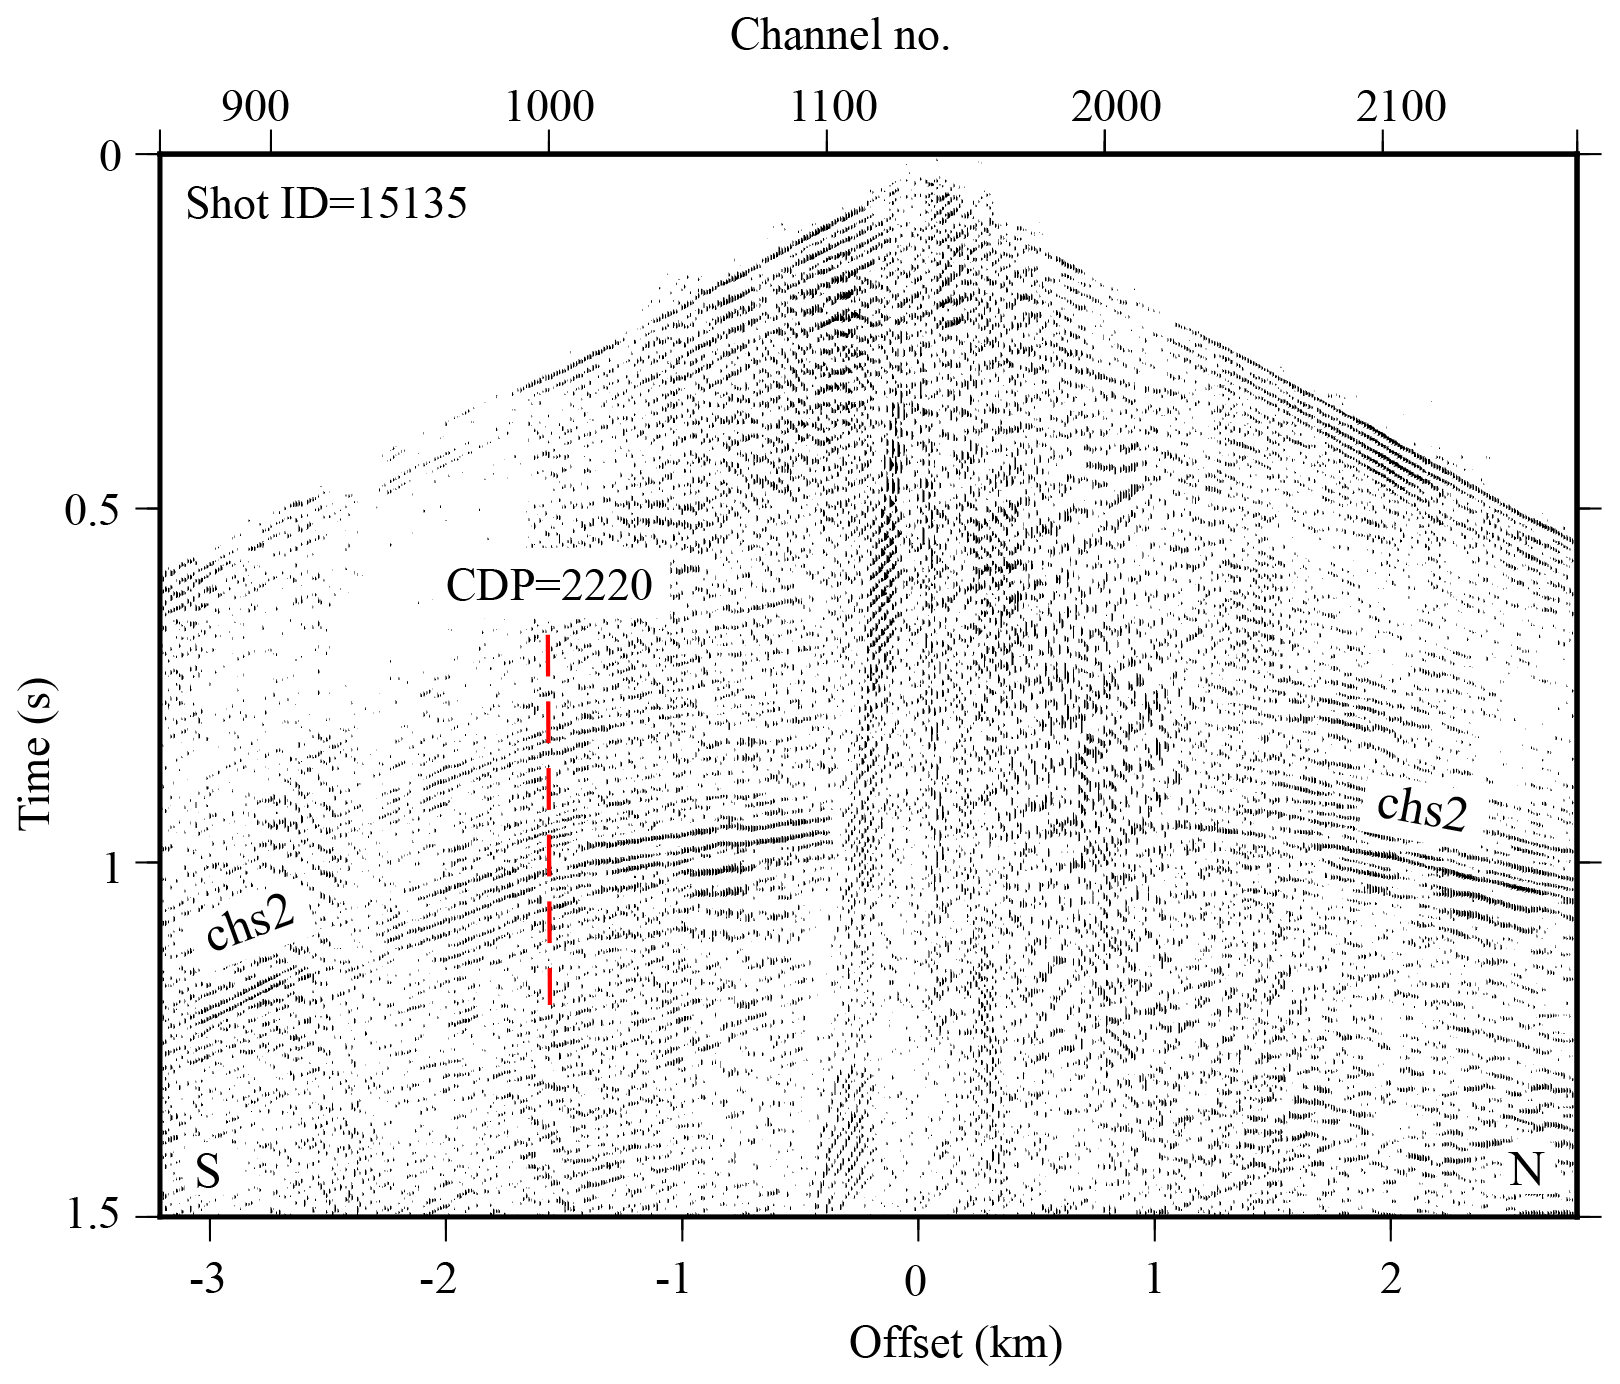
Figure 12Shot gather 15 135 acquired for the south survey (see Fig. 4 for the location). A package of reflections interpreted as chs2 in Fig. 6 is imaged in this shot. The location of CDP 2220 is marked (see Figs. 6 and 9 for the location) and is marked on the shot. This CDP location shows separation of subhorizontal and steeply dipping part of chs2. See text for interpretation.
6.3 Potential for the exploration of orogenic gold
The Barlow fault and the associated diffractions in the north (reflection package chn3, Fig. 5) and in the south, the joint compound structure of the Guercheville fault (reflection package chs2, Fig. 6), and the Doda fault (reflection package chs4, Fig. 6) all lie within the greenstone belt rocks of the upper crust (Mathieu et al., 2020a). Both surveys show deep reflectors, reflections chn5 and chn6 along the north profile and reflections chs5 and chs6 along the south profile, that appear related to regional synclines. Fault zones within Abitibi greenstone rocks are recognized to host the orogenic gold deposits, for example, the Cadillac–Larder Lake fault zone (Robert et al., 2005). One major attribute of the orogenic gold systems is their association with steeply dipping (at least in the upper crust) crustal-scale faults (e.g., Cadillac–Larder Lake fault). Although the faults in the Chibougamau area discussed here are mapped regionally over tens of kilometers (Fig. 1), at depth they dip shallowly (e.g., chn3 in Fig. 5) and do not extend deep within the crust. Thus, these are not faults typically thought to promote Au mineralization. Bedeaux et al. (2020) inclusively studied the kinematics and metamorphism of the Barlow fault zone in comparison with the Cadillac–Larder Lake fault zone. They explained that an absence of second-order structures connected to the Barlow fault and an insufficient thickness of deep marine sedimentary rocks prevents ponding of deep metamorphic fluids necessary to produce orogenic gold deposits. Few gold deposits are reported in the Barlow fault zone area (Lafrance, 2018). Nevertheless, the three faults imaged and discussed here and the diffractions imaged around the Barlow fault zone could potentially be targeted for more detailed exploration as representing small orebody lenses.
Analysis of high-resolution seismic profiles in the Chibougamau area revealed the crucial role of survey geometry on seismic illumination. Seismic data processing steps such as DMO corrections and PSTM proved to be highly dependent on a regular offset distribution of CMPs in CDP bins for their effectiveness and further dependent on an optimized offset range that provides better illumination in the presence of a complex subsurface architecture. The regular distribution of CMPs directly affects the performance of DMO and PSTM algorithms. A detailed velocity model also increases the seismic illumination and improves the performance when a DMO or PSTM algorithm is utilized. The key step in our study for optimized DMO and PSTM processing is the investigation of offset distribution in order to choose an offset range in which most of the CDP bins show regular distribution and thus contribute better to each process. We specifically investigated this for two high-resolution seismic surveys with offsets in a range of 0–9 km, and the analysis indicated that an offset range of 0–3 km provides more regular sampling. Further investigation performed on the common-offset DMO correction process and common-offset PSTM for the entire available offset range of 0–9 km (at a step rate of 3 km) indicated that both profiles showed their best results for the offset range of 0–3 km. This offset range, along with a detailed velocity model, also provides the better illumination for DMO and PSTM.
The subsurface architecture in the Chibougamau area has complex structure within its fault systems, these fault systems potentially correspond to metal (gold) endowment and thus provide a major motivation for the survey and the processing trials. The comprehensive processing work flow applied in this study improved the imaging of several major faults in the area. The crooked nature of the surveys encouraged performing CDMO analysis to take into account the effect of out-of-plane structures. The seismic imaging revealed the general trend of south-dipping structures including the Barlow fault along the north survey to depths of 5 km. The CDMO–DMO stacked sections imaged some diffractions along the north profile within the reflection package associated with the Barlow fault. The seismic image also shows the thickening of the supracrustal sequence of rocks beneath the Barlow fault within the regional Wachonachi syncline. The seismic imaging along the south profile implies a moderate thickening of the supracrustal sequence and metasedimentary rocks between reflections associated with the Guercheville and Doda faults in the form of a regional synform. The Guercheville fault relates to south-dipping reflectors on the north limb of the mapped regional Druillettes syncline and numerous gold showings along its strike. The DMO–CDMO results indicate a local anticlinal fault geometry. The south profile did not cross the Doda fault directly but did image several structures which project upward to known faults and lithological contacts in the southern Chibougamau area. This work contributes important constraints on the geometry and depth extent of these structures. The seismic imaging implies that the Doda fault forms a steeply north-dipping reflector at depths greater than 2 km.
For a 3D survey, equal azimuthal distribution, typically contributed by inline and crossline components, satisfies the symmetric sampling (Vermeer, 1990, 1998 and 2010). In the case of a 2D survey, reciprocity of shot and/or receiver gathers suggests that properties of the continuous wave field in a common shot or VP gather are the same as the properties of a common receiver gather. Sampling requirements are the same for both domains and results in symmetric sampling. The immediate requirement of the 2D symmetric sampling is that the continuous wave field should be alias-free for ground roll and low-velocity noise (Vermeer, 2010). To satisfy an alias-free, continuous wave field sampling, the basic sampling interval (Δx) is defined as Eq. (A1) (Vermeer, 2010):
where Vmin is the minimum apparent velocity and fmax is the maximum frequency of data. The VP and receiver spacing for high-resolution surveys in the Chibougamau area is 6.25 and 12.5 m, respectively (Table 1). For a representative shot gather (receiver spacing of 12.5 m) and an estimated maximum frequency range of 60–120 Hz, the minimum apparent velocity would be 1500–3000 ms−1, and for a receiver gather with shot spacing of 6.25 m the minimum apparent velocity would be 750–1500 ms−1. These calculated apparent velocities indicate that the Chibougamau profiles are alias-free regarding shear waves and ground roll.
The basic signal sampling interval (d) required to acquire a desired part of the continuous wave field, (i.e., P-wave energy) alias-free can be defined with Eq. (A1), and Vmin is the minimum apparent velocity in the signal part, e.g., 5000–5500 ms−1 for a typical crystalline rock environment. Assuming these velocities, the receiver and VP spacing in Chibougamau profiles are much smaller than the basic requirement and the acquired signal is alias-free for P-wave energy. The benefit of acquiring alias-free signal for receiver and/or VP gathers is that those gathers act as an anti-alias filter for remaining low-velocity noise (e.g., 300–1500 ms−1 in Chibougamau profiles).
Acquiring a seismic survey on the planned shot and receiver locations is not always practical due to natural obstacles or economic considerations. Gaps result in missed shots or receivers and sparse CMP distribution for some locations or acquiring extra shots in other places with a resulting coarse CMP coverage. The crooked geometry exacerbates the effect of improper CMP distribution. The irregularity of a survey is defined as sparse CMP distribution in some parts of the survey and overabundance of CMPs in other parts (Beasley and Klotz, 1992). Some of the essential multichannel processing steps, and especially wave equation processes such as Kirchhoff PSTM and/or DMO corrections, assume that shots and receivers were acquired in nominal places and that a continuous CMP coverage (regular geometry) was fulfilled. The irregular geometry may lead to artifacts or footprints for PSTM and DMO process (Canning and Gardner, 1998; Schuster and Liu, 2001). The effects of those artifacts on Kirchhoff PSTM algorithms and DMO corrections can be defined basically as a concept of an integral summation (Canning and Gardner, 1998):
S and R represent shot and receiver coordinates, respectively; is a diffraction point (p) and τ is travel time along the diffraction surface generated by (p). When common-offset gathers are considered for PSTM algorithms or DMO corrections, dSdR will be the CMP coordinate, i.e., dxmdym where xm and ym are CMP coordinates and offset planes are shown by w. For a regular geometry offset increments are constant, and thus we can assume that dxmdym is constant and the offset planes (w) including short and long offsets contribute equally in Eq. (A2). In a case of irregular geometry, CMP locations (i.e., dxmdym) and w (i.e., offset planes) will contribute irregularly in Eq. (A2). For a Kirchhoff-style PSTM, if CMPs are irregularly distributed (per their offsets), the migrated traces would destructively contribute in the stacking process and the resulting seismic image will be blurred (Yilmaz, 2001). For DMO corrections, an imaging point represents a contribution of CMPs for both short and long offsets in the DMO formula (Deregowski, 1982). If some of the offsets are missing around the imaging point, the DMO process generates artifacts (Vermeer, 2012), generally in the form of subhorizontal features that disguise the seismic image (Cheraghi et al., 2012).
To further investigate the effect of the regular offset plane for DMO corrections, we generated an example of common-offset DMO corrections, which is shown in Fig. A1 based on the seismic-wave velocities typically observed in crystalline rock environments. The graph has been provided from a DMO formula (Hale, 1991) considering the common-offset method (Fowler, 1998). This graph implies that the missing offsets (i.e., irregularity) hinder the DMO correction process; i.e., the curve will be discrete.
The abovementioned irregularity of the wave equation processes and its effect has been subject of many studies (e.g., Williams and Marcoux, 1989; Ronen, et al., 1995;). The less studied subject is the CMP contribution to the subsurface illumination of those processes (e.g., DMO fold, Vermeer, 1994; Ferber, 1997). The conventional CMP stacking fold is defined based on the total number of traces sharing a reflector point on a flat surface. All these traces contribute to the subsurface illumination (Beasley and Klotz, 1992; Beasley, 1993; Ferber, 1997). The standard CMP stacking can also be applied to single-dip reflectors if dip-dependent velocity (i.e., apparent velocity) is considered (Jakubowicz, 1990). Cases of lateral velocity changes, diffractions, and conflicting dips require more advanced processes. Pre-stack depth migration provides an efficient solution for apparent velocity cases, whereas the other cases need DMO or PSTM to be applied (Jakubowicz, 1990). For a particular reflector with an arbitrary dip and strike the DMO fold (or DMO illumination) is considered to be those traces that contribute to the process constructively (Ferber, 1997). For a given source and receiver location, constructive DMO illumination takes place if the difference between DMO- and NMO-corrected travel-time reflection and zero-offset travel-time reflector is less than half of the dominant wavelength (Ferber, 1997). In the best-case scenario, DMO fold is equal to CMP stacking fold (Vermeer, 2010). The DMO illumination can be investigated during survey design with numerical modeling of seismic response where different scenarios are considered for subsurface architecture (Beasley, 1993). For the acquired geometry, the regularity of CMPs is the most crucial factor which defines the optimized performance of any wave equation process (DMO and PSTM, Canning and Gardner, 1998).
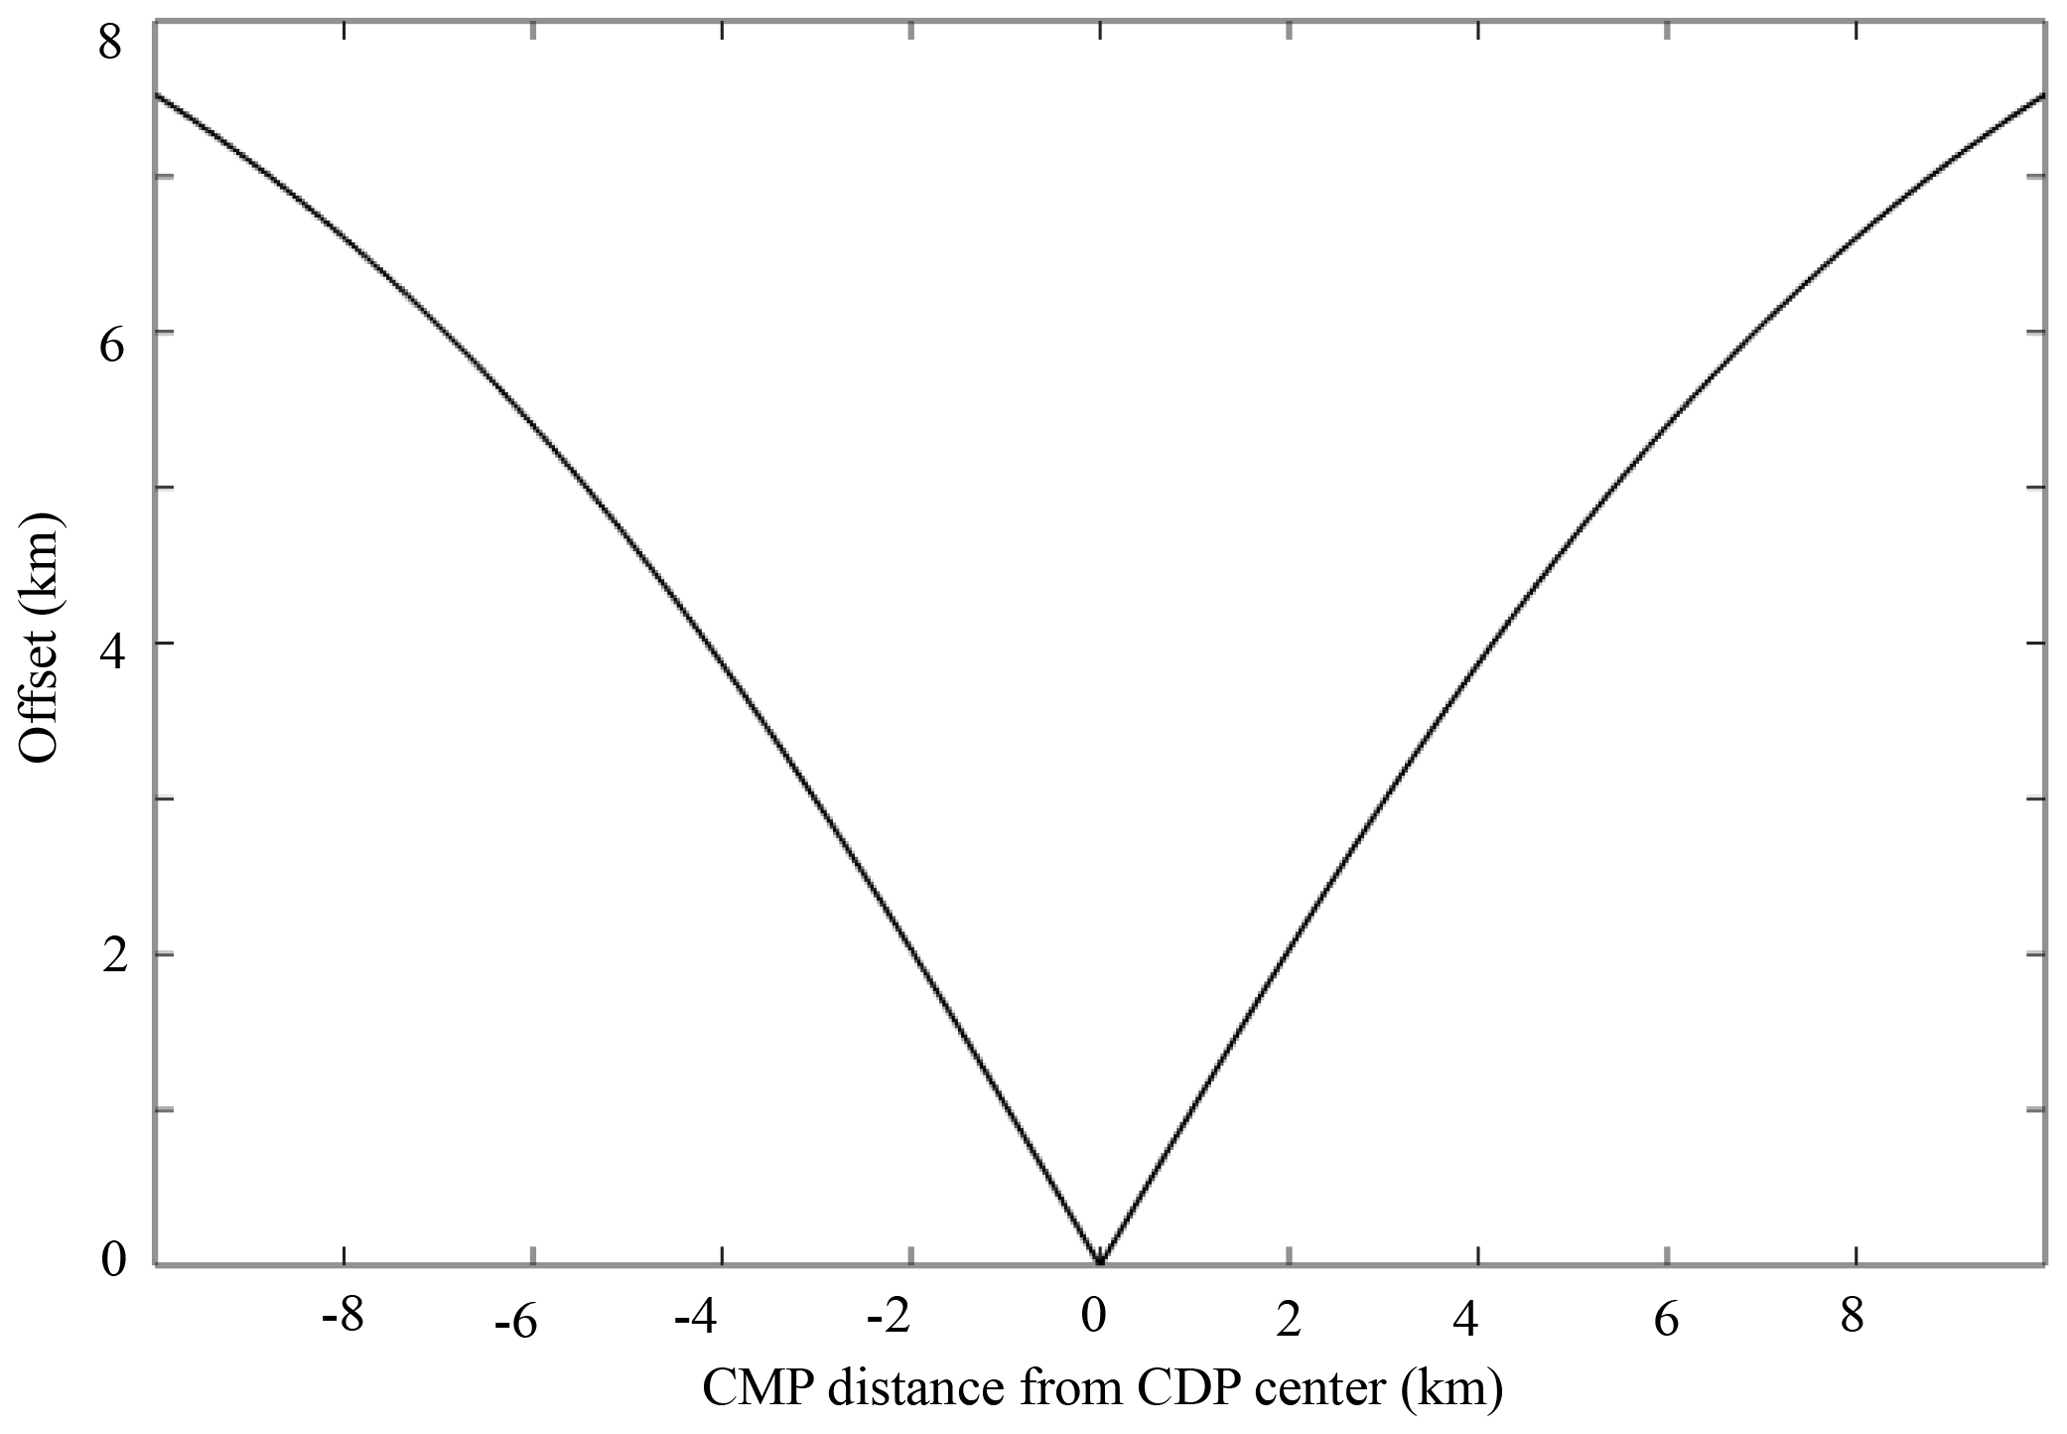
Figure A1The regular offset distribution in a CDP bin for DMO corrections calculated from a DMO formula (see Hale, 1991; Fowler, 1998). The offset range is considered to be 0–8 km; the average velocity is considered to be 5500 ms−1 in order to be representative of crystalline rocks. The recording length is 4 s with a sampling rate of 2 ms (similar to Chibougamau high-resolution seismic surveys, see Table 1). Target depth is located at 1 s.
The data that support the findings of this study are available from the Metal Earth project. Restrictions apply to the availability of these data, which were used under license for this study. The data are available from the authors with the permission of the Metal Earth project. For more information about the Chibougamau Transect please visit https://merc.laurentian.ca/research/activities/transectChibougamau (last access: 28 April 2021). To ask about the data repository, contact Metal Earth GIS and Database Management Team at me_gis@laurentian.ca.
SC processed seismic data, prepared the methodology, wrote the original draft, and constructed all the figures. AM contributed to seismic data processing and writing the original draft. SC, AM, MN, DS, LM, and PB contributed to interpretation, writing, and editing. DS designed the seismic survey.
The authors declare that they have no conflict of interest.
This article is part of the special issue “State of the art in mineral exploration”. It is a result of the EGU General Assembly 2020, 3–8 May 2020.
The authors would like to thank the Metal Earth project at Laurentian University for providing and archiving the seismic data. Saeid Cheraghi acknowledges Metal Earth for funding his research. Globe Claritas was used for seismic processing. GMT from Paul Wessel and Walter H. F. Smith was used to prepare some of the figures. GOCAD was used for 3D visualization and interpretation. The authors would like to thank Kipp Grose for IT support during the processing of Metal Earth seismic surveys. Dean Meek is acknowledged for providing geological and geographical maps in the study area. The authors would like to thank front line and essential workers who risk their lives during the pandemic spread of COVID-19. This is a collaboration of Metal Earth and Smart Exploration. Smart Exploration has received funding from the European Union's Horizon 2020 research and innovation program under grant. This is Metal Earth publication MERC-ME-2020-093.
This research has been supported by the Canada First Research Excellence Fund.
This paper was edited by Ramon Carbonell and reviewed by Fomin Tanya and two anonymous referees.
Adam, E., Milkereit, B., and Mareschal, M.: Seismic reflection and borehole geophysical investigations in the Matagami mining camp, Can. J. Earth Sci., 35, 686–695, 1998.
Adam, E., Perron, G., Milkereit, B., Wu, J., Calvert, A. J., Salisbury, M., Verpaelst, P., and Dion, D. J.: A review of high-resolution seismic profiling across the Sudbury, Selbaie, Noranda, and Matagami mining camps, Can. J. Earth Sci., 37, 503–516, 2000.
Adam, E., Perron, G., Arnold, G., Matthews, L., and Milkeriet, B.: 3D seismic imaging for VMS deposit exploration, Matagami, Quebec, in: Hardrock seismic exploration, edited by: Eaton, D. W., Milkereit, B., and Salisbury, M. H., SEG, 229–246, 2003.
Ahmadi, O., Juhlin, C., Malehmir, A., and Munck, M.: High-resolution 2D seismic imaging and forward modeling of a polymetallic sulfide deposit at Garpenberg, central Sweden, Geophysics, 78, 339–350, 2013.
Beasley, C. J.: Quality Assurance of Spatial Sampling: SEG, Washington, 544–547, 1993.
Beasley, C. J. and Klotz, R.: Equalization of DMO for Irregular Spatial Sampling, SEG, New Orleans, 970–973, 1992.
Bedeaux, P., Brochu, A., Mathieu, L., Gaboury, D., and Daigneault, R.: Structural analysis and metamorphism of the Barlow Fault Zone, Chibougamau area, Neoarchean Abitibi Subprovince: Implications for gold mineralization, Can. J. Earth Sci., https://doi.org/10.1139/cjes-2020-0048, 2020.
Bellefleur, G., Barnes, A., Calvert, A. J., Hubert, C., and Mareschal, M.: Seismic reflection constraints from Lithoprobe line 29 on the upper crustal structures of the northern Abitibi greenstone belt, Can. J. Earth Sci., 32, 128–134, 1995.
Bellefleur, G., Calvert, A. J., and Chouteau, M. C.: Crustal geometry of the Abitibi Subprovince, in light of three-dimensional seismic reflector orientation, Can. J. Earth Sci., 35, 569–582, 1998.
Bellefleur, G., Schetselaar, E., White, D., Miah, K., and Dueck, P.: 3D seismic imaging of the Lalor volcanogenic massive sulphide deposit, Manitoba, Canada, Geophys. Prospect., 63, 813–832, 2015.
Bellefleur, G., Cheraghi, S., and Malehmir, A.: Reprocessing legacy 3D seismic data from the Halfmile Lake and Brunswick No. 6 VMS deposits, New Brunswick, Canada, Can. J. Earth Sci., 56, 569–583, 2019.
Bédard, J. H., Leclerc, F., Harris, L. B., and Goulet, N.: Intra-sill magmatic evolution in the Cummings Complex, Abitibi greenstone belt: Tholeiitic to calc-alkaline magmatism recorded in an Archaean subvolcanic conduit system, Lithos, 111, 47–71, 2009.
Braunig, L., Buske, S., Malehmir, A., Backstrom, E., Schon, M., and Marsden, P.: Seismic depth imaging of iron-oxide deposits and their host rocks in the Ludvika mining area of central Sweden, Geophys. Prospect., 68, 24–43, 2020.
Canning, A. and Gardner, G. H. F.: Reducing 3D acquisition footprint for 3D DMO and 3D prestack migration, Geophysics, 63, 1177–1183, 1998.
Cheraghi, S., Malehmir, A., and Bellefleur, G.: Crustal-scale reflection seismic investigations in the Bathurst Mining Camo, New Brunswick, Canada, Tectonophysics, 506, 55–72, 2011.
Cheraghi, S., Malehmir, A., and Bellefleur, G.: 3D imaging challenges in steeply dipping mining structures: new lights on acquisition geometry and processing from the Brunswick No. 6 seismic data, Canada, Geophysics, 77, 109–122, 2012.
Cheraghi, S., Malehmir, A., Bellefleur, G., Bongajum, E., and Bastani, M.: Scaling behavior and the effects of heterogeneity on shallow seismic imaging of mineral deposits: A case study from Brunswick No. 6 mining area, Canada, J. Appl. Geophys., 90, 1–18, 2013.
Cheraghi, S., Naghizadeh, M., Snyder, D. B., and Mathieu, L.: Crustal-scale seismic investigation in Chibougamau, Quebec, Canada, 2nd Conference on Geophysics for Mineral Exploration and Mining, Workshop: worldwide Mineral Exploration Challenges and Cost-effective Geophysical Methods, EAGE, Porto, Portugal, Abstract, 2018.
Deregowski, S. M.: Dip-moveout and reflector point dispersal, Geophys. Prospect., 30, 318–322, 1982.
Daigneault, R., St-Julien, P., and Allard, G. O.: Tectonic evolution of the northeast portion of the Archean Abitibi greenstone belt, Chibougamau area, Quebec, Can. J. Earth Sci., 27, 1714–1736, 1990.
Daigneault, R.: Couloirs de déformation de la Sousprovince de l'Abitibi, Ministère des Ressources Naturelles du Québec, MB, 140 p., 1996.
David, J., Vaillancourt, D., Bandyayera, D., Simard, M., Goutier, J., Pilote, P., Dion, C., and Barbe, P.: Datations U-Pb Effectuées dans les Sousprovinces d'Ashuanipi, de La Grande, d'Opinaca et d'Abitibi en 2008–2009. MERN report, RP-2010-11; Ministère de l'Énergie et des Ressources Naturelles: Québec, QC, Canada, 2011.
Dimroth, E., Rochelau, M., Mueller, W., Archer, P., Brisson, H., Fortin, G., Jutras, M., Lefebvre, C., Piche, M., Pilote, P., and Simoneau, P.: Paleogeographic and paleotectonic response to magmatic processes – a case-history from the Archean sequence in the Chibougamau area, Quebec, Geologische Rundschau, 74, 11–32, 1985.
Dimroth, E., Mueller, W., Daigneault, R., Brisson, H., Poitras, A., and Rocheleau, M.: Diapirism during regional compression: the structural pattern in the Chibougamau region of the Archean Abitibi Belt, Quebec, Geologische Rundschau, 75, 715–736, 1986.
Ferber, R.: What is DMO coverage, 59th Annual International Meeting, EAGE, Geneva, Switzerland, A049, 2 pp., 1997.
Fowler, P. J.: A comparative overview of prestack time migration methods, 67th Annual International meeting, SEG, 1571–1574, 1997.
Fowler, P. J.: A comparative overview of dip moveout methods, Annual Meeting, SEG, 1744, 1998.
Groves, D. I., Goldfarb, R. J., Gebre-Mariam, M., Hagemann, S. G., and Robert, F.: Orogenic gold deposits – a proposed classification in the context of their crustal distribution and relationship to other gold deposit types, Ore Geol. Rev., 13, 7–27, 1998.
Hale, D.: A nonaliased integral method for dip moveout: Geophysics, 56, 795–805, 1991.
Heinonen, S., Malinowski, M., Hloušek, F., Gislason, G., Buske, S., Koivisto, E., and Wojdyla, M.: Cost-effective seismic exploration: 2D reflection imaging at the Kylylahti massive sulfide deposit, Finland, Minerals, 9, 263, https://doi.org/10.3390/min9050263, 2019.
Jakubowicz, H.: A simple efficient method of dip-moveout correction, Geophys. Prospect., 38, 221–245, 1990.
Juhlin, C.: Imaging of fracture zones in the Finnsjön area, central Sweden, using the seismic reflection method, Geophysics, 60, 66–75, 1995.
Juhlin, C., Kashubin, A. S., Knapp, J., Makovsky, V., and Ryberg, T.: EUROPROBE seismic reflection profiling in the Urals: The ESRU project, EOS, 76, 193–198, 1995.
Juhlin, C., Dehghannejad, M., Lund, B., Malehmir, A., and Pratt, G.: Reflection seismic imaging of the end-glacial Pärvie Fault system, northern Sweden, Appl. Geophys., 70, 307–316, 2010.
Kashubin, A. S. and Juhlin, C.: Mapping of crustal scale tectonic boundaries in the Ossa-Morena Zone using reprocessed IBERSEIS re?ection seismic data, Tectonophysics, 489, 139–158, 2010.
Lafrance, B.: Travaux ď exploration 2016-2017, Project Richardson, Chibougamau, Quebec, Tarku Resources, GM 70535, 132 p., 2018.
Larner, K. L., Gibson, B. R., Chambers, R., and Wiggins, R. A.: Simultaneous estimation of residual static and crossdip corrections, Geophysics, 44, 1175–1192, 1979.
Leclerc, F., Harris, L. B., Bedard, J. H., van Breemen, O., and Goulet, N.: Structural and stratigraphic controls on magmatic, volcanogenic, and shear zone-hosted mineralization in the Chapais-Chibougamau mining camp, northeastern Abitibi, Canada, Eco. Geol., 107, 963–989, 2012.
Leclerc, F., Roy, P., Houle, P., Pilote, P., Bedard, J. H., Harris, L. B., McNicoll, V., Van Breemen, O., David, J., and Goulet, N.: Géologie de la région de Chibougamau, Ministère de l'Énergie et des Ressources Naturelles, RG 2015-03, 97 p., 2015.
Leclerc, F., Roy, P., Pilote, P., Bédard, J. H., Harris, L. B., McNicoll, V. J., Van Breemen, O., David, J., and Goulet, N.: Géologie de la Région de Chibougamau : MERN report RG 2015-03, Ministère de l'Énergie et des Ressources Naturelles, Québec, QC, 97 pp., Canada, 2017.
Lundberg, E. and Juhlin, C.: High resolution reflection seismic imaging of the Ullared Deformation Zone, southern Sweden, Precambrian Research, 190, 25–34, 2011.
Malehmir, A. and Bellefleur, G.: Reflection seismic imaging and physical properties of base-metal and associated iron deposits in the Bathurst Mining Camp, New Brunswick, Canada, Ore Geol. Rev., 38, 319–333, 2010.
Malehmir, A., Bellefleur, G., and Müller, C.: 3D diffraction and mode converted scattering signatures of base-metal deposits, Bathurst Mining Camp, Canada, First Break, 28, 41–45, 2010.
Malehmir, A. Dahlin, P., Lundberg, E., Juhlin, C., Sjöström, H., and Högdahl, K.: Reflection seismic investigations in the Dannemora area, central Sweden: Insights into the geometry of polyphase deformation zones and magnetite-skarn deposits, J. Geophys. Res., 116, B11307, https://doi.org/doi:10.1029/2011JB008643, 2011.
Malehmir, A., Durrheim, R., Bellefleur, G., Urosevic, M., Juhlin, C., White, D., Milkeriet, B., and Campell, G.: Seismic methods in mineral exploration and mine planning: A general overview of past and present case histories and a look into the future, Geophysics, 77, 173–190, 2012.
Mathieu, L. and Racicot, D.: Petrogenetic Study of the Multiphase Chibougamau Pluton: Archaean Magmas Associated with Cu-Au Magmato-Hydrothermal Systems, Minerals, 9, 174, https://doi.org/10.3390/min9030174, 2019.
Mathieu, L., Crépon, A., and Kontak, D. J.: Tonalite-dominated magmatism in the Abitibi Subprovince, Canada, and significance for Cu-Au magmatic-hydrothermal systems, Minerals, 10, 242, https://doi.org/10.3390/min10030242, 2020a.
Mathieu, L., Snyder, D. B., Bedeaux, P., Cheraghi, S., Lafrance, B., Thurston, P., and Sherlock, R.: Deep into the Chibougamau area, Abitibi Subprovince: structure of a Neoarchean crust revealed by seismic reflection profiling, Tectonics, 38, 1–25, 2020b.
Mercier-Langevin, P., Lafrance, B., Bécu, V., Dubé, B., Kjarsgaard, I., and Guha, J.: The Lemoine auriferous volcanogenic massive sulfide deposit, Chibougamau camp, Abitibi greenstone belt, Quebec, Canada: Geology and genesis, Eco. Geol., 109, 231–269, 2014.
Milkereit, B. and Eaton, D.: Imaging and interpreting the shallow crust, Tectonophysics, 286, 5–18, 1998.
Mueller, W., Chown, E. H., Sharma, K. N. M., Tait, L., and Rocheleau, M.: Paleogeographic and paleotectonic evolution of a basement-controlled Archean supracrustal sequence, Chibougamau-Caopatina, Quebec, J. Geol., 97, 399–420, 1989.
Naghizadeh, M., Snyder, D. B., Cheraghi, S., Foster, S., Cilensek, S., Feloreani, E., and Mackie, J.: Acquisition and Processing of Wider Bandwidth Seismic Data in Crystalline Crust: Progress with the Metal Earth Project, Minerals, 9, 145, https://doi.org/10.3390/min9030145, 2019.
Nedimovic, M. R. and West, G. F.: Crooked-line 2D seismic reflection imaging in crystalline terrains: Part 1, data processing, Geophysics, 68, 274–285, 2003.
Perron, G. and Calvert, A. J.: Shallow, high-resolution seismic imaging at the Ansil mining camp in the Abitibi greenstone belt, Geophysics, 63, 379–391, 1998.
Perron, G., Milkereit, B., Reed, L. E., Salisbury, M., Adam, E., and Wu, J.: Integrated seismic reflection and borehole geophysical studies at Les Mines Selbaie, Quebec, CIM Bulletin, 90, 75–82, 1997
Pilote, P., Dion, C., Joanisse, A., David, J., Machado, N., Kirkham, R. V., and Robert, F.: Géochronologie des minéralisations d'affiliation magmatique de l'Abitibi, secteurs Chibougamau et de Troilus-Frotet: implications géotectoniques, in: Programme et résumés, Séminaire d'information sur la recherche géologique (p. 47), MRN report, DV-97-03, Ministère des Ressources Naturelles, Québec, QC, Canada, 1997.
Phillips, G. N. and Powell, R.: Formation of gold deposits: a metamorphic devolatilization model, J. Metamor. Geol., 28, 689–718, 2010.
Robert, F., Poulsen, K. H., Cassidy, K. F., and Hodgson, C. J.: Gold metallogeny of the Superior and Yilgarn cratons, Economic Geology, 100, 1001–1033, 2005.
Rodriguez-Tablante, J., Tryggvason, A., Malehmir, A., Juhlin, C., and Palm, H.: Cross-profile acquisition and cross-dip analysis for extracting 3D information from 2D surveys, a case study from the western Skellefte District, northern Sweden, J. Appl. Geophys., 63, 1–12, 2007.
Ronen, S., Nichols, D., Bale, R., and Ferber, R.: Dealiasing DMO: Good-pass, bad-pass, and unconstrained, SEG, Houston, 743–745, 1995.
Salisbury, M. H., Harvey, C. W., and Matthews, L.: The acoustic properties of ores and host rocks in hardrock terranes, in: Hard rock seismic exploration, edited by: Eaton, D. W., Milkereit, B., and Salisbury, M. H., SEG, 9–19, 2003.
Sawyer, E. W. and Benn, K.: Structure of the high-grade Opatica Belt and adjacent low-grade Abitibi Subprovince, Canada: An Archaean mountain front, J. Struct. Geol., 15, 1443–1458, 1993.
Schmelzbach, C., Juhlin, C., Carbonell, R., and Simancas, J. F.: Prestack and poststack migration of crooked-line seismic reflection data: a case study from the South Portuguese Zone fold belt, southwestern Iberia, Geophysics, 72, 9–18, 2007.
Schuster, G. T. and Liu, Z.: Seismic array theorem and rapid calculation of acquisition footprint noise, Geophysics, 66, 1843–1849, 2001.
Singh, B., Malinowski, M., Hlousek, F., Koivisto, E., Heinonen, S., Hellwig, O., Buske, S., Chamarczuk, M., and Juurela, S.: Sparse 3D Seismic Imaging in the Kylylahti Mine Area, Eastern Finland: Comparison of Time Versus Depth Approach, Minerals, 9, 305, https://doi.org/10.3390/min9050305, 2019.
Vermeer, G. J. O.: Seismic wavefield sampling, SEG, 1990.
Vermeer, G. J. O.: 3D symmetric sampling, 64th annual International Metting, SEG, extended abstreract, 906–909, 1994.
Vermeer, G. J. O.: 3D symmetric sampling, Geophysics, 63, 1629–1647, 1998.
Vermeer, G. J. O.: 3D symmetric sampling of sparse acquisition geometries, Geophysics, 75, 3–14, 2010.
Vermeer, G. J. O.: 3D seismic survey design, second edition, SEG, 263–270, 2012.
Williams, R. G. and Marcoux, M.: Model-constrained anti-alias filtering for improved 3-D DMO, 51st Annual International Meeting, EAGE, 1989.
Yilmaz, Ö.: Seismic data analysis, Processing, inversion, and interpretation of seismic data, SEG, 2001.
- Abstract
- Introduction
- Geological setting
- Seismic data acquisition
- Data processing and results
- Cross-dip analysis
- Discussion
- Conclusions
- Appendix A: Evaluating survey geometry for DMO and PSTM
- Data availability
- Author contributions
- Competing interests
- Special issue statement
- Acknowledgements
- Financial support
- Review statement
- References