the Creative Commons Attribution 4.0 License.
the Creative Commons Attribution 4.0 License.
 | 31 May 2021
Looking beyond kinematics: 3D thermo-mechanical modelling reveals the dynamics of transform margins
Anthony Jourdon
Charlie Kergaravat
Guillaume Duclaux
Caroline Huguen
Transform margins represent ∼ 30 % of non-convergent margins worldwide. Their formation and evolution have traditionally been addressed through kinematic models that do not account for the mechanical behaviour of the lithosphere. In this study, we use high-resolution 3D numerical thermo-mechanical modelling to simulate and investigate the evolution of intra-continental strain localization under oblique extension. The obliquity is set through velocity boundary conditions that range from 15∘ (high obliquity) to 75∘ (low obliquity) every 15∘ for rheologies of strong and weak lower continental crust. Numerical models show that the formation of localized strike-slip shear zones leading to transform continental margins always follows a thinning phase during which the lithosphere is thermally and mechanically weakened. For low- (75∘) to intermediate-obliquity (45∘) cases, the strike-slip faults are not parallel to the extension direction but form an angle of 20∘ to 40∘ with the plate motion vector, while for higher obliquities (30∘ to 15∘) the strike-slip faults develop parallel to the extension direction. Numerical models also show that during the thinning of the lithosphere, the stress and strain re-orient while boundary conditions are kept constant. This evolution, due to the weakening of the lithosphere, leads to a strain localization process in three major phases: (1) initiation of strain in a rigid plate where structures are sub-perpendicular to the extension direction; (2) distributed deformation with local stress field variations and formation of transtensional and strike-slip structures; (3) formation of highly localized plate boundaries stopping the intra-continental deformation. Our results call for a thorough re-evaluation of the kinematic approach to studying transform margins.
- Article
(18462 KB) - Full-text XML
-
Supplement
(88877 KB) - BibTeX
- EndNote


Transform margins represent ∼ 30 % of non-convergent margins worldwide (Mercier de Lépinay et al., 2016; Philippon and Corti, 2016). Transform continental margin refers to the continent–ocean transition derived from a transform plate boundary that accommodates, or has accommodated, ocean spreading (Basile, 2015; Mascle and Blarez, 1987). Transform continental margins are comprised of transform faults that connect divergent margins at both ends. In contrast with continental passive margins, continental transform margins have received limited attention, probably due to their non-cylindrical nature and the steep geometry of the deformed structures that make it difficult to image them with seismic reflection methods.
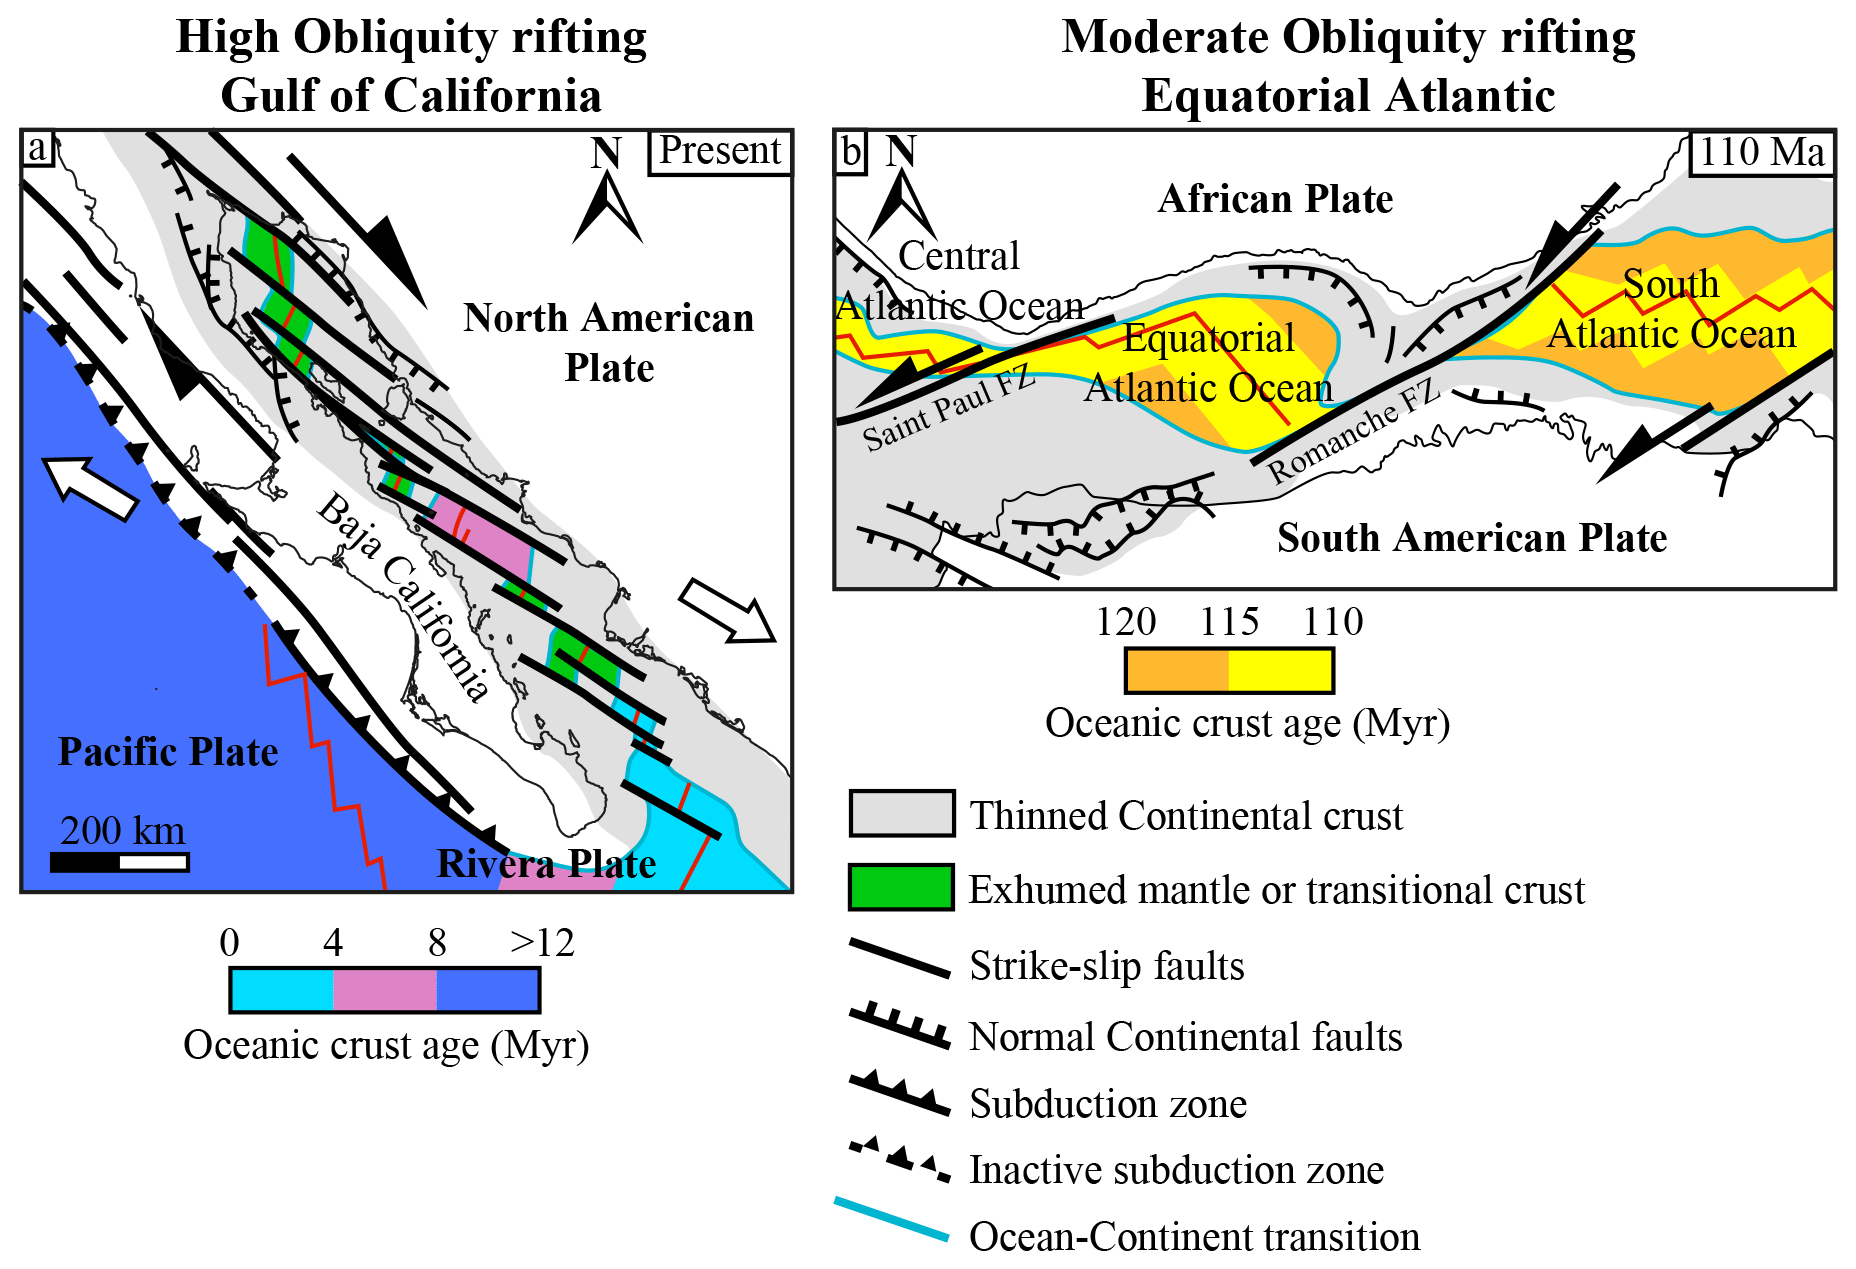
Figure 1(a) Simplified structural map of the Gulf of California rift system (modified from Bonini et al., 2019; Ferrari et al., 2018; Fletcher et al., 2007). Large white arrows display the plate motion between the North American Plate and the Pacific Plate from Plattner et al., (2007). (b) Simplified structural map of the equatorial Atlantic rift system at 110 Ma modified from Heine et al. (2013). FZ: fault zone. Half-headed black arrows represent the shearing direction.
Kinematic interpretations of transform margins are mainly based on a conceptual model (Basile, 2015; Basile et al., 2013; Mascle and Blarez, 1987; Scrutton, 1979). This conceptual model was first established from the interpretation of seismic reflection profiles along the conjugate equatorial Atlantic margins (Fig. 1) assuming inherited plate boundaries (Mascle and Blarez, 1987). It then became more widely used and applied to other continental margins around the world such as the southern African margin (Parsiegla et al., 2009), the Antarctic southern Exmouth Plateau along the South Australian margin (Lorenzo and Vera, 1992), and the western Greenland margin (Suckro et al., 2013). This original conceptual model involves the formation of offset intra-continental rift segments linked by a transform fault since the early stages of extension. As a consequence, the whole rift–transform fault system evolves synchronously during continental thinning and oceanic accretion. The onset of oceanic accretion marks the start of the triple junction migration along the transform margin at half the spreading velocity (Basile, 2015; Gerya, 2012). The transform continental margin is then considered active during the migration of the oceanic accretion axis along the continental domain. Whether transform faults originate pre- or syn-rifting or even post-continental break-up is still a matter of debate. However, some oceanic transform faults can form without any continental inheritances as shown by the presence of many transform faults along mid-oceanic ridges due to the plate kinematics and oceanic lithosphere rheology (Langemeyer et al., 2021). More recently, based on natural examples, Bellahsen et al. (2013) and Basile (2015) highlighted the fact that transform faults can form synchronously with syn-rift structures and may reactivate or cross-cut inherited structures (e.g. equatorial Atlantic, Gulf of California; Fig. 1), or they can develop after the oceanic spreading starts to connect offset oceanic ridges (e.g. Woodlark basin; Taylor et al., 2009).
This conceptual model and its offspring based on rigid plate tectonics do not reflect the whole intra-continental deformation phase associated with progressive strain localization and structure re-orientation (Ammann et al., 2017; Brune, 2014; Brune and Autin, 2013; Mondy et al., 2018; Le Pourhiet et al., 2017). This has first-order implications for tectonic plate reconstructions and the interpretation of a margin's progressive deformation history. In highly oblique systems, during the intra-continental stage, the relative plate motion between two divergent segments is mostly accommodated by strain partitioning along transfer fault zones (Milani and Davison, 1988). In order to better understand the dynamics of such transform margins from initiation in continental domains to maturity, it is therefore necessary to account for lithosphere physical properties. Both analogue and numerical modelling studies have focused on the formation and evolution of transform continental margins. Different modelling approaches have been used to investigate parameters that control intra-continental deformation and transform margin formation, all of them implying oblique plate motion (rift obliquity controls the orientation and proportion of normal, strike-slip, and oblique-slip faults). On the one hand, this obliquity can be either imposed through initial conditions with oblique pre-existing weak zones representing a structural inheritance (Agostini et al., 2009; Ammann et al., 2017; Brune et al., 2012; Clifton et al., 2000; Corti, 2012; Duclaux et al., 2020; Mart and Dauteuil, 2000; Tron and Brun, 1991; Withjack and Jamison, 1986) or imposed en-échelon offset weak zones (Allken et al., 2012; Le Calvez and Vendeville, 2002; Liao and Gerya, 2015; Le Pourhiet et al., 2017; Zwaan et al., 2016). On the other hand, obliquity can be set through boundary conditions with oblique extension (e.g. Brune, 2014; Brune et al., 2012; Brune and Autin, 2013; Persaud et al., 2017) or pure shear conditions (Gerya and Burov, 2018; Jourdon et al., 2020; Le Pourhiet et al., 2018) relative to the domain borders.
Except in experiments approaching pure strike-slip conditions, models show that the onset of intra-continental deformation localizes on structures at half the angle of obliquity (i.e. the angle between the extension-perpendicular direction and rift trend) (Brune, 2014; Duclaux et al., 2020; Withjack and Jamison, 1986). Then, depending on the obliquity (defined as the angle between the plate motion direction and the average rift trend) the deformation evolution differs. Resulting rifts systems are generally classified into three categories: (1) low obliquity, (2) intermediate obliquity, and (3) high obliquity.
Low-obliquity systems are close to orthogonal extension. For models with oblique extension or oblique weak zones it represents angles from 60∘ to 90∘ between the extension direction and weak zone trend. In models involving offset rifts, low obliquity is reached for offsets of 100 km or less (Allken et al., 2012; Liao and Gerya, 2015; Le Pourhiet et al., 2017). In these systems, the deformation is almost always orthogonal to the extension direction, and the developing structures are mainly extensional.
Intermediate obliquity is reached in models involving an oblique weak zone or oblique extension for angles of extension between 30∘ and 60∘ (Agostini et al., 2009; Brune, 2014; Corti, 2012; Duclaux et al., 2020), while for models with offset weak zones, an offset of 100 km to 300 km is required (Le Pourhiet et al., 2017). In this context, once the continental lithosphere has thinned enough, the rheology of the whole system evolves and the deformation regime changes to reach transtensional deformation. Large-scale strike-slip structures develop to connect isolated rift basin segments and accommodate the strike-slip component of deformation. However, strike-slip structures are not parallel to the extension direction as transform faults are in natural systems.
Finally, high obliquity represents systems in which the deformation regime approaches pure strike-slip conditions. These conditions can be reached for obliquities lower than 30∘ between the rift trend and the extension direction (Agostini et al., 2009; Ammann et al., 2017; Brune, 2014) or offset between rifts larger than 300 km (Le Pourhiet et al., 2017). This highly oblique deformation regime is rarely simulated except in setups with periodic or open boundary conditions due to a strong limitation in model setups associated with the use of free-slip boundary conditions on the vertical boundaries of the model. Indeed, free-slip boundary conditions that are generally used for vertical boundaries trending parallel to the extension direction physically prevent deformation in the direction normal to the face (i.e. if free slip is applied to a boundary of normal x, no deformation can occur in the x direction along this border). Therefore, models involving oblique or offset weak zones show that in high-obliquity contexts two independent rifts develop and never link (Le Pourhiet et al., 2017), suggesting a natural propensity for segmented rifts systems rather than oblique ones. However, this context seems to be the best candidate to form transform faults parallel to the extension direction segmenting two spreading systems. Indeed, Ammann et al., (2017) showed that a transform fault can develop in a highly oblique weak zone, forming an angle of 16∘ with the extension direction if intense softening is applied. This softening is set in their models through low-viscosity magmatism, allowing the viscosity in the weak zone to drop by 4 to 6 orders of magnitude compared to the surrounding material.
Here we numerically investigate the effect of oblique velocity boundary conditions on strain partitioning and localization during early rifting and break-up in the continental lithosphere using non-free-slip and oblique boundary conditions and different lower crustal rheologies. We first present high-resolution 3D numerical thermo-mechanical models illustrating the evolution of intra-continental rifting processes and strike-slip deformation leading to the formation of transform and/or strike-slip margins. We then discuss the implications of the crustal rheology for strain localization and strike-slip deformation. Finally, we compare the model results to emblematic natural examples of transform margins and propose a simplified tectonic evolution model for the formation of transform margins undergoing intermediate and highly oblique extension.
2.1 Modelling approach and initial conditions
In order to model the long-term deformation of the lithosphere we use pTatin3D (May et al., 2014, 2015), a highly scalable, massively parallel implementation of the finite-element method. It employs an arbitrary Lagrangian–Eulerian (ALE) discretization together with the material point method to solve the conservation of mass and momentum for an incompressible fluid coupled with energy conservation.

Figure 2Numerical model setup. (a) 3D spatial representation of the model domain with the three initially damaged zones. (b) Schematic representation in map view of the velocity boundary conditions. α is the angle between the velocity vectors and the x direction. (c) Yield stress envelopes and initial geotherm of strong- and weak-lower-crust models.
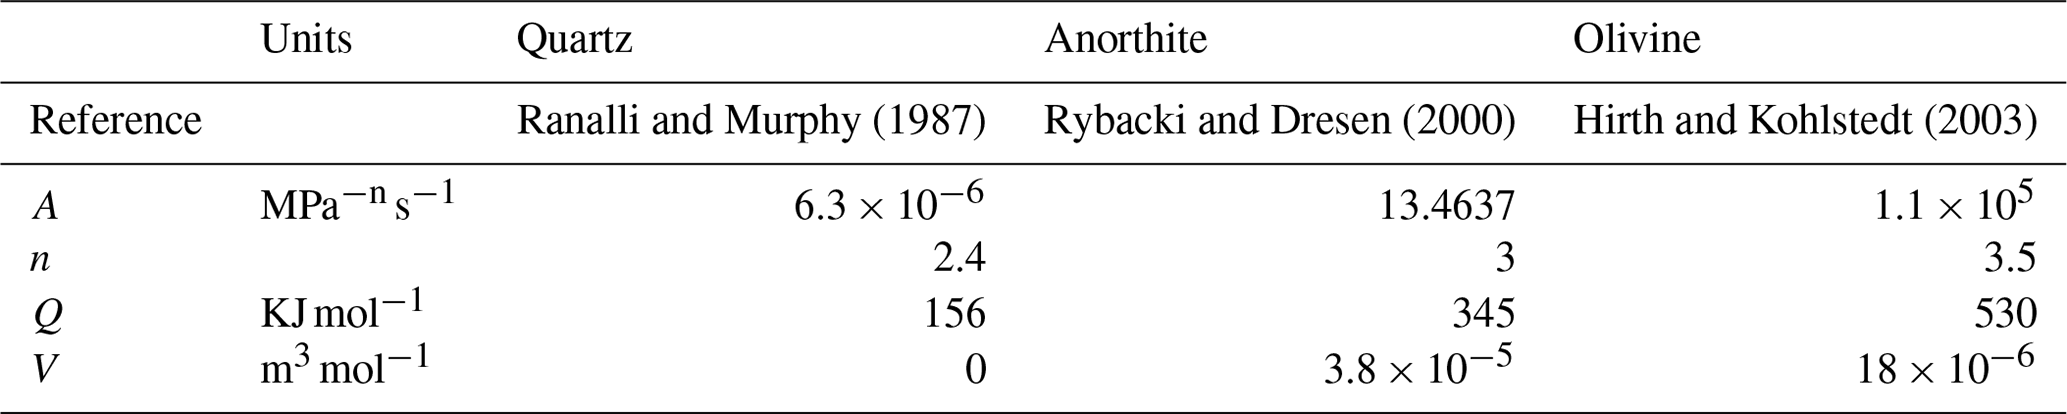
The geometry of the modelled domain is 1200 km in the x direction, 600 km in the z direction, and 250 km in the vertical y direction (Fig. 2a). Two sets of models are conducted: the first set involves 10 models with a resolution of 512 × 256 × 128 elements, while the second set involves three high-resolution models of 1024 × 512 × 256 elements for a resolution of about 1 km × 1 km × 1 km. The initial lithosphere geometry involves four flat layers. The crust is divided into an upper crust from y = 0 km to y = −20 km and a lower crust from y = −20 km to y = −40 km. The upper crust is simulated with a quartz flow law (Ranalli and Murphy, 1987) when viscous deformation takes place. Since the lower crust rheology is known to have a first-order control on strain localization (Allken et al., 2012; Brune et al., 2017; Corti, 2012; Jourdon et al., 2020; Le Pourhiet et al., 2017) we conducted all the experiments with two different lower crust rheologies. The “weak-lower-crust” models involve a quartz flow law (Ranalli and Murphy, 1987), while the “strong-lower-crust” models involve an anorthite flow law (Rybacki and Dresen, 2000). The mantle is also divided into two layers, the lithosphere mantle (from y = −40 km to y = −120 km) and the asthenosphere mantle (from y = −120 km to y = −250 km), which share the same rheology simulated with an olivine flow law (Hirth and Kohlstedt, 2003). To simulate the brittle parts of the lithosphere we use the Drucker–Prager pseudo-plastic yield criterion adapted to continuum mechanics (see Eq. A5).
Table 1Parameters used for the different flow laws in the model.
The initial temperature field is set with a steady-state analytical solution (Turcotte and Schubert, 2002):
with Ty=0 = 0 ∘C, an incoming mantle heat flux qm = 20 mW m−2, a radiogenic heat production H = 1.2 × 10⁻⁶ W m−3, a characteristic radiogenic layer of yp = 40 km, and a conductivity of 3.3 . With this analytical solution the temperature at the Moho (40 km of depth, Fig. 2c) is 610 ∘C, and the lithosphere–asthenosphere boundary (1300 ∘C) lies at a depth of 120 km (Fig. 2c). Then, from 120 to 250 km depths we prescribe a linear increase in the temperature representing an adiabatic gradient of 0.5 (Fig. 2c). Although this second part of the geotherm is not at steady state, the cooling by diffusivity is very slow (less than 2 for the maximum cooling rate) and it maintains reasonable conductivity values in the asthenosphere (3.3 ).
The initial radiogenic heat production is set as an exponential decay of heat production with depth according to Turcotte and Schubert (2002) as follows:
for a surface production H0 of 1.2 × 10⁻⁶ W m−3.
In order to initiate the deformation in the central part of the model we define three weak zones that could represent tectonic inheritances in which we prescribe an initial amount of plastic strain that reduces the friction angle as
where φ is the friction angle, φ0 the initial friction angle (30∘), φ∞ the minimum friction angle (5∘), εp the plastic strain, and εmin and εmax the minimum and maximum values of plastic strain between which the plastic strain softening is applied (0 and 1, respectively). The geometry consists of three cuboid damage zones with dimensions of 200 km × 200 km × 100 km centred at x = {200; 600; 1000} and z = 300 km.
2.2 Boundary conditions
The boundary conditions to solve the conservation of momentum are defined with velocity vectors oblique to the boundary (Fig. 2b). On faces normal to the z axis, we impose the same velocity on the whole face with opposite directions between face zmin and face zmax. On faces normal to the x axis, we impose approximately periodic boundary conditions (Fig. 2b) according to which the velocity vectors flip 180∘ at the centre of the z axis. The angle of extension α is determined as the angle between the velocity vector and z, the horizontal direction normal to x (Fig. 2b). For every model, we impose a velocity vector of norm |v| = 0.5 cm a−1 on each face. This velocity simulates a total extension rate of 1 cm a−1 corresponding to an average of the varying extension rate during the evolution of a rift system. Each component of the velocity vector is therefore computed as
The basal boundary condition is defined as a constant inflow to compensate for the outflow as
where Lx, Ly, and Lz are the length of the domain in the corresponding direction.
The boundary conditions to solve the conservation of energy are null heat fluxes on vertical boundaries, Ty=0 = 0 ∘C and Ty=bottom = 1365 ∘C.
In order to best interpret the tectonic evolution of the oblique rift models we choose to represent the stress-inferred deformation regime, the finite strain, and the beta factor in map views. We also display cross sections oriented either perpendicularly to the strike-slip structures or to the extensional ones on which the second invariant of the strain rate tensor is computed as follows:
where is the strain rate tensor and v the velocity vector. The second invariant is then computed as
with the Einstein summation convention.
Table 2Regime stress ratio (RSR) values and corresponding interpretation.
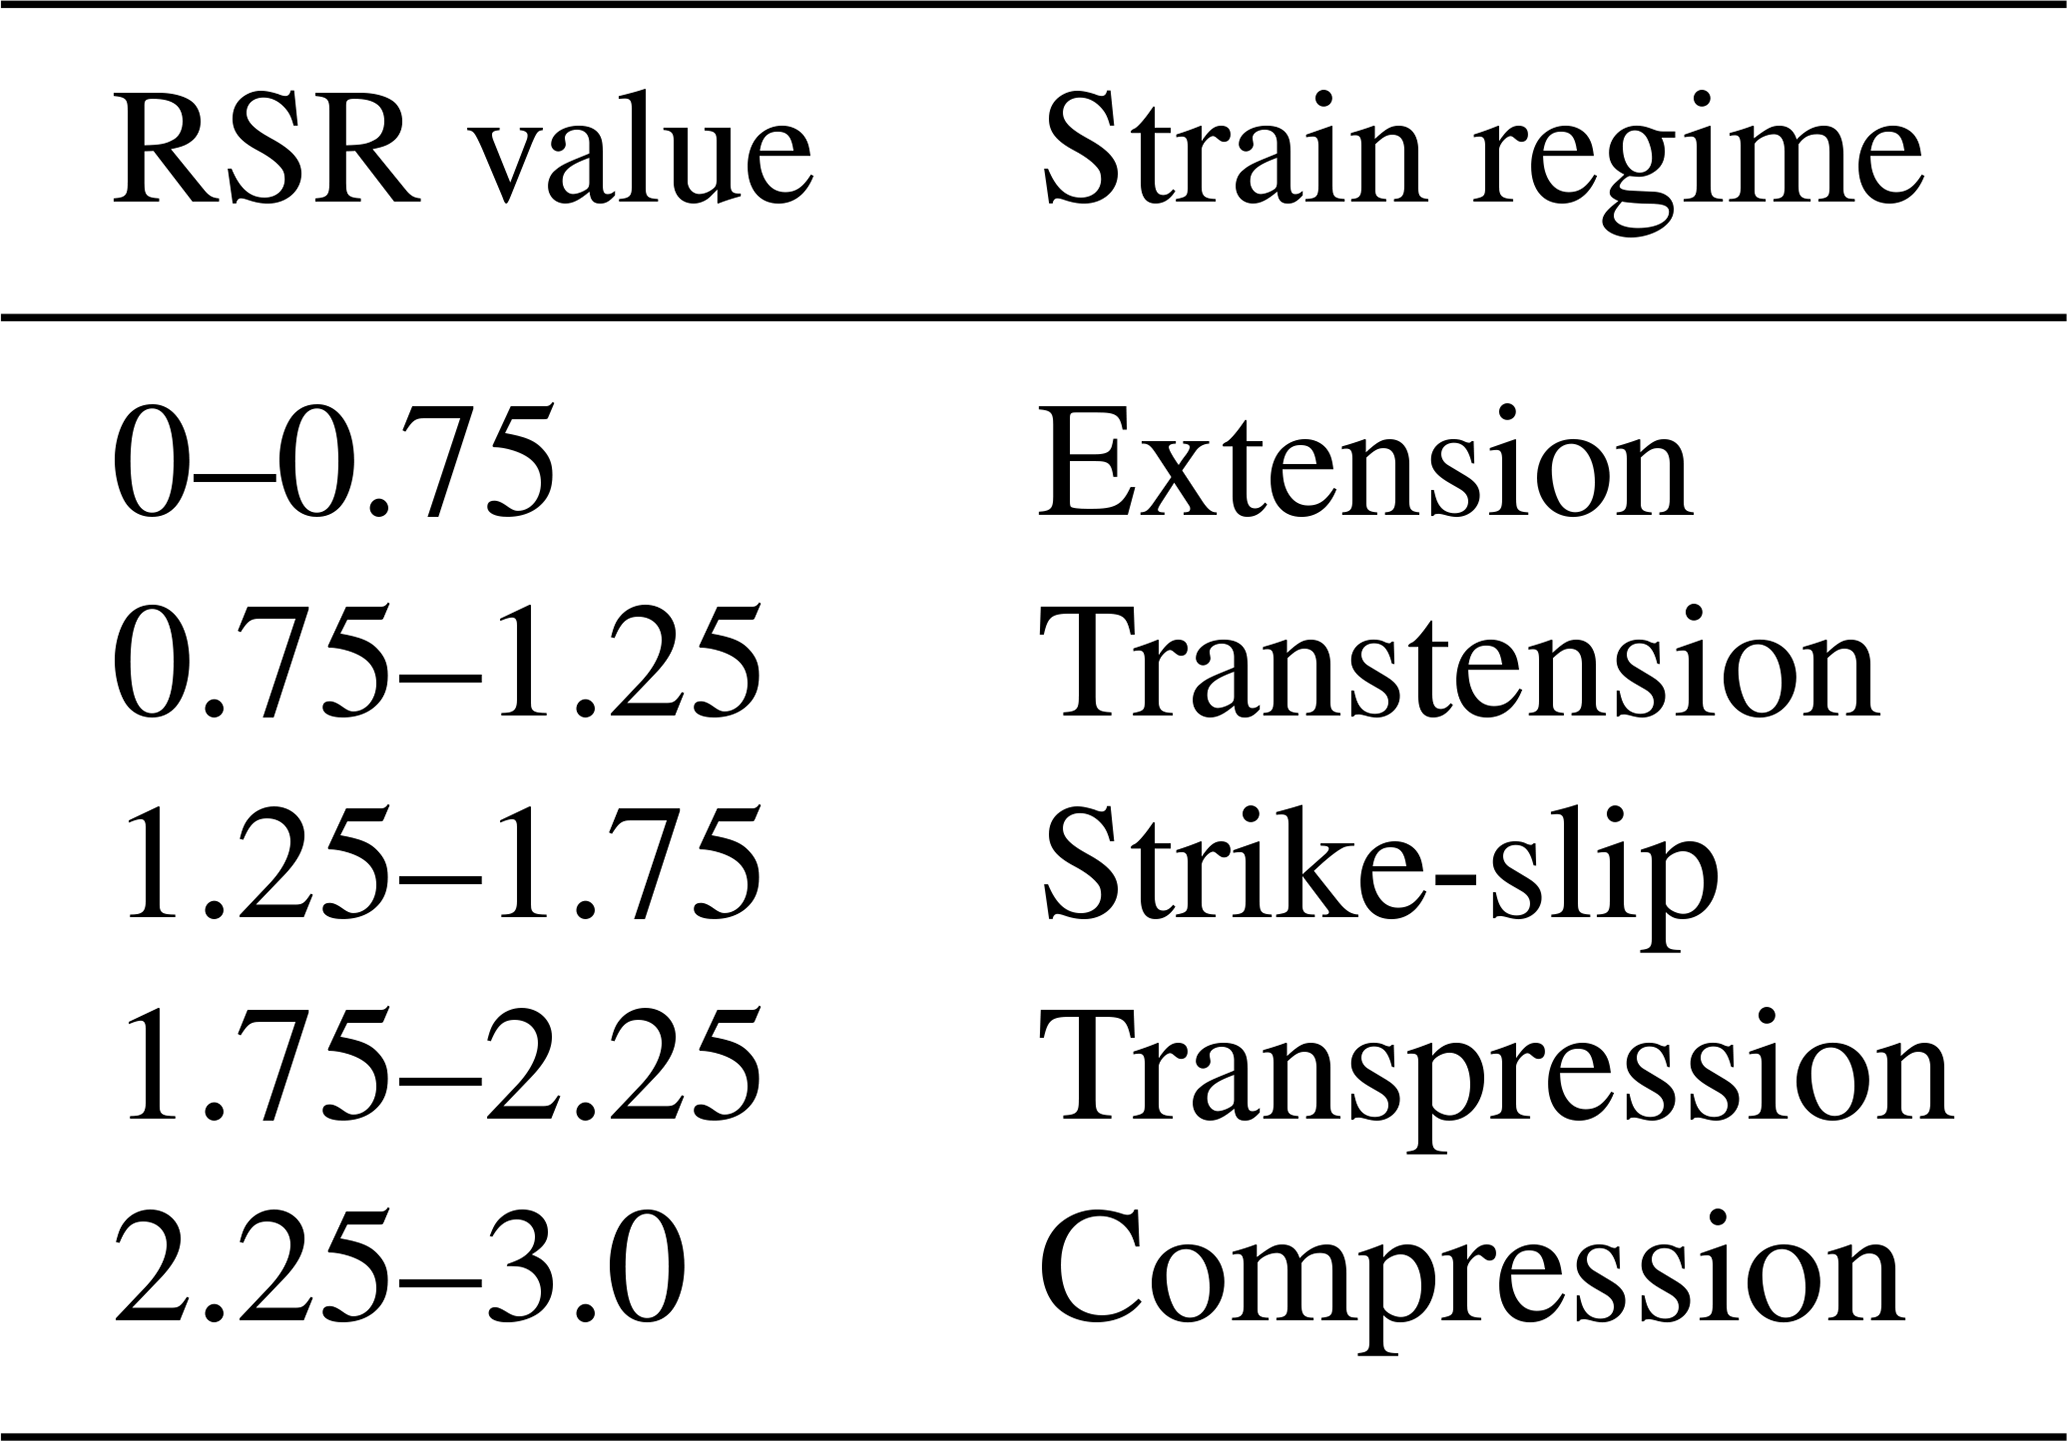
The stress-inferred deformation regime is used to determine whether the dominant instantaneous deformation regime is extensional, transtensional, strike-slip, transpressional, or compressional. This method has been used in several studies (Brune, 2014; Brune and Autin, 2013; Buchmann and Connolly, 2007; Delvaux et al., 1997; Hergert and Heidbach, 2011; Simpson, 1997) and facilitates the interpretation of the active tectonic structures. The detailed method is described in Brune (2014) wherein the regime stress ratio (RSR) is computed as a scalar ranging from 0 to 3 corresponding to a continuous evolution from extension, transtension, strike-slip, transpression, and compression. In Figs. 3, 5, and 7 we represent each of these deformation regimes with different colours. Table 2 shows the upper and lower bounds of each deformation regime.
The maps of finite strain (Figs. 3, 5, and 7) display both plastic strain and the mantle exhumation age, which is indicative of the time when the mantle starts to exhume. The plastic strain is computed as the cumulative deformation over time when deformation occurs under the Drucker–Prager yield criterion (Eq. A6). The mantle exhumation age is designed to be compared with oceanic seafloor age or magnetic anomalies. It is computed as the time at which the particles cooled down below 800 ∘C (Jourdon et al., 2020).
In Figs. 3, 5, and 7, the beta factor represents the crustal thinning as a ratio of the crust thickness at a given time to the initial crust thickness:
where βn is the beta factor at time n, hct=n is the crustal thickness at time n, and hct=0 is the initial crustal thickness.
Figure 11 represents the rift obliquity with respect to the extension direction. In order to compute the rift obliquity we define two boundaries depending on the beta factor value. The boundary labelled OCT (ocean–continent transition) corresponds to the highest beta factor value (i.e. the location where the crust is the thinnest before the mantle starts to exhume), and the lines labelled “necking” represent contours showing the beta factor equal to 2. Then we extract discrete points located on these contours and use the dot product between a vector defined by two points located on these contours (uc) and a vector defining the boundary condition velocity (v) to compute the angle γ as
In order to highlight the first-order structure orientation we then average the value of γ on rift segments of 20 km.
In this study, we conducted 10 experiments with a resolution of ∼ 2 km × 2 km × 2 km per element. Five simulations with a weak lower crust and five simulations with a strong lower crust for angles of extension α = 15∘, 30∘, 45∘, 60∘, and 75∘ have been run. From these 10 simulation setups three were selected and run at higher resolution (∼ 1 km × 1 km × 1 km per element). The three selected simulations are weak lower crust at α = 60∘ and strong lower crust at α = 45∘ and 15∘. These three models better capture the detailed structures associated with evolution of offset rift basins linked by strike-slip structures and allow very precise imaging of the progressive formation and evolution of strike-slip and transform margins. Therefore, we present in detail the evolution through time and space of these three models before summarizing the results of all the lower-resolution simulations.

Figure 3Model 1, weak lower crust, α = 60∘, map views. Left column: active strain regime; the intensity of the colours depends on the intensity of the second invariant of the strain rate. The background represents the topography with hill shading. The inset plot represents the strike of shear zones. Central column: plastic strain computed from Eq. (A6) in the crust and exhumation ages of the mantle below the 800 ∘C isotherm. Right column: beta factor of the crust computed with Eq. (8).

Figure 4Model 1, weak lower crust, α = 60∘. Map views and cross sections of simulated lithologies and second invariant of the strain rate tensor (Eq. 7).
4.1 Model 1: weak lower crust, 60∘ extension
Deformation starts to localize around 5 Ma and isolated grabens form. These grabens are limited by extensional to transtensional en-échelon faults oriented almost perpendicular (∼ N110) to the extension direction (Figs. 3a and 4a). From 15 Ma, as strain localizes more intensively in basins, the en-échelon deformation re-organizes (Figs. 3g and 4c). Newly formed strike-slip faults in shear zones oriented N75 link the N110-trending normal faults in the basins. The initial normal faults that are no longer active start to rotate clockwise along the diffuse strike-slip structures (Fig. 3h and 3k). A differential thinning of the crust occurs between strike-slip fault zones and dip-slip deformation zones, leading to basin formation (Fig. 3i). Then, strike-slip linkage occurs (Fig. 3j) to form large-scale transfer zones (∼ 100 km long; ∼ 50 km wide) between offset basins. The major large-scale transfer zone is localized along a pre-existing damaged zone. Strike-slip shear zones display a N60 strike and a dip of 90∘ (Fig. 4d and e, cross section b-b'), while newly formed divergent shear zones show a ∼ N95 surface orientation. Strike-slip and divergent shear zones form an angle of 35∘ between each other and an angle of 30∘ and 65∘ with the extension direction. With the strike-slip strain localization, small regions with transient compressional stress regimes appear in the strike-slip to divergent transition zones, accommodating the clockwise rotation (Fig. 3g and j). During the rifting phase, normal faults formed at the early stages of thinning are passively rotating. As they approach the strike-slip transfer zones their orientation changes through time from N110 (at 5 Ma, Fig. 3a) to N10 (at 30 Ma, Fig. 3p), showing a clockwise rotation of ∼ 100∘. Finally, when the mantle exhumes and ridge accretion takes place (Fig. 3p), the continental lithosphere resumes rigid behaviour and deformation only localizes in the mantle along transfer fault zones oriented N80 to N100.
The final geometry of the continental margins is dominated by divergent segments that are parallel to the exhumation age mantle stripes (i.e. to magnetic anomalies; Fig. 3q), while margin segments located close to strike-slip fault zones are perpendicular to these mantle stripes (Fig. 3q). Offset divergent basins are bounded by strike-slip fault zones controlling ridge propagation. The orientation of these segments highlights the fact that the ridge propagation along-strike stops until the strike-slip fault zones start to accommodate mantle exhumation. As shown by the evolution of the rift through time, under constant plate kinematics, the active deformation regime changes and re-orients.
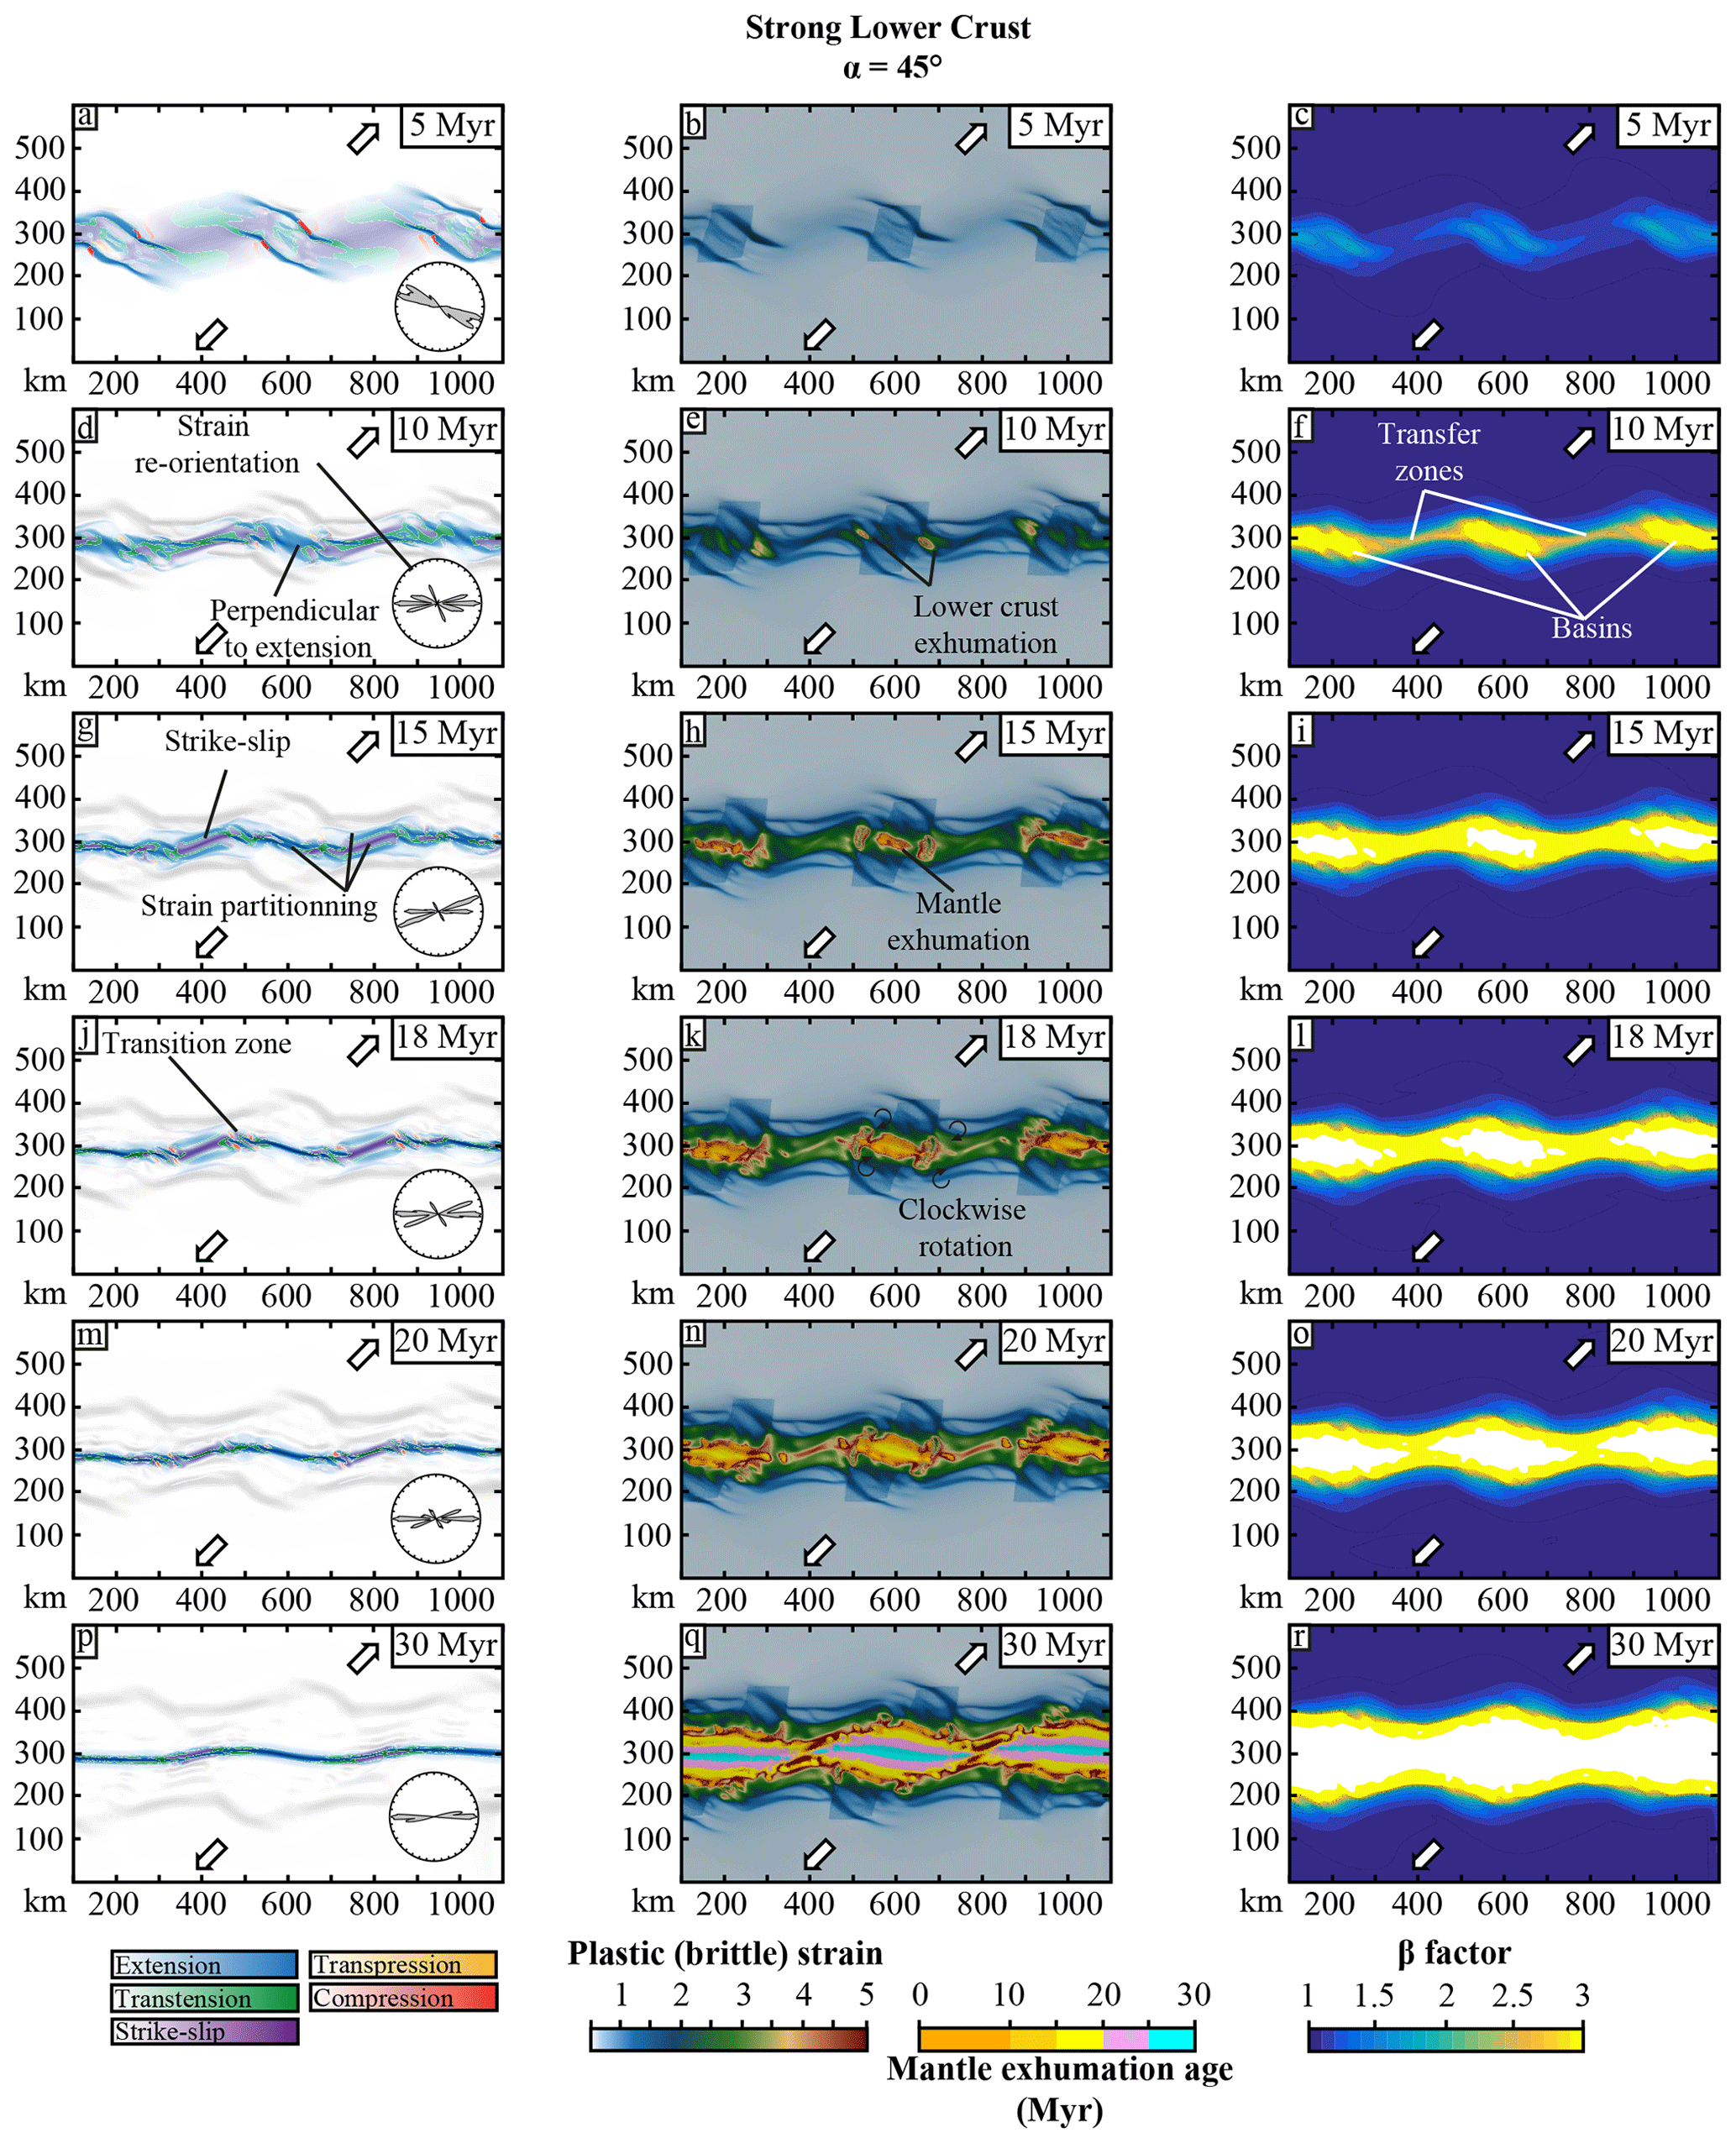
Figure 5Model 2, strong lower crust, α = 45∘, map views. Left column: active strain regime; the intensity of the colours depends on the intensity of the second invariant of the strain rate. The background represents the topography with hill shading. The inset plot represents the strike of shear zones. Central column: plastic strain computed from Eq. (A6) in the crust and exhumation ages of the mantle below the 800 ∘C isotherm. Right column: beta factor of the crust computed with Eq. (8).
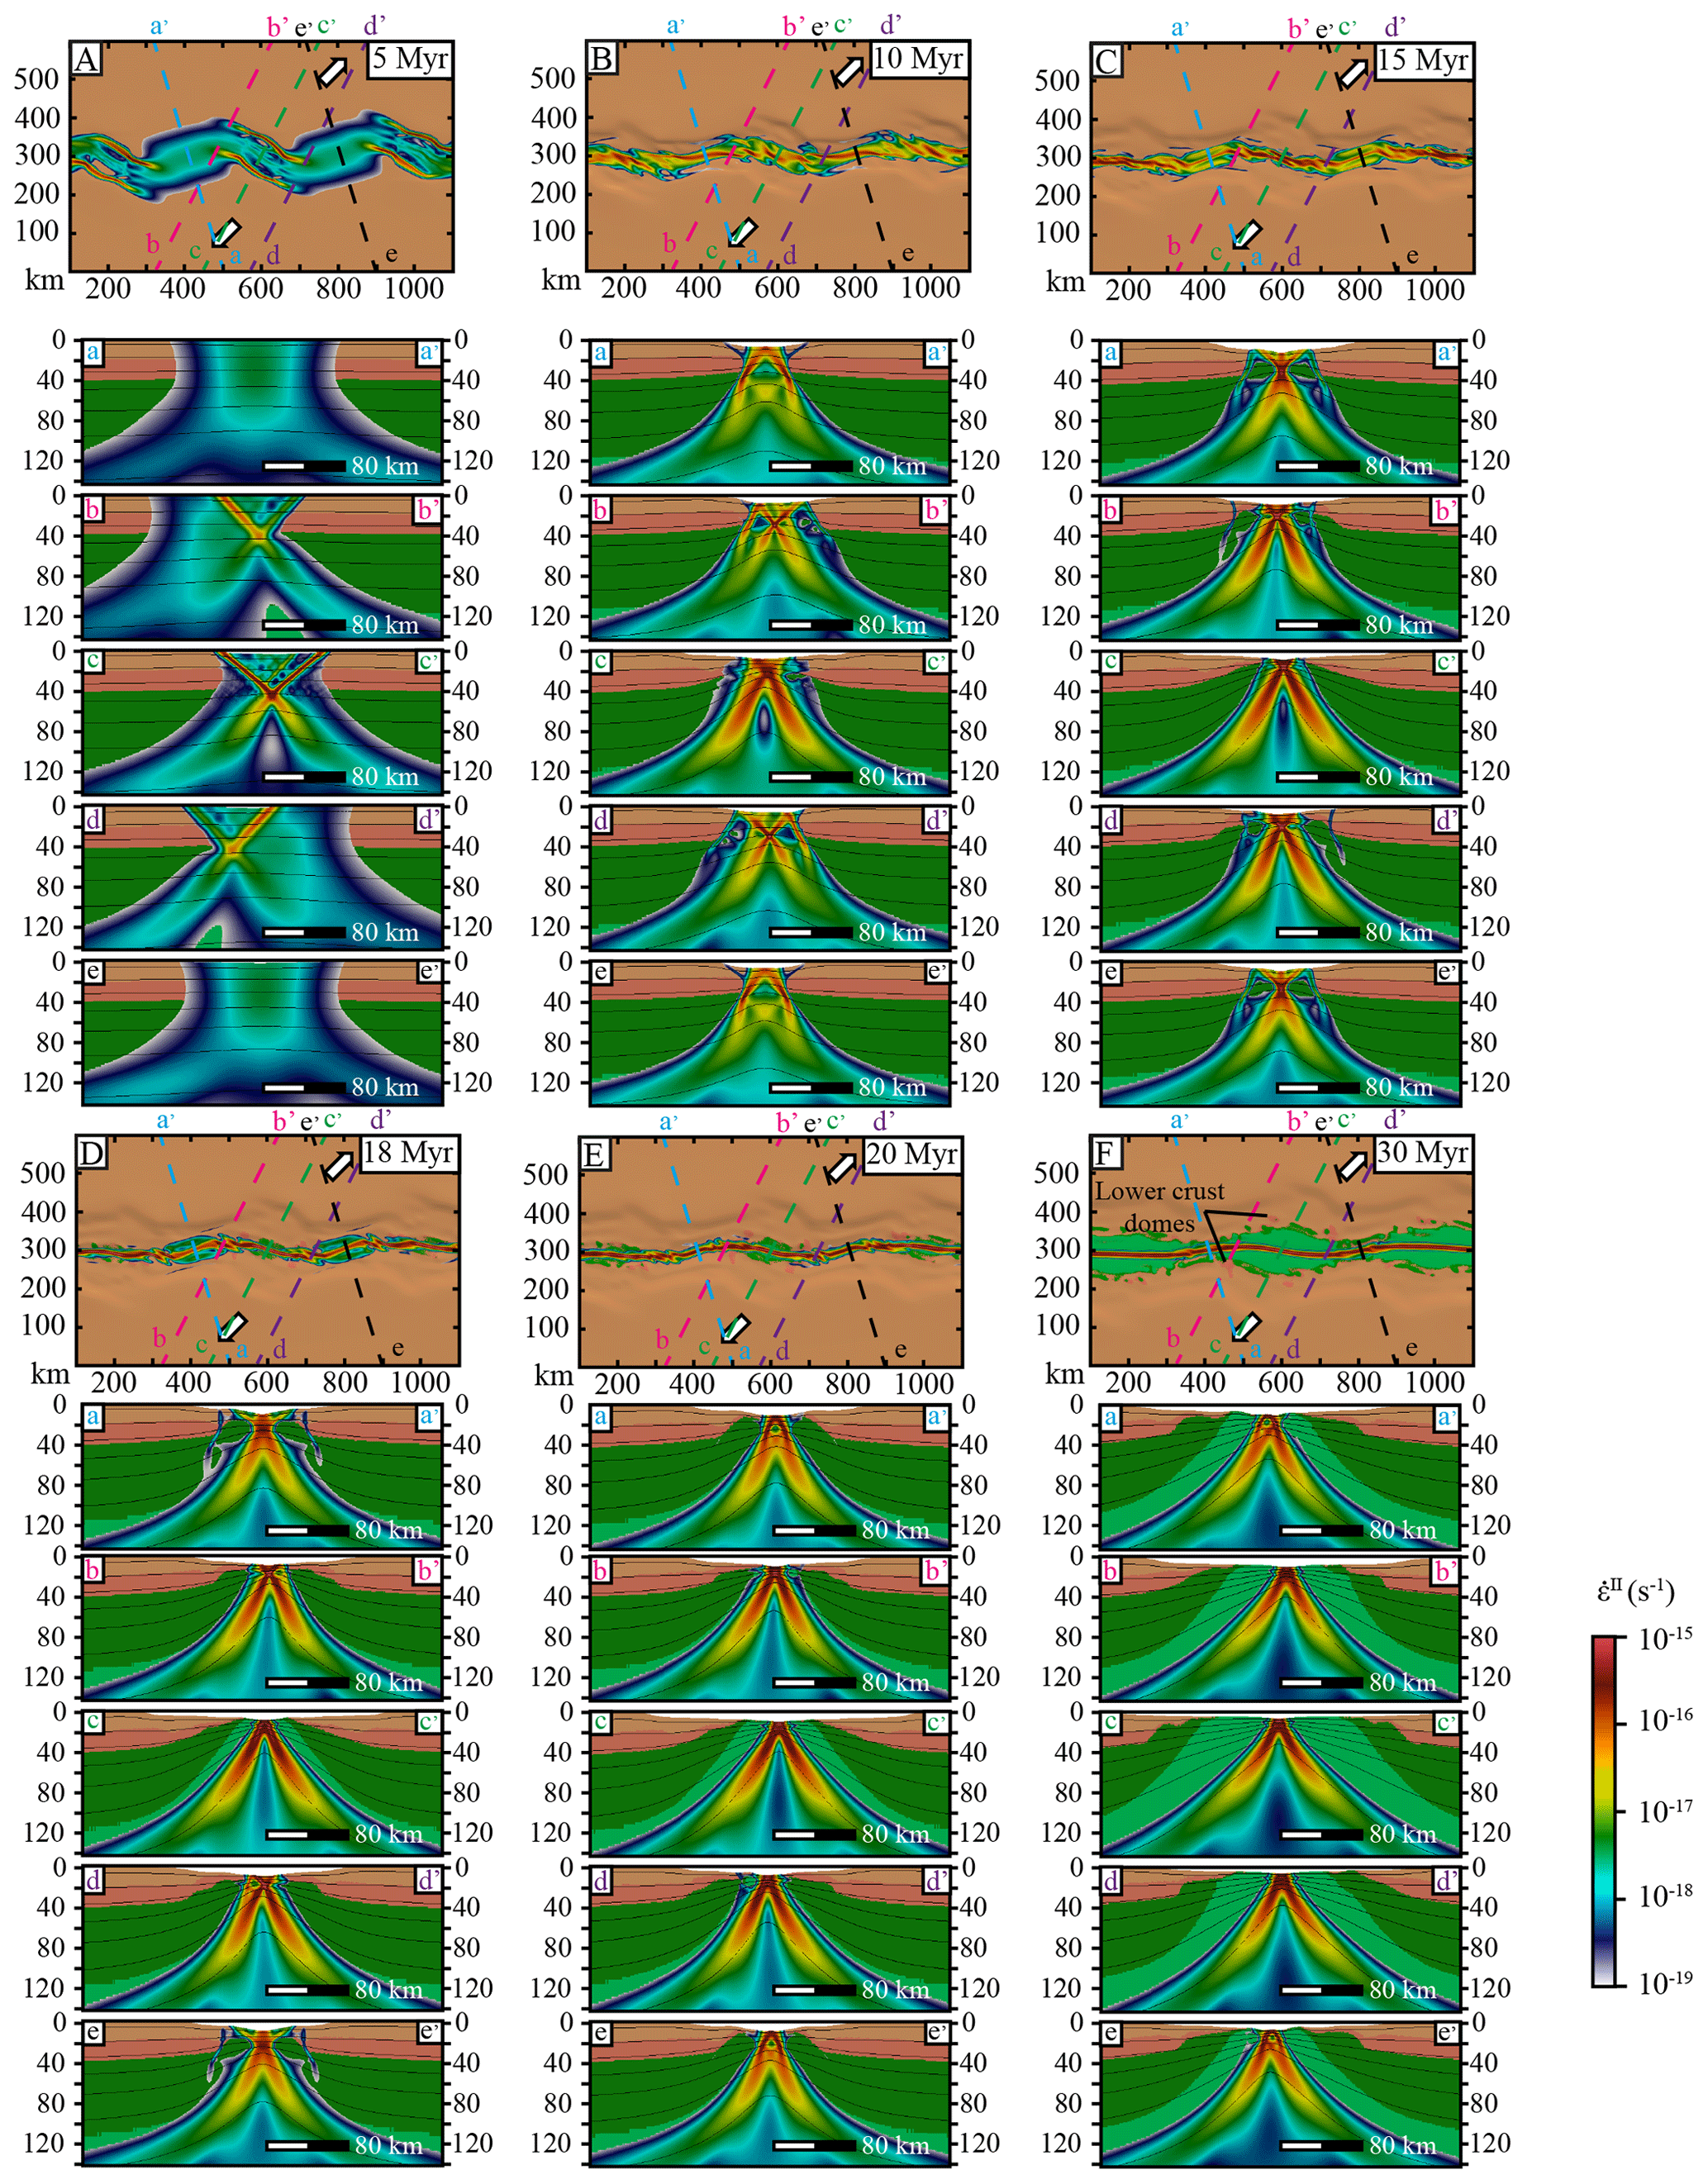
Figure 6Model 2, strong lower crust, α = 45∘. Map views and cross sections of simulated lithologies and second invariant of the strain rate tensor (Eq. 7).
4.2 Model 2: strong lower crust, 45∘ extension
In this model, the deformation starts to localize as extensional shear zones at the edges of the initial damaged zones (Figs. 5a and 6a). Inside the weak zones, active deformation zones trend perpendicular (∼ N130) to the extension direction, while at the weak zone edges deformation is oriented N110. The stress field shows weak and diffuse compression that accommodates the variation in shear zone orientation between damaged zones (Fig. 5a). Areas situated between localized shear zones show a diffuse strike-slip stress field (∼ 200 km wide for a strain rate second invariant of 10−18 s−1). As thinning progresses, the deformation localizes more intensively in the basins along shear zones oriented N110 (Figs. 5d and 6b). Between the basins, active deformation localizes along N70 transfer zones with a sigmoidal shape. The shear zone orientation evolves from N90 at the edge of the basins to N70 (Fig. 5d) where elongated lower crustal domes exhume in the transition zones between basins and strike-slip shear zones (Fig. 5e). The associated stress field also displays variations from purely strike-slip to transtensional (Fig. 5d). At 10 Ma, the transfer zones show transtensional deformation in the most localized deformation area (Fig. 5d), while at 15 Ma strike-slip deformation dominates (Fig. 5g). Once pure strike-slip deformation takes place in the central part of the transfer zones (from 15 Ma), strain partitioning intensifies. The transfer zones are divided into three domains: (1) the most external domain dominated by pure extension, (2) a transitional domain dominated by transtensional deformation, and (3) the central domain dominated by pure strike-slip (Fig. 5g). These three domains are visible in cross section (Fig. 6c, cross sections a-a' and e-e') where two normal shear zones located on the borders of the transfer zones accommodate the thinning of the lithosphere, while in the centre a vertical shear zone accommodates the horizontal displacement. From 18 Ma, ridge dynamics take place in the basins (Figs. 5j and 6d) where the deformation is highly localized along two symmetrical shear zones, accommodating the oceanic spreading. The transition region between basins and transfer zones displays small en-échelon shear zones with compressional stresses at their tips, accommodating local clockwise rotation (Fig. 5j). At 30 Ma, the continental crust in the transfer zones finally breaks up, and the oceanic domain displays a suite of interconnected basins with sigmoid shapes (Fig. 5q).
The final structure of the continental margins (at 30 Ma) shows a spatial repetition of three segments associated with divergent, transtensional, and strike-slip kinematics. The divergent segments are parallel to the mantle exhumation age stripes and to the main necking faults located along the initial weak zones (Fig. 5q). Transitional segments, located between the divergent and the strike-slip segments, show exhumed lower crustal and mantle domes (Figs. 5q and 6f). The deformation pattern combines strike-slip, extensional, and transitory compressional structures formed during the evolution of the rift system. They are related to stress field dynamics with rotation between basins that are mainly divergent and transfer zones that are mainly strike-slip. Finally, the strike-slip segments form the third part of the margins where the mantle exhumed domain is the narrowest. The deformation pattern is relatively simple, with a strike-slip shear zone at the centre and a few preserved normal faults in the thinned continental domain.

Figure 7Model 3, strong lower crust, α = 15∘, map views. Left column: active strain regime; the intensity of the colours depends on the intensity of the second invariant of the strain rate. The background represents the topography with hill shading. The inset plot represents the strike of shear zones. Central column: plastic strain computed from Eq. (A6) in the crust and exhumation ages of the mantle below the 800 ∘C isotherm. Right column: beta factor of the crust computed with Eq. (8).

Figure 8Model 3, strong lower crust, α = 15∘. Map views and cross sections of simulated lithologies and second invariant of the strain rate tensor (Eq. 7).
4.3 Model 3: strong lower crust, 15∘ extension
In this model, the deformation initiates as a wide and diffuse strike-slip region without clear individual faults or shear zones, except along the model borders (Figs. 7a and 8a). At 10 Ma, the deformation is already localized along a central vertical strike-slip shear zone oriented N90 and two surrounding normal shear zones (Figs. 7d and 8b, cross section a-a'). From this stage, the deformation in the central part of the model, located between initial damaged weak zones, evolves from strike-slip to transtensional and extensional (Fig. 7g and j). Basins developed in these zones accommodate the maximum vertical displacement (Fig. 7l). At the same time, between and around these basins, the deformation progressively localizes as transtensional to vertical strike-slip shear zones oriented N70 to N90 (Figs. 7j and 8d). Then at 25 Ma the deformation partitions between large-scale (∼ 500 km long) strike-slip shear zones oriented N80 and extensional shear zones in between (Figs. 7m and 8e). The strike-slip motion leads to the clockwise rotation of individualized blocks. This rotation produces transient compressive strain in the hinges of the blocks (Fig. 7m and p). While during the first deformation phase (from 0 to 20 Ma) the extensional deformation localized along N90 shear zones, during the second phase the extensional structures located between the large-scale transform faults display a N105 orientation (Fig. 7m and p). Compared to the two previous models, the crust thins slower and at 30 Ma the mantle is not exhumed yet. In addition, the maximum crustal thinning occurs between the initial damaged zones between the strike-slip shear zones. However, the cross section b-b' (Fig. 8b), following the orientation of the transform faults and crossing the normal faults perpendicularly, shows a hyper-thinned margin over ∼ 300 km. The high obliquity of the extension velocity favours horizontal displacements over vertical ones. This results in a relative dextral motion of ∼ 200 km on each transform shear zone in 30 Myr, while continental break-up has not yet occurred.
The final structure of the continental margins (at 30 Ma) shows three strike-slip-dominated shear zones that are parallel to the extensional direction, limiting two elongated extensional segments (Fig. 7p and q).
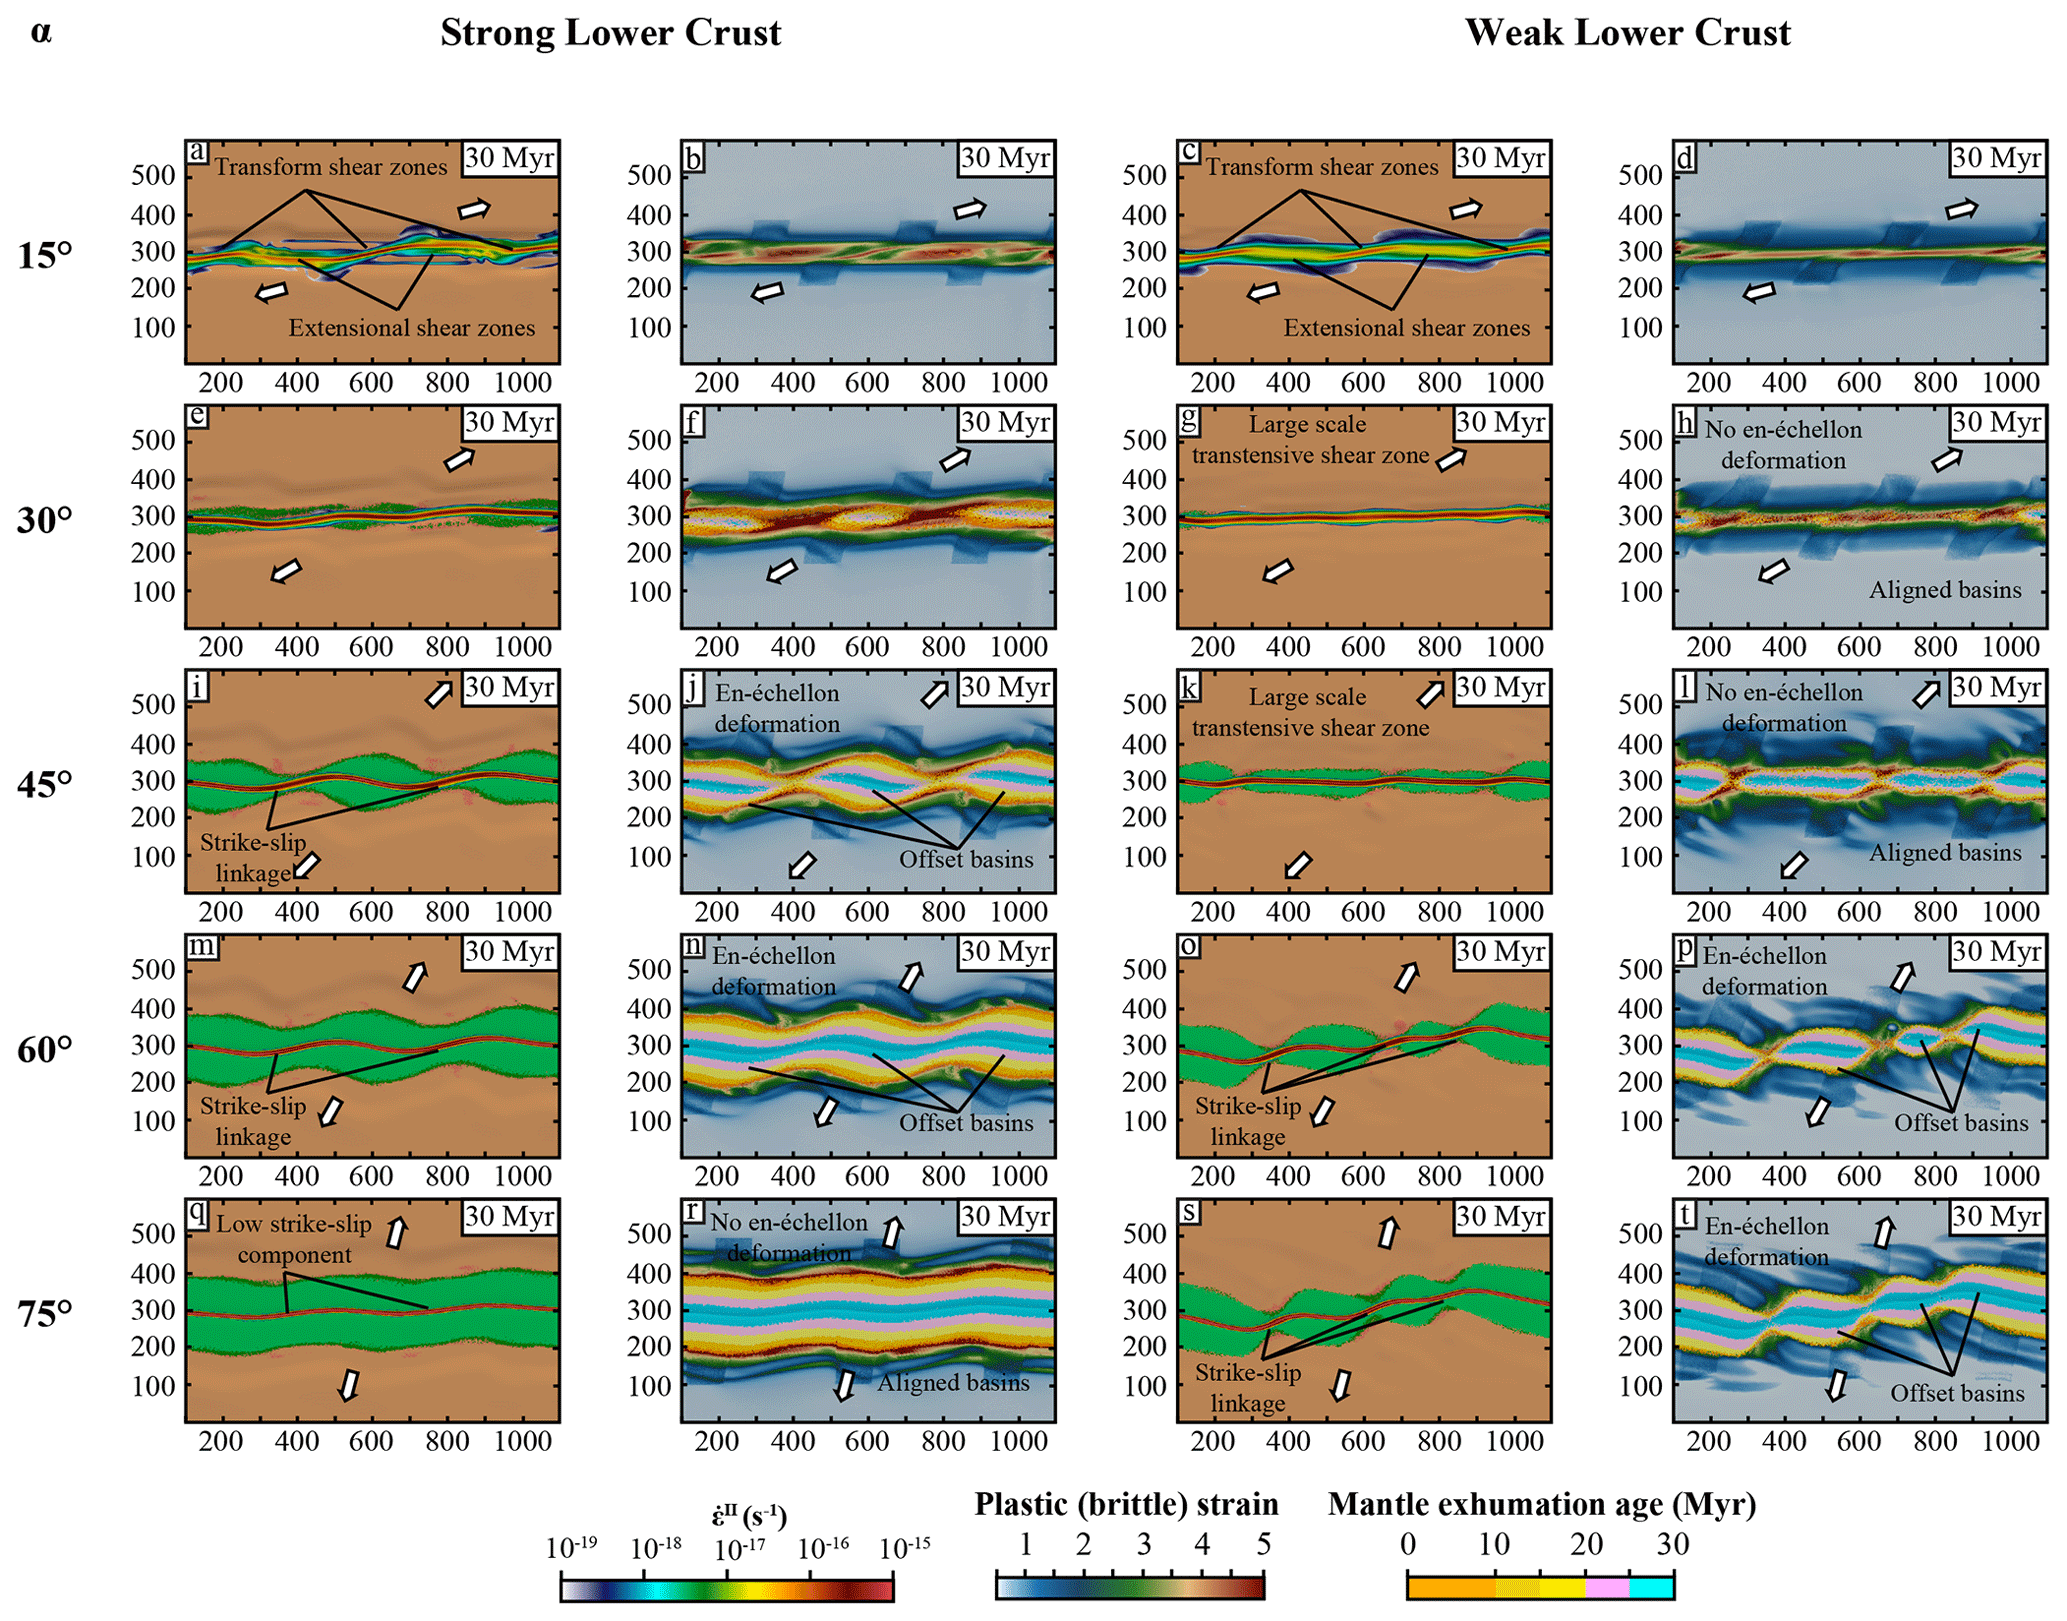
Figure 9Map view of the 2 km × 2 km × 2 km resolution models at 30 Ma. The two left columns display the strong-lower-crust models, while the two right columns display the weak-lower-crust models. For each model the second invariant of the strain rate tensor and the plastic strain and mantle exhumation age are displayed.
4.4 Effect of obliquity and rheology on strain localization and rift evolution
Figure 9 shows the results of all 2 km × 2 km × 2 km resolution simulations at 30 Ma. The models show that for the same extension direction, the rheology of the crust exerts a first-order control on the rift evolution and final margin structure. The 75∘ oblique extension models are drastically different for a strong (Fig. 9q and r) and weak lower crust (Fig. 9s and t). Although this model has only a small degree of obliquity, a weak lower crust leaves more freedom in the model for stress rotation in the crust and favours the development of individual offset basins which are linked by a transfer fault zone. This transfer fault zone results from the evolution of the en-échelon-distributed deformation that progressively localizes as described in Sect. 4.1 (Model 1). For a strong lower crust, the deformation localizes faster on fewer shear zones and basins develop with a small offset. This strain localization behaviour is different for a direction of extension of 45∘. For these simulations, the model with a strong lower crust (Fig. 9i and j) develops offset basins, while for a weak lower crust (Fig. 9k and l) basins are aligned. Finally, for high obliquity (α = 15∘) both strong- (Fig. 9a and b) and weak-lower-crust (Fig. 9c and d) models show that the strike-slip deformation drives the evolution of the rift and results in large-scale transform shear zones.
These results tend to demonstrate that in order to form large-scale strike-slip deformation that evolves into strike-slip margin segments, the early formation of offset basins is essential in cases with low to intermediate obliquity. However, in high-obliquity cases, the strike-slip deformation drives the evolution of the system as soon as the deformation starts to localize.
The modelled rift evolution shows that the deformation of the continental lithosphere takes place in three stages. The first stage corresponds to the initiation of the deformation in a rigid plate. For obliquity angles larger than 30∘ the deformation always initiates along extensional shear zones oriented sub-perpendicular to the extension direction. In contrast, for obliquity angles below 30∘ the deformation initiates along strike-slip shear zones almost parallel to the imposed velocity field vectors. This behaviour corresponds to the expected strain localization in a rigid plate. However, the second stage of deformation marks a significant change in the stress regime and strain localization. The timing for the initiation of this second stage may differ depending on the initial rheology of the lithosphere (strong and weak crust) and the angle of extension, but it is always observed. During this phase, the stress field changes and the initial shear zones start to re-orient. For angles of obliquity greater than 30∘ the strike-slip deformation takes place along transfer fault zones to link the offset basins and accommodate the oblique component of the velocity field. Rotation of former faulted blocks is the result of this stress field re-orientation at the corner between transfer fault zones and divergent segments, where lower crust exhumation may occur. For angles of obliquity lower than 30∘, the initial strike-slip deformation partitions to later form extensional shear zones that accommodate the vertical displacement. Mechanically, the rheology of the lithosphere evolves from a rigid continuous plate to a weakening domain in which the deformation localizes and temperature increases, which contributes to the weakening of the lithosphere. This deformation stage is transient and evolves to the third deformation stage, which corresponds to the formation of a new plate boundary where the deformation is highly localized and partitioned along a continuous shear zone again separating two rigid plates.

Figure 10Curves of crustal thickness in (a, g) basins, (b, h) transition zones, and (c, i) transfer and strike-slip zones for strong- and weak-lower-crust models. Curves of crustal thinning rate computed as the time derivative of crustal thickness for (d, j) basins, (e k) transition zones, and (f, l) transfer and strike-slip zones for strong- and weak-lower-crust models at different obliquities.
4.5 Lithosphere thickness evolution
Figure 10 shows the evolution through time of the crustal thickness and thinning rate for each model. Thickness evolution curves display the crustal thickness evolution in a selected zone located in a basin (i.e. where the extension is maximal), in a strike-slip transfer zone, and in the transition zone between the basin and the transfer zone. At first order, the thinning of the crust is faster in low-obliquity models than in high-obliquity models (Fig. 10). Low to intermediate oblique extension models favour the formation of extensional shear zones delimiting large basins between which strike-slip transfer zones develop, and therefore the vertical displacements are greater than the horizontal displacements. In contrast, high-obliquity extension favours the formation of long strike-slip structures between which small basins develop. In this context the horizontal motion is predominant over the vertical motion, and the thinning of the continental crust and lithosphere progresses 2 to 4 times slower than under low- and intermediate-obliquity extension for the same plate velocity. The rheology of the crust also controls the thinning rate since the deformation is more distributed in a weak crust than in a strong crust, and a longer time is necessary to achieve the same thinning of the crust.
For low- to intermediate-obliquity models (from α = 75∘ to α = 45∘) the thinning of the crust occurs in different phases related to the deformation regime of the lithosphere. The first thinning phase is fast (between 3 and 4 mm yr−1) and corresponds to the localization of extensional structures. Then, during the second phase (stress re-orientation), as the strike-slip structures start to form, the thinning of the crust slows down (between 1 and 2 mm yr−1). This slowing down is marked by a peak in the thinning rate curves. A delay can also be observed between basins and strike-slip transfer zones where achieving the same amount of thinning can take more time due to the decrease in the vertical velocity component and the increase in the horizontal one in strike-slip shear zones.
5.1 Strain localization
Modelling experiments involving oblique boundary conditions (Brune, 2014; Brune et al., 2012; this study), offset weak zones (Allken et al., 2012; Le Pourhiet et al., 2017; Zwaan et al., 2016), or oblique weak zones (Agostini et al., 2009; Ammann et al., 2017; Corti, 2012; Duclaux et al., 2020) show that strain localization in the continental lithosphere always begins as extensional structures approximately striking at half the angle of obliquity to the extension direction for angles between the extension direction and weak zones larger than ∼ 30∘. Then, as the lithosphere thins and weakens due to mechanical and thermal softening, deformation patterns evolve, and strain is partitioned between extensional and strike-slip segments. Nevertheless, the orientation of these strike-slip segments is not parallel to the imposed plate motion direction but to local variations of the velocity field. Moreover, the orientation of the tectonic structures changes through time although the global plate motion is kept constant (Brune, 2014; Duclaux et al., 2020; Jourdon et al., 2020; Philippon et al., 2015; Le Pourhiet et al., 2017). For angles of obliquity lower than ∼ 30∘ the models with oblique boundary conditions show that strike-slip deformation dominates (Withjack and Jamison, 1986) at the onset of intra-continental rifting. Then, localization leads to strain partitioning between pure strike-slip shear zones and extensional shear zones, accommodating a small amount of vertical motion and promoting crustal thinning. However, in these highly oblique cases, the vertical motion is very low and the continental lithosphere thins 2 times slower than for the same velocity with lower obliquity (Fig. 10) (e.g. Brune et al., 2018). Among the models involving cylindrical boundary conditions but offset or oblique weak zones, this degree of obliquity is never reached due to the free-slip boundary condition. Except in the presence of very efficient mechanical softening processes (Ammann et al., 2017), two rifts develop and never link (e.g. Le Pourhiet et al., 2017). Therefore, to study systems with very high obliquity, models need to take into account limitations associated with the boundary conditions they use.
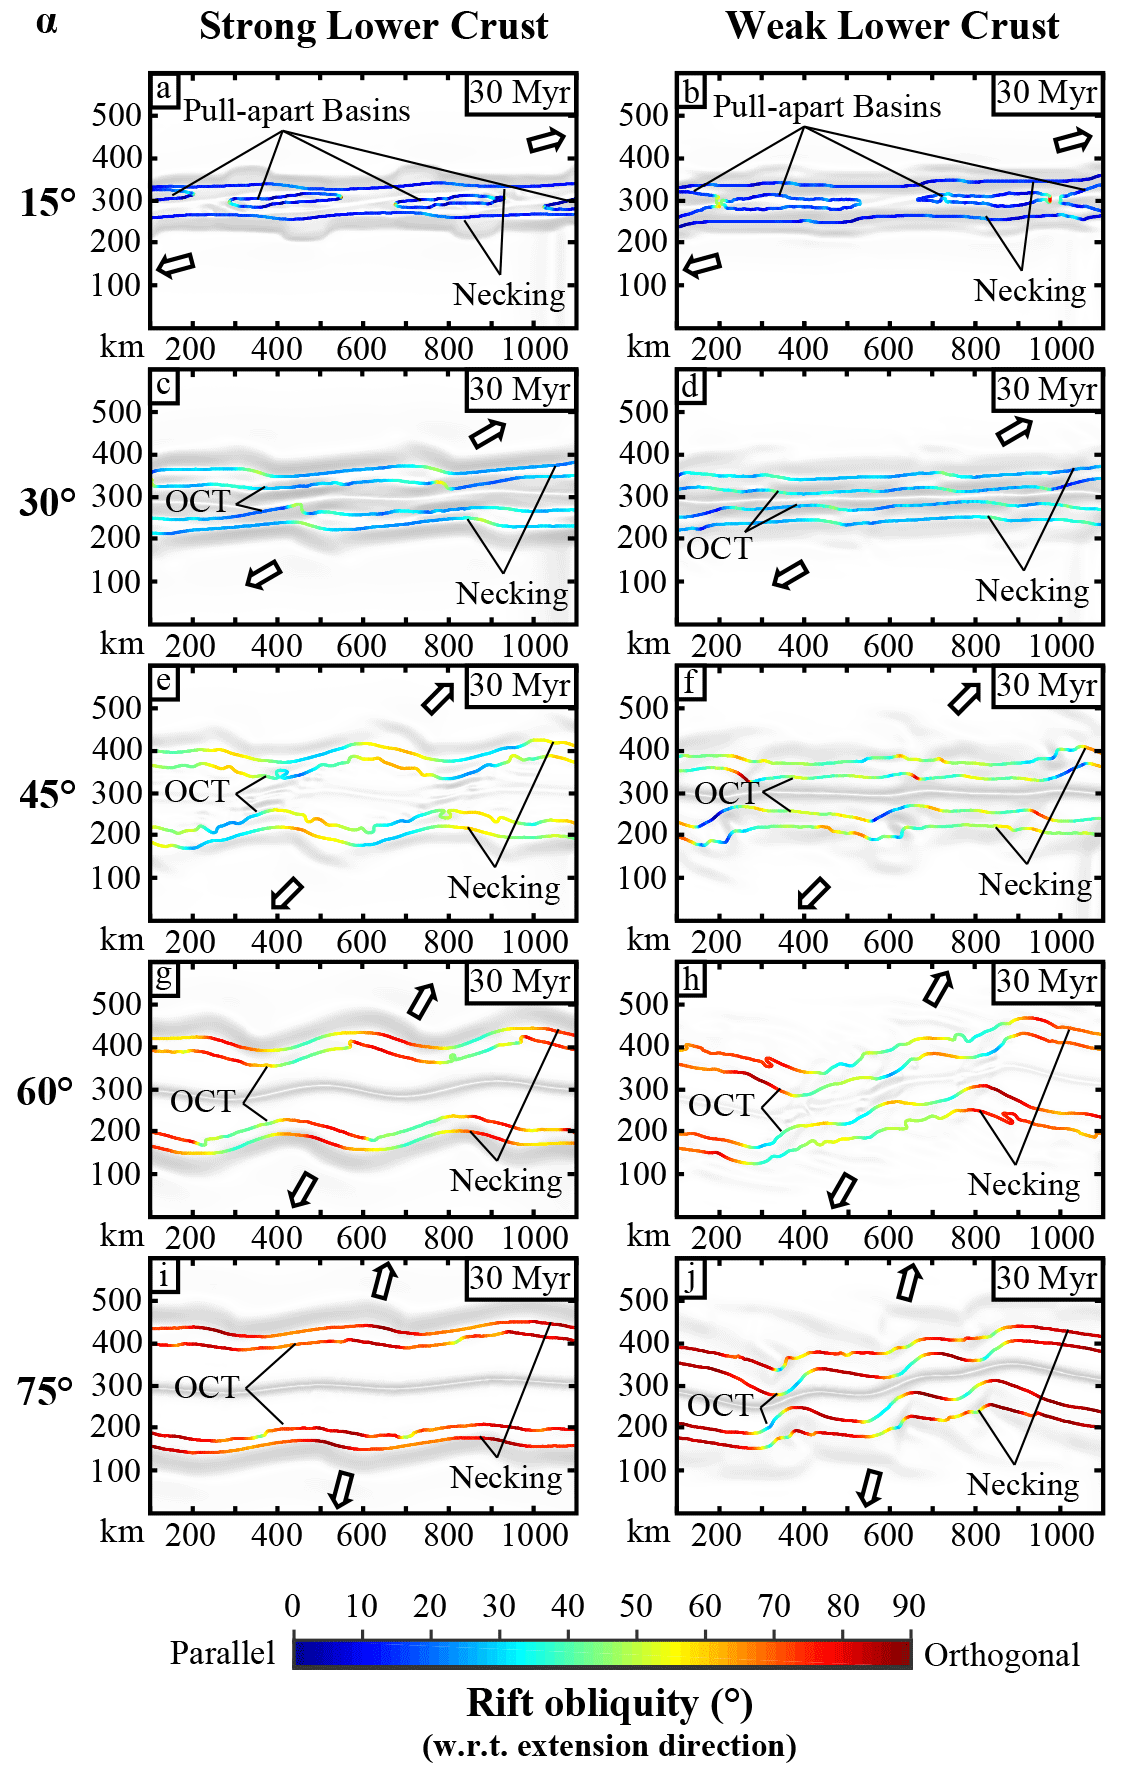
Figure 11Map view of each model representing the angle of the ocean–continent transition (OCT) and the necking zone with respect to the extension direction. The background represents the topography with hill shading. Models with α = 15∘ and 45∘ with a strong lower crust and the model α = 60∘ with a weak lower crust are high-resolution models (models 1, 2, and 3).
5.2 Obliquity and offset structures
Brune et al. (2012, 2018) and Heine and Brune (2014) showed that oblique rifting requires less force than cylindrical rifting during the deformation of the continental lithosphere. However, transform and strike-slip margins do not represent the majority of non-convergent margins (Mercier de Lépinay et al., 2016). Models suggest that the formation of offset structures is essential for producing the association of strike-slip or transform segments and divergent segments (e.g. Allken et al., 2012; Ammann et al., 2017; Duclaux et al., 2020; Le Pourhiet et al., 2017; Zwaan et al., 2016). Although the formation of offset structures is intrinsic in models involving offset or oblique weak zones and cylindrical boundary conditions, with oblique boundary conditions the deformation does not necessarily develop offset basins linked by strike-slip shear zones (Brune, 2014; Brune et al., 2012). Thermo-mechanical numerical models involving oblique boundary conditions applied to a uniform lithosphere with one straight weak zone (Brune, 2014; Brune et al., 2012) show that the deformation localizes to progressively form a unique straight shear zone and straight margins. However, the resolution of these experiments was 3 times lower (in each spatial direction) than in our study, which also contributes to different strain localization patterns. Models conducted in this study have the same oblique boundary conditions but present three separated weak zones rather than a continuous one. These weak zones allow more freedom for structures to develop inside the model and favour the localization of offset structures. For low to intermediate obliquity, they favour the formation of offset basins, while for high obliquity they favour the formation of offset strike-slip shear zones. As shown in Fig. 9, the offset between structures is essential to facilitate strain partitioning and to form divergent and strike-slip segments. In models in which basins form aligned with each other, only one straight transtensional shear zone develops, whereas in basins (or strike-slip structures) that form with an offset, the deformation partitions between divergent and strike-slip segments (Fig. 11). A first-order implication of this result is that although oblique rifting may be ubiquitous (Brune et al., 2018; Philippon and Corti, 2016) structural inheritance and previous geodynamic events should play an important role in the initial localization pattern of offset structures and therefore transform margins.
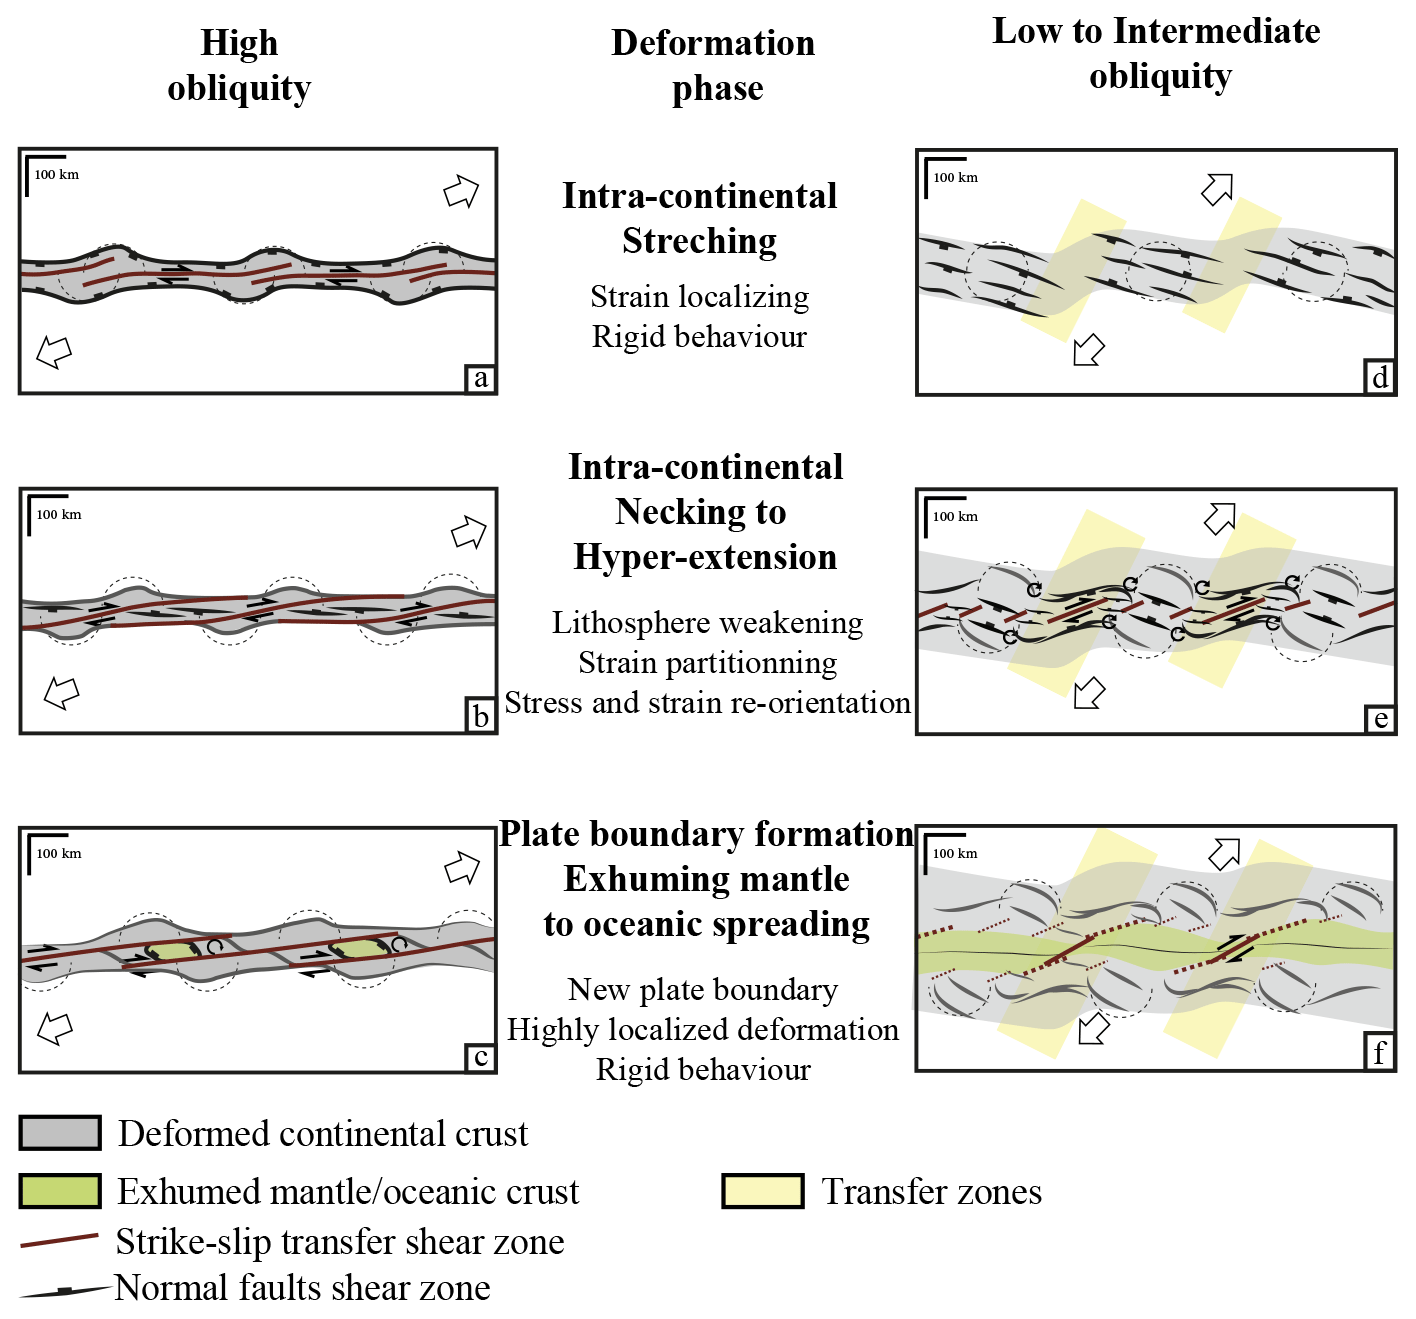
Figure 12Schematic showing the simplified evolution of intra-continental deformation leading to the formation of strike-slip and transform margins for high and intermediate to low obliquity based on numerical model results.
5.3 Transform and strike-slip margins
The kinematic conceptual model currently used to interpret and reconstruct the formation of transform margins (e.g. Basile, 2015; Mascle and Blarez, 1987) has already been questioned by thermo-mechanical models (e.g. Le Pourhiet et al., 2017). Indeed, our results show that during the intra-continental oblique rifting phase, the lithosphere does not behave solely as a rigid plate; shear structures are dynamic, and the deformation pattern changes as deformation progresses. The continental lithosphere rheology evolves through time in favour of mechanical and thermal softening (Fig. 12). Therefore, especially for an obliquity angle greater than 30∘, it is highly unlikely that transform margins initiate from an already segmented ridge–transform fault–ridge system, but rather emerge from the progressive evolution of the stress field coupled with local heterogeneities in the lithosphere. Moreover, although the definition that a transform fault is a strike-slip fault forming a plate boundary parallel to the plate relative motion, analogue and numerical models suggest that except for high obliquities, the strike-slip transfer zones formed during continental extension are not necessarily parallel to the global plate motion (Fig. 11) but to the local velocity field, which contrasts with oceanic transform faults that form parallel to the plate motion (Gerya, 2012, 2013). On the one hand, for intermediate- to low-obliquity cases (45∘ to 75∘), the modelled margins that develop strain partitioning display divergent segments oriented between 90∘ (orthogonal) and 60∘ and strike-slip segments oriented between 20∘ and 50∘ with respect to the imposed extension direction (Fig. 11e to 11g). These margins present the first-order characteristics of transform margins. Indeed, they display offset basins, strike-slip and divergent segments, and rotation of the tectonic structures in the (inner or outer corner) concave and convex transition zones between the strike-slip and the divergent margins. On the other hand, high-obliquity margins develop strike-slip faults parallel to the global relative plate motion. The rift system is no longer segmented in basins and transfer shear zones but displays pull-apart basins oriented between 0∘ and 30∘ with respect to the extension direction (Fig. 11a to 11d). Highly oblique systems also have very low extension rates (Fig. 10), a rather cold lithosphere (1300 ∘C isotherm at 120 km, while the crust is only a few kilometres thick), and small length–large width basins. Our numerical models show that even a small amount of obliquity in the extension direction can result in important obliquity of the rift structures and trend (Fig. 11) and therefore corroborate the finding that “oblique rifting [is] the rule not the exception” (Brune et al., 2018).
Figure 1 shows natural examples of transform margins formed at different obliquities and presenting very different structures. The numerical models presented in this study are not specifically designed for particular natural rifts, especially in terms of imposed velocities or tectonic inheritances. For low- to intermediate-obliquity rift, the extension rates in the models represent an average of the natural rifting velocity during the evolution of the system. However, for high-obliquity systems like the Gulf of California, the extension rates in the models are ∼ 5 times lower. As a consequence, the relatively cold temperature shown in the high-obliquity models might be higher in natural systems and could accelerate the strain localization processes. However, they share first-order similarities with natural oblique rift systems.
The Gulf of California shows a rift system with small basins segmented by large-scale strike-slip faults and dynamics very similar to high-obliquity extension models. In contrast, the equatorial Atlantic displays large oceanic basins surrounded by continental margins showing alternating strike-slip transfer zones linking long divergent segments (hundreds of kilometres). The African and South American margins clearly share more similarities with intermediate oblique extension models than highly oblique ones.
6.1 Intermediate-obliquity rift systems
The equatorial Atlantic margins represent a historic natural case for which the conceptual and kinematic models of transform margins have been established (Basile, 2015; Mascle and Blarez, 1987). The equatorial Atlantic is part of a larger-scale rifting system that led to Gondwana fragmentation and individual offset basins connected by transform faults during the Mesozoic. Continental margins emerging from this major extensional event display individual offset basins connected by transform faults such as the Mozambique–East Antarctica margins (e.g. Thompson et al., 2019), the central Atlantic margins (e.g. Schettino and Turco, 2009), and the equatorial Atlantic margins (e.g. Heine et al., 2013). Kinematic reconstructions of the equatorial Atlantic opening succeed in reconstructing the oceanic opening phase but present gaps, overlaps, and misfits of major structures and cratonic bodies for the intra-continental rifting phase. These errors mainly come from the non-rigid behaviour of the lithosphere and the locally varying velocity field that cannot be produced in kinematic models. Indeed, our models show that during the intra-continental rifting phase, the stress field, and therefore the associated structures, strongly varies along the rift. However, these variations are not due to changes in plate kinematics, as the imposed velocity boundary condition is constant in our models, but to a change in the rheological behaviour of the continental lithosphere. Indeed, while the continental lithosphere behaves as a rigid plate when the deformation is localized along its plate boundaries, the intra-plate strain localization process is characterized by interactions between brittle and ductile domains of the lithosphere. Moreover, the crustal and lithospheric thinning allows advecting warm material from the exhuming mantle, intensifying the non-rigid behaviour of the lithosphere by increasing the intensity of ductile deformation. Numerical models show that it is precisely during this intra-continental rifting phase that strike-slip structures form and that rotation of early structures occurs (Fig. 12e) (e.g. Duclaux et al., 2020; Neuharth et al., 2021).
In the equatorial Atlantic rift system, two offset basins (the central Atlantic basin to the northwest and the South Atlantic basin to the southeast) connect in the future central Atlantic basin, forming an east stepping system of dextral strike-slip fault zones (e.g. Heine et al., 2013).
Along the Romanche transform fault (Fig. 1b), the finite deformation shows pull-apart basins with various fault orientations and isolated rotated blocks (e.g. Davison et al., 2016; Mascle and Blarez, 1987). Numerical models especially display structure rotation at the junction between divergent segments and transfer strike-slip shear zones. The rotation of tilted blocks associated with a horsetail splay is also observed at the junction between transform and divergent plate boundaries in analogue experiments (e.g. Basile and Brun, 1999).
Finally, the continental deformation along the Romanche transform fault zone is not a single highly localized strike-slip fault but constitutes a deformation corridor 40 to 70 km wide in which normal faults, reverse faults, strike-slip faults, or a combination of these are present (Basile et al., 1993; Nemčok et al., 2012). This wide deformation zone, in which a main strike-slip structure finally localizes well, illustrates the progressive strain localization process as shown in numerical models.
6.2 High-obliquity rift systems
The Gulf of California represents the most compelling example of a highly oblique rift system. Located south of the dextral San Andreas Fault system, the Gulf of California is an active plate boundary formed in response to the relative motion between the Pacific and North America plates of ∼ 5 mm a−1 (Plattner et al., 2007). At ∼ 12 Ma, subduction beneath Baja California ceased. A major change in plate kinematics occurred and a system of highly oblique extension was established as the current plate boundary localized in the Gulf of California at ∼ 8–6 Ma (Atwater and Stock, 1998; DeMets and Merkouriev, 2016; Lizarralde et al., 2007; McKenzie and Morgan, 1969). The structural analysis performed on faults and shear zones shows that the average angle between the rift system and the extension direction is ∼ 20∘ (e.g. Bonini et al., 2019). Moreover, the general trend of normal fault strike in the continental margin shows a NNW orientation, while the strike-slip faults display a NW–SE strike, indicating a ∼ 20∘ difference in orientation. In the deep basins of the northern Gulf of California (where the basement is likely composed of serpentinized mantle; e.g. van Wijk et al., 2019), oblique-slip faults strike NNE–SSW, perpendicular to the strike-slip faults (Persaud et al., 2003). Several models were proposed to interpret the changes in the surface geology through time and space in the Gulf of California from ∼ 12 Ma to the present. These models involve two end-members, one implying a progressive change in the deformation regime firstly dominated by extension (between 12 and 6 Ma) and followed by dextral shear (from 6 Ma to the present) (e.g. Darin et al., 2016; Spencer and Normark, 1979; Stock and Hodges, 1989) and the other implying a coexistence of strike-slip faults and normal faults since ∼ 12 Ma (e.g. Fletcher et al., 2007; Seiler et al., 2010).
The high-obliquity numerical model (extension angle α = 15∘) shows striking first-order similarities to the Gulf of California rift system and may bring new insights regarding the strain localization in highly oblique rifts such as the Gulf of California. For constant boundary conditions (1 cm a−1, 15∘ obliquity) the strain localizes along normal shear zones, forming a ∼ 15∘ angle with the extension direction located at the boundaries of the rift system, while in its central part a large-scale strike-slip shear zone develops. The deformation regime then evolves to transtension and forms pull-apart basins separated by strike-slip shear zones parallel to the plate motion (e.g. Farangitakis et al., 2021; Persaud et al., 2017; van Wijk et al., 2017). The system then reaches a stable partitioned state with large transform faults in the central part of the rift separating pull-apart basins and normal faults on the edges parallel to the rift trend. Moreover, the high obliquity favours horizontal strike-slip motion over vertical motion, resulting in a dextral displacement of 200 km, while break-up has still not occurred. In the Gulf of California the strike-slip motion since the Miocene (∼ 12 Ma) represents roughly 200 to 300 km (DeMets and Merkouriev, 2016; Stock and Hodges, 1989) depending on whether the northern or central gulf is considered, also including the Gulf of California Shear Zone in the slip budget (e.g. Bonini et al., 2019).
Therefore, the numerical model tends to show that the deformation could be partitioned since the onset of highly oblique continental rifting, but with a first phase of predominant extension preserved in the continental margin as well as predominant dextral shear in the nascent oceanic–exhumed mantle domain (Fig. 12a) and a second phase of predominant dextral deformation with pull-apart basins in between (Fig. 12b) followed by the rotation of extensional structures (Fig. 12c).
Numerical models presented in this study show the following.
-
The strike-slip faults responsible for transform margin formation do not form parallel to the plate motion except for highly oblique extension (α > 30∘).
-
En-échelon deformation and offset basins are required to develop strike-slip linkage shear zones evolving into transform margins.
-
Localized strike-slip shear zones form after normal faults once the lithosphere is already thermally and mechanically weakened.
-
The lithosphere weakening leads to stress and strain re-orientation under same kinematic boundary conditions.
To model the deformation of the lithosphere at geological timescales we use pTatin3D (May et al., 2014, 2015). The code uses an arbitrary Lagrangian–Eulerian (ALE) discretization with the material point method to solve the conservation of momentum:
where η is the non-linear effective viscosity, the strain rate tensor, P the pressure, ρ the density, and g the gravity acceleration vector. The conservation of mass is solved for an incompressible fluid:
with v as the velocity vector.
To consider the interactions between deformation and temperature, the Stokes flow is coupled with the time-dependent advection–diffusion energy conservation law:
where T is the temperature, v the velocity vector of the fluid, κ the thermal diffusivity, and Cp is the heat capacity. The heat source H is the sum of the radiogenic heat production (Eq. 2 in the main text) and the shear heating heat production Hs:
According to the Boussinesq approximation the material density may vary with pressure and temperature as
where ρ0 is the initial material density, α the thermal expansion coefficient, and β the compressibility.
To solve the Stokes flow we use Q2–P1 elements, while the energy conservation is solved with a Q1 discretization. The top boundary of the domain is defined with a free-surface boundary condition evolving dynamically with the deformation.
Rheological model
The mechanical behaviour of the lithosphere at geological timescales is simulated with a visco-plastic rheology. The brittle parts of the lithosphere are simulated with the Drucker–Prager pseudo-plastic yield criterion adapted to continuum mechanics:
where C is the cohesion (20 MPa), ϕ the friction coefficient, P the pressure, and the second invariant of the strain rate tensor. To simulate the mechanical softening in brittle faults, we apply a simple linear decrease in the friction angle from 30∘ to 5∘ with accumulated plastic strain from 0 to 1 (Eq. 3 in main text). Moreover, laboratory experiments show that under high confining pressures (> 1 GPa) rocks no longer behave as brittle but as plastic materials (e.g. Kameyama et al., 1999; Precigout et al., 2007). To consider that change we limit the Drucker–Prager yield stress to a maximum deviatoric stress of 400 MPa according to the findings in Watremez et al. (2013).
The ductile deformation is modelled with the Arrhenius flow law for dislocation creep:
where A, n, and Q are material-dependent parameters (see Table 1), R is the gas constant, and V is the activation volume.
Models in this study were produced with pTatin (May et al., 2014, 2015), an open-source code for geodynamics modelling publicly available at https://bitbucket.org/ptatin/ptatin3d/src/master/.
The supplement related to this article is available online at: https://doi.org/10.5194/se-12-1211-2021-supplement.
AJ designed, ran, and post-processed the models, wrote the paper, and produced the figures. CK and GD contributed to results discussion and interpretation, figure production, and writing of the paper. CH contributed to the conceptualization of the study.
Three of the authors were or are employed by the energy company TOTAL S.A. Model computing was done on TOTAL's Pangea supercomputer.
We thank the two reviewers, Patricia Persaud and Sascha Brune, for their constructive reviews, which contributed to improving the paper. We also thank the editor Susanne Buiter for considering our work.
This paper was edited by Susanne Buiter and reviewed by Sascha Brune and Patricia Persaud.
Agostini, A., Corti, G., Zeoli, A., and Mulugeta, G.: Evolution, pattern, and partitioning of deformation during oblique continental rifting: Inferences from lithospheric-scale centrifuge models, Geochem. Geophy. Geosy., 10, 11, https://doi.org/10.1029/2009GC002676, 2009.
Allken, V., Huismans, R. S., and Thieulot, C.: Factors controlling the mode of rift interaction in brittle-ductile coupled systems: A 3D numerical study, Geochem. Geophy. Geosy., 13, 1–18, https://doi.org/10.1029/2012GC004077, 2012.
Ammann, N., Liao, J., Gerya, T., and Ball, P.: Oblique continental rifting and long transform fault formation based on 3D thermomechanical numerical modeling, Tectonophysics, 746, 106–120, https://doi.org/10.1016/j.tecto.2017.08.015, 2017.
Atwater, T. and Stock, J.: Pacific North America plate tectonics of the Neogene southwestern United States: an update, Int. Geol. Rev., 40, 375–402, https://doi.org/10.1080/00206819809465216, 1998.
Basile, C.: Tectonophysics Transform continental margins – part 1: Concepts and models, Tectonophysics, 661, 1–10, https://doi.org/10.1016/j.tecto.2015.08.034, 2015.
Basile, C. and Brun, J. P.: Transtensional faulting patterns ranging from pull-apart basins to transform continental margins: An experimental investigation, J. Struct. Geol., 21, 23–37, https://doi.org/10.1016/S0191-8141(98)00094-7, 1999.
Basile, C., Mascle, J., Popoff, M., Bouillin, J. P., and Mascle, G.: The Ivory Coast-Ghana transform margin: a marginal ridge structure deduced from seismic data, Tectonophysics, 222, 1–19, 1993.
Basile, C., Maillard, A., Patriat, M., Gaullier, V., Loncke, L., Roest, W., Mercier de Lépinay, M., and Pattier, F.: Structure and evolution of the demerara plateau, offshore french guiana: Rifting, tectonic inversion and post-rift tilting at transform-divergent margins intersection, Tectonophysics, 591, 16–29, https://doi.org/10.1016/j.tecto.2012.01.010, 2013.
Bellahsen, N., Leroy, S., Autin, J., Razin, P., d'Acremont, E., Sloan, H., Pik, R., Ahmed, A., and Khanbari, K.: Pre-existing oblique transfer zones and transfer/transform relationships in continental margins: New insights from the southeastern Gulf of Aden, Socotra Island, Yemen, Tectonophysics, 607, 32–50, https://doi.org/10.1016/j.tecto.2013.07.036, 2013.
Bonini, M., Cerca, M., Moratti, G., López-Martínez, M., Corti, G., and Gracia-Marroquín, D.: Strain partitioning in highly oblique rift settings: Inferences from the southwestern margin of the Gulf of California (Baja California Sur, México), Tectonics, 38, 4426–4453, https://doi.org/10.1029/2019TC005566, 2019.
Brune, S.: Evolution of stress and fault patterns in oblique rift systems: 3-D numerical lithospheric-scale experiments from rift to breakup, Geochem. Geophy. Geosy., 15, 3392–3415, https://doi.org/10.1002/2014GC005446, 2014.
Brune, S. and Autin, J.: The rift to break-up evolution of the Gulf of Aden: Insights from 3D numerical lithospheric-scale modelling, Tectonophysics, 607, 65–79, https://doi.org/10.1016/j.tecto.2013.06.029, 2013.
Brune, S., Popov, A. A., and Sobolev, S. V: Modeling suggests that oblique extension facilitates rifting and continental break-up, J. Geophys. Res., 117, 1–16, https://doi.org/10.1029/2011JB008860, 2012.
Brune, S., Corti, G., and Ranalli, G.: Controls of inherited lithospheric heterogeneity on rift linkage: Numerical and analog models of interaction between the Kenyan and Ethiopian rifts across the Turkana depression, Tectonics, 36, 1767–1786, https://doi.org/10.1002/2017TC004739, 2017.
Brune, S., Williams, S. E., and Müller, R. D.: Oblique rifting: the rule, not the exception, Solid Earth, 9, 1187–1206, https://doi.org/10.5194/se-9-1187-2018, 2018.
Buchmann, T. J. and Connolly, P. T.: Contemporary kinematics of the Upper Rhine Graben: A 3D finite element approach, Global Planet. Change, 58, 287–309, https://doi.org/10.1016/j.gloplacha.2007.02.012, 2007.
Clifton, A. E., Schlische, R. W., Withjack, M. O., and Ackermann, R. V.: Influence of rift obliquity on fault-population systematics: Results of experimental clay models, J. Struct. Geol., 22, 1491–1509, https://doi.org/10.1016/S0191-8141(00)00043-2, 2000.
Corti, G.: Tectonophysics Evolution and characteristics of continental rifting: Analog modeling-inspired view and comparison with examples from the East African Rift System, Tectonophysics, 522–523, 1–33, https://doi.org/10.1016/j.tecto.2011.06.010, 2012.
Darin, M. H., Bennett, S. E. K., Dorsey, R. J., Oskin, M. E., and Iriondo, A.: Late Miocene extension in coastal Sonora, México: Implications for the evolution of dextral shear in the proto-Gulf of California oblique rift, Tectonophysics, 693, 378–408, https://doi.org/10.1016/j.tecto.2016.04.038, 2016.
Davison, I., Faull, T., Greenhalgh, J., Beirne, E. O., and Steel, I.: Transpressional structures and hydrocarbon potential along the Romanche Fracture Zone: a review, Geol. Soc. London Spec. Publ., 431, 235–248, https://doi.org/10.1144/SP431.2, 2016.
Delvaux, D., Moeys, R., Stapel, G., Petit, C., Levi, K., Miroshnichenko, A., Ruzhich, V., and San'kov, V.: Paleostress reconstructions and geo- dynamics of the Baikal region, Central Asia, Part 2. Cenozoic rifting, Tectonophysics, 282, 1–38, https://doi.org/10.1016/S0040-1951(97)00210-2, 1997.
DeMets, C. and Merkouriev, S.: High-resolution reconstructions of Pacific-North America plate motion: 20 Ma to present, Geophys. J. Int., 207, 741–773, https://doi.org/10.1093/gji/ggw305, 2016.
Duclaux, G., Huismans, R. S., and May, D. A.: Rotation, narrowing, and preferential reactivation of brittle structures during oblique rifting, Earth Planet. Sc. Lett., 531, 115952, https://doi.org/10.1016/j.epsl.2019.115952, 2020.
Farangitakis, G. P., McCaffrey, K. J. W., Willingshofer, E., Allen, M. B., Kalnins, L. M., van Hunen, J., Persaud, P., and Sokoutis, D.: The structural evolution of pull-apart basins in response to changes in plate motion, Basin Res., 33, 1603–1625, https://doi.org/10.1111/bre.12528, 2021.
Ferrari, L., Orozco-Esquivel, T., Bryan, S. E., López-Martínez, M., and Silva-Fragoso, A.: Cenozoic magmatism and extension in western Mexico: Linking the Sierra Madre Occidental silicic large igneous province and the Comondú Group with the Gulf of California rift, Earth-Sci. Rev., 183, 115–152, https://doi.org/10.1016/j.earscirev.2017.04.006, 2018.
Fletcher, J. M., Grove, M., Kimbrough, D., Lovera, O., and Gehrels, G. E.: Ridge-trench interactions and the Neogene tectonic evolution of the Magdalena shelf and southern Gulf of California: Insights from detrital zircon U-Pb ages from the Magdalena fan and adjacent areas, Bull. Geol. Soc. Am., 119, 1313–1336, https://doi.org/10.1130/B26067.1, 2007.
Gerya, T.: Origin and models of oceanic transform faults, Tectonophysics, 522–523, 34–54, https://doi.org/10.1016/j.tecto.2011.07.006, 2012.
Gerya, T. and Burov, E.: Nucleation and evolution of ridge-ridge-ridge triple junctions: Thermomechanical model and geometrical theory, Tectonophysics, 746, 83–105, https://doi.org/10.1016/j.tecto.2017.10.020, 2018.
Gerya, T. V.: Three-dimensional thermomechanical modeling of oceanic spreading initiation and evolution, Phys. Earth Planet. In., 214, 35–52, https://doi.org/10.1016/j.pepi.2012.10.007, 2013.
Heine, C. and Brune, S.: Oblique rifting of the equatorial atlantic: Why there is no saharan atlantic ocean, Geology, 42, 211–214, https://doi.org/10.1130/G35082.1, 2014.
Heine, C., Zoethout, J., and Müller, R. D.: Kinematics of the South Atlantic rift, Solid Earth, 4, 215–253, https://doi.org/10.5194/se-4-215-2013, 2013.
Hergert, T. and Heidbach, O.: Geomechanical model of the Marmara Sea region—II. 3-D contemporary background stress field, Geophys. J. Int., 185, 1090–1102, https://doi.org/10.1111/j.1365-246X.2011.04992.x, 2011.
Hirth, G. and Kohlstedt, D. L.: Rheology of the Upper Mantle and the Mantle Wedge: A View from the Experimentalists, Geophys. Monogr. Ser., 138, 83–105, 2003.
Jourdon, A., Le Pourhiet, L., Mouthereau, F., and May, D.: Modes of Propagation of Continental Breakup and Associated Oblique Rift Structures, J. Geophys. Res.-Sol. Ea., 125, 1–27, https://doi.org/10.1029/2020JB019906, 2020.
Kameyama, M., Yuen, D. A., and Karato, S.: Thermal-mechanical effects of low-temperature plasticity (the Peierls mechanism) on the deformation of a viscoelastic shear zone, Earth Planet. Sc. Lett., 168, 159–172, 1999.
Langemeyer, S. M., Lowman, J. P., and Tackley, P. J.: Global mantle convection models produce transform offsets along divergent plate boundaries, Communications Earth & Environment, 2, 1–10, https://doi.org/10.1038/s43247-021-00139-1, 2021.
Le Calvez, J. and Vendeville, B.: Experimental designs to model along-strike fault interaction fault interaction, Journal of the Virtual Explorer, 7, 1–17, https://doi.org/10.3809/jvirtex.2002.00043, 2002.
Le Pourhiet, L., May, D. A., Huille, L., Watremez, L., and Leroy, S.: A genetic link between transform and hyper-extended margins, Earth Planet. Sc. Lett., 465, 184–192, https://doi.org/10.1016/j.epsl.2017.02.043, 2017.
Le Pourhiet, L., Chamot-Rooke, N., Delescluse, M., May, D. A., Watremez, L., and Pubellier, M.: Continental break-up of the South China Sea stalled by far-field compression, Nat. Geosci., 11, 605–609, https://doi.org/10.1038/s41561-018-0178-5, 2018.
Liao, J. and Gerya, T.: From continental rifting to sea fl oor spreading: Insight from 3D thermo-mechanical modeling, Gondwana Res., 28, 1329–1343, https://doi.org/10.1016/j.gr.2014.11.004, 2015.
Lizarralde, D., Axen, G. J., Brown, H. E., Fletcher, J. M., González-Fernández, A., Harding, A. J., Holbrook, W. S., Kent, G. M., Paramo, P., Sutherland, F., and Umhoefer, P. J.: Variation in styles of rifting in the Gulf of California, Nature, 448, 466–469, https://doi.org/10.1038/nature06035, 2007.
Lorenzo, J. M. and Vera, E. E.: Thermal uplift and erosion across the continent-ocean transform boundary of the southern Exmouth Plateau, Earth Planet. Sc. Lett., 108, 79–92, https://doi.org/10.1016/0012-821X(92)90061-Y, 1992.
Mart, Y. and Dauteuil, O.: Analogue experiments of propagation of oblique rifts, Tectonophysics, 316, 121–132, 2000.
Mascle, J. and Blarez, E.: Evidence for transform margin evolution from the Ivory Coast–Ghana continental margin, Nature, 326, 378–381, 1987.
May, D. A., Brown, J., and Le Pourhiet, L.: pTatin3D: High-Performance Methods for Long-Term Lithospheric Dynamics, in: Proceeding SC'14 Proc. Int. Conf. High Perform. Comput. Networking, Storage Anal., SC14, 16–21 November 2014, New Orleans, 274–284, 2014.
May, D. A., Brown, J., and Le Pourhiet, L.: A scalable, matrix-free multigrid preconditioner for finite element discretizations of heterogeneous Stokes flow, Comput. Methods Appl. Mech. Eng., 290, 496–523, https://doi.org/10.1016/j.cma.2015.03.014, 2015 (code available at: https://bitbucket.org/ptatin/ptatin3d/src/master/, last access: 27 May 2021).
McKenzie, D. and Morgan, W. J.: Evolution of Triple Junctions, Nature, 224, 125–133, https://doi.org/10.1038/224125a0, 1969.
Mercier de Lépinay, M., Loncke, L., Basile, C., Roest, W. R., Patriat, M., Maillard, A., and De Clarens, P.: Transform continental margins – Part 2: A worldwide review, Tectonophysics, 693, 96–115, https://doi.org/10.1016/j.tecto.2016.05.038, 2016.
Milani, E. J. and Davison, I.: Basement control and transfer tectonics in the Recôncavo-Tucano-Jatobá rift, Northeast Brazil, Tectonophysics, 154, 41–70, https://doi.org/10.1016/0040-1951(88)90227-2, 1988.
Mondy, L. S., Rey, P. F., Duclaux, G., and Moresi, L.: The role of asthenospheric flow during rift propagation and breakup, Geology, 46, 103–106, 2018.
Nemčok, M., Sinha, S. T., Stuart, C. J., Welker, C., Choudhuri, M., Sharma, S. P., Misra, A. A., Sinha, N., and Venkatraman, S.: East Indian margin evolution and crustal architecture: integration of deep reflection seismic interpretation and gravity modelling, Geol. Soc. London Spec. Publ., 369, 477–496, https://doi.org/10.1144/SP369.6, 2012.
Neuharth, D., Brune, S., Glerum, A., Heine, C., and Welford, J. K.: Formation of continental microplates through rift linkage: Numerical modelling and its application to the Flemish Cap and Sao Paulo Plateau, Geochem. Geophy. Geosy., 22, e2020GC009615, https://doi.org/10.1029/2020gc009615, 2021.
Parsiegla, N., Stankiewicz, J., Gohl, K., Ryberg, T., and Uenzelmann-Neben, G.: Southern African continental margin: Dynamic processes of a transform margin, Geochem. Geophy. Geosy., 10, 3, https://doi.org/10.1029/2008GC002196, 2009.
Persaud, P., Stock, J. M., Steckler, M. S., Martín-Barajas, A., Diebold, J. B., González-Fernández, A., and Mountain, G. S.: Active deformation and shallow structure of the Wagner, Consag, and Delfín Basins, northern Gulf of California, Mexico, J. Geophys. Res.-Sol. Ea., 108, 2355, https://doi.org/10.1029/2002jb001937, 2003.
Persaud, P., Tan, E., Contreras, J., and Lavier, L.: A bottom-driven mechanism for distributed faulting in the Gulf of California rift, Tectonophysics, 719–720, 51–65, https://doi.org/10.1016/j.tecto.2016.11.024, 2017.
Philippon, M. and Corti, G.: Obliquity along plate boundaries, Tectonophysics, 693, 171–182, https://doi.org/10.1016/j.tecto.2016.05.033, 2016.
Philippon, M., Willingshofer, E., Sokoutis, D., Corti, G., Sani, F., Bonini, M., and Cloetingh, S.: Slip re-orientation in oblique rifts, Geology, 43, 147–150, https://doi.org/10.1130/G36208.1, 2015.
Plattner, C., Malservisi, R., Dixon, T. H., Lafemina, P., Sella, G. F., Fletcher, J., and Suarez-Vidal, F.: New constraints on relative motion between the Pacific Plate and Baja California microplate (Mexico) from GPS measurements, Geophys. J. Int., 170, 1373–1380, https://doi.org/10.1111/j.1365-246X.2007.03494.x, 2007.
Precigout, J., Gueydan, F., Gapais, D., Garrido, C. J., and Essaifi, A.: Strain localisation in the subcontinental mantle — a ductile alternative to the brittle mantle, Tectonophysics, 445, 318–336, https://doi.org/10.1016/j.tecto.2007.09.002, 2007.
Ranalli, G. and Murphy, D. C.: Rheological stratification of the lithosphere, Tectonophysics, 132, 281–295, 1987.
Rybacki, E. and Dresen, G.: Dislocation and diffusion creep of synthetic anorthite aggregates, J. Geophys. Res.-Sol. Ea., 105, 26017–26036, https://doi.org/10.1029/2000JB900223, 2000.
Schettino, A. and Turco, E.: Breakup of Pangaea and plate kinematics of the central Atlantic and Atlas regions, Geophys. J. Int., 178, 1078–1097, https://doi.org/10.1111/j.1365-246X.2009.04186.x, 2009.
Scrutton, R. A.: On Sheared Passive Continental Margins, Developments in Geotectonics, 15, 293–305, https://doi.org/10.1016/B978-0-444-41851-7.50020-0, 1979.
Seiler, C., Fletcher, J. M., Quigley, M. C., Gleadow, A. J. W., and Kohn, B. P.: Neogene structural evolution of the Sierra San Felipe, Baja California: Evidence for proto-gulf transtension in the Gulf Extensional Province?, Tectonophysics, 488, 87–109, https://doi.org/10.1016/j.tecto.2009.09.026, 2010.
Simpson, R. W.: Quantifying Anderson's fault types, J. Geophys. Res., 102, 909–919, https://doi.org/10.1029/97JB01274, 1997.
Spencer, J. E. and Normark, W. R.: Tosco-Abreojos fault zone: A Neogene transform plate boundary within the Pacific margin of southern Baja California, Mexico, Geology, 7, 554–557, https://doi.org/10.1130/0091-7613(1979)7<554:TFZANT>2.0.CO;2, 1979.
Stock, J. M. and Hodges, V. K.: Pre-Pliocene extension around the Gulf of California and the transfer of Baja California to the Pacific plate, Tectonics, 8, 99–115, 1989.
Suckro, S. K., Gohl, K., Funck, T., Heyde, I., Schreckenberger, B., Gerlings, J., and Damm, V.: The davis strait crust-a transform margin between two oceanic basins, Geophys. J. Int., 193, 78–97, https://doi.org/10.1093/gji/ggs126, 2013.
Taylor, B., Goodliffe, A., and Martinez, F.: Initiation of transform faults at rifted continental margins, C. R. Geosci., 341, 428–438, https://doi.org/10.1016/j.crte.2008.08.010, 2009.
Thompson, J. O., Moulin, M., Aslanian, D., de Clarens, P., and Guillocheau, F.: New starting point for the Indian Ocean: Second phase of breakup for Gondwana, Earth-Sci. Rev., 191, 26–56, https://doi.org/10.1016/j.earscirev.2019.01.018, 2019.
Tron, V. and Brun, J. P.: Experiments on oblique rifting in brittle-ductile systems, Tectonophysics, 188, 71–84, https://doi.org/10.1016/0040-1951(91)90315-J, 1991.
Turcotte, D. L. and Schubert, G.: Geodynamics, second edn., Cambridge University Press, Cambridge, https://doi.org/10.1007/s007690000247, 2002.
van Wijk, J., Axen, G., and Abera, R.: Initiation, evolution and extinction of pull-apart basins: Implications for opening of the Gulf of California, Tectonophysics, 719–720, 37–50, https://doi.org/10.1016/j.tecto.2017.04.019, 2017.
van Wijk, J. W., Heyman, S. P., Axen, G. J., and Persaud, P.: Nature of the crust in the northern Gulf of California and Salton trough, Geosphere, 15, 1598–1616, https://doi.org/10.1130/GES02082.1, 2019.
Watremez, L., Burov, E., D'Acremont, E., Leroy, S., Huet, B., Le Pourhiet, L., and Bellahsen, N.: Buoyancy and localizing properties of continental mantle lithosphere: Insights from thermomechanical models of the eastern Gulf of Aden, Geochem. Geophy. Geosy., 14, 2800–2817, https://doi.org/10.1002/ggge.20179, 2013.
Withjack, M. O. and Jamison, W. R.: Deformation produced by oblique rifting, Tectonophysics, 126, 99–124, https://doi.org/10.1016/0040-1951(86)90222-2, 1986.
Zwaan, F., Schreurs, G., Naliboff, J., and Buiter, S. J. H.: Insights into the effects of oblique extension on continental rift interaction from 3D analogue and numerical models, Tectonophysics, 693, 239–260, https://doi.org/10.1016/j.tecto.2016.02.036, 2016.
- Abstract
- Introduction
- Setup for thermo-mechanical numerical modelling
- Post-processing
- Numerical model results
- Comparison with previous modelling studies
- Comparison with natural cases
- Conclusions
- Appendix A
- Code availability
- Author contributions
- Competing interests
- Acknowledgements
- Review statement
- References
- Supplement