the Creative Commons Attribution 4.0 License.
the Creative Commons Attribution 4.0 License.
 | 21 Jul 2021
Present-day geodynamics of the Western Alps: new insights from earthquake mechanisms
Marguerite Mathey
Christian Sue
Colin Pagani
Stéphane Baize
Andrea Walpersdorf
Thomas Bodin
Laurent Husson
Estelle Hannouz
Bertrand Potin
Due to the low to moderate seismicity of the European Western Alps, few focal mechanisms are available in this region to this day, and the corresponding current seismic stress and strain fields remain partly elusive. The development of dense seismic networks in past decades now provides a substantial number of seismic records in the 0–5 magnitude range. The corresponding data, while challenging to handle due to their amount and relative noise, represent a new opportunity to increase the spatial resolution of seismic deformation fields. The aim of this paper is to quantitatively assess the current seismic stress and strain fields within the Western Alps, from a probabilistic standpoint, using new seismotectonic data. The dataset comprises more than 30 000 earthquakes recorded by dense seismic networks between 1989 and 2013 and more than 2200 newly computed focal mechanisms in a consistent manner. The global distribution of P and T axis plunges confirms a majority of transcurrent focal mechanisms in the entire western Alpine realm, combined with pure extension localized in the core of the belt. We inverted this new set of focal mechanisms through several strategies, including a seismotectonic zoning scheme and grid procedure, revealing extensional axes oriented obliquely to the strike of the belt. The Bayesian inversion of this new dataset of focal mechanisms provides a probabilistic continuous map of the style of seismic deformation in the Western Alps. Extension is found to be clustered, instead of continuous, along the backbone of the belt. Robust indications for compression are only observed at the boundary between the Adriatic and Eurasian plates. Short-wavelength spatial variations of the seismic deformation are consistent with surface horizontal Global Navigation Satellite System (GNSS) measurements, as well as with deep lithospheric structures, thereby providing new elements with which to understand the current 3D dynamics of the belt. We interpret the ongoing seismotectonic and kinematic regimes as being controlled by the joint effects of far-field forces – imposed by the anticlockwise rotation of Adria with respect to Europe – and buoyancy forces in the core of the belt, which together explain the short-wavelength patches of extension and marginal compression overprinted on an overall transcurrent tectonic regime.
- Article
(21519 KB) - Full-text XML
-
Supplement
(1908 KB) - BibTeX
- EndNote


The European Alps are characterized by a complex orogenic history. The Alpine belt results from the collision between the African and European plates during the Cenozoic (e.g. Coward and Dietrich, 1989; Handy et al., 2010). Tertiary continental collision followed the late Cretaceous to Eocene closure of the Ligurian Tethys Ocean (e.g. Stampfli et al., 1998), leading to the indentation of the European plate by Adria. The anticlockwise rotation of the Adriatic plate with respect to the European plate prevails in the tectonic history of the Western Alps (e.g. D'Agostino et al., 2008; Nocquet and Calais, 2004; Serpelloni et al., 2007). More precisely, multiple collision phases led to nappe stacking, as well as folds and thrusts, from the inner zones to the outer front of the belt. The Frontal Penninic Thrust (FPT) is the main compressional structure of Oligocene age along the Western Alpine arc (Tricart, 1984). Concurrently with the Miocene progradation of the collision front towards the external zones, the inner part of the belt was affected by orogen-parallel extension, crosscutting earlier compressional structures and resulting in intertwined networks of normal and strike-slip faults (e.g. Champagnac et al., 2006; Sue and Tricart, 2003; Bertrand and Sue, 2017). A late phase of orogen-perpendicular extension developed in the core of the Western Alps during the Plio-Pleistocene (Bilau et al., 2021; Sue et al., 2007b), leading to the extensional reactivation of the FPT (Sue and Tricart, 1999). This continued tectonic regime is currently revealed by the moderate seismicity of the Western Alps, which is distributed along two main seismic arcs, namely the Briançonnais seismic arc running along the FPT and the Piémontais seismic arc running along the western side of the Ivrea Body (Sue et al., 2002; Fig. 1). Congruent with the late brittle extension, ongoing seismicity shows normal faulting combined with dextral longitudinal strike-slip (Sue et al., 1999, 2007b; Delacou et al., 2004).
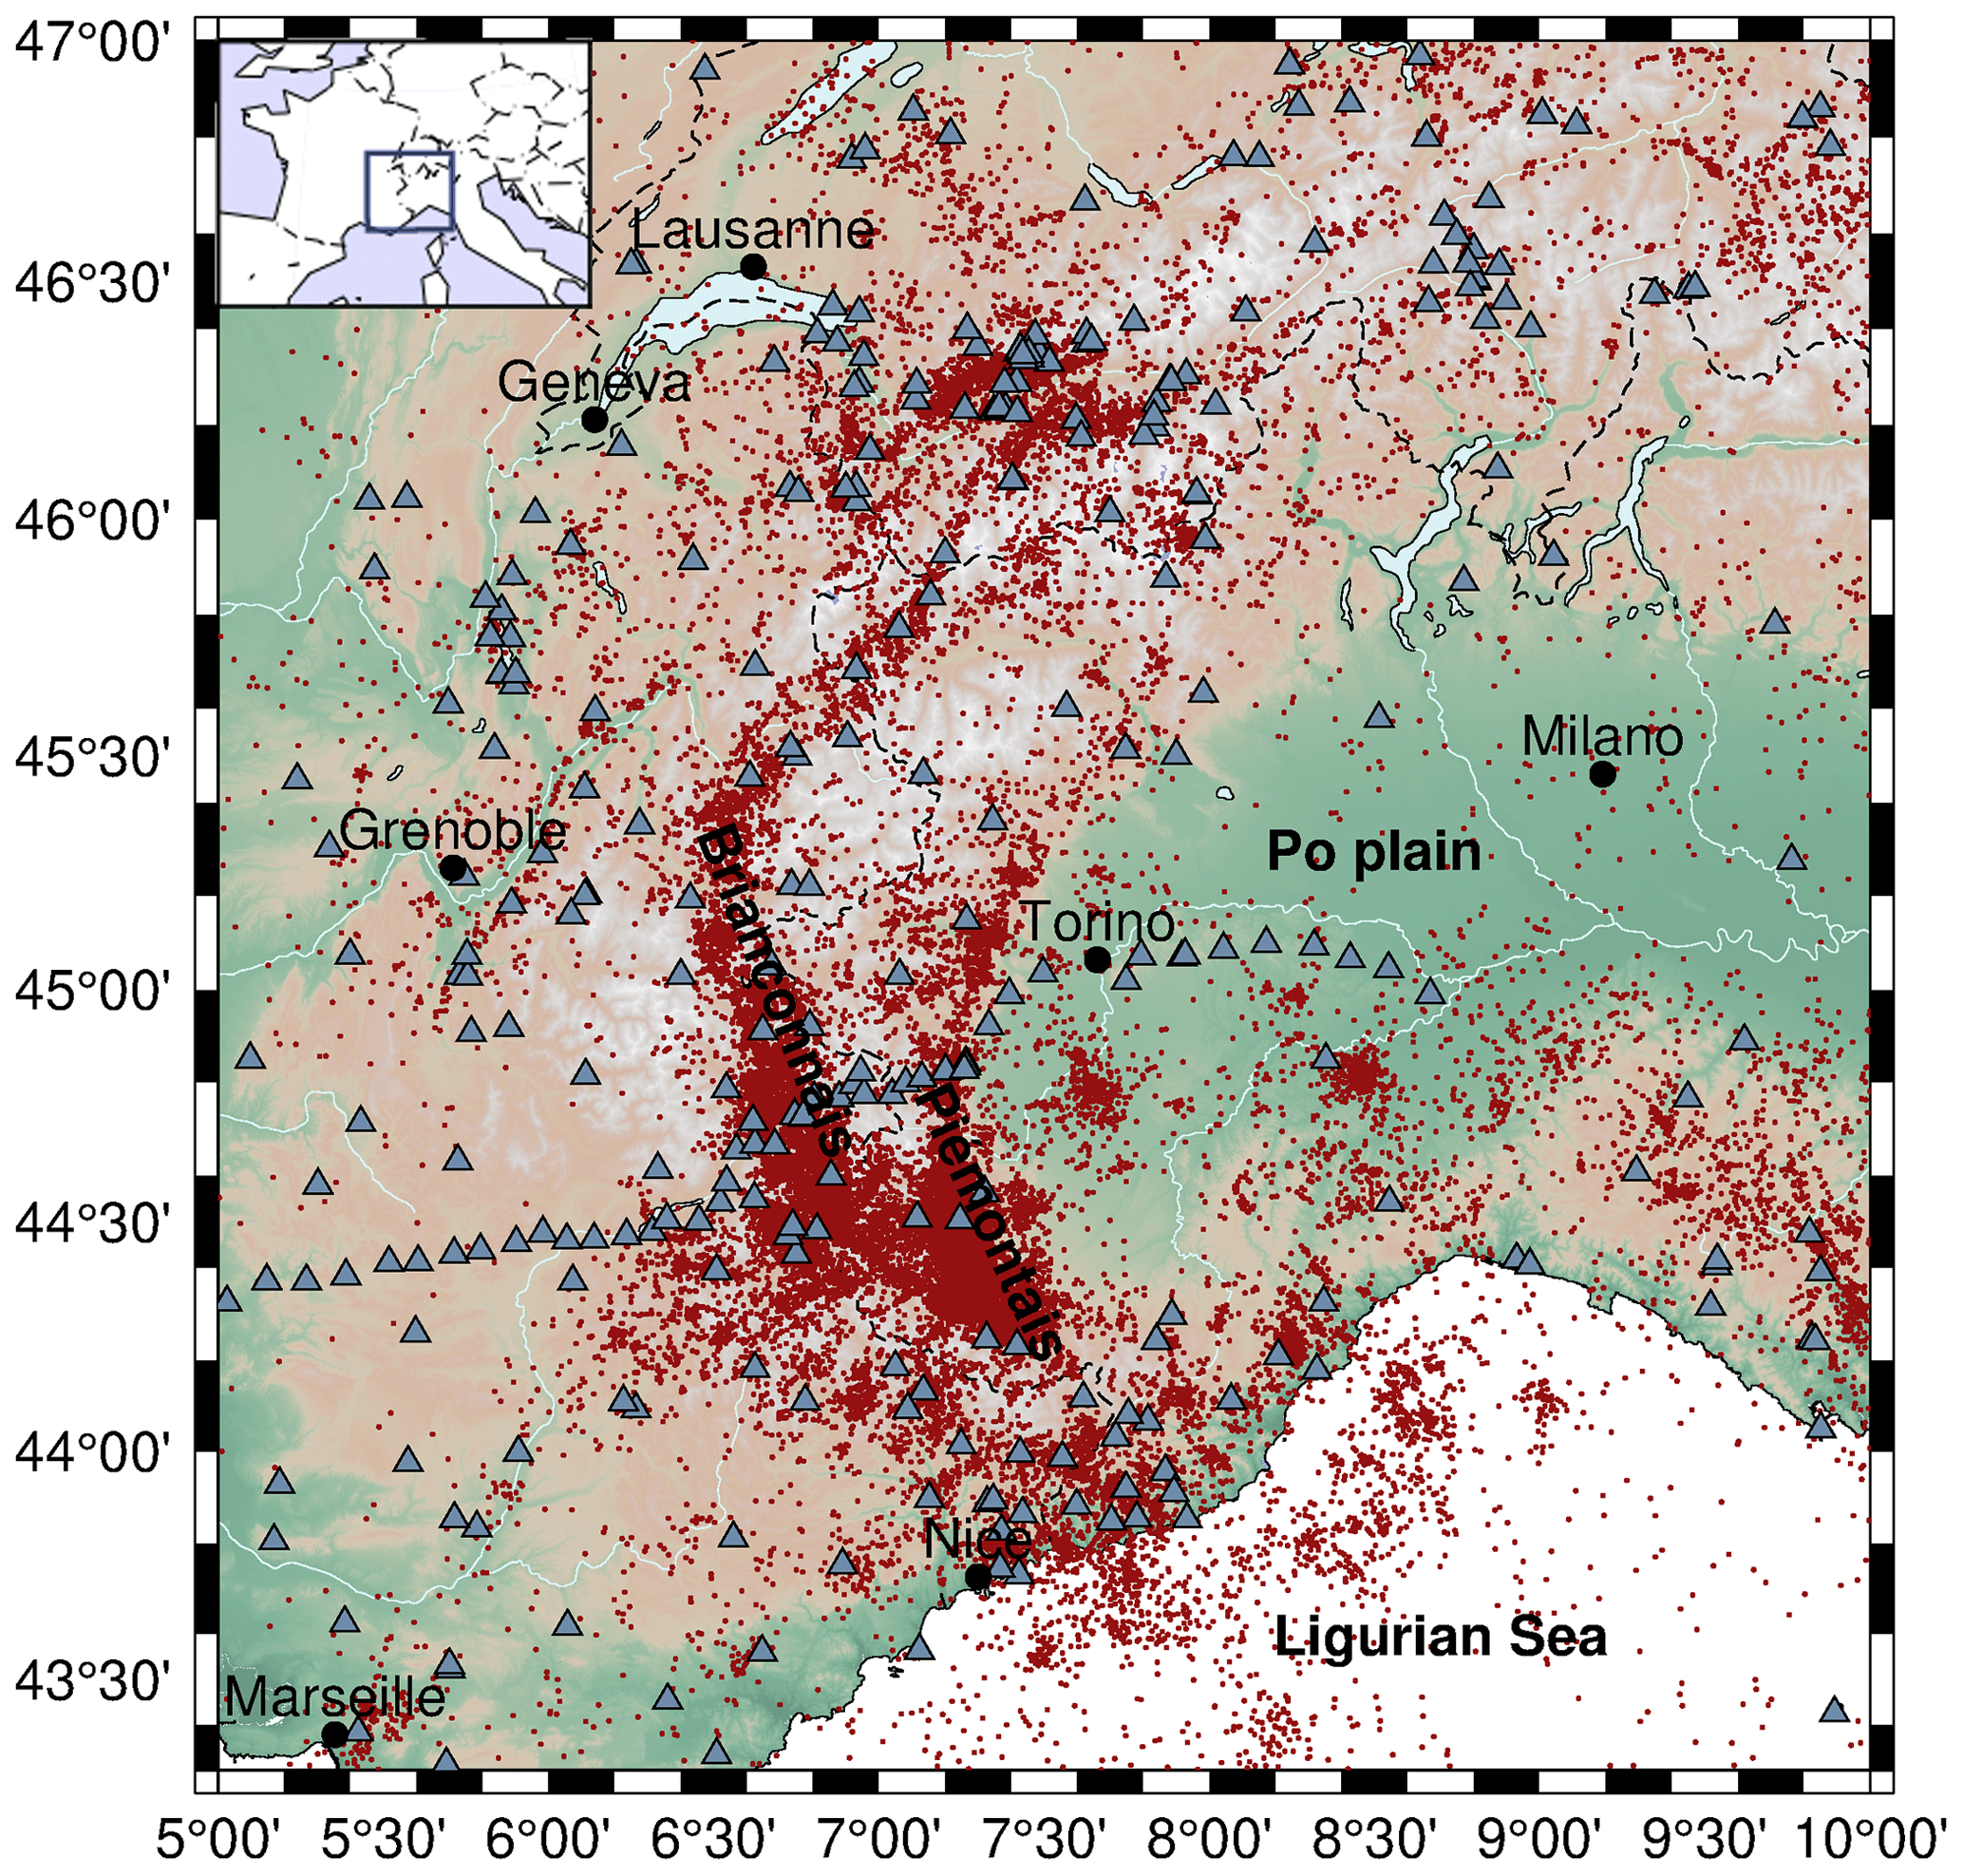
Figure 1Map of the seismicity (red dots) encompassing the Western Alps, compiled in Potin (2016) from national and regional networks seismic stations (triangles). The two major seismic arcs (Briançonnais and Piémontais arcs) can be clearly identified in the seismicity.
From the end of the 1990s onward, seismotectonic studies brought increasing constraints on the current strain and stress states of the Western Alpine realm as a whole (e.g. Maurer et al., 1997; Kastrup et al., 2004; Eva et al., 2020). The progressive development of dense permanent and temporary seismic networks in the Western Alps (e.g. Sismalp, Thouvenot et al., 1990, 2013; CIFALPS, Zhao et al., 2013) improved the catalogues by decreasing both the magnitude of completeness and the minimum magnitude from which focal mechanisms could be computed. These updated catalogues offer the opportunity to reappraise the disputed current dynamics of the Western Alps (e.g. Nocquet et al., 2016; Sternai et al., 2019; Champagnac et al., 2012; Mazzotti et al., 2020).
In this paper, we apply an integrated seismotectonic approach taking advantage of a comprehensive seismic dataset (Potin, 2016) that compiles the seismicity recorded from 1989 to 2013 by five national and regional networks and includes more than 30 000 events with local magnitudes (Ml) in the 0 to 5 range. Given the exceptional amount of data available in this catalogue we unveil the highest-resolution stress and strain fields to date based on the computation of more than 2200 focal mechanisms, and we retrieve the robust deformation signals at the regional scale. This is achieved thanks to a Bayesian inversion for the deformation style, combined to a stress inversion of the focal mechanisms. Principal stress orientations, combined with the regionalization of deformation modes, are of primary importance to understand the seismogenic processes within the belt and to seismic hazard analyses.
2.1 Seismic database and earthquake localizations
Our large dataset is a compilation of P- and S-wave travel time arrivals recorded by five local or national networks operated from 1989 to 2013 (Potin, 2016, Fig. 1). (i) The Sismalp (OG) network from Grenoble Observatory (Thouvenot et al., 1990, 2013; Thouvenot and Fréchet, 2006) consisted of up to 44 permanent and 10 temporary stations from 1989 and 2013 and specifically targeted the weak seismicity of the Western Alps. (ii) The French RéNaSS (Réseau National de Surveillance Sismique) and LDG (Laboratoire de Détection Géophysique) (FR) networks (https://doi.org/10.15778/RESIF.FR, RESIF, 1995) cover all of Metropolitan France and include 36 stations in the Western Alps. (iii) The Italian RSNI (GU) network (Regional Seismic Network of North Western Italy, https://doi.org/10.7914/SN/GU, University of Genoa, 1967; Scafidi et al., 2015) comprises 40 stations in the Western Alps and the Po plain and collected data from the 1960s onward. (iv) The Swiss SED (CH) network (https://doi.org/10.12686/sed/networks/ch, SED, 1983; Cauzzi and Clinton, 2013) has maintained an increasing number of stations in Switzerland since the 1970s, with more than 200 stations at time of writing (Diehl et al., 2018). (v) The CIFALPS (YP) network (https://doi.org/10.15778/RESIF.YP2012, Zhao et al., 2016a, 2013) was installed between 2012 and 2013 along a profile across the southwestern (SW) Alps. Potin (2016) standardized and homogenized the seismic data collected from these different networks: duplicate events were removed, and arrival time uncertainties were harmonized. Potential picking errors were identified and cleared out. The remaining dataset includes 36 010 events, for which at least seven phases were read by at least four seismic stations. A total of 791 754 P- and S-wave arrival times, recorded at 375 stations, were retained. Potin (2016) combined a 3D velocity inversion and earthquake re-localizations; take-off angles of seismic rays were estimated with an uncertainty of the order of a few degrees for well-constrained hypocentres, thus providing an enhanced localization of the events with a precision of a few kilometres both laterally and vertically.
2.2 Focal mechanism computation
From the aforementioned large dataset, we computed focal mechanisms with the code HASH (Hardebeck and Shearer, 2002). The computation makes use only of P-wave first-motion polarities. Thanks to the high density of stations provided by the combination of six networks, we were able to apply strict computation criteria. From the 36 010 events of the above-described dataset, we retained those with at least 10 P-wave polarities and at least 1 S-wave polarity. The maximum allowed azimuthal gap between polarities was set to 90∘ and the maximum azimuthal gap of incidence angles to 60∘. The maximum allowed distance to the seismic station was set to 600 km since all the stations used are within this range and covered by the same velocity model from Potin (2016). The preferred solution corresponds to the average solution of all acceptable solutions (Hardebeck and Shearer, 2002). The HASH code yields a quality flag from A to F for each computed focal mechanism (A, best constrained), which takes into account several parameters, such as the number of polarities used, spatial distribution of stations, and uncertainties of the polarities. The quality flag distribution of the computed focal mechanisms is available in Fig. S1 in the Supplement. From the 2215 events for which a focal mechanism has been computed, 58 have a Ml < 1, 1200 have a Ml ranging from 1 to 2, 769 have a Ml ranging from 2 to 3, 102 have a Ml ranging from 3 to 4, and 19 have a Ml > 4 (Fig. 2a). A total of 15 of them are A quality events with Ml ranging from 1.6 to 4.6, 52 are B quality events with Ml ranging from 1.3 to 4.9, 72 are C quality events with Ml ranging from 0.9 to 4.8, and all other mechanisms are D quality events with Ml ranging from 0.2 to 4.5. According to Hardebeck and Shearer (2002), A quality events have an associated fault strike uncertainty between 0 and 25∘, B events have an uncertainty between 25 and 35∘, C events have an uncertainty between 35 and 45∘, and D events have an uncertainty between 45 and 55∘.
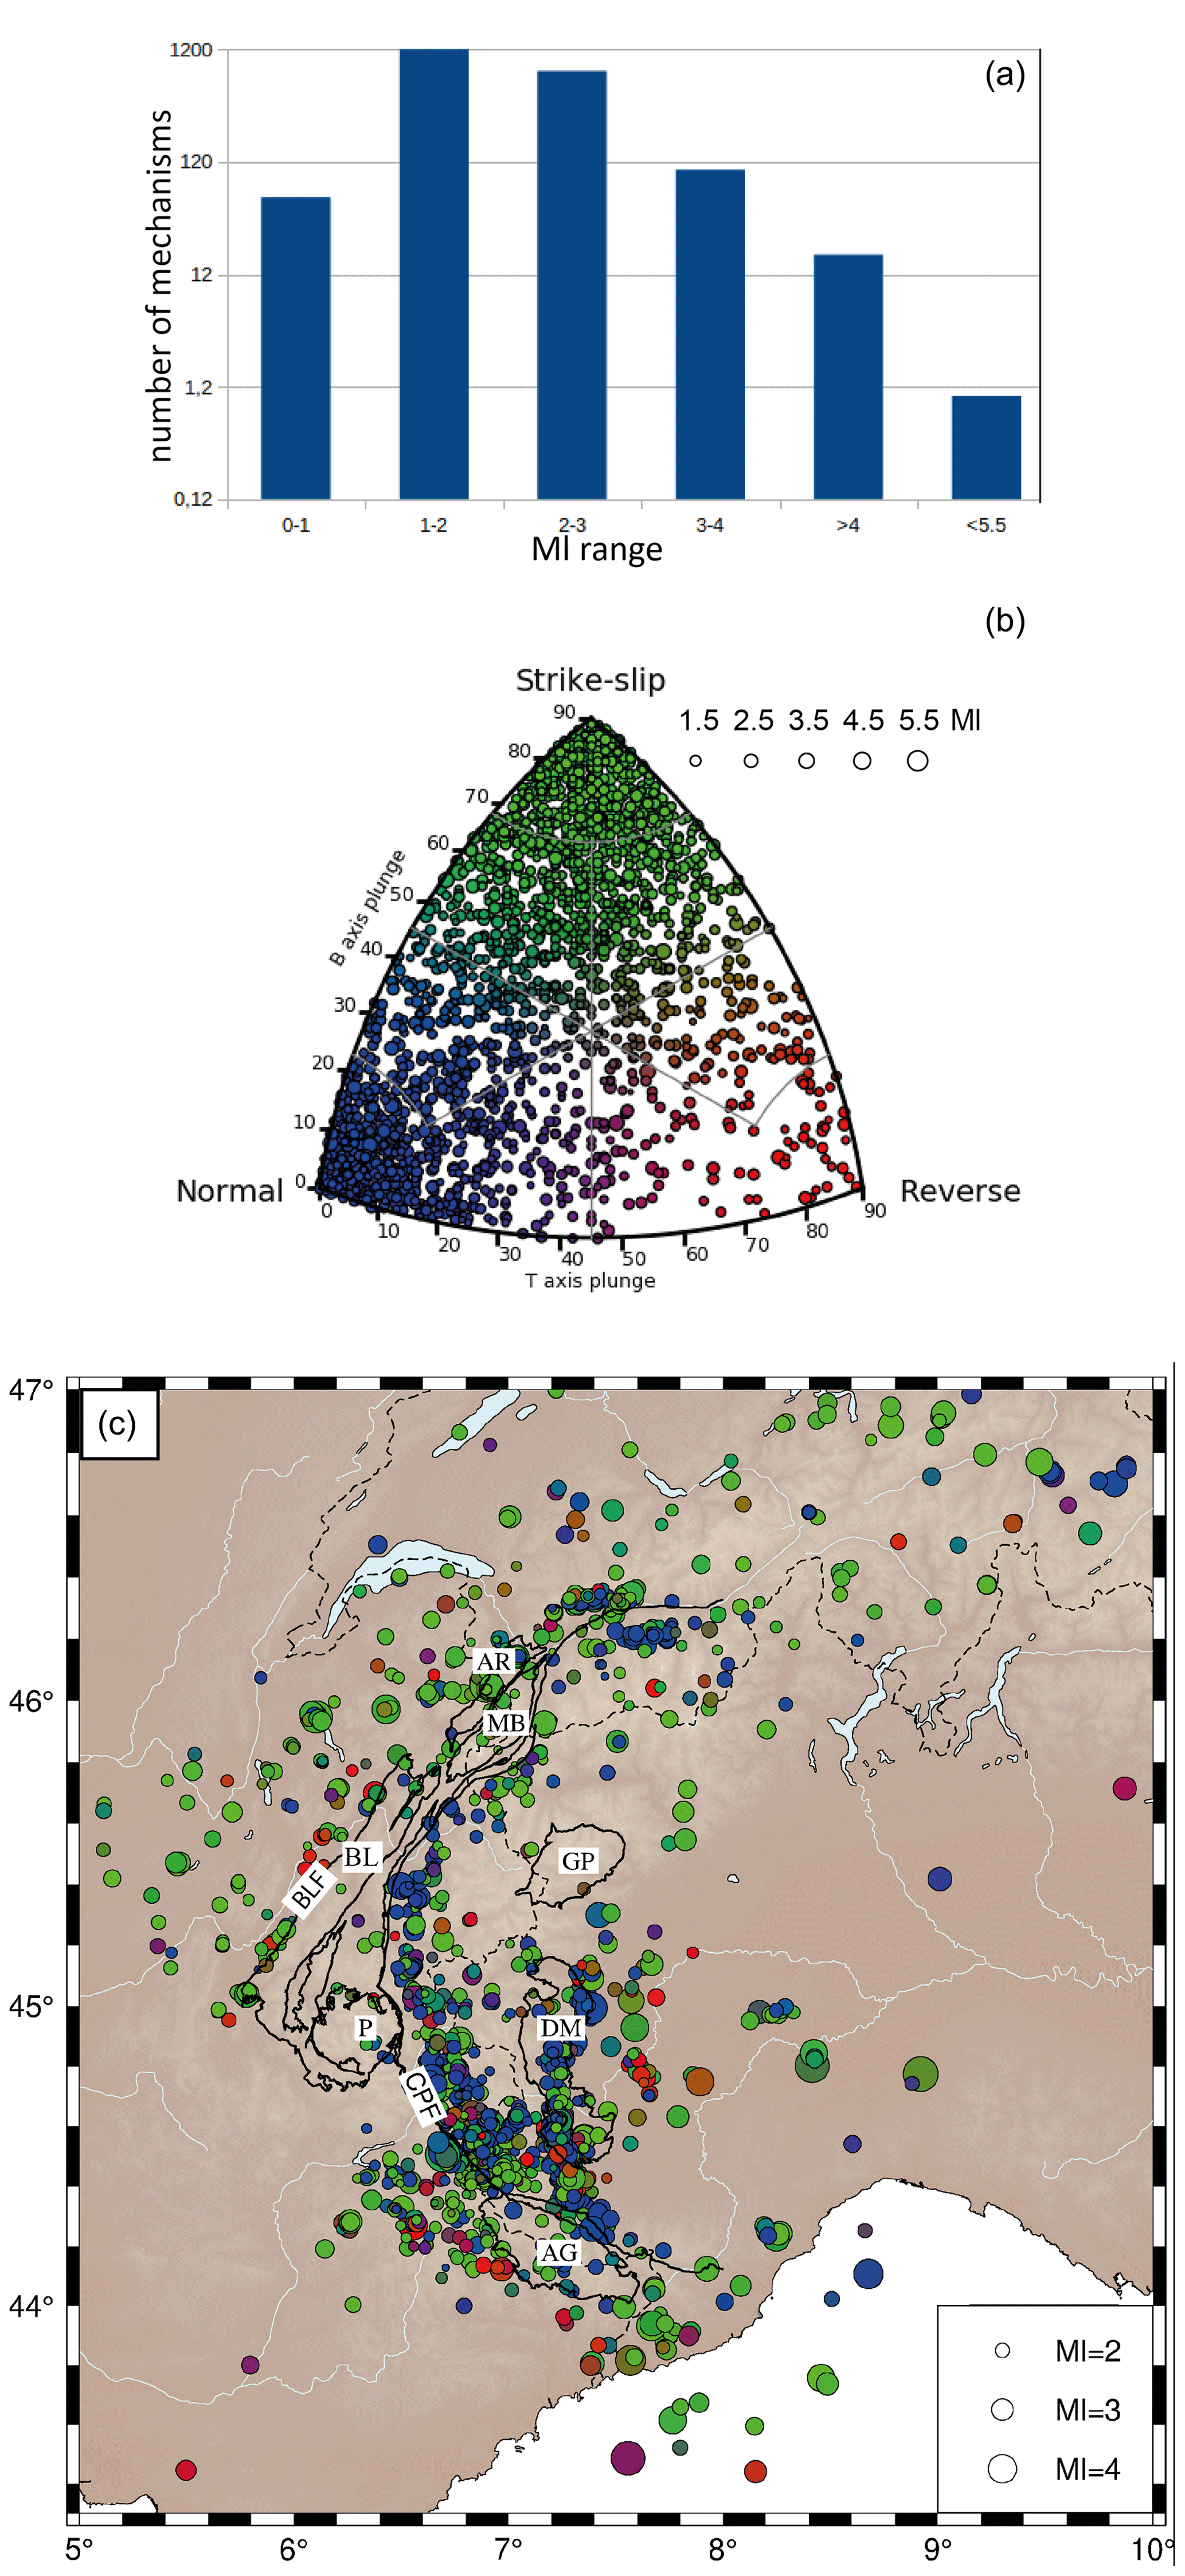
Figure 2Set of the 2215 focal mechanisms computed in this study. (a) Histogram of magnitude distribution (local magnitude, Ml) for the computed focal mechanisms. (b) Kaverina diagram displaying the style of deformation of the mechanisms according to their T axis (tension axis) and B axis (null axis) plunges. Normal, reverse, and strike-slip deformation style corresponding to the vertical P, T, and B axes is indicated by circles in blue, red, and green, respectively. (c) Localization of the focal mechanisms colour-coded according to their classification in the Kaverina diagram in (b). Note the different scale for events size between (b) and (c). Black lines outline the crystalline massifs of the area. External crystalline massifs (Aiguilles Rouges, AR; Mont Blanc, MB; Belledonne, BL; Pelvoux, P; Argentera, AG) are separated from the internal crystalline massifs (Gran Paradiso, GP; Dora Maira, DM) by the Crustal Penninic Front (CPF). The Belledonne external massif is delineated by the Belledonne Fault (BLF) along its western flank.
While low-magnitude seismic events account for less seismic energy release compared to larger ones, they will nonetheless be used both in an approach in which all focal mechanisms are used regardless of their magnitude (stress inversions, Sect. 2.3) and in approaches in which focal mechanisms are weighted depending on their magnitude (seismic moment summation, Sect. 2.3) and overall quality (Bayesian inversion, Sect. 2.4).
To further analyse the regional distribution of the focal mechanisms, we classified them according to the plunges of their pressure (P), tension (T), and null (B) axes (following the method of Frohlich, 1992). One can use ternary diagrams to graphically represent intermediate faulting styles between pure strike-slip, pure normal, or pure reverse motion. Each pole of the diagram represents one of the three pure styles of deformation (pure strike-slip, pure normal, or pure reverse motion). For each focal mechanism, Kaverina diagrams (e.g. Alvarez-Gómez, 2019) allow the representation of the styles of deformation, including cases of intermediate modes such as transpression or transtension. Frohlich's classification with Kaverina diagrams allows the representation of a focal mechanism in the ternary diagram by only two coordinates, the B and T axis plunges, with P axis plunge being retrieved by the product of the first two axes ones (e.g. if both T plunge and B plunge = 0∘, then P plunge = 90∘). The representation of the style of deformation through the Frohlich classification thus allows one to project a focal mechanism into a 2D parameter space and to account for intermediate styles of deformation, while information on the focal plane solution is lost. The Kaverina diagram for the complete catalogue is presented in Fig. 2b, and the corresponding map is shown in Fig. 2c. Kaverina diagrams per Ml ranges are available in Fig. S2.
2.3 Strain quantification and stress inversions
Strain rates are computed by averaging moment tensors (i.e. symmetrical nine-component second-order tensor, plus seismic moment amplitude), for which the nine components directly depend on strike, dip, and rake parameters of the focal mechanisms. The seismic moment for each focal mechanism is by definition related to moment magnitude Mw (Hanks and Kanamori, 1979). The local magnitude (Ml) of the catalogue is based on the maximum amplitude among all three components of the signal. A double conversion toward Mw has been proposed by Cara et al. (2015), through another national-scale local magnitude (Ml LDG). However, a careful analysis of this double conversion (Laurendeau et al., 2019) shows that this relationship is misleading for Ml Sismalp > 2.5: above this value, a linear relationship could be derived from the available dataset; below this value, a polynomial equation is a better approximation. Finally, Mw = Ml is a reasonable hypothesis, but it underestimates moment magnitude on the complete range of values. According to Kostrov (1974), in order to retrieve an annual strain rate, the sum of the individual moment tensors is divided by a volume and a time span. This method thus requires defining homogeneous volumes in terms of deformation style prior to summing compatible focal mechanisms in each volume. We defined 11 volumes within our region of interest, based on structural criteria, taking into account both the arcuate structure of the belt, as well as its geological structures, or based on the focal mechanism distribution and density of earthquakes. The 11 seismotectonic zones are named according to their structural environment: the VSS and VSN zones in the southern and northern Valais; BRN, BRS, and BRS2 from north to south along the Briançonnais seismic arc; PIE along the Piémontais seismic arc; PPO, SMT, NMT, and VAR for the areas at the periphery of the belt: Po plain to the east, southern Mercantour to the south, and northern Mercantour and VAR to the southwest; and finally DPH in the external Dauphinois zone (map view and definitions given in Fig. 3).
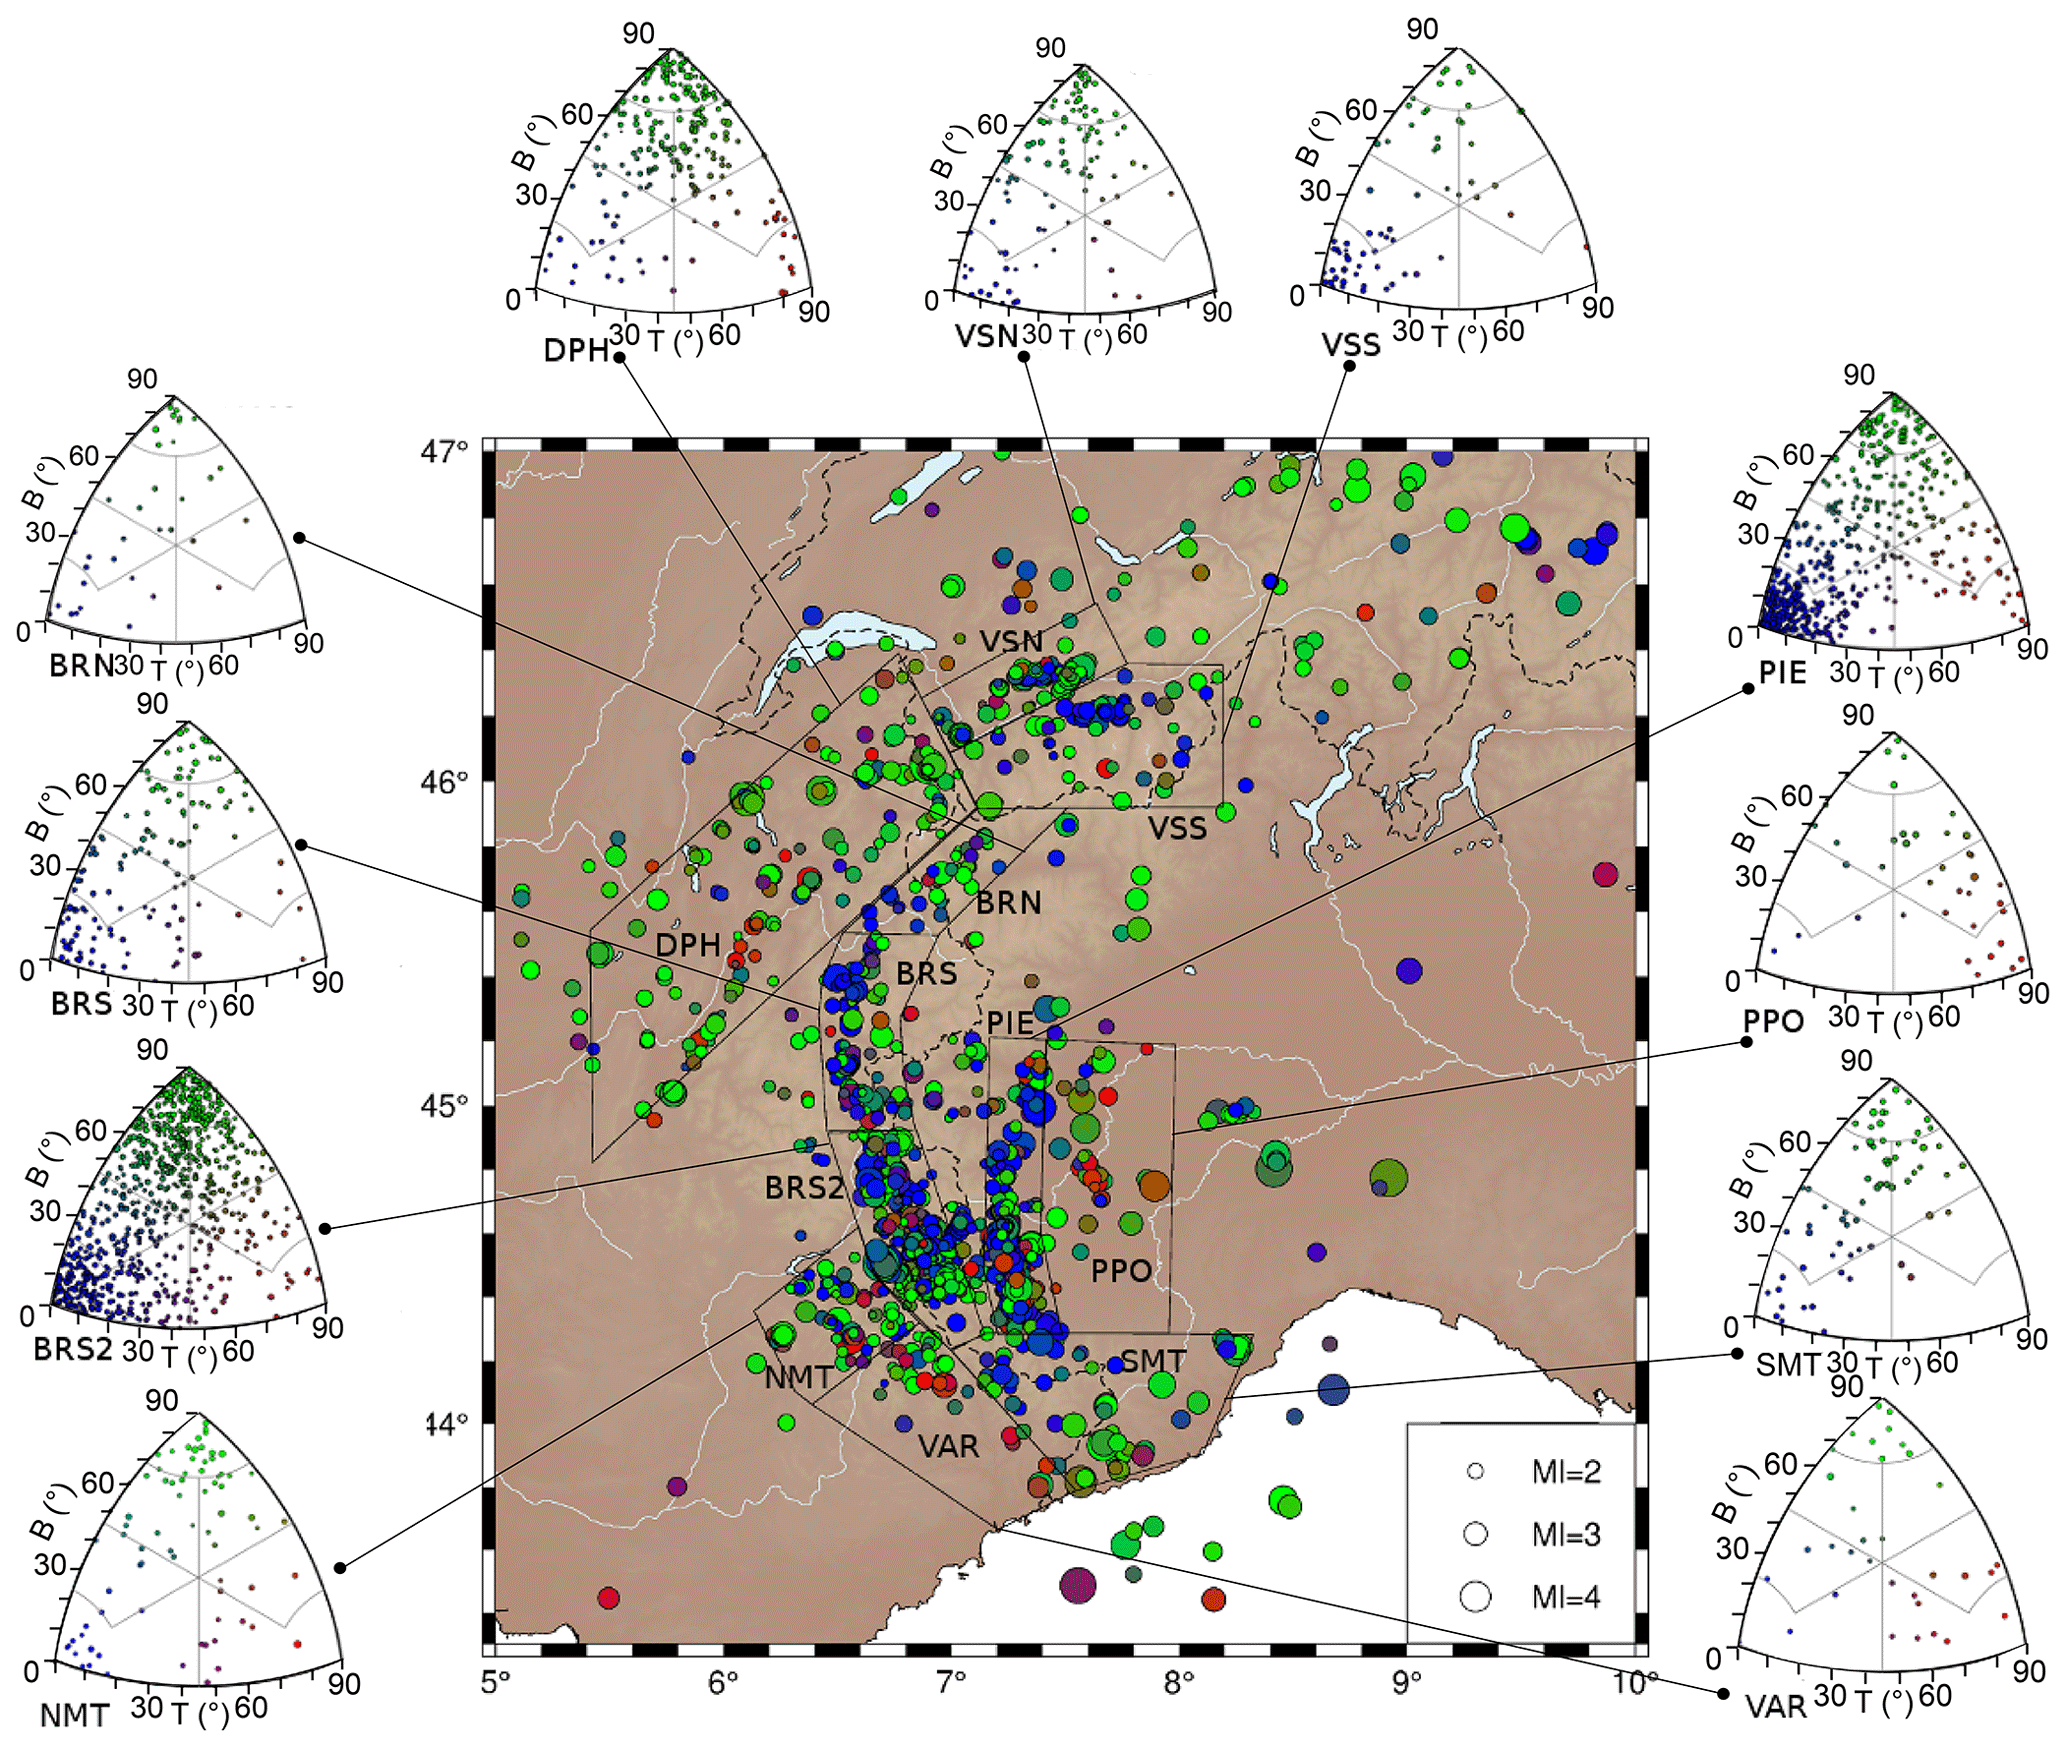
Figure 3Seismotectonic zonation of the study area, yielding 11 zones based on structural criteria, style of seismic deformation, and density. VSS stands for Valais south, VSN stands for Valais north, BRN stands for Briançon north, BRS stands for Briançon south, BRS2 stands for Briançon south 2, PIE stands for Piémontais seismic arc, PPO stands for Po plain, VAR represents Var; NMT stands for northern Mercantour, SMT stands for southern Mercantour, and DPH stands for Dauphinois zone. Kaverina diagrams are shown for each seismotectonic zone, highlighting their homogeneous style of deformation, associating either normal and strike-slip events or reverse and strike-slip events.
In a second analysis, focal mechanisms were inverted to retrieve the principal stress directions. Different inversion methodologies exist, all based on the same assumption of a locally uniform stress regime in the crust producing a slip, which occurs in a direction parallel to the plane of resolved shear stress (Hardebeck and Hauksson, 2001; Lund and Townend, 2007). In the stress inversion strategy, all mechanisms are equally weighted, regardless of their magnitude. In order to strengthen our analysis, we compare the classic FMSI (Focal Mechanism Stress Inversion, Gephart, 1990) method based on a grid search algorithm with the SI (StressInverse, Vavryčuk, 2014) method based on a linear least-squares inversion. These methods allow retrieving a partial stress tensor, since orientations of the three principle stresses can be obtained, as well as the shape ratio of the stress tensor, but not their absolute amplitude. The retrieved information is constitutive of the deviatoric stress tensor (D'Amico, 2018). In a first step, these two procedures were implemented on the same seismotectonic zones that were defined for strain rate quantification, in order to assess the robustness of the inversion. In a second step, we inverted the mechanisms on a regular grid rather than on pre-defined seismotectonic zones, which enables us to increase the spatial resolution of the derived stress field, at the cost of a reduced level of constraint, since fewer data are used to derive each tensor. We used the MSATSI (MATLAB Spatial And Temporal Stress Inversion, Martínez-Garzón et al., 2014) software to perform an inversion for each cell encompassing at least 10 focal mechanisms. While MSATSI allows the user to modulate the damping factor describing the attenuation of the weight of neighbouring cells in a given cell inversion, we choose to run the inversion without damping in order to identify any spatial heterogeneity in the stress field.
2.4 Bayesian interpolation of focal mechanisms
We choose to interpolate the style of deformation, in order to construct a continuous map of the regional trends prevailing among the locally varying mechanisms. As shown in Fig. 2, our dataset consists of an ensemble of P and T plunge angles given at each event location. In order to better investigate the spatial variations of this dataset, we implemented a 2D Bayesian regression method (following Bodin et al., 2012) to reconstruct a continuous surface of P and T plunge angles. The procedure is based on a transdimensional regression, which can be used over n-dimension datasets that are evenly distributed, and variable uncertainties. The reconstructed surface is parameterized with a mesh that self-adapts to the level of information in the data. The solution is a full probability distribution for each parameter at each geographical location, which is useful to estimate uncertainties. This method was first use to reconstruct the Moho topography beneath Australia from a discrete set of local observations (Bodin et al., 2012). Choblet et al. (2014) used it to reconstruct probabilistic maps of coastal relative sea level variation from tide gauge records. The approach was also used by Husson et al. (2018) to reconstruct maps of vertical displacement rates measured at GPS stations and by Hawkins et al. (2019a, b) to produce probabilistic maps of sea level rise by combining GPS, satellite altimetry, and tide gauge measurements.
In this work, the transdimensional regression algorithm applied to focal mechanisms output probability distributions for P and T plunge values at each geographical location. The method accounts for the heterogeneous data density thanks to a self-adapting parameterization based on Delaunay triangles. It also accounts for variable uncertainties in the data and thus allows deciphering which signal is robust at the regional scale despite the data heterogeneity. Moreover, a hierarchical Bayesian approach is used and data uncertainties are rescaled by a global adaptive factor depending on the level of data fit (Malinverno and Briggs, 2004). This factor enables us to assess whether formal uncertainties on fault planes and thus on P and T axes are overestimated or underestimated. In our case, we took into account the fault plane uncertainty as input error on our focal mechanisms. We were able to assess through the Bayesian inversions that these formal errors are overestimated by a factor of ∼ 0.6.
3.1 Focal mechanism distribution
To get a general overview of the 2200 focal mechanisms in terms of mode of deformation, we plotted them all together on a Kaverina diagram, i.e. according to their B and T axis plunges. The corresponding plot (Fig. 2b) shows a majority of strike-slip mechanisms (∼ 1200; 54.5 %), a large number of extensional ones (∼ 800; 36.5 %), and a minority of reverse ones (∼ 200; 9 %) over the Western Alps as a whole. The localization of the events is shown in Fig. 2c with respect to the main geological features covering the area. At a first glance, a strike-slip regime is distributed all over the belt while extension is mainly located in the inner part of the belt, i.e. along the Briançonnais and Piémontais arcs, confirming previous studies (Bauve et al., 2014; Delacou et al., 2004; Sue et al., 2002). Compression is scattered, and mostly expressed in the Po plain and in the southwestern external part of the belt.
In a second step, we plotted Frohlich classes on Kaverina diagrams for each of the 11 predefined seismotectonic zones (Fig. 3). These plots confirm that the 11 zones display roughly consistent deformation modes; the homogeneity of the deformation mode in each zone is a prerequisite to strain estimates. Importantly, strike-slip mode prevails everywhere, either as almost pure transcurrent or in association with extension.
3.2 Up-to-date strain and stress fields
The strain rate tensors computed in each of the 11 seismotectonic zones with Kostrov's (1974) method are presented as surface projections in Fig. 4, and the related parameters (rate, azimuth, and dip) are listed in Table 1. The largest strain tensor of the belt is located in the southern Briançonnais area (BRS2). The deformation style of the strain tensors is generally strike-slip (both extension and compression horizontal), except for the Piémontais (PIE) and southern Mercantour (SMT) areas, which show vertical compression axes and negligible compression rates, respectively. However, in the Kostrov methodology, the style of deformation and its orientation are dominated by the larger events in each sub-area, as they bring most of the energy released. The short time span of the observations (24 years) prevents a thorough investigation of spatial and temporal variations in seismic energy release. Therefore, including historical events that occurred in the Western Alps in the summation could modify the strain rate distribution in the belt.
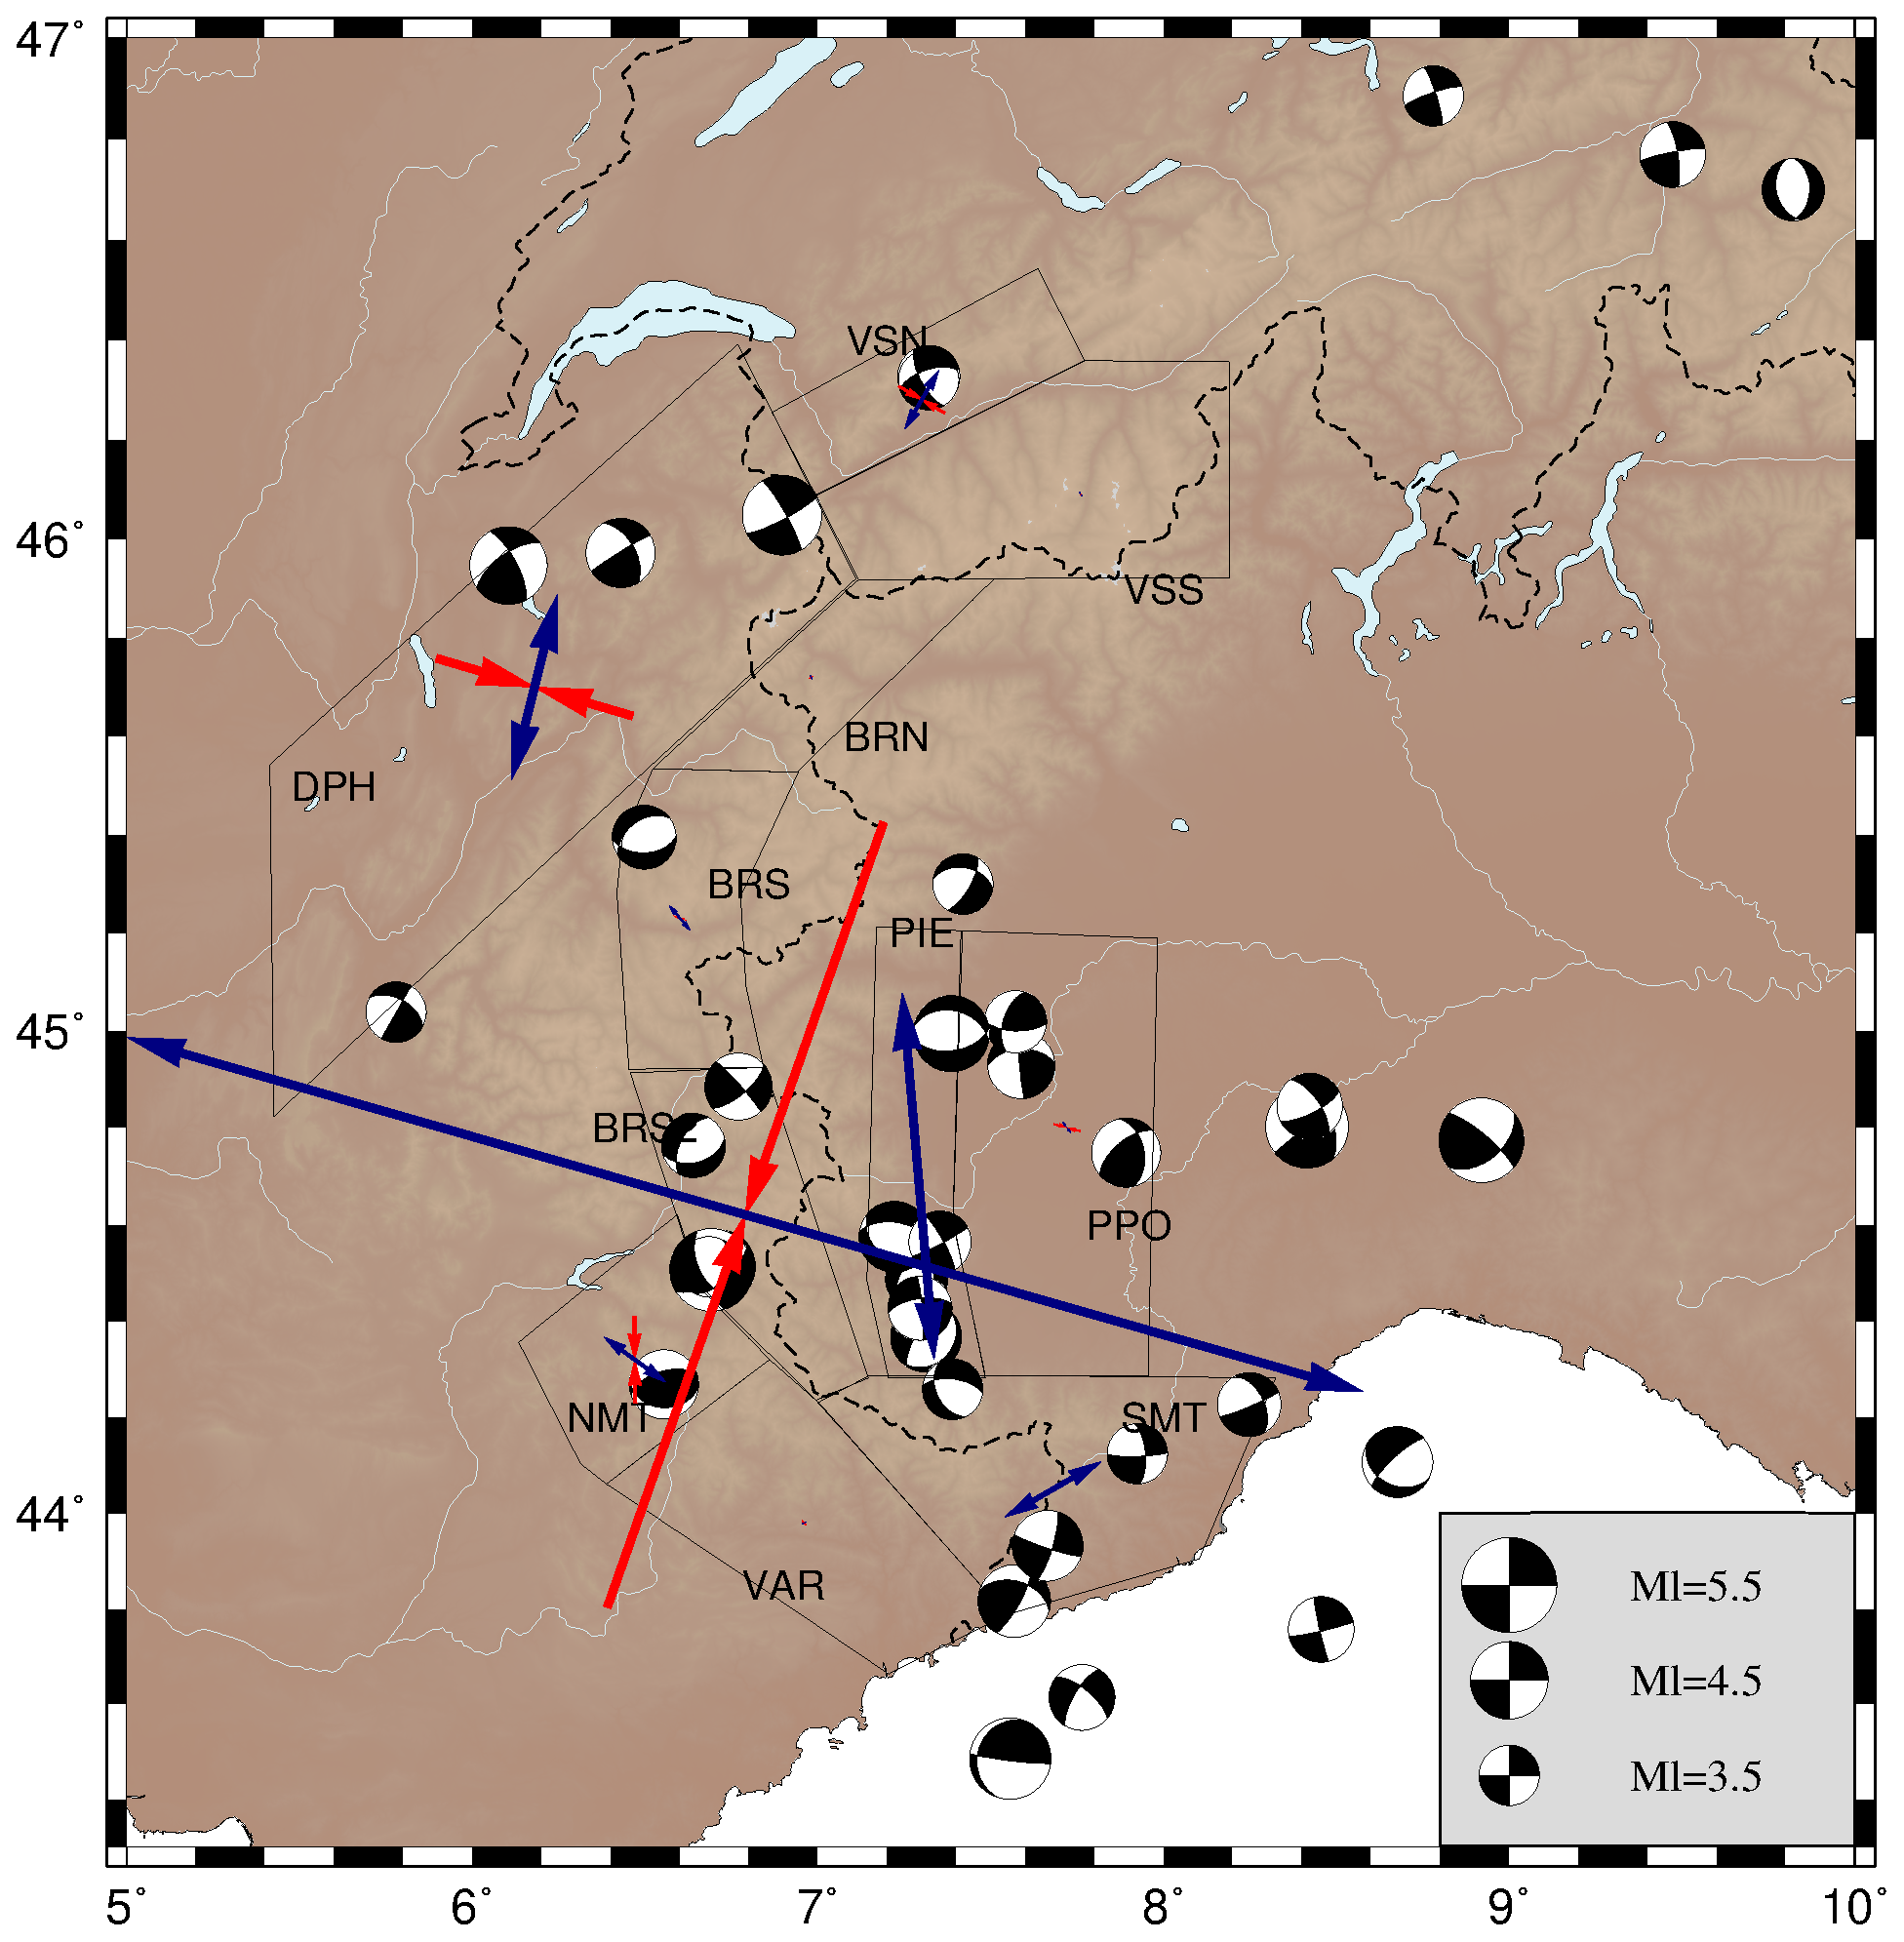
Figure 4Seismic strain rates computed according to Kostrov's (1974) method in each of the 11 subareas, based on 25 years of seismicity records from Potin (2016). Blue and red arrows respectively show the extensive and compressive components of the strain rate projected at the surface (ε∗cos (δ)), where ε is the given eigenvalue and δ is the dip (see values in Table 1). Black arrows represent the scale of the strain rate. Focal mechanisms with Ml ≥ 3.5 are represented in the background since strain rates mostly depend on higher-moment tensors.
Table 1Strain tensors (Kostrov's method) for each of the 11 subareas. Strain rates display the first (ε1) and third (ε3) eigenvalues of the strain tensor, corresponding to compression and extension, respectively, as well as their azimuth (θ, in degrees from north) and dip (δ, degrees) used to project the strain tensors at the surface in Fig. 4.
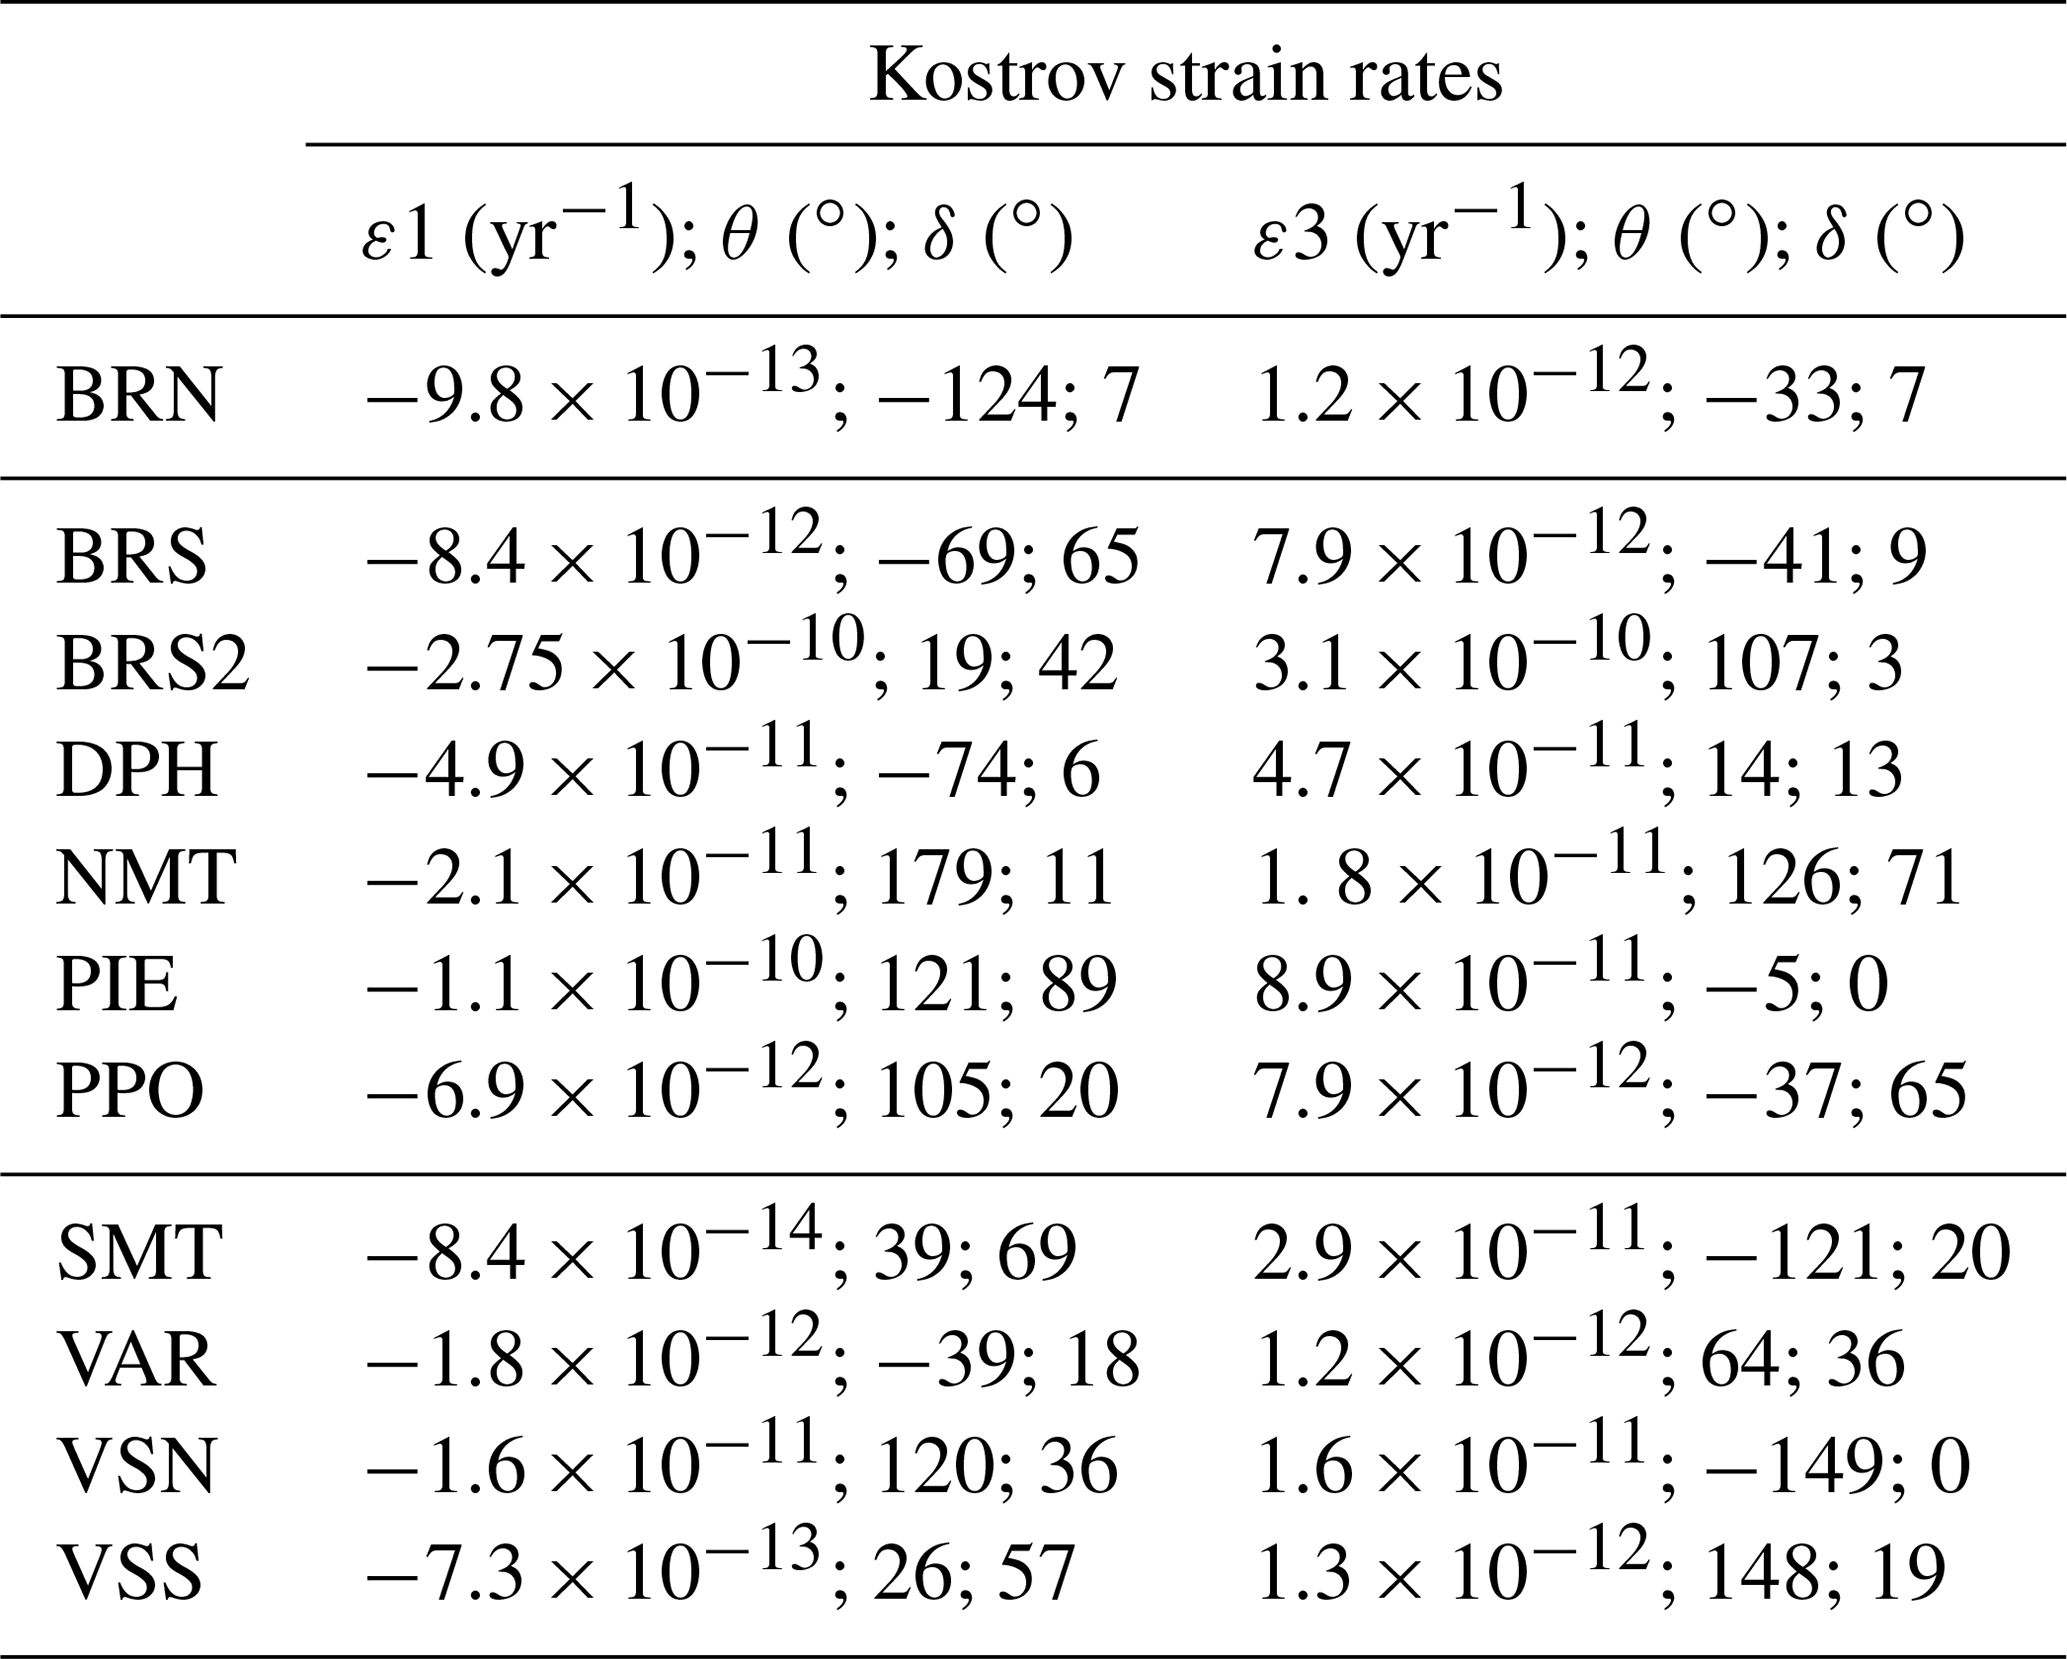
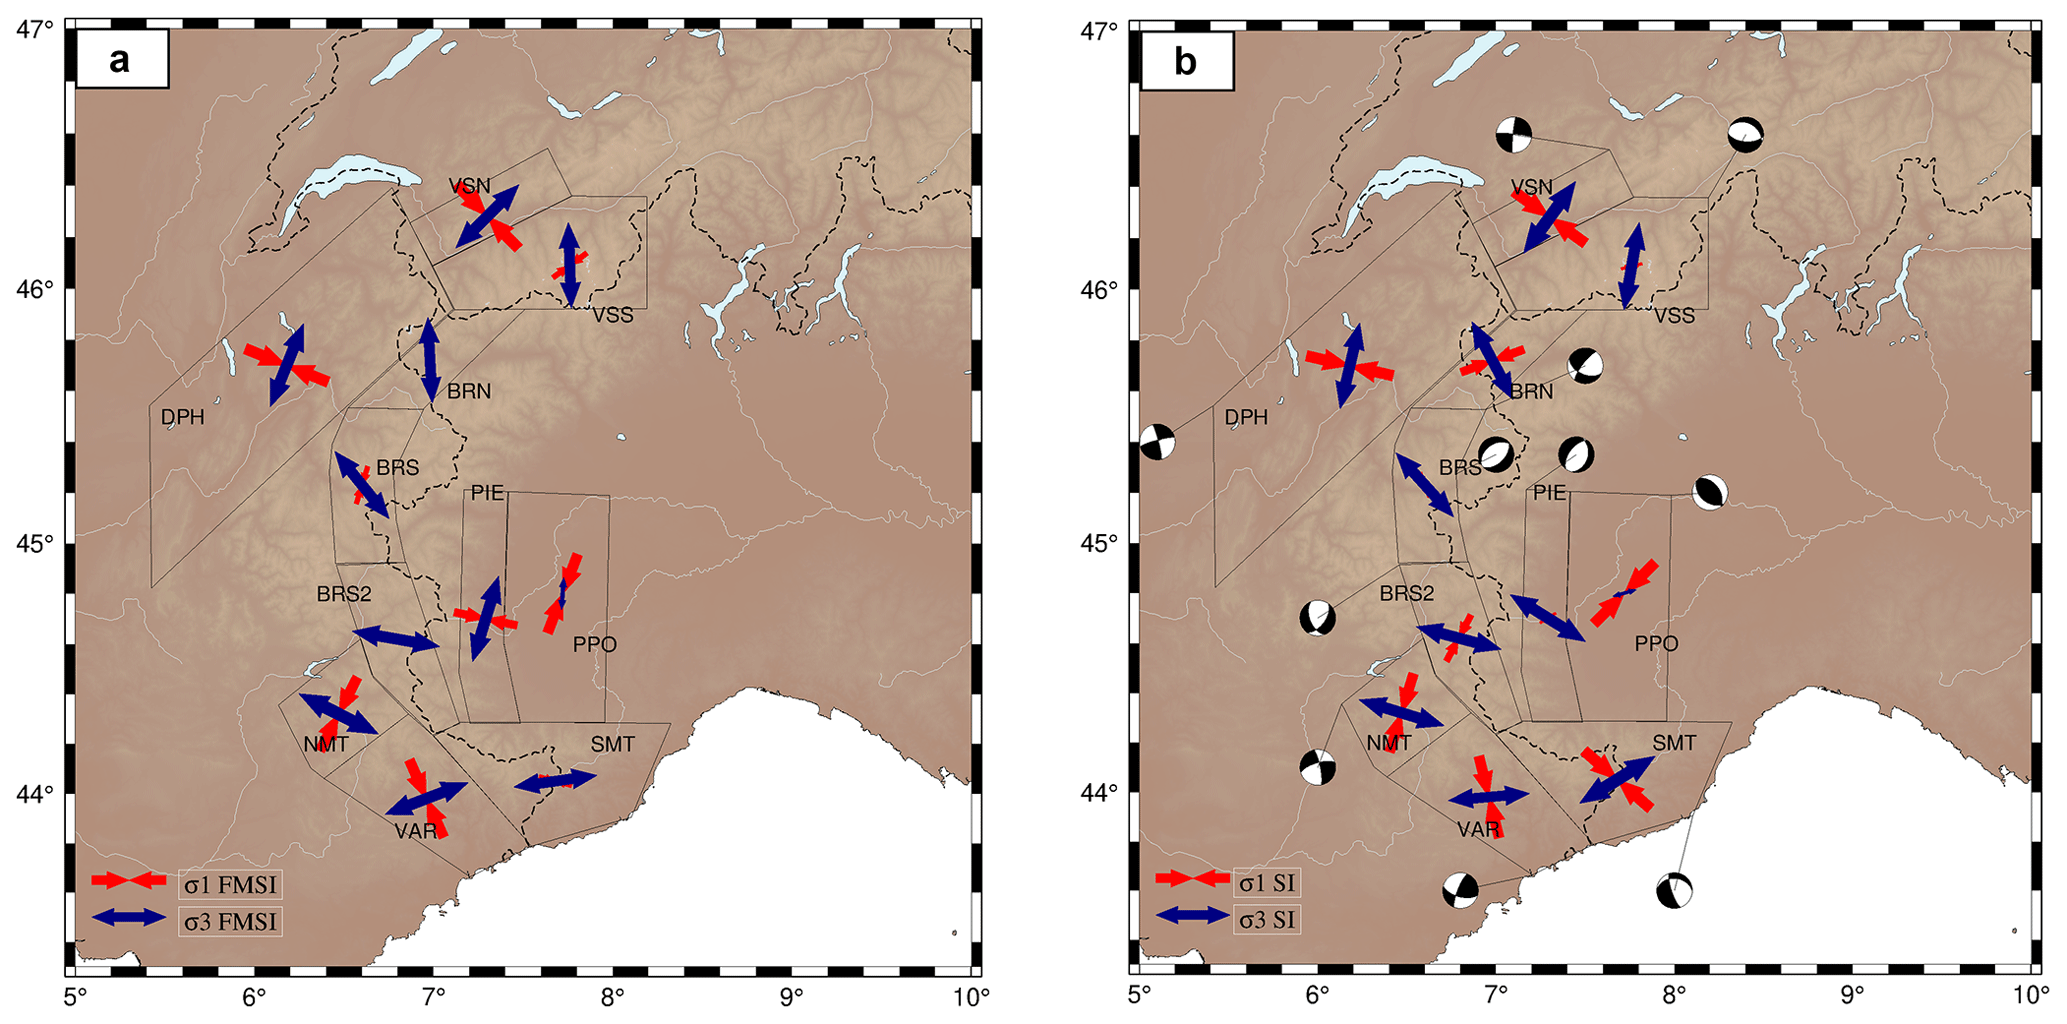
Figure 5Comparison of stress orientations resulting from FMSI (a) and SI (b) inversions of focal mechanisms within each subarea. The most compressional (σ1, in red) and least compressional (σ3 in blue) stresses are plotted given their plunge (i.e. arrows length depending on the plunge: the scale arrows in the bottom-left corner represent 0∘ plunging stress axes (horizontal stresses), while 90∘ plunging stress axes will not be seen on the map). The mean focal mechanism retrieved from SI inversion, corresponding to each partial stress tensor, is plotted for each subarea in (b).
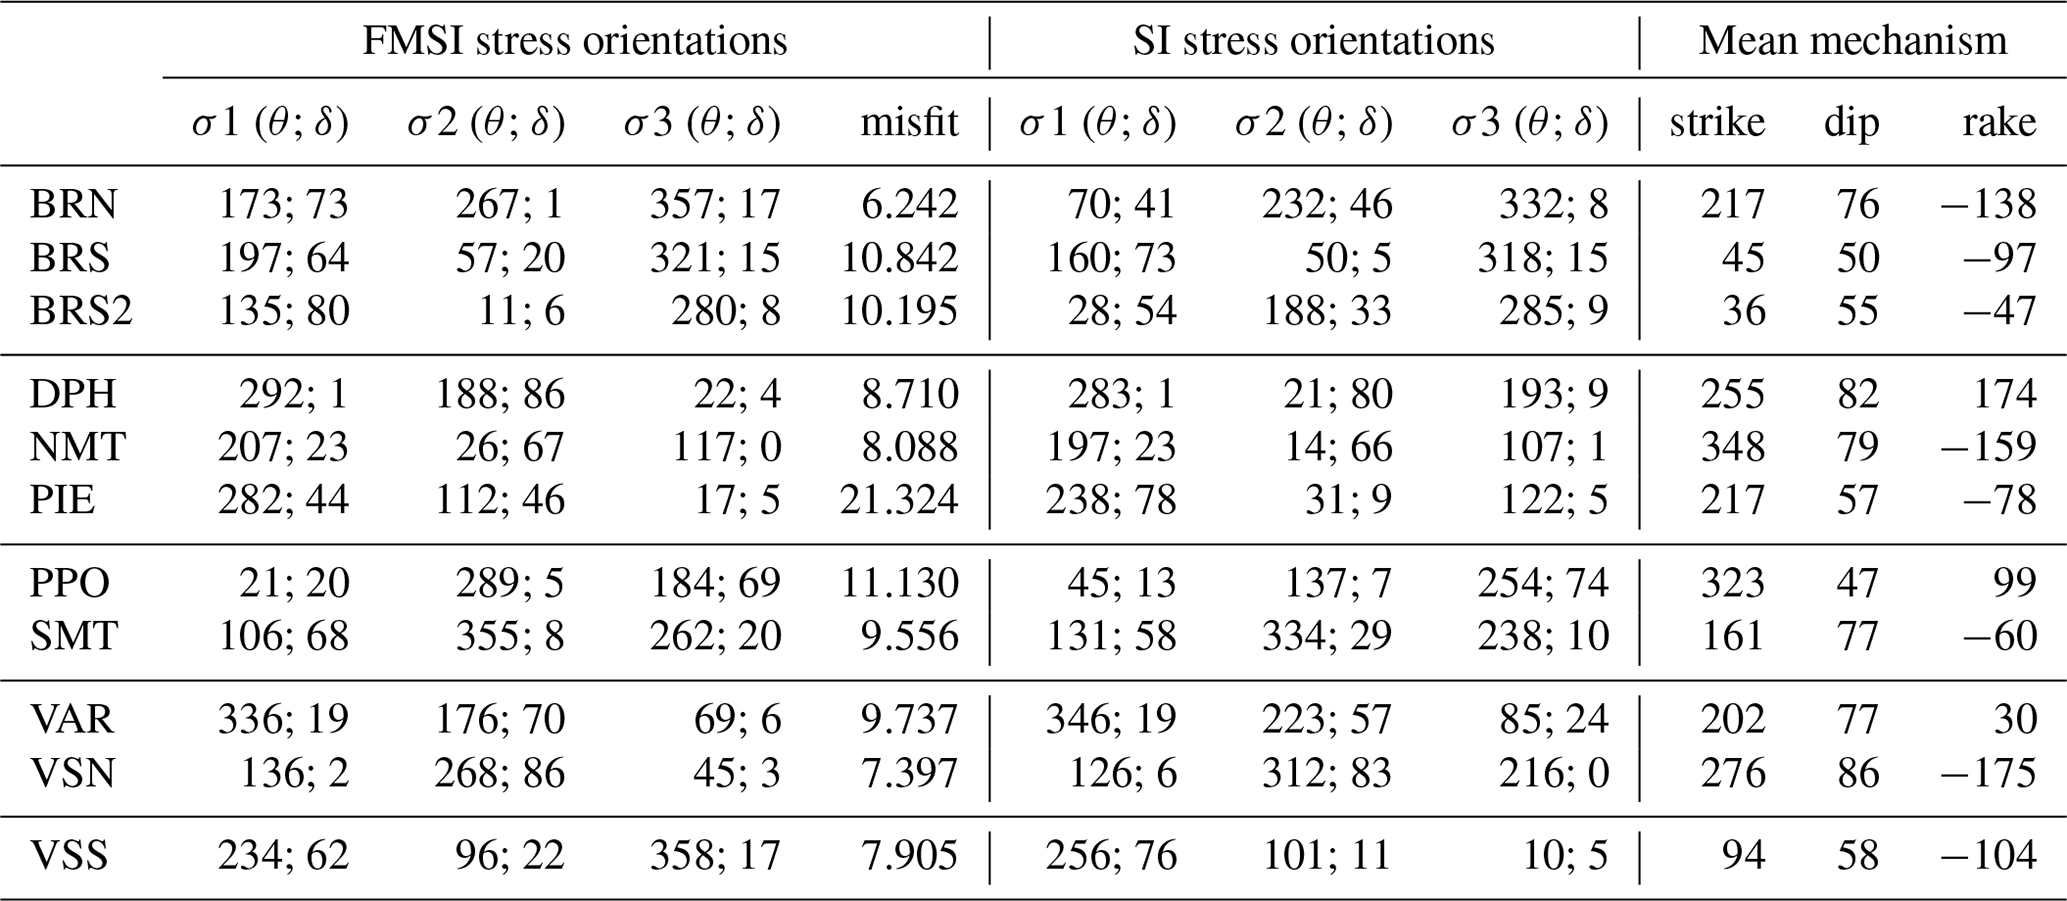
To better explore the current tectonic regime in each sub-area, we investigated the distribution of stress orientations using focal mechanism inversions. All inverted earthquakes are equally weighted, regardless of their magnitude. Figure 5 shows the azimuths of maximum (σ1) and minimum (σ3) compressive stresses, as given by SI and a FMSI inversions, plotted according to their plunge (i.e. the length of the stress axes being expressed as a unitary value ∗ cos(plunge)). The three principal stresses are orthogonal: horizontal σ1 by itself (i.e. σ1 axis length at the maximum unitary value) represents a compressional regime, horizontal σ3 by itself (i.e. σ3 axis length at the maximum unitary value) gives an extensional regime, and both horizontal σ1 and σ3 (i.e. both σ1 and σ3 axis lengths at the maximum unitary value) indicate a strike-slip regime. The most representative focal mechanism in each zone is plotted beside each sub-area. Associated azimuth and dip values, as well as strike, dip, and rake of both inversions and the corresponding mean mechanism from SI inversion, are listed in Table 2. The FMSI inversion additionally reports a misfit value, listed after the principal stress components. The results of the two inversion methods are in rather good agreement for each of the 11 zones, highlighting the overall stability and the robustness of our stress inversions.
Table 2Stress (FMSI and SI) results for each of the 11 subareas. Stress orientations display the azimuth (θ, in degrees from north) and the dip (δ, degrees) of the most compressional stress (σ1), intermediate stress (σ2), and least compressional stress (σ3) for the two methods. FMSI also yields a misfit value (dimensionless) for the deviatoric stress tensor constituted by the three principal stresses. SI yields the focal mechanism corresponding to the inverted deviatoric stress tensor.
Overall, the set of inversions allows for deciphering six mostly extensive sub-areas in the core of the belt (VSS, BRN, BRS, BRS2, SMT, PIE), four strike-slip sub-areas at the periphery (VSN, DPH, NMT and VAR), and only one compressive sub-area in the Po plain (PPO).
To test the significance of the observed heterogeneity between the inner and outer parts of the belt, we implemented a MSATSI stress inversion (based on SI method, see above) on a 0.5∘ × 0.5∘ geographical grid for each cell encompassing at least 10 focal mechanisms (Hardebeck and Michael, 2006). This inversion procedure allows us to get past any a priori seismotectonic zoning for the Alpine stress determination along the arc of the orogen. Such an inversion on a regular 0.5∘ × 0.5∘ grid (Fig. 6) is possible for the first time in the Alps thanks to the large number of focal mechanisms computed in our dataset, resulting in the highest-resolution stress map to date in the Alps. It is worth noting that neighbouring stress tensors appear consistent in orientation. The orientations are also in good agreement with the stress tensors derived in the seismotectonic zoning scheme. The orientations of the strike-slip tensors appear in good agreement with previous studies, whether at the regional (e.g. Delacou et al., 2004) or local scale (e.g. Bauve et al., 2014; Kastrup et al., 2004). However, the orientation of the extensive tensors appears slightly less perpendicular to the belt than previously observed (e.g. Sue et al., 1999, 2007b; see Sect. 4).

Figure 6Stress orientations resulting from MSATSI inversion (based on the SI method) on a 0.5∘ × 0.5∘ grid, for all cells containing at least 10 focal mechanisms (black dots). The most compressional (σ1, in red) and least compressional (σ3, in blue) stresses are projected according to their plunge. Solid lines and their labels refer to major geological features described in Fig. 2.
Extension is localized along the Briançonnais and Piémontais seismic arcs (Fig. 1) as previously shown (review in Sue et al., 2007b; Sect. 4), but it is found to be oblique to the strike of the Alpine belt, whereas it has been often described as perpendicular to the orogen (Sue et al., 2007b). This feature is observed all along the arcuate shape of the belt, from the Valais area in the north to the southernmost tip of the Alps in the south. The entire western periphery of the belt (corresponding to the zones VSN, DPH, NMT, and VAR in Fig. 5) shows strike-slip stress fields, with a rotating state of stresses compatible with dextral motions on fault parallel to the strike of the belt (such as the Belledonne fault, Thouvenot et al., 2003). Compression is once again only retrieved in the cell centred on the Po plain, with an axis oriented almost north–south. This grid inversion shows the prevalence of strike-slip around the bend of the Western Alps, as well as the deflection of the extension in the core of the orogen with respect to its strike, and the very limited importance of compression.
3.3 Probabilistic reconstruction of tectonic regimes throughout the Western Alps
Spatial variations of the deformation modes are assessed though the Bayesian reconstruction of continuous surfaces for P and T axis plunges. This is achieved through a 2D regression, where hypocentre locations are first projected at the surface and depth is ignored. In the following, all the focal mechanisms were projected to the surface. Inversion tests were also implemented for different depth intervals projected at the surface (Fig. S4). From a discrete set of values (P and T axis plunges for each event) distributed on a 2D map, the problem consists of reconstructing a smooth surface for these values. As shown with the earthquake classification in Sect. 3.1, these two parameters are sufficient to describe the style of deformation. The Bayesian approach provides full probability distributions for the P and T axes at any point in a 300 × 300 km2 area covering the entire western part of the belt. From these two distributions, a continuous probabilistic map of the deformation style can be constructed in the region.

Figure 7(a) Seismic flux computed using the annualized seismic moment (Mo) over the 1989–2014 time interval, summed in 0.05∘ × 0.05∘ cells and interpolated with an adjustable tension curvature surface algorithm (Smith and Wessel, 1990). Areas without focal mechanisms within 35 km are masked out, as well as mechanisms in the Ligurian Sea and in NE Switzerland, due to the lack of constraints. (b) Mean values of the distributions of P, T, and B axis plunges resulting from a Bayesian inversion. The colour code is according to the Kaverina classification of the style of deformation (the end-members red, blue, and green corresponding to reverse, normal, and strike-slip deformation styles, respectively). Focal mechanisms used are represented as dots filled with the same colour code. Areas without focal mechanisms within 35 km are masked out, as are mechanisms in the Ligurian Sea, due to the lack of constraints. White lines show isocontours of the seismic flux from (a) in log 10(Mo). Profiles numbered from 1 to 5 correspond to the interpolated vertical cross sections in Fig. 9. Dashed boxes encompass the focal mechanisms projected along each profile in Fig. 9.
The information about the style of deformation retrieved from the Bayesian inversion, once combined with the information about the seismic energy released in the area, thus delivers a comprehensive view of the current seismic deformation in the western Alps. Figure 7a shows a smoothed map of the seismic flux in the area. This map was generated by interpolating the seismic moment (Mo) values of events in the full dataset described in Sect. 2.1. The seismic moment is estimated assuming that Ml = Mw in our region (Sect. 2.3) and using the Hanks and Kanamori (1979) magnitude–moment relationship. Mo values are then summed on the 25-year period (the raw seismic moment map is displayed in Fig. S3) and annualized. It appears from Fig. 7a that most of the seismic energy was released during the considered time interval along the Briançonnais arc, from the Briançon region to the Valais region, and along the Piémontais arc.
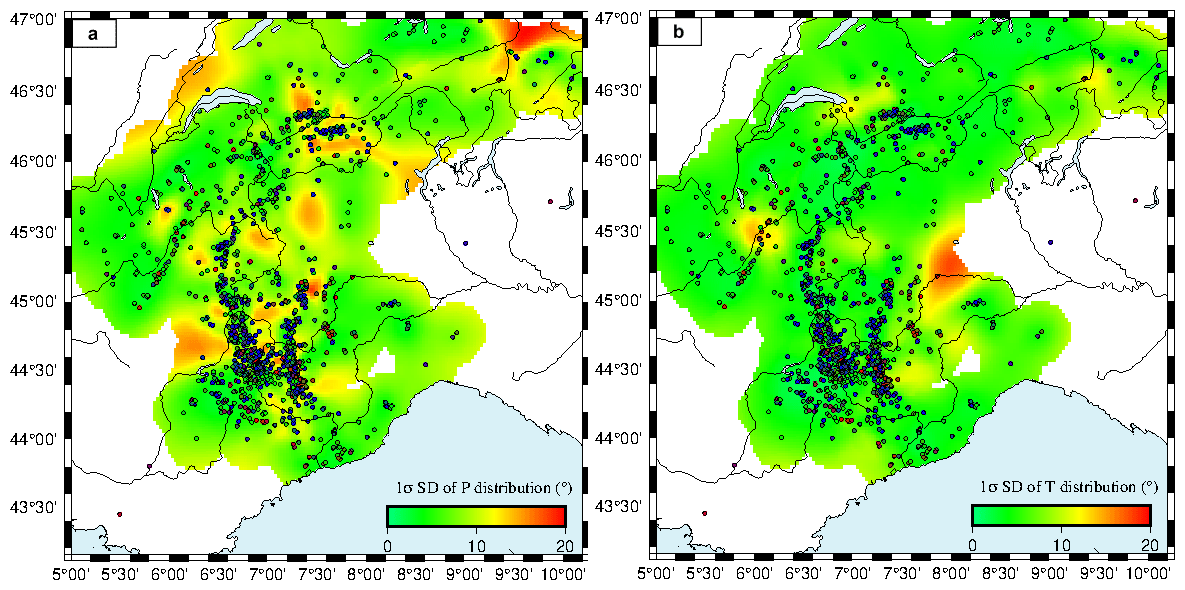
Figure 8The 1σ uncertainties (in degrees) of the mean values of P distributions (a) and T distributions (b) resulting from the Bayesian interpolation in Fig. 7. Superimposed focal mechanisms allow us to distinguish between two types of higher-uncertainty areas: areas without enough data and areas displaying high data heterogeneity.
Figure 7b shows a map of deformation modes obtained by combining the mean values of the Bayesian posterior distributions for P and T axis plunges, converted to a colour code in RGB triplet at each geographical location, according to the ternary diagram representation (Fig. 2b). Transcurrent and transtensive deformation predominate all over the belt. Extension is specifically localized in the core of the belt, as shown by previous studies (review in Sue et al., 2007b). However, whereas previous works have shown a continuous stretch of extension, our interpolation shows much more localized extensional areas. They are located discontinuously along the Briançonnais seismic arc (running along the CPF from the southern Briançonnais region to the Swiss Valais region, Fig. 1), the Piémontais seismic arc, and embedded within an overall strike-slip regime that prevails throughout (Fig. 7). The extensional areas correspond in general to areas of higher seismic energy release, even if some strike-slip areas also bear significant energy, such as in the Aiguilles Rouges and Mont Blanc crystalline massifs (Fig. 6). Figure 8 shows the standard deviations of the P and T axis plunges probability distributions (see Sect. 2.2). Uncertainties range between 5 and 20∘ on interpolated P and T axis plunges. As in any inverse problem, the level of uncertainty associated with the solution can only be interpreted relative to the level of resolution. Here, it is important to keep in mind that the solution model is smooth and represents an average over a given wavelength. The model uncertainties shown in Fig. 8 are associated with this spatial average and can therefore be much smaller than the data variability or data uncertainties (see Choblet et al., 2014). Figure 8b shows that on the two compressive patterns retrieved, only the one lying east of the Piémontais arc appears as a robust feature.
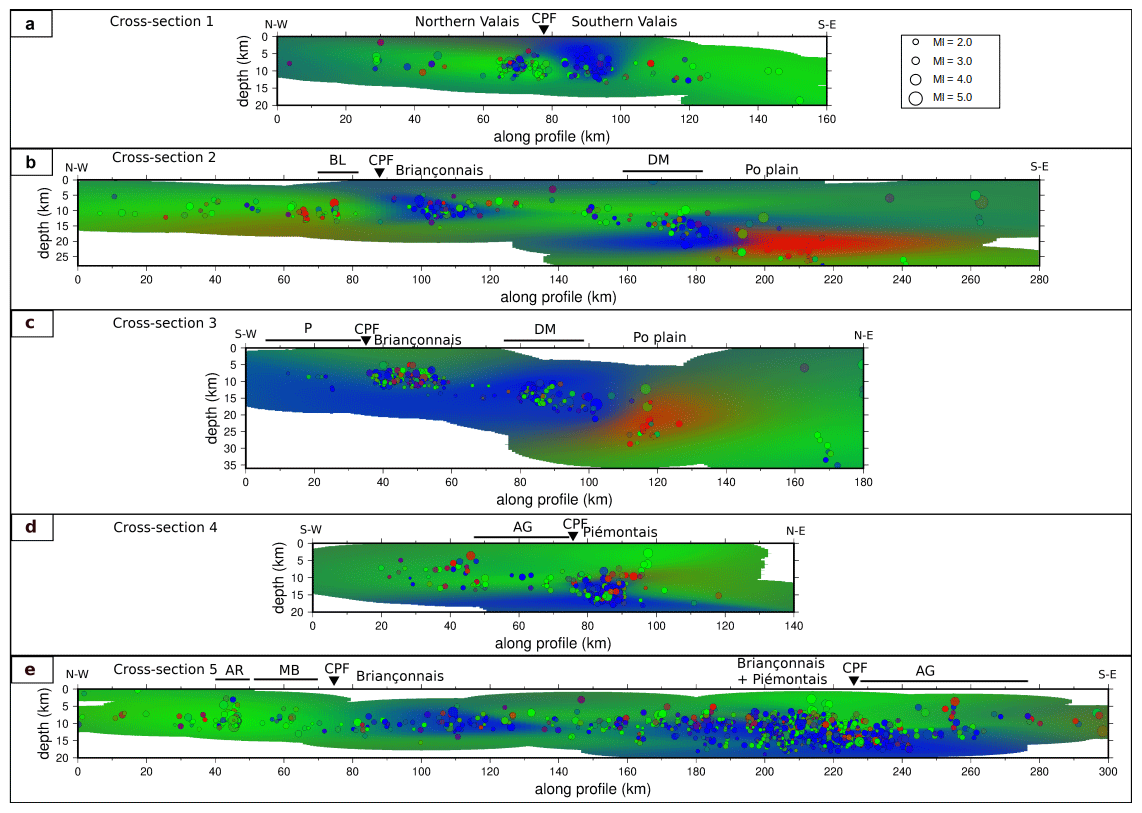
Figure 9Vertical cross sections displaying averages of P, T, and B distributions from the Bayesian interpolation of events projected along five profiles. Focal mechanisms used are represented as dots with their size depending on their magnitude (Ml). Profile locations are indicated in Fig. 7. Labels refer to geological features displayed in Fig. 2c. Uncertainties in P and T plunges distributions are available in Figs. S5 and S6.
To investigate the spatial variability of deformation mode at depth and thus obtain a 3D view of the overall deformation in the belt, in a second step we perform 2D inversions over five vertical cross sections across the belt (Figs. 7 and 9). To do so, we first projected focal mechanisms onto the 2D cross sections (Fig. 7). We then interpolated P and T axis plunges in the vertical 2D cross section. The 1σ uncertainties of the P and T axis plunges probability distributions are displayed in Figs. S5 and S6, respectively. The cross section uncertainties show that the localizations of the deformation patches are in general well resolved, while their exact spatial extent is less constrained.
Cross section 1 (Fig. 9a) is comprised of the Swiss molasse basin to the north of the Po plain 153 focal mechanisms projected from 25 km on each side of the profile with depths in the 5–12 km range. Their inversion shows a majority of strike-slip mechanisms, with a pattern of extension localized in the inner part of the chain in the southern Valais area, east of the CPF trace (seismicity cluster and corresponding complex faulting style already described in previous studies; see, e.g. Maurer et al., 1997; Eva et al., 1998; Diehl et al., 2018, 2021). A small extensional zone appears at 10 km depth under the northern Valais seismic zone, encompassed in a major transcurrent signal. These results are consistent with the version obtained at the surface, i.e. surface-projected results. The extension appears to be relatively shallow on this cross section, as it develops from 10 km depth up to the surface.
Interpolated cross section 2 (Fig. 9b) is located more or less along the ECORS profile (Sect. 4.1; Marchant and Stampfli, 1997). It is constrained by 218 focal mechanisms distributed over 25 km on each side of the profile. The focal depths are quite shallow (i.e. approximately 10 km) in the western part of the section and increase significantly eastward at around 140 km along the profile from 10 up to 30 km deep. This section shows two extensional areas, one in the shallow part, corresponding to the Briançonnais arc east of the CPF, and the other around 20 km deep, corresponding to the northern tip of the Piémontais arc beneath the DM massif, separated by an area of strike-slip regime, as shown in Fig. 7b. This section reveals a striking juxtaposition of extension and compression at 190 km along the profile. This compression pattern lies underneath the Po plain at a depth of 20 to 25 km. The occurrence of this unique compressive pattern appears robust from Figs. S5 and S6, even if the juxtaposition limit between the extensive Piémontais pattern and the compression area seems less constrained.
Cross section 3 (Fig. 9c) runs from the Pelvoux massif (“P”, external zone) to the Po plain. It is made of 302 focal mechanisms up to 20 km away from the profile line, which corresponds to the width of deformation patches seen on the map (Fig. 7b). It also shows a deepening of the seismicity from west to east, from 10 to 30 km. The vertical interpolation gives a quite different view of the extensional pattern compared to the map interpolation. Figure 7b thus shows two extensive patterns separated by a narrow strip of strike-slip strip deformation along the Briancçonnais arc. The cross section, however, reveals that this extension is rather continuous at depth, with a shallower strike-slip pattern on the top centred on the CPF. These features appear robust from the standard deviation cross sections (Figs. S5c and S6c). This strike-slip pattern located in the Briancçonnais area seems to correspond to a local transcurrent zone in a regional extensional area. In continuity with cross section 2 (Fig. 9b), the compressional zone is located directly next to the extensional area, with a sharp boundary at depth (10–25 km), while the respective shapes of the compressional and extensive patterns are poorly resolved (Figs. S5 and S6).
Cross section 4 (Fig. 9d) runs from the Provence area to the south of the Po plain and regroups 245 focal mechanisms located up to 15 km away from the profile. This profile is designed tighter than the other ones due to the higher heterogeneity in the focal mechanisms at the surface (Fig. 7b). The vertical interpolation is consistent with the map interpolation and reveals that the extensive pattern seen on the Piémontais arc is rather deep (from 12 to 20 km deep) and is surrounded by a predominant strike-slip regime all around, especially at shallower levels. The extensive area located at depth under the Piémontais arc appears robust; however, its lateral extension deep under the Argentera massif and the Po plain seems poorly constrained.
Cross section 5 (Fig. 9e) is drawn along the strike of the belt and runs from Lake Geneva (Chablais area) to the region of Nice. It gathers 1186 focal mechanisms spread over 25 km on each side of the profile. This section aims to investigate the connections between the different extensional patches observed in the map interpolation (see also Fig. S4). It appears that extension is characterized by a depth increasing from ∼ 10 to ∼ 20 km from north to south, while strike-slip remains dominant in the whole upper crust of the northern external zone and in the shallow levels to the south. In this specific section, extension appears as a 200 km strip dipping southward that cuts through external geological units both north and south of the profile. The extent of the deformation patterns is rather well resolved on this cross section. Only the thin lineaments observed in the extensive area below the CPF and in the surrounding strike-slip areas appear to be artefacts.
These features appear robust from the standard deviation cross sections (Figs. S5c and S6c). This strike-slip pattern located in the Briancçonnais area seems to correspond to a local transcurrent zone in a regional extensional area. In continuity with cross section 2 (Fig. 9b), the compressional zone is located directly next to the extensional area, with a sharp boundary at depth (10–25 km), while the respective shapes of the compressional and extensive patterns are poorly resolved (Figs. S5 and S6). Cross section 4 (Fig. 9d) runs from the Provence area to the south of the Po plain and regroups 245 focal mechanisms located up to 15 km away from the profile. This profile is designed tighter than the other ones due to the higher heterogeneity in the focal mechanisms at the surface (Fig. 7b). The vertical interpolation is consistent with the map interpolation and reveals that the extensive pattern seen on the Piémontais arc is rather deep (from 12 to 20 km deep) and is surrounded by predominant strike-slip regime all around, and more specifically at shallower levels. The extensive area located at depth under the Piémontais arc appears robust; however, its lateral extension, deep under the Argentera massif and the Po plain, seems poorly constrained.
4.1 Comparative analysis of surficial and deep seismic deformation
The reconstructed maps of deformation styles presented in Sect. 3.3 permit us to address the structural control on the seismicity distribution and its deformation mode. From seismicity maps and focal mechanism distributions, extension first appears continuous along the Briançonnais and Piémontais seismic arcs. However, once interpolated, strike-slip to transtensive regimes are prevailing not only at the periphery of the chain but also at several places intersecting the Briançonnais seismic arc, such as in the northern Briançonnais and Argentera, in association with significant energy release. Thus extension appears rather concentrated in several places along the belt in the southern Valais, in the Briançonnais, and in the Piémontais areas. Cross section views of the focal mechanism distribution on the contrary seem to indicate transverse clusters of seismic events located beneath the Briançonnais and Piémontais arcs and the Po plain (cross sections 2, 3, and 4 of Fig. 9), sometimes undergoing a continuous extensive regime from west to east (cross sections 3 and 4). These discrepancies are due to the vertical integration of all focal mechanisms resulting from the projection to the surface. In particular, it hides the vertical stratification of the tectonic regime, where strike-slip events often occur above the extensive ones. This is well documented by the Piémontais extensive events (cross sections 2 and 4).
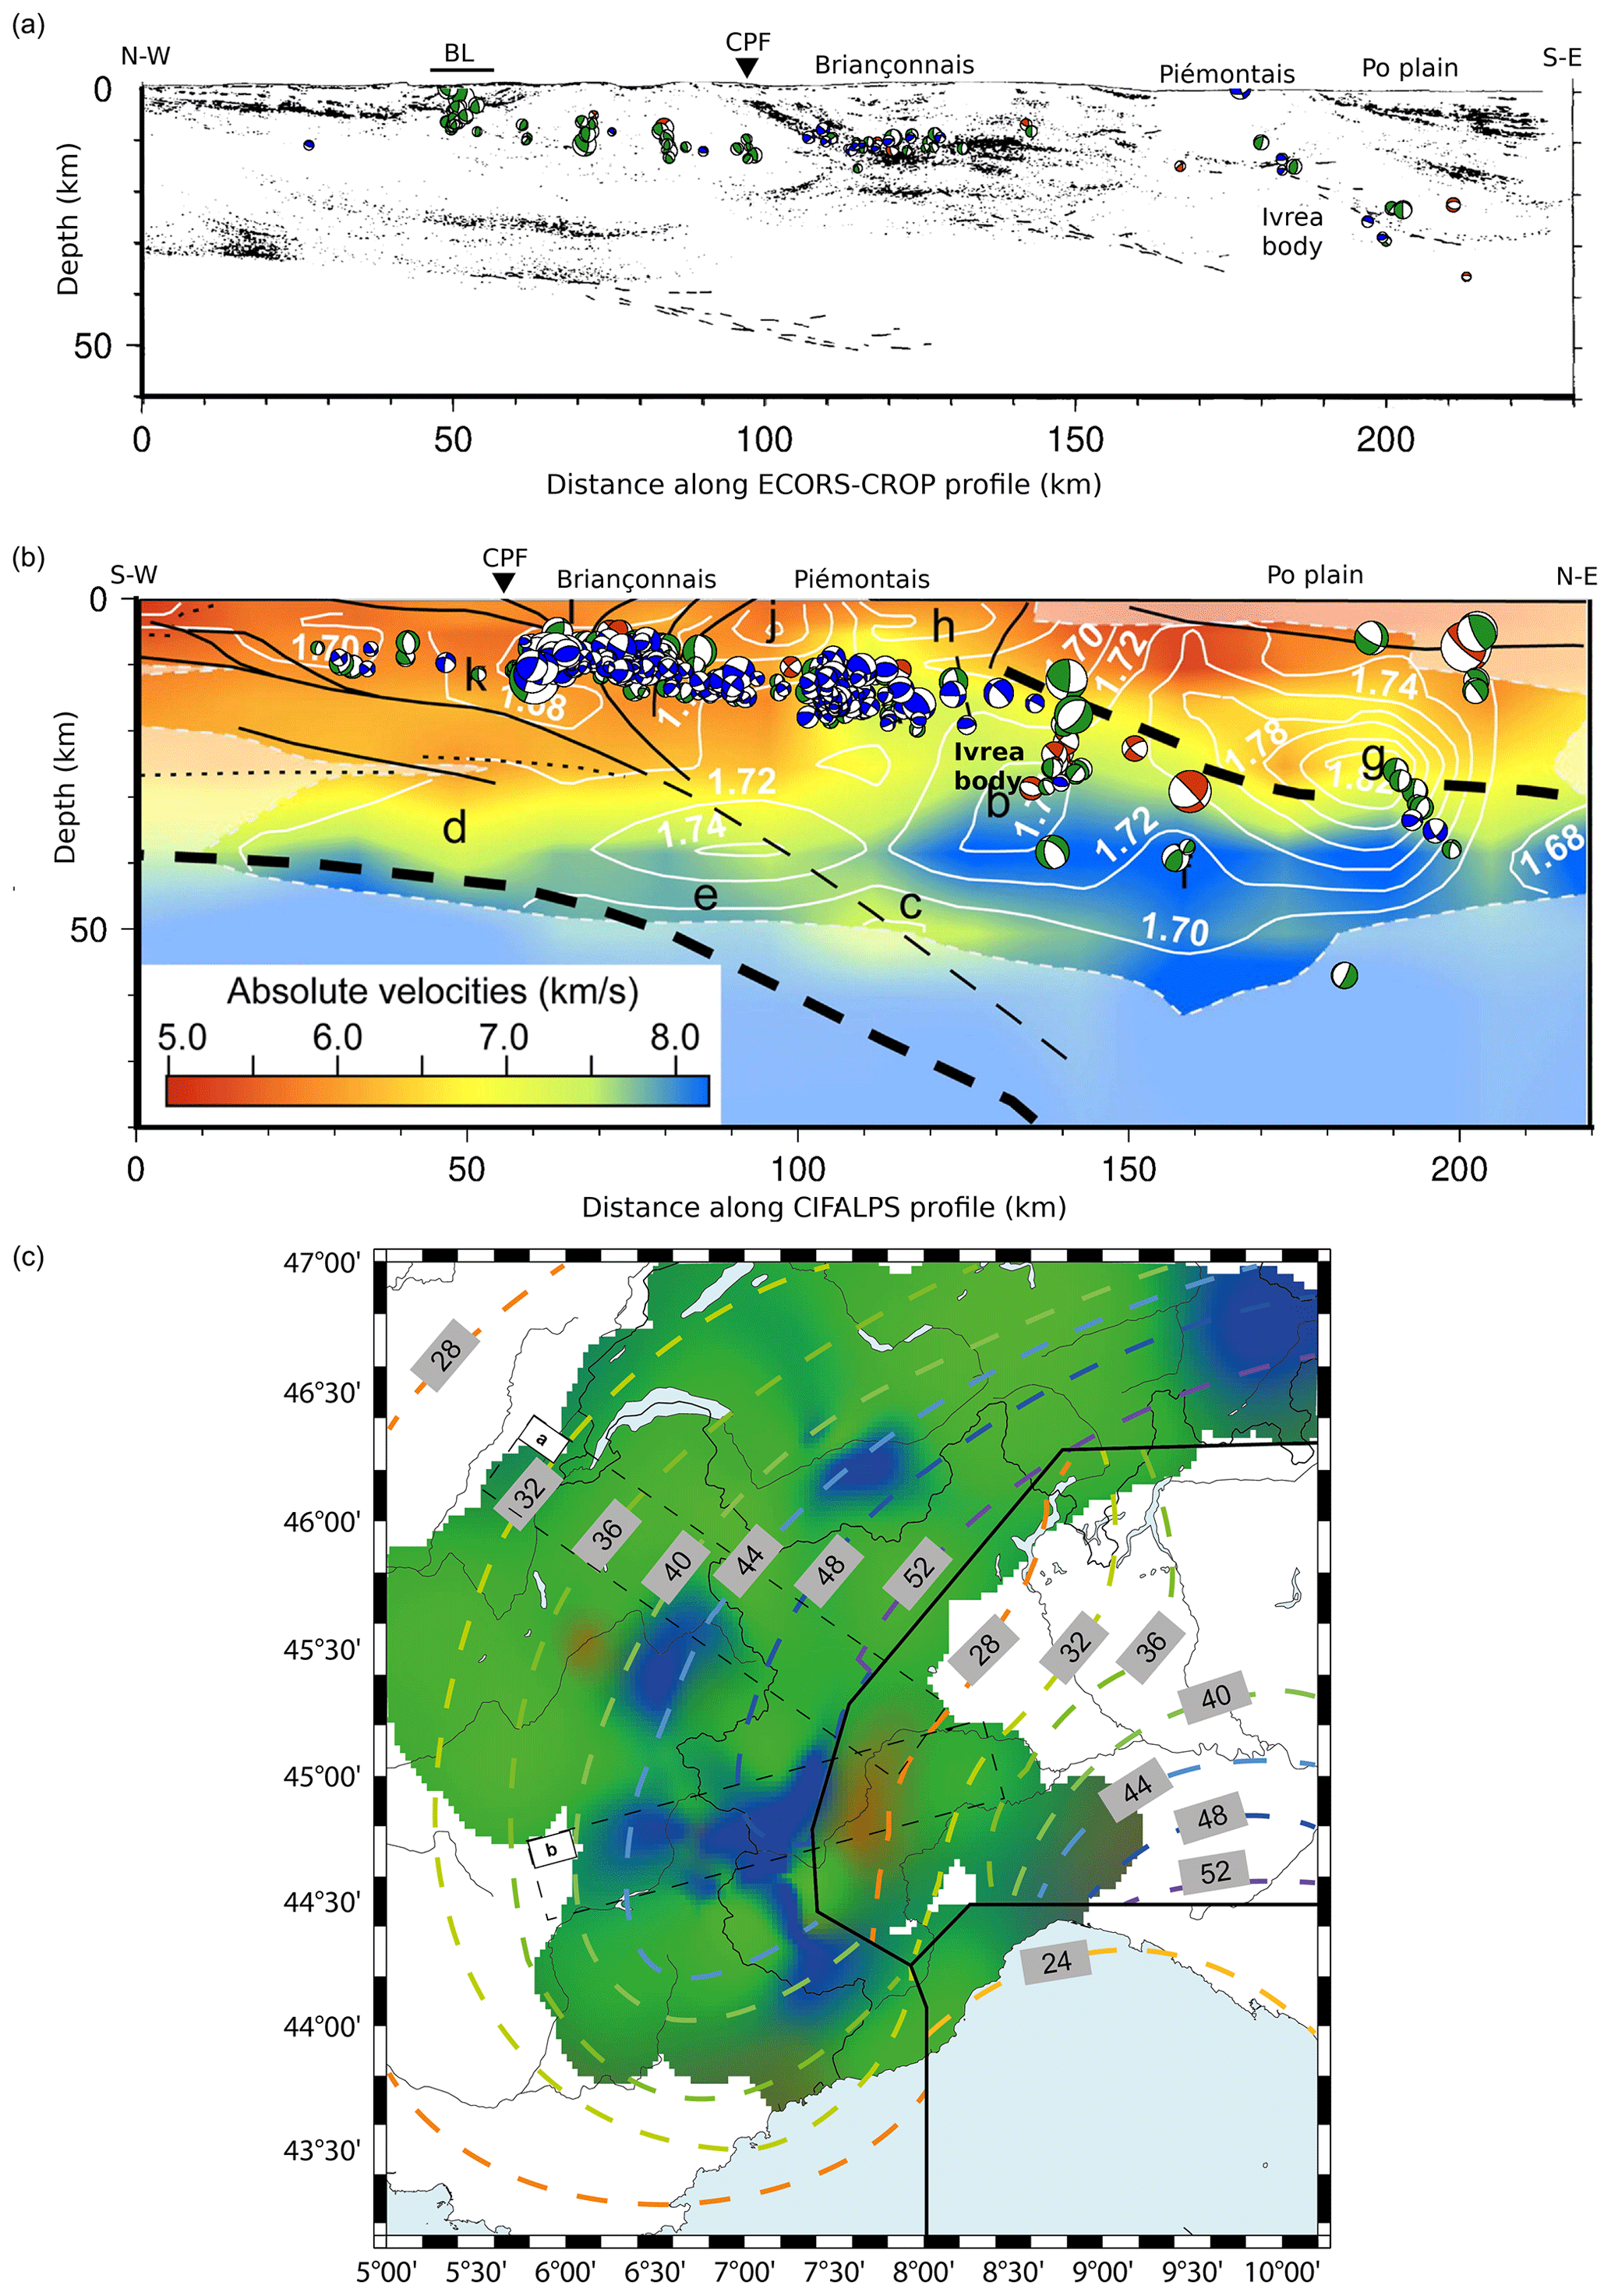
Figure 10(a) Cross section of computed focal mechanisms (vertical sections) projected on an ECORS-CROP seismic reflection profile (see projection width in c), modified from Marchant and Stampfli (1997). Green, blue, and red are for strike-slip, normal, and reverse mechanisms, respectively. Labels refer to geological features displayed in Fig. 3. (b) Focal mechanism (vertical sections) cross section projected on a CIFALPS profile (see projection width in c) of local earthquake tomography, modified from Solarino et al. (2018) and colour-coded as in (a). White contours are isolines of equal , solid lines represent main tectonic features, and bold letters refer to different regions of the model discussed in Solarino et al. (2018). Thick dashed lines represent European and Adriatic Mohos following Solarino et al. (2018). The Adriatic Moho is deflected west of the Po plain (∼ 15 km depth) at the location of the Ivrea body gravimetric anomaly. (c) Contours of Moho depth (in km) from Spada et al. (2013) superposed on the map of deformation style from Fig. 7. The European Moho (to the west), the Adriatic Moho (to the east), and the Ligurian Moho (to the south) are separated by thick black lines. The location of the seismic profiles (a) and (b) are indicated by dashed lines.
The link between these deformation patterns and the structural information is investigated in Fig. 10, where we show the location of our focal mechanisms at depth superposed on top of two geophysical profiles. One profile is based on seismic reflection (ECORS-CROP, Marchant and Stampfli, 1997), and the second profile is based on local earthquake tomography (Solarino et al., 2018). Our focal mechanisms appear to follow the main horizontal reflectors along the ECORS-CROP profile (Fig. 10a), with their depth increasing from west to east. Seismicity appears grouped in several patches of distinct deformation style along these two transverse profiles, especially beneath the Belledonne area and the Briançonnais and Piémontais arcs where the two main extensive patterns described in Sect. 3.3 lie. Both profiles highlight the limits between European and Adriatic upper crust, with a wedge of Adriatic mantle (the so-called Ivrea body, e.g. Lyon-Caen and Molnar, 1989; Paul et al., 2001) located at the boundary between the two crustal entities. Our focal mechanisms are localized in the upper crust. While the depth distribution of the focal mechanisms follows the dip of the European crust (Fig. 10b), the distribution of the style of deformation does not appear controlled by the structure of the European Moho, with both extensive and strike-slip events being imaged on the same sub-horizontal structure. However, a few seismic events are found deeper in the mantle wedge (Malusà et al., 2017), which correspond to the compressive fault plane solutions observed in the Po plain (Fig. 10b). The limit between the Piémontais extensive and the Po compressive patterns thus coincides with the boundary between the European crust and the Adriatic one. This is illustrated by the geometry of the Moho (Spada et al., 2013) on top of our map of interpolated deformation modes (Fig. 10c), where the limit between the European and the Adriatic Moho separates the Piémontais extensive zone from the Po compressive one (Fig. 10c).
4.2 Implications on Alpine geodynamics
In the present study we used state-of-the-art methods plus an innovative statistical approach to provide an updated 3D high-resolution view of the seismic deformation in this mountain belt. The unprecedented resolution of our analysis sheds new light regarding several detailed geodynamical aspects.
The current Alpine stress field and its related deformation mode have been investigated using inversion methods of focal mechanisms since the end of the 1990s (e.g. Baroux et al., 2001; Kastrup et al., 2004; Maurer et al., 1997) with increasing accuracy. Actually, these studies dealt with more or less local or regional areas, and only Delacou et al. (2004) addressed the problem at the scale of the entire Western and Central Alps. All these previous surveys relied on a limited number of focal mechanisms with respect to the present investigation, and they systematically were inverted within zones expected to be homogeneous in terms of deformation style based on structural criteria. Notwithstanding these limitations, former stress inversions in the Alps have established a first-order contrasted stress field (e.g. Maurer et al., 1997; Baroux et al., 2001; Sue et al., 2002; Delacou et al., 2004; Kastrup et al., 2004; Bauve et al., 2014). It is characterized by roughly orogen-perpendicular extension all along the backbone of the arc, surrounded by a transcurrent stress state at the periphery of the orogeny, locally modulated by a reverse component. These features remain compatible everywhere with a dextral motion along the strike of the belt. One of the main improvements of the present paper is the stress inversion using a grid strategy (Sect. 3.2), which is independent of any a priori zonation. Our new high-resolution imaging of the stress field around the Alpine arc injects important modulations into this first-order distribution. Firstly, transcurrent tectonism appears robust and much more important in the whole Alpine realm than previously thought, in association with significant energy release. This point is very important in terms of geodynamic interpretations and could not be properly imaged by the previous 2D analyses (Delacou et al., 2004). Secondly, we confirm the prevalence of extension in the core of the Alpine arc, but we point out a more complex scheme for the extensional zones (Figs. 7 and 9) in 3D, which appear now as extensional patches embedded within an overall transcurrent field (Fig. 7). These patches are located all along the so-called Briançonnais and Piémontais seismic arcs, but the continuity of the extensional area is no more supported by the inversion, as we retrieved four main zones of extension more or less disconnected one from the other (Fig. 7). The in-depth geometry of the extensional zones is also revealed for the first time by our inversion of the deformation mode (Fig. 9). Thirdly, the direction of the least compressive stress axes in the internal zones (namely the σ3 axes) is almost systematically deflected 30 to 40∘ clockwise from the orogen-perpendicular extension previously proposed (Sue et al., 2007a; Delacou et al., 2004; Sue et al., 1999; Eva et al., 1997). Moreover, we retrieved fewer and smaller local compressive areas than shown by the previous studies (e.g. Delacou et al., 2004; Eva et al., 1997). The only significant zone of shortening appears to be located in the Po plain. We also found a small zone of compression at the western front (Belledonne zone), but it is poorly constrained. Although some individual reverse focal mechanisms are noticed to the south of the arc (Mercantour and Var regions, Figs. 2 and 3), neither the deformation mode inversion nor the stress inversion pointed out a reliable stable compression in this zone, in contrast to the interpretation of Delacou et al. (2004). This may arise from the lack of data in the Ligurian Sea and surroundings in our dataset (for this specific zone see for instance Béthoux et al., 1992; Larroque et al., 2016). The compressive pattern we obtained in the Po plain is, however, stable and sharply juxtaposed with extension at the limit between Adriatic and European plates.
The contrasting juxtaposition of extension and compression occurs in a region of complex geometry and complex processes related to the Alpine orogeny (plate boundaries, Ivrea body). It has sometimes been interpreted in the literature as a border effect of gravitational collapse of the Western Alpine chain (e.g. Delacou et al., 2005), as well as a marker of indentation resulting from Africa–Eurasia current plate dynamics in other studies (e.g. Eva et al., 2020). In both cases, sharp variations in the stress field are expected. In the case of the gravitational collapse for instance, stresses depend on the spatial derivative of the load, and to some extent this varies like the derivative of the crustal thickness and topography: clearly, these variations occur on short spatial scales. While we cannot decipher which processes are at the origin of this very specific and local pattern, gravitational collapse schemes fail to explain the localized compressive pattern observed at the border of the chain, and indentation by Adria or Corso-Sardinia blocks does not appear to be the main process controlling crustal deformation nowadays in the Western Alps, since a majority of extension and strike-slip mechanisms are found, drawing a self-consistent transcurrent deformation field over the whole Western Alpine region.
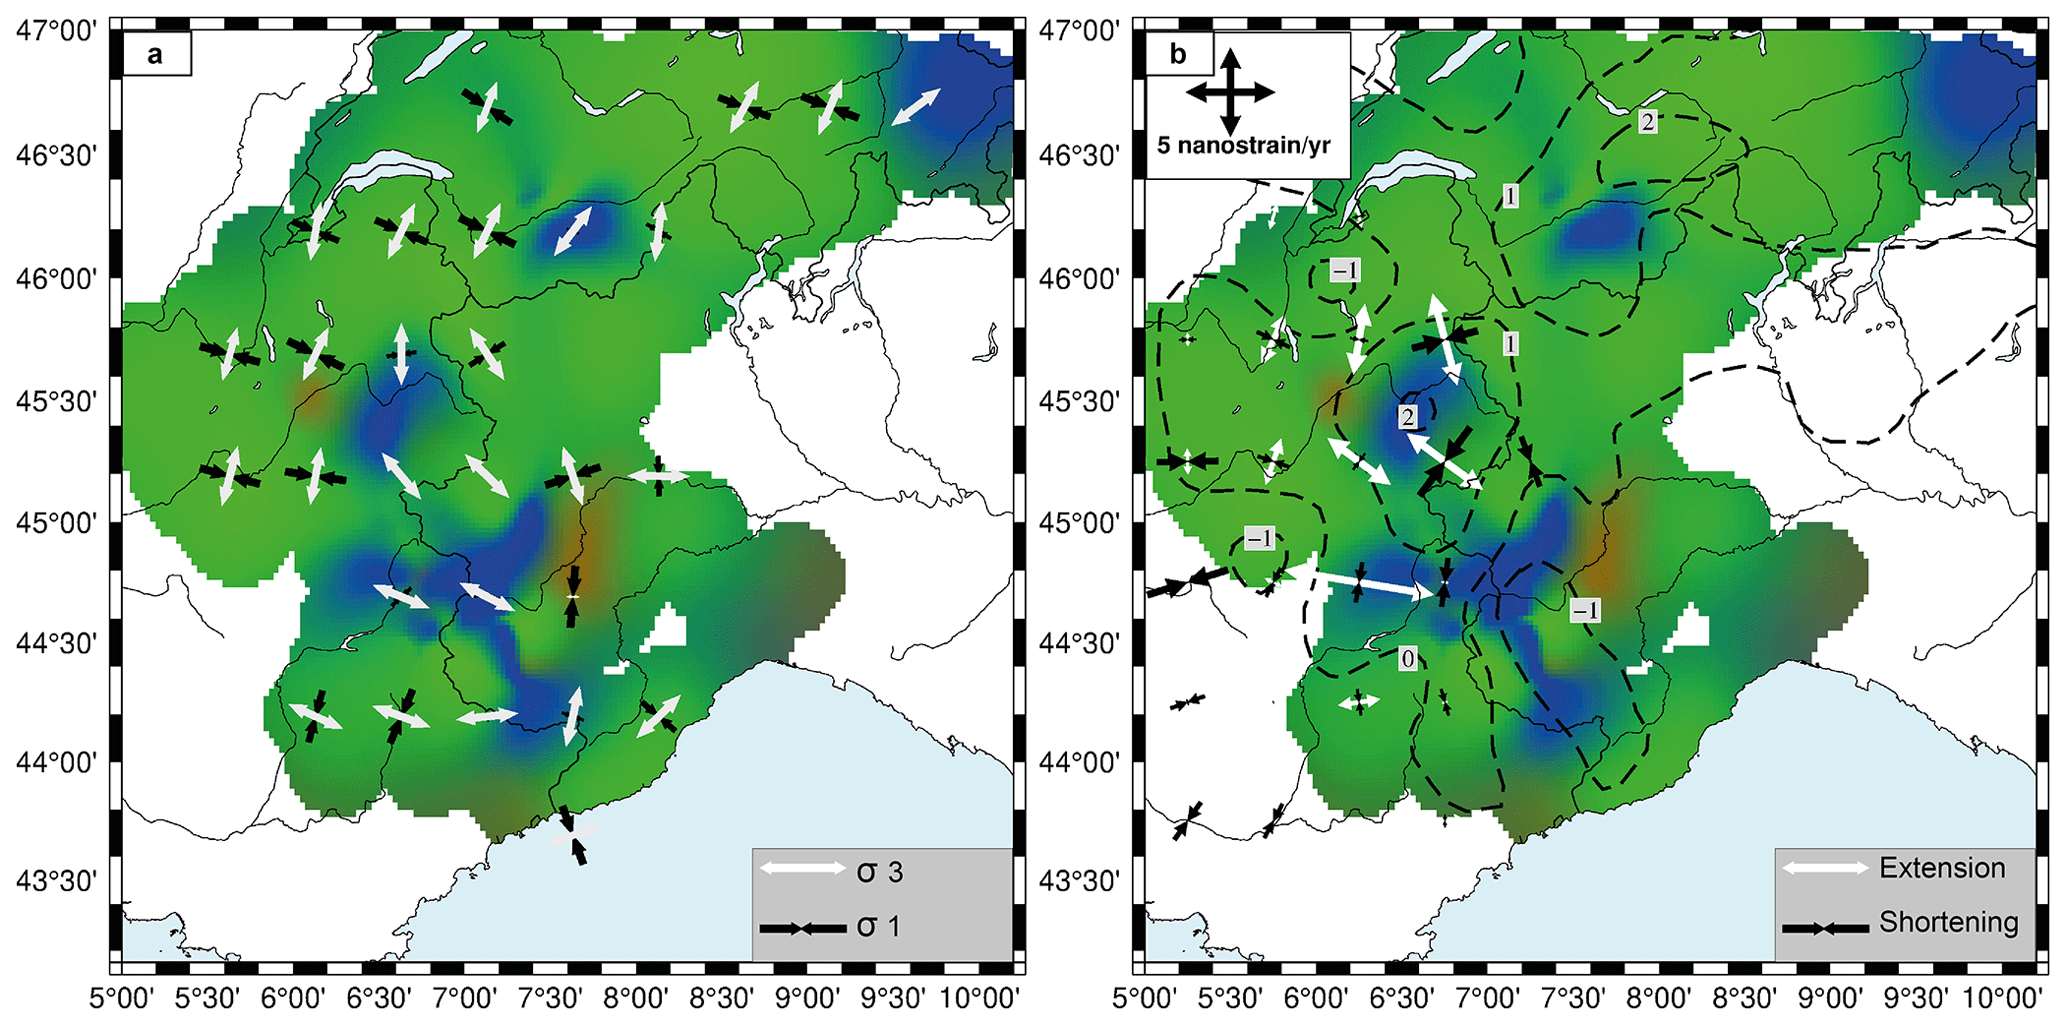
Figure 11(a) Stress field from MSATSI inversion from Fig. 6. (b) Global Navigation Satellite System (GNSS) strain rates from Walpersdorf et al. (2018) showing extension (white arrows) and compression (black arrows). Dashed lines represent contours of vertical velocities (in mm yr−1) from Sternai et al. (2019). In the background of both graphs is the Bayesian interpolation of deformation style from focal mechanisms from Fig. 7.
Beyond the seismotectonic approach sensu stricto (i.e. focal mechanisms analyses), the comparison of the seismotectonic-related deformation with the one mapped using geodesy can still enhance our comprehension of the Alpine geodynamics. The horizontal geodetic deformation in the Alps is well correlated with the seismotectonic one in terms of deformation style and of orientations (Fig. 11; Walpersdorf et al., 2018). In particular, the extensional tectonics observed in the core of the belt are now generally identified by recent GNSS studies (Masson et al., 2019; Mathey et al., 2020; Sánchez et al., 2018; Walpersdorf et al., 2015). However, vertical motions seen by GNSS yield a regional uplift roughly correlated to the Alpine topography in the northern and central part of the Western Alps, possibly up to 1 to 2 mm yr−1 (e.g. Serpelloni et al., 2013; Nocquet et al., 2016; although the magnitude can be disputed; see Husson et al., 2018). Our precise mapping of the seismic extension compared to GNSS uplift shows that the patterns of extension and uplift are spatially uncorrelated, especially in the southern branch of the Alpine arc (Fig. 11). Only two patterns of extension of our interpolated deformation map (in the northern Briançonnais seismic arc BRN and in the southern Valais VSS) correlate with uplift. The extension located along the Piémontais arc is (in contrast) associated with a zone of subsidence. Therefore, we state that uplift and extension, which were sometimes considered correlated (Champagnac et al., 2007; Vernant et al., 2013), are partially disconnected.
In terms of geodynamics, the question of the processes driving the current deformation of the Alps remains a matter of debate. The prevalence of extension in the core of the belt reinforced mounting evidence of geodetic uplift of the elevated regions of the Western Alps and led to the development of a series of models, alternatively involving intrinsic forces due to crustal and/or lithospheric roots and extrinsic processes (see Sternai et al., 2019, for a review). Extrinsic processes include the glacial isostatic adjustment (GIA; e.g. Gudmundsson, 1994; Mey et al., 2016; Chéry et al., 2016) and erosion (e.g. Champagnac et al., 2007; Sternai et al., 2012). According to Sternai et al. (2019), together they could explain 50 % to 70 % of the uplift rates observed in the Alps. Besides isostatic adjustment to crustal deformation, intrinsic processes are related to deep dynamics in the Alpine lithosphere and predictions largely rely on the knowledge of the thermo-mechanical properties of deep structures. The current state of the European slab beneath the Western Alps remains a matter of debate to this day. Evidence for both a detached slab (e.g. Lippitsch et al., 2003; Kissling et al., 2006; Diehl et al., 2009; Kästle et al., 2018) or a continuous slab (e.g. Piromallo and Faccenna, 2004; Zhao et al., 2015, 2016b) is claimed between different tomography models. The focal mechanisms derived in this study thus only provide seismic deformation styles up to 35 km, while the debated continuation of the European Moho beneath the Adriatic one is likely deeper than ∼ 60 km. While our results constrain a depth too shallow to help decipher between these two end-member models, we rely on the literature to suggest that a recently (< 5 Myr, e.g. Lippitsch et al., 2003) detached slab, with its detached extent nowadays located beneath the eastern margin of the Western Alps, could induce extension as well as uplift, due to lithospheric rebound processes and/or mantle upwelling related to the sinking into the asthenosphere of more dense lithospheric material (e.g. Sternai et al., 2019). Slab dynamics in particular (see Lippitsch et al., 2003; Zhao et al., 2015; Kästle et al., 2018) can cause transient dynamic topography (e.g. Faccenna and Becker, 2020) or influence exhumation processes (Baran et al., 2014; Fox et al., 2015).
All these mechanisms may, jointly or independently, explain the short-wavelength variations of the seismicity and kinematics. Yet, they cannot account for the robust transcurrent motion that prevails over the entire region. This strain field requires a more global geodynamic cause, and far-field forces need to be invoked. Plate tectonics set the stage for local Alpine tectonics. The anticlockwise rotation of Adria with respect to stable Europe (e.g. Calais et al., 2002; Serpelloni et al., 2005, 2007) largely counterbalances buoyancy forces (Delacou et al., 2005). While a purely plate-related geodynamic model seems discarded by now (D'Agostino et al., 2008; Devoti et al., 2008) due to the evidence of both extension and uplift in many places all along the Western Alpine arc, which cannot be explained by plate kinematics alone, we stress that our observations revive the role of plate motion in interaction with buoyancy forces in an attempt to explain the current Alpine kinematics and seismicity (Fig. 12). Indeed, in addition to the predominance of transcurrent tectonics that we point out at the scale of the whole Western and Central Alps and forelands, we show a deflection of the extension axes in the core of the belt with respect to simple orogen-perpendicular extension. Both the transcurrent stress field at the periphery of the orogen and the deflection of the extensional direction in the inner zones could be driven by anticlockwise rotation of Adria with respect to Europe. According to this scenario, buoyancy forces set the short-wavelength patterns of extension and compression, while far-field forces control the overall transcurrent field. Their joint effects interact to produce the complex deformation pattern and stress field revealed here (Fig. 12).
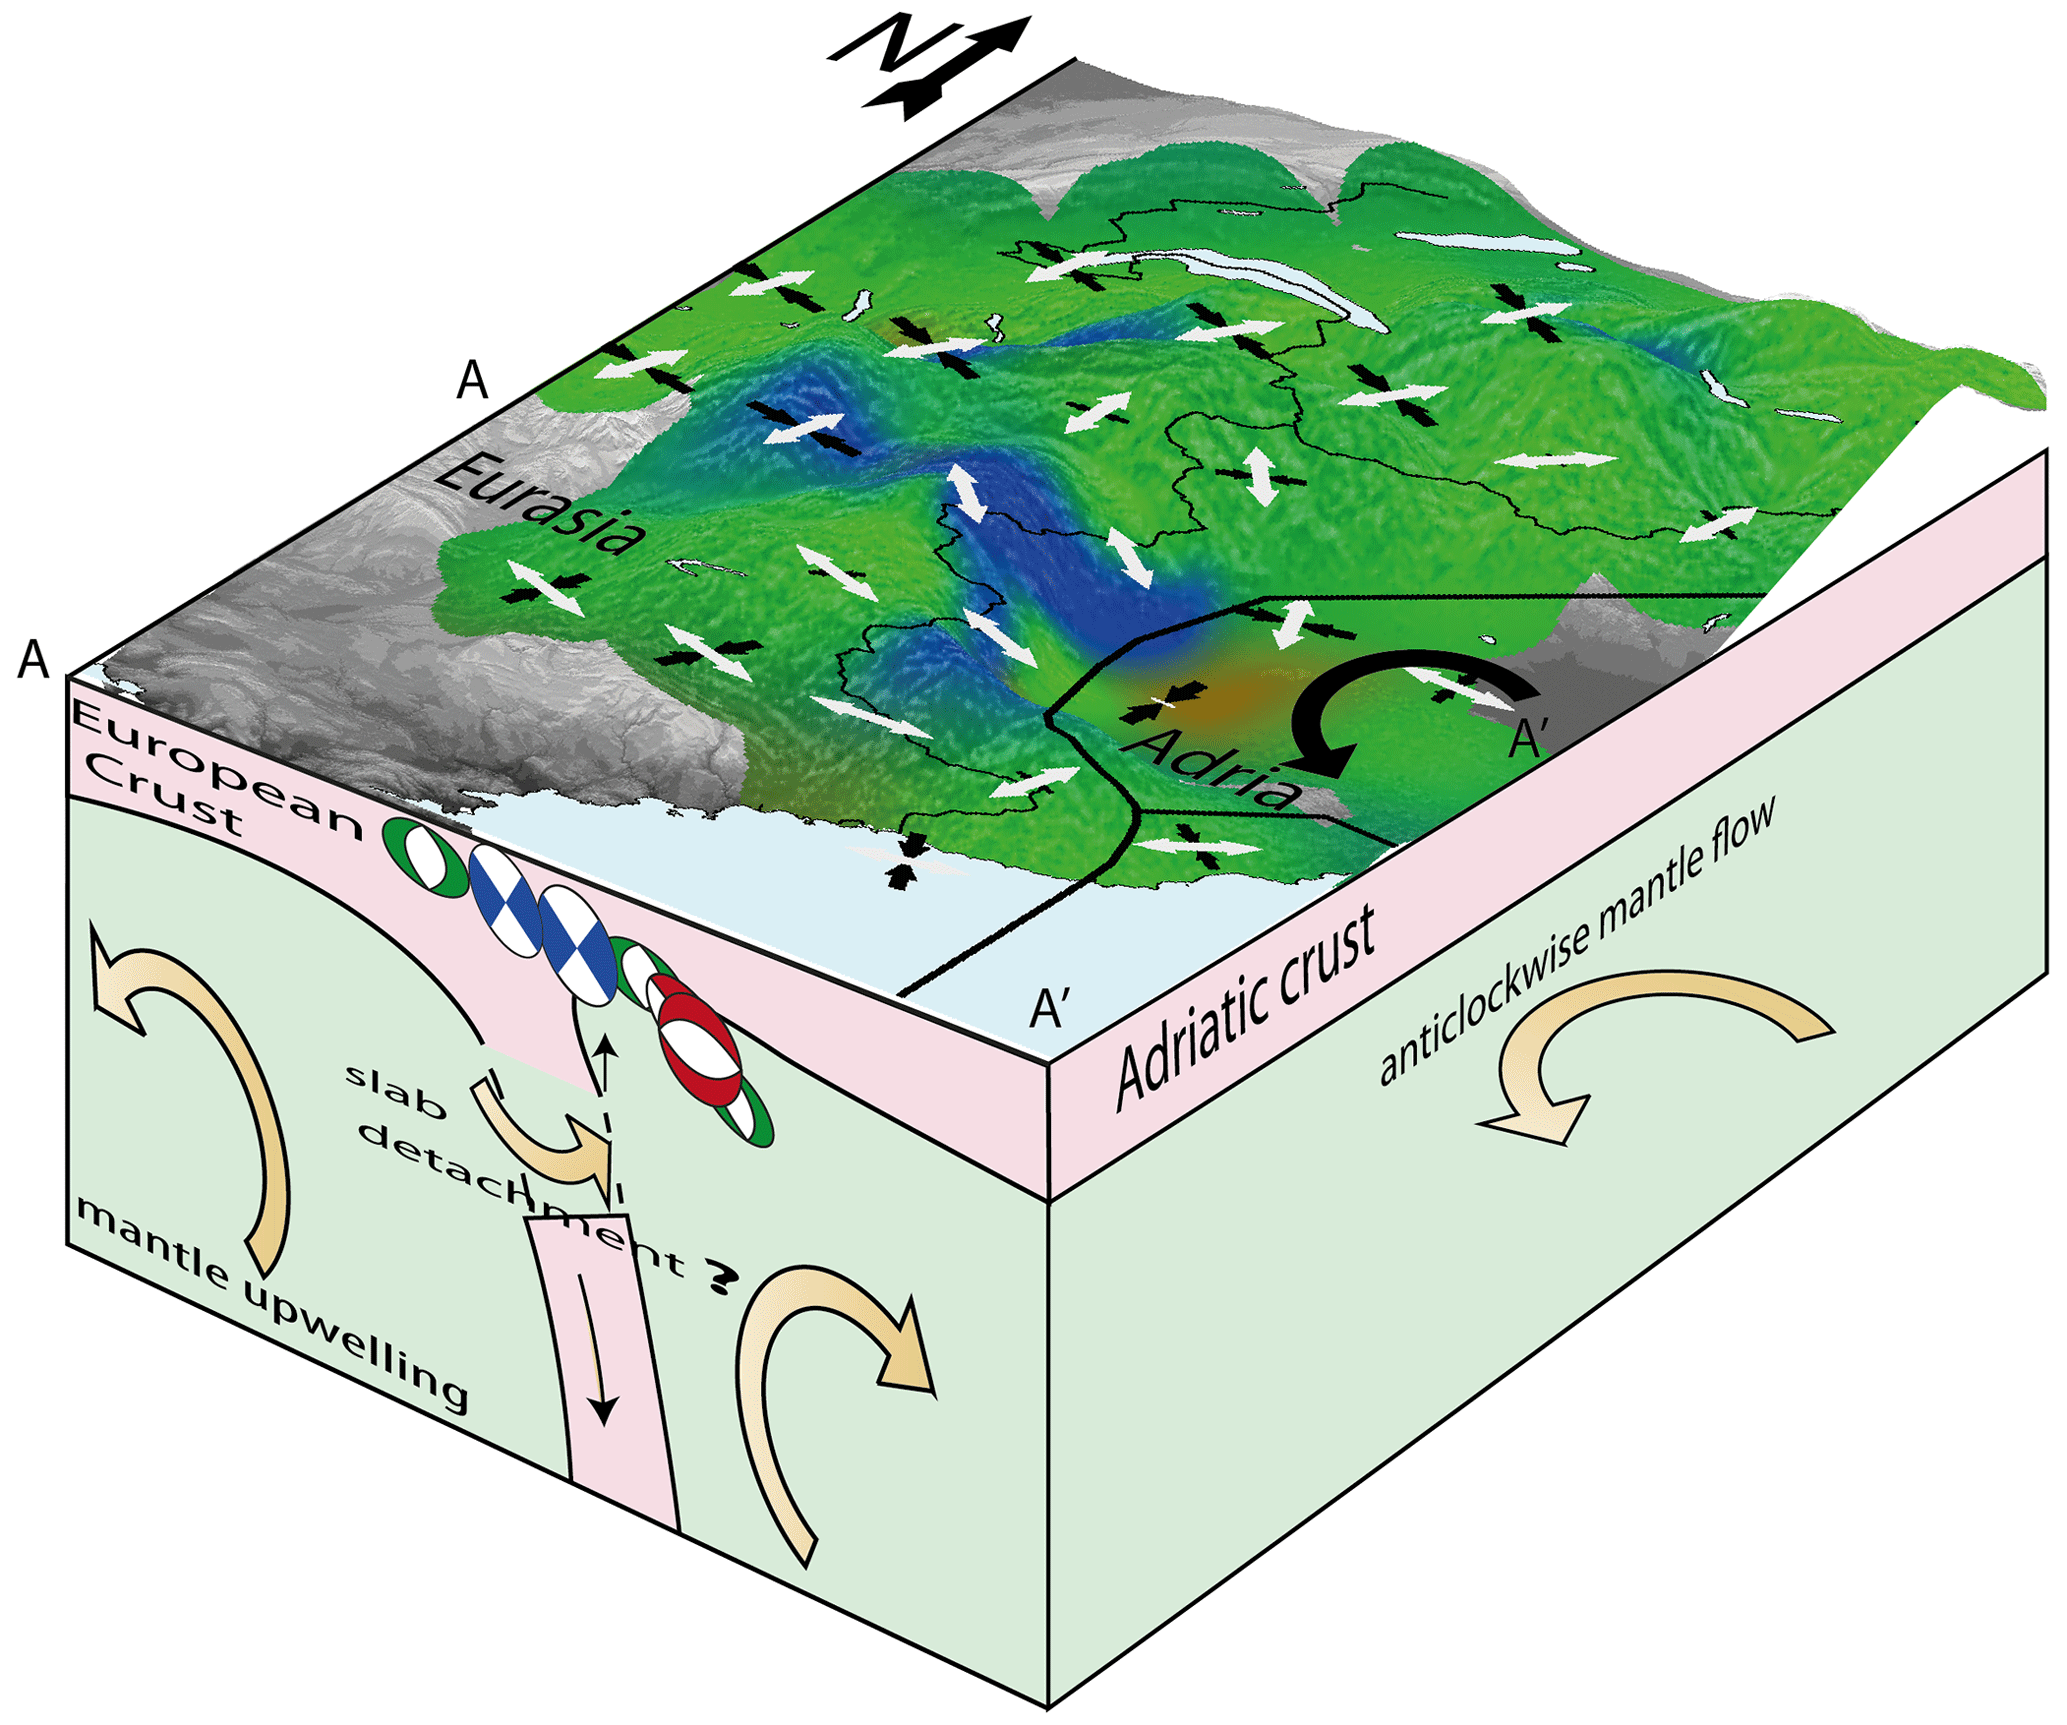
Figure 12Interpretative 3D block diagram of the current geodynamics of the Western Alps. The southern front of the diagram represents the interpretative A–A′ cross section running from the Pelvoux massif to the Po plain. The main observations are represented as in Fig. 11a. Forces suggested to be involved together to produce the observed seismic deformation field (far-field plate kinematics and buoyancy forces) are represented as solid arrows: Adria anticlockwise rotation is shown as a black arrow, and mantle upwelling and possible slab detachment are shown as gold arrows.
The three-dimensional analysis of the mode and orientation of seismic deformation within the Western Alps provides, for the first time, a spatial resolution without the use of any a priori seismotectonic zonation. The exceptional density of seismic data acquired within the Western Alps for the past 25 years allowed us to derive focal mechanisms for low-magnitude events that were, to date, unavailable. From this new dataset we inferred a continuous seismic deformation field characterized by the deformation style, at the surface and at depth, associated with an up-to-date objective surface stress field. The resulting seismic deformation field is overall consistent with the deformation patterns retrieved by previous seismotectonics studies as well as with the horizontal geodetic observations. At depth, the distribution of computed focal mechanisms matches the main reflectors already unveiled by seismic imaging methods. Our results also highlight new features that could be observed only due to the increased spatial resolution we provided. Most importantly, the probabilistic inversion of focal mechanisms points out a robust predominant strike-slip regime at the regional scale, with dextral motion consistent with the strike of the belt and robust discontinuous extensive patches in the core of the belt, while restricting robust compression to the Po plain and western Alpine front. The pattern of deformation at depth raises the issue of the continuity of the extension pattern, as patches of extension appear clustered along the two main seismic arcs. Extensional directions are in good agreement with long-term geodetic strain rates and appear robustly oblique to the arc from three inversion methods. The high spatial resolution seismotectonic field sheds a new light on the current dynamics of the Alpine orogen, wherein far-field plate tectonics, linked to the anticlockwise rotation of Adria with respect to Europe, imposes a global transcurrent regime, while buoyancy forces explain the short wavelength variations of extension and marginal compression in the core of the belt.
All the focal mechanisms computed for this study and the corresponding dataset are available in the Supplement.
Supplementary_revised2.pdf contains Figs. S1 to S8 and Tables S1 to S2. liste_meca.txt contains Table S1 in digital format. computedFM_HASHformat.inp contains the data used to compute the focal mechanisms. The supplement related to this article is available online at: https://doi.org/10.5194/se-12-1661-2021-supplement.
BP relocalized the dataset. MM and BP computed the focal mechanisms. MM, CS, and EH carried the formal analysis out. CP and TB developed the surface reconstruction algorithms and codes. CS, AW, SB, and LH administered and supervised the project. All authors analysed, discussed, and validated the results. MM prepared the manuscript with contributions from all co-authors.
The authors declare that they have no conflict of interest.
Publisher's note: Copernicus Publications remains neutral with regard to jurisdictional claims in published maps and institutional affiliations.
This article is part of the special issue “New insights into the tectonic evolution of the Alps and the adjacent orogens”. It is not associated with a conference.
This work was funded by both the IRSN (Institut de Radioprotection et de Sûreté Nucléaire) and the LabEx OSUG@2020 (Investissement d'avenir – ANR10LABX56). The authors thank the editor and two anonymous reviewers for their help in improving the manuscript. The authors would like to thank the Sismalp team for maintaining the regional seismic observation network. This work contributes to an effort toward the valorization of long-term seismic and geodetic observations in the framework of the RESIF-EPOS National Research Infrastructure (Réseau Sismologique et géodésique Français, https://doi.org/10.15778/RESIF.FR, RESIF, 1995). This work was only possible thanks to the operators of the following networks: RESIF (FR, https://doi.org/10.15778/RESIF.FR, RESIF, 1995), RSNI (GU, https://doi.org/10.7914/SN/GU, University of Genoa, 1967), SED (CH, https://doi.org/10.12686/sed/networks/ch, SED, 1983), and CIFALPS (YP, (https://doi.org/10.15778/RESIF.YP2012, Zhao et al., 2016a).
This research has been supported by the Institut de Radioprotection et de SÛreté Nucléaire (grant no. ANR10LABX56).
This paper was edited by Giancarlo Molli and reviewed by two anonymous referees.
Alvarez-Gómez, J. A.: FMC – Earthquake focal mechanisms data management, cluster and classification, SoftwareX, 9, 299–307, https://doi.org/10.1016/j.softx.2019.03.008, 2019.
Baran, R., Friedrich, A. M., and Schlunegger, F.: The late Miocene to Holocene erosion pattern of the Alpine foreland basin reflects Eurasian slab unloading beneath the western Alps rather than global climate change, Lithosphere, 6, 124–131, 2014.
Baroux, E., Béthoux, N., and Bellier, O.: Analyses of the stress field in southeastern France from earthquake focal mechanisms, Geophys. J. Int., 145, 336–348, https://doi.org/10.1046/j.1365-246x.2001.01362.x, 2001.
Bauve, V., Plateaux, R., Rolland, Y., Sanchez, G., Bethoux, N., Delouis, B., and Darnault, R.: Long-lasting transcurrent tectonics in SW Alps evidenced by Neogene to present-day stress fields, Tectonophysics, 621, 85–100, https://doi.org/10.1016/j.tecto.2014.02.006, 2014.
Bertrand, A. and Sue, C.: Reconciling late faulting over the whole Alpine belt: from structural analysis to geochronological constrains, Swiss J. Geosci., 110, 565–580, 2017.
Béthoux, N., Fréchet, J., Guyoton, F., Thouvenot, F., Cattaneo, M., Eva, C., Nicolas, M., and Granet, M.: A closing Ligurian Sea?, Pure Appl. Geophys., 139, 179–194, https://doi.org/10.1007/BF00876326, 1992.
Bilau, A., Rolland, Y., Schwartz, S., Godeau, N., Guihou, A., Deschamps, P., Brigaud, B., Noret, A., Dumont, T., and Gautheron, C.: Extensional reactivation of the Penninic frontal thrust 3 Myr ago as evidenced by U–Pb dating on calcite in fault zone cataclasite, Solid Earth, 12, 237–251, https://doi.org/10.5194/se-12-237-2021, 2021.
Bodin, T., Salmon, M., Kennett, B. L. N., and Sambridge, M.: Probabilistic surface reconstruction from multiple data sets: An example for the Australian Moho, J. Geophys. Res.-Sol. Ea., 117, B10307, https://doi.org/10.1029/2012JB009547, 2012.
Calais, E., Nocquet, J.-M., Jouanne, F., and Tardy, M.: Current strain regime in the Western Alps from continuous Global Positioning System measurements, 1996–2001, Geology, 30, 651–654, https://doi.org/10.1130/0091-7613(2002)030<0651:CSRITW>2.0.CO;2, 2002.
Cara, M., Cansi, Y., Schlupp, A., Arroucau, P., Béthoux, N., Beucler, E., Bruno, S., Calvet, M., Chevrot, S., Deboissy, A., Delouis, B., Denieul, M., Deschamps, A., Doubre, C., Fréchet, J., Godey, S., Golle, O., Grunberg, M., Guilbert, J., Haugmard, M., Jenatton, L., Lambotte, S., Leobal, D., Maron, C., Mendel, V., Merrer, S., Macquet, M., Mignan, A., Mocquet, A., Nicolas, M., Perrot, J., Potin, B., Sanchez, O., Santoire, J.-P., Sèbe, O., Sylvander, M., Thouvenot, F., Woerd, J. V. D., and Woerd, K. V. D.: SI-Hex: a new catalogue of instrumental seismicity for metropolitan France, Bull. Société Géologique Fr., 186, 3–19, https://doi.org/10.2113/gssgfbull.186.1.3, 2015.
Cauzzi, C. and Clinton, J.: A high- and low-noise model for high-quality strong-motion accelerometer stations, Earthq. Spectra, 29, 85–102, https://doi.org/10.1193/1.4000107, 2013.
Champagnac, J. D., Sue, C., Delacou, B., Tricart, P., Allanic, C., and Burkhard, M.: Miocene lateral extrusion in the inner western Alps revealed by dynamic fault analysis, Tectonics, 25, TC3014, https://doi.org/10.1029/2004TC001779, 2006.
Champagnac, J. D., Molnar, P., Anderson, R. S., Sue, C., and Delacou, B.: Quaternary erosion-induced isostatic rebound in the western Alps, Geology, 35, 195–198, https://doi.org/10.1130/G23053A.1, 2007.
Champagnac, J.-D., Molnar, P., Sue, C., and Herman, F.: Tectonics, climate, and mountain topography, J. Geophys. Res.-Sol. Ea., 117, B02403, https://doi.org/10.1029/2011JB008348, 2012.
Chéry, J., Genti, M., and Vernant, P.: Ice cap melting and low-viscosity crustal root explain the narrow geodetic uplift of the Western Alps, Geophys. Res. Lett., 43, 3193–3200, https://doi.org/10.1002/2016GL067821, 2016.
Choblet, G., Husson, L., and Bodin, T.: Probabilistic surface reconstruction of coastal sea level rise during the twentieth century, J. Geophys. Res.-Sol. Ea., 119, 9206–9236, 2014.
Coward, M. and Dietrich, D.: Alpine tectonics – an overview, Geol. Soc. Lond. Spec. Publ., 45, 1–29, 1989.
D'Agostino, N., Avallone, A., Cheloni, D., D'Anastasio, E., Mantenuto, S., and Selvaggi, G.: Active tectonics of the Adriatic region from GPS and earthquake slip vectors, J. Geophys. Res.-Sol. Ea., 113, B12413, https://doi.org/10.1029/2008JB005860, 2008.
D'Amico, S.: Moment tensor solutions: A useful tool for seismotectonics, Springer, Cham, Switzerland, 2018.
Delacou, B., Sue, C., Champagnac, J.-D., and Burkhard, M.: Present-day geodynamics in the bend of the western and central Alps as constrained by earthquake analysis, Geophys. J. Int., 158, 753–774, https://doi.org/10.1111/j.1365-246X.2004.02320.x, 2004.
Delacou, B., Sue, C., Champagnac, J.-D., and Burkhard, M.: Origin of the current stress field in the western/central Alps: role of gravitational re-equilibration constrained by numerical modelling, Geol. Soc. Lond. Spec. Publ., 243, 295–310, 2005.
Devoti, R., Riguzzi, F., Cuffaro, M., and Doglioni, C.: New GPS constraints on the kinematics of the Apennines subduction, Earth Planet. Sci. Lett., 273, 163–174, https://doi.org/10.1016/j.epsl.2008.06.031, 2008.
Diehl, T., Husen, S., Kissling, E., and Deichmann, N.: High-resolution 3-DP-wave model of the Alpine crust, Geophys. J. Int., 179, 1133–1147, 2009.
Diehl, T., Clinton, J., Deichmann, N., Cauzzi, C., Kästli, P., Kraft, T., Molinari, I., Böse, M., Michel., C., Hobiger, M., Haslinger, F., Fäh, D., and Wiemer, S.: Earthquakes in Switzerland and surrounding regions during 2015 and 2016, Swiss J. Geosci., 111, 221–244, 2018.
Diehl, T., Clinton, J., Cauzzi, C., Kraft, T., Kästli, P., Deichmann, N., Massin, F., Grigoli, F., Molinari, I., Böse, M., Hobiger, M., Haslinger, F., Fäh, D., and Wiemer, S.: Earthquakes in Switzerland and surrounding regions during 2017 and 2018, Swiss J. Geosci., 114, 1–29, 2021.
Eva, E., Solarino, S., Eva, C., and Neri, G.: Stress tensor orientation derived from fault plane solutions in the southwestern Alps, J. Geophys. Res.-Sol. Ea., 102, 8171–8185, https://doi.org/10.1029/96JB02725, 1997.
Eva, E., Pastore, S., and Deichmann, N.: Evidence for ongoing extensional deformation in the western Swiss Alps and thrust-faulting in the southwestern Alpine foreland, J. Geodyn., 26, 27–43, https://doi.org/10.1016/S0264-3707(97)00022-7, 1998.
Eva, E., Malusà, M., and Solarino, S.: Seismotectonics at the transition between opposite-dipping slabs (western Alpine region), Tectonics, 39, e2020TC006086, https://doi.org/10.1029/2020TC006086, 2020.
Faccenna, C. and Becker, T. W.: Topographic expressions of mantle dynamics in the Mediterranean, Earth-Sci. Rev., 209, 103327, https://doi.org/10.1016/j.earscirev.2020.103327, 2020.
Fox, M., Herman, F., Kissling, E., and Willett, S. D.: Rapid exhumation in the Western Alps driven by slab detachment and glacial erosion, Geology, 43, 379–382, 2015.
Frohlich, C.: Triangle diagrams: ternary graphs to display similarity and diversity of earthquake focal mechanisms, Phys. Earth Planet. Inter., 75, 193–198, 1992.
Gephart, J. W.: FMSI: A fortran program for inverting fault/slickenside and earthquake focal mechanism data to obtain the regional stress tensor, Comput. Geosci., 16, 953–989, https://doi.org/10.1016/0098-3004(90)90105-3, 1990.
Gudmundsson, G.: An order-of-magnitude estimate of the current uplift-rates in Switzerland caused by the Würm Alpine deglaciation, Eclogae Geol. Helv., 87, 545–557, 1994.
Handy, M. R., M. Schmid, S., Bousquet, R., Kissling, E., and Bernoulli, D.: Reconciling plate-tectonic reconstructions of Alpine Tethys with the geological–geophysical record of spreading and subduction in the Alps, Earth-Sci. Rev., 102, 121–158, https://doi.org/10.1016/j.earscirev.2010.06.002, 2010.
Hanks, T. C. and Kanamori, H.: A moment magnitude scale, J. Geophys. Res.-Sol. Ea., 84, 2348–2350, https://doi.org/10.1029/JB084iB05p02348, 1979.
Hardebeck, J. L. and Hauksson, E.: Stress Orientations Obtained from Earthquake Focal Mechanisms: What Are Appropriate Uncertainty Estimates?, Bull. Seismol. Soc. Am., 91, 250–262, https://doi.org/10.1785/0120000032, 2001.
Hardebeck, J. L. and Michael, A. J.: Damped regional-scale stress inversions: Methodology and examples for southern California and the Coalinga aftershock sequence, J. Geophys. Res.-Sol. Ea., 111, B11310, https://doi.org/10.1029/2005JB004144, 2006.
Hardebeck, J. L. and Shearer, P. M.: A New Method for Determining First-Motion Focal Mechanisms, Bull. Seismol. Soc. Am., 92, 2264–2276, https://doi.org/10.1785/0120010200, 2002.
Hawkins, R., Husson, L., Choblet, G., Bodin, T., and Pfeffer, J.: Virtual tide gauges for predicting relative sea level rise, J. Geophys. Res.-Sol. Ea., 124, 13367–13391, 2019a.
Hawkins, R., Bodin, T., Sambridge, M., Choblet, G., and Husson, L.: Trans-dimensional surface reconstruction with different classes of parameterization, Geochem. Geophy. Geosy., 20, 505–529, 2019b.
Husson, L., Bodin, T., Spada, G., Choblet, G., and Kreemer, C.: Bayesian surface reconstruction of geodetic uplift rates: Mapping the global fingerprint of Glacial Isostatic Adjustment, J. Geodyn., 122, 25–40, https://doi.org/10.1016/j.jog.2018.10.002, 2018.
Kästle, E. D., El-Sharkawy, A., Boschi, L., Meier, T., Rosenberg, C., Bellahsen, N., Cristiano, L., and Weidle, C.: Surface Wave Tomography of the Alps Using Ambient-Noise and Earthquake Phase Velocity Measurements, J. Geophys. Res.-Sol. Ea., 123, 1770–1792, https://doi.org/10.1002/2017JB014698, 2018.
Kastrup, U., Zoback, M. L., Deichmann, N., Evans, K. F., Giardini, D., and Michael, A. J.: Stress field variations in the Swiss Alps and the northern Alpine foreland derived from inversion of fault plane solutions, J. Geophys. Res.-Sol. Ea., 109, B01402, https://doi.org/10.1029/2003JB002550, 2004.
Kissling, E., Schmid, S. M., Lippitsch, R., Ansorge, J., and Fügenschuh, B.: Lithosphere structure and tectonic evolution of the Alpine arc: new evidence from high-resolution teleseismic tomography, Geological Society, London, Memoirs, 32, 129–145, 2006.
Kostrov, V. V.: Seismic moment and energy of earthquakes, and seismic flow of rock, Izv. Acad. Sci. USSR Phys. Solid Earth Engl. Transl., 1, 23–44, 1974.
Larroque, C., Delouis, B., Sage, F., Régnier, M., Béthoux, N., Courboulex, F., and Deschamps, A.: The sequence of moderate-size earthquakes at the junction of the Ligurian basin and the Corsica margin (western Mediterranean): The initiation of an active deformation zone revealed?, Tectonophysics, 676, 135–147, https://doi.org/10.1016/j.tecto.2016.03.027, 2016.
Laurendeau, A., Clement, C., and Scotti, O.: A unified Mw-based earthquake catalog for metropolitan France consistent with European catalogs, Montréal, available at: https://hal.archives-ouvertes.fr/hal-02635592 (last access: 16 August 2020), 2019.
Lippitsch, R., Kissling, E., and Ansorge, J.: Upper mantle structure beneath the Alpine orogen from high-resolution teleseismic tomography, J. Geophys. Res.-Sol. Ea., 108, 2376, https://doi.org/10.1029/2002JB002016, 2003.
Lund, B. and Townend, J.: Calculating horizontal stress orientations with full or partial knowledge of the tectonic stress tensor, Geophys. J. Int., 170, 1328–1335, https://doi.org/10.1111/j.1365-246X.2007.03468.x, 2007.
Lyon-Caen, H. and Molnar, P.: Constraints on the deep structure and dynamic processes beneath the Alps and adjacent regions from an analysis of gravity anomalies, Geophys. J. Int., 99, 19–32, 1989.
Malinverno, A. and Briggs, V. A.: Expanded uncertainty quantification in inverse problems: Hierarchical Bayes and empirical Bayes, Geophysics, 69, 1005–1016, 2004.
Malusà, M. G., Zhao, L., Eva, E., Solarino, S., Paul, A., Guillot, S., Schwartz, S., Dumont, T., Aubert, C., Salimbeni, S., Pondrelli, S., Wang, Q., and Zhu, R.: Earthquakes in the western Alpine mantle wedge, Gondwana Res., 44, 89–95, https://doi.org/10.1016/j.gr.2016.11.012, 2017.
Marchant, R. H. and Stampfli, G. M.: Subduction of continental crust in the Western Alps, Tectonophysics, 269, 217–235, https://doi.org/10.1016/S0040-1951(96)00170-9, 1997.
Martínez-Garzón, P., Kwiatek, G., Ickrath, M., and Bohnhoff, M.: MSATSI: A MATLAB Package for Stress Inversion Combining Solid Classic Methodology, a New Simplified User-Handling, and a Visualization Tool, Seismol. Res. Lett., 85, 896–904, https://doi.org/10.1785/0220130189, 2014.
Masson, C., Mazzotti, S., Vernant, P., and Doerflinger, E.: Extracting small deformation beyond individual station precision from dense Global Navigation Satellite System (GNSS) networks in France and western Europe, Solid Earth, 10, 1905–1920, https://doi.org/10.5194/se-10-1905-2019, 2019.
Mathey, M., Walpersdorf, A., Sue, C., Baize, S., and Deprez, A.: Seismogenic potential of the High Durance Fault constrained by 20 yr of GNSS measurements in the Western European Alps, Geophys. J. Int., 222, 2136–2146, https://doi.org/10.1093/gji/ggaa292, 2020.
Maurer, H. R., Burkhard, M., Deichmann, N., and Green, A. G.: Active tectonism in the central Alps: contrasting stress regimes north and south of the Rhone Valley, Terra Nova, 9, 91–94, https://doi.org/10.1111/j.1365-3121.1997.tb00010.x, 1997.
Mazzotti, S., Jomard, H., and Masson, F.: Processes and deformation rates generating seismicity in metropolitan France and conterminous Western Europe, BSGF – Earth Sci. Bull., 191, 19, https://doi.org/10.1051/bsgf/2020019, 2020.
Mey, J., Scherler, D., Wickert, A. D., Egholm, D. L., Tesauro, M., Schildgen, T. F., and Strecker, M. R.: Glacial isostatic uplift of the European Alps, Nat. Commun., 7, 13382, https://doi.org/10.1038/ncomms13382, 2016.
Nocquet, J.-M. and Calais, E.: Geodetic Measurements of Crustal Deformation in the Western Mediterranean and Europe, Pure Appl. Geophys., 161, 661–681, https://doi.org/10.1007/s00024-003-2468-z, 2004.
Nocquet, J.-M., Sue, C., Walpersdorf, A., Tran, T., Lenôtre, N., Vernant, P., Cushing, M., Jouanne, F., Masson, F., Baize, S., Chéry, J., and van der Beek, P. A.: Present-day uplift of the western Alps, Sci. Rep., 6, 28404, https://doi.org/10.1038/srep28404, 2016.
Paul, A., Cattaneo, M., Thouvenot, F., Spallarossa, D., Béthoux, N., and Fréchet, J.: A three-dimensional crustal velocity model of the southwestern Alps from local earthquake tomography, J. Geophys. Res.-Sol. Ea., 106, 19367–19389, https://doi.org/10.1029/2001JB000388, 2001.
Piromallo, C. and Faccenna, C.: How deep can we find the traces of Alpine subduction?, Geophys. Res. Lett., 31, L06605, https://doi.org/10.1029/2003GL019288, 2004.
Potin, B.: Les Alpes occidentales: tomographie, localisation de séismes et topographie du Moho, thesis, Grenoble Alpes, 1 July, available at: http://www.theses.fr/2016GREAU022 (last access: 27 February 2020), 2016.
RESIF: RESIF-RLBP French Broad-band network, RESIF-RAP strong motion network and other seismic stations in metropolitan France [data set], RESIF – Réseau Sismologique et géodésique Français, https://doi.org/10.15778/RESIF.FR, 1995.
Sánchez, L., Völksen, C., Sokolov, A., Arenz, H., and Seitz, F.: Present-day surface deformation of the Alpine region inferred from geodetic techniques, Earth Syst. Sci. Data, 10, 1503–1526, https://doi.org/10.5194/essd-10-1503-2018, 2018.
Scafidi, D., Barani, S., De Ferrari, R., Ferretti, G., Pasta, M., Pavan, M., Spallarossa, D., and Turino, C.: Seismicity of Northwestern Italy during the last 30 years, J. Seismol., 19, 201–218, 2015.
Serpelloni, E., Anzidei, M., Baldi, P., Casula, G., and Galvani, A.: Crustal velocity and strain-rate fields in Italy and surrounding regions: new results from the analysis of permanent and non-permanent GPS networks, Geophys. J. Int., 161, 861–880, https://doi.org/10.1111/j.1365-246X.2005.02618.x, 2005.
Serpelloni, E., Vannucci, G., Pondrelli, S., Argnani, A., Casula, G., Anzidei, M., Baldi, P., and Gasperini, P.: Kinematics of the Western Africa-Eurasia plate boundary from focal mechanisms and GPS data, Geophys. J. Int., 169, 1180–1200, https://doi.org/10.1111/j.1365-246X.2007.03367.x, 2007.
Serpelloni, E., Faccenna, C., Spada, G., Dong, D., and Williams, S. D. P.: Vertical GPS ground motion rates in the Euro-Mediterranean region: New evidence of velocity gradients at different spatial scales along the Nubia-Eurasia plate boundary, J. Geophys. Res.-Sol. Ea., 118, 6003–6024, https://doi.org/10.1002/2013JB010102, 2013.
Smith, W. H. F. and Wessel, P.: Gridding with continuous curvature splines in tension, Geophysics, 55, 293–305, 1990.
Solarino, S., Malusà, M. G., Eva, E., Guillot, S., Paul, A., Schwartz, S., Zhao, L., Aubert, C., Dumont, T., Pondrelli, S., Salimbeni, S., Wang, Q., Xu, X., Zheng, T., and Zhu, R.: Mantle wedge exhumation beneath the Dora-Maira (U)HP dome unravelled by local earthquake tomography (Western Alps), Lithos, 296–299, 623–636, https://doi.org/10.1016/j.lithos.2017.11.035, 2018.
Spada, M., Bianchi, I., Kissling, E., Agostinetti, N. P., and Wiemer, S.: Combining controlled-source seismology and receiver function information to derive 3-D Moho topography for Italy, Geophys. J. Int., 194, 1050–1068, https://doi.org/10.1093/gji/ggt148, 2013.
Stampfli, G., Mosar, J., Marquer, D., Marchant, R., Baudin, T., and Borel, G.: Subduction and obduction processes in the Swiss Alps, Tectonophysics, 296, 159–204, 1998.
Sternai, P., Herman, F., Champagnac, J.-D., Fox, M., Salcher, B., and Willett, S. D.: Pre-glacial topography of the European Alps, Geology, 40, 1067–1070, https://doi.org/10.1130/G33540.1, 2012.
Sternai, P., Sue, C., Husson, L., Serpelloni, E., Becker, T. W., Willett, S. D., Faccenna, C., Di Giulio, A., Spada, G., Jolivet, L., Valla, P., Petit, C., Nocquet, J.-M., Walpersdorf, A., and Castelltort, S.: Present-day uplift of the European Alps: Evaluating mechanisms and models of their relative contributions, Earth-Sci. Rev., 190, 589–604, https://doi.org/10.1016/j.earscirev.2019.01.005, 2019.
Sue, C. and Tricart, P.: Late alpine brittle extension above the Frontal Pennine Thrust near Briançon, western Alps, Eclogae Geol. Helv., 92, 171–181, 1999.
Sue, C. and Tricart, P.: Neogene to ongoing normal faulting in the inner western Alps: A major evolution of the late alpine tectonics, Tectonics, 22, 1050, https://doi.org/10.1029/2002TC001426, 2003.
Sue, C., Thouvenot, F., Fréchet, J., and Tricart, P.: Widespread extension in the core of the western Alps revealed by earthquake analysis, J. Geophys. Res.-Sol. Ea., 104, 25611–25622, https://doi.org/10.1029/1999JB900249, 1999.
Sue, C., Grasso, J. R., Lahaie, F., and Amitrano, D.: Mechanical behavior of western alpine structures inferred from statistical analysis of seismicity, Geophys. Res. Lett., 29, 65-1-65–4, https://doi.org/10.1029/2001GL014050, 2002.
Sue, C., Delacou, B., Champagnac, J.-D., Allanic, C., and Burkhard, M.: Aseismic deformation in the Alps: GPS vs. seismic strain quantification, Terra Nova, 19, 182–188, https://doi.org/10.1111/j.1365-3121.2007.00732.x, 2007a.
Sue, C., Delacou, B., Champagnac, J.-D., Allanic, C., Tricart, P., and Burkhard, M.: Extensional neotectonics around the bend of the Western/Central Alps: an overview, Int. J. Earth Sci., 96, 1101–1129, https://doi.org/10.1007/s00531-007-0181-3, 2007b.
Swiss Seismological Service (SED): National Seismic Networks of Switzerland, ETH Zürich, https://doi.org/10.12686/sed/networks/ch, 1983.
Thouvenot, F. and Fréchet, J.: Seismicity Along The Northwestern Edge Of The Adria Microplate, in: The Adria Microplate: GPS Geodesy, Tectonics and Hazards, edited by: Pinter, N., Gyula, G., Weber, J., Stein, S., and Medak, D., Springer Netherlands, Dordrecht, the Netherlands, 335–349, 2006.
Thouvenot, F., Fréchet, J., Guyoton, F., Guiguet, R., and Jenatton, L.: Sismalp: an automatic phone-interrogated seismic network for the western Alps, Cah. Cent. Eur. Géodynamique Séismologie, 1, p. 10, 1990.
Thouvenot, F., Fréchet, J., Jenatton, L., and Gamond, J.-F.: The Belledonne Border Fault: identification of an active seismic strike-slip fault in the western Alps, Geophys. J. Int., 155, 174–192, https://doi.org/10.1046/j.1365-246X.2003.02033.x, 2003.
Thouvenot, F., Jenatton, L., and Sanchez, O.: Région Alpes: Contribution OSUG, OSUG observatory, Grenoble, France, report, Annexe A–V, 94–123, 2013.
Tricart, P.: From passive margin to continental collision; a tectonic scenario for the Western Alps, Am. J. Sci., 284, 97–120, 1984.
University of Genoa: Regional Seismic Network of North Western Italy, International Federation of Digital Seismograph Networks [data set], https://doi.org/10.7914/SN/GU, 1967.
Vavryčuk, V.: Iterative joint inversion for stress and fault orientations from focal mechanisms, Geophys. J. Int., 199, 69–77, https://doi.org/10.1093/gji/ggu224, 2014.
Vernant, P., Hivert, F., Chéry, J., Steer, P., Cattin, R., and Rigo, A.: Erosion-induced isostatic rebound triggers extension in low convergent mountain ranges, Geology, 41, 467–470, https://doi.org/10.1130/G33942.1, 2013.
Walpersdorf, A., Sue, C., Baize, S., Cotte, N., Bascou, P., Beauval, C., Collard, P., Daniel, G., Dyer, H., Grasso, J.-R., Hautecoeur, O., Helmstetter, A., Hok, S., Langlais, M., Menard, G., Mousavi, Z., Ponton, F., Rizza, M., Rolland, L., Souami, D., Thirard, L., Vaudey, P., Voisin, C., and Martinod, J.: Coherence between geodetic and seismic deformation in a context of slow tectonic activity (SW Alps, France), J. Geodyn., 85, 58–65, https://doi.org/10.1016/j.jog.2015.02.001, 2015.
Walpersdorf, A., Pinget, L., Vernant, P., Sue, C., Deprez, A., and the RENAG team: Does Long-Term GPS in the Western Alps Finally Confirm Earthquake Mechanisms?, Tectonics, 37, 3721–3737, https://doi.org/10.1029/2018TC005054, 2018.
Zhao, L., Paul, A., Solarino, S., Aubert, C., Zheng, T., Salimbeni, S., Guillot, S., Wang, Q., Ai, Y., Zangelmi, P., He, Y., Lainé, R., Chen, L., Xu, W., Lin, W., Margheriti, L., Pondrelli, S., and Zhu, R.: First results of a new seismic profile across the southwestern Alps, CIFALPS, 15, EGU General Assembly, 7–12 April 2013, Vienna, Austria, EGU2013-6436, 2013.
Zhao, L., Paul, A., Guillot, S., Solarino, S., Malusà, M. G., Zheng, T., Aubert, C., Salimbeni, S., Dumont, T., Schwartz, S., Zhu, R., and Wang, Q.: First seismic evidence for continental subduction beneath the Western Alps, Geology, 43, 815–818, https://doi.org/10.1130/G36833.1, 2015.
Zhao, L., Paul, A., Solarino, S., and RESIF: Seismic network YP: CIFALPS temporary experiment (China-Italy-France Alps seismic transect) [data set], RESIF – Réseau Sismologique et géodésique Français, https://doi.org/10.15778/RESIF.YP2012, 2016a.
Zhao, L., Paul, A., Malusà, M. G., Xu, X., Zheng, T., Solarino, S., Guillot, S., Schwartz, S., Dumont, T., Salimbeni, S., Aubert, C., Pondrelli, S., Wang, Q., and Zhu, R.: Continuity of the Alpine slab unraveled by high-resolution P wave tomography, J. Geophys. Res.-Sol. Ea., 121, 8720–8737, 2016b.