the Creative Commons Attribution 4.0 License.
the Creative Commons Attribution 4.0 License.
 | 10 Aug 2021
Buoyancy versus shear forces in building orogenic wedges
Lorenzo G. Candioti
Thibault Duretz
Evangelos Moulas
Stefan M. Schmalholz
The dynamics of growing collisional orogens are mainly controlled by buoyancy and shear forces. However, the relative importance of these forces, their temporal evolution and their impact on the tectonic style of orogenic wedges remain elusive. Here, we quantify buoyancy and shear forces during collisional orogeny and investigate their impact on orogenic wedge formation and exhumation of crustal rocks. We leverage two-dimensional petrological–thermomechanical numerical simulations of a long-term (ca. 170 Myr) lithosphere deformation cycle involving subsequent hyperextension, cooling, convergence, subduction and collision. Hyperextension generates a basin with exhumed continental mantle bounded by asymmetric passive margins. Before convergence, we replace the top few kilometres of the exhumed mantle with serpentinite to investigate its role during subduction and collision.
We study the impact of three parameters: (1) shear resistance, or strength, of serpentinites, controlling the strength of the evolving subduction interface; (2) strength of the continental upper crust; and (3) density structure of the subducted material. Densities are determined by linearized equations of state or by petrological-phase equilibria calculations. The three parameters control the evolution of the ratio of upward-directed buoyancy force to horizontal driving force, , which controls the mode of orogenic wedge formation: ArF≈0.5 causes thrust-sheet-dominated wedges, ArF≈0.75 causes minor wedge formation due to relamination of subducted crust below the upper plate, and ArF≈1 causes buoyancy-flow- or diapir-dominated wedges involving exhumation of crustal material from great depth (>80 km). Furthermore, employing phase equilibria density models reduces the average topography of wedges by several kilometres.
We suggest that during the formation of the Pyrenees ArF⪅0.5 due to the absence of high-grade metamorphic rocks, whereas for the Alps ArF≈1 during exhumation of high-grade rocks and ArF⪅0.5 during the post-collisional stage. In the models, FD increases during wedge growth and subduction and eventually reaches magnitudes (≈18 TN m−1) which are required to initiate subduction. Such an increase in the horizontal force, required to continue driving subduction, might have “choked” the subduction of the European plate below the Adriatic one between 35 and 25 Ma and could have caused the reorganization of plate motion and subduction initiation of the Adriatic plate.
- Article
(22466 KB) - Full-text XML
- BibTeX
- EndNote


The formation of collisional orogenic belts is an impressive manifestation of plate tectonics, and many studies have investigated the mechanisms causing mountain building in collisional settings (e.g. Malinverno and Ryan, 1986; Platt, 1986; Beaumont et al., 1996; Malavieille, 2010; Jaquet et al., 2018; Dal Zilio et al., 2020b). A popular geodynamic model explaining the formation of collisional orogens, such as the Western Alps, the Pyrenees or the Himalayas, is the wedge model (e.g. Chapple, 1978; Dahlen et al., 1984; Platt, 1986; Willett et al., 1993; Vanderhaeghe et al., 2003; Malavieille, 2010; Dal Zilio et al., 2020b). The first mechanical models of so-called critical wedges considered a frictional deformation (stresses are controlled by a specific yield criterion) and were originally applied to accretionary wedges. The formation of such wedges has been extensively studied with both analogue and numerical models (e.g. Gutscher et al., 1998; Simpson, 2009; Malavieille, 2010; Graveleau et al., 2012; Ruh et al., 2012; Borderie et al., 2018; Dal Zilio et al., 2020b). Wedge models typically consider crustal deformation only and are driven by a kinematic boundary condition at the base of the crust, involving a rigid indenter, or backstop, which creates a kinematic singularity point at the base of the wedge. Such wedge models have also been used to study the formation of viscous fold nappes during fold and thrust belt evolution (e.g. Bauville and Schmalholz, 2015; Spitz et al., 2020) or the impact of surface processes on wedge formation (e.g. Willett, 1999).
Crustal wedge models have also been applied to entire collisional orogens and are frequently referred to as orogenic wedge models (e.g. Platt, 1986; Willett et al., 1993; Dal Zilio et al., 2020b). However, the geodynamic evolution of collisional orogens, such as the Alps or the Himalayas, typically involves the closure of oceanic domains and the subduction of oceanic and continental rocks before actual collision. Also, large regions of some of these orogens are characterized by exhumed high-pressure (> 1 GPa), and sometimes ultrahigh-pressure (> 2.7 GPa), rocks with peak temperatures ranging typically from 500 to 700 ∘C (e.g. Lardeaux, 2014). Furthermore, tomographic images from the Western Alps and the Pyrenees (Zhao et al., 2015; Schmid et al., 2017; Teixell et al., 2018) indicate that the overriding lithospheric mantle is involved in the formation of orogenic wedges (see Fig. 1), implying that these orogenic wedges are rather lithospheric wedges (Nicolas et al., 1990) and not just crustal wedges. The above-mentioned pre-collisional subduction, the associated formation and exhumation of (ultra)high-pressure rocks, and the density contrast between the subducted crustal material and the surrounding mantle might significantly impact on the orogen dynamics (e.g. Beaumont et al., 1996; Burov et al., 2014; Butler et al., 2014; Sizova et al., 2014). Particularly, the subduction-related burial of crustal material to depths deeper than the isostatically balanced depth will cause (upward-directed) buoyancy forces, which act against the forces driving subduction and may assist rock exhumation.
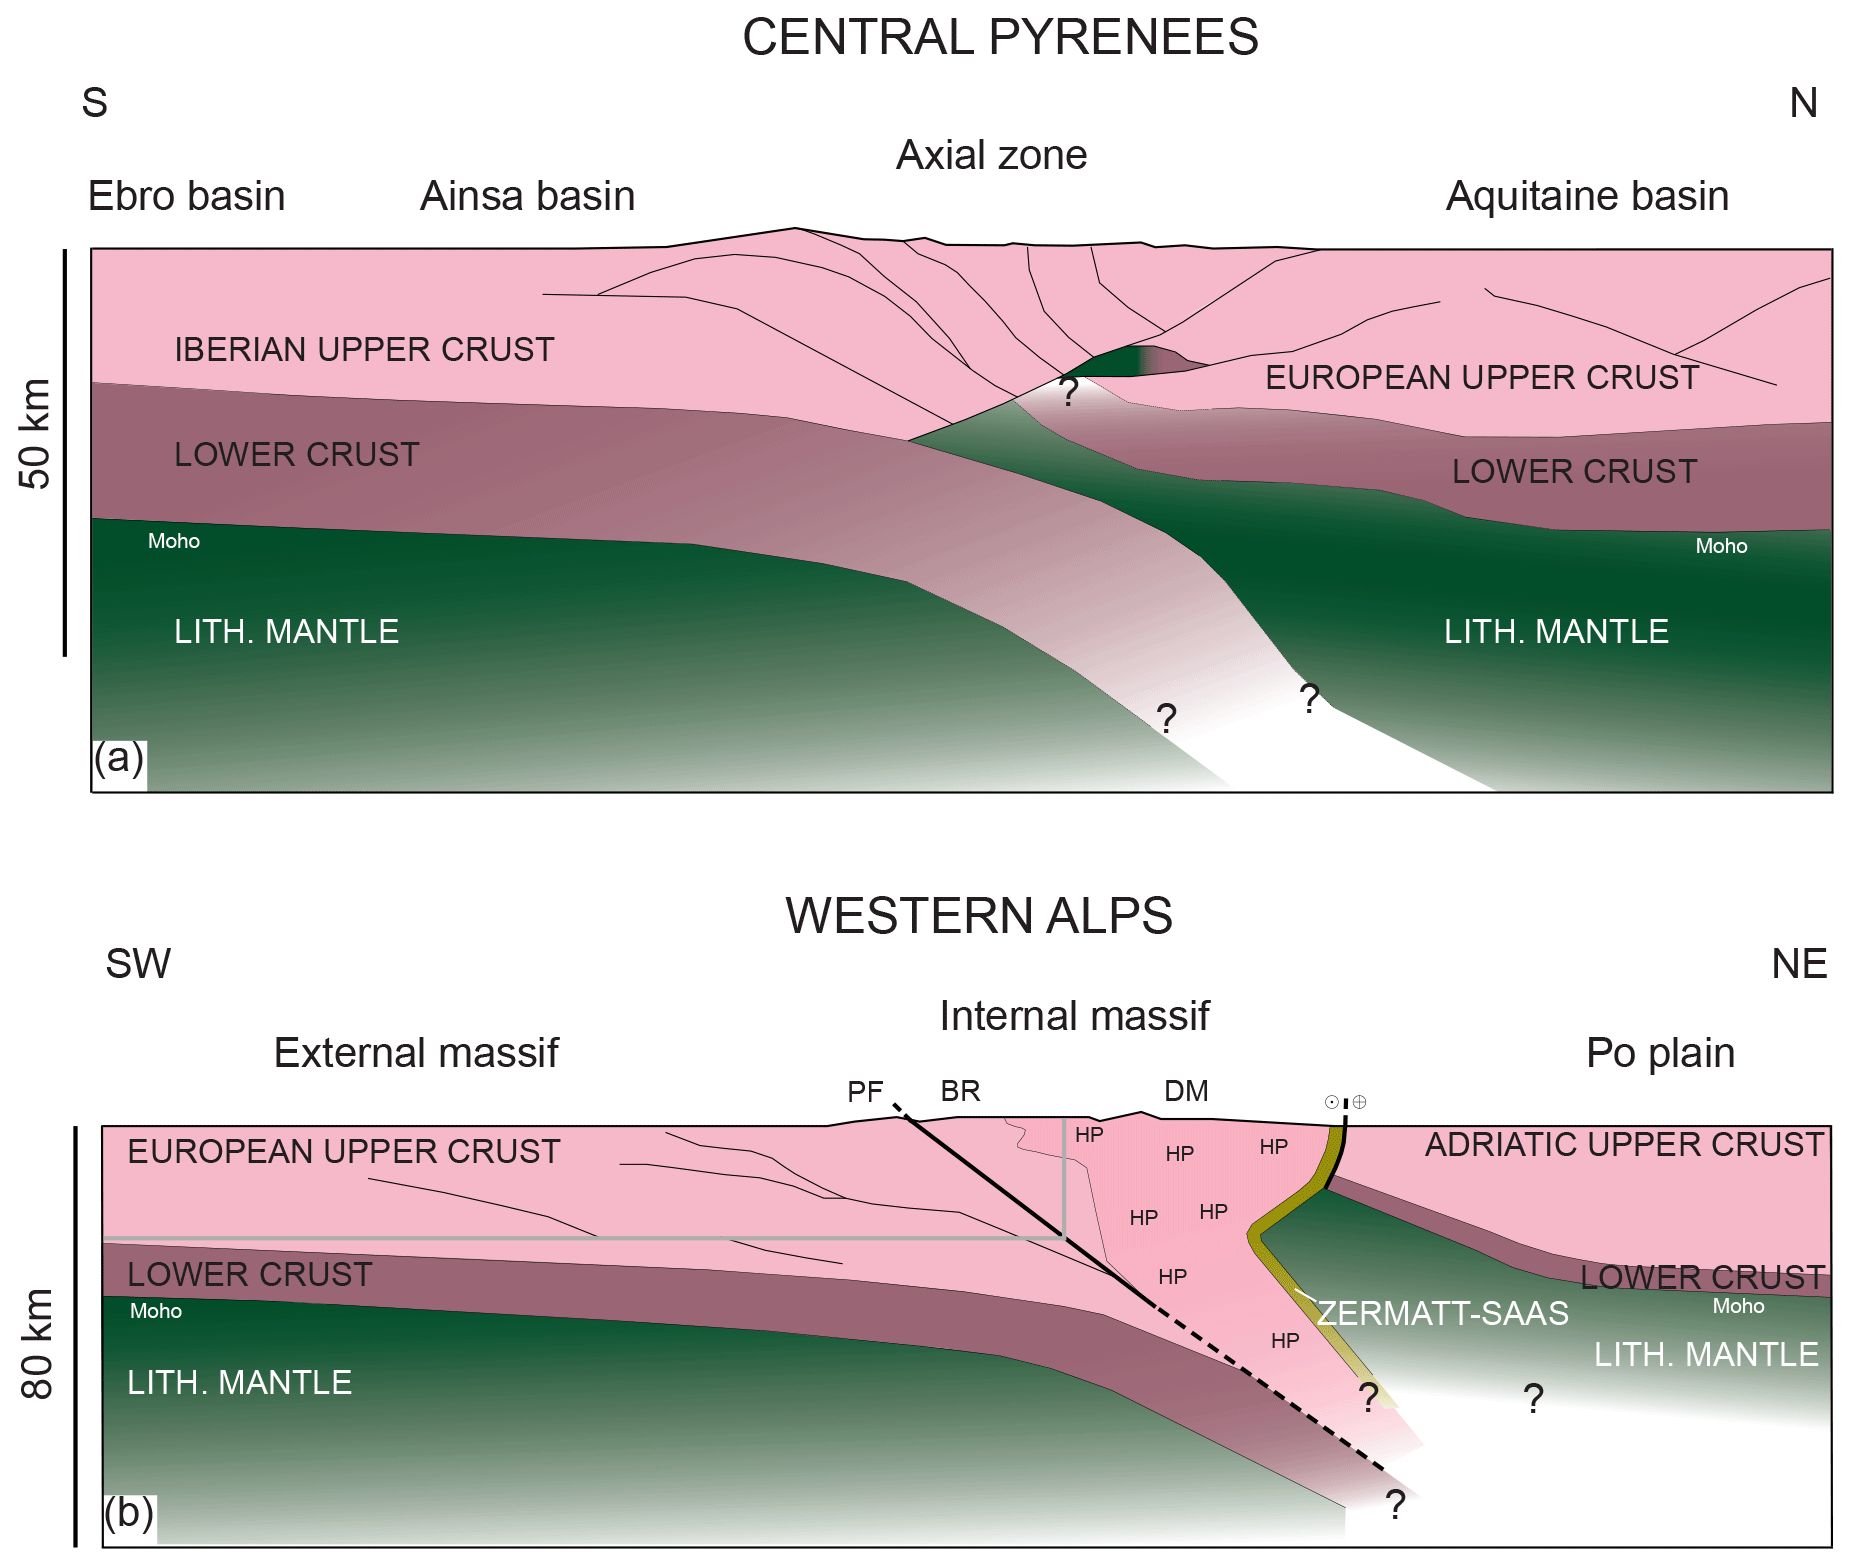
Figure 1Simplified tectonic cross sections: (a) across the Central Pyrenees, modified after Teixell et al. (2018) and (b) across the Western Alps, modified after Zhao et al. (2015) and Schmid et al. (2017). Light violet represents the upper crust, dark violet represents the lower crust and green represents the mantle lithosphere. The region of mixed violet and green in (a) represents a unit of lower crust or mantle thrust slices. Black lines indicate unit boundaries and the grey line in (b) indicates the domain captured by most crustal wedge models (compare to Malavieille, 2010; Dal Zilio et al., 2020b, for example). Abbreviations: Penninic Front, PF; Briançonnais, BR; Dora–Maira, DM; and high-pressure regions, HP.
From a mechanical point of view, the relatively slow tectonic deformation (no inertia) of the lithosphere is controlled by the balance of gravitational forces (acting everywhere inside a representative rock volume) and shear forces (or surface forces, acting on the surface of a representative rock volume) (e.g. Forsyth and Uyeda, 1975; Ramberg, 1981; Weijermars and Schmeling, 1986; Turcotte and Schubert, 2014; Gerya, 2019). In the absence of volumetric deformation, shear forces include forces acting normal or tangential to surfaces of the representative volume and induce shear deformation, such as pure or simple shear. Crustal wedge models typically consider shear forces and gravitational forces. The gravitational forces impact on frictional deformation via a depth-increasing confining pressure and the gravitational adjustment of topographic gradients. Due to the kinematic singularity point that exists in most of the crustal wedge models, such models cannot predict deep subduction of continental crustal rocks. Consequently, (upward-directed) buoyancy forces resulting from density differences between subducted crust and surrounding mantle are not considered in these models. Here, we study the formation of orogenic wedges in a large-scale lithosphere (crust and mantle lithosphere) and upper mantle (asthenosphere and transition zone) framework, including subduction, to investigate the impact of shear and buoyancy forces on orogenic wedge formation.
We further aim to investigate orogenic wedge formation relevant to the Alpine orogeny. The formation of many collisional orogens, such as the Alps, is embedded in larger geodynamic cycles (Wilson, 1965; Wilson et al., 2019) including pre-orogenic rifting events. The Alpine orogen (see Fig. 1b) resulted from subduction of the Piemont–Liguria oceanic domain and collision of the European and Adriatic passive continental margins (e.g. Handy et al., 2010). Ophiolitic units found in the Alps mainly consist of serpentinized mantle material, indicating a Piemont–Liguria domain with exhumed and serpentinized mantle lithosphere (e.g. Manatschal and Müntener, 2009; McCarthy et al., 2020). For such Alpine-type orogens, structures inherited from continental margin formation presumably had a strong control on the dynamics of orogen formation (Chenin et al., 2017, 2019). Furthermore, progressive subduction of serpentinites and sediments may weaken the plate interface (Shreve and Cloos, 1986; Lamb and Davis, 2003; Behr and Becker, 2018) and impact on the balance between shear and buoyancy forces. Therefore, we consider models which involve a pre-collisional rifting phase and subduction involving serpentinites and sediments.
Here, we quantify the relative dominance and magnitude of buoyancy and shear forces during the formation of Alpine-type collisional orogens. We leverage two-dimensional (2D) petrological–thermomechanical numerical models of a long-term (ca. 170 Myr) extension–cooling–convergence cycle including subduction and continent–continent collision coupled to petrological-phase equilibria modelling (Gerya et al., 2004; Kaus et al., 2005; Yamato et al., 2007; Hetényi et al., 2007; Rummel et al., 2020). To quantify the relative importance of buoyancy and shear forces at convergent plate boundaries, we compare (1) simple or linearized equation of state (LEOS) density models to complex density (CD) models that include metamorphic reactions. The density structure of subducted continental crust and the surrounding mantle controls the magnitude of buoyancy forces. Increased (upward-directed) buoyancy forces eventually lead to slab detachment, vanishing of slab-pull forces (Duretz et al., 2012) and a rearrangement of forces throughout orogeny (Dal Zilio et al., 2020a). (2) We vary the strength of the upper crust and of serpentinites forming the subduction interface. The shear resistance of serpentinite lubricating the subduction interface (Hirth and Guillot, 2013; Guillot et al., 2015, and references therein) may facilitate subduction. Also, coupling of the continental crust to the subducting mantle lithosphere impacts on the subduction and, therefore, orogen dynamics (Duretz and Gerya, 2013). We show that the relative dominance of shear or (upward-directed) buoyancy forces generates different modes, or styles, of orogenic wedges, some dominated by buoyancy-driven return flow and some by stacking of thrust sheets. We further analyse the importance of the shear resistance of serpentinites and the upper continental crust as well as rock density to make another step towards understanding the dynamics of Alpine-type orogens.
2.1 Mathematical model and numerical algorithm
As it is commonly done in continuum mechanics, the applied numerical algorithm solves the continuity and momentum equations coupled to conservation of energy expressed with respect to temperature. We consider incompressible visco-elasto-plastic materials that slowly flow (inertia forces are negligible) under gravity and the influence of boundary tractions. Here, the term plastic refers to all rate-independent (instantaneous) irreversible deformation controlled by a Drucker–Prager yield function (Eq. A13). The applied pressure-dependent yield function is motivated by laboratory experiments (Byerlee, 1978) and is representative of rock deformation mechanisms at low temperatures (shear banding, faulting). The term viscous comprises all rate-dependent inelastic deformation, which is generally thermally activated. Material properties are advected using a marker-in-cell approach (Gerya and Yuen, 2003) involving initially 16 Lagrangian markers per Eulerian finite-difference grid cell. Up to 56 million numerical markers are advected in total. We do not apply any frictional or viscous strain softening. However, thermal softening, caused by shear heating, is active, resulting from the conservation of energy and temperature-dependent viscous flow stress. The algorithm has already been used to model deformation processes at various scales (Yamato et al., 2015; Duretz et al., 2016b; Yamato et al., 2019; Petri et al., 2019; Bessat et al., 2020) including upper mantle convection coupled to lithospheric-scale deformation (Candioti et al., 2020). Appendix A provides a detailed description of the algorithm.
2.2 Model configuration
We here follow the modelling approach of Candioti et al. (2020) and we employ a 1600 km wide and 680 km deep (see Fig. 2) model domain. The global model resolution is 1 km × 1 km in horizontal x and in vertical z direction, respectively. A stress-free surface (Duretz et al., 2016a) is set initially at z=0 km and, to allow for dynamic build-up of topography, the topmost +20 km of the model domain is left free of material. We impose constant material inflow and outflow velocities at the lateral boundaries, and the mechanical boundary at the bottom of the domain is free to slip. Further, we assume that no heat flows laterally out of the model domain, and the top and bottom temperature is kept constant at 15 and 1613 ∘C, respectively. Viscous deformation is modelled leveraging a combination of rheological flow laws, namely dislocation, diffusion and Peierls creep. Diffusion creep flow laws (Eq. A9) require knowledge of the grain size. Including an evolving grain size in lithospheric-scale models is usually achieved by employing additional parameterizations (e.g. paleowattmeters; Austin and Evans, 2007). As these parameterizations are commonly determined in laboratory experiments conducted at relatively fast deformation rates (compared to tectonic deformation), these parameterizations have to be extrapolated to natural conditions. This extrapolation introduces additional uncertainties. To keep the model simple, we here neglect grain size evolution and choose a constant average mantle grain size of 1 mm in Eq. (A9). Previous work has demonstrated that this choice, in combination with suitable flow law parameters, results in a viscosity structure that is consistent with geophysical constraints with respect to the convection dynamics of the mantle and the thermal thickness of the overlying, horizontal lithosphere (Candioti et al., 2020). Similar average grain sizes of the order of 1 mm in the upper mantle have been predicted by whole mantle convection models that include state-of-the-art grain size evolution models (Dannberg et al., 2017; Schierjott et al., 2020).
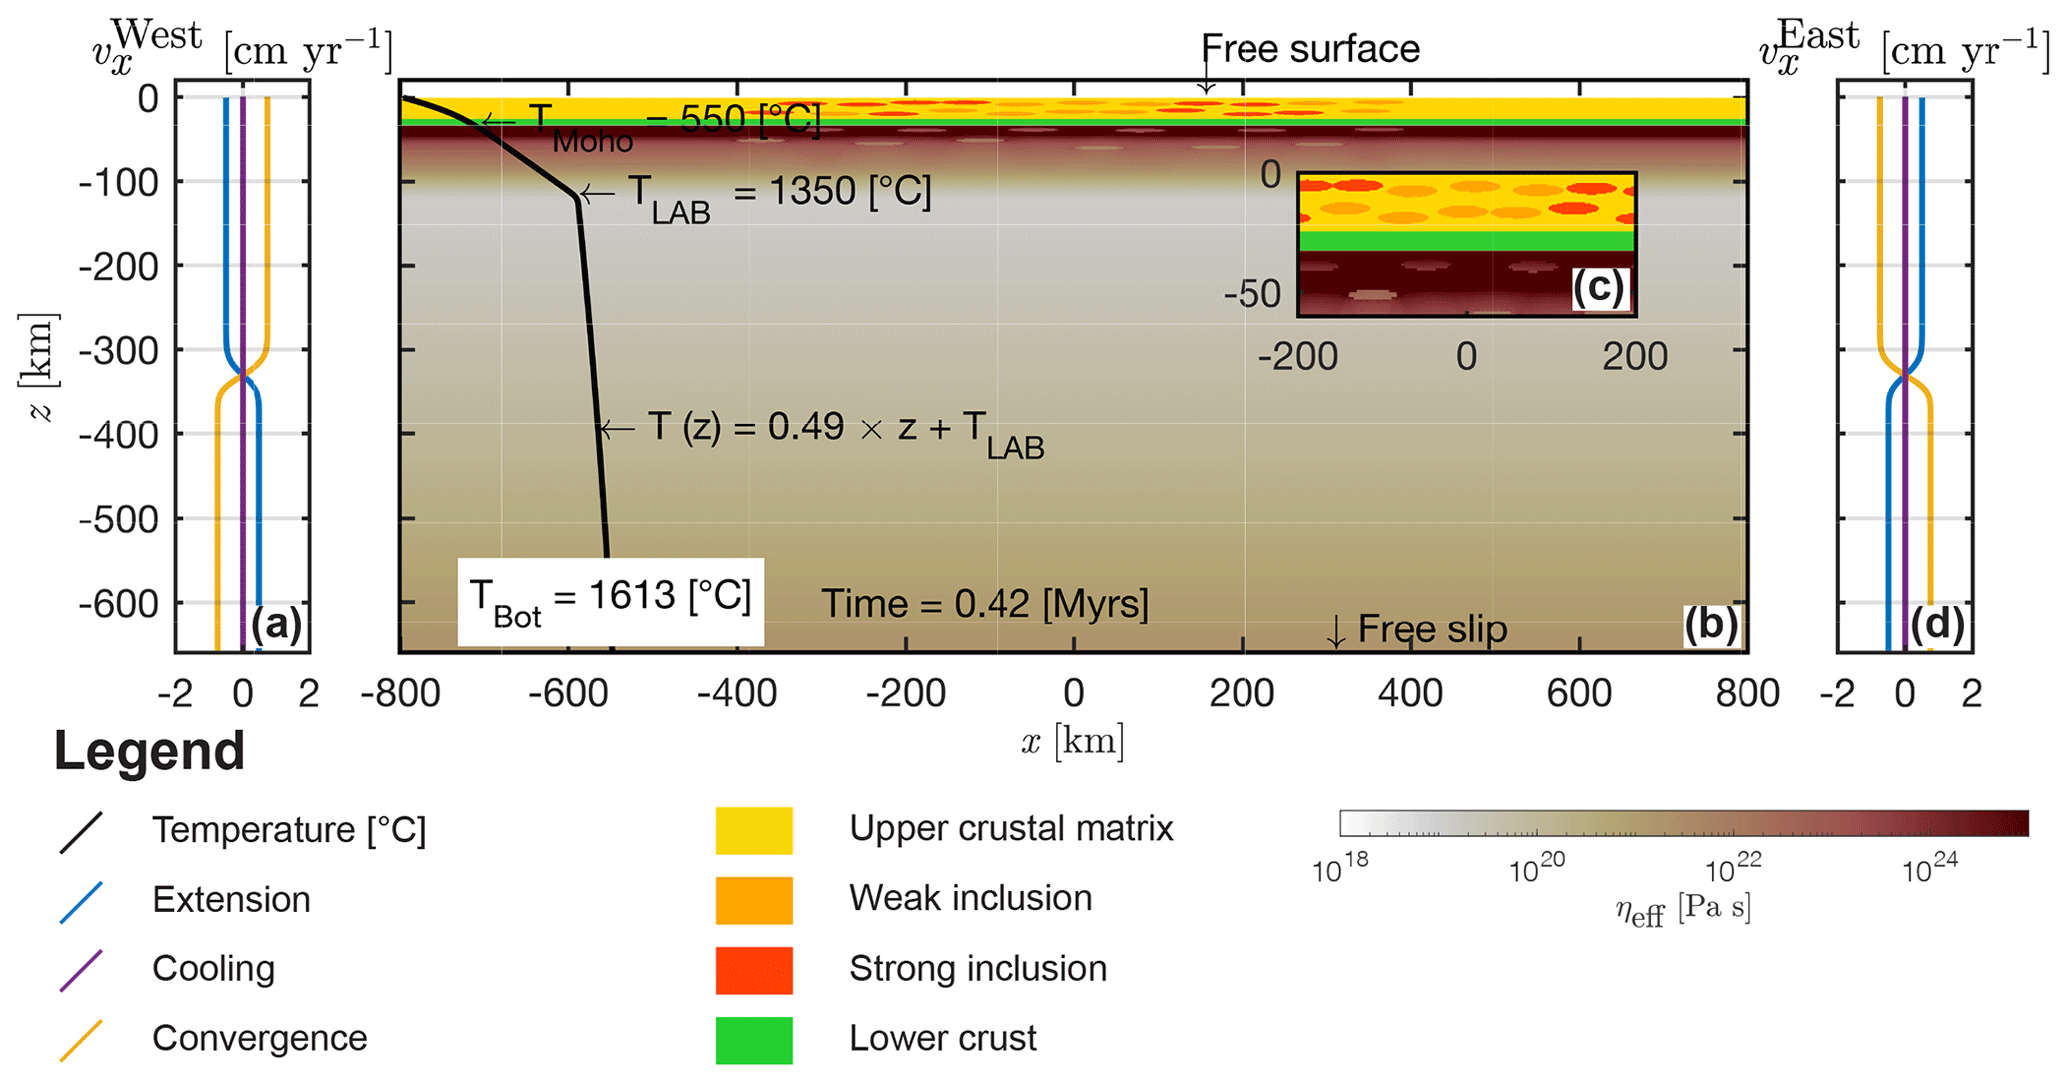
Figure 2Model configuration and boundary conditions. (a) Profile of horizontal velocity for material inflow and outflow along the western model boundary. The blue line indicates the profile for the extension, the purple line indicates the profile for the cooling and the yellow line indicates the profile for the convergence. (b) Entire model domain. Crustal phases: yellow represents the crustal matrix, dark orange represents strong elliptical inclusions and light orange represents weak elliptical inclusions. White to red shows the effective viscosity field as calculated by the numerical algorithm. All colour maps used to visualize physical fields in this study are provided by Crameri (2018). Black line shows the vertical temperature profile. (c) Enlargement of the central region of the domain. (d) Same profile as shown in (a), but along the eastern model boundary.
The effective density of the materials is either directly calculated via a linearized equation of state or pre-computed based on equilibrium phase-diagram sections for specific bulk-rock composition (see Appendix A). We consider surface processes such as erosion (constant erosion rate of 0.5 mm yr−1 above z≥2 km of topographic elevation) and sedimentation (instantaneous basin fill below km of topographic elevation, alternating calcite and mica rheology every 2 Myr). For more detailed justifications of model assumptions and explanations for the implementation of boundary conditions, the reader is referred to the study of Candioti et al. (2020). Model units include an initially 25 km thick upper crust with two vertical levels of 11 elliptical inclusions each, whose rheology is different from the upper crustal matrix (weakened wet anorthite or Westerly granite rheology; see Table A1 for all material parameters). These elliptical inclusions represent structural and petrological units inherited from previous orogenic cycles and are motivated by field observations (e.g. Petri et al., 2019). Weak (wet quartzite) and strong (Maryland diabase) inclusions may represent metasedimentary units and mafic intrusions, respectively. Below the upper crust an 8 km thick lower crust (wet anorthite) is employed. The initial Moho is set to km and the mantle lithosphere (dry olivine) extends down to km. In total, 12 weak (wet olivine) elliptical inclusions over two vertical levels are included in the mantle lithosphere. These heterogeneities are motivated by geophysical observations (e.g. Barnhoorn et al., 2010) and represent weaknesses owing to spatial lithological variations. Elongated or elliptical inclusions allow for the generation of asymmetric margin geometries (Duretz et al., 2016b; Petri et al., 2019). We include the asthenosphere and transition zone (grouped and termed upper mantle hereafter, dry olivine rheology) down to km. The distribution and emplacement of the inclusions is described in detail in Appendix B. The difference between mantle lithosphere and upper mantle is due to temperature and pressure only; i.e. all material parameters are the same.
2.3 Simulations
Four types of simulations are performed: (1) the reference model (REF) generates a long-term (> 160 Myr) geodynamic cycle of subsequent extension–cooling–convergence in a single and continuous simulation. During a 50 Myr rifting period, an ≈ 360 km wide basin is formed. This basin is floored by exhumed continental mantle and bounded by two hyper-extended magma-poor rifted margins. We apply an absolute extension velocity of 1 cm yr−1 and we assume an ultra-slow to slow spreading rift system with minor melt production and therefore neglect decompressional melting of the peridotites. No far-field plate velocity is applied to the system for the following 60 Myr. This choice of applied deformation velocity and duration of the periods leads to margin geometries comparable to reconstructions from the ancient Alpine Tethys margin system and Piemont–Liguria ocean (Le Breton et al., 2021). In all models presented here, the subsequent convergence is driven by a kinematic boundary velocity of 1.5 cm yr−1 (absolute value). The convergence phase involves subduction initiation, closure of the basin floored by exhumed mantle, continental collision and orogenic wedge formation. Model REF simulates a scenario without serpentinization of the exhumed mantle peridotite. Except for the mantle lithology that utilizes a complex density (CD) model, the density of all other model lithologies is calculated using a LEOS (Eq. A3).
The geodynamic evolution of REF at the end of the cooling stage (109 Myr) serves as a self-consistently generated initial configuration for three additional types of simulations. (2) We parameterize a serpentinization front propagating through the topmost layer of exhumed peridotites to test the impact of serpentinite strength on the convergent deformation. In this parametrization, we replace the dry olivine flow law parameters of the exhumed peridotites in the basin above km with parameters for antigorite rheology (Hilairet et al., 2007). This approach results in an effective average thickness of the serpentinite layer of ca. 5.5 km. In order to investigate the effects of variable serpentinite strength, we gradually increase the prefactor in front of the dislocation creep flow law (ζ in Eq. A8) for antigorite (Hilairet et al., 2007). We here report the modelling results for prefactors 1 and 18, because these models are end-member types for subduction and orogen dynamics. The background upper and lower crust are feldspar-dominated (see Table A1 for details). As in REF, density is computed with a LEOS except for the mantle where a CD model is employed. (3) We consider serpentinization and investigate the impact of (upward-directed) buoyancy forces on the collisional stage employing a CD model for all lithologies. Type (4) is identical to type (3), except that compared to a feldspar-dominated (wet anorthite) rheology a relatively weaker quartz-dominated rheology (Westerly granite) is employed for the upper crust. A summary of all simulations is given in Table 1. The applied material parameters are given in Table A1, and the bulk rock compositions as well as the solution models used for phase diagram calculations are given in Table 2.
Table 1Summary of all simulations presented in this study. Bold entries highlight the differences compared to the reference model REF.
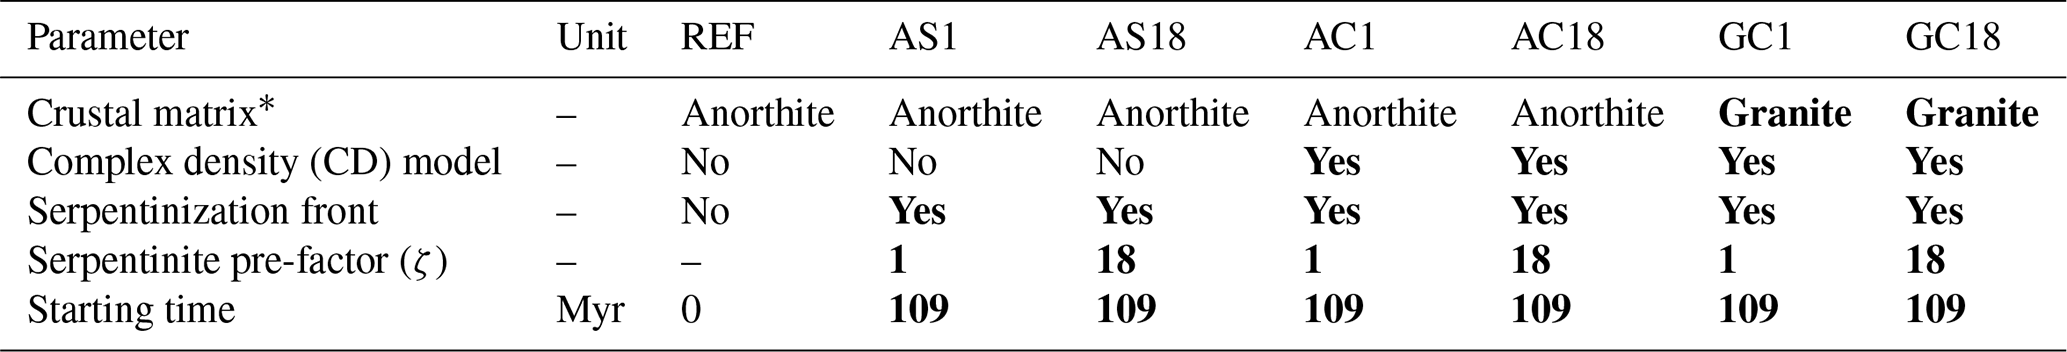
* All material parameters are listed in Table A1.
Table 2Bulk rock composition for phase equilibrium calculations.

Modified bulk rock after 1 Winter (2013), 2 Pelletier et al. (2008), 3 Workman and Hart (2005). We assume water saturation in all calculations. Crosses denote solution models used for given lithologies. Thermodynamic databases used: 4 Holland and Powell (1998) updated in 2002 and 5 Stixrude and Lithgow-Bertelloni (2011) for depleted MORB mantle (DMM). Note that only the relative abundance of elements is important for our phase diagram calculations. Details on the solution models can be found in the solution_model.dat data file in Perple_X.
We first describe the results of the reference model, REF, for the entire geodynamic extension–cooling–convergence cycle. We then describe the impact of serpentinite shear resistance on the evolution of the models during convergence. Finally, we report results of linearized and complex density models as well as the impact of upper crustal shear resistance. We focus on the continent–continent collision stage of the individual models. Stages of basin closure, serpentinite channel formation and the subduction dynamics are documented in the video supplement of models REF (Candioti, 2020a) and GC1 (Candioti, 2020b) but are not described in further detail here.
3.1 Reference model – REF
Figure 4 shows the geodynamic evolution of the reference model (REF). Crustal break-up occurs at ≈ 19 Myr in model history (Fig. 4a). At this stage, hot mantle material rises in the horizontal centre and diverges laterally below the plates (see arrows in Fig. 4a). The 1300 ∘C isotherm remains at a depth of ≈ 20–30 km below the rift centre (Fig. 4d). Two asymmetric continental margins have formed. The necking zone of the left margin is ≈ 20 km wide. In total, the width of the left margin is ca. 80–90 km. The right margin is in total ca. 140–160 km wide including an ≈ 60–80 km wide necking zone. At the end of the cooling period (109 Myr, Fig. 4b), an ≈ 360 km wide basin has opened, which is floored by exhumed mantle material. Convection in the upper mantle stabilizes the thermal and mechanical thickness of the lithosphere to ca. 90–100 km (no velocity glyphs in Fig. 4b and e; see also the discussion in Candioti et al. (2020) for more detail). At 112 Myr subduction is initiated at the transition from the proximal to the distal continental margin in the right model side (see Sutra et al., 2013, for nomenclature). Partly, the necking zone of this margin has been subducted to ca. 40 km depth (Fig. 4c and f). At 144 Myr in model history, the continental crust of the left margin (blue colours in Fig. 5a and d) is subducted to ca. 60 km depth. Sediments originally deposited in the trench have been incorporated in between the subducting and the overriding plate. With ongoing convergence, the upper crust of the subducting plate is buried to a maximum depth of ca. 120 km. At 155 Myr, upper crustal units are sheared off the subducting plate at the transition to the lower crust and begin to form thrust sheets (see deflected isotherms at km and km in Fig. 5e). Major parts of continental crust are sheared off the subducting plate before entering the subduction zone. An orogenic wedge with several thrust sheets has formed at 164 Myr (Fig. 5f). At this stage, the lower part of the subducting slab detaches and the deeper subducted upper crustal material flows upward. This return flow is limited to depths between ca. 60 and 80 km (see arrows in Fig. 5f).
3.2 Impact of low (AS1) and high (AS18) serpentinite shear resistance
As in REF, subduction is initiated at the transition from the proximal to the distal right continental margin in AS1 and AS18. A large volume of serpentinite material is sheared off the subducting plate in AS1 and AS18 (Fig. 6a and e). In AS1, the serpentinites form a coherent, inclined channel down to ca. 100–120 km depth (Fig. 6a). At 148 Myr, the upper continental crust of the left margin (blue colours in Fig. 6) has been subducted to ca. 90–100 km depth (Fig. 6a). Between 154 and 162 Myr, the subducted upper continental crust returns to the surface through the weak serpentinite channel in AS1. An ≈50 km wide block of the overriding plate's upper crust is separated from the right margin by subducted crustal material that is being exhumed to the surface. At 164 Myr, large parts of the subducted continental crust have been exhumed to the surface (Fig. 6d). Units containing weak inclusions are internally deformed during the exhumation. Strong units are folded but exhumed coherently (Fig. 6d). The serpentinite material is surrounding the exhumed upper crustal material and the separated continental upper crustal block of the overriding plate. In AS18, the serpentinite channel is intersected by the two colliding plates at km (Fig. 6e). In contrast to AS1, the continental upper crust is partly sheared off the subducting plate at km in AS18 (Fig. 6e). Maximum burial depth of upper continental crust in this model is ca. 80–90 km. Exhumation of subducted crustal material is limited to km (Fig. 6f and g). Instead, the upper continental crust is wedged at shallower depths, similar to REF (see deflected isotherms at km in Fig. 6g). Thrust sheets propagate along the upper continental crust of the subducting plate (Fig. 6h). The serpentinized mantle material forms a coherent unit emplaced in between the wedged continental upper crust of the subducting plate and the relatively undeformed continental upper crust of the overriding plate. Dimensions of the evolved orogenic wedge in AS18 are similar to the wedge dimensions evolved in REF (compare Fig. 5f to Fig. 6h).
3.3 Impact of complex density models – models AC1 and AC18
Density models that include predicted metamorphic assemblages (CD models) lead to more variable density fields and larger density changes as a function of pressure and temperature compared to LEOS models (compare Fig. 3g to f). Similar to AS1, a serpentinite channel (low viscosity region in Fig. 7a) forms after subduction initiation in AC1 (Fig. 8a). The continental upper crust of the subducting plate (blue colours) is subducted to ca. 150 km depth, which is deeper compared to AS1 (compare Fig. 6b to Fig. 8b and c). In contrast to AS1, exhumation of the subducted upper continental crust has not occurred until 163 Myr (compare Fig. 6c to Fig. 8c) in model history. At 170 Myr, the subducted continental crust in AC1 has been exhumed to the surface along the weak subduction interface (Fig. 8d). In contrast to AS1, the continental upper crust of the overriding plate has not been separated by the returning continental crust of the subducting plate in AC1 (compare Fig. 6d to Fig. 8d). Figure 9a and b show the density field of models AS1 and AC1, respectively, computed by the algorithm at 170 Myr in model history. Compared to AS1, in AC1 the density of the material in the wedge is much more variable. The density of the subducted crustal units in AC1 is up to ca. 100 kg m−3 higher than in AS1. The resulting buoyancy contrasts are much smaller, leading to significantly less uplift of topography in AC1 compared to AS1. In AS1, the maximum elevation of topography exceeds 10 km; in AC1 the maximum elevation is locally ≈7 km, but high topographies are on average ≈5 km. The width of the wedge is ≈350 and ≈275 km in AS1 and AC1, respectively. Compared to AS18, only a minor volume of serpentinite material has been sheared off the subducting slab in AC18 (compare Fig. 6e to Fig. 8e). The majority of serpentinite material is coupled to the slab and subducted into the upper mantle (Figs. 8f and 7c). Subduction of continental upper crust reaches a depth of ca. 180 km after 163 Myr (Fig. 8g). In the absence of a weak, serpentinized subduction interface, the resistance of the subduction channel is increased in AC18 (compare Fig. 7a to c). The deeply subducted continental upper crust cannot be exhumed along the strong subduction interface and breaks through the less resistant mantle wedge (Fig. 8h), relaminating below the overriding plate (similar to the models presented in Currie et al., 2007, and Li and Gerya, 2009).

Figure 3Density structures employed in the models presented here. (a–e, g–h) Phase diagram density fields calculated with Perple_X for the bulk rock compositions given in Table 2. (f, i) Density fields calculated using a linearized equation of state (Eq. A3) for an upper crustal reference density of 2800 kg m−3 and a serpentinite reference density of 2585 kg m−3, respectively.
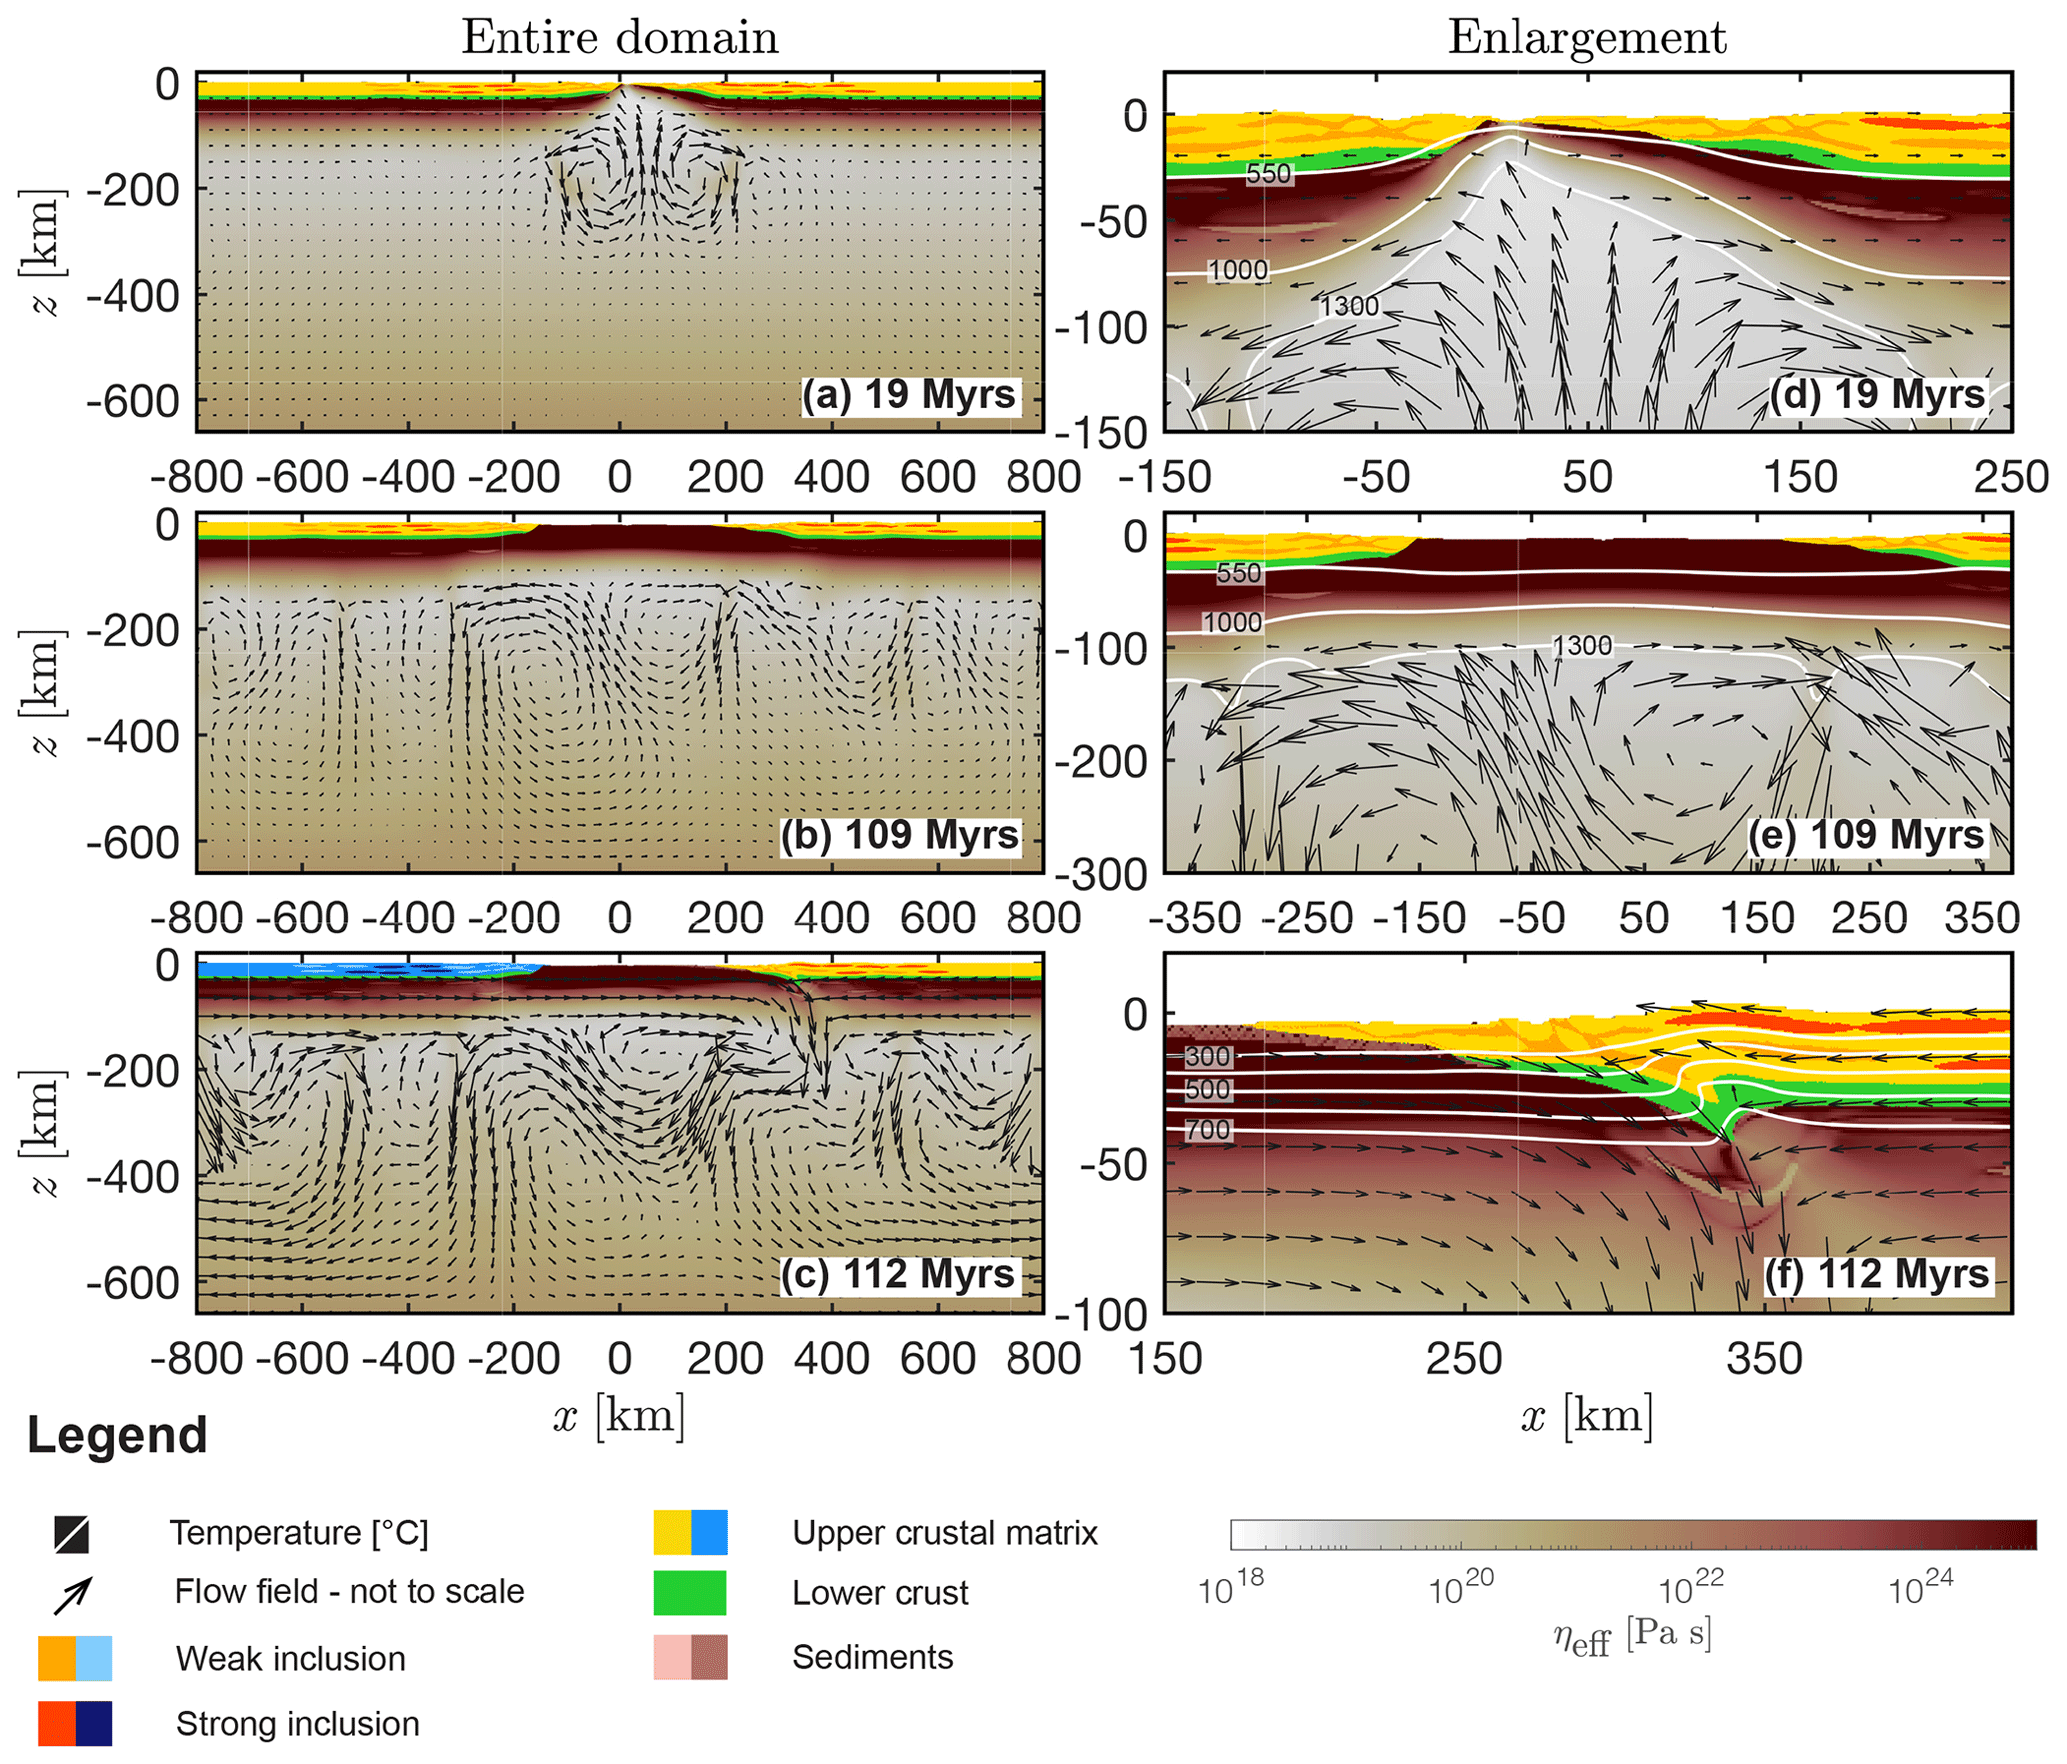
Figure 4Evolution of the reference run REF during rifting, cooling and subduction initiation. Panels (a)–(c) show the entire domain and (d)–(f) show an enlargement. White to dark red indicates the effective viscosity of the mantle material calculated by the algorithm, yellow to orange indicates the crustal matrix and the weak and strong inclusions of the overriding plate, light to dark blue indicates the corresponding crustal units of the subducting plate. The material parameters used for the upper crustal phase of the overriding and the subducting plates are identical. Green indicates the lower crust of both plates and salmon and brown indicates the sedimentary units. White lines show different isotherms and the arrows indicate the velocity field calculated by the numerical algorithm.

Figure 5Evolution of the reference run REF after closure of the marine basin and continent–continent collision. White to dark red indicates the effective viscosity of the mantle material calculated by the algorithm, yellow to orange indicates the crustal matrix and the weak and strong inclusions of the overriding plate, light to dark blue indicates the corresponding crustal units of the subducting plate. The material parameters used for the upper crustal phases of the overriding and the subducting plates are identical. Green indicates the lower crust of both plates and salmon and brown indicates the sedimentary units. White lines are different isotherms and the arrows indicate the velocity field.
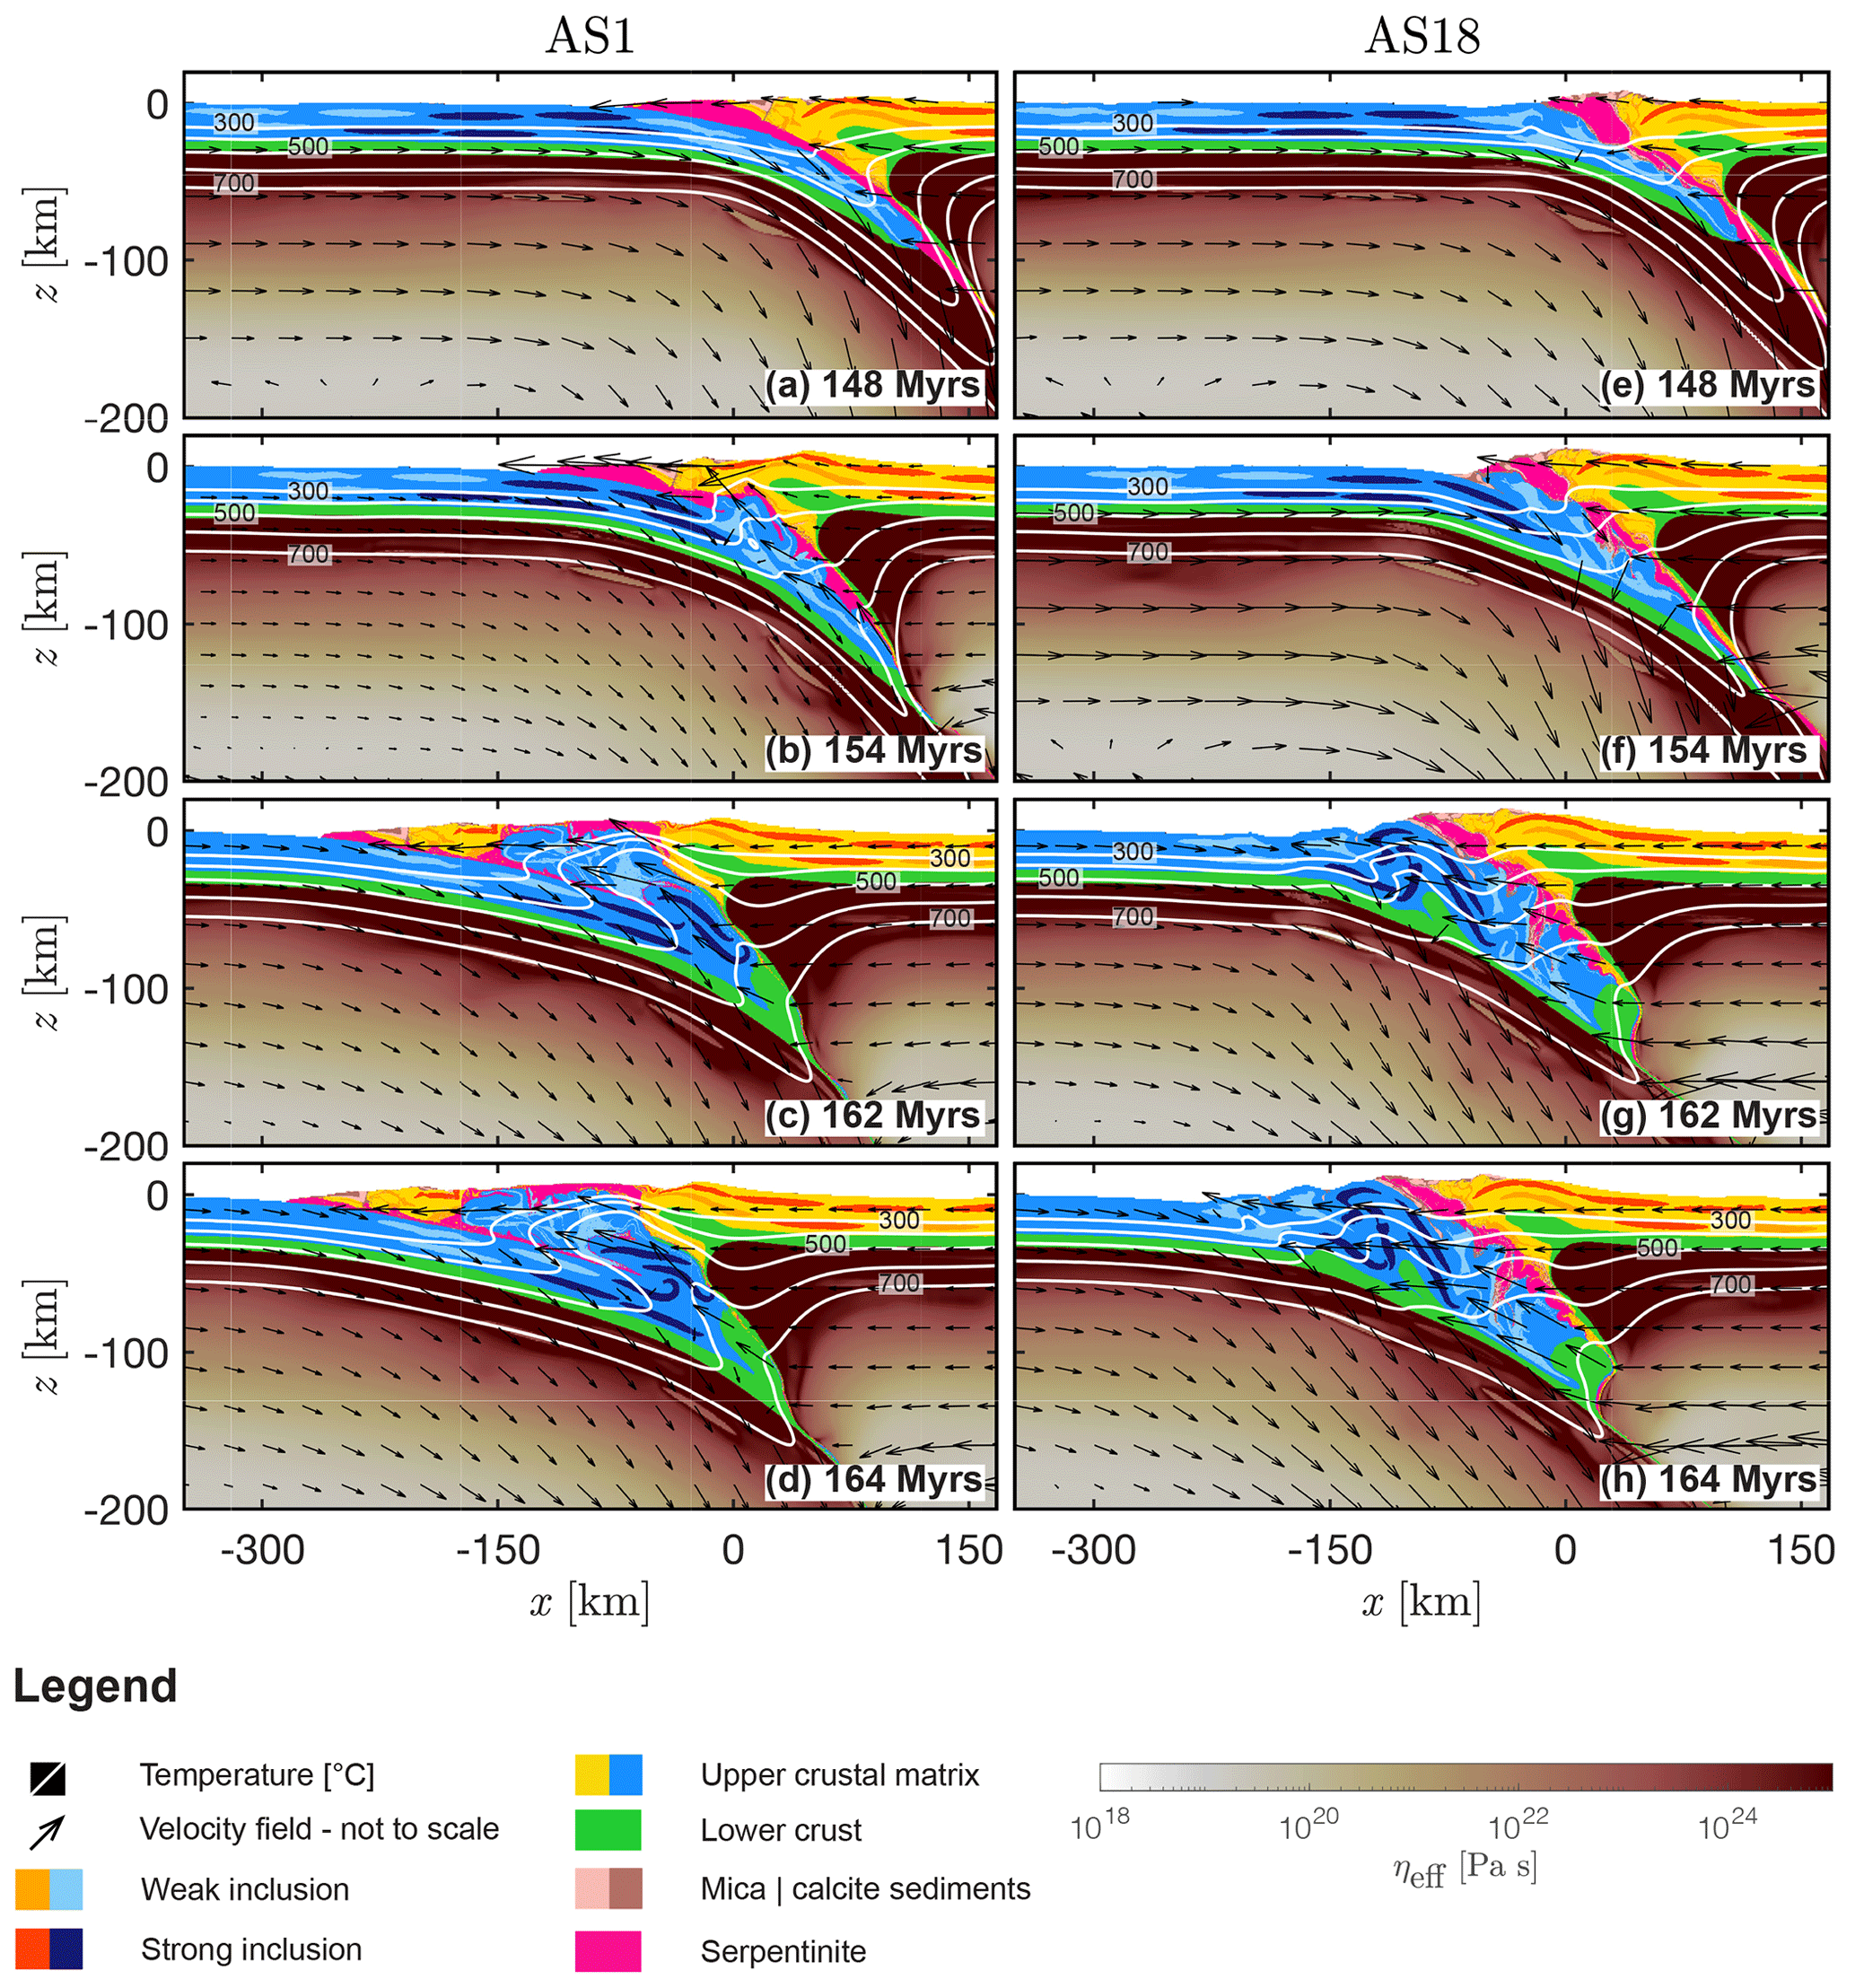
Figure 6Convergence and collisional stage of AS1 and AS18 (low and high shear resistance of serpentinite, LEOS density model, feldspar-dominated upper crust). White to dark red indicates the effective viscosity of the mantle material calculated by the algorithm, yellow to orange indicates the crustal matrix and the weak and strong inclusions of the overriding plate, light to dark blue indicates the corresponding crustal units of the subducting plate. The material parameters used for the upper crustal phases of the overriding and the subducting plates are identical. Green indicates the lower crust of both plates and salmon and brown indicates the sedimentary units. White lines are different isotherms and the arrows indicate the velocity field calculated by the numerical algorithm.
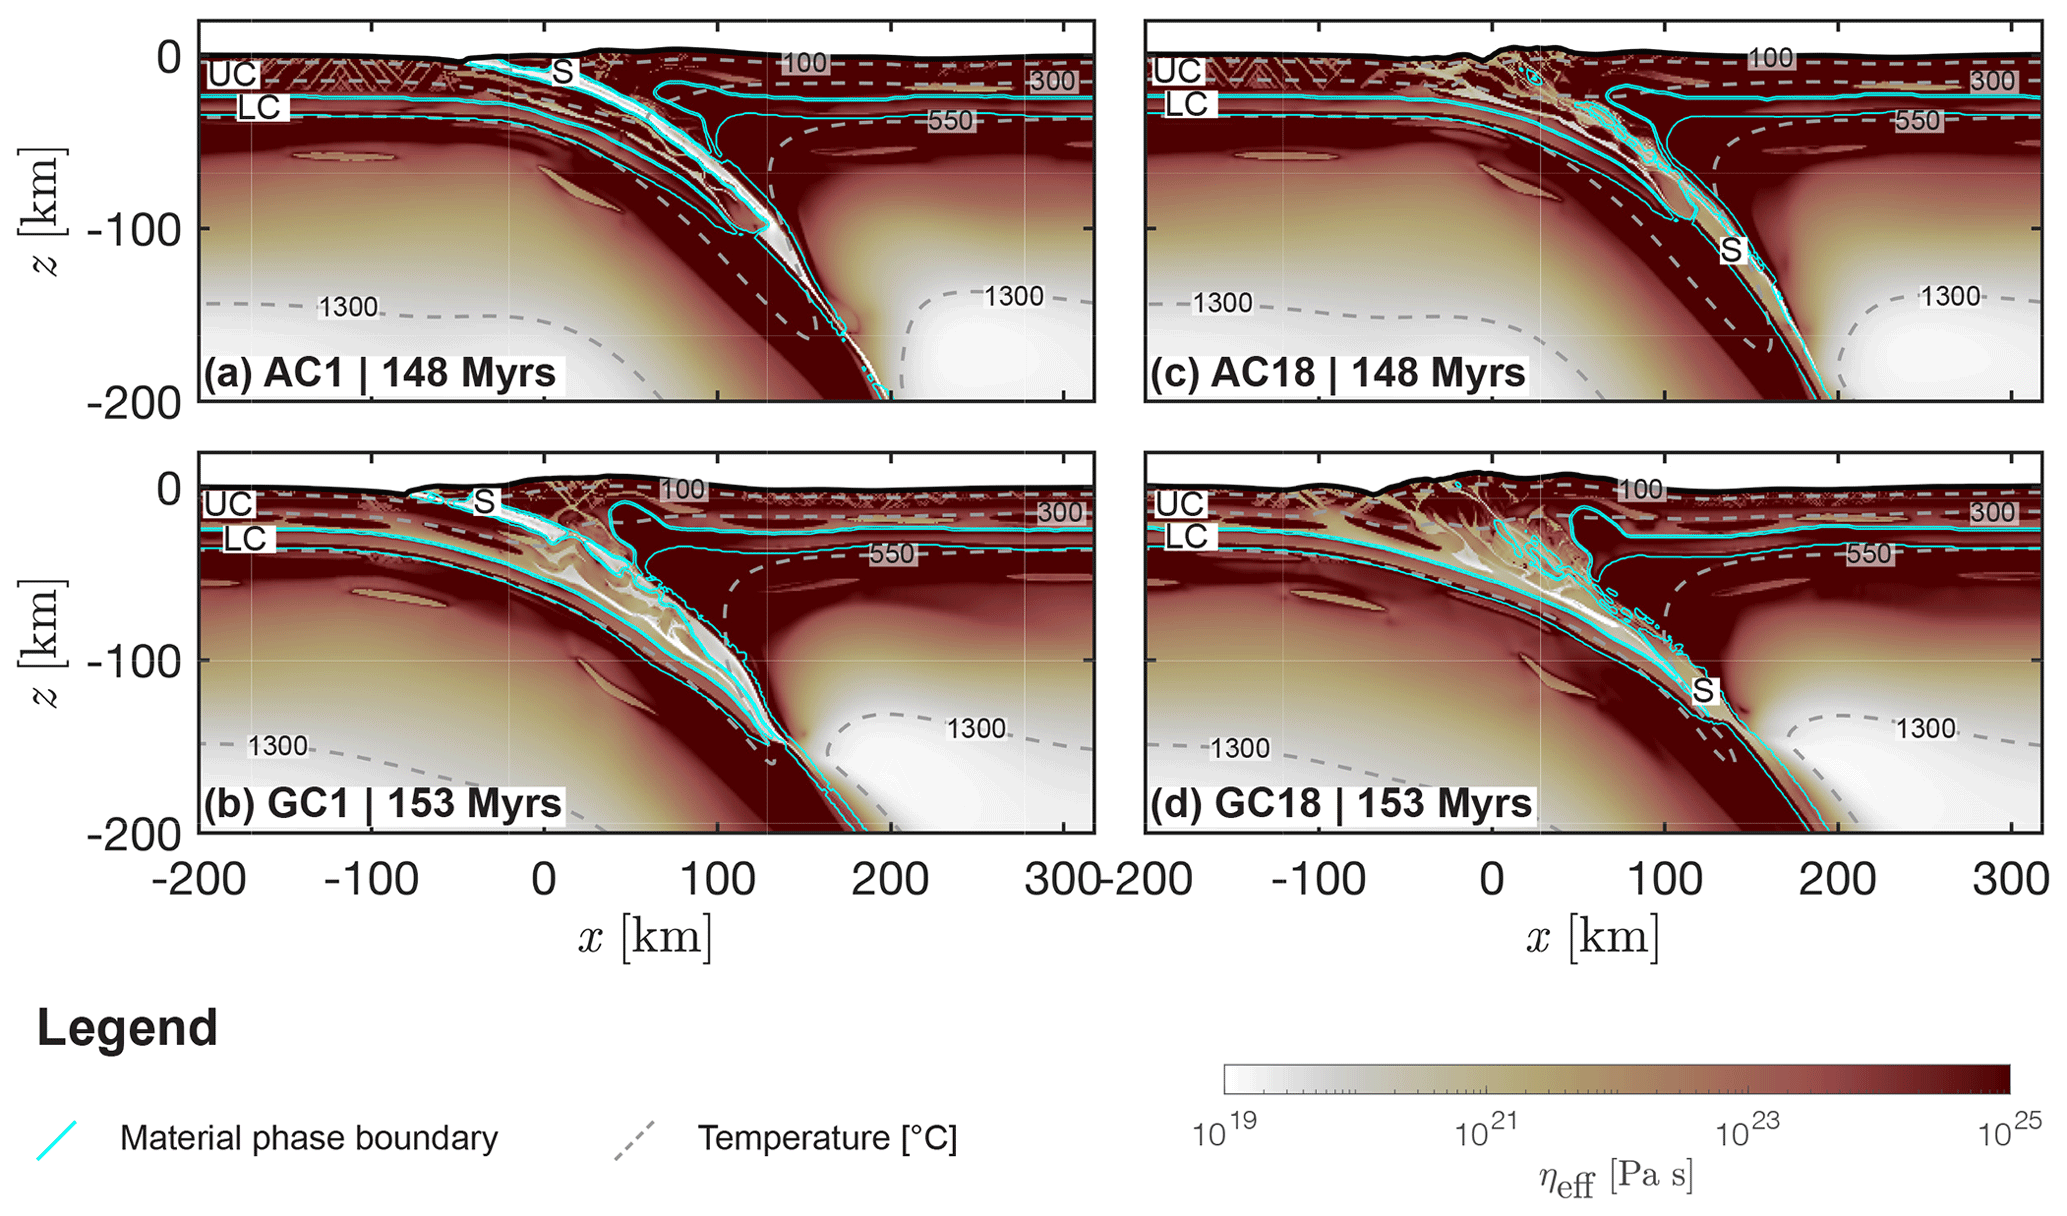
Figure 7Plate-interface and upper crustal-matrix strength for models AC1, AC18, GC1 and GC18. White to dark red is the effective viscosity field calculated by the numerical algorithm. (a, b) Weak interface (AC1 and GC1), (c, d) strong interface (AC18, GC18). Grey dashed lines are several isotherms, cyan solid lines are material phase boundaries. Abbreviations: UC = upper crust, LC = lower crust and S = serpentinites. Low viscosity of serpentinites indicates weak plate interface (a, b). For high viscosity the serpentinites are coupled to the lower plate and subducted into the mantle (c, d). For a wet anorthite upper crustal matrix (a, c) the brittle-ductile transition (depth of plastic shear bands) in the upper crust is at greater depth compared to a Westerly granite upper crustal matrix (b, d).
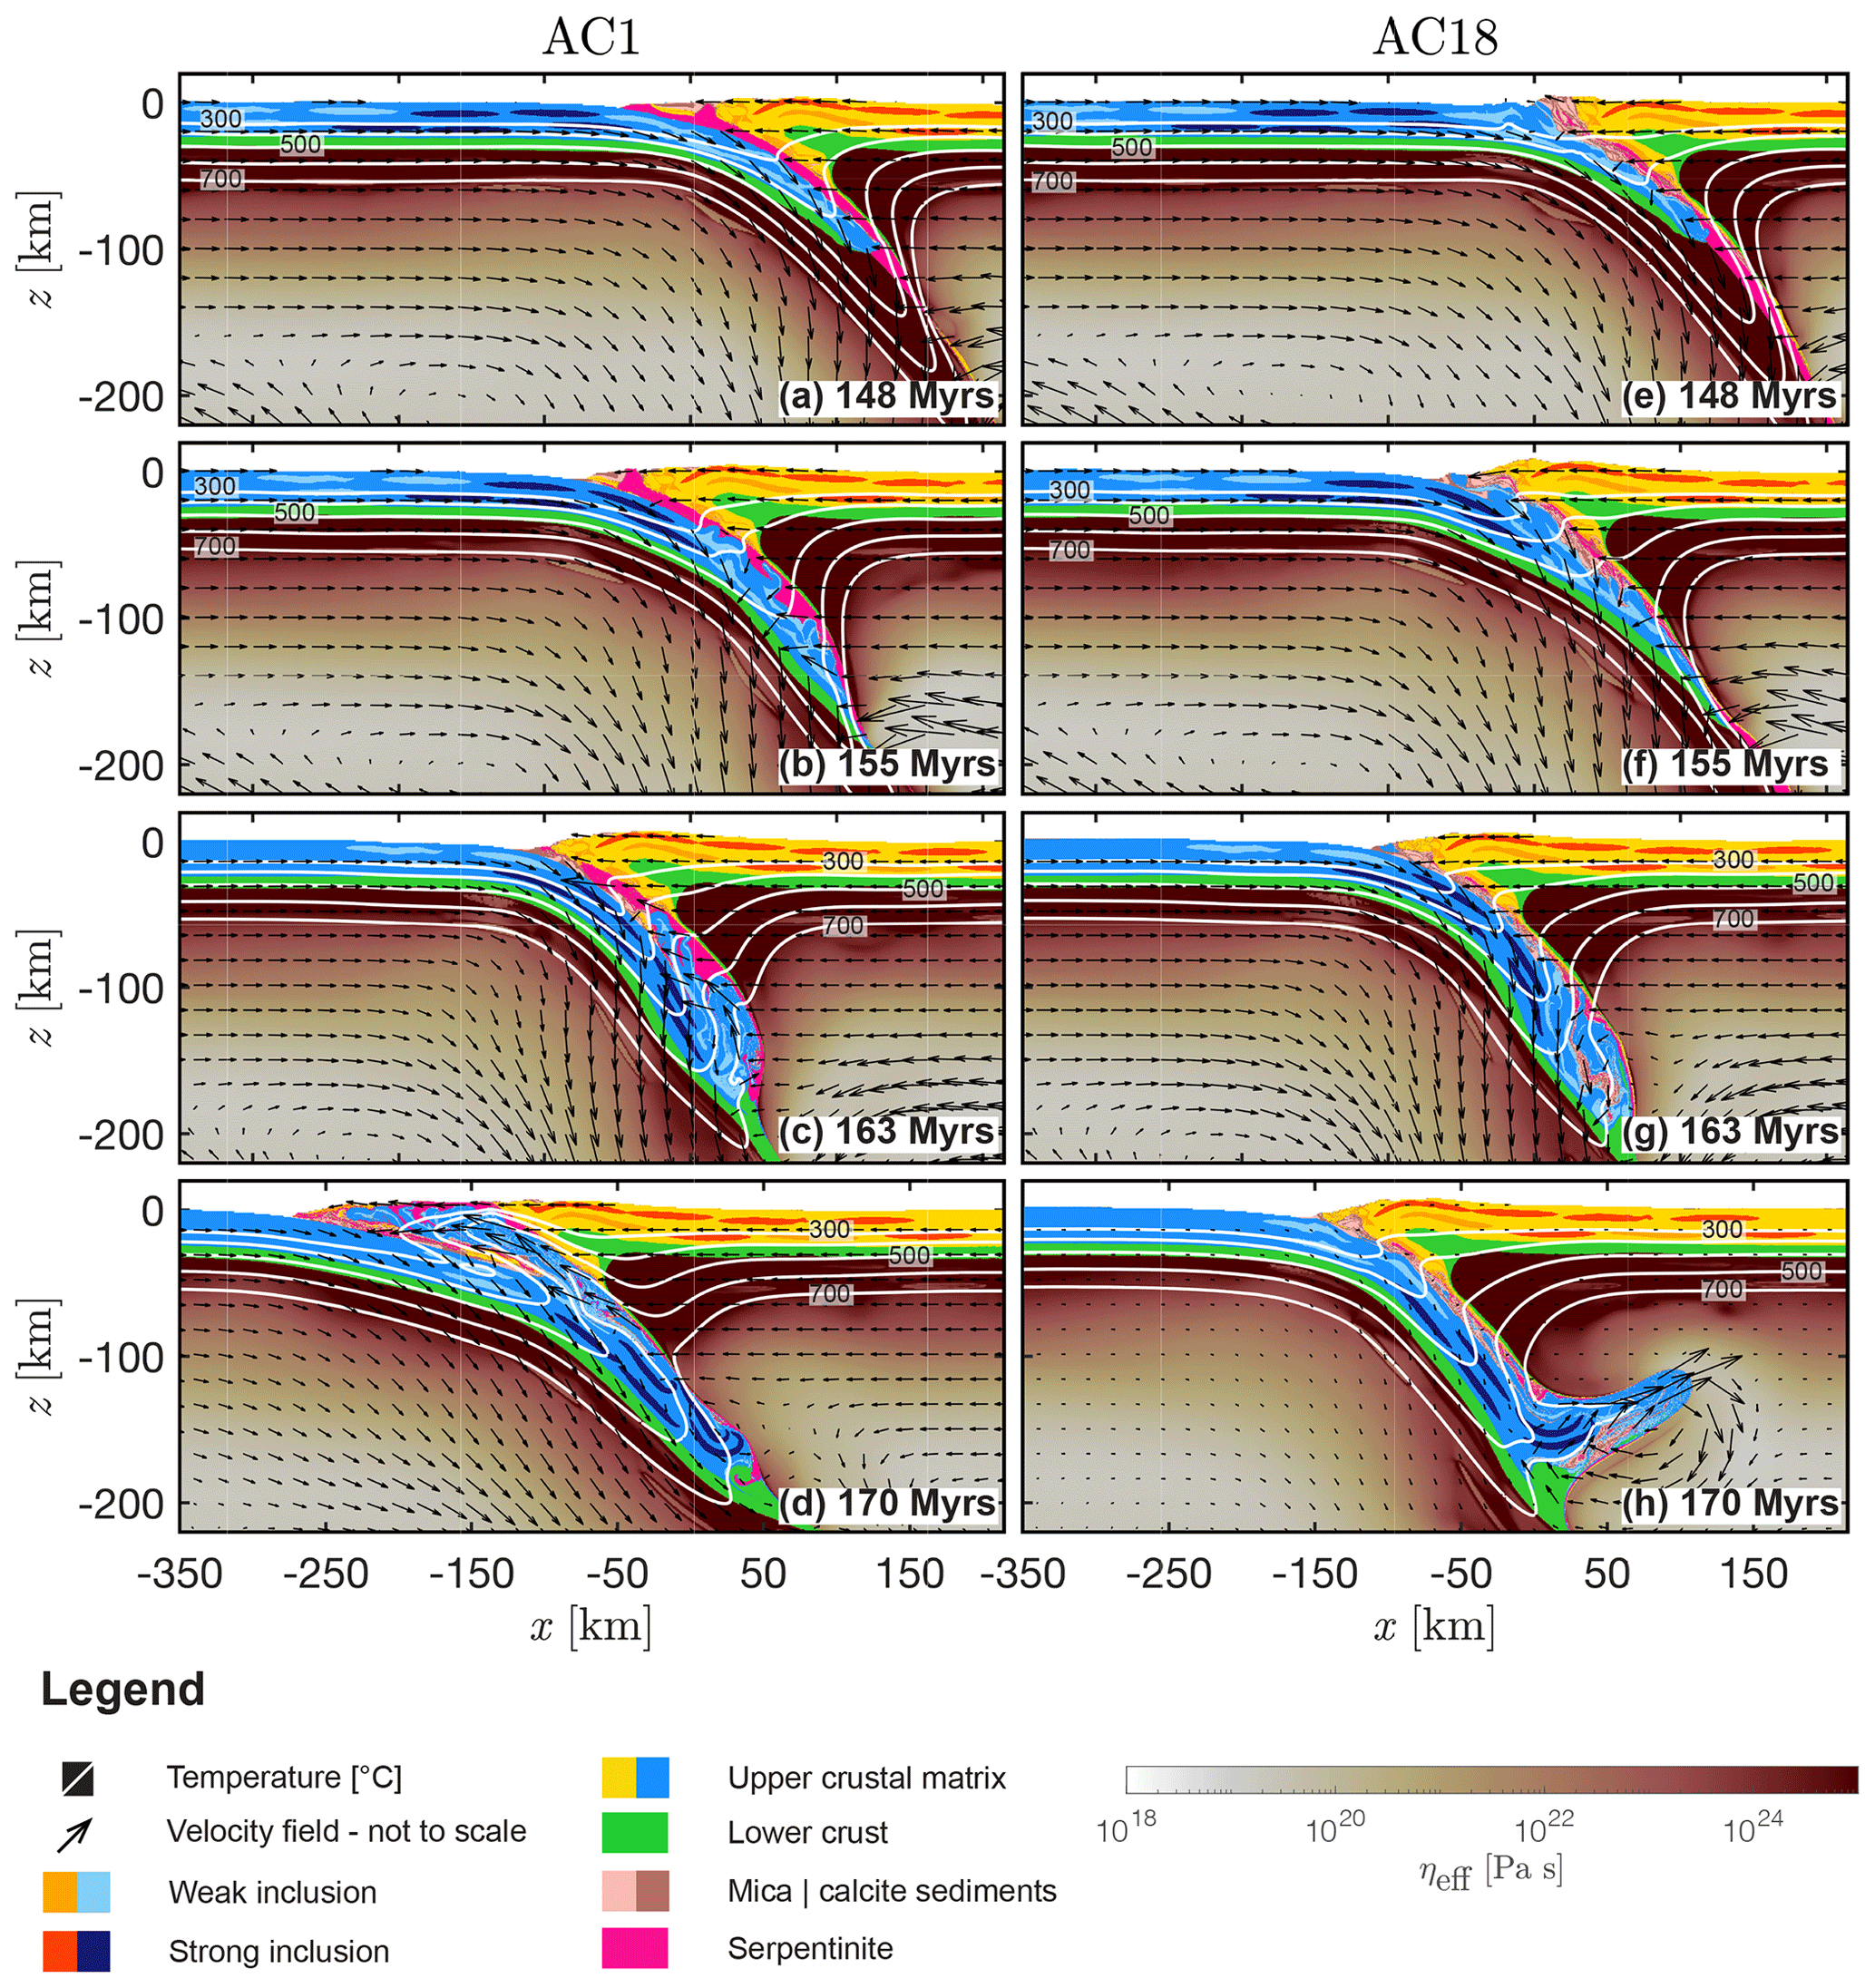
Figure 8Convergence and collisional stage of AC1 and AC18 (low and high shear resistance of serpentinite, complex density model, feldspar-dominated upper crust). White to dark red indicates the effective viscosity of the mantle material calculated by the algorithm, yellow to orange indicates the crustal matrix and the weak and strong inclusions of the overriding plate, light to dark blue indicates the corresponding crustal units of the subducting plate. The material parameters used for the upper crustal phases of the overriding and the subducting plates are identical. Green indicates the lower crust of both plates and salmon and brown indicates the sedimentary units. White lines are different isotherms and the arrows indicate the velocity field calculated by the numerical algorithm.
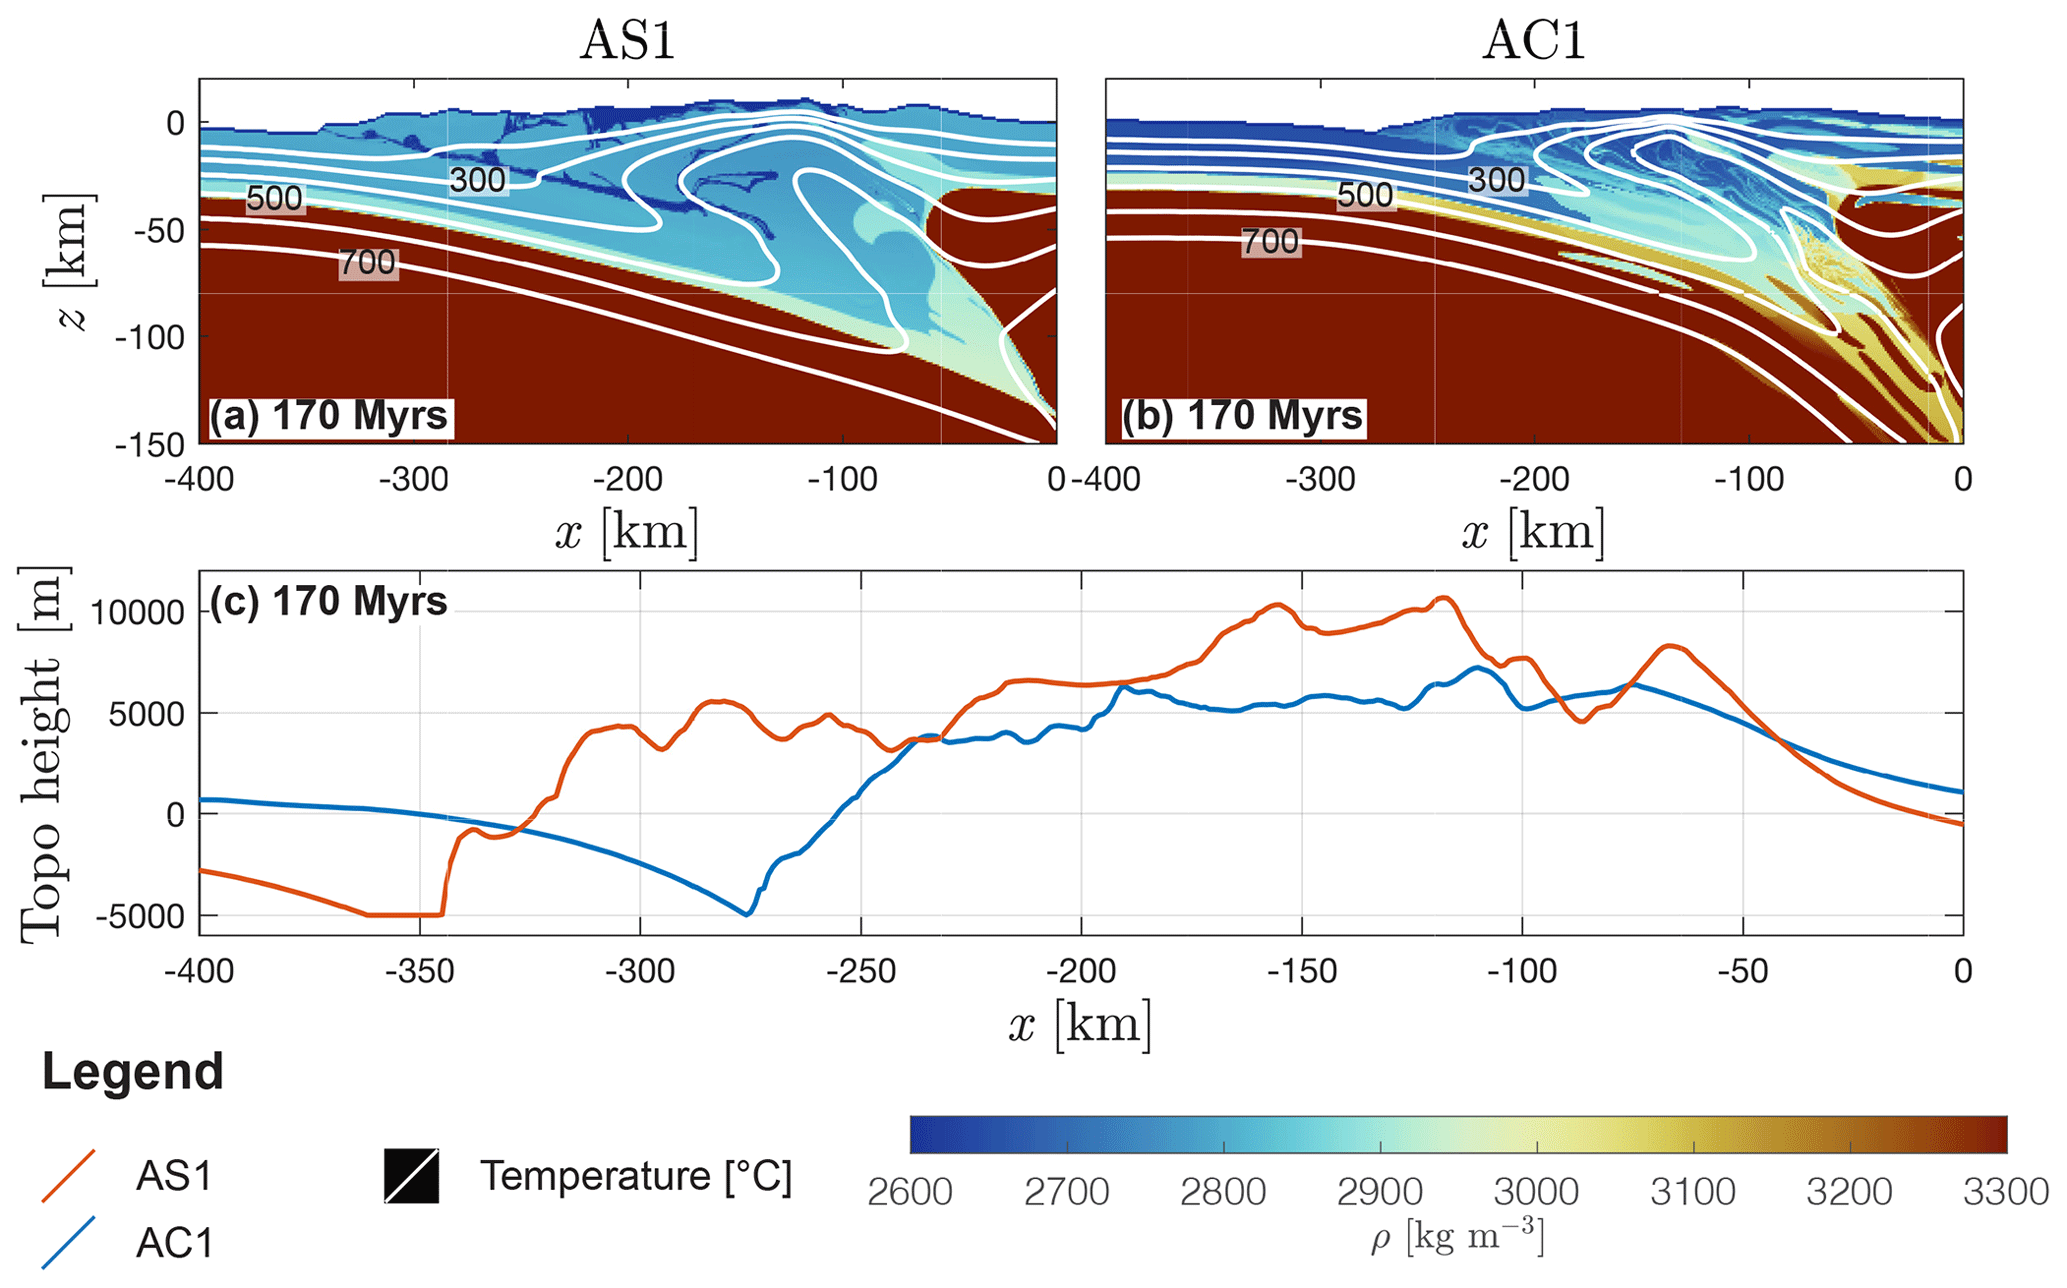
Figure 9Wedge geometry at 170 Myr in model history. Blue to red is the density field calculated by the algorithm for (a) AS1 (LEOS) and (b) AC1 (CD model). White lines are several isotherms. (c) Topographic elevation of AS1 (red line) and AC1 (blue line).
3.4 Impact of crustal strength – models GC1 and GC18
Similar to AS1 and AC1, in GC1 the serpentinites form a channel along the subduction interface down to ca. 120 km depth (Figs. 10a and 7b). Continental upper crust of the subducting plate is buried to km (Fig. 10a and b). At ca. 153 Myr, the subducting slab detaches at a depth of ca. 400 km (see Candioti, 2020b). Between 156 and 162 Myr, the subducted continental upper crust flows back to the surface along the weak subduction interface breaking through the continental upper crust of the overriding plate (Fig. 10c). The serpentinite material is surrounding the exhumed crustal material (Fig. 10d) within the orogenic wedge. Exhumation of upper continental crust from km to km occurs between 162 and 164 Myr. At ca. 165 Myr, a second slab detachment occurs at km (see Candioti, 2020b). In contrast to AC18, less crustal volume is subducted in GC18 (Fig. 10e). Instead, the continental upper crust is largely sheared off the subducting lithosphere at km (Fig. 10f), and several thrust sheets form (Fig. 10f). Compared to GC1, the relatively stronger serpentinite in GC18 is largely subducted (Fig. 7d) and sediments originally deposited in the trench are incorporated into a growing orogenic thrust wedge (Fig. 10f–h).
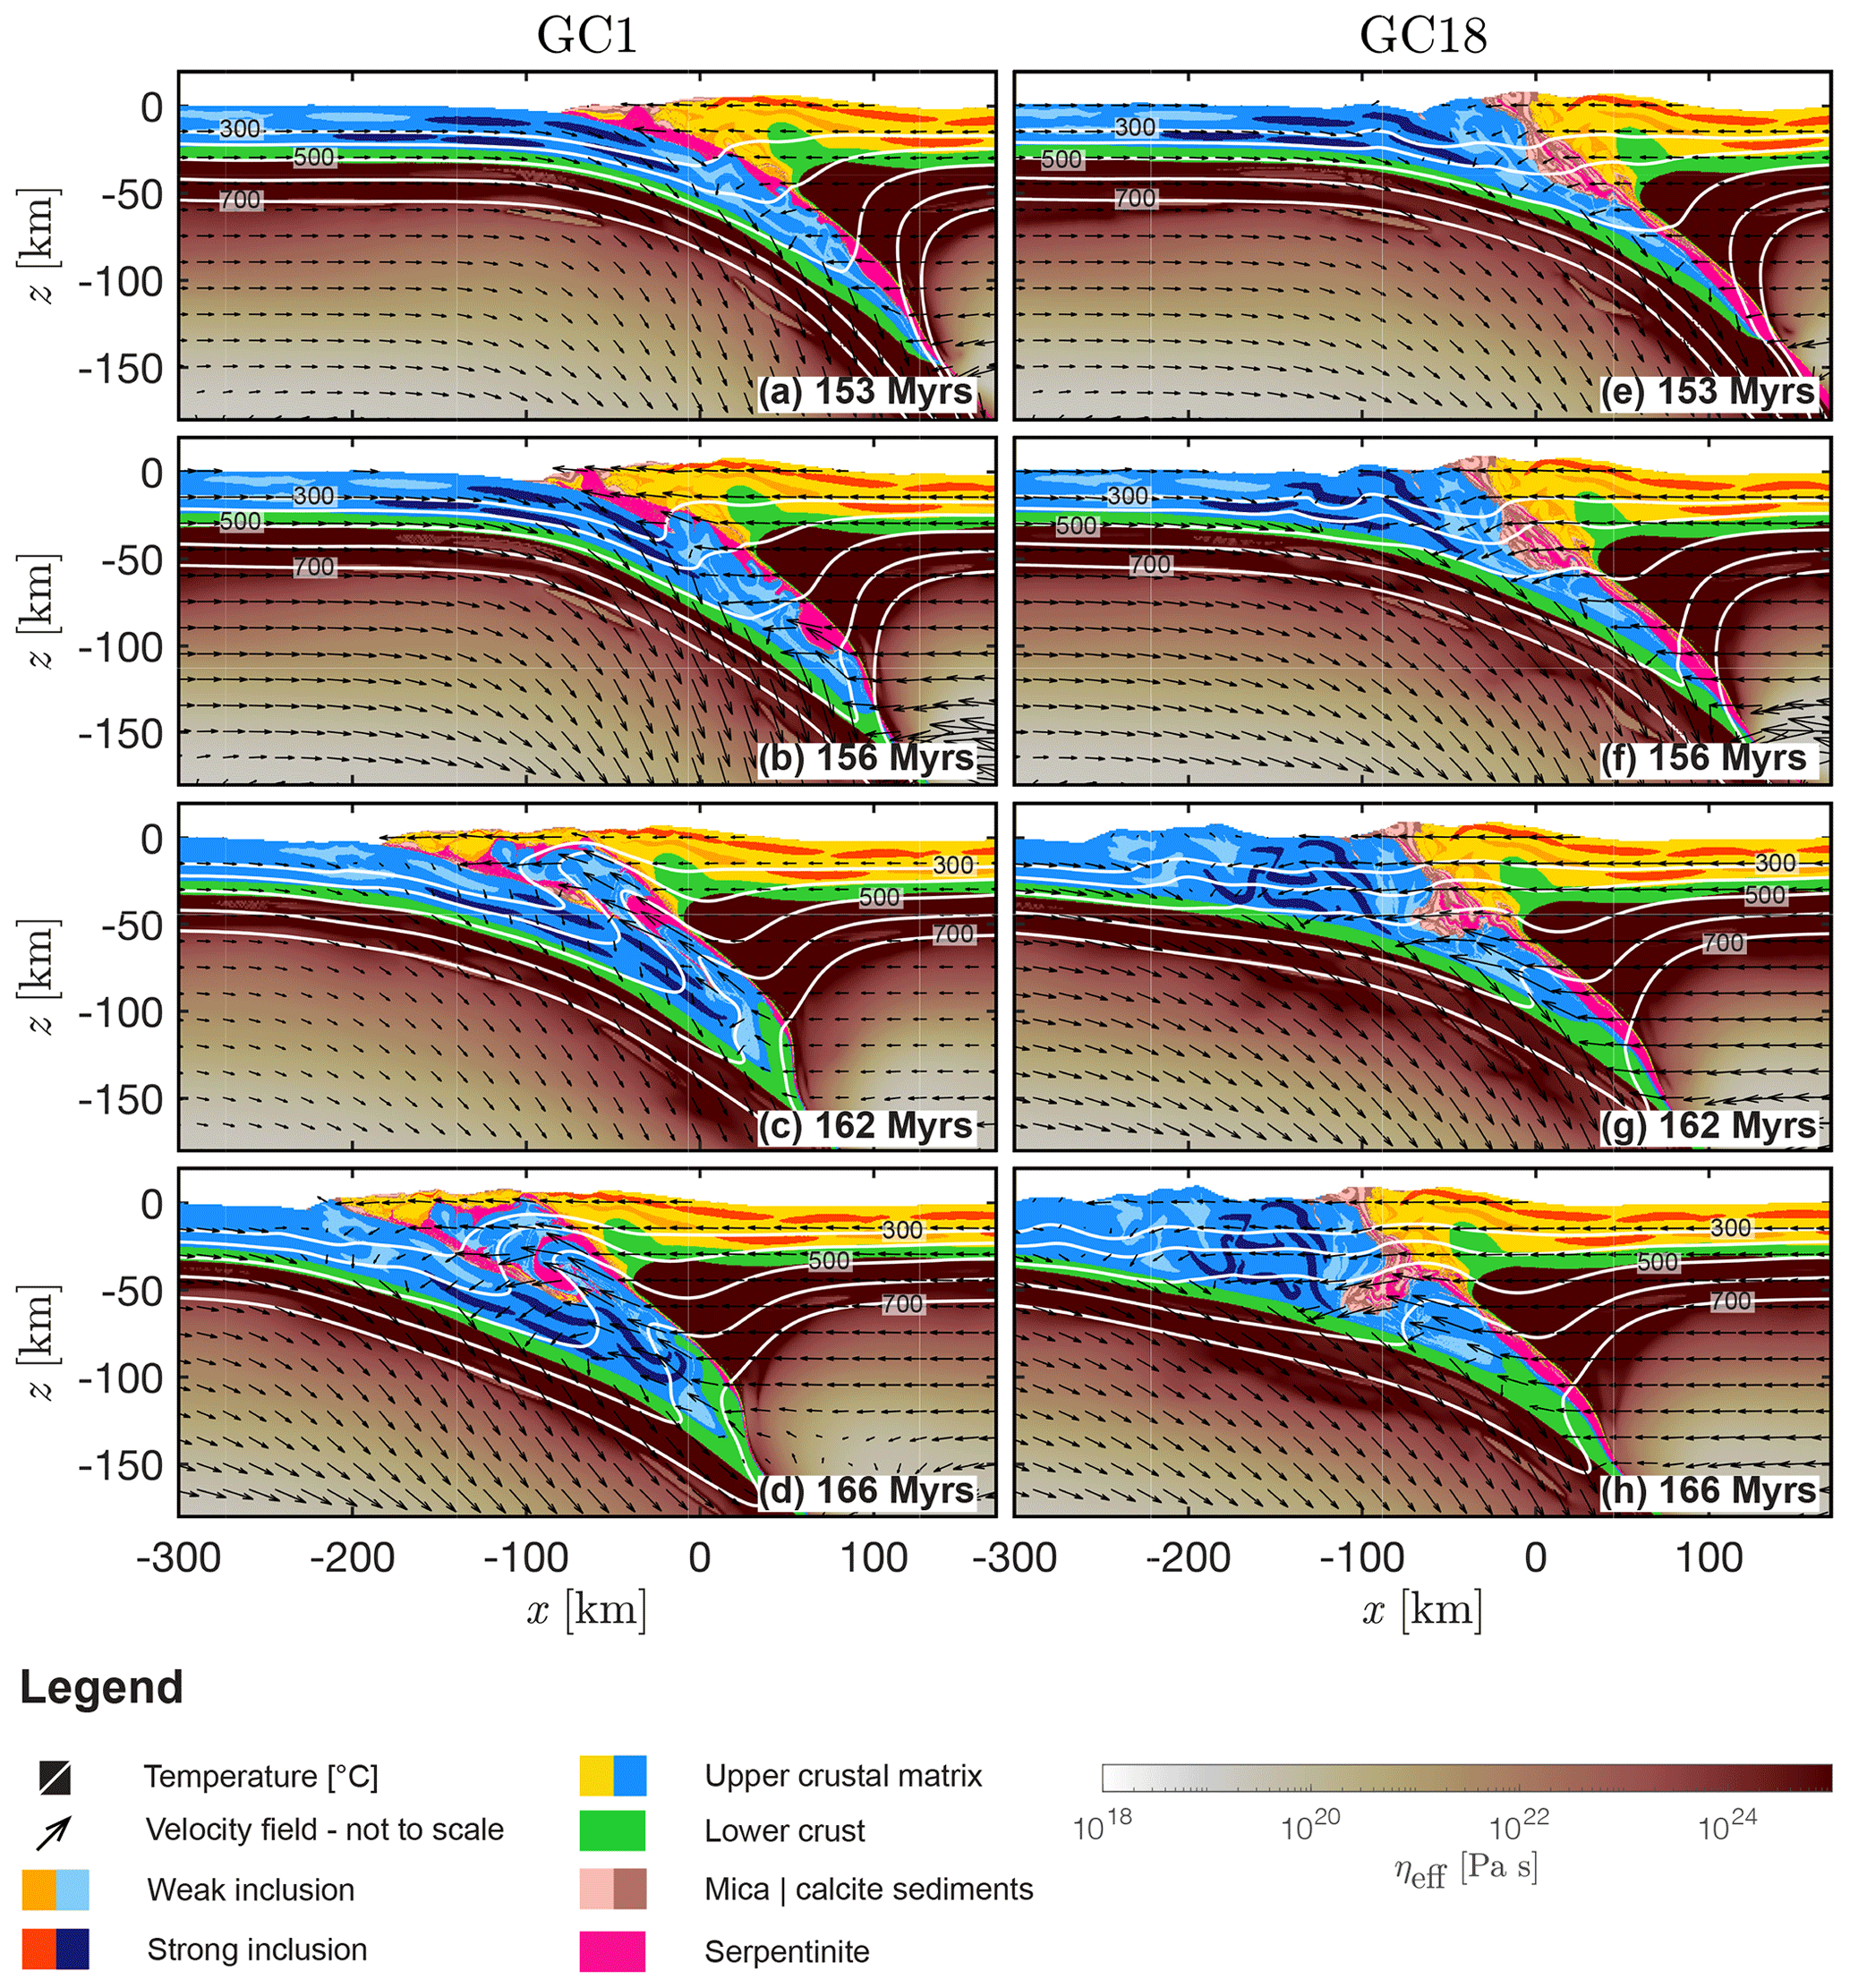
Figure 10Convergence and collisional stage of GC1 and GC18 (low and high shear resistance of serpentinite, CD model, quartz-dominated upper crust). White to dark red indicates the effective viscosity of the mantle material calculated by the algorithm, yellow to orange indicates the crustal matrix and the weak and strong inclusions of the overriding plate, light to dark blue indicates the corresponding crustal units of the subducting plate. The material parameters used for the upper crustal phases of the overriding and the subducting plates are identical. Green indicates the lower crust of both plates and salmon and brown indicates the sedimentary units. White lines are different isotherms and the arrows indicate the velocity field calculated by the numerical algorithm.
3.5 Evolution of buoyancy and shear forces
In order to investigate the relative impact of buoyancy and shear forces on collision, we quantify the temporal evolution of the horizontal driving force per unit length (Fig. 11b, FD hereafter; see Appendix C) and of the (upward-directed) buoyancy forces of subducted crustal material (Fig. 11c, FB hereafter; see Appendix C). Buoyancy forces calculated here represent an upward-directed (positive) buoyancy force of the subducted crust acting against further subduction. The ratio (Fig. 11a, ArF, hereafter) is a measure for the relative dominance of buoyancy or shear forces driving the deformation and exhumation within the orogenic wedge (see Appendix C). Points 1–5 in Fig. 11a–e represent important stages of model GC1 (thick dashed turquoise blue line) and are representative for the evolution of all presented models.
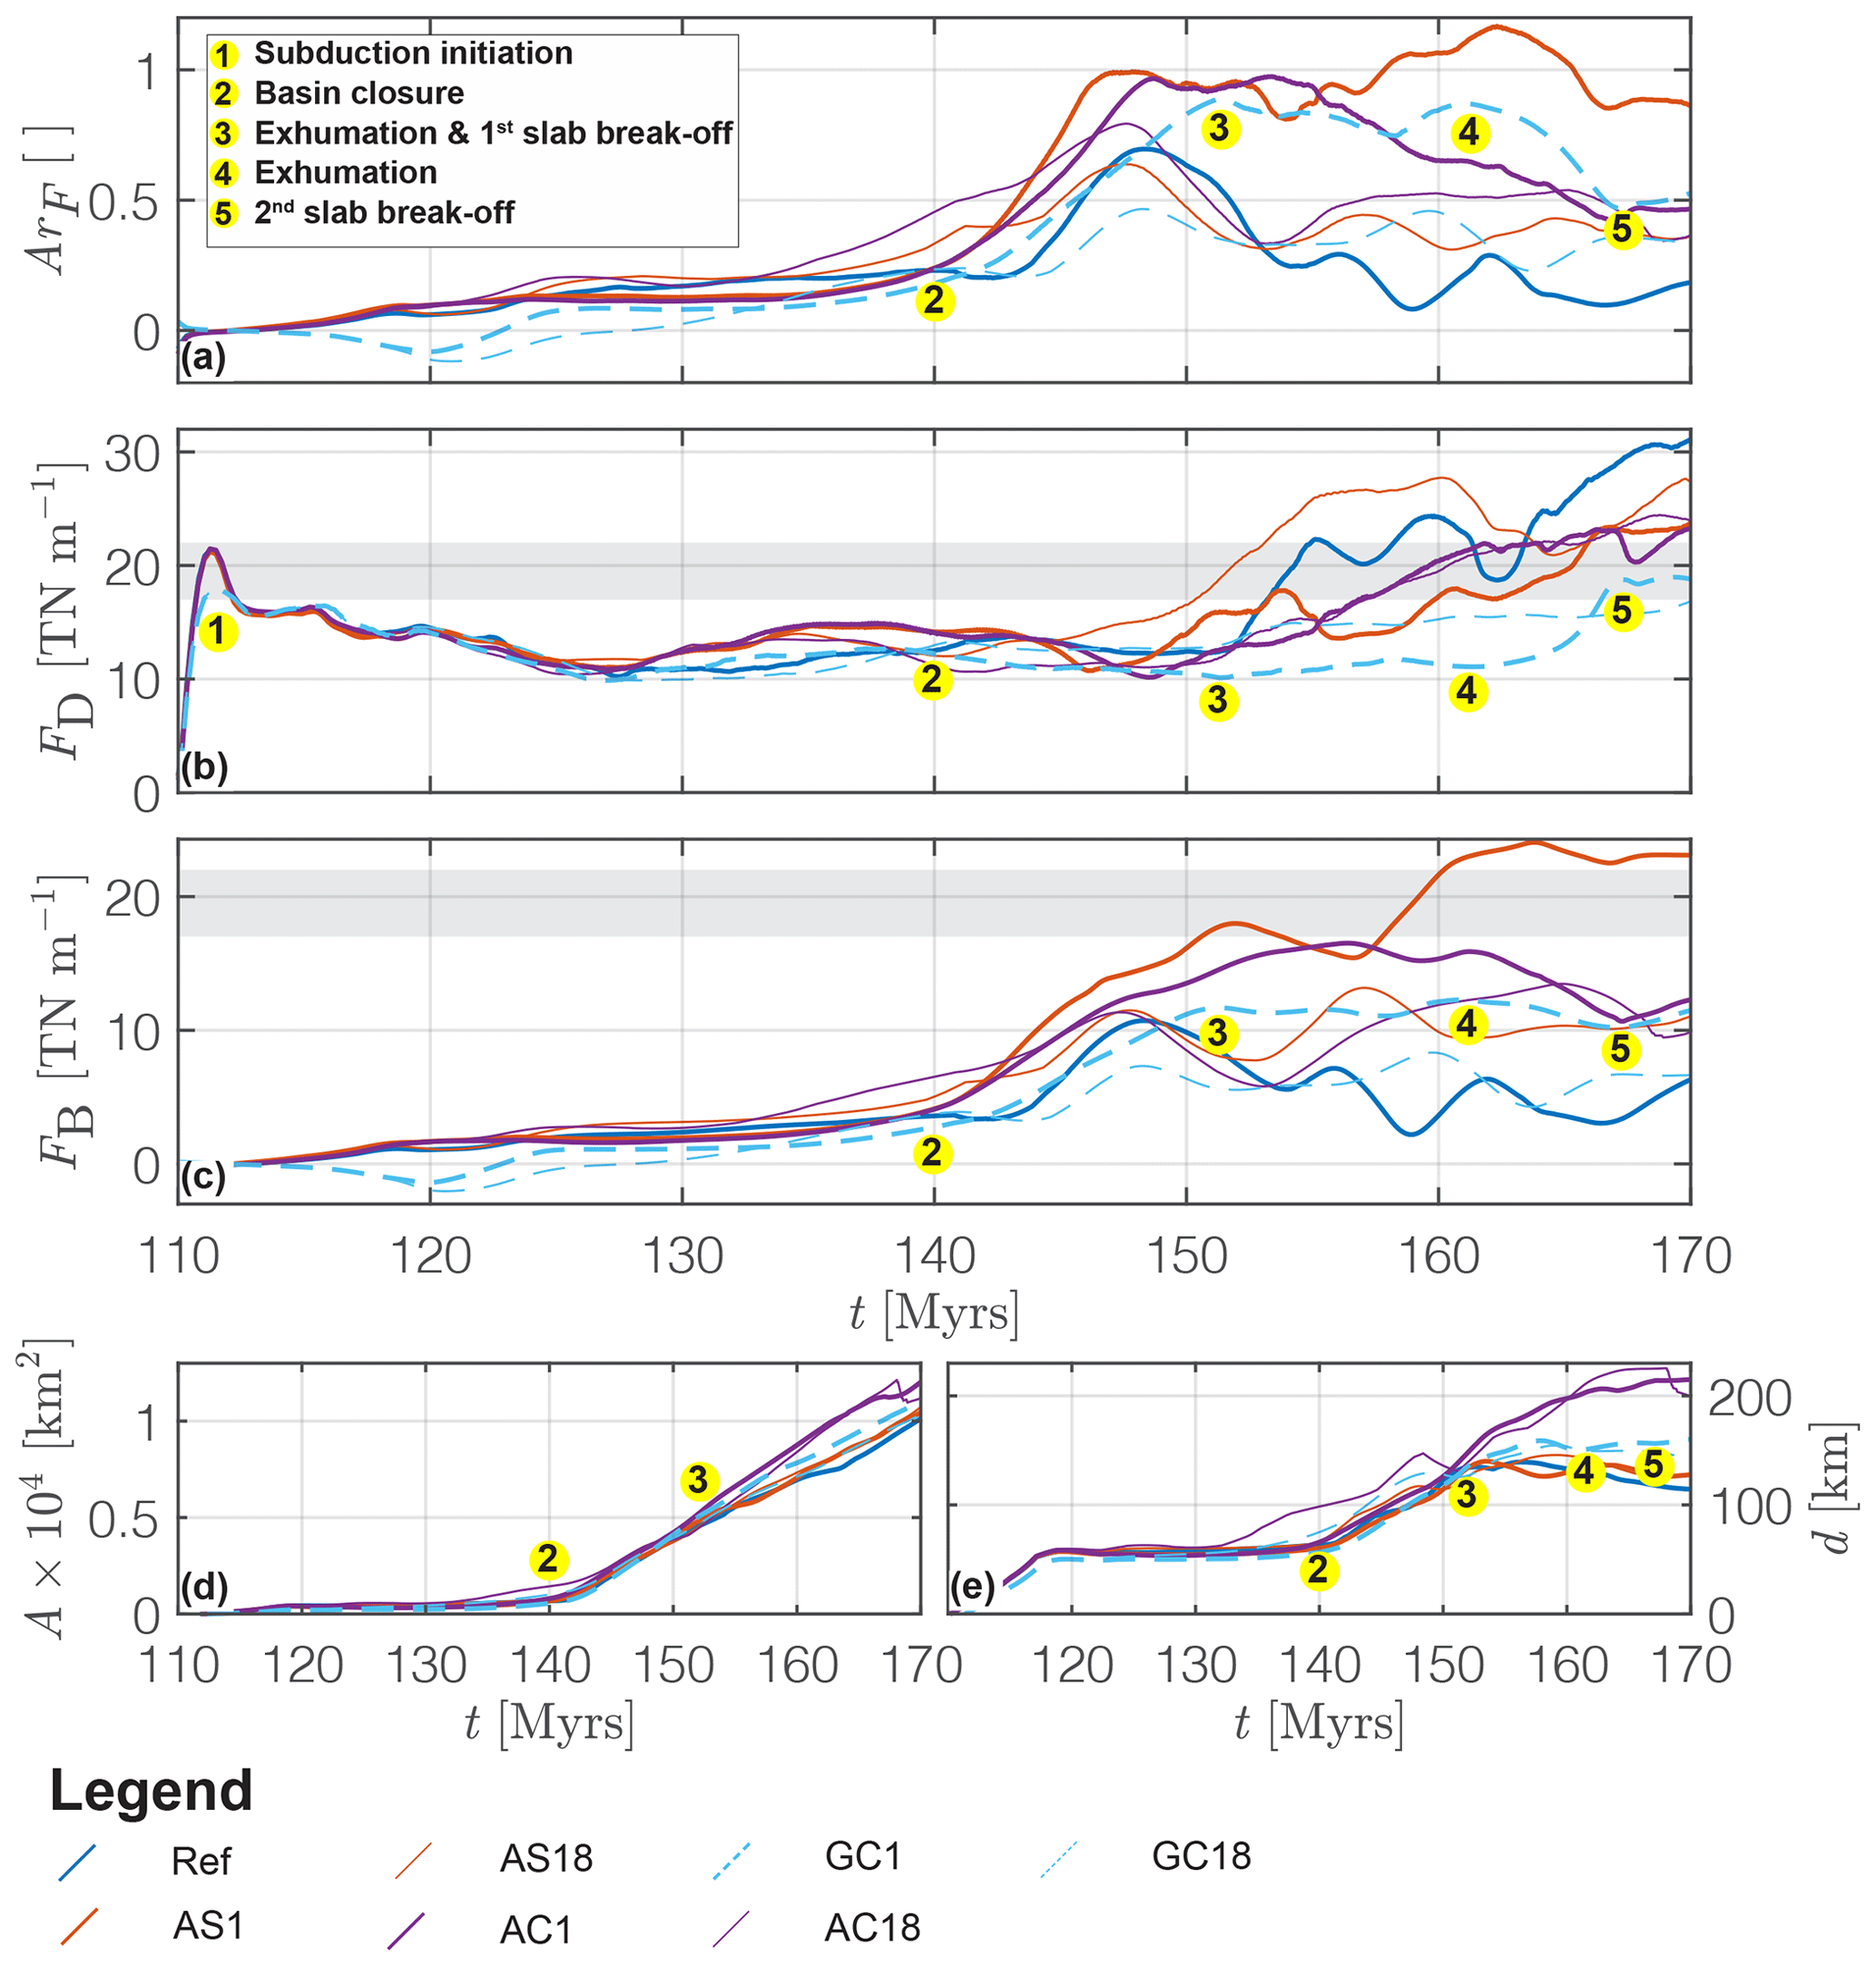
Figure 11Force evolution. (a) Ratio of buoyancy force to shear force, ArF, (b) shear forces, (c) buoyancy forces, (d) average area of subducted material and (e) maximum depth of subducted crust. For a detailed explanation on the calculation of quantities see Appendix C. Numbering in all panels exemplified for model GC1: 1 = onset of subduction initiation, 2 = basin closure and onset of continental subduction, 3 = onset of continental crustal exhumation and first slab detachment, 4 = onset of the second exhumation event and 5 = onset of the second slab detachment.
Subduction initiation occurs for FD≈22 TN m−1 in models of feldspar dominated continental upper crust (AS1, AS18, AC1 and AC18) and for FD≈18 TN m−1 in models of quartz dominated upper crust (GC1, GC18, 1 and grey area in Fig. 11b). Magnitudes of FD decrease after subduction initiation to ca. 10–15 TN m−1 and remain, on average, relatively constant during basin closure (between 1 and 2 in Fig. 11). Until basin closure, ArF≈0.25 and remains relatively constant in all models. Magnitudes of FB increase with an increasing volume of crustal material involved in subduction (see Fig. 11c and d) between 140 and 153 Myr. In response, magnitudes of ArF≈1 are reached in AS1, AC1 and GC1. Between ca. 153 and 156 Myr, shallower buried crustal material is exhumed in GC1 (3 in Fig. 11; see also Fig. 10a) coinciding with a deep slab detachment (see Candioti, 2020b). At ca. 162 Myr, the deeper subducted units are exhumed (see also Fig. 10c). This exhumation event is followed by a shallow slab detachment leading to a rapid increase in magnitude of FD at ca. 165 Myr. The buoyancy pull of the subducting slab is lost, and a larger horizontal driving force is needed to overcome the (upward-directed) buoyancy push of subducted crust and to continue subduction with the prescribed kinematic boundary velocity. While the buoyancy forces remain relatively constant, the increase in FD decreases the magnitude of ArF (between 4 and 5 in Fig. 11a–c). The maximum burial depth of continental crust is reached in AC1 and AC18 (feldspar-dominated upper crust) and is ca. 200 km. In REF, GC1, GC18, AS1 and AS18 the maximum burial depth varies between 120–150 km. During the formation of the collisional orogen, the magnitude of FD increases and eventually exceeds the magnitude that was necessary for subduction initiation (grey area in Fig. 11b). Magnitudes of FD and FB are on average higher in models of feldspar-dominated continental upper crust compared to models of quartz-dominated upper crust. The increased shear resistance in these feldspar-dominated models allows for deeper subduction of continental upper crust when the serpentinite is weak. High values for FD in AS18 and REF are explained by a more resistant subduction interface caused by either an increased shear resistance of the serpentinite material, or absence of serpentinization.
3.6 Different modes of orogenic wedge formation
The geometry, kinematics and dynamics of the evolving collision zone and orogenic wedge varies significantly in the presented models (Fig. 12). We refer here to these variations as different modes of orogenic wedge formation. These varying modes depend mainly on the shear resistance of upper crust and serpentinite, and its buoyancy contrast to the surrounding mantle material. The magnitude of ArF is used to classify the different modes of orogenic wedge formation.
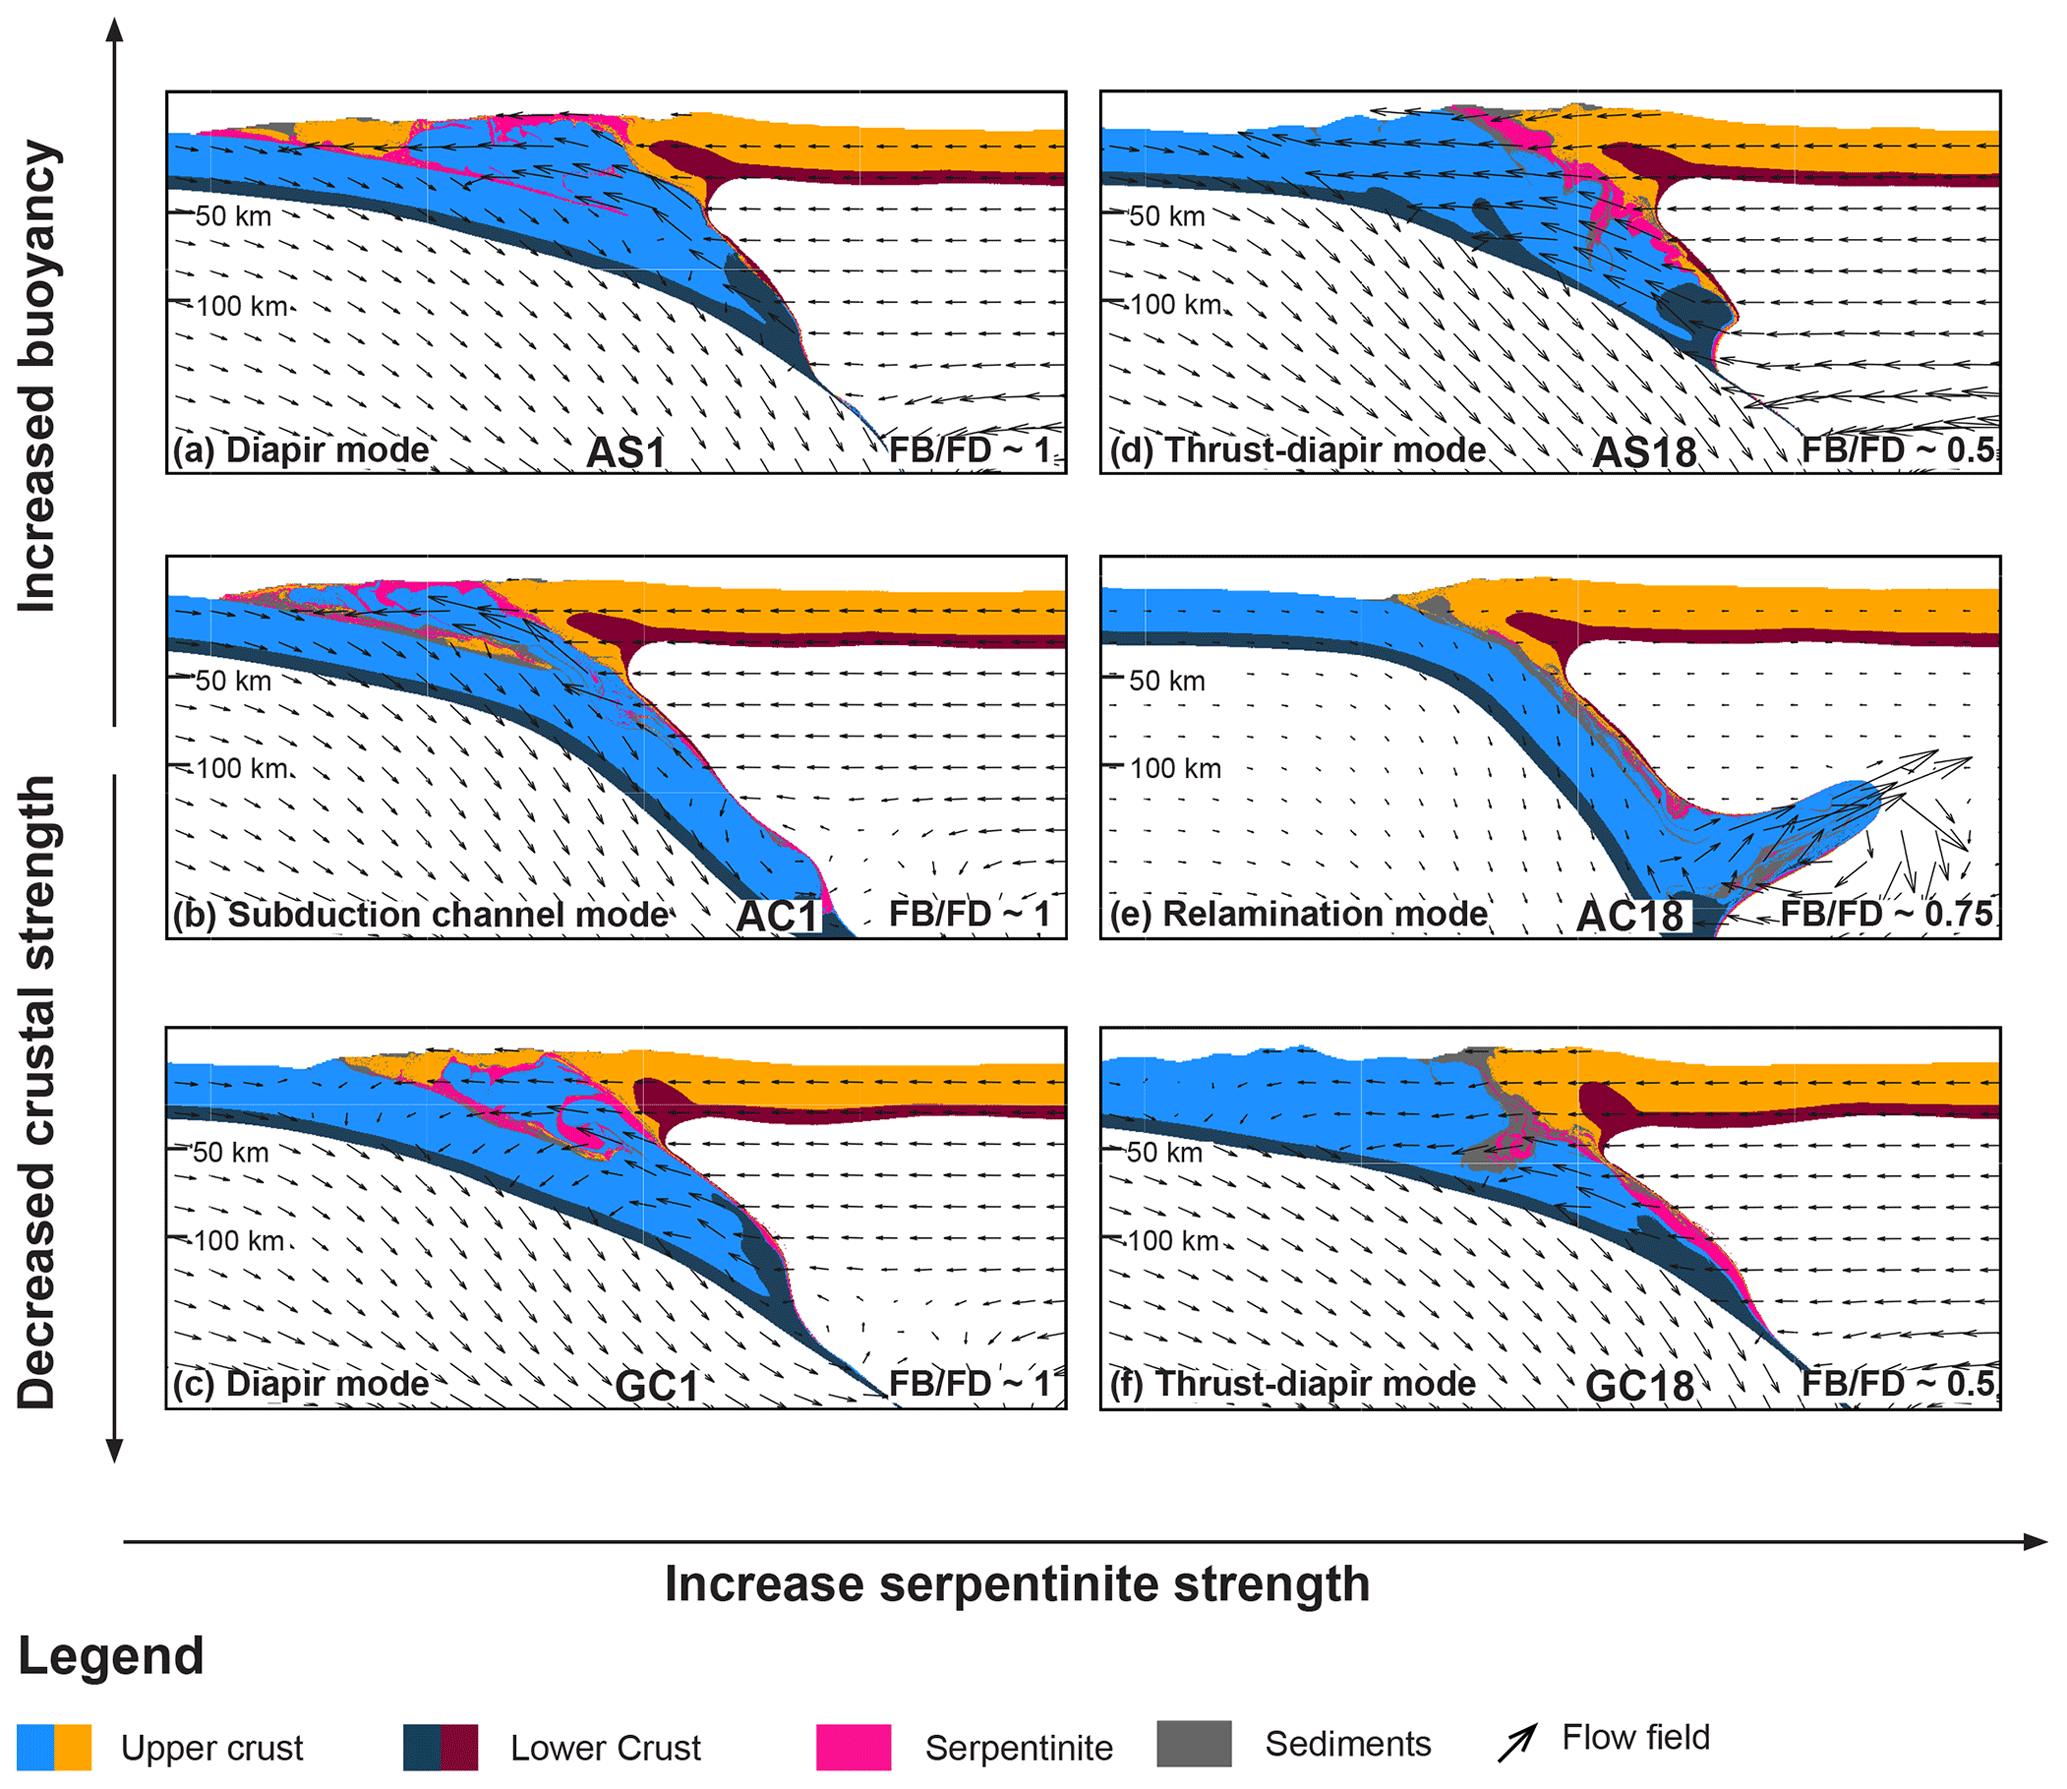
Figure 12Orogen dynamics observed in the models presented here. Light blue and orange indicates the upper crustal phases, dark blue and merlot red indicates the lower crustal phases of the subducting and upper plates, respectively. Dark grey and magenta represent the sediments and the serpentinite unit, respectively. Arrows indicate the velocity field calculated by the numerical algorithm.
For low shear resistance of serpentinites, generating a weak subduction interface, ArF≈1, indicating equal importance of buoyancy and shear forces building the orogenic wedge. Two modes are observed: (1) a diapir-like mode of exhumation due to either (i) increased buoyancy contrast (LEOS models) and high shear resistance of the upper crust (AS1; see Fig. 12a) or (ii) a decreased buoyancy contrast (CD models) and low shear resistance of the upper crust (GC1; see Fig. 12c); (2) a channel flow mode of exhumation occurs for a decreased buoyancy contrast (CD models) and increased shear resistance of the upper crust (AC1; see Fig. 12b).
In models of high serpentinite shear resistance, generating a strong subduction interface, two different modes are also observed: (3) a thrust-diapir mode of deformation for either (i) an increased buoyancy contrast and high shear resistance of the upper crust or (ii) a decreased buoyancy contrast and low shear resistance of upper crust. In both cases ArF≈0.5, indicating that shear forces dominate the building of the orogenic wedge (Fig. 12d and f). (4) A relamination mode due to relamination of deeply subducted continental crust is observed for a decreased buoyancy contrast and high shear resistance of the upper crust (ArF≈0.75; see Fig. 12e).
4.1 Buoyancy vs. shear forces controlling modes of orogenic wedge formation
The shear resistance of (i) serpentinites and (ii) the upper continental crust directly impacts the shear forces (compare GC1 to AC1 in Fig. 11b). Determining the shear resistance, or effective viscosity, of the lithosphere deforming under geological timescales remains challenging (Burov and Watts, 2006). Rock deformation experiments are performed at deformation rates that are many orders of magnitude higher than tectonic deformation rates. Best-fitting curves have to be extrapolated to natural conditions, which introduces large uncertainties on the actual strength of rocks deforming under natural conditions (Mancktelow and Pennacchioni, 2010; Idrissi et al., 2020). Serpentinite plays a crucial role in subduction zones and, ultimately, in the formation of Alpine-type collisional orogens (Hess, 1955; Raleigh and Paterson, 1965; Hacker et al., 2003; McCarthy et al., 2020). Despite its importance, the rheology of serpentinite at lithospheric-scale pressure and temperature conditions remains elusive (David et al., 2018; Hirauchi et al., 2020, and references therein). Several deformation mechanisms for serpentinite material, often based on experiments with antigorite, have been discussed in the literature, including dislocation creep (Hilairet et al., 2007), semi-brittle or plastic deformation behaviour (Chernak and Hirth, 2010; Hirth and Guillot, 2013), grain boundary sliding (Idrissi et al., 2020), and sliding on shear cracks (Hansen et al., 2020). Numerical models are useful to test different end-member rock rheologies and to investigate the impact of rock strength on subduction and formation of collisional orogens. To first order, weak serpentinite material may indeed form a subduction channel and lubricate the subduction interface. The subduction channel in model AC1 has formed self-consistently, because subduction was initiated without a prescribed major weak zone in the lithosphere. Deep subduction and exhumation to the surface of crustal material is feasible in this kind of model. In contrast, strong serpentinite material leads to detaching and thrusting of crustal material already escaping subduction at shallow depths. In natural settings, the effective strength of serpentinites may vary along the upper regions of the subducting plate parallel and/or orthogonal (along-trench) to the subduction direction, for example due to varying degrees of serpentinization. Such spatial strength variation may cause temporal and/or along-trench alternations between channel mode and thrust-diapir mode when serpentinites of different strength enter the subduction zone. The shear resistance of the upper crust resulting from the rheological flow laws employed here, wet anorthite (Rybacki and Dresen, 2004) and Westerly granite (Hansen and Carter, 1983), is similar and neither extremely low nor extremely high (see also Fig. 1 in Bürgmann and Dresen, 2008). However, employing these two different flow laws for the upper crust changes the mode of orogenic wedge formation significantly. Similar to the strength of serpentinites, in natural settings the effective strength of the upper crust may also vary and cause temporal and along-trench variations of the orogenic wedge modes during the evolution of continental collision.
Magnitudes of buoyancy forces in our models are enhanced by large density contrasts between the subducted material and the surrounding mantle. We tested end-member models of simple and complex density calculations. The precomputed density tables are based on calculated equilibrium phase diagram sections (Fig. 3). In our calculations we have assumed H2O saturation and therefore our system is open with respect to its H2O content, but closed with respect to other elements. This is a valid approximation for the kilometre scale that we are considering. However, the preservation of high-grade metamorphic rocks at the near-surface environment indicates that the crustal metamorphic rocks are not always at thermodynamic equilibrium as is assumed here. The rate of metamorphic re-equilibration is strongly affected by temperature and by the availability of fluids (Rubie, 1986; Austrheim, 1987; Malvoisin et al., 2020). Coupling mineral-scale phase equilibria modelling to large-scale geodynamic models remains challenging. Although coupling of petrological and thermo-mechanical modelling via CD models as presented here is simplified, this approach has proven useful to explain observations that cannot be predicted by the commonly used LEOS models. These observations include (i) varying sediment thickness accumulated during basin subsidence (Kaus et al., 2005), (ii) evolution of subducting slab dynamics (van Hunen et al., 2001; Toussaint et al., 2004) and (iii) the exhumation of (U)HP rocks (Yamato et al., 2007; Warren et al., 2008). In addition, our results demonstrate that CD models avoid unrealistically high topographic elevation during orogen formation.
Varying mechanical strength of (i) serpentinites and (ii) the upper crust in combination with varying buoyancy contrasts changes the mode of orogenic wedge formation modelled here (Fig. 12). Hence, it is essential to (1) further refine our knowledge on the mechanical strength of crustal rocks and serpentinites under natural deformation conditions and (2) to account for realistic density structures including metamorphic reactions in numerical models of collisional orogen formation.
4.2 Subduction initiation
We follow here the modelling approach by Candioti et al. (2020). The margin geometry and thermal structure, prior to convergence, is generated during a modelled rifting and cooling period. This way, the generated passive margin, the marine basin system and the subsequent convergence are modelled in an internally consistent manner. Subduction initiation is horizontally forced (Stern, 2004; Stern and Gerya, 2018; Crameri et al., 2020), and a major lithospheric shear zone forms around the transition from the distal to the proximal margin (see also the discussion in Candioti et al., 2020). The ad hoc parameterized layer of serpentinite is not relevant for subduction initiation, as subduction is initiated also in the reference model without serpentinite (see Fig. 4f). Instead, geometrical focusing of stresses below the margin together with thermal softening and a temperature-dependent viscosity leads to spontaneous formation of a shear zone transecting the lithosphere (Thielmann and Kaus, 2012; Jaquet and Schmalholz, 2018; Kiss et al., 2020; Candioti et al., 2020; Auzemery et al., 2020). In our models, magnitudes of FD between 18 and 22 TN m−1 are necessary to initiate subduction for quartz- and feldspar-dominated upper crust, respectively. These magnitudes are significantly lower compared to FD≈37 TN m−1 obtained by Kiss et al. (2020). They studied subduction initiation at an idealized, ad hoc constructed passive margin without mechanical heterogeneities in the form of a multi-layer or elliptical geometry (see also Candioti et al., 2020, for a detailed comparison). The Peierls flow law parameters describing the rheology of olivine used here have been elaborated by Goetze and Evans (1979). Recent studies suggest that the olivine strength resulting from this parameterization is likely overestimated (Idrissi et al., 2016). If true, stresses in the mantle lithosphere would be lower than predicted by our models, which could further reduce the magnitude of shear forces necessary for subduction initiation. However, the minimum value of FD required for subduction initiation in our models should be determined in future studies.
4.3 Potential applications to natural collisional orogens
4.3.1 Implications for the Pyrenean orogeny
The opening of the Bay of Biscay (110–105 Ma, Henry et al., 1998) lead to the formation of a narrow marine basin which was floored by exhumed mantle in the present-day Pyrenean domain. Convergence between the Iberian and European plates initiated at ca. 85 Ma and culminated in the formation of the Pyrenean collisional orogen in the Eocene (Jammes et al., 2009). Orogenic wedge formation in the Pyrenees involved mainly the upper 20 km of the upper crust (see Fig. 1a; Teixell et al., 2018, and references therein). The absence of subduction-related high-pressure metamorphism (Muñoz, 1992) indicates that no significant volumes of upper crust have been subducted to great depth (>50 km). Instead, the majority of the upper crust has been presumably sheared off the subducting lower crust and formed thrust sheets at mid to upper crustal level (Muñoz, 1992; Teixell et al., 2018, and references therein). Rifting-related inheritances are likely important for the formation of crustal thrust sheets during the Pyrenean orogeny (Jammes and Huismans, 2012; Jammes et al., 2014; Erdős et al., 2014). In our models, a ca. 360–400 km wide basin (see for example Fig. 4b) with exhumed serpentinized mantle is generated during a rifting period modelled prior to convergence. The model geometry before the onset of convergence is, thus, not directly applicable to the pre-orogen geodynamic setting in the Pyrenees, because the basin resulting from the opening of the Bay of Biscay was most likely considerably narrower (Jammes et al., 2009; McCarthy et al., 2020, and references therein). However, during the collisional stage, our thrust-mode models (for example model GC18, Fig. 10e–h) seem to reproduce some of the first-order features observed in the Pyrenees. We therefore suggest that the buoyancy push of subducted crust was insignificant during the Pyrenean orogeny. Instead, convergence between Iberia and Europe induced shear-force-driven crustal wedging without deep (>80 km) subduction of continental upper crust, as for example modelled by Jammes and Huismans (2012) and Grool et al. (2019).
4.3.2 Implications for the Alpine orogeny
In the Western Alps, a rifting phase prior to subduction lead to the formation of a ca. 300–400 km wide basin floored by exhumed mantle, and presumably only minor volumes of mature oceanic crust have been produced (Le Breton et al., 2021). Instead, ophiolites preserved in the Western Alps indicate serpentinization of the mantle exhumed in the basin (McCarthy et al., 2020, and references therein). The serpentinized material likely formed a relatively weak subduction interface (Zhao et al., 2020) and inhibited subduction of hydrous sediments, explaining the sparse arc magmatism in the European Alps (McCarthy et al., 2018, 2020; Yang et al., 2020). Field evidence of (ultra)high-pressure units (Chopin, 1984) in the Western Alps indicate either deep subduction of upper continental crust (Berger and Bousquet, 2008) at a close-to-lithostatic stress state, or significant deviation from the lithostatic stress state (Schenker et al., 2015) (Fig. 1b). Tomographic images (Zhao et al., 2015; Schmid et al., 2017) indicate that major volumes of upper continental crust have been involved in subduction. While the crustal wedge model may be applicable to the deformation during the post-collisional (⪅30 Ma) stage of the Alpine orogeny (e.g. Erdős et al., 2019), it does not predict the exhumation of subduction-related (ultra)high-pressure continental and oceanic crustal rocks prior to collision. Instead, a subduction channel model has been proposed to explain deep subduction of continental upper crust and subsequent exhumation of (ultra)high-pressure units along the subduction interface (Gerya et al., 2002; Raimbourg et al., 2007; Butler et al., 2014). The subduction channel model, as proposed by Butler et al. (2014), has been criticized mainly for two reasons: (1) exhumation relies on significant removal, or erosion, of major crustal volumes, which is not in agreement with the sediment volume recorded in the Eocene–Oligocene basins (Malusà et al., 2015). (2) The exhuming units are strongly mixed (tectonic mélange) and significant volumes of lower crust are also exhumed, which is at odds with interpretations from seismic tomography showing no significant exhumation of lower crust (Schmid et al., 2017). In our models, significant synconvergent exhumation of upper crust can occur by either diapirism or channel-flow and is enabled by spatially localized upper plate extension (Fig. 12) and not by significant erosion. Exhumation of the strong lower crust does not occur in our model, because it remains coupled to the subducting mantle lithosphere. Instead, weak zones in the upper crust connect and form a decoupling horizon within the upper crust above the Moho (see region of reduced viscosity in Fig. 7b). This observation is in agreement with interpretations from tomographic images. We focused here on the general evolution of different modes of orogenic wedges. We will present a detailed analysis of (i) the mechanisms causing local upper plate extension, (ii) the exhumation mechanisms of (ultra)high-pressure rocks, and (iii) the pressure and temperatures paths and associated exhumation velocities in a subsequent study, and we will not discuss these issues further here.
Our models are restricted to two dimensions and driven by far-field kinematic boundary conditions. Therefore, we can only capture first-order fundamental features of natural orogens. During model evolution, more and more crustal material is forced into subduction (Fig. 11d). In fact, in our models plate driving forces eventually reach again the magnitude necessary for subduction initiation after basin closure (see grey area in Fig. 11b). From this point on, the model probably becomes unrealistic, because in nature a new subduction zone may form at a different location and the active subduction zone may cease or slow down significantly. Plate reconstructions from the Western Alps indicate that European subduction below Adria was presumably slowed down significantly (“choked”) between ca. 35 and 25 Ma (Malusà et al., 2015; Schmid et al., 2017; see Fig. 13). Estimating subduction initiation at the Adriatic margin between ca. 90 and 85 Ma (Manzotti et al., 2014), there has been ca. 50–65 Myr of convergence before European subduction was “choked”. This duration approximately coincides with the time span (ca. 55–60 Myr of convergence) necessary to build up plate driving forces exceeding the magnitude for subduction initiation (at ca. 167 Myr; see 5 in Fig. 11b) in our model GC1. Hence, we suggest that the horizontal forces, required to drive the collision, became continuously larger during the evolving Alpine orogeny and ultimately exceeded a critical value leading to (1) significant slow-down of the European subduction and (2) plate boundary reorganization leading to subduction initiation of the remaining Adriatic oceanic lithosphere below Iberia (Fig. 13).
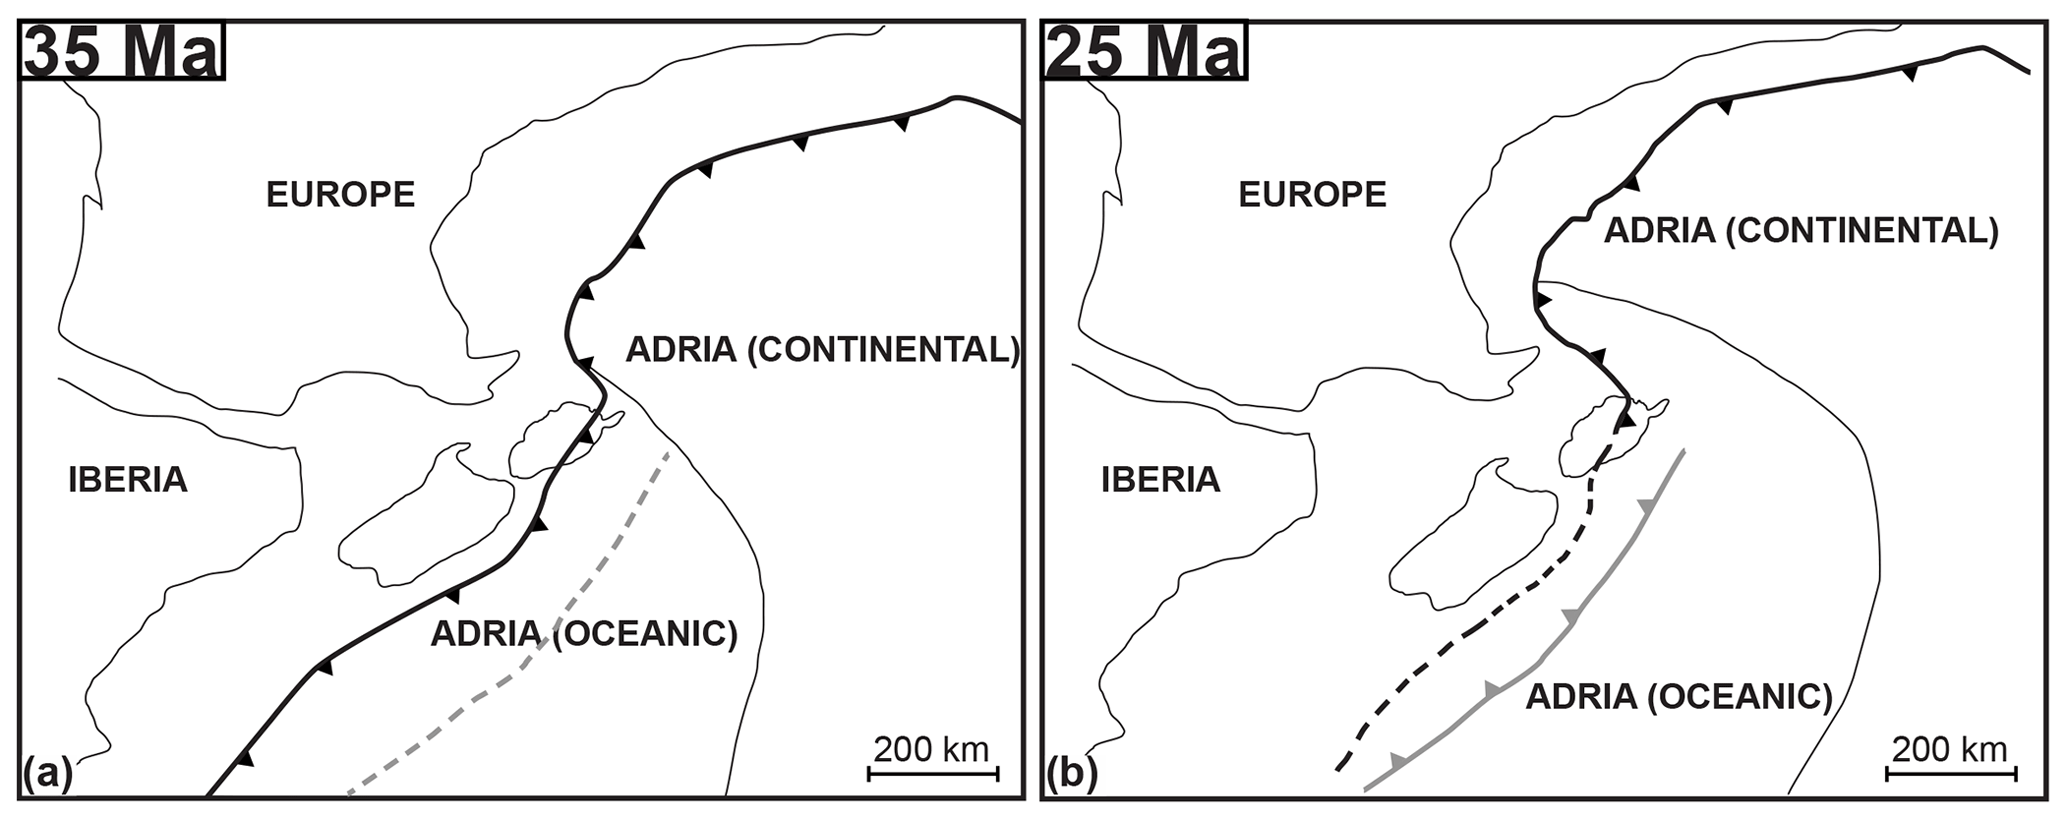
Figure 13Simplified plate reconstruction of Europe, Iberia and Adria at (a) 35 Ma and (b) 25 Ma. Europe and Iberia are fixed, Adria is moving northward. Thick black and grey solid lines indicate active subduction zones, dashed lines indicate inactive subduction zones. Sketches modified after Schmid et al. (2017) and Malusà et al. (2015).
4.3.3 Challenges in applying wedge models to the Alpine orogeny
The “classical” crustal wedge models (Platt, 1986; Dahlen, 1990; Malavieille, 2010; Dal Zilio et al., 2020b) focus mainly on upper-crustal levels (see grey framed area in Fig. 1b and explanations in the introduction). The evolution of the Alpine orogeny, however, involves the entire lithosphere in wedging (Nicolas et al., 1990). Some studies applied the “classical” crustal wedge model to lithospheric-scale orogens (Platt, 1986; Vanderhaeghe et al., 2003; Beaumont et al., 2010). Vanderhaeghe et al. (2003) concluded that temperature dependence of material parameters indeed modulates wedge geometries, impacts on the transition between wedge and plateau behaviour, and controls the topographic evolution. In crustal wedge models, deformation is usually driven by an internal kinematic boundary condition at the base of the continental crust pulling the material towards a rigid backstop. Of course, subduction and collision in our models are also controlled by the kinematic boundary conditions. However, in our models boundary conditions are imposed far away from the evolving wedge, and not directly at the base of the continental crust, avoiding kinematic singularity points and allowing for continental subduction. This is likely important when the mantle lithosphere is involved in wedging (Beaumont et al., 2010). The first-order dynamics within the evolving wedge are controlled by the interaction of buoyancy and shear forces according to the shear resistance and density structure of the material. Our models, therefore, presumably provide a more realistic insight into orogen dynamics compared to orogenic wedge models considering crustal deformation only.
As mentioned in Sect. 4.1, the density structure impacts on the force balance and reduces the mean topographic elevation. This is important, because orogenic wedge models applied to the Western Alps have been criticized for overestimating the mean topographic elevation (Kissling, 1993; Dal Zilio et al., 2020a). Certainly, the average topography in our models is still higher compared to the average topography of the Alps. However, we suggest that employing more realistic density models is an important step to avoid exaggerated mean topographic elevation in orogenic wedge models. Furthermore, the topography in our models would likely decrease if we significantly reduce the convergence velocities at the mature stage of orogenic wedge formation, so that rollback of the subducted mantle lithosphere would become more important. The so-called rollback orogeny (Kissling and Schlunegger, 2018; Dal Zilio et al., 2020a) applies to the latest Alpine evolution in the post-collisional stage (younger than ca. 30 Ma) but does not apply to the formation of the major (ultra)high-pressure regions (including oceanic, e.g. Zermatt-Saas, and Adriatic, e.g. Sesia and Dent Blanche, domains) of the Alps.
Absolute values for shear and buoyancy forces reported here strongly depend on the amount and strength of crustal material carried into the subduction zone. How much crustal material has been involved in Alpine subduction depends on the pre-orogenic crustal thickness (Mohn et al., 2014) and is still contentious (Butler, 2013; Schmid et al., 2017). The orogenic wedges modelled here are wider and deeper than the natural Alpine orogenic wedge. The size of the mechanical heterogeneities employed here is chosen based on the numerical resolution (1 km × 1 km) and probably strongly impacts on the size of the modelled wedge. At higher numerical resolution, the size of the mechanical heterogeneities could be reduced and the modelled rifted margins might be thinner, leading to a more realistic pre-orogenic crustal thickness generated during the rifting period. In consequence, less material would be involved in subduction, and the absolute magnitude of forces would change. However, the general model evolution, i.e. the relative increase in buoyancy forces with continuous subduction, would be most likely unchanged. Therefore, our models likely provide a representative model for the relative evolution of shear and buoyancy forces building orogenic wedges.
Our models show that upward-directed buoyancy forces, FB, caused by subduction of continental crust, can be as high as the horizontal driving shear forces, FD, induced by far-field plate convergence. Therefore, such buoyancy forces should be considered in models of continent collision and associated orogenic wedge formation.
We investigated three parameters that control orogenic wedge formation: (1) the shear resistance, or strength, of serpentinites, controlling the strength of the subduction interface; (2) the strength of the continental upper crust, controlling the maximal depth of crustal subduction; (3) the density structure of the subducted material, which controls buoyancy forces and significantly impacts on the mean topographic elevation, leading to more realistic topography evolution.
These three parameters control the evolution of the ratio . The value of ArF controls the mode of orogenic wedge formation: ArF≈0.5 causes thrust-sheet-dominated wedges, similar to crustal wedge models without buoyancy, with thrusts propagating towards the foreland; ArF≈0.75 causes minor wedge formation due to significant relamination of subducted crust below the upper plate; ArF≈1 causes buoyancy flow, or diapir, dominated wedges involving exhumation of crustal material from large depth (>80 km).
The spatial and temporal variation of the three parameters mentioned above, and the associated variation of ArF, may explain the variation of deformation style observed between and within natural collisional orogens. We suggest that during the formation of the Pyrenees ArF⪅0.5 due to the absence of high-grade metamorphic rocks, whereas for the Alps ArF≈1 during exhumation of high-grade rocks and ArF⪅0.5 during the post-collisional stage. In the models, the increase in FB during orogenic wedge growth causes an increase in FD required to drive wedge growth and subduction. In nature, the requirement of larger driving forces may cause a slow down, or “choking”, of the associated subduction and may even cause horizontally forced subduction initiation in other, nearby regions. Therefore, quantifying buoyancy and shear forces during orogenic wedge formation may prove useful to unravel changes in relative plate motion and subduction initiation during the Alpine orogeny, and during other collisional orogenies worldwide.
We employ the extended Boussinesq approximation (e.g. Candioti et al., 2020) for buoyancy-driven flow. The applied numerical algorithm solves the continuity and momentum equations defined as
where i and j are spatial indices and repeated indices are summed, v is velocity and x is the spatial coordinate, σ is the total stress tensor, ρ is density, and is the gravitational acceleration. Effective density can be (1) computed as a linearized equation of state (LEOS) like
where P (negative mean stress) is pressure, T is temperature, ρ0 is the material density at reference temperature (T0) and pressure (P0), and α and β are material parameters accounting for density changes due to thermal expansion and isothermal compression, respectively, , and . Alternatively, effective density can be (2) pre-computed using the Gibbs free energy minimization software package Perple_X (Connolly, 2005) for given bulk rock compositions. The density field predicted by these phase equilibrium models is stored in look-up tables and density values are read in by the applied algorithm during simulation runtime according to local pressure and temperature conditions at each grid cell centre.
We employ a backward-Euler scheme (e.g. Schmalholz et al., 2001) to define the viscoelastic stress tensor components as
where δij is the Kronecker–Delta function, ηeff is the effective viscosity, and denotes the effective deviatoric strain rate tensor components,
where G is shear modulus, Δt is the time step, denotes the deviatoric stress tensor components of the preceding time step. We consider Maxwell materials and additively decompose the total deviatoric strain rate tensor into contributions from viscous (dislocation, diffusion and Peierls creep), elastic and plastic deformation like
Table A1Physical parameters used in the numerical simulations presented here.
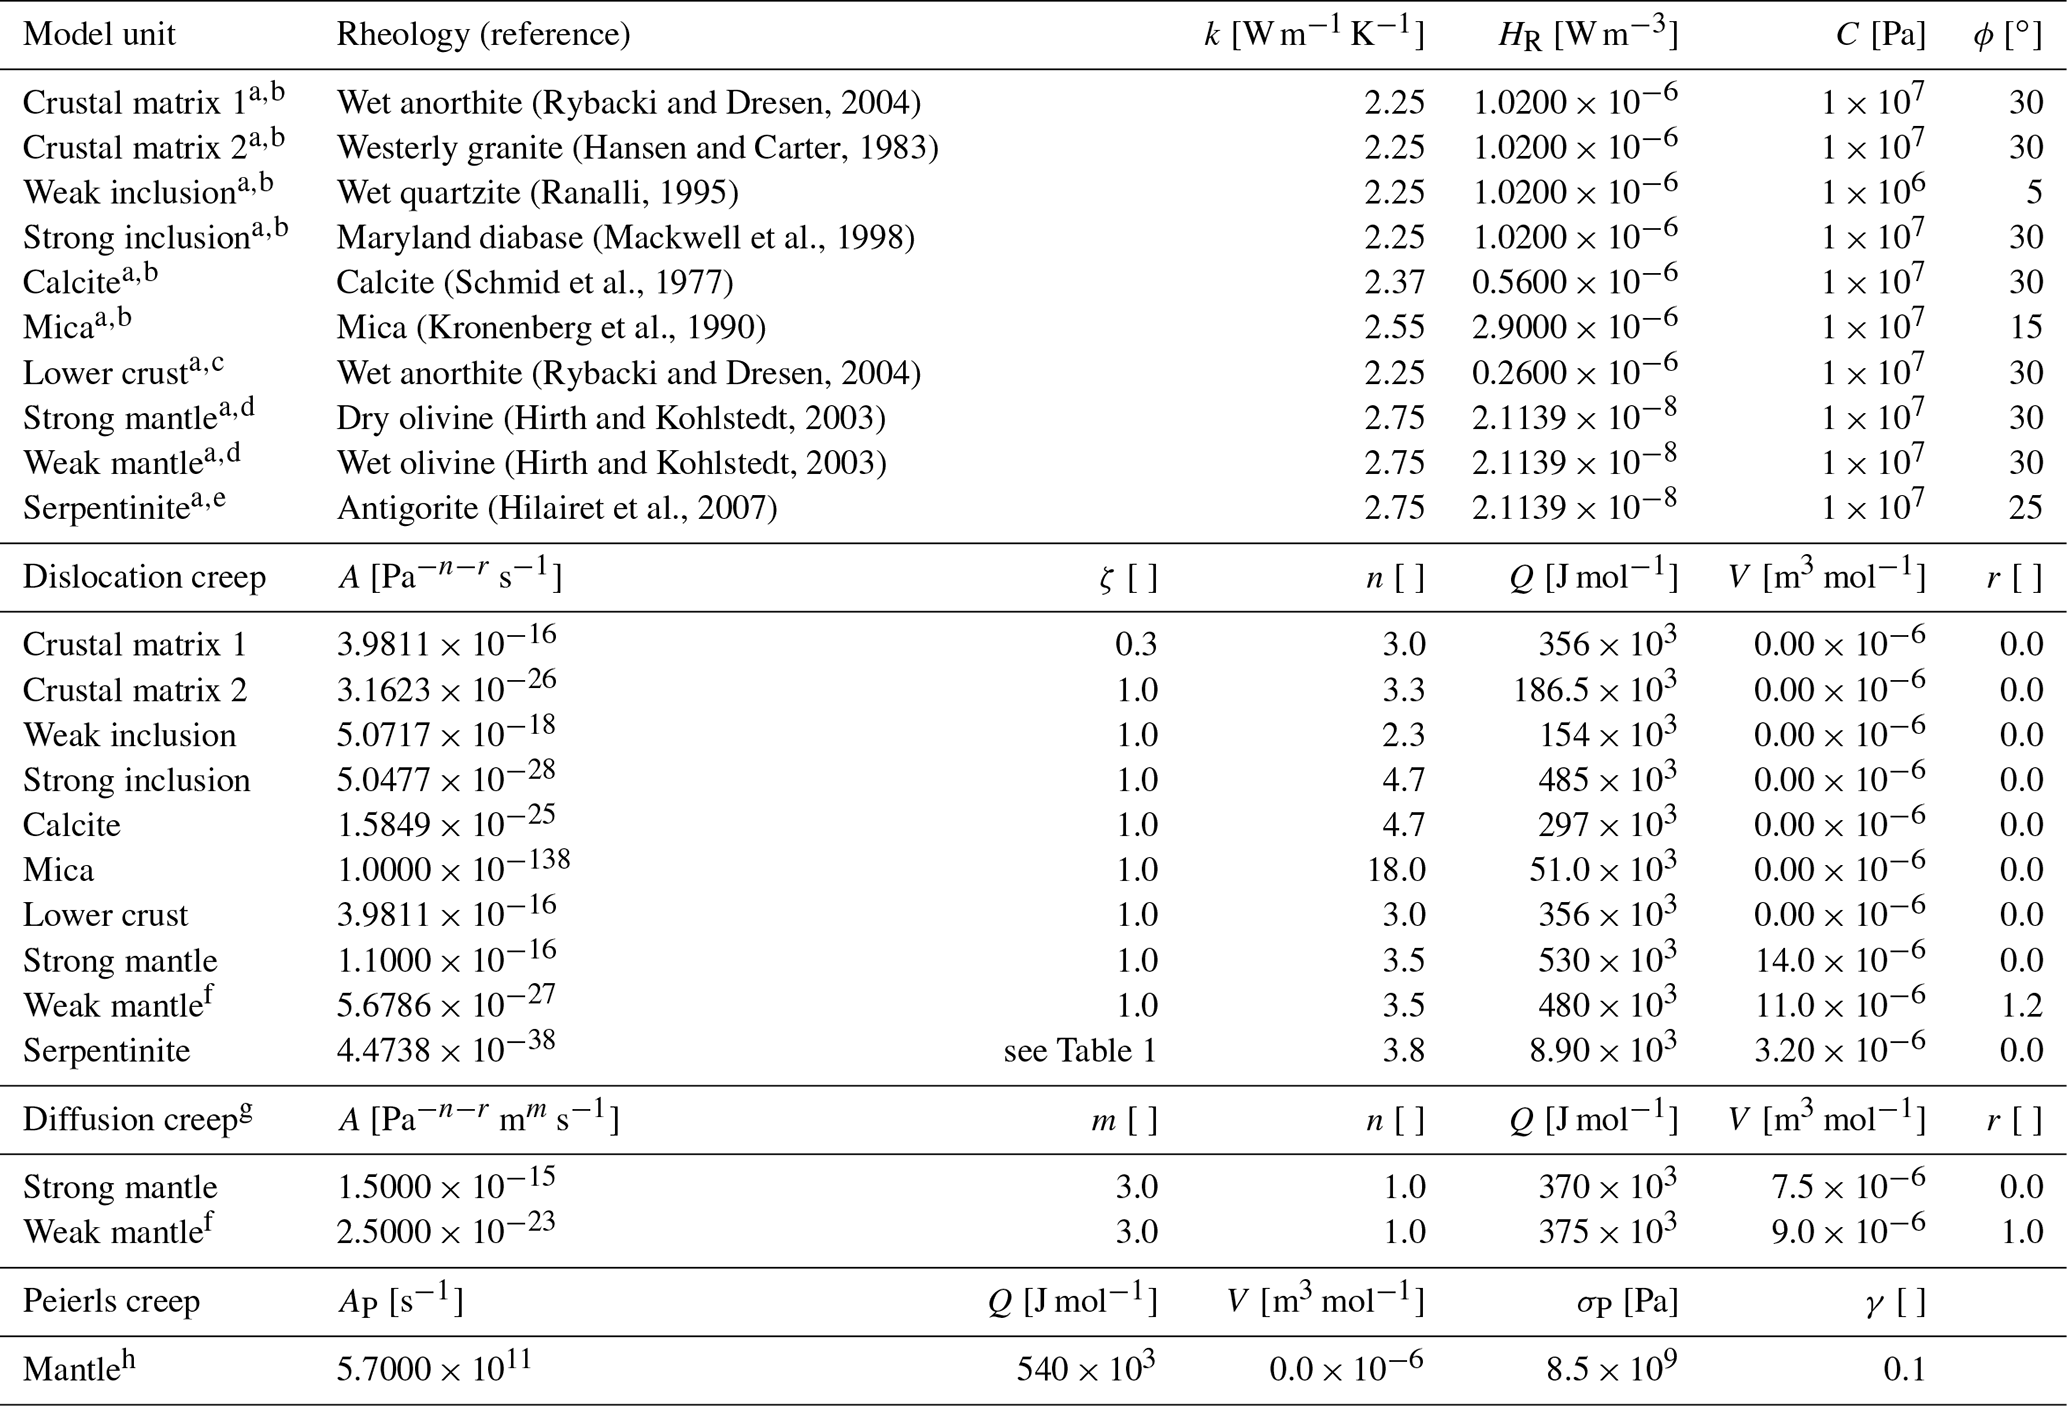
Constant parameters: a a heat capacity cP=1050 [J kg−1 K−1] is employed in Eq. (A20) for all phases. A constant shear modulus [Pa] is used in Eq. (A4). e A constant shear modulus [Pa] is used in Eq. (A4). b ρ0=2800 [kg m−3], c ρ0=2900 [kg m−3] and eρ0=2585 [kg m−3], b,c [K−1] and e [K−1] and [Pa−1] are used for density calculations using a simplified equation of state according to Eq. (A4). f A water fugacity f [Pa] is used in equation Eq. (A8). For all other phases f [Pa]. g A constant grain size [m] is used in Eq. (A9). h Reference: Goetze and Evans (1979) regularized by Kameyama et al. (1999). These parameters are used for both strong and weak mantle rheology.
Furthermore, we perform an iteration cycle locally on each grid cell until Eq. (A7) is satisfied (e.g. Popov and Sobolev, 2008). The viscosity for the dislocation and Peierls creep flow laws is a function of the second invariant of the respective strain rate components, and the dislocation creep viscosity takes the following form:
where the ratio in front of the prefactor ζ results from tensor conversion of the experimentally derived flow law (e.g. Schmalholz and Fletcher, 2011). A, n, Q, V, and r are material parameters. The diffusion creep viscosity is calculated as
where d is grain size and m is a grain size exponent. Effective Peierls viscosity is calculated based on the experimentally derived flow law by Goetze and Evans (1979) expressed in the regularized form of Kameyama et al. (1999) as
where s is an effective stress exponent:
in Eq. (A10) is
where AP, γ and σP are flow law parameters. Brittle-plastic material failure is controlled by the Drucker–Prager yield function
which depends on the internal friction angle, ϕ, and the cohesion, C. In case of failure (F≥0), the plastic viscosity at the yield stress is calculated as
and . In Eq. (A4), the effective viscosity is either the quasi-harmonic average of the visco-elastic contributions
or is equal to the viscosity ηpla calculated according to Eq. (A14). Rigid body rotation is computed analytically:
where ⊺ denotes matrix transposition, R is the rotation matrix, θ is the rotation angle and ωij denotes vorticity tensor components. Heat transfer is included into the model by expressing the energy balance equation with respect to temperature as
where cP is the specific heat capacity, is the material derivative, k is thermal conductivity, HA=Tαvzgρ includes contributions from adiabatic processes assuming lithostatic pressure conditions, includes contributions from dissipative processes and HR includes heat production from radiogenic elements.
The semi-major axis is a=30 km and the semi-minor axis is b=2.5 km for all elliptical inclusions. The inclusions are emplaced between −400 km < x<400 km at two different vertical levels. The x coordinate of the first elliptical inclusion's centre (superscript C = crust, L = lithosphere) at each vertical level is calculated as
where RS is a random starting x coordinate, RE is a random ending x coordinate, d=400 km, c=350 km, is a random amplitude, f=300 km and h=250 km. The starting coordinate of the next horizontally emplaced inclusion is then calculated as
where Rdx is a random spacing ensuring that the ellipses do not overlap each other. The z coordinate of the elliptical inclusion's centre at the vertical level m is calculated as
where zMoho=33 km is the initial depth of the Moho. Similarly, the central coordinates of the elliptical inclusions in the mantle are calculated using the following parameters for the first level:
and for the second level:
where zLith=60 km. Finally, all markers within the circumference of the elliptical inclusion are assigned with a random phase, i.e. either mechanically weak or strong material, according to the condition
where xM and zM are the horizontal and vertical coordinate of the marker, respectively. All random numbers used here are seeded at a value of 197 using the C function srand (Intel compiler version 13.1.3). Choosing the above-mentioned values yields an increased number of weak elliptical inclusions in the centre of the domain. This yields localization of deformation without an additional perturbation of the marker field in the centre of the domain.
In this study we use as a representative value for the horizontal driving force per unit length causing the far-field convergence. This horizontal driving force calculation is correct if the smallest principal stress is vertical and corresponds to the lithostatic pressure and if the maximal principal stress is horizontal (e.g. Schmalholz et al., 2014, 2019), which is the case around the lateral model boundaries where FD is calculated. To calculate , first the vertical integral of τII(x,y) is calculated at the different horizontal positions of the numerical grid:
The values of are then averaged horizontally inside two regions of 100 km width located at the two lateral model sides. This horizontally averaged, vertically integrated stress is termed . St(x) is the height of the topography at each horizontal grid point and km is the bottom of the domain. The reader is referred to Candioti et al. (2020) for further detail.
The buoyancy force per unit length is calculated with the difference between densities of all subducted material except for mantle (i.e. upper and lower crust, serpentinite, and sediments) and a representative mantle density of 3350 kg m−3. This mantle density is representative for mantle rocks down to depths of ≈150 km (Candioti et al., 2020), which is, in our models, a representative maximal depth of subduction of non-mantle material. The buoyancy force is calculated by
where Δρ is the above-mentioned density difference, which is integrated over the area Ω occupied by non-mantle material subducted below km. To obtain a reasonable value for the upward-directed buoyancy force of subducted material, which is not isostatically balanced by high topography, we subtract the force contributing to the build-up of topography. As an approximation for this topographic contribution, the density of material lifted above z=1.5 km is integrated over its area and then subtracted from FB. As a measure for the relative importance of buoyancy and shear forces in orogen dynamics, we here define which is a dimensionless number comparable to the Argand number (England and McKenzie, 1982).
The data presented in this study are available on request from Lorenzo G. Candioti.
We provide videos showing the entire evolution of the numerical simulation REF (https://doi.org/10.5446/50527, Candioti, 2020a) and the subduction and collision stage of the numerical simulation GC1 (https://doi.org/10.5446/50528, Candioti, 2020b).
LGC configured and performed the numerical simulations, interpreted the numerical results, generated the figures and wrote the paper. SMS designed the scientific and numerical study, helped in interpreting the results and designing the figures, contributed to writing the paper, and acquired the funding for this study. TD developed the applied numerical algorithm and helped in configuring the model and the interpretation of the results. EM performed the phase equilibria calculations and helped interpreting the results.
The authors declare that they have no conflict of interest.
Publisher’s note: Copernicus Publications remains neutral with regard to jurisdictional claims in published maps and institutional affiliations.
This article is part of the special issue “New insights into the tectonic evolution of the Alps and the adjacent orogens”. It is not associated with a conference.
The authors gratefully thank Jianfeng Yang and Jonas Ruh for very constructive comments during the review process.
This research has been supported by the Schweizerischer Nationalfonds zur Förderung der Wissenschaftlichen Forschung (grant no. 200020 163169).
This paper was edited by Mirijam Vrabec and reviewed by Jonas B. Ruh and Jianfeng Yang.
Austin, N. J. and Evans, B.: Paleowattmeters: A scaling relation for dynamically recrystallized grain size, Geology, 35, 343–346, 2007. a
Austrheim, H.: Eclogitization of lower crustal granulites by fluid migration through shear zones, Earth Planet. Sc. Lett., 81, 221–232, 1987. a
Auzemery, A., Willingshofer, E., Yamato, P., Duretz, T., and Sokoutis, D.: Strain localization mechanisms for subduction initiation at passive margins, Global Planet. Change, 195, 103323, https://doi.org/10.1016/j.gloplacha.2020.103323, 2020. a
Barnhoorn, A., Drury, M. R., and van Roermund, H. L.: Evidence for low viscosity garnet-rich layers in the upper mantle, Earth Planet. Sc. Lett., 289, 54–67, 2010. a
Bauville, A. and Schmalholz, S. M.: Transition from thin-to thick-skinned tectonics and consequences for nappe formation: Numerical simulations and applications to the Helvetic nappe system, Switzerland, Tectonophysics, 665, 101–117, 2015. a
Beaumont, C., Ellis, S., Hamilton, J., and Fullsack, P.: Mechanical model for subduction-collision tectonics of Alpine-type compressional orogens, Geology, 24, 675–678, 1996. a, b
Beaumont, C., Jamieson, R., and Nguyen, M.: Models of large, hot orogens containing a collage of reworked and accreted terranes, Can. J. Earth Sci., 47, 485–515, 2010. a, b
Behr, W. M. and Becker, T. W.: Sediment control on subduction plate speeds, Earth Planet. Sc. Lett., 502, 166–173, 2018. a
Berger, A. and Bousquet, R.: Subduction-related metamorphism in the Alps: review of isotopic ages based on petrology and their geodynamic consequences, Geol. Soc. Lond. Spec. Publ., 298, 117–144, 2008. a
Bessat, A., Duretz, T., Hetényi, G., Pilet, S., and Schmalholz, S. M.: Stress and deformation mechanisms at a subduction zone: insights from 2D thermo-mechanical numerical modelling, Geophys. J. Int., 221, 1605–1625, https://doi.org/10.1093/gji/ggaa092, 2020. a
Borderie, S., Graveleau, F., Witt, C., and Vendeville, B. C.: Impact of an interbedded viscous décollement on the structural and kinematic coupling in fold-and-thrust belts: Insights from analogue modeling, Tectonophysics, 722, 118–137, 2018. a
Bürgmann, R. and Dresen, G.: Rheology of the lower crust and upper mantle: Evidence from rock mechanics, geodesy, and field observations, Annu. Rev. Earth Pl. Sc., 36, 531–567, https://doi.org/10.1146/annurev.earth.36.031207.124326, 2008. a
Burov, E. and Watts, A.: The long-term strength of continental lithosphere: “jelly sandwich” or “crème brûlée”?, GSA Today, 16, 4, https://doi.org/10.1130/1052-5173(2006)016<4:tltSOc>2.0.cO;2, 2006. a
Burov, E., François, T., Agard, P., Le Pourhiet, L., Meyer, B., Tirel, C., Lebedev, S., Yamato, P., and Brun, J.-P.: Rheological and geodynamic controls on the mechanisms of subduction and HP/UHP exhumation of crustal rocks during continental collision: Insights from numerical models, Tectonophysics, 631, 212–250, 2014. a
Butler, J. P., Beaumont, C., and Jamieson, R. A.: The Alps 2: Controls on crustal subduction and (ultra) high-pressure rock exhumation in Alpine-type orogens, J. Geophys. Res.-Sol. Ea., 119, 5987–6022, 2014. a, b, c
Butler, R. W.: Area balancing as a test of models for the deep structure of mountain belts, with specific reference to the Alps, J. Struct. Geol., 52, 2–16, 2013. a
Byerlee, J.: Friction of rocks, in: Rock friction and earthquake prediction, 615–626, Springer, 1978. a
Candioti, L. G.: Evolution of numerical simulation REF, TIB, https://doi.org/10.5446/50527, 2020a. a, b
Candioti, L. G.: Evolution of numerical simulation GC1, TIB, https://doi.org/10.5446/50528, 2020b. a, b, c, d, e
Candioti, L. G., Schmalholz, S. M., and Duretz, T.: Impact of upper mantle convection on lithosphere hyperextension and subsequent horizontally forced subduction initiation, Solid Earth, 11, 2327–2357, https://doi.org/10.5194/se-11-2327-2020, 2020. a, b, c, d, e, f, g, h, i, j, k, l
Chapple, W. M.: Mechanics of thin-skinned fold-and-thrust belts, Geol. Soc. Am. Bull., 89, 1189–1198, 1978. a
Chenin, P., Manatschal, G., Picazo, S., Müntener, O., Karner, G., Johnson, C., and Ulrich, M.: Influence of the architecture of magma-poor hyperextended rifted margins on orogens produced by the closure of narrow versus wide oceans, Geosphere, 13, 559–576, 2017. a
Chenin, P., Picazo, S., Jammes, S., Manatschal, G., Müntener, O., and Karner, G.: Potential role of lithospheric mantle composition in the Wilson cycle: a North Atlantic perspective, Geol. Soc. Lond. Spec. Publ., 470, 157–172, 2019. a
Chernak, L. J. and Hirth, G.: Deformation of antigorite serpentinite at high temperature and pressure, Earth Planet. Sc. Lett., 296, 23–33, 2010. a
Chopin, C.: Coesite and pure pyrope in high-grade blueschists of the Western Alps: a first record and some consequences, Contrib. Mineral. Petr., 86, 107–118, 1984. a
Connolly, J. A.: Computation of phase equilibria by linear programming: a tool for geodynamic modeling and its application to subduction zone decarbonation, Earth Planet. Sc. Lett., 236, 524–541, 2005. a
Crameri, F.: Geodynamic diagnostics, scientific visualisation and StagLab 3.0, Geosci. Model Dev., 11, 2541–2562, https://doi.org/10.5194/gmd-11-2541-2018, 2018. a
Crameri, F., Magni, V., Domeier, M., Shephard, G. E., Chotalia, K., Cooper, G., Eakin, C. M., Grima, A. G., Gürer, D., Király, Á., Mulyukova, E., Peters, K., Robert, B., and Thielmann, M.: A transdisciplinary and community-driven database to unravel subduction zone initiation, Nat. Commun., 11, 1–14, 2020. a
Currie, C. A., Beaumont, C., and Huismans, R. S.: The fate of subducted sediments: A case for backarc intrusion and underplating, Geology, 35, 1111–1114, 2007. a
Dahlen, F.: Critical taper model of fold-and-thrust belts and accretionary wedges, Annu. Rev. Earth Planet. Sc., 18, 55–99, 1990. a
Dahlen, F., Suppe, J., and Davis, D.: Mechanics of fold-and-thrust belts and accretionary wedges: Cohesive Coulomb theory, J. Geophys. Res.-Sol. Ea., 89, 10087–10101, 1984. a
Dal Zilio, L., Kissling, E., Gerya, T., and van Dinther, Y.: Slab Rollback Orogeny model: A test of concept, Geophys. Res. Lett., 47, e2020GL089917, https://doi.org/10.1029/2020GL089917, 2020a. a, b, c
Dal Zilio, L., Ruh, J., and Avouac, J.-P.: Structural evolution of orogenic wedges: interplay between erosion and weak décollements, Tectonics, 39, e2020TC006210, https://doi.org/10.1029/2020TC006210, 2020b. a, b, c, d, e, f
Dannberg, J., Eilon, Z., Faul, U., Gassmöller, R., Moulik, P., and Myhill, R.: The importance of grain size to mantle dynamics and seismological observations, Geochem. Geophy. Geosy., 18, 3034–3061, 2017. a
David, E. C., Brantut, N., Hansen, L. N., and Mitchell, T. M.: Absence of stress-induced anisotropy during brittle deformation in antigorite serpentinite, J. Geophys. Res.-Sol. Ea., 123, 10616–10644, 2018. a
Duretz, T. and Gerya, T.: Slab detachment during continental collision: Influence of crustal rheology and interaction with lithospheric delamination, Tectonophysics, 602, 124–140, 2013. a
Duretz, T., Schmalholz, S., and Gerya, T.: Dynamics of slab detachment, Geochem. Geophy. Geosy., 13, Q03020, https://doi.org/10.1029/2011GC004024, 2012. a
Duretz, T., May, D. A., and Yamato, P.: A free surface capturing discretization for the staggered grid finite difference scheme, Geophys. J. Int., 204, 1518–1530, 2016a. a
Duretz, T., Petri, B., Mohn, G., Schmalholz, S., Schenker, F., and Müntener, O.: The importance of structural softening for the evolution and architecture of passive margins, Sci. Rep.-UK, 6, 38704, https://doi.org/10.1038/srep38704, 2016b. a, b
England, P. and McKenzie, D.: A thin viscous sheet model for continental deformation, Geophys. J. Int., 70, 295–321, 1982. a
Erdős, Z., Huismans, R. S., van der Beek, P., and Thieulot, C.: Extensional inheritance and surface processes as controlling factors of mountain belt structure, J. Geophys. Res.-Sol. Ea., 119, 9042–9061, 2014. a
Erdős, Z., Huismans, R. S., and van der Beek, P.: Control of increased sedimentation on orogenic fold-and-thrust belt structure – insights into the evolution of the Western Alps, Solid Earth, 10, 391–404, https://doi.org/10.5194/se-10-391-2019, 2019. a
Forsyth, D. and Uyeda, S.: On the relative importance of the driving forces of plate motion, Geophys. J. Int., 43, 163–200, 1975. a
Gerya, T.: Introduction to numerical geodynamic modelling, Cambridge University Press, 2019. a
Gerya, T. V. and Yuen, D. A.: Characteristics-based marker-in-cell method with conservative finite-differences schemes for modeling geological flows with strongly variable transport properties, Phys. Earth Planet. In., 140, 293–318, 2003. a
Gerya, T. V., Stöckhert, B., and Perchuk, A. L.: Exhumation of high-pressure metamorphic rocks in a subduction channel: A numerical simulation, Tectonics, 21, 6–1, 2002. a
Gerya, T. V., Perchuk, L. L., Maresch, W. V., and Willner, A. P.: Inherent gravitational instability of hot continental crust: Implications for doming and diapirism in granulite facies terrains, SPECIAL PAPERS-GEOLOGICAL SOCIETY OF AMERICA, 97–116, 2004. a
Goetze, C. and Evans, B.: Stress and temperature in the bending lithosphere as constrained by experimental rock mechanics, Geophys. J. Int., 59, 463–478, 1979. a, b, c
Graveleau, F., Malavieille, J., and Dominguez, S.: Experimental modelling of orogenic wedges: A review, Tectonophysics, 538, 1–66, 2012. a
Grool, A. R., Huismans, R. S., and Ford, M.: Salt décollement and rift inheritance controls on crustal deformation in orogens, Terra Nova, 31, 562–568, 2019. a
Guillot, S., Schwartz, S., Reynard, B., Agard, P., and Prigent, C.: Tectonic significance of serpentinites, Tectonophysics, 646, 1–19, 2015. a
Gutscher, M.-A., Kukowski, N., Malavieille, J., and Lallemand, S.: Episodic imbricate thrusting and underthrusting: Analog experiments and mechanical analysis applied to the Alaskan accretionary wedge, J. Geophys. Res.-Sol. Ea., 103, 10161–10176, 1998. a
Hacker, B. R., Peacock, S. M., Abers, G. A., and Holloway, S. D.: Subduction factory 2. Are intermediate-depth earthquakes in subducting slabs linked to metamorphic dehydration reactions?, J. Geophys. Res.-Sol. Ea., 108, 2030, https://doi.org/10.1029/2001JB001129, 2003. a
Handy, M. R., Schmid, S. M., Bousquet, R., Kissling, E., and Bernoulli, D.: Reconciling plate-tectonic reconstructions of Alpine Tethys with the geological–geophysical record of spreading and subduction in the Alps, Earth-Sci. Rev., 102, 121–158, 2010. a
Hansen, F. and Carter, N.: Semibrittle creep of dry and wet Westerly granite at 1000 MPa, ARMA-83-0429, in: 24th U.S. Symposium on Rock Mechanics (USRMS), College Station, Texas, 1983. a, b
Hansen, L. N., David, E. C., Brantut, N., and Wallis, D.: Insight into the microphysics of antigorite deformation from spherical nanoindentation, Philos. T. R. Soc. A, 378, 20190197, https://doi.org/10.1098/rsta.2019.0197, 2020. a
Henry, P., Azambre, B., Montigny, R., Rossy, M., and Stevenson, R.: Late mantle evolution of the Pyrenean sub-continental lithospheric mantle in the light of new 40Ar–39Ar and Sm–Nd ages on pyroxenites and peridotites (Pyrenees, France), Tectonophysics, 296, 103–123, 1998. a
Hess, H. H.: Serpentines, orogeny, and epeirogeny, Geol. Soc. Am. Spec. Paper, 62, 391–407, 1955. a
Hetényi, G., Cattin, R., Brunet, F., Bollinger, L., Vergne, J., Nábělek, J. L., and Diament, M.: Density distribution of the India plate beneath the Tibetan plateau: Geophysical and petrological constraints on the kinetics of lower-crustal eclogitization, Earth Planet. Sc. Lett., 264, 226–244, 2007. a
Hilairet, N., Reynard, B., Wang, Y., Daniel, I., Merkel, S., Nishiyama, N., and Petitgirard, S.: High-pressure creep of serpentine, interseismic deformation, and initiation of subduction, Science, 318, 1910–1913, 2007. a, b, c, d
Hirauchi, K.-I., Katayama, I., and Kouketsu, Y.: Semi-brittle deformation of antigorite serpentinite under forearc mantle wedge conditions, J. Struct. Geol., 140, 104151, https://doi.org/10.1016/j.jsg.2020.104151, 2020. a
Hirth, G. and Guillot, S.: Rheology and tectonic significance of serpentinite, Elements, 9, 107–113, 2013. a, b
Hirth, G. and Kohlstedt, D.: Rheology of the upper mantle and the mantle wedge: A view from the experimentalists, Geophysical Monograph-American Geophysical Union, 138, 83–106, 2003. a, b
Holland, T. and Powell, R.: An internally consistent thermodynamic data set for phases of petrological interest, J. Metamorph. Geol., 16, 309–343, 1998. a
Idrissi, H., Bollinger, C., Boioli, F., Schryvers, D., and Cordier, P.: Low-temperature plasticity of olivine revisited with in situ TEM nanomechanical testing, Sci. Adv., 2, e1501671, https://doi.org/10.1126/sciadv.1501671, 2016. a
Idrissi, H., Samaee, V., Lumbeeck, G., van der Werf, T., Pardoen, T., Schryvers, D., and Cordier, P.: In situ quantitative tensile testing of antigorite in a transmission electron microscope, Journal of Geophysical Research: Solid Earth, 125, e2019JB018 383, 2020. a, b
Jammes, S. and Huismans, R. S.: Structural styles of mountain building: Controls of lithospheric rheologic stratification and extensional inheritance, J. Geophys. Res.-Sol. Ea., 117, B10403, https://doi.org/10.1029/2012JB009376, 2012. a, b
Jammes, S., Manatschal, G., Lavier, L., and Masini, E.: Tectonosedimentary evolution related to extreme crustal thinning ahead of a propagating ocean: Example of the western Pyrenees, Tectonics, 28, TC4012, https://doi.org/10.1029/2008TC002406, 2009. a, b
Jammes, S., Huismans, R. S., and Muñoz, J. A.: Lateral variation in structural style of mountain building: controls of rheological and rift inheritance, Terra Nova, 26, 201–207, 2014. a
Jaquet, Y. and Schmalholz, S. M.: Spontaneous ductile crustal shear zone formation by thermal softening and related stress, temperature and strain rate evolution, Tectonophysics, 746, 384–397, 2018. a
Jaquet, Y., Duretz, T., Grujic, D., Masson, H., and Schmalholz, S. M.: Formation of orogenic wedges and crustal shear zones by thermal softening, associated topographic evolution and application to natural orogens, Tectonophysics, 746, 512–529, 2018. a
Kameyama, M., Yuen, D. A., and Karato, S.-I.: Thermal-mechanical effects of low-temperature plasticity (the Peierls mechanism) on the deformation of a viscoelastic shear zone, Earth Planet. Sc. Lett., 168, 159–172, 1999. a, b
Kaus, B. J., Connolly, J. A., Podladchikov, Y. Y., and Schmalholz, S. M.: Effect of mineral phase transitions on sedimentary basin subsidence and uplift, Earth Planet. Sc. Lett., 233, 213–228, 2005. a, b
Kiss, D., Candioti, L. G., Duretz, T., and Schmalholz, S. M.: Thermal softening induced subduction initiation at a passive margin, Geophys. J. Int., 220, 2068–2073, 2020. a, b
Kissling, E.: Deep structure of the Alps – what do we really know?, Phys. Earth Planet. In., 79, 87–112, 1993. a
Kissling, E. and Schlunegger, F.: Rollback orogeny model for the evolution of the Swiss Alps, Tectonics, 37, 1097–1115, 2018. a
Kronenberg, A. K., Kirby, S. H., and Pinkston, J.: Basal slip and mechanical anisotropy of biotite, J. Geophys. Res.-Sol. Ea., 95, 19257–19278, 1990. a
Lamb, S. and Davis, P.: Cenozoic climate change as a possible cause for the rise of the Andes, Nature, 425, 792–797, 2003. a
Lardeaux, J.-M.: Deciphering orogeny: a metamorphic perspective. Examples from European Alpine and Variscan belts: Part I: Alpine metamorphism in the western Alps. A review, B. Soc. Géol. Fr., 185, 93–114, 2014. a
Le Breton, E., Brune, S., Ustaszewski, K., Zahirovic, S., Seton, M., and Müller, R. D.: Kinematics and extent of the Piemont–Liguria Basin – implications for subduction processes in the Alps, Solid Earth, 12, 885–913, https://doi.org/10.5194/se-12-885-2021, 2021. a, b
Li, Z. and Gerya, T. V.: Polyphase formation and exhumation of high-to ultrahigh-pressure rocks in continental subduction zone: Numerical modeling and application to the Sulu ultrahigh-pressure terrane in eastern China, J. Geophys. Res.-Sol. Ea., 114, B09406, https://doi.org/10.1029/2008JB005935, 2009. a
Mackwell, S., Zimmerman, M., and Kohlstedt, D.: High-temperature deformation of dry diabase with application to tectonics on Venus, J. Geophys. Res.-Sol. Ea., 103, 975–984, 1998. a
Malavieille, J.: Impact of erosion, sedimentation, and structural heritage on the structure and kinematics of orogenic wedges: Analog models and case studies, GSA Today, 20, 4–10, 2010. a, b, c, d, e
Malinverno, A. and Ryan, W. B.: Extension in the Tyrrhenian Sea and shortening in the Apennines as result of arc migration driven by sinking of the lithosphere, Tectonics, 5, 227–245, 1986. a
Malusà, M. G., Faccenna, C., Baldwin, S. L., Fitzgerald, P. G., Rossetti, F., Balestrieri, M. L., Danišík, M., Ellero, A., Ottria, G., and Piromallo, C.: Contrasting styles of (U) HP rock exhumation along the Cenozoic Adria-Europe plate boundary (Western Alps, Calabria, Corsica), Geochem. Geophy. Geosy., 16, 1786–1824, 2015. a, b, c
Malvoisin, B., Austrheim, H., Hetényi, G., Reynes, J., Hermann, J., Baumgartner, L. P., and Podladchikov, Y. Y.: Sustainable densification of the deep crust, Geology, 48, 673–677, 2020. a
Manatschal, G. and Müntener, O.: A type sequence across an ancient magma-poor ocean–continent transition: the example of the western Alpine Tethys ophiolites, Tectonophysics, 473, 4–19, 2009. a
Mancktelow, N. S. and Pennacchioni, G.: Why calcite can be stronger than quartz, J. Geophys. Res.-Sol. Ea., 115, B01402, https://doi.org/10.1029/2009JB006526, 2010. a
Manzotti, P., Ballevre, M., Zucali, M., Robyr, M., and Engi, M.: The tectonometamorphic evolution of the Sesia–Dent Blanche nappes (internal Western Alps): review and synthesis, Swiss J. Geosci., 107, 309–336, 2014. a
McCarthy, A., Chelle-Michou, C., Müntener, O., Arculus, R., and Blundy, J.: Subduction initiation without magmatism: The case of the missing Alpine magmatic arc, Geology, 46, 1059–1062, 2018. a
McCarthy, A., Tugend, J., Mohn, G., Candioti, L., Chelle-Michou, C., Arculus, R., Schmalholz, S. M., and Müntener, O.: A case of Ampferer-type subduction and consequences for the Alps and the Pyrenees, Am. J. Sci., 320, 313–372, 2020. a, b, c, d, e
Mohn, G., Manatschal, G., Beltrando, M., and Haupert, I.: The role of rift-inherited hyper-extension in Alpine-type orogens, Terra Nova, 26, 347–353, 2014. a
Muñoz, J. A.: Evolution of a continental collision belt: ECORS-Pyrenees crustal balanced cross-section, in: Thrust tectonics, 235–246, Springer, 1992. a, b
Nicolas, A., Hirn, A., Nicolich, R., and Polino, R.: Lithospheric wedging in the western Alps inferred from the ECORS-CROP traverse, Geology, 18, 587–590, 1990. a, b
Pelletier, L., Müntener, O., Kalt, A., Vennemann, T. W., and Belgya, T.: Emplacement of ultramafic rocks into the continental crust monitored by light and other trace elements: An example from the Geisspfad body (Swiss-Italian Alps), Chem. Geol., 255, 143–159, 2008. a
Petri, B., Duretz, T., Mohn, G., Schmalholz, S. M., Karner, G. D., and Müntener, O.: Thinning mechanisms of heterogeneous continental lithosphere, Earth Planet. Sc. Lett., 512, 147–162, 2019. a, b, c
Platt, J.: Dynamics of orogenic wedges and the uplift of high-pressure metamorphic rocks, Geol. Soc. Am. Bull., 97, 1037–1053, 1986. a, b, c, d, e
Popov, A. and Sobolev, S.: SLIM3D: A tool for three-dimensional thermomechanical modeling of lithospheric deformation with elasto-visco-plastic rheology, Phys. Earth Planet. In., 171, 55–75, 2008. a
Raimbourg, H., Jolivet, L., and Leroy, Y.: Consequences of progressive eclogitization on crustal exhumation, a mechanical study, Geophys. J. Int., 168, 379–401, 2007. a
Raleigh, C. B. and Paterson, M.: Experimental deformation of serpentinite and its tectonic implications, J. Geophys. Res., 70, 3965–3985, 1965. a
Ramberg, H.: Gravity, deformation and the earth's crust: in theory, experiments and geological application, Academic press, 1981. a
Ranalli, G.: Rheology of the Earth, Springer Science & Business Media, 1995. a
Rubie, D. C.: The catalysis of mineral reactions by water and restrictions on the presence of aqueous fluid during metamorphism, Mineral. Mag., 50, 399–415, 1986. a
Ruh, J. B., Kaus, B. J., and Burg, J.-P.: Numerical investigation of deformation mechanics in fold-and-thrust belts: Influence of rheology of single and multiple décollements, Tectonics, 31, TC3005, https://doi.org/10.1029/2011TC003047, 2012. a
Rummel, L., Baumann, T. S., and Kaus, B. J.: An autonomous petrological database for geodynamic simulations of magmatic systems, Geophys. J. Int., 223, 1820–1836, 2020. a
Rybacki, E. and Dresen, G.: Deformation mechanism maps for feldspar rocks, Tectonophysics, 382, 173–187, 2004. a, b, c
Schenker, F. L., Schmalholz, S. M., Moulas, E., Pleuger, J., Baumgartner, L. P., Podladchikov, Y., Vrijmoed, J., Buchs, N., and Müntener, O.: Current challenges for explaining (ultra) high-pressure tectonism in the Pennine domain of the Central and Western Alps, J. Metamorph. Geol., 33, 869–886, 2015. a
Schierjott, J., Rozel, A., and Tackley, P.: On the self-regulating effect of grain size evolution in mantle convection models: application to thermochemical piles, Solid Earth, 11, 959–982, https://doi.org/10.5194/se-11-959-2020, 2020. a
Schmalholz, S., Podladchikov, Y., and Schmid, D.: A spectral/finite difference method for simulating large deformations of heterogeneous, viscoelastic materials, Geophys. J. Int., 145, 199–208, 2001. a
Schmalholz, S. M. and Fletcher, R. C.: The exponential flow law applied to necking and folding of a ductile layer, Geophys. J. Int., 184, 83–89, 2011. a
Schmalholz, S. M., Medvedev, S., Lechmann, S. M., and Podladchikov, Y.: Relationship between tectonic overpressure, deviatoric stress, driving force, isostasy and gravitational potential energy, Geophys. J. Int., 197, 680–696, 2014. a
Schmalholz, S. M., Duretz, T., Hetényi, G., and Medvedev, S.: Distribution and magnitude of stress due to lateral variation of gravitational potential energy between Indian lowland and Tibetan plateau, Geophys. J. Int., 216, 1313–1333, 2019. a
Schmid, S., Boland, J., and Paterson, M.: Superplastic flow in finegrained limestone, Tectonophysics, 43, 257–291, 1977. a
Schmid, S. M., Kissling, E., Diehl, T., van Hinsbergen, D. J., and Molli, G.: Ivrea mantle wedge, arc of the Western Alps, and kinematic evolution of the Alps–Apennines orogenic system, Swiss J. Geosci., 110, 581–612, 2017. a, b, c, d, e, f, g
Shreve, R. L. and Cloos, M.: Dynamics of sediment subduction, melange formation, and prism accretion, J. Geophys. Res.-Sol. Ea., 91, 10229–10245, 1986. a
Simpson, G. D.: Mechanical modelling of folding versus faulting in brittle–ductile wedges, J. Struct. Geol., 31, 369–381, 2009. a
Sizova, E., Gerya, T., and Brown, M.: Contrasting styles of Phanerozoic and Precambrian continental collision, Gondwana Res., 25, 522–545, 2014. a
Spitz, R., Bauville, A., Epard, J.-L., Kaus, B. J. P., Popov, A. A., and Schmalholz, S. M.: Control of 3-D tectonic inheritance on fold-and-thrust belts: insights from 3-D numerical models and application to the Helvetic nappe system, Solid Earth, 11, 999–1026, https://doi.org/10.5194/se-11-999-2020, 2020. a
Stern, R. J.: Subduction initiation: spontaneous and induced, Earth Planet. Sc. Lett., 226, 275–292, 2004. a
Stern, R. J. and Gerya, T.: Subduction initiation in nature and models: A review, Tectonophysics, 746, 173–198, 2018. a
Stixrude, L. and Lithgow-Bertelloni, C.: Thermodynamics of mantle minerals-II. Phase equilibria, Geophys. J. Int., 184, 1180–1213, 2011. a
Sutra, E., Manatschal, G., Mohn, G., and Unternehr, P.: Quantification and restoration of extensional deformation along the Western Iberia and Newfoundland rifted margins, Geochem. Geophy. Geosy., 14, 2575–2597, 2013. a
Teixell, A., Labaume, P., Ayarza, P., Espurt, N., de Saint Blanquat, M., and Lagabrielle, Y.: Crustal structure and evolution of the Pyrenean-Cantabrian belt: A review and new interpretations from recent concepts and data, Tectonophysics, 724, 146–170, 2018. a, b, c, d
Thielmann, M. and Kaus, B. J.: Shear heating induced lithospheric-scale localization: Does it result in subduction?, Earth Planet. Sc. Lett., 359, 1–13, 2012. a
Toussaint, G., Burov, E., and Jolivet, L.: Continental plate collision: Unstable vs. stable slab dynamics, Geology, 32, 33–36, 2004. a
Turcotte, D. and Schubert, G.: Geodynamics, Cambridge University Press, 2014. a
van Hunen, J., van den Berg, A. P., and Vlaar, N. J.: Latent heat effects of the major mantle phase transitions on low-angle subduction, Earth Planet. Sc. Lett., 190, 125–135, 2001. a
Vanderhaeghe, O., Medvedev, S., Fullsack, P., Beaumont, C., and Jamieson, R. A.: Evolution of orogenic wedges and continental plateaux: insights from crustal thermal–mechanical models overlying subducting mantle lithosphere, Geophys. J. Int., 153, 27–51, 2003. a, b, c
Warren, C. J., Beaumont, C., and Jamieson, R. A.: Formation and exhumation of ultra-high-pressure rocks during continental collision: Role of detachment in the subduction channel, Geochem. Geophy. Geosy., 9, Q04019, https://doi.org/10.1029/2007GC001839, 2008. a
Weijermars, R. and Schmeling, H.: Scaling of Newtonian and non-Newtonian fluid dynamics without inertia for quantitative modelling of rock flow due to gravity (including the concept of rheological similarity), Phys. Earth Planet. In., 43, 316–330, 1986. a
Willett, S., Beaumont, C., and Fullsack, P.: Mechanical model for the tectonics of doubly vergent compressional orogens, Geology, 21, 371–374, 1993. a, b
Willett, S. D.: Orogeny and orography: The effects of erosion on the structure of mountain belts, J. Geophys. Res.-Sol. Ea., 104, 28957–28981, 1999. a
Wilson, J. T.: A new class of faults and their bearing on continental drift, Nature, 207, 343–347, 1965. a
Wilson, R., Houseman, G., Buiter, S., McCaffrey, K., and Doré, A.: Fifty years of the Wilson Cycle concept in plate tectonics: an overview, Geol. Soc. Lond. Spec. Publ., 470, 1–17, 2019. a
Winter, J. D.: Principles of igneous and metamorphic petrology, Pearson education, 2013. a
Workman, R. K. and Hart, S. R.: Major and trace element composition of the depleted MORB mantle (DMM), Earth Planet. Sc. Lett., 231, 53–72, 2005. a
Yamato, P., Agard, P., Burov, E., Le Pourhiet, L., Jolivet, L., and Tiberi, C.: Burial and exhumation in a subduction wedge: Mutual constraints from thermomechanical modeling and natural P-T-t data (Schistes Lustrés, western Alps), J. Geophys. Res.-Sol. Ea., 112, B07410, https://doi.org/10.1029/2006JB004441, 2007. a, b
Yamato, P., Duretz, T., May, D. A., and Tartese, R.: Quantifying magma segregation in dykes, Tectonophysics, 660, 132–147, 2015. a
Yamato, P., Duretz, T., and Angiboust, S.: Brittle/ductile deformation of eclogites: insights from numerical models, Geochem. Geophy. Geosy., 20, 3116–3133, https://doi.org/10.1029/2019GC008249, 2019. a
Yang, J., Lu, G., Liu, T., Li, Y., Wang, K., Wang, X., Sun, B., Faccenda, M., and Zhao, L.: Amagmatic subduction produced by mantle serpentinization and oceanic crust delamination, Geophys. Res. Lett., 47, e2019GL086257, https://doi.org/10.1029/2019GL086257, 2020. a
Zhao, L., Paul, A., Guillot, S., Solarino, S., Malusà, M. G., Zheng, T., Aubert, C., Salimbeni, S., Dumont, T., Schwartz, S., Zhu, R., and Wang, Q.: First seismic evidence for continental subduction beneath the Western Alps, Geology, 43, 815–818, 2015. a, b, c
Zhao, L., Malusà, M. G., Yuan, H., Paul, A., Guillot, S., Lu, Y., Stehly, L., Solarino, S., Eva, E., Lu, G., Bodin, T., CIFALPS Group, and AlpArray Working Group: Evidence for a serpentinized plate interface favouring continental subduction, Nat. Commun., 11, 1–8, 2020. a
- Abstract
- Introduction
- Numerical model
- Results
- Discussion
- Conclusions
- Appendix A: Algorithm description
- Appendix B: Emplacement of elliptical heterogeneous inclusions
- Appendix C: Buoyancy and driving forces
- Data availability
- Video supplement
- Author contributions
- Competing interests
- Disclaimer
- Special issue statement
- Acknowledgements
- Financial support
- Review statement
- References