the Creative Commons Attribution 4.0 License.
the Creative Commons Attribution 4.0 License.
 | 13 Aug 2021
Elastic anisotropies of rocks in a subduction and exhumation setting
Michael J. Schmidtke
Ruth Keppler
Jacek Kossak-Glowczewski
Nikolaus Froitzheim
Michael Stipp
Subduction and exhumation are key processes in the formation of orogenic systems across the world, for example, in the European Alps. For geophysical investigations of these orogens, it is essential to understand the petrophysical properties of the rocks involved. These are the result of a complex interaction of mineral composition and rock fabric including mineral textures (i.e., crystallographic preferred orientations). In this study we present texture-derived elastic anisotropy data for a representative set of different lithologies involved in the Alpine orogeny. Rock samples were collected in the Lago di Cignana area in Valtournenche, in the Italian northwestern Alps. At this locality a wide range of units of continental and oceanic origin with varying paleogeographic affiliations and tectono-metamorphic histories are accessible. Their mineral textures were determined by time-of-flight neutron diffraction. From these data the elastic properties of the samples were calculated. The data set includes representative lithologies from a subduction-exhumation setting. In subducted lithologies originating from the oceanic crust, the P-wave anisotropies (AVPs [%]) range from 1.4 % to 3.7 % with average P-wave velocities of 7.20–8.24 km/s and VP VS ratios of 1.70–1.75. In the metasediments of the former accretionary prism the AVPs range from 3.7 % to 7.1 %, average P-wave velocities are 6.66–7.23 km/s and VP VS ratios are 1.61–1.76. Continental crust which is incorporated in the collisional orogen shows AVP ranging from 1.4 % to 2.1 % with average P-wave velocities of 6.52–6.62 km/s and VP VS ratios of 1.56–1.60. Our results suggest that mafic and felsic rocks in subduction zones at depth may be discriminated by a combination of seismic signatures: lower anisotropy and higher VP VS ratio for mafic rocks, and higher anisotropy and lower VP VS ratio for felsic rocks and metasediments.
- Article
(6806 KB) - Full-text XML
- Companion paper
- BibTeX
- EndNote


During subduction, exhumation and continental collision, rocks of different paleogeographic affiliations are juxtaposed, strongly deformed and submitted to variable metamorphic conditions. Oceanic crust and its sedimentary cover, as well as continental fragments, are frequently subducted before or during continental collision. This leads to a large variety of lithologies within the subduction zone from ultramafic rocks originating from mantle material, to mafic rocks originating from oceanic crust, to felsic rocks which were either part of continental fragments, continental margins or sedimentary cover of the oceanic rocks. Deformation during subduction and exhumation produces crystallographic preferred orientation (CPO), which in turn leads to elastic anisotropy of the rocks involved. The metamorphic overprint also influences their seismic velocities and Poisson ratios. With increasing depth, the rocks undergo blueschist- to eclogite-facies metamorphic conditions. During exhumation the rocks are frequently exposed to further metamorphic overprint, depending on various factors such as exhumation speed and available water content (e.g., Peacock, 1993). These rocks that can now be found in outcrops at the Earth's surface yield insights into various stages of subduction, collision and exhumation, which can be compared to the geophysical investigations of such rocks at depth.
Such high-resolution geophysical imaging of 3D structures is currently taking place within the AlpArray initiative using a high-end seismological array within the Alpine orogen. For this project, knowledge of the seismic anisotropy of the imaged rocks is of great interest because in conjunction with the VP VS ratio it is a key parameter for the interpretation of geological structures in the subsurface. Receiver-function analysis allows the separation of crustal from mantle anisotropy in the Alps (Link and Rümpker, 2019). Because of the larger lithological heterogeneity of the crust, as compared to the mantle, information on the seismic properties of various crustal rocks is required for interpreting the crustal anisotropy pattern.
Elastic anisotropies of rocks can be calculated from mineral compositions, single-crystal mineral properties and the CPOs of all involved mineral phases (Christoffel, 1877; Mainprice and Humbert, 1994). They are also influenced by other factors, such as shape preferred orientation (SPO) of the minerals, their grain sizes and microcracks in the rocks (Siegesmund and Vollbrecht, 1991; Siegesmund et al., 1993; Ullemeyer et al., 2011). With increasing depth, the importance of porosity and microcracks is diminished, leading to CPO as the most important factor influencing elastic anisotropies in the deeper parts of subduction zones and collisional orogens.
In this study, we collected a set of rock samples from the Lago di Cignana area in Valtournenche, western Alps (Fig. 1a and b). The samples are representative of various stages within a subduction and exhumation cycle, including rocks of oceanic and continental origin and variable degrees of metamorphism and deformation (Fig. 2). The CPOs of the mineral phases of the samples were acquired by time-of-flight (TOF) neutron diffraction. Measurements were conducted at the SKAT diffractometer of the Frank Laboratory of Neutron Physics at the JINR in Dubna, Russia (Ullemeyer et al., 1998, 2006, 2010; Ivankina et al., 2000, 2001; Nikitin et al., 2004; Kern et al., 2008; Keppler et al., 2014). This method has the advantage of being able to measure bulk CPOs of all mineral phases in large, polyphase, coarse-grained samples simultaneously (Keppler et al., 2014). From the CPO and single-crystal elastic anisotropy data the seismic properties of all collected samples were calculated. These data provide a catalogue for seismic imaging and geodynamic models of the Alpine orogen as well as other subduction zones and continental collision zones around the world. Among the texture-derived properties presented are the P- and S-wave velocities, the VP VS ratio and the P-wave anisotropies of each sample.
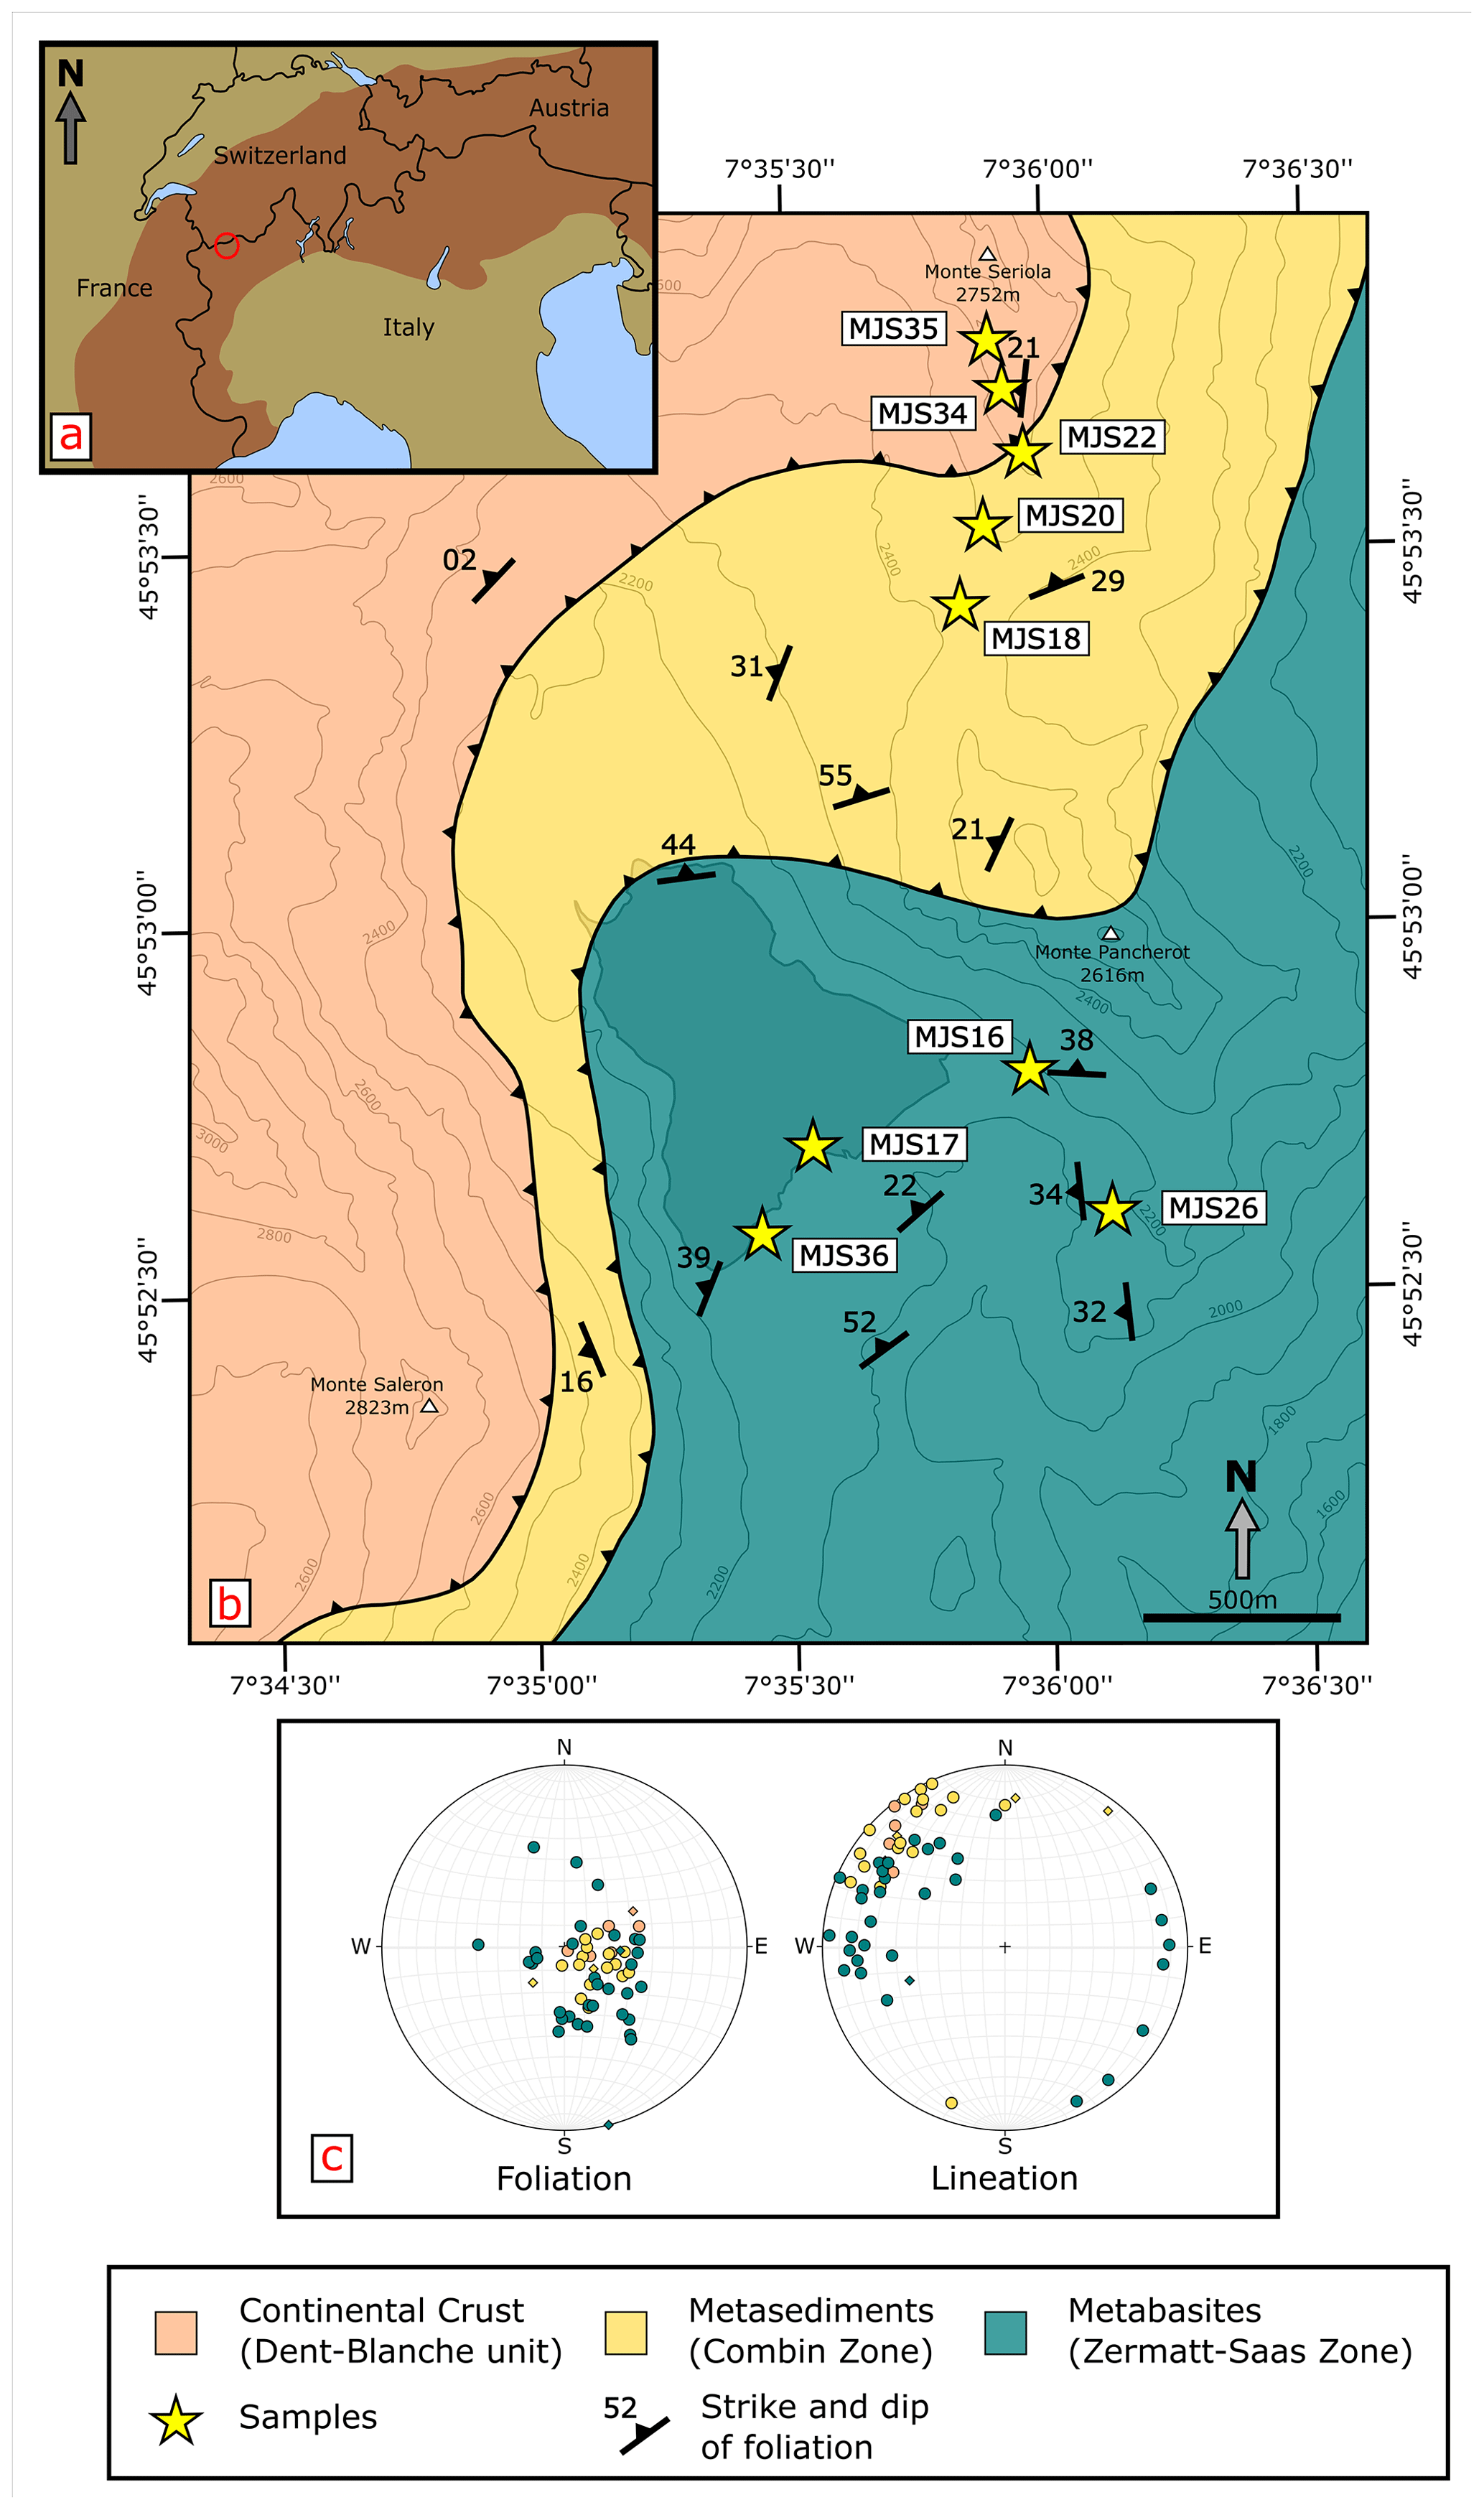
Figure 1(a) Miniature map displaying approximate location of the study area in the European alpine orogen. (b) Geological map of the study area at Lago di Ciganan, in the western Italian Alps, modified after the map of Kirst and Leiss (2016). Sample locations indicated by stars. (c) Stereoplots of foliation normal and stretching lineation as equal area projections in the lower hemisphere. Data compiled from our own measurements (diamonds) and from Kirst and Leiss (2016) (circles); colors match those used in the map.
The samples in this study were collected in the western Alps in northwestern Italy (Fig. 1a). In this area the Alpine orogen consists of tectonic nappes of continental and oceanic origin with various paleogeographic provenances and tectono-metamorphic histories. The nappe stack formed from the continent–continent collision of Europe and Adria occurring in the Palaeogene. The units in the nappe stack were accreted to the Adriatic margin during SE-directed subduction. The units from which the samples were collected are derived from the Piemont-Liguria Ocean and the Margna-Sesia continental fragment (Schmid et al., 2004), also termed Cervinia (Pleuger et al., 2007).
At Lago Di Cignana (Fig. 1b), a cross section through continental and oceanic units is exposed. Generally, the units exhibit a shallowly NW-dipping foliation and SE–NW to E–W trending lineation (Fig. 1c). The oceanic Zermatt-Saas zone is found in the footwall, separated from the continental hanging wall unit of the Dent Blanche Nappe by the oceanic and metasedimentary Combin zone. These three units are separated by shear zones and faults; clear differences in metamorphic grade can be found. For this study, metabasites (eclogite, blueschist, amphibolite and greenschist) were collected from the Zermatt-Saas zone. Furthermore, several metasedimentary rocks of various compositions were collected from the Combin zone as well as two gneiss samples from the Dent Blanche Nappe.
The rocks in this study followed different P–T paths. The Dent Blanche unit has experienced peak P–T conditions of 1.4–1.6 GPa and 450–520 ∘C (Ballèvre et al., 1986; Oberhänsli and Bucher, 1987; Angiboust et al., 2014; Manzotti et al., 2014). The age of blueschist-facies metamorphism was dated at 48–43 Ma by Rb-Sr geochronology (Angiboust et al., 2014) in the Arolla mylonites at the base of the Dent Blanche unit.
The Combin zone displays P–T conditions of 1.2 GPa and 450 ∘C (Bousquet, 2008). The age of blueschist- to greenschist-facies metamorphism in the Combin zone has been dated between 48 and 36 Ma (Reddy et al., 1999, 2003) by Rb-Sr and Ar/Ar methods.
In the Zermatt-Saas zone the P–T path involved prograde blueschist-facies conditions, high-pressure (HP) to ultra-high-pressure (UHP) peak conditions, and retrograde amphibolite- and greenschist-facies overprints. Peak conditions reached 2.5–3 GPa and 550–600 ∘C (Bucher et al., 2005), with locally UHP peak conditions of 3.2 GPa and over 600 ∘C (Groppo et al., 2009; Frezzotti et al., 2011). The peak UHP metamorphism was dated at 40.6 ± 2.6 Ma by Sm-Nd garnet (Amato et al., 1999), to 44–43 Ma by the Ar/Ar step-heating method on phengite (Gouzu et al., 2006) and at 48.8 ± 2.1 Ma by Lu-Hf on garnet-omphacite whole rock (Lapen et al., 2003). The greenschist-facies retrograde overprint was dated at 38 ± 2 Ma by Rb-Sr whole-rock-phengite chronology (Amato et al., 1999).
CPOs were measured by the TOF neutron diffractometer SKAT at the Frank Laboratory of Neutron Physics at JINR in Dubna, Russia (Keppler et al., 2014; Ullemeyer et al., 1998). Neutron diffraction has several advantages over other texture analysis methods such as optical measurement and electron and X-ray diffraction analysis (Wenk et al., 1998; Ullemeyer et al., 2000; Nikitin and Ivankina, 2004). Among these advantages is the low absorption of thermal neutrons in matter. This allows the measurement of large sample volumes (up to 65 cm3) of complex material such as coarse-grained rocks containing multiple low-symmetry mineral phases (Ullemeyer et al., 2006, 2010; Ivankina et al., 2005; Kern et al., 2008; Keppler et al., 2014).
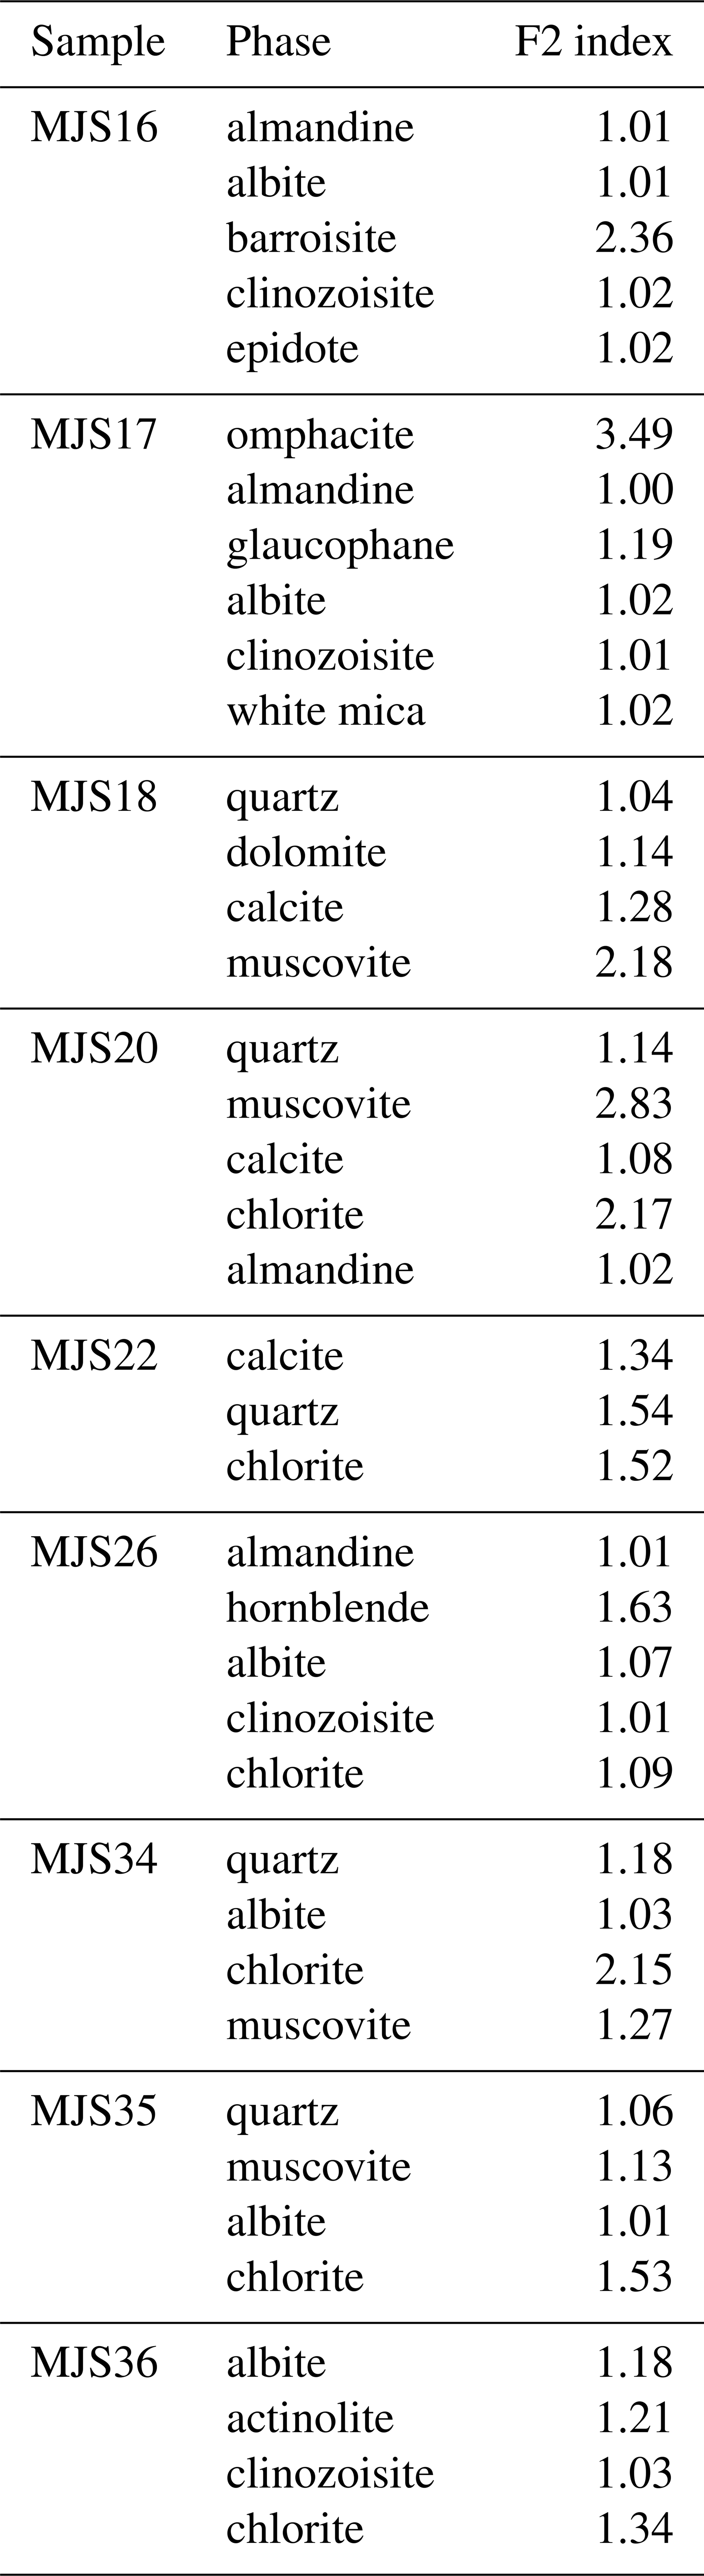
The diffraction data are processed by Rietveld Texture Analysis (RTA) (Von Dreele, 1997; Matthies et al., 1997; Lutterotti et al., 1997). This method allows for the determination of the textures of all mineral phases in the sample by calculation of the orientation distribution function (ODF) using the E-WIMV algorithm (Lutterotti et al., 2004; Chateigner et al., 2019). The RTA is performed in the software Mineral Analysis Using Diffraction (MAUD: Lutterotti, 2010; Wenk et al., 2010). For further discussion on the functions and limitations of MAUD, see the publication of Wenk et al. (2012). For comparability of texture strength within the sample set we calculated F2 indexes (Bunge et al., 1982; Matthies et al., 1997) of all mineral phases in the samples of this study (see Appendix A). The F2 index is an OFD-based texture index in which a completely random texture as found in a powder sample would result in an index of 1, while a perfect single crystal would result in an index of ∞ (Matthies et al., 1997).
In RTA, amphiboles are generally very difficult to distinguish, since they are crystallographically very similar. For this reason, the crystallographic best-fit amphibole structure was picked for refinement and not the compositional best fit. This procedure has an negligible influence on the calculated CPO due to the crystallographic similarity of the amphibole group (C2/m space group; Reynard et al., 1989). For the analysis of the mineral assemblage, thin sections parallel to the stretching lineation and perpendicular to the foliation of all samples were made and analyzed by optical polarization microscopy.
To calculate the P-wave velocities and other elastic properties of the samples, the program BEARTEX (Wenk et al., 1998) was used. To calculate the bulk-rock elastic moduli, the orientation distribution function (ODF) of the mineral phases, knowledge of their single-crystal elastic constants and their volume fractions are necessary. The elastic moduli were then calculated using the Christoffel equation (Eq. 1) (Christoffel, 1877; Mainprice and Humbert, 1994):
In it the phase velocity of P, S1 or S2 waves is represented by V. The Kronecker delta is represented by δij, and the Christoffel tensor is represented by Γij. The equation of the Christoffel tensor (Eq. 2) is as follows:
In it aijkl represents the density-corrected elastic (stiffness) moduli, and xkx1 represents the direction cosines of the wave propagation direction.
It has been shown by Hill (1952) that the widely used averaging schemes of Voigt (1928) and Reuss (1929) give upper and lower bounds of the elastic stiffness, respectively. Furthermore, other averaging schemes have been proposed by Matthies and Humbert (1995) and Matthies (2012). However, since the values of the parameters aijkl are still uncertain, the Voigt averaging scheme was used consistently throughout this study. It should be kept in mind that the recalculated velocities are therefore maximum velocities only. In order to gain these uppermost possible VP and avoid overestimation as well as uncertainties concerning the values of the aijkl parameters the Voigt averaging scheme was selected.
The ODFs of all phases are exported from MAUD. The volume percentages of the phases are estimated from thin sections and calculated in MAUD by RTA. The single-crystal elastic constants were taken from the literature (quartz: Heyliger et al., 2003; albite: Brown et al., 2006; muscovite: Vaughan and Guggenheim, 1986; calcite: Chen et al., 2001; dolomite: Humbert and Plique, 1972; hornblende: Aleksandrov and Ryzhova, 1961; epidote/zoisite/clinozoisite: Aleksandrov et al., 1974; garnet: Zhang et al., 2008; glaucophane: Bezacier et al., 2010; omphacite: Bhagat et al., 1992; chlorite: Mookherjee and Mainprice, 2014; actinolite: Brown and Abramson, 2016). In some cases, single-crystal elastic constants are not available for all phases (barroisite and clinozoisite), so similar minerals were selected as approximations. For clinozoisite the single-crystal elastic constants of epidote (Aleksandrov et al., 1974) were selected, for the blueschist-facies amphibole barroisite those of glaucophane (Bezacier et al., 2010). In most cases, the contents of the phases for which approximations were necessary are below 10 % of the total sample volume. At this low content, the CPOs of these minerals are of low relevance for the physical properties of the rock (Mainprice and Ildefonse, 2009).
It is known that at low confining pressures, close to the Earth's surface, the elastic properties of rocks are greatly influenced by microcracks and crack fabrics, as well as a shape preferred orientation (SPO). This has been shown in multiple studies (Kern et al., 2002, 2008; Pros et al., 2003; Ivankina et al., 2005; Ullemeyer et al., 2006). Further studies have even shown that the influence of microcracks is still visible up to a confining pressure of 1 GPa (Christensen, 1974; Ullemeyer et al., 2011). In this study the elastic properties are calculated solely on the basis of mineral texture and single-crystal data without taking microcracks into account. Since the microcracks are closed or almost closed at great depth, the calculated elastic properties can be seen as representative of these conditions.
In this study we have related the subduction and exhumation settings to several structural positions, each containing characteristic lithologies (Fig. 2). These positions are (1) the oceanic crust of the subducting plate, (2) the sedimentary cover of the subducting plate as well as the accretionary prism and (3) the continental crust of a microcontinent. The eclogite, blueschist, amphibolite and greenschist of the Zermatt-Saas zone belong to the first of these. The metasediments of the Combin zone represent the second position, and the gneisses of the Dent-Blanche represent the position of the deformed continental crust. However, the samples do not always represent the peak conditions of metamorphism but contain minerals grown during various steps of the P–T path. In most samples presented here a clear chlorite-forming greenschist overprint is visible, even if the rock originated at higher metamorphic conditions. This is especially true for the metabasic rocks in this study, which often contain hornblende, actinolite and chlorite, indicating the amphibolite- and greenschist-facies overprint.
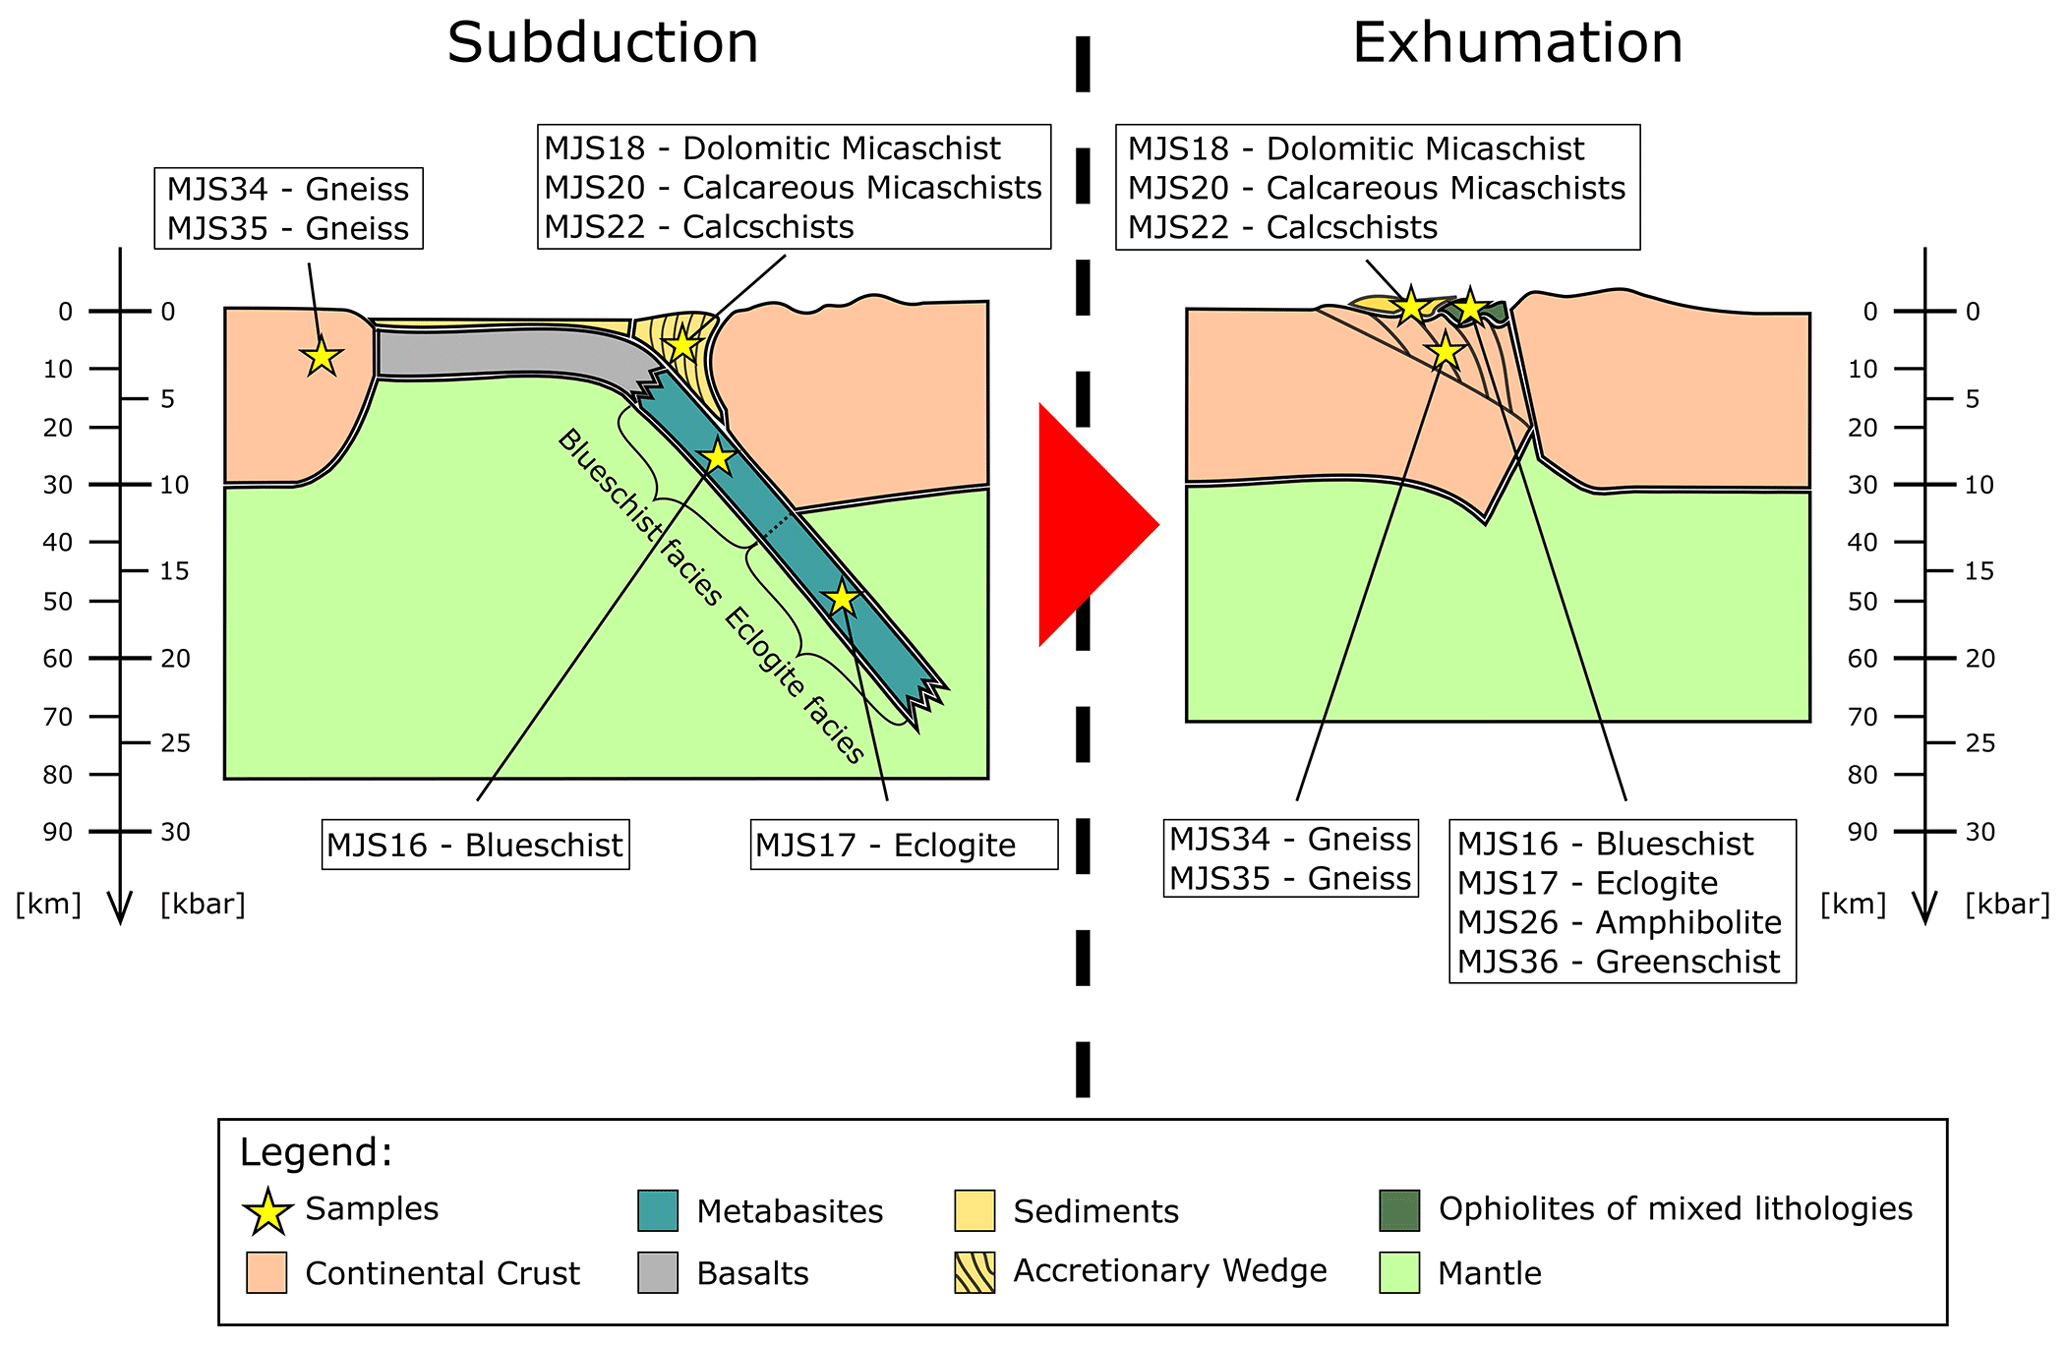
Figure 2Schematic cross section of subduction and exhumation in a collisional orogeny. The stars show locations which the samples represent within this setting. Colors correlate to map in Fig. 1.
4.1 Eclogite
The eclogite (MJS17) is composed of omphacite (30 vol %), garnet (30 vol %), clinozoisite (15 vol %), glaucophane (10 vol %), albite (10 vol %), rare white mica (< 5 vol %) and retrograde chlorite (< 5 vol %) (Table 1; Fig. 3a). Mesoscopically the fabric is strongly dominated by a clear foliation defined by omphacite and glaucophane, surrounding larger grains of garnet. Elongated omphacite and glaucophane grains form the stretching lineation and are visible in the foliation plane. On the microscopic level the eclogite is strongly foliated with idiomorphic garnet grains surrounded by layers of omphacite, glaucophane, clinozoisite and feldspar. The grain size distribution is bimodal with a mostly fine-grained matrix of omphacite, glaucophane and some feldspar surrounding larger garnet grains. The presence of albite shows a greenschist-facies overprint.
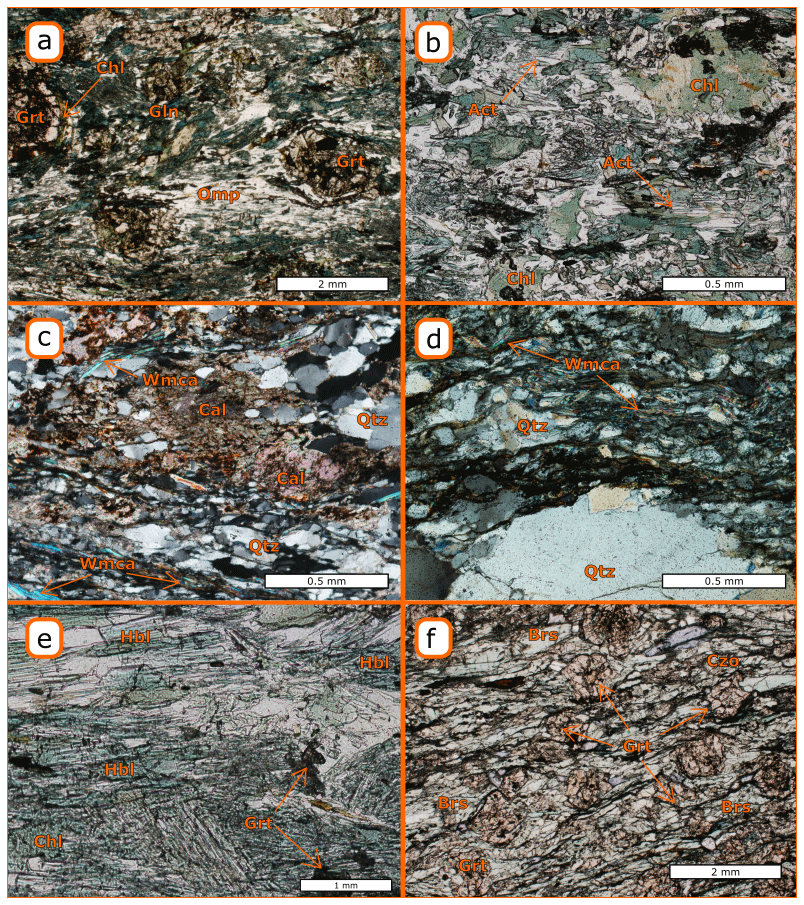
Figure 3Thin-section photographs of typical microstructures in four representative samples. (a) Eclogite (MJS17) with foliation of glaucophane (Gln) and omphacite (Omp) flowing around larger grains of garnet (Grt) with some retrograde chlorite (Chl) visible at its rim. (b) Greenschist (MJS36) with actinolite (Act) and chlorite (Chl) visible in the foliation and larger chlorite grains found unoriented grown over the foliation. (c) Calcareous micaschist (MJS20) with quartz (Qz), calcite (Calc) and white mica (Wmca) oriented in the foliation. (d) Gneiss (MJS35) displaying strongly foliated fine grained quartz (Qz) and white mica (Wmca) larger coarse grained quartz. (e) Amphibolite (MJS26) displaying abundant hornblende (Hbl) with some chlorite (Chl) and smaller fragmented garnet (Grt) grains. (f) Garnet (Grt) rich band in the blueschist (MJS36) surrounded by barroisite (Brs) and clinozoisite (Czo). Sections are oriented perpendicular to the foliation and parallel to the stretching lineation. Panels (a), (b), (e) and (f) are shown under plane-polarized light, while (c) and (d) are shown under x-polarized light. For sample descriptions see Table 1.
4.2 Blueschist
The blueschist (MJS16) comprises barroisite (40 vol %), albite (30 vol %), clinoziosite (15 vol %), garnet (10 vol %) and epidote (5 vol %). The foliation in the blueschist is clearly pronounced on the mesoscopic scale (Table 1; Fig. 3f). The stretching lineation is formed by elongated barroisite and feldspar grains in the foliation plane. On the microscopic scale a foliation formed by barroisite can clearly be seen. The grain-size distribution is bimodal, with a finer grained matrix of amphibole and feldspar, and layers of larger, strongly retrogressed, inclusion-rich and fractured garnets therein.
Table 1Description and modal composition of investigated samples.
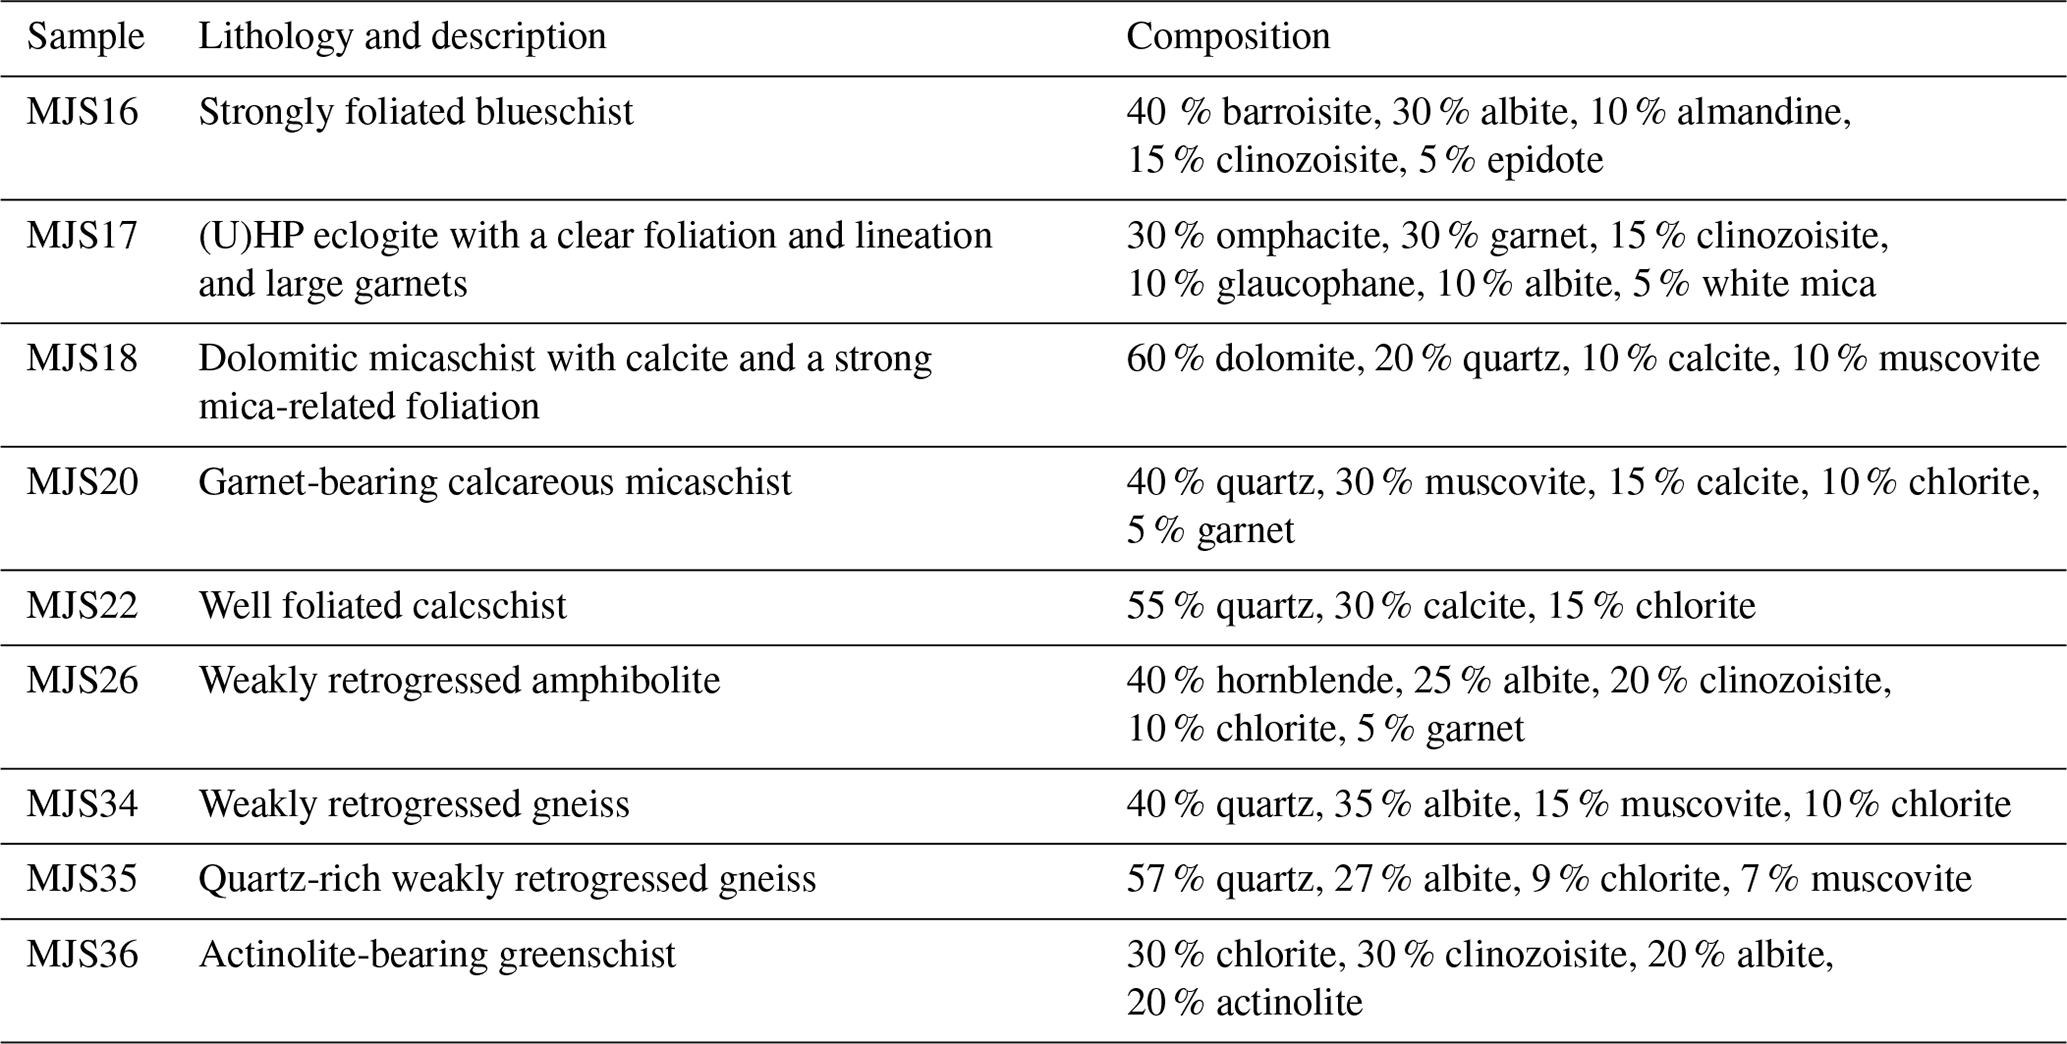
Table 2P-wave (VP) and S-wave (VS) velocities, seismic anisotropies (VP-, VS1- and VS2-anisotropies %), and VP VS ratios of all samples, modeled from CPOs.

4.3 Amphibolite
The composition of the amphibolite (MJS26; Table 1; Fig. 3e) is dominated by hornblende (40 vol %). Feldspar (25 vol %), clinozoisite (15 vol %) and chlorite (10 vol %) are also present in the matrix. Some large, fractured garnet (5 vol %) grains are found as accessory minerals, which display strong greenschist-facies retrogression, with abundant chlorite surrounding them. Hornblende defines a weak foliation in MJS26. Both hornblende and feldspar grains form a stretching lineation on the foliation plane.
4.4 Greenschist
In the greenschist MJS36, the main constituent minerals are chlorite (30 vol %), clinozoisite (30 vol %) and actinolite (20 vol %). Feldspar is visible throughout the matrix (Table 1, Fig. 3b). Actinolite defines the foliation of the sample, while chlorite grains show a weaker preferred orientation. In the foliation, amphibole grains can be seen forming a stretching lineation. The greenschist is fine-grained and shows a very homogeneous mineral distribution.
4.5 Metasediments
The composition of the metasediments (MJS18, MJS20, MJS22) is variable (Table 1), but they all display a clear foliation and stretching lineation (Fig. 3c). In sample MJS18 the matrix consists of dolomite (60 vol %), quartz (20 vol %), calcite (10 vol %) and white mica (10 vol %). The foliation is pronounced and defined by dolomite and calcite grains. Layers of finer- and coarser-grained calcite, dolomite and quartz alternate. Mica fishes are found interlayered in the matrix. In the layers of coarser-grained calcite, dolomite and quartz, a weak oblique foliation in addition to the main foliation can be seen. The stretching lineation is visible on the foliation plane, in elongated calcite and dolomite grains. In the calc-micaschist (MJS20) a clear foliation is defined by white mica. Alternating layers of coarser- and finer-grained calcite (15 vol %) and quartz (40 vol %) are separated by bands of white mica (30 vol %) and chlorite (10 vol %). Larger grains of strongly fractured garnet (5 vol %) are present. These garnet grains give the fabric a knotty appearance, with the other minerals flowing around them. The calcschist MJS22 is made up of quartz (55 vol %), calcite (30 vol %) and chlorite (15 vol %). Compositional layering is clearly visible, with thick bands of very coarse-grained quartz, alternating with bands of fine-grained quartz and calcite with chlorite fishes. The coarser grains of both quartz and calcite form a weak oblique foliation.
4.6 Gneiss
The composition of the two gneisses (MJS34, MJS35) is quite similar to the main mineral components – in both are quartz (40 vol %–57 vol %), feldspar (27 vol %–35 vol %), white mica (7 vol %–15 vol %) and chlorite (9 vol %–10 vol %) (Table 1, Fig. 3d). The fabric of both samples is also very similar. They are strongly foliated with a lineation formed by quartz and feldspar. Sample MJS35 contains a 5 mm thick quartz band, which is a feature quite common in this unit in general. The other sample has a more homogeneous distribution of minerals. Microscopically the foliation is formed by mica, quartz and feldspar. Mica shows a pronounced SPO of grains aligned in the foliation plane. Where chlorite is present it is interwoven with white mica between the quartz- and feldspar-rich layers.
5.1 Crystallographic preferred orientations
5.1.1 Eclogite
In the eclogite (MJS17) omphacite shows a distinct CPO and has the highest texture strength of all phases in the sample with an F2 index (Bunge, 1982; see complete list in Appendix A) of 3.49. The c axes display the highest intensity clusters with a maximum parallel to the stretching lineation. The a axes display maxima in a girdle perpendicular to the stretching lineation. The omphacite b axes form a weak girdle perpendicular to the stretching lineation with a clear maximum normal to the foliation plane (Fig. 4a). The glaucophane in eclogite has a weak CPO with an F2 index of 1.19. The c axes display a maximum parallel to the stretching lineation. The a axes develop a girdle perpendicular to the stretching lineation with a maximum paralleling the kinematic y axis. The glaucophane b axes display two maxima, the stronger of which is normal to the foliation plane and a secondary maximum parallel to the stretching lineation (Fig. 4a). Clinozoisite has weak textures with an F2 index of 1.01. The c axes display a maximum parallel to the kinematic y axis. The main b axis maximum is parallel to the stretching lineation (Fig. 4a). The texture of white mica in the eclogite is quite weak (F2 index of 1.02). However, the basal planes show an alignment to the foliation plane (Fig. 4a). Garnet and albite show random textures.
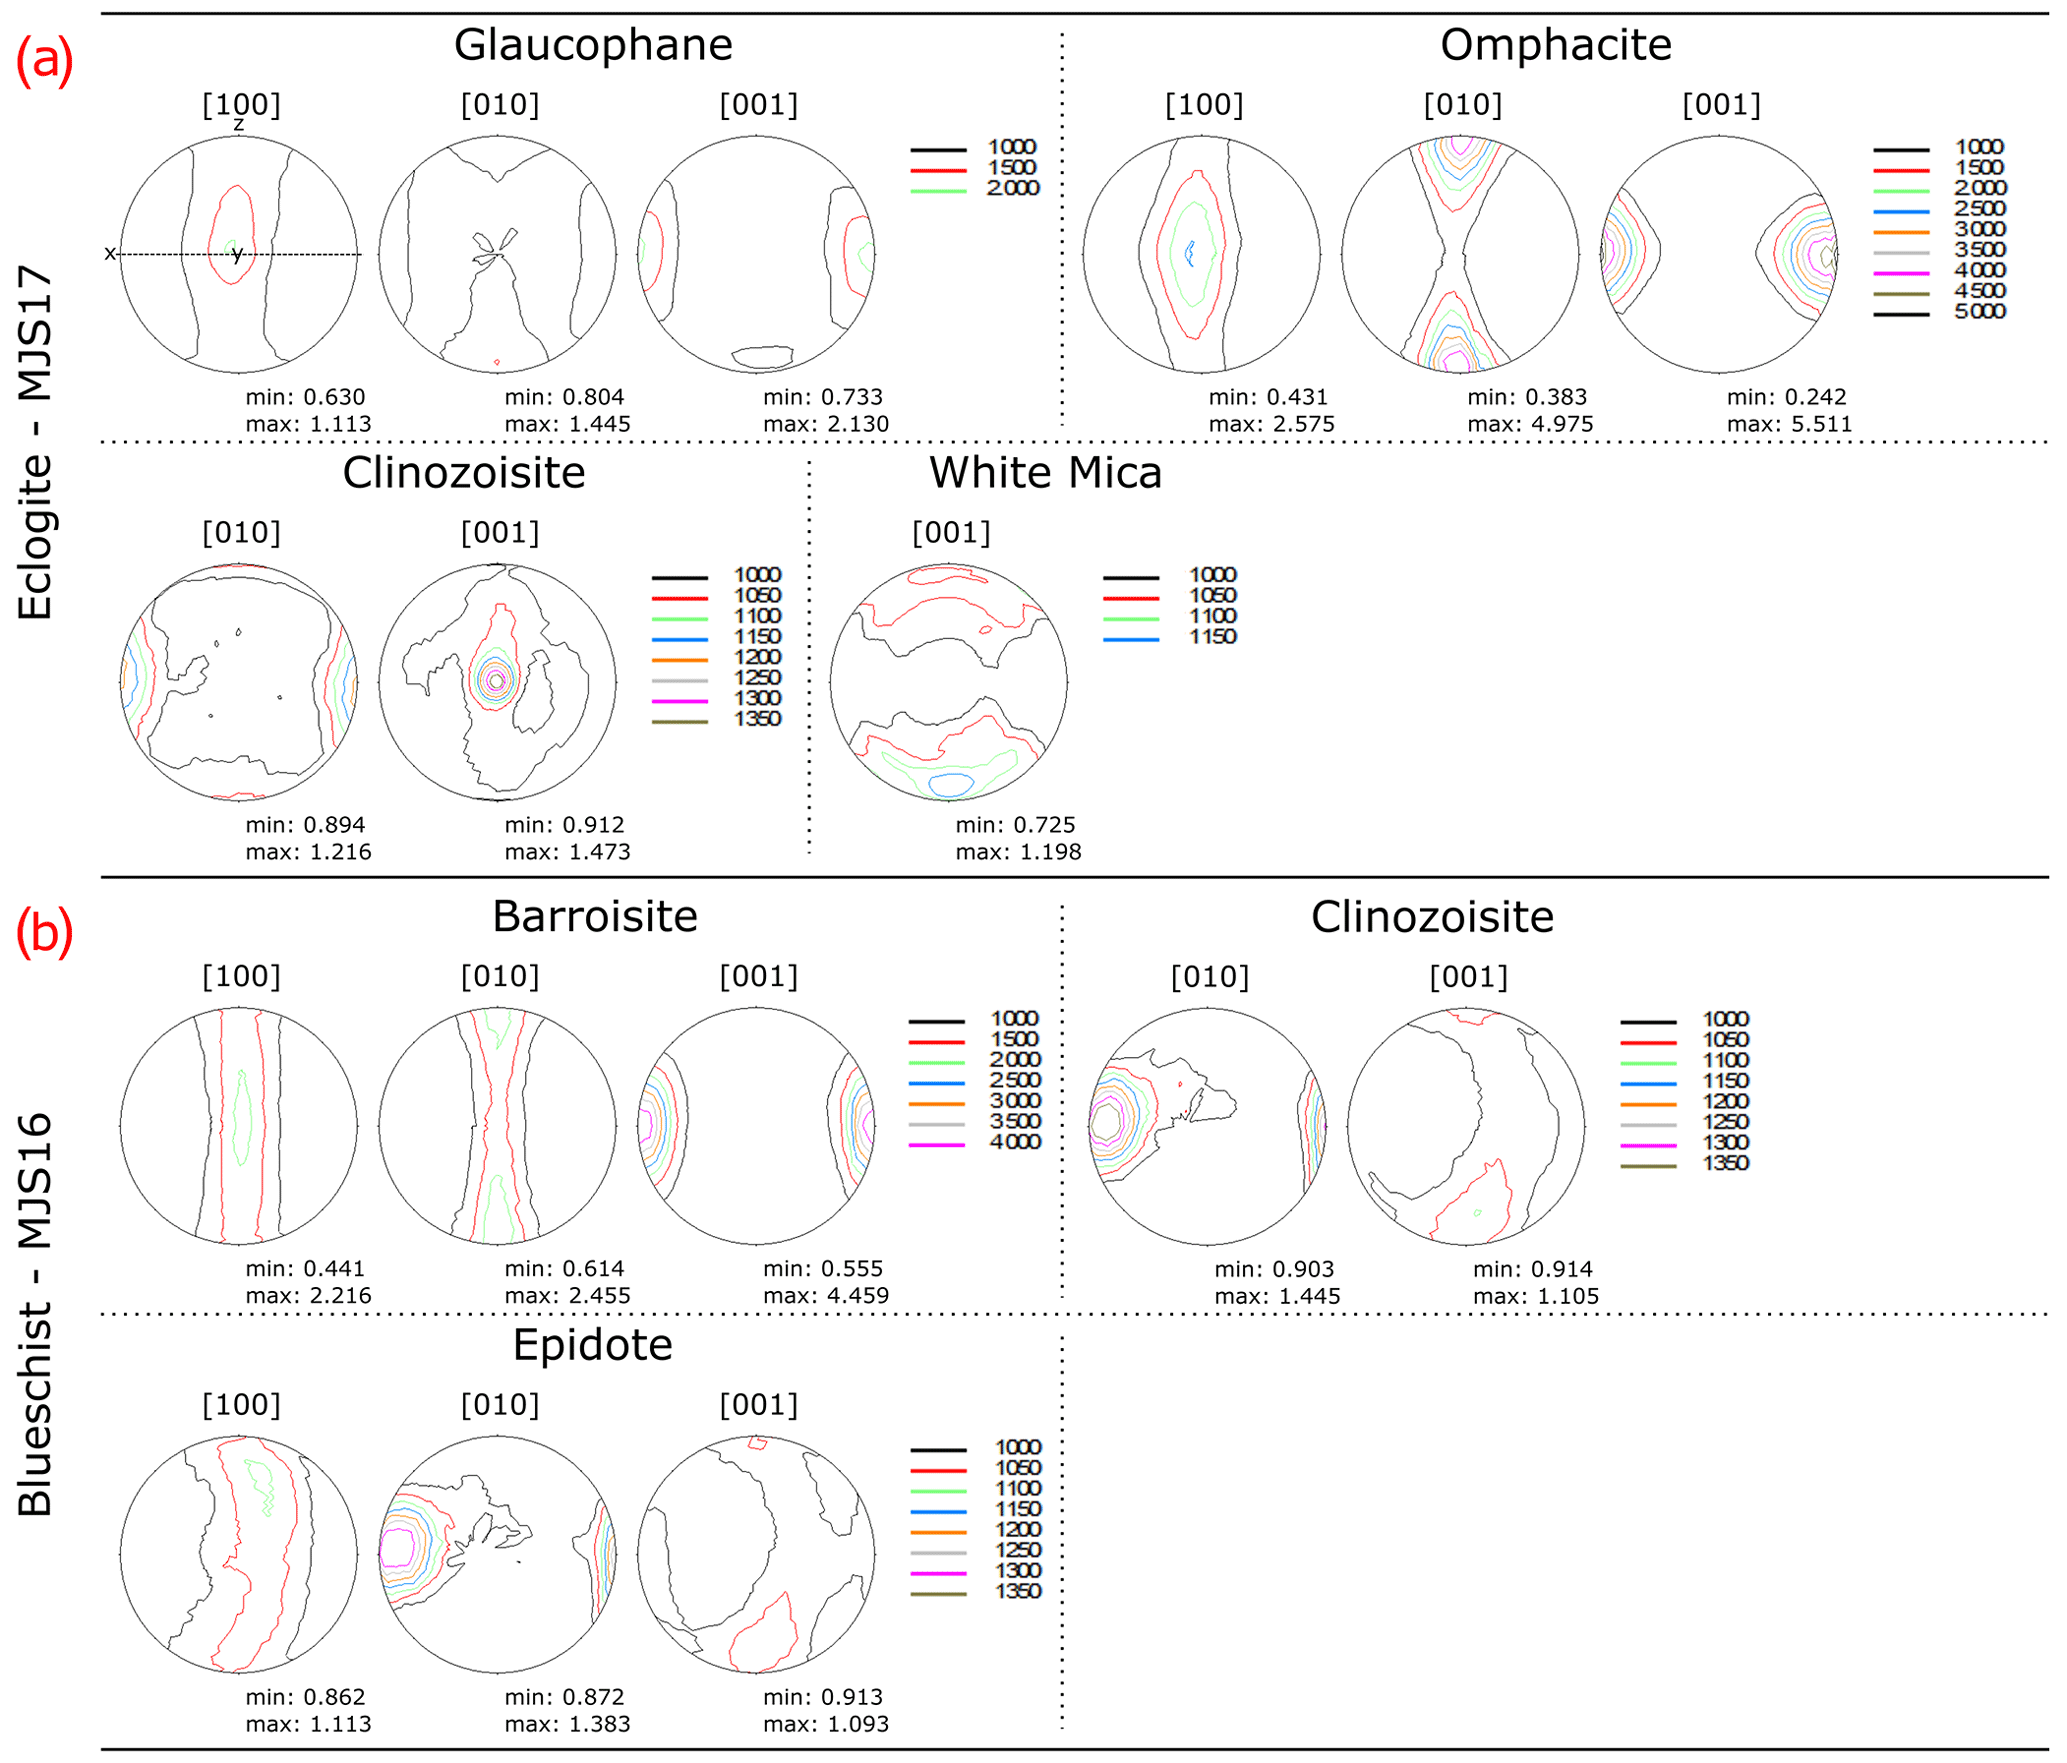
Figure 4Calculated pole figures of important mineral phases in the eclogite (a; MJS17) and the blueschist (b; MJS16). The stretching lineation (kinematic x direction) is oriented EW in the pole figures, the foliation normal (kinematic z direction) is oriented NS and the kinematic y direction (perpendicular to x and z directions) is normal to the pole figure plane. The pole figures are lower hemisphere equal area projections. The contour levels display multiples of random distribution and minimum and maximum values are listed below the pole figure.
5.1.2 Blueschist
In the blueschist (MJS16), barroisite displays the strongest textures with an F2 index of 2.36. The strongest textures are seen in the c axes, which exhibit a maximum parallel to the stretching lineation. The a axes in barroisite display a girdle distribution perpendicular to the lineation direction with a maximum parallel to the kinematic y axis. The b axes display maxima in a similar girdle perpendicular to the stretching lineation with highest densities normal to the foliation plane (Fig. 4b). Clinozoisite and epidote CPOs are very similar and relatively weak. Both show an F2 index of 1.02 and b axes with a maximum almost parallel to the stretching lineation. The a axes and c axes show girdles perpendicular to the lineation (Fig. 4b). Garnet and albite exhibit random textures.
5.1.3 Amphibolite
In the amphibolite MJS26, the strongest textures are found in the hornblende, with an F2 index of 1.62. The hornblende c axes show the strongest CPO with a distinct maximum parallel to the stretching lineation. The b axes are distributed in a girdle normal to the stretching lineation, with a maximum normal to the foliation plane. The a axes also display a girdle normal to the stretching lineation (Fig. 5a). For chlorite, the F2 index is 1.10. Chlorite c axes show a girdle perpendicular to the lineation with a maximum parallel to the foliation normal (Fig. 5a). In albite the texture strength is low, with an F2 index of 1.07. However, a axes display a girdle perpendicular to the stretching lineation and a weak maximum normal to the foliation plane while b axes display a broad, weak maximum parallel to the stretching lineation (Fig. 5a). The textures in garnet and clinozoisite are nearly random.
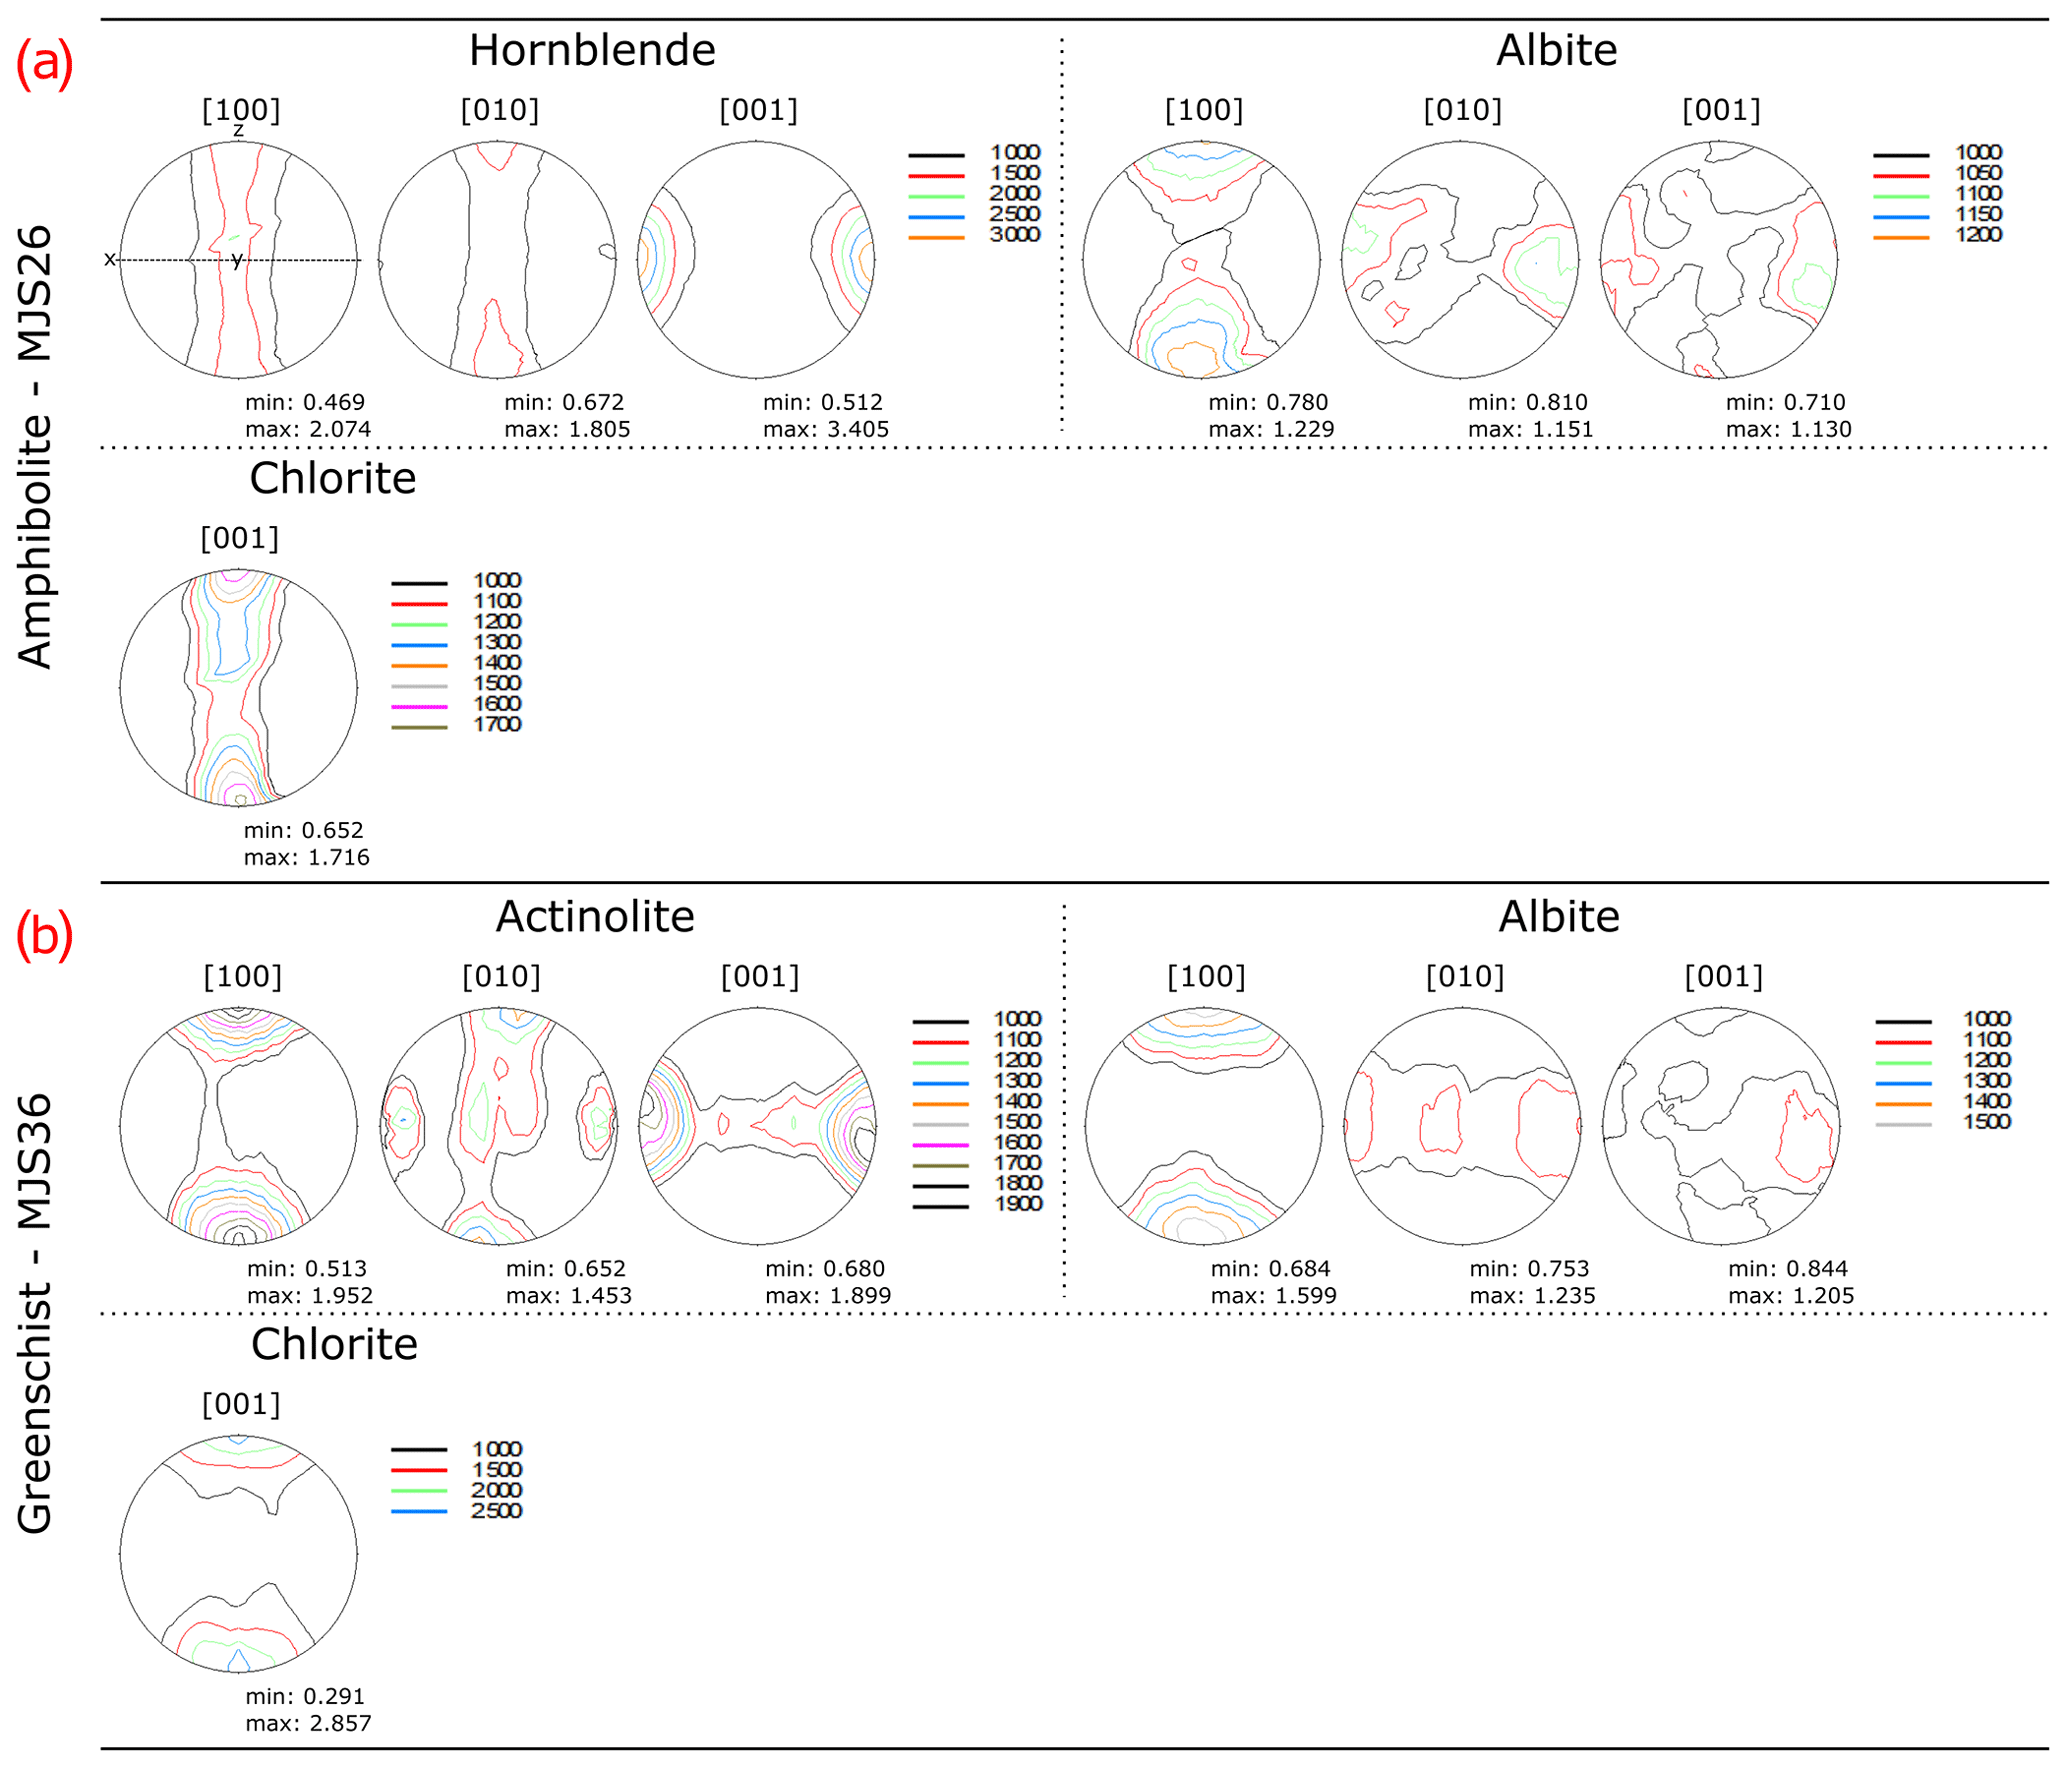
Figure 5Calculated pole figures of important mineral phases in the amphibolite (a; MJS26) and the greenschist (b; MJS36). The stretching lineation (kinematic x direction) is oriented EW in the pole figures, the foliation normal (kinematic z direction) is oriented NS and the kinematic y direction (perpendicular to x and z directions) is normal to the pole figure plane. The pole figures are lower hemisphere equal area projections. The contour levels display multiples of random distribution and minimum and maximum values are listed below the pole figure.
5.1.4 Greenschist
In the greenschist MJS36, the strongest textures are found in chlorite with an F2 index of 1.34. Chlorite basal planes are oriented parallel to the foliation plane (Fig. 5b). The textures of actinolite are of intermediate strength with an F2 index of 1.21. The c axes display a strong maximum parallel to the stretching lineation and a weak girdle distribution in the foliation plane. The a axes show highest intensities with a maximum normal to the foliation plane. The b axes display a slightly weaker texture with a maximum parallel to the foliation normal, connected by a weak, irregular girdle normal to the stretching lineation. Furthermore, secondary maxima are slightly oblique to the stretching lineation (Fig. 5b). Albite has an F2 index of 1.18, and a axes display the strongest CPO with a maximum parallel to the foliation normal. The b axes are concentrated in a girdle in the foliation plane with weak maxima therein. The c axes display a weak CPO with diffuse maxima (Fig. 5b). Clinozoisite shows a random CPO.
5.1.5 Metasediments
In the metasediment samples (MJS18, MJS20, MJS22) the CPOs are quite distinct and often stronger than in the samples described above. In the dolomitic micaschist MJS18, the textures of muscovite are strongest with an F2 index of 2.18. Its basal planes display a strong alignment with the foliation plane (Fig. 6a). The textures of dolomite are of intermediate strength with an F2 index of 1.14. The c axes display a maximum normal to the foliation plane. The a axes show a girdle distribution in the foliation plane with a maximum parallel to the stretching lineation (Fig. 6a). In calcite the textures are slightly stronger than in dolomite and have an F2 index of 1.28. The c axes display a strong maximum perpendicular to the foliation plane, and the a axes display a girdle distribution in the foliation plane (Fig. 6a). The CPO of quartz is weak with an F2 index of 1.04. The c axes display small girdles around the foliation normal. The a axes show a weak diffuse maximum oblique to the stretching lineation. Prism and rhomb planes display almost random distributions (Fig. 6a).
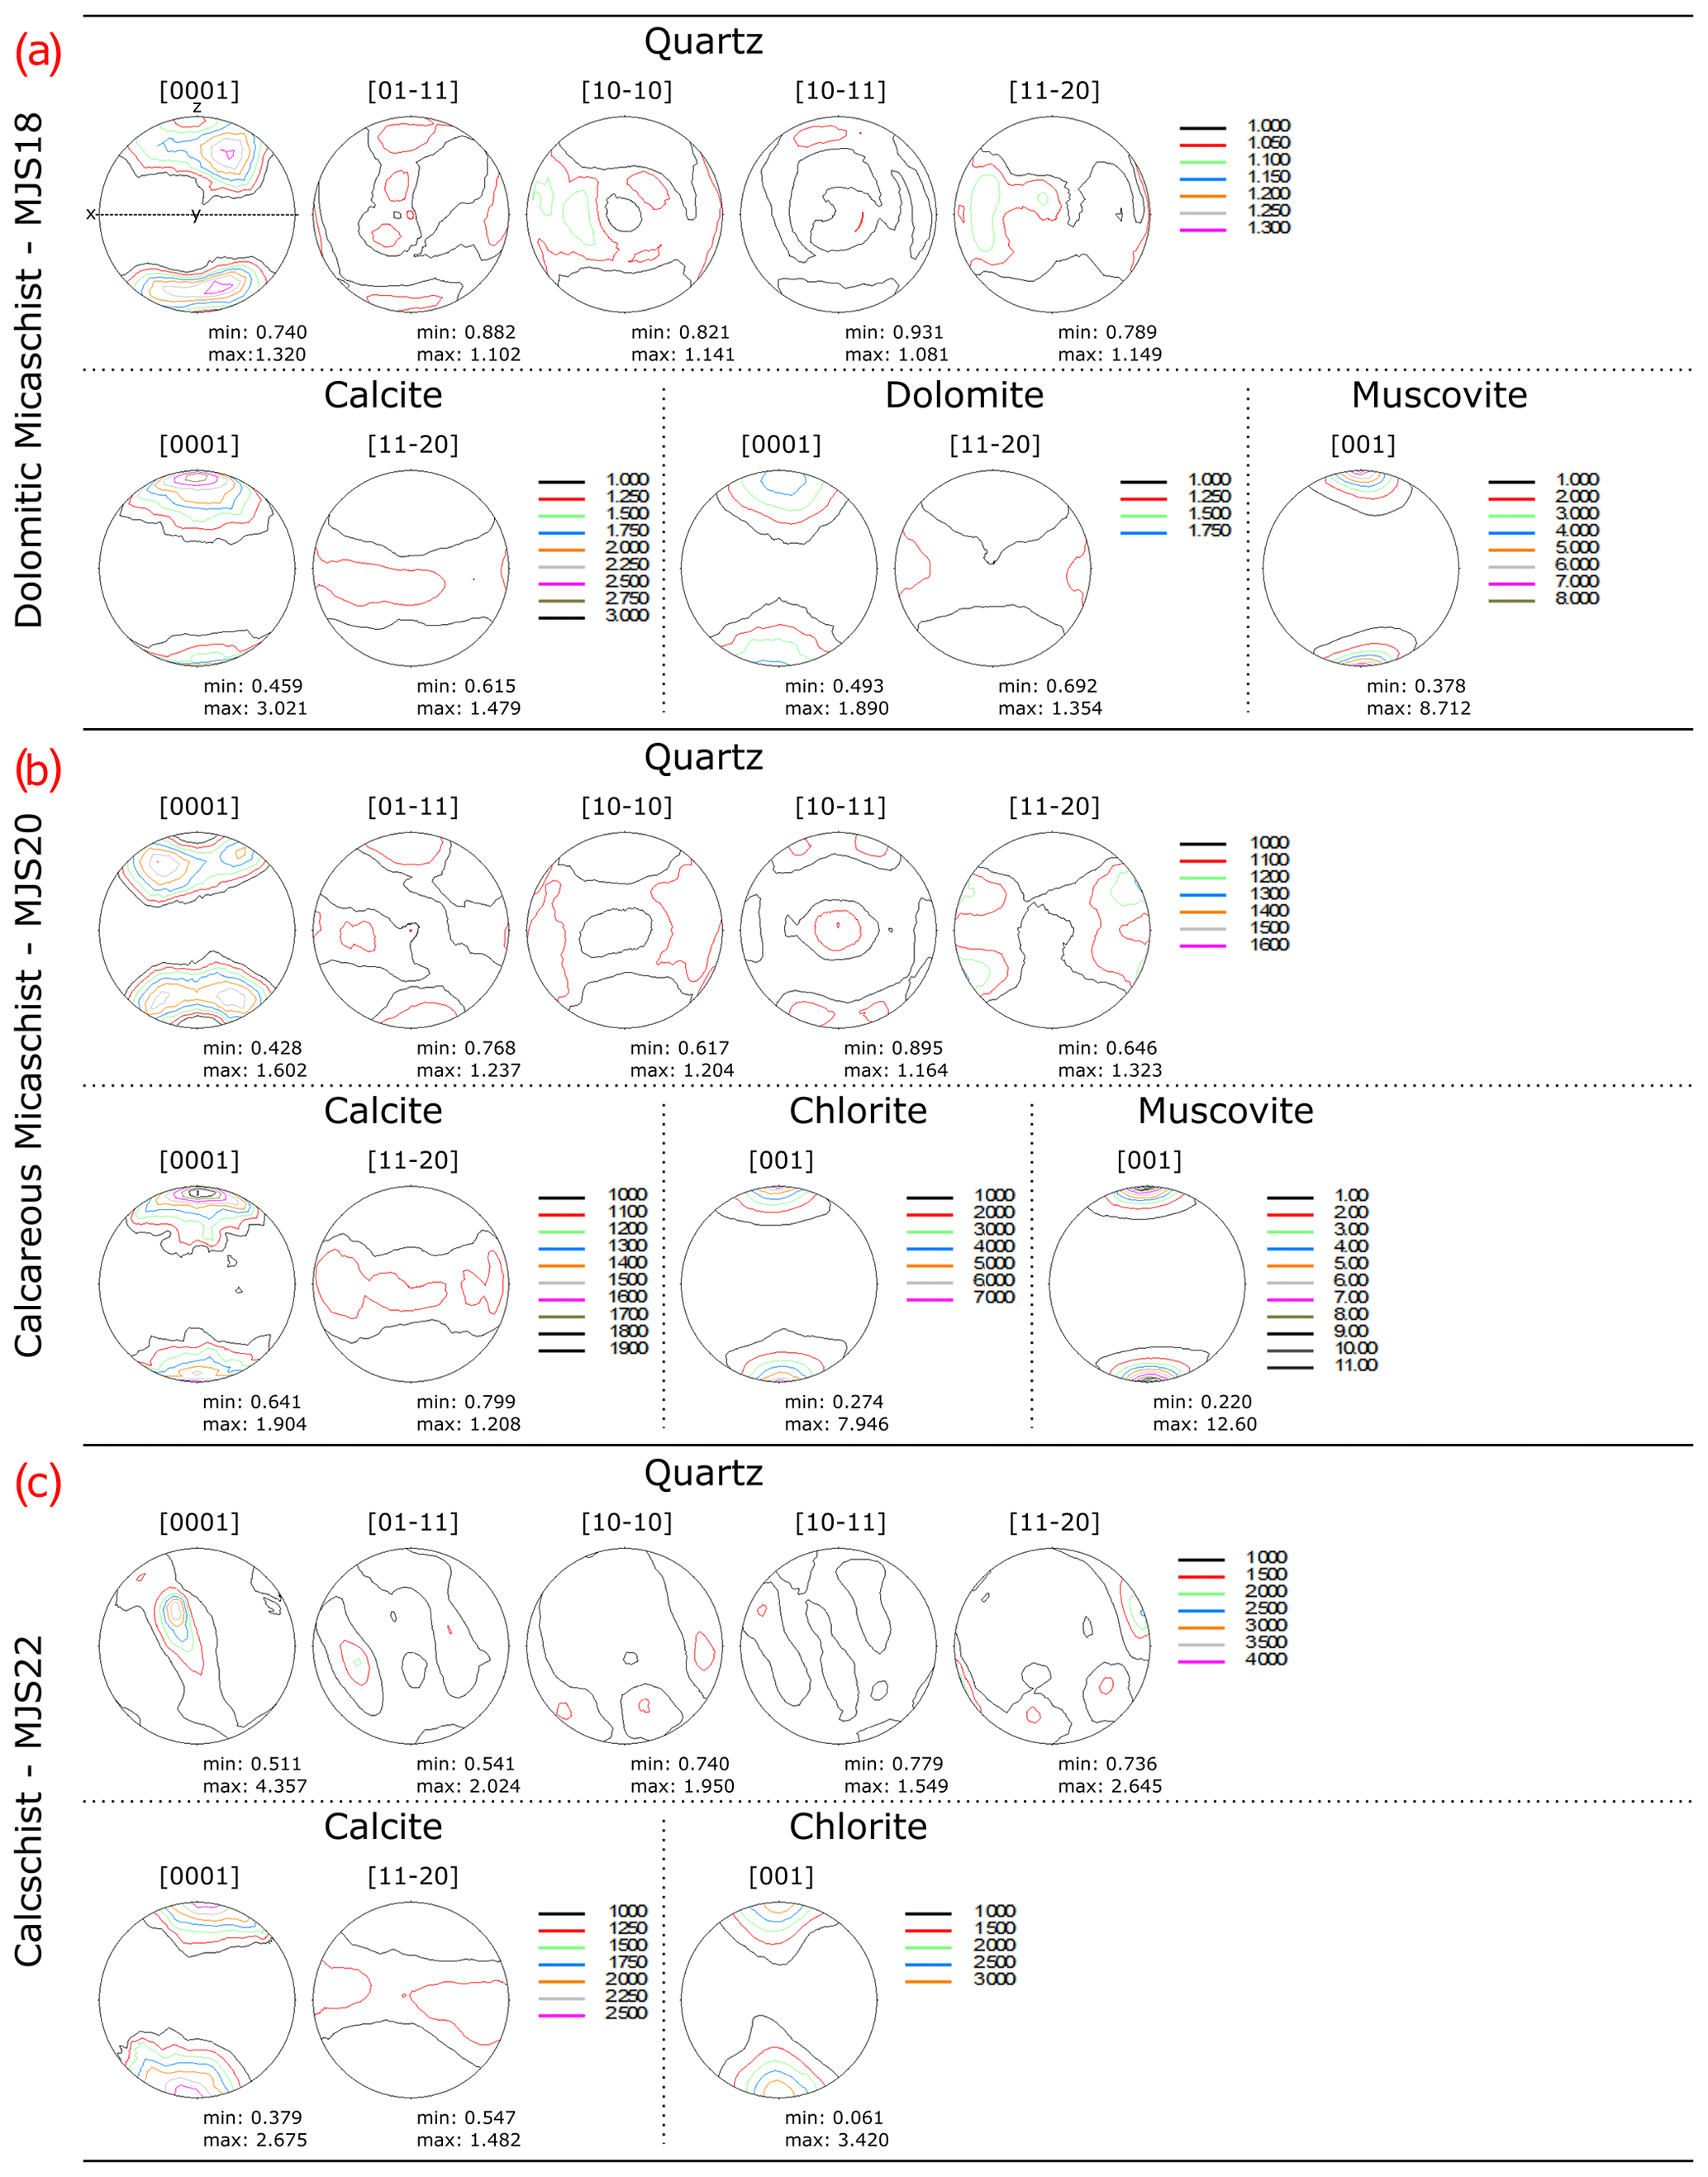
Figure 6Calculated pole figures of important mineral phases in the dolomitic micaschist (a; MJS18), the calcareous micaschist (b; MJS20) and the calcschist (c; MJS22). The stretching lineation (kinematic x direction) is oriented EW in the pole figures, the foliation normal (kinematic z direction) is oriented NS and the kinematic y direction (perpendicular to x and z directions) is normal to the pole figure plane. The pole figures are lower hemisphere equal area projections. The contour levels display multiples of random distribution, and minimum and maximum values are listed below the pole figure.
In the calcareous micaschist (MJS20), muscovite and chlorite show strong textures with F2 indices of 2.83 and 2.17, respectively. Both minerals yield a strong alignment of their basal planes in the foliation (Fig. 6b). Calcite textures are weak, with an F2 index of 1.08. The c axes display a maximum normal to the foliation, and the a axes are concentrated in a girdle in the foliation plane (Fig. 6b). The texture of quartz is of intermediate strength with an F2 index of 1.14. The c axes display small circle distributions around the foliation normal, while the a axes display two maxima at the periphery, each at low angle to the stretching lineation. [01–11] shows one maximum normal to the foliation and a second set of maxima in the foliation plane. [10–10] displays a diffuse maximum nearly parallel to the stretching lineation, while [10–11] displays maxima clustered around the foliation normal and in the foliation plane parallel to the y direction. Garnet shows a random CPO.
In the calcschist MJS22 all mineral phases display medium texture strength (Appendix A). In calcite the F2 index is 1.34. The c axes display a strong maximum parallel to the foliation normal. The a axes are concentrated in the foliation plane with a maximum parallel to the stretching lineation (Fig. 6c). In quartz the textures are stronger than in calcite, with an F2 index of 1.54. The quartz c axes display a weak sinistrally rotated girdle with a strong maximum offset from the kinematic y axis by ca. 30∘. A weaker density cluster is found perpendicular to this girdle. The a axis maximum is located close to the periphery of the pole figure slightly sinistrally rotated away from the x direction. The poles of the prism and rhomb planes display weaker maxima in girdles paralleling the c axis girdle (Fig. 6c). Chlorite has an F2 index of 1.52 and displays a strong alignment of its basal plane in the foliation (Fig. 6c).
5.1.6 Gneiss
In the gneisses (MJS34, MJS35) CPOs are similar to those of the metasediments (Figs. 6 and 7).
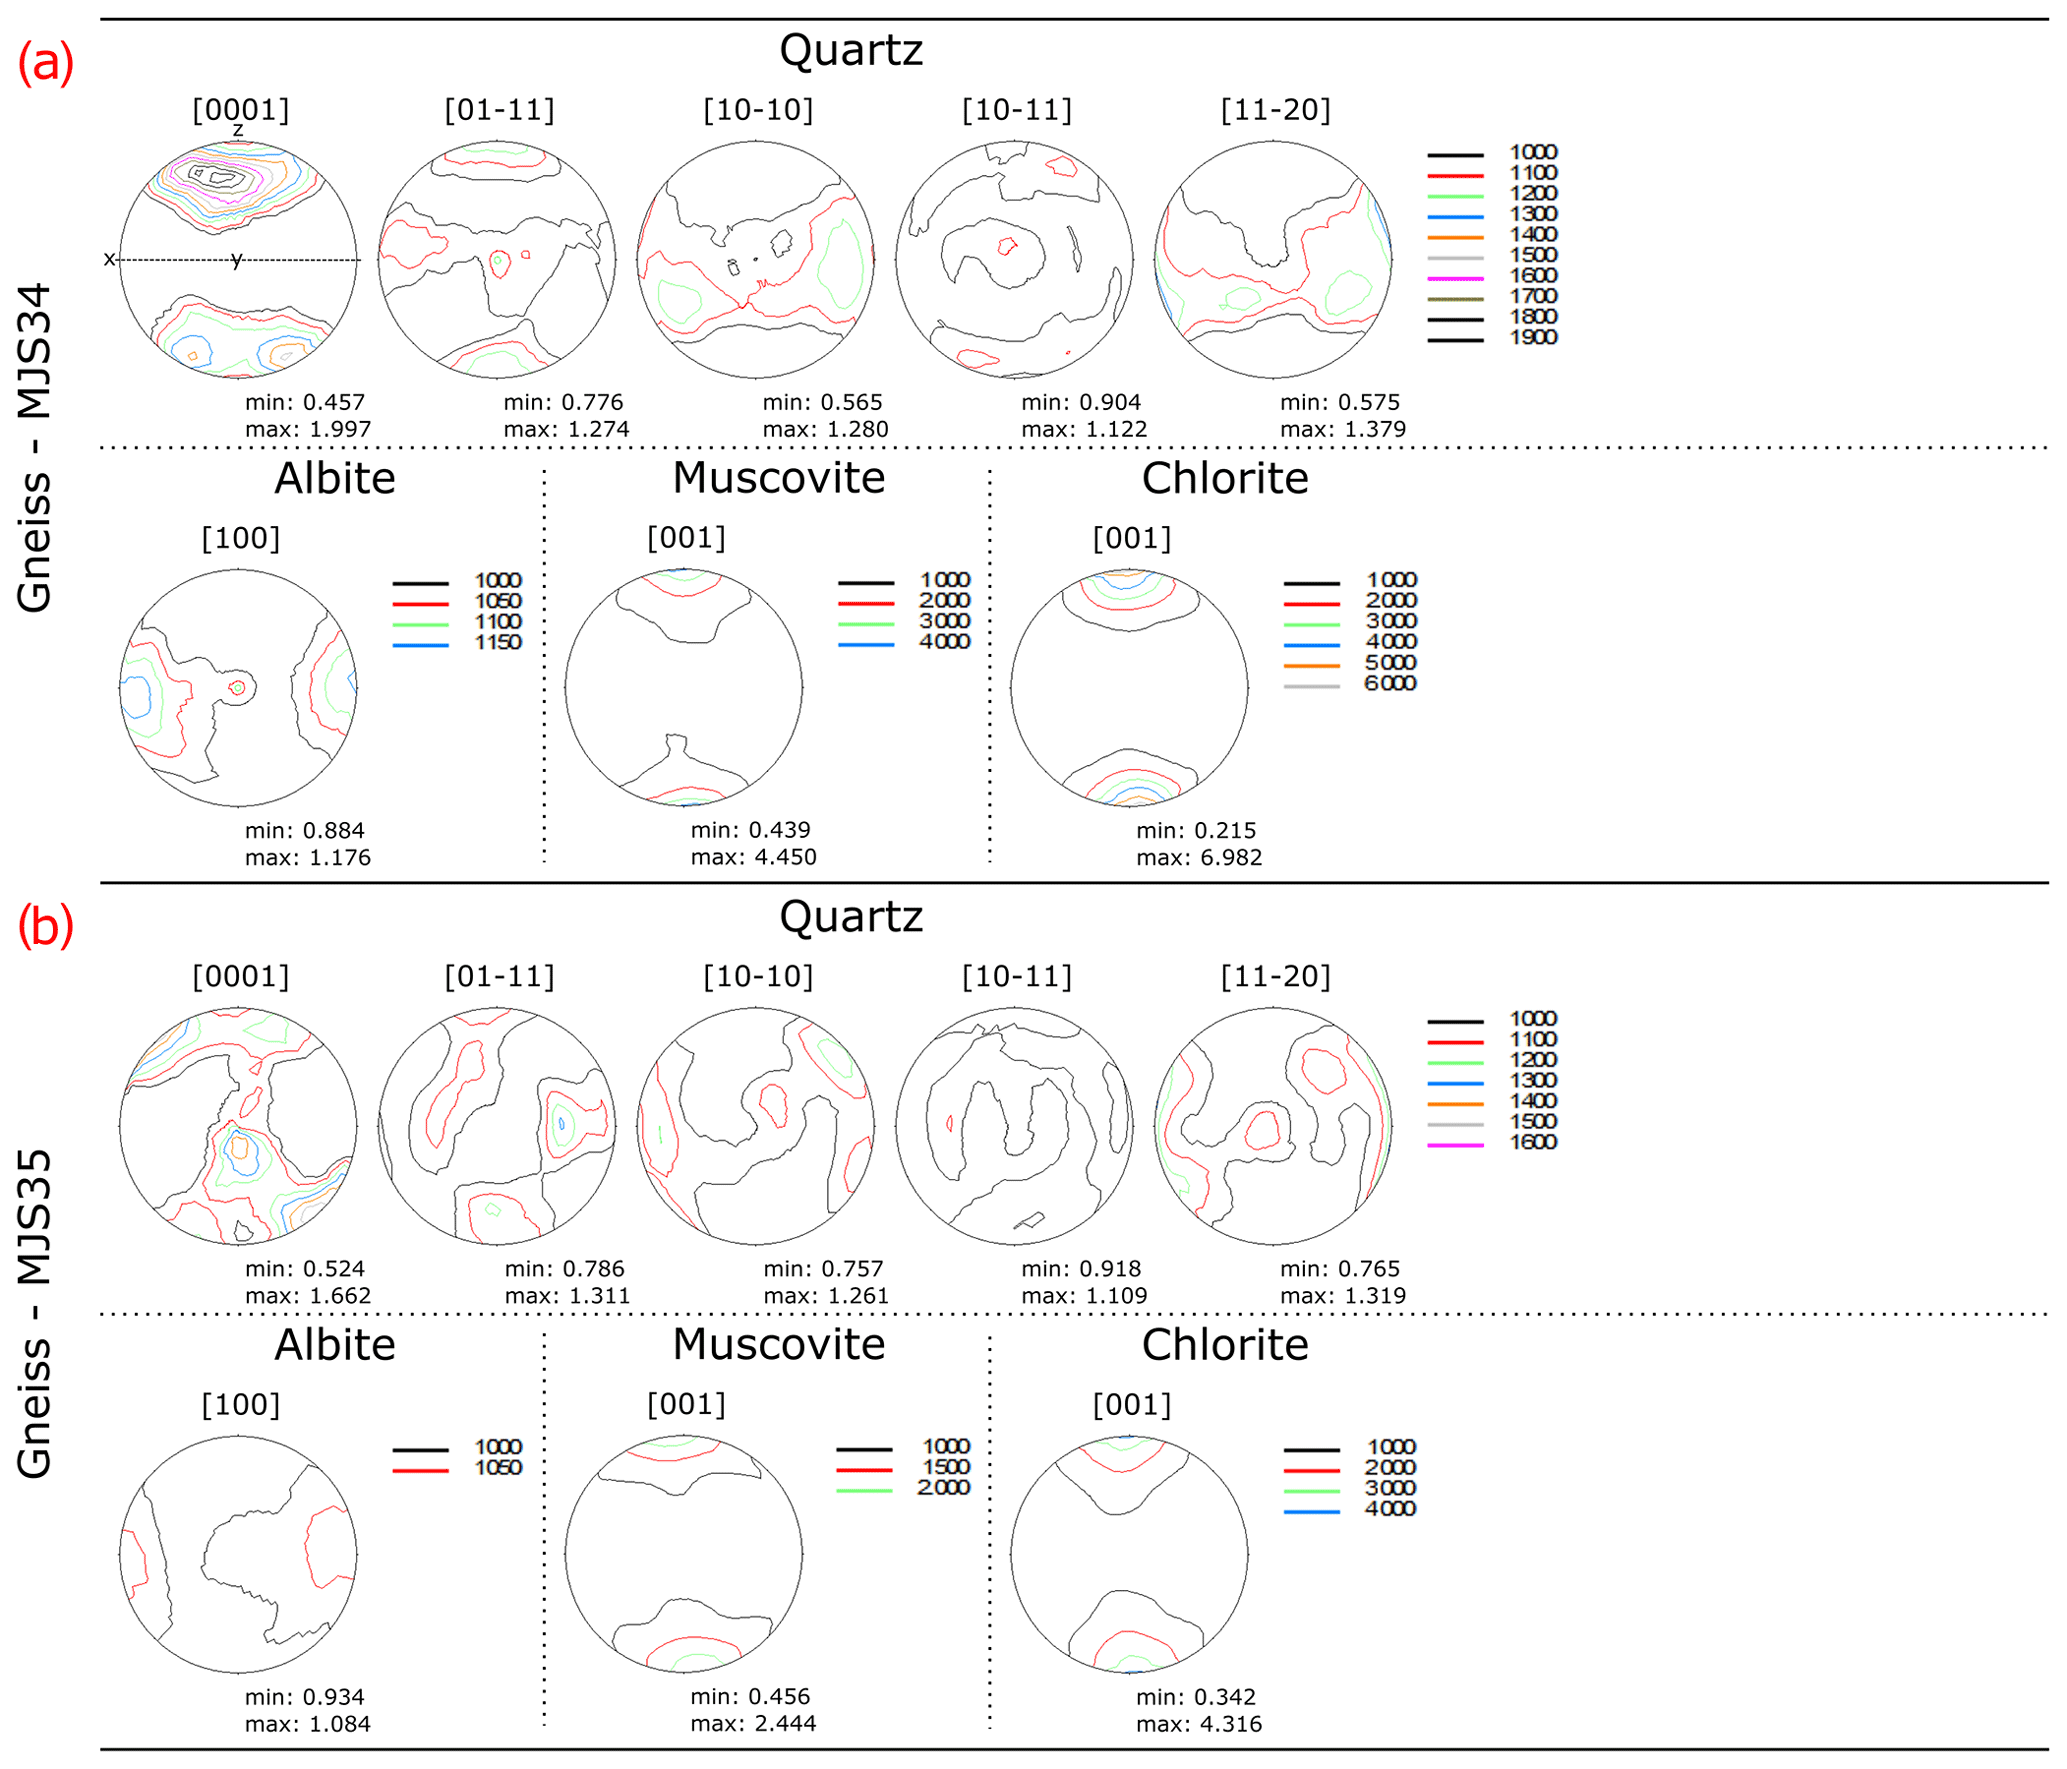
Figure 7Calculated pole figures of important mineral phases in the gneisses (a; MJS34) and (b; MJS35). The stretching lineation (kinematic x direction) is oriented EW in the pole figures, the foliation normal (kinematic z direction) is oriented NS and the kinematic y direction (perpendicular to x and z directions) is normal to the pole figure plane. The pole figures are lower hemisphere equal area projections. The contour levels display multiples of random distribution and minimum and maximum values are listed below the pole figure.
In MJS34 the muscovite and chlorite display basal planes parallel to the foliation plane. The textures are strongest for chlorite with an F2 index of 2.15. Muscovite has an F2 index of 1.27. Quartz shows an F2 index of 1.18 and its c axes are distributed in small circles around the foliation normal. The a axes display a weak and diffuse girdle distribution in the foliation plane. In albite a very weak (F2 index of 1.03) but distinct CPO can be seen. The a axes display a maximum parallel to the stretching lineation (Fig. 7a).
In MJS35 both muscovite and chlorite display clear alignment of the basal planes in the foliation plane. The F2 indices of these two minerals are 1.13 and 1.53, respectively. The CPOs in quartz are weaker (F2 index of 1.06) than those in MJS34. c axes display an asymmetric crossed girdle distribution. The a axes display diffuse intensity clusters at the periphery around the stretching lineation. In albite the CPO is nearly random (F2 index = 1.01), with a faint maximum of the a axes in the lineation direction (Fig. 7b).
5.2 Elastic properties
P-wave anisotropies for the various lithologies were calculated from the ODFs of constituent mineral phases, single-crystal data of the respective phase and their volume fraction within the sample using the software BEARTEX (Wenk et al., 1998). Graphical representations of S-wave velocity distributions are not shown in this study, since the differences between maximum and minimum velocities in a sample are relatively small and deemed insignificant (Table 2).
5.2.1 Eclogite
In the eclogite (MJS17) the average P-wave velocity (VP) is 8.2 km/s and the average S-wave velocity (VS) is 4.8 km/s resulting in a VP VS ratio of 1.72 (Table 2). The AVP is 1.4 %, which is defined by omphacite (30 vol %; Table 1) and glaucophane (10 vol %; Table 1). The fast velocities correlate with the c axis maximum of omphacite as well as of glaucophane parallel to the stretching lineation. The lowest P-wave velocities are found parallel to the foliation normal and intermediate velocities can be found parallel to the kinematic y axis (Figs. 4a and 8a).
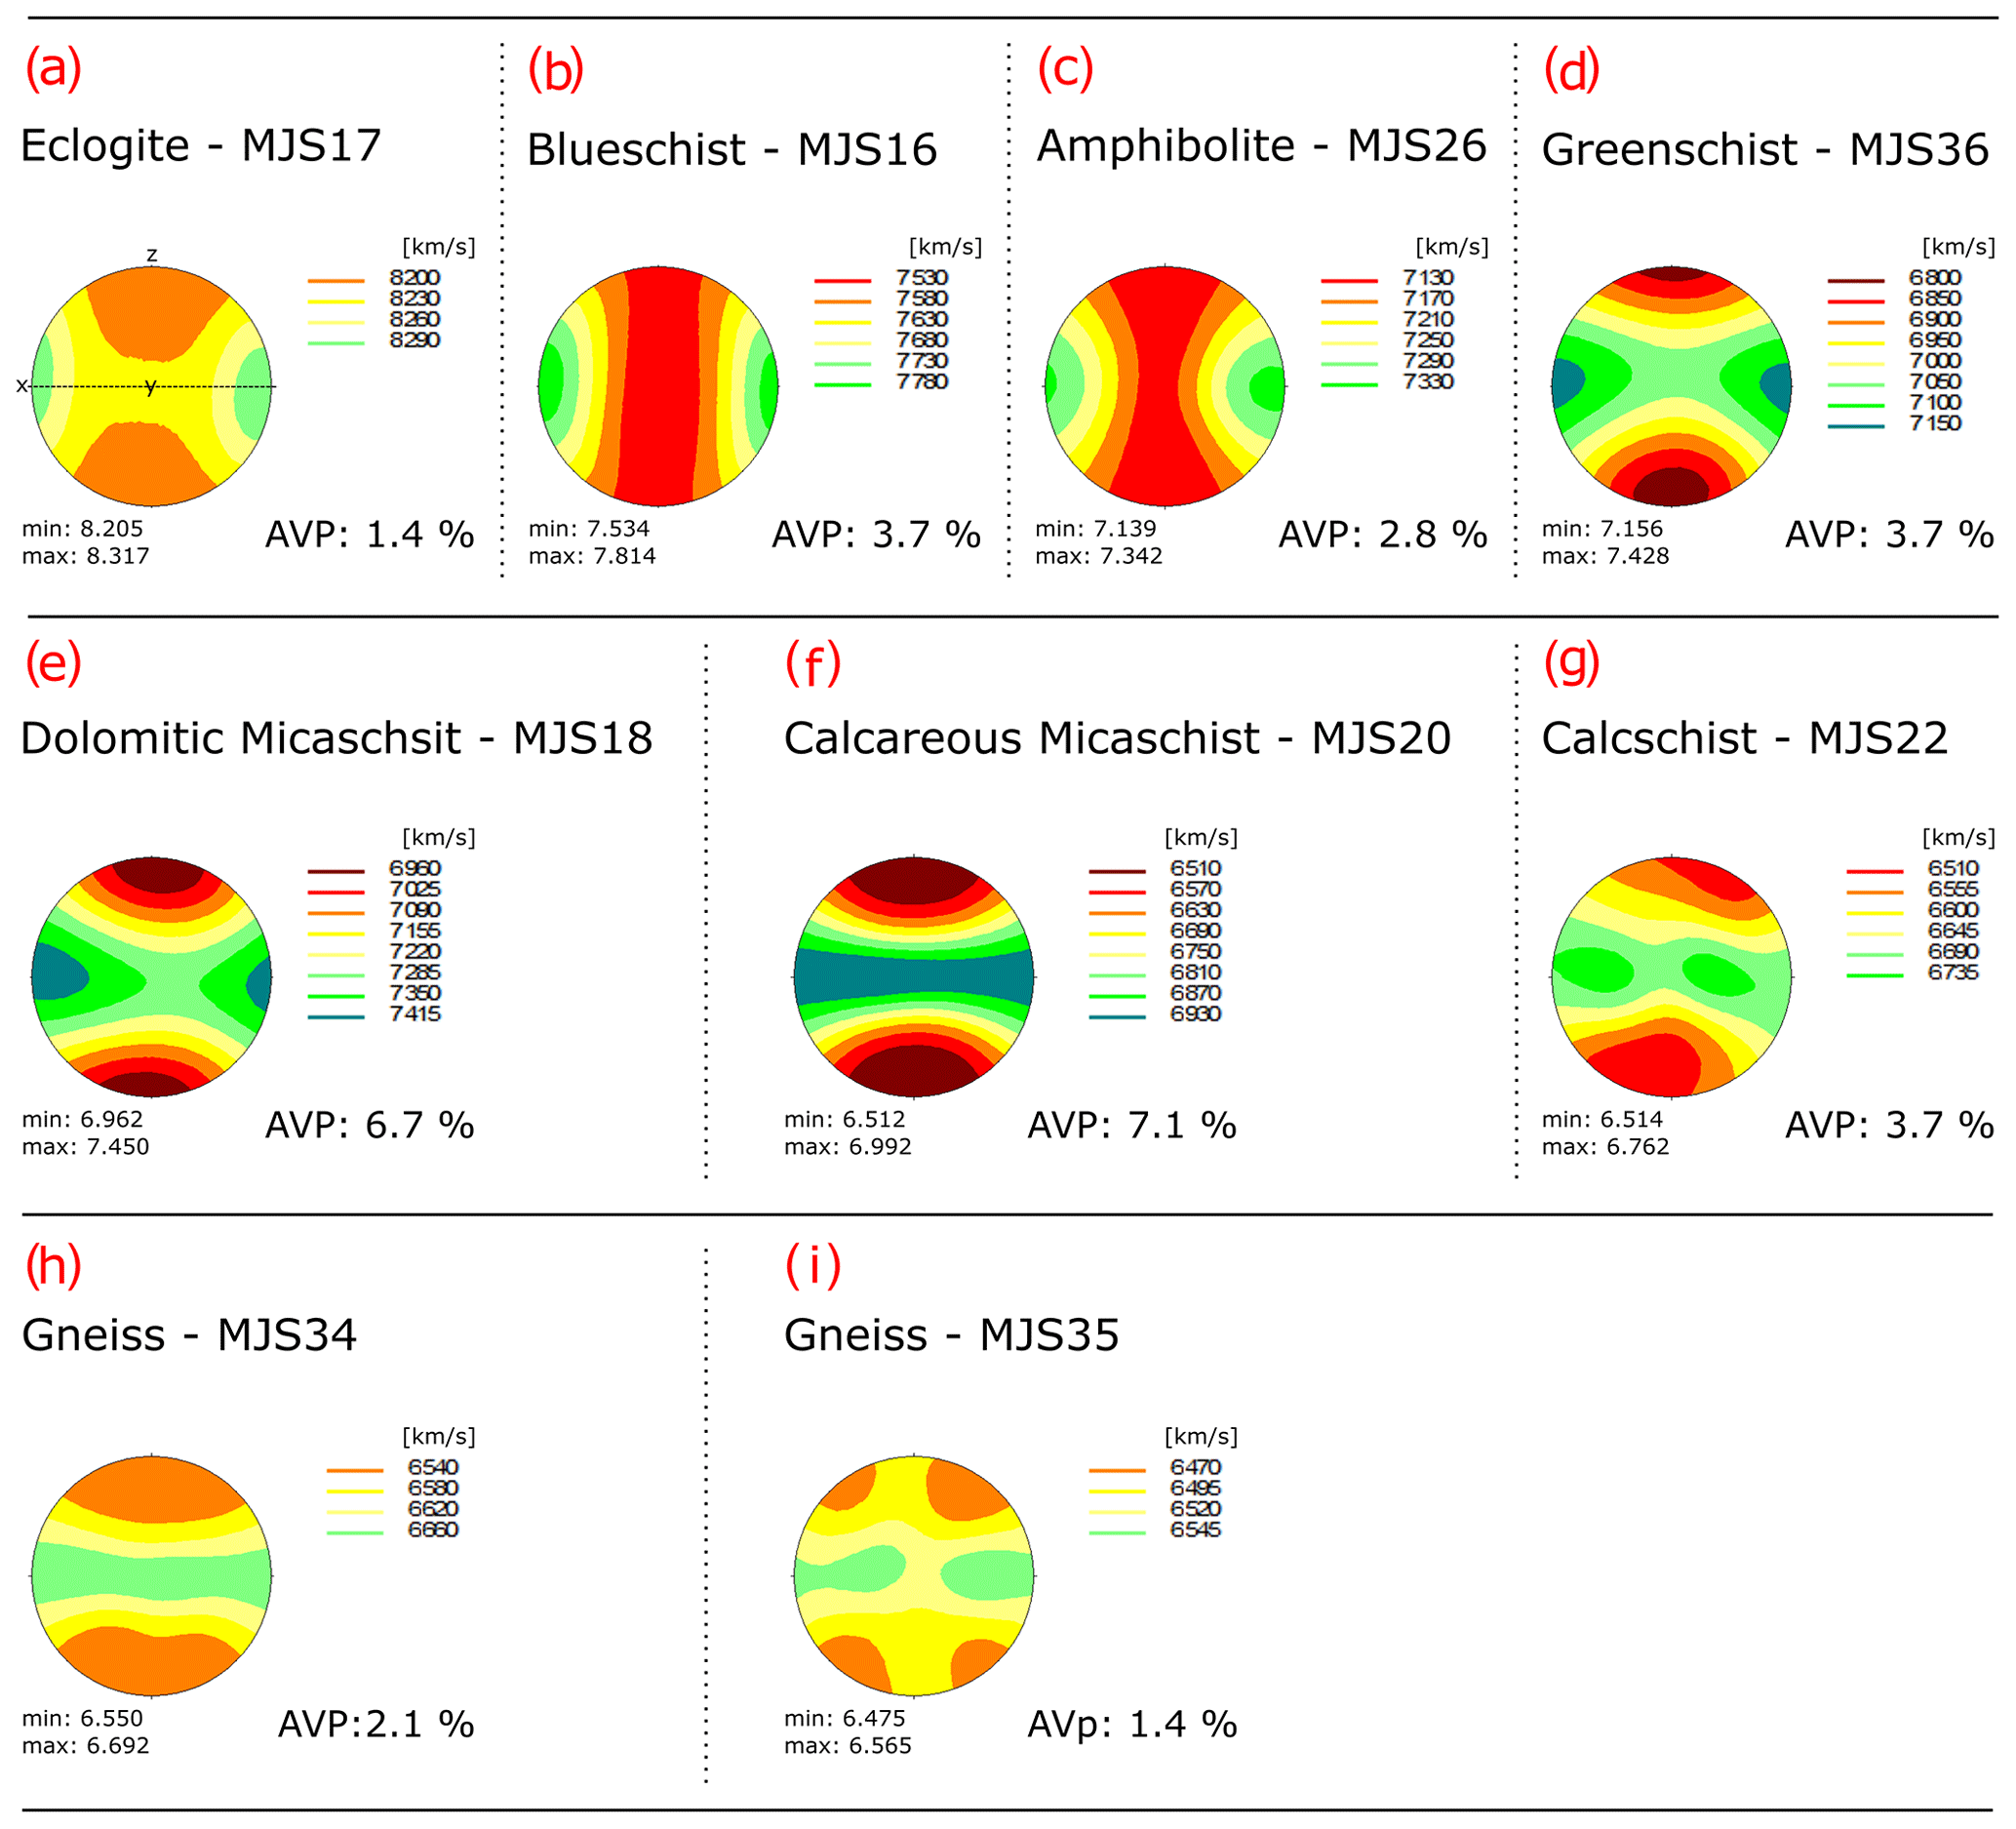
Figure 8Texture-derived calculated P-wave velocity distributions of all samples in the study. All velocities in km/s with maximum and minimum values as well as P-wave anisotropy (in %) given below the pole figure.
5.2.2 Blueschist
In the blueschist the average VP is 7.6 km/s, with a maximum of 7.8 km/s and minimum of 7.5 km/s. The average VS is 4.5 km/s, resulting in a VP VS ratio of 1.71 (Table 2). The P-wave anisotropy is of medium strength with 3.7 % and defined by barroisite (40 vol %, Table 1) and clinozoisite (15 vol %, Table 1). The distribution of the fast velocities matches the orientation of the barroisite c axes and the clinozoisite b axes. Lowest P-wave velocities can be found in a girdle distribution perpendicular to the stretching lineation (Figs. 4b and 8b).
5.2.3 Amphibolite
The amphibolite has an AVP of 2.8 %. The VP range from 7.14 to 7.34 km/s, with an average of 7.20 km/s. The average VS is 4.11 km/s, resulting in a VP VS ratio of 1.75 (Table 2). Maximum VP is aligned parallel to the stretching lineation, with a girdle of low velocities in the kinematic y–z plane, perpendicular to the stretching lineation (Fig. 8c). The maximum velocity correlates well with the c axes of hornblende (40 vol %, Table 1) in the amphibolite (Figs. 5a and 8c).
5.2.4 Greenschist
In the greenschist MJS36, the average VP is 7.30 km/s, with a maximum of 7.43 km/s and a minimum of 7.16 km/s. The average VS is 4.28 km/s, resulting in a VP VS ratio of 1.70. The P-wave anisotropy is high with a value of 3.7 % (Table 2). The highest VP is found in the foliation plane, with a maximum parallel to the stretching lineation. The lowest VP is found parallel to the foliation normal (Fig. 8d). The highest velocities are parallel to the actinolite (20 vol %, Table 1) c axes and distributed similarly to the chlorite (30 vol %, Table 1) basal planes (Figs. 5b and 8d).
5.2.5 Metasediments
The metasedimentary schist samples (MJS18, MJS20 and MJS22) show average VP of 6.66–7.23 km/s and average VS of 4.12–4.16 km/s. The P-wave anisotropies range from 3.7 %–7.1 % and VP VS ratios range from 1.61–1.76 (Fig. 8e–g, Table 2).
In the dolomitic micaschist (MJS18) the average VP of 7.2 km/s is high for a metasedimentary sample. The AVP is 6.7 %. The average VS is 4.1 km/s, resulting in a VP VS ratio of 1.76. Maximum VP is parallel to the stretching lineation, and the lowest VP is found parallel to the foliation normal (Fig. 8e).
In the calcareous micaschist (MJS20) the average velocities are lower than in the previously described sample. The average VP is 6.77 km/s and the average VS is 4.16 km/s, resulting in a VP VS ratio of 1.63. The P-wave anisotropy in the calcareous micaschist is the highest determined in the metasediments at 7.1 %. The highest VP is concentrated in the foliation plane, and the lowest VP is found parallel to the foliation normal (Fig. 8f).
In the calcschist (MJS22) the average VP is 6.66 km/s with an AVP of 3.7 %. The average VS is 4.15 km/s, resulting in a VP VS ratio of 1.61. The highest P-wave velocities are concentrated in a broad girdle parallel to the foliation plane with lowest P-wave velocities perpendicular to it (Figs. 6c and 8g).
5.2.6 Gneiss
In the gneiss samples (MJS34, MJS35) the P-wave anisotropies are relatively low and the velocity distributions show the highest VP in the foliation plane (Fig. 8h–i).
In MJS34 the average VP is 6.62 km/s and the average VS is 4.14 km/s resulting in a VP VS ratio of 1.6 (Table 2). The P-wave anisotropy of 2.1 % is low, and the velocity distribution displays fast velocities in the foliation plane and a minimum velocity perpendicular to it (Fig. 8h).
In MJS35 the average VP is slightly lower than in MJS34 at 6.52 km/s. The average VS is 4.18 km/s, resulting in a VP VS ratio of 1.56. The AVP is 1.4 % (Table 2). Similar to MJS34, the highest velocities are found in the foliation plane. However, instead of the continuous girdle of higher VP in the foliation plane, several distinct maxima occur in the foliation plane, connected by a weak girdle (Fig. 8i).
The elastic anisotropy of rocks is influenced by several factors, including mineral composition, grain fabric, possible microcracks and the CPO of its constituent minerals. The CPO contributes a large part of the anisotropy and mostly results from ductile rock deformation. According to Mainprice and Ildefonse (2009) only mineral phases which make up more than 10 % of the sample have an important influence on the elastic properties of the rock in question. In our calculations we have, however, included all mineral phases down to a volume fraction of 5 %.
6.1 Metabasic rocks
6.1.1 CPO development
In the metabasic rocks of eclogite, blueschist, amphibolite and greenschist-facies metamorphic conditions the compositions are dominated by pyroxenes (omphacite), amphiboles (glaucophane, barroisite, hornblende and actinolite) and chlorite (Table 1).
The CPOs of omphacite, glaucophane, barroisite, actinolite, chlorite and hornblende have a strong effect on the seismic anisotropy of the metabasic rocks. In previous studies, the CPO geometry of omphacite has been interpreted as being the result of corresponding strain geometry (Helmstaedt et al., 1972; Kurz et al., 2004; Neufeld et al., 2008; Müller et al., 2011; Keppler et al., 2016; Zhang and Green, 2007). L-type (lineation dominated) fabrics are interpreted as the result of constrictional strain, S-type (foliation dominated) fabrics as the result of flattening strain and the transitional fabrics as indicators of plain strain deformation (e.g., Helmstaedt et al., 1972; Zhang and Green, 2007). SL- and LS-type fabrics have been described by Godard and Van Roermund (1995). Omphacite in MJS17 displays an L- to LS-type fabric, with c axes parallel to the stretching lineation and a and b axes parallel to the kinematic y and z axes, respectively (Fig. 4). Keppler (2018) suggests that this correlation of strain geometry to CPO geometry found in omphacite is applicable for amphiboles as well. The amphibole CPO in three of the four metabasites (eclogite, blueschist and amphibolite; Figs. 4 and 5) can therefore also be interpreted as L-type or LS-type fabrics, since the c axes are aligned in the lineation direction, while a axes and b axes are closer to a girdle distribution perpendicular to the lineation. In the greenschist the actinolite c axes display a maximum parallel to the stretching lineation with a weak girdle extending into the foliation plane, while the a axes display a maximum perpendicular to the foliation plane (Fig. 5), which points to a transitional SL-type fabric.
Since the omphacite, glaucophane and barroisite c axes are parallel to both the stretching lineation and one another, the assumption can be made that they formed in the same prograde deformation event. A further possibility would be retrograde mimetic overgrowth of omphacite by glaucophane (McNamara et al., 2012). There are considerable debates on timing of CPO formation in eclogites, with proponents of formation during subduction, during exhumation, or both, including concurrent switches in strain geometry (Zulauf, 1997; Kurz et al., 2004; Kurz, 2005; Neufeld et al., 2008; Müller et al., 2011; Keppler et al., 2016; Keppler, 2018). The CPOs of clinozoisite and epidote frequently have similarities to those of omphacite and the amphiboles. The clinozoisite b axes display a maximum paralleling the stretching lineation, matching the omphacite and amphibole c axes. Keppler et al. (2017) suggest concordant CPOs due to opposing crystallographic axis definitions and further conclude that clinozoisite CPOs can likewise be classified in S-type, L-type and intermediate fabrics (Keppler, 2018; Puelles et al., 2017). In this case the CPOs of clinozoisite would suggest L-type fabrics hinting at constrictional strain and matching those already described for omphacite and the amphiboles. Albite preferentially displays weak CPOs in the metabasites. However, in the amphibolite and greenschist the weak albite texture of the b and c axes corresponds to the stretching lineation, while the a axis maximum is aligned nearly normal to the foliation plane (Fig. 5). The slip systems in plagioclase are highly complex, and a correlation with the strain geometry is difficult to infer (Hacker and Christie, 1990; Prior and Wheeler, 1999). When chlorite or white mica are present, they mostly display a strong alignment of the basal planes in the foliation plane. The similarities in the CPOs of chlorite, amphibole and albite in the greenschist suggest a formation during the same deformation, which likely took place during exhumation.
6.1.2 Elastic properties
The seismic anisotropies and the VP distribution in the metabasites are primarily controlled by the influences of omphacite, amphibole and chlorite. These minerals result primarily in low to intermediate AVP (1.4 %–3.7 %, Table 2) and VP distributions with the highest VP parallel to the stretching lineation. In the greenschist, the influence of chlorite is significant, resulting in a girdle-type distribution of higher VP in the foliation plane and a weaker maximum parallel to the stretching lineation.
The composition, AVP and VP distribution are primarily controlled by omphacite and amphibole and secondarily by chlorite, clinozoisite, epidote and garnet. In the amphiboles, the highest P-wave velocities in the single crystals correlate almost perfectly with the c axes, only deviating by a few degrees. Since the c axes of the amphiboles in these metabasites are parallel to the stretching lineation, this results in a velocity maximum in the lineation direction. The influence of omphacite is slightly more complicated, since in the omphacite single crystals the highest velocity is not parallel to the c axis and instead can be found between the c and a axes. This discrepancy has little influence in this case since it also results in a velocity maximum parallel to the stretching lineation, but it should be kept in mind when considering anisotropy strength and distribution. Epidote and clinozoisite CPOs in the blueschist likely contribute to the same pattern of high velocities in the lineation direction. Even though garnet has a near random CPO and does not contribute directly to the anisotropy, the high garnet content in the eclogite sample (30 vol %, Table 1) and the very high P-wave velocities in garnet single crystals increase the average seismic velocities in MJS17. In the blueschist and the amphibolite in which the garnet is only present to 5 %–10 % this effect is negligible. Albite can also influence the bulk anisotropy of the metabasites due to its strong single-crystal velocity anisotropy (Brown et al., 2006, 2016). The highest velocities in albite are parallel to the b and c axes (Brown et al., 2006), both of which display weak maxima parallel to the stretching lineation in the metabasites, further contributing to the high velocities parallel to the stretching lineation (Figs. 4 and 5). In the amphibolite, the chlorite basal planes display a girdle distribution perpendicular to the stretching lineation with a maximum perpendicular to the foliation (Fig. 5). This CPO reflects a rotation of the chlorite basal planes around an axis parallel to the stretching lineation. Due to the lowest velocities in sheet silicates normal to the basal plane, the CPO of chlorite in this sample contributes to the low velocity girdle perpendicular to the stretching lineation. The eclogite contains white mica. However, due to its very low volume fraction of 5 % it is considered insignificant for the bulk anisotropy (Mainprice and Ildefonse, 2009). In the greenschist, chlorite dominates the composition. However, the anisotropy as well as the VP distribution is primarily controlled by actinolite in the sample. Actinolite CPOs in the greenschist display a transitional SL-type fabric, resulting in the highest VP parallel to the stretching lineation and contributing to the weak girdle of slightly higher VP in the foliation plane. In sheet silicates the highest velocities in the single crystals are distributed parallel to the basal planes. The strong alignment of these basal planes in the foliation plane results in higher VP in the foliation plane similar but far weaker than the pattern observed in the metasediments (Figs. 5, 6 and 8d–g). Albite in the greenschist also contributes to this pattern due to the maxima of b axes and c axes within the foliation plane.
When comparing the AVP results to anisotropy data from the literature (Table 3) we find a very wide range of anisotropy values for these lithologies. For the eclogite our data (1.4 %) fit well inside the bounds of the texture-derived AVP data of 0.6 % to 5.0 % by Llana-Fúnez and Brown (2012), 0.4 %–3.7 % by Keppler et al. (2015), 2.9 % by Bezacier et al. (2010), 1.2 %–2.9 % by Bascou et al. (2001), 1.1 %–2.8 % by Worthington et al. (2013), 1.4 %–10.2 % by Cao et al. (2013) and 0.99 %–2.46 % by Cao et al. (2020). In the case of experimentally derived results, our data fit well into the range of 0.6 %–1.7 % reported by Wang et al. (2009), while it is significantly lower than the results of 7 %–11 % reported in Zertani et al. (2019) or the value of 8.3 % from Keppler et al. (2015). Similarly, our data from the amphibolite (A: 2.8 %) are in good agreement with texture-derived data from previous studies on amphibolites. Ivankina et al. (2005) report AVP of 0.59 %–5.51 %, Ullemeyer et al. (2006) of 4.4 %, Keppler et al. (2015) of 2.6 % and Keppler et al. (2021) AVP of 2.1 %–4.5 %. As with the eclogite our texture-derived data are lower than the experimental AVP reported by Siegesmund et al. (1989) with 6.4 %, Barruol and Kern (1996) with 5.69 %–12.74 % and Kästner et al. (2020) with 7.75 %–10.90 %. However, the studies by Ivankina et al. (2005) and Keppler et al. (2015) also report lower experimental AVP of 0.86 %–8.27 % and 4.4 %, respectively. These are quite similar to the data of our study. In the case of the blueschist, our data (AVP: 3.7 %) fit very well into the range of texture-derived data by Fujimoto et al. (2010) with AVP of 1.7 %–6.2 %. However, our value is significantly lower than that presented in other studies. Bezacier et al. (2010) report texture-derived AVP of 16.1 %, Cao et al. (2013) of 13.4 %–24.6 % and Kim et al. (2013) of 7.1 %–29.5 %. There are several possible explanations for the discrepancy to the three later studies. The first of these is that in many studies, blueschist samples are collected from highly deformed bands resulting in stronger anisotropies. In our study, however, a sample with a fabric that is representative for the lithology within the Alps was selected, resulting in weaker overall mineral CPOs and a lower anisotropy. Furthermore, in the two studies mentioned the amphibole in the blueschist was glaucophane, while in the case of the sample in this study it is mostly barroisite. This was addressed in part when calculating the seismic properties of the blueschist since no single-crystal data for barroisite were available so the single-crystal data of glaucophane (Bezacier et al., 2010) were selected as a suitable substitute. However, glaucophane may still react differently to deformation than barroisite, possibly resulting in stronger CPOs leading to higher seismic anisotropies. Finally, few studies are available on the seismic anisotropy of greenschists. Due to the high chlorite content (30 vol %; Table 1), which contains a lot of water, measurements by neutron diffraction are very difficult. Measurements by synchrotron diffraction are possible, but limited to very fine grain sizes. However with an AVP of 3.7 % and an actinolite content of 20 % in the greenschist of this study (Fig. 8d), it can be compared well to the amphibolite MJS26.
Table 3AVP [%], average VP, average VS and VP VS ratios from the literature in comparison to the data from this study.
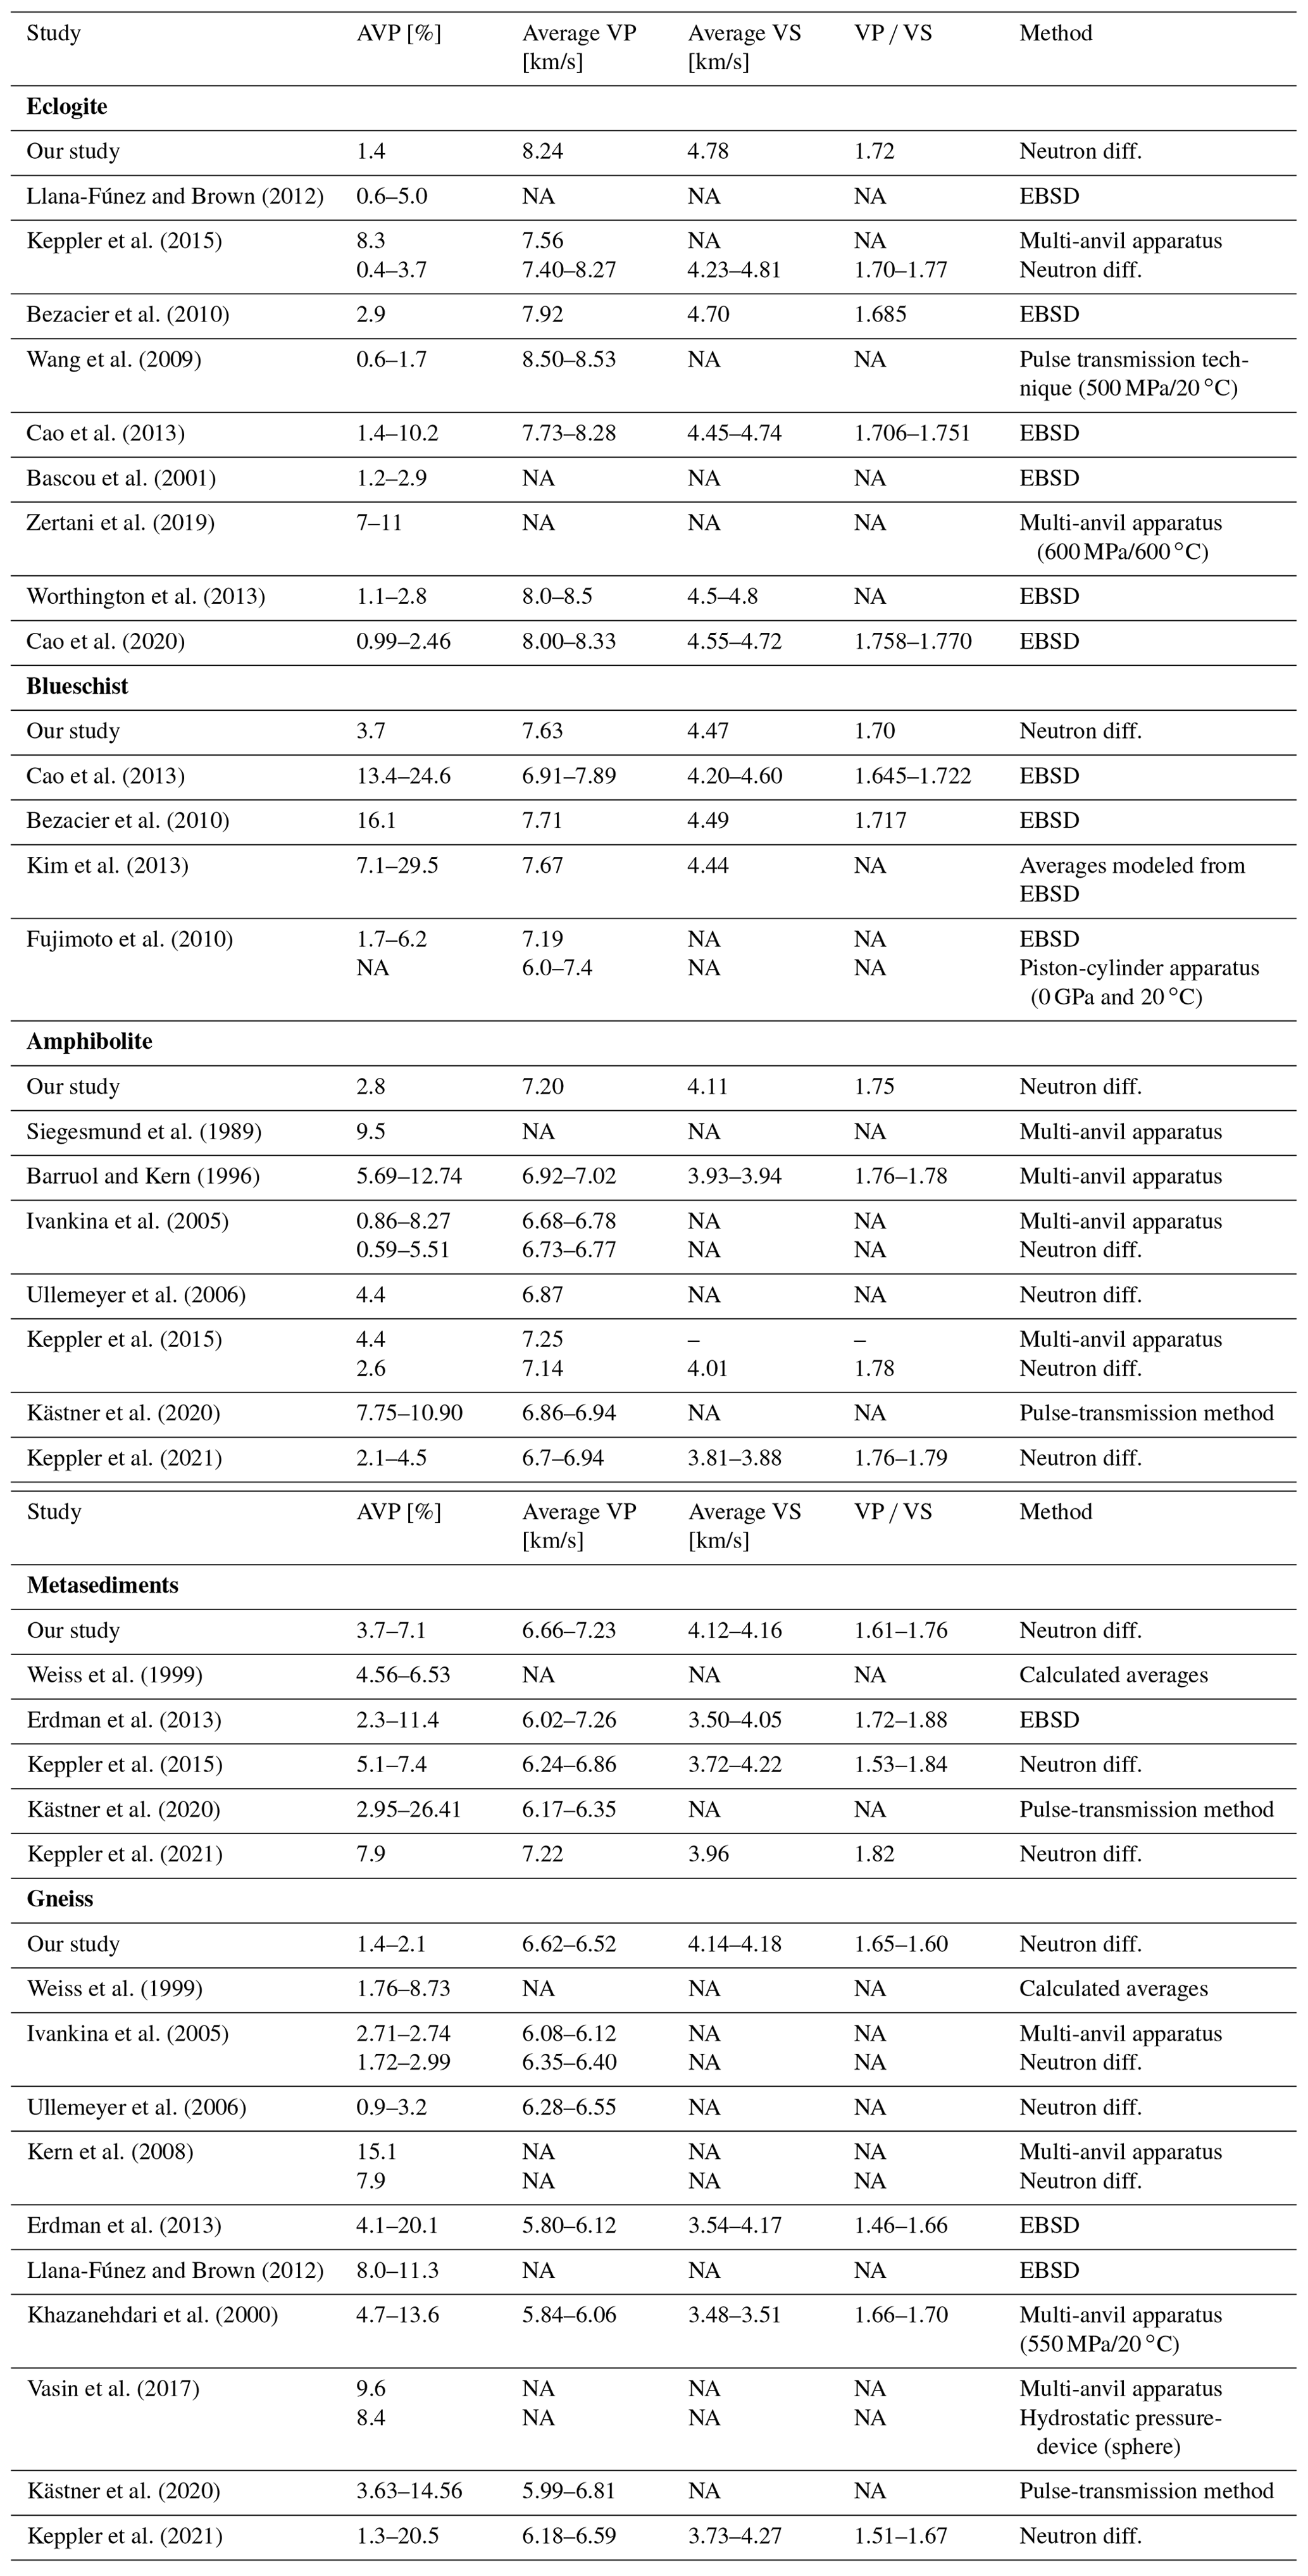
NA: not available.
The VP VS ratios in the metabasites range from 1.70 in the greenschist, 1.71 in the blueschist, over 1.72 in the eclogite and up to 1.75 in the amphibolite. These VP VS ratios are the direct result of the VP VS ratios of their constituent minerals and their respective volume fractions (Table 1). The lower ratios of 1.69 in the glaucophane are balanced out by the slightly higher ratios of pyroxene, garnet, clinozoisite, epidote, chlorite, actinolite and albite whose ratios range between 1.73–1.75. The ratio in the amphibolite is particularly high due to the high hornblende content of 40 vol % (Table 1) with its very high VP VS ratio of 1.84.
6.2 Metasediments
6.2.1 CPO development
The small circles of quartz c axes around the foliation normals of samples MJS18 and MJS20 might indicate flattening strain (Lister and Hobbs, 1980; Schmid and Casey, 1986) (Fig. 6). This is also supported by the distribution of quartz a axes, but the textures are quite weak. The c axis pole figures of MJS18 and MJS20 are indicative of basal 〈a〉 slip and rhomb 〈a〉 slip in quartz (cf. Schmid and Casey, 1986) (Fig. 6). In MJS22 the quartz c axes display an inclined single girdle pointing to simple shear. This distribution is also reflected by the quartz a axes, prism and rhomb planes and indicative of multi-slip activity, possibly a combination of rhomb 〈a〉 slip, prism 〈a〉 slip and perhaps some basal 〈a〉 slip (e.g., Schmid and Casey, 1986; Stipp et al., 2002) (Fig. 6). In all metasediments the basal planes of white mica and chlorite display a strong alignment in the foliation plane. In all three metasedimentary samples the CPOs of calcite c and a axes exhibit axial symmetry with respect to the foliation normal as a symmetry axis (Fig. 6). This symmetry in calcite was first interpreted as indicative of pure shear deformation (Wenk et al., 1987; Kern and Wenk, 1983). However, more recently, there was considerable debate on this topic (De Bresser, 1989; Ratschbacher et al., 1991; Erskine et al., 1993; Burlini et al., 1998; Leiss et al., 1999; Bestmann et al., 2000). The maximum of the calcite a axes can either be parallel to the stretching lineation or to the kinematic y axis or even display multiple maxima between the two (Ratschbacher et al., 1991; Puntero et al., 2005; Bestmann et al., 2000, 2006; Trullenque et al., 2006). Few studies have focused on dolomite CPOs. Delle Piane et al. (2009) show that dolomite CPOs very closely reflect those of calcite, but deformation itself strongly influences the texture development when both phases deform together. Dolomite in MJS18 displays very similar CPOs to calcite, with the same axial symmetry in the c and a axes (Fig. 6).
6.2.2 Elastic properties
The AVP of the metasediments (MJS18, MJS20 and MJS22) range from 3.7 %–7.1 % and are among the highest presented in this study (Fig. 8e–g, Table 2). These anisotropies directly correlate to the pronounced foliation and high mica and chlorite contents found in the metasediments, as well as the strong influence of calcite and dolomite CPOs on the samples. This corresponds well to texture-derived AVP data from similar metasediments reported in other studies (see overview in Table 3) such as Weiss et al. (1999) with 4.56 %–6.53 %, Erdman et al. (2013) with 2.3 %–11.4 %, Keppler et al. (2015) with 5.1 %–7.4 % and Keppler et al. (2021) with 7.9 %. Our data fall into the range of experimental AVP reported by Kästner et al. (2020) with an AVP of 2.95 %–26.41 %.
In our study, the orientation of white mica and chlorite (10 vol %–40 vol %) basal planes and the very high single-crystal anisotropy of white mica, which is used for both sheet silicates, mainly contribute to the seismic anisotropy in the metasediments. The VP distribution in muscovite single crystals is dominated by the highest velocity parallel to and the lowest velocity normal to the basal plane (Figs. 6 and 8e–g). As micas preferentially align with increasing strain in the foliation, the result is a strong tendency for high P-wave velocities in the foliation plane in deformed mica-rich rocks.
The composition of the metasediments varies substantially. Calcite and dolomite combined range from 15 up to 70 vol % (Table 1). The CPOs of both minerals strongly influence the P-wave anisotropy of the metasediments. They result in high velocities in the foliation plane with a maximum parallel to the stretching lineation. Further they contribute to the velocity minima normal to the foliation plane. This is the result of the calcite single-crystal data in which the c and a axes are the slow and fast directions, respectively (Puntero et al., 2005). The single-crystal anisotropy of dolomite is quite similar to that of calcite. Hence, both similarly contribute to the bulk anisotropy of sample MJS18. The contribution of quartz to the P-wave anisotropy is weak due to the nearly random CPO observed for the poles of the rhombs, which represent the fastest direction in the quartz crystal. Furthermore, the three-fold symmetry of the quartz single crystal makes any influence on the velocity distribution complicated to assess. The garnet present in MJS20 displays a random texture and therewith has no significant influence on the seismic anisotropy.
The VP VS ratios in the metasediments range from 1.61 to 1.76. The highest ratio is found in sample MJS18 at 1.76, while the ratios of the other two samples range from 1.61–1.63. The high ratio of MJS18 is the result of the very high dolomite content of 60 vol % and the 10 vol % of calcite in this sample. Dolomite and calcite have very high single-crystal VP VS ratios of 1.851 and 1.922, respectively. They are significantly higher than those of quartz (20 vol %) and white mica (10 vol %) at 1.476 and 1.726. For the other two samples the velocity ratio is dominated by quartz (40 vol %–55 vol %), resulting in their low ratios of 1.61 to 1.63.
6.3 Gneiss
6.3.1 CPO development
The small circles around the foliation normal, visible in the quartz c axes, and the distribution of a axes of MJS34 indicate flattening strain with combined activity of rhomb 〈a〉 slip and basal 〈a〉 slip (Lister and Hobbs, 1980; Schmid and Casey, 1986) (Fig. 7). In MJS35, the type I crossed girdle in the quartz c axes is indicative of plane strain with combined basal 〈a〉, rhomb 〈a〉 slip and prism 〈a〉 slip (e.g., Schmid and Casey, 1986). White mica and chlorite CPO in both MJS34 and MJS35 bear a strong relation to the foliation plane (Fig. 7). Albite in MJS34 and MJS35 shows very weak CPOs, but albite a axes in both display a weak but visible maximum parallel to the stretching lineation (Fig. 7). Due to the random distribution of the b axes and c axes a clear assignment cannot be made; however, this CPO pattern is closest to an axial A type, indicating that the activated plagioclase slip system is [100](010) and/or [100](001) (Satsukawa et al., 2013).
6.3.2 Elastic properties
The AVP in the gneiss MJS34 is primarily constrained by the CPOs of mica and chlorite (25 vol %, Table 1) while in the gneiss MJS35 it is primarily constrained by quartz. In MJS34 the strong single-crystal anisotropy of muscovite and chlorite in combination with their strong CPO results in the high velocities found in the foliation plane and the corresponding perpendicular velocity minima (Figs. 7 and 8h). In MJS35, the effect of the sheet silicates is far weaker and only results in a weak girdle of higher VP in the foliation plane. However, the three-fold symmetry of quartz likely results in the distinct VP maxima visible in the foliation plane. The VP VS ratio of the gneiss samples ranges from 1.56 to 1.60 (Table 2). As in the metasediments this low ratio is the result of the very low ratio of 1.48 in quartz (40 vol % and 60 vol % respectively) and the intermediate ratios in albite (1.73) and the sheet silicates (1.73 and 1.72; 25 vol %) in the samples (Table 1). The velocity distribution is similar to that of the metasediments, with higher velocities in the foliation plane and low velocities perpendicular to this plane (Fig. 8h–i), but the AVP in both samples is significantly lower. When comparing the results of our study to those previously published (Table 3), we see a very wide range of P-wave anisotropy data by different methods reported in gneisses. Texture-derived AVP range from low to intermediate values such as 1.76 %–8.73 % by Weiss et al. (1999), 1.72 %–2.99 % by Ivankina et al. (2005), 0.9 %–3.2 % by Ullemeyer et al. (2006) and 7.9 % by Kern et al. (2008), up to high to very high values such as 4.1 %–20.1 % by Erdman et al. (2013), 8.0 %–11.3 % by Llana-Fúnez and Brown (2012) and 1.3 %–20.5 % by Keppler et al. (2021). Experimental studies equally display a very wide range of AVP for gneisses. AVP of 2.71 %–2.74 % by Ivankina et al. (2005), 15.1 by Kern et al. (2008), 4.7 %–13.6 % by Khazanehdari et al. (2000) 9.6 % by Vasin et al. (2017) and 3.63 %–14.56 % by Kästner et al. (2020) are reported. As gneisses predominantly display weak CPOs similar to our results, our low AVP values are common for gneisses.
6.4 Elastic anisotropy data in the context of a subduction and exhumation setting
In this study we examine the seismic properties of a wide array of lithologies in a subduction and exhumation setting. As previously mentioned and is visible in Fig. 2, we have divided this setting into several structural positions. These are the oceanic crust of the subducting plate undergoing different metamorphic facies, the sedimentary cover of the subducting plate (which is at least partly scraped off and transferred into the accretionary prism) and finally the deformed continental crust. This continental crust can be part of a microcontinent (as in the case of the Dent Blanche unit) or can be the continental crust on the opposite side of the ocean, which enters the subduction zone subsequently to the oceanic crust leading to continental collision. This scenario is presented in the schematic cross section in Fig. 2. The structural positions vary in a range of criteria such as degree of deformation and mineral composition. The different degrees of deformation and metamorphism lead to different texture strengths and variable mineral content. When comparing the different structural positions, samples can be related in order of SiO2 content, with quartz- and feldspar-rich felsic rocks on one end of the spectrum, and the olivine-rich ultramafic rocks on the opposite end of the spectrum. This has been discussed extensively by Almqvist and Mainprice (2017) for the Earth's crust. Generally, a trend of lower velocities in the felsic and higher velocities in the mafic to ultramafic rocks can be observed. In this study, we further discuss another important criterion for the seismic properties, which is the influence of CPO of the constituent minerals on the seismic anisotropy. This might differ from the compositional effect in the spectrum from felsic to mafic to ultramafic. Concerning seismic anisotropy, the sheet-silicate content and its alignment caused by deformation show a pronounced influence.
During the prograde metamorphism in subduction zones the basaltic oceanic crust undergoes blueschist-facies metamorphism leading to the formation of glaucophane (in some cases barroisite), epidote, omphacite and some accessory minerals. Glaucophane and feldspar usually dominate the composition, of which glaucophane greatly influences the anisotropy and the velocity distribution. Blueschists display strongly varying AVP of 1.7 %–24.6 % (Cao et al., 2013; Bezacier et al., 2010; Kim et al., 2013; Fujimoto et al., 2010). The deformation during subduction leads to CPO formation in amphibole. In most cases plane strain is dominant. The orientation of the c axes of amphibole parallel to the stretching lineation results in the highest velocity parallel to the lineation. Dominant constriction in the blueschist of the present study produces a similar pattern (see Figs. 4 and 8b). At greater depth the oceanic crust reaches eclogite-facies metamorphic conditions. There, omphacite and garnet are the major rock-forming minerals (Table 1), and omphacite has the strongest contribution to the seismic anisotropy. The AVP in eclogites are lower than those in the blueschists and display values of 0.4 %–11 %, due to the higher AVP of amphiboles compared to pyroxenes (Llana-Fúnez and Brown, 2012; Keppler et al., 2015; Cao et al., 2013; Bezacier et al., 2010; Wang et al., 2009; Bascou et al., 2001; Zertani et al., 2019; Worthington et al., 2013; Cao et al., 2020). The highest P-wave velocities remain parallel to the stretching lineation, because the omphacite CPO yields an alignment of [001] in the lineation direction during plane strain and constriction (see Figs. 4 and 8b). Especially strongly deformed eclogites could be detected by seismic imaging due to their composition and their CPO-related specific seismic properties (e.g., Boundy et al., 1992; Fountain et al., 1994).
During exhumation the high-pressure rocks frequently experience retrogression as they pass through the amphibolite facies, where they are overprinted or completely retrogressed. In the amphibolite-facies rocks, hornblende together with feldspar and epidote dominates the composition. These minerals result in anisotropies of 0.59 %–12.74 % (Siegesmund et al., 1989; Ivankina et al., 2005; Ullemeyer et al., 2006; Keppler et al., 2015; Barruol and Kern, 1996; Kästner et al., 2020; Keppler et al., 2021), of which the amphiboles have the strongest influence. The velocity distribution in the amphibolites is very similar to those observed in the blueschists and eclogites, with highest velocities found parallel to the stretching lineation (Fig. 8c). Further along the exhumation path, the rocks enter greenschist-facies conditions, where further retrogression is possible. In the greenschist facies, chlorite is formed and, together with actinolite, epidote and feldspar, makes up the greenschists. Chlorite and actinolite result in intermediate AVP of 3.7 %, presented in this study. The velocity distribution displays the highest VP parallel to the stretching lineation slightly extending into the foliation plane caused by chlorite. Very few studies have been carried out on the seismic properties of greenschists, and further research is necessary to better constrain this lithology.
In the overlying metasediments VP anisotropies display values of 2.3 %–26.41 % (Erdman et al., 2013; Keppler et al., 2015; Weiss et al., 1999; Kästner et al., 2020; Keppler et al., 2021). The composition of these metasediments in the present study is highly variable. However, quartz, feldspar, mica, chlorite, calcite and dolomite are the most abundant mineral phases and control the seismic properties. The velocity distribution shows the highest velocities in the foliation plane with a velocity-minimum normal to it, as seen in the greenschists, due to the high content in sheet silicates as well as of calcite and dolomite.
In the deformed continental crust the composition is dominated by feldspar, quartz, mica and chlorite, represented by the gneisses in this study. In the gneisses the AVP are similar to those observed in the metasediments, with values of 0.9 %–20.5 % (Ivankina et al., 2005; Ullemeyer et al., 2006; Erdman et al., 2013; Llana-Fúnez and Brown, 2012; Kern et al., 2008; Weiss et al., 1999; Vasin et al., 2017; Khazanehdari et al., 2000; Kästner et al., 2020; Keppler et al., 2021) even though our samples are at the lower end of this range. The velocity distribution of the gneisses displays highest velocities in a girdle in the foliation plane, similar to the metasediments. This results from the high sheet silicate contents of this lithology (Fig. 8h–i). In both the metasediments and the gneisses the metamorphic facies does not change the elastic properties beyond the greenschist facies up to HP conditions, since the single-crystal anisotropies in most of the constituent minerals are constant at higher metamorphic conditions (e.g., quartz, feldspar, calcite and dolomite). Mica shows changes in chemistry with rising pressures, and quartz is replaced by coesite at UHP conditions, but due to limited single-crystal anisotropy data of these minerals their influence cannot be determined.
With these structural positions and their characteristic elastic properties in mind, a better interpretation of seismic data is feasible. Lower VP VS ratios with high elastic anisotropies hint at felsic compositions and high sheet silicate content, while the higher VP VS ratios and overall lower to intermediate AVP indicate more mafic lithologies (Almqvist and Mainprice, 2017). In the mafic rocks a dominance of high velocities parallel to the stretching lineation can be observed. In comparison, the metasediments and gneisses display a distinctly different velocity distribution with the highest velocities in the foliation plane. The knowledge of the characteristic properties of the different structural positions can better help to identify thickness and boundaries of the predominantly mafic to ultramafic subducting plate. It might also allow the anatomy of subduction channels to be better constrained.

Figure 9AVP [%] and VP VS ratios of all samples from this study, divided into the three categories of metabasic rocks, metasediment and gneisses.
6.5 Common issues for the calculation and application of seismic properties
Precise single-crystal data are not available for all mineral phases, but our fitting represents a good approximation. Firstly, the selected substitute minerals are very similar to those in the samples, especially with respect to their crystallography. Secondly, the goal of our models is not to simulate specific rock samples, but the rock types that are representative of distinct sections of the subduction and exhumation cycle. Hence, for the missing mineral phases substitute single-crystal data were selected, which we considered to be acceptable matches due to the metamorphic and petrological context they can be found in. As mentioned above, this was done for clinozoisite, for which we selected the single-crystal data of epidote (Aleksandrov et al., 1974). Furthermore, the almandine garnet single-crystal data of Zhang et al. (2008) were used for all garnet-bearing samples, even if different garnet compositions were present in the samples. A similar simplification was made for the amphiboles. In samples with glaucophane or barroisite, we used glaucophane single-crystal data by Bezacier et al. (2010).
Throughout this study the Voigt averaging scheme was used. This model is based on the “equal strain” assumption and represents the upper bound for the stiffness of a polycrystalline material. As a result, the velocities presented are maximum velocities. This does not correspond to the “equal stress” assumption of the Reuss model that represents the lower stiffness boundary. Hence, the use of the Voigt method should be kept in mind for the interpretation of the calculated P-wave velocity distributions. Neither method takes grain shape, layering, microcracks, fractures or pores into account. A study by Cyprych et al. (2017) showed that particularly in rocks with weak textures, the microstructural arrangement of minerals can influence the anisotropy. There are methods such as the self-consistent method GeoMIXself (GMS) by Matthies (2010, 2012) or the ESP toolbox of Vel et al. (2016) which take CPOs, morphologies and SPOs of the mineral grains into account. However, only based on CPO data the Voigt averaging scheme is assumed to be appropriate to estimate representative samples.
In addition to CPO-based anisotropy of individual lithological units, local tectonic structures can affect the regional anisotropy. Folds and local shear zones can have a strong impact on the velocity patterns and the large-scale structural geometry has to be accounted for (e.g., Bleibinhaus and Gebrande, 2006; Okaya et al., 2018). The possibility to detect these structures is strongly dependent on the resolution of seismic imaging. In addition, the propagation of seismic waves is usually not parallel to the symmetry axes of geological structures within the crust. Such non-axial propagation has to be taken into account in any seismic model (e.g., Okaya and Christensen, 2002).
In this study all volume proportions of the different mineral phases were estimated from thin-section microscopy and calculated by RTA in MAUD. Related errors need to be considered, when calculating the elastic properties. However, as we do not wish to model specific rocks but rather general lithologies, the resulting compositional variations fall within the spectrum of the lithologies of interest.
As the single-crystal properties were measured at ambient conditions and our calculations were based on these, a degree of uncertainty results from changes of these properties with metamorphic conditions. In our calculations we cannot take these changes into account, yet as noted in the example of the barroisite-bearing sample MJS16 this is a possibility for errors. A further issue which requires discussion is the influence of microcracks on the elastic properties of crustal rocks (Siegesmund and Vollbrecht, 1991; Siegesmund et al., 1993; Ullemeyer et al., 2011; Vasin et al., 2014, 2017). The seismic anisotropies presented in this study are texture-derived and do not take the presence of microcracks into account. Instead, they depend on the mineral composition, single-crystal mineral properties and the CPOs of the respective phases. This means that the calculated data reflect the seismic anisotropies of rocks at great depth, in which microcracks are closed due to high confining pressure. The influence of microcracks can well be observed in studies in which CPO-derived calculated results have been compared to seismic anisotropy measurements in laboratory experiments at high confining pressure (some examples listed in Table 3). Some of these studies have demonstrated that the influence of microcracks is still detectable up to confining pressures of 1 GPa (Christensen, 1974; Ullemeyer et al., 2011). However, with increasing pressure and closing of the microcracks, the results far better resemble the CPO-derived results, and the influence of microcracks decreases significantly (Table 3; Ivankina et al., 2005; Lokajicek et al., 2017; Vasin et al., 2017).
Using time-of-flight neutron diffraction, texture data from a wide range of compositionally variable and complex rocks were collected. These are representative of different positions for subduction and exhumation in a collisional orogen. From these data texture-derived seismic anisotropies and other petrophysical properties were modeled (Table 2). The following conclusions can be made:
-
Composition and CPO have a strong effect on the rock texture and the related elastic properties in subduction and exhumation settings. Felsic rocks with high sheet silicate and calcite or dolomite contents preferentially display the fastest P-wave velocities in the foliation plane independently of the orientation of the stretching lineation. The mafic rocks with high amphibole and pyroxene contents in this study mostly display highest P-wave velocities parallel to the stretching lineation.
-
Among mafic rocks the elastic anisotropies vary by composition. The elastic anisotropies increase from a composition dominated by pyroxenes (1.4 %), to those dominated by amphiboles and chlorite (2.8 %–3.7 %).
-
The described structural positions have varying elastic properties (AVP, VP VS ratio, P-wave-velocity distribution), often overlapping each other (Fig. 9). However, in many cases the combination of properties can be utilized to distinguish these positions from one another. In this study the mafic rocks of oceanic crustal origin such as eclogite, blueschist, greenschist and amphibolite display lower anisotropies (1.4 %–3.7 %) with higher VP VS ratios (1.70–1.75) and highest velocities parallel to the stretching lineation. These gneisses, micaschists and calcareous schists display higher elastic anisotropies (1.4 %–7.1 %), lower VP VS ratios (1.56–1.76) and fast P-wave velocities distributed in the foliation plane.
Table A1F2 indices after Bunge (1982) for all mineral phases of the study.
All data referred to in the text are also presented in this paper in its tables and figures.
MJS is the main author of the paper and is primarily responsible for conducting the fieldwork of the study.
RK is responsible for the analysis of TOF neutron diffraction data and the resulting CPO data.
JKG is responsible for the sample measurements by TOF neutron diffraction at the SKAT diffractometer of the FLNP at the JINR in Dubna, Russia.
NF brought the study into the context of alpine geology and its tectonic framework.
MS lead the discussion on CPOs and microstructures as well as aligning the study with a more general subduction and exhumation setting.
The authors declare that they have no conflict of interest.
Publisher’s note: Copernicus Publications remains neutral with regard to jurisdictional claims in published maps and institutional affiliations.
This article is part of the special issue “New insights into the tectonic evolution of the Alps and the adjacent orogens”. It is not associated with a conference.
Fruitful discussions within the DFG priority programme “Mountain Building Processes in 4 Dimensions” are gratefully acknowledged. We wish to thank the Frank Laboratory of Neutron Physics (FLNP) at the Joint Institute of Neutron Research (JINR) in Dubna, Russia, for the texture measurements made possible at SKAT. We acknowledge very constructive and helpful comments by Bjarne Almqvist and Yi Cao, which have greatly improved the quality of the paper.
This research has been supported by the Deutsche Forschungsgemeinschaft (grant no. KE 2268/2-1).
This paper was edited by Mirijam Vrabec and reviewed by Yi Cao and Bjarne Almqvist.
Aleksandrov, K. S. and Ryzhova, T. V.: The elastic properties of rock forming minerals, Izvestija Academy of Science USSR, Geophys. Ser., 12, 1799–1804, 1961.
Aleksandrov, K. S., Alchikov, U. V., Belikov, B. P., Zaslavski, B. I., and Krupny, A. I.: Elastic wave velocities in minerals at atmospheric pressure and increasing precision of elastic constants by means of EVM, Izvestija Academy of Science USSR, Geol. Ser., 10, 15–24, 1974.
Almqvist, B. S. G. and Mainprice, D.: Seismic properties and anisotropy of the continental crust: Predictions based on mineral texture and rock microstructure, Rev. Geophys., 55, 367–433, 2017.
Amato, J. M., Johnson, C. M., Baumgartner, L. P., and Beard, B. L.: Rapid exhumation of the Zermatt–Saas ophiolite deduced from high precision Sm–Nd and Rb–Sr geochronology, Earth Planet. Sc. Lett., 171, 425–438, 1999.
Angiboust, S., Glodny, J., Oncken, O., and Chopin, C.: In search of transient subduction interfaces in the Dent Blanche-Sesia Tectonic System (W. Alps), Lithos, 205, 298–321, 2014.
Ballèvre, M., Kienast, J. R., and Vuichard, J. P.: La “nappe de la Dent-Blanche” (Alpes occidentals): deux unites austroalpines independantes, Eclogae. Geol. Helv., 79, 57–74, 1986.
Barruol, G. and Kern, H.: Seismic anisotropy and shear-wave splitting in lower-crustal and upper-mantle rocks from the Ivrea Zone experimental and calculated data, Phys. Earth Planet. In., 95, 175–194, 1996.
Bascou, J., Barruol, G., Vauchez, A., Mainprice, D., and Egydio-Silva, M.: EBSD-measured lattice-preferred orientations and seismic properties of eclogites, Tectonophysics, 342, 61–80, 2001.
Bestmann, M., Kunze, K., and Matthews, A.: Evolution of a calcite marble shear zone complex on Thassos Island, Greece; microstructural and textural fabrics and their kinematic significance, J. Struct. Geol., 22, 1789–1807, 2000.
Bestmann, M., Prior, D. J., and Grasemann, B.: Characterisation of deformation and flow mechanics around porphyroclasts in a calcite marble ultramylonite by means of EBSD analysis, Tectonophysics, 413, 185–200, 2006.
Bezacier, L., Reynard, B., Bass, J. D., Wang, J., and Mainprice, D.: Elasticity of glaucophane, seismic velocities and anisotropy of the subducted oceanic crust, Tectonophysics, 494, 201–210, 2010.
Bhagat, S. S., Bass, J. D., and Smyth, J. R.: Single-crystal elastic properties of omphacite-C2/C by Brillouin spectroscopy, J. Geophys. Res.-Sol. Ea., 97, 6843–6848, 1992.
Bleibinhaus, F. and Gebrande, H.: Crustal structure of the Eastern Alps along the TRANSALP profile from wide-angle seismic tomography, Tectonophysics, 414, 51–69, 2006.
Boundy, T. M., Fountain, D. M., and Austrheim, H.: Structural development and petrofabrics of eclogite facies shear zones, Bergen Arcs, western Norway: implications for deep crustal deformational processes, J. Metamorph. Geol., 10, 127–146, 1992.
Bousquet, R.: Metamorphic heterogeneities within a single HP unit: overprint effect or metamorphic mix?, Lithos, 103, 46–69, 2008.
Brown, J. M. and Abramson, E. H.: Elasticity of calcium and calciumsodium amphiboles, Phys. Earth Planet. In., 261, 161–171, https://doi.org/10.1016/j.pepi.2016.10.010, 2016.
Brown, J. M., Abramson, E. H., and Angel, R. J.: Triclinic elastic constants for low albite, Phys. Chem. Miner., 33, 256–265, 2006.
Brown, J. M., Angel, R. J., and Ross, N. L.: Elasticity of plagioclase feldspars, J. Geophys. Res.-Sol. Ea., 121, 663–675, 2016.
Bucher, K., Fazis, Y., de Capitani, C., and Grapes, R.: Blueschists, eclogites, and decompression assemblages of the Zermatt–Saas ophiolite: high-pressure metamorphism of subducted Tethys lithosphere, Am. Mineral., 90, 821–835, 2005.
Bunge, H.: Texture Analysis in Materials Science: Mathematical Models, Butterworths, London, 1982.
Burlini, L., Marquer, D., Challandes, N., Mazzola, S., and Zangarini, N.: Seismic properties of highly strained marbles from the Splügenpass, central Alps, J. Struct. Geol., 20, 277–292, 1998.
Cao, Y., Jung, H., and Song, S.: Petro-fabrics and seismic properties of blueschist and eclogite in the North Qilian suture zone, NW China: Implications for the low-velocity upper layer in subducting slab, trench-parallel seismic anisotropy, and eclogite detectability in the subduction zone, J. Geophys. Res.-Sol. Ea., 118, 3037–3058, https://doi.org/10.1002/jgrb.50212, 2013.
Cao, Y., Jung, H., and Ma, J.: Seismic properties of a unique olivine-rich eclogite in the Western Gneiss Region, Norway, Minerals, 10, 774, https://doi.org/10.3390/min10090774, 2020.
Chateigner, D., Lutterotti, L., and Morales, M.: Chapter 5.3: Quantitative texture analysis and combined analysis, International Tables of Crystallography, Vol. H, 555–580, https://doi.org/10.1107/97809553602060000968, 2019.
Chen, C.-C., Lin, C.-C., Liu, L. G., Sinogeikin, S. V., and Bass, J. D.: Elasticity of single-crystal calcite and rhodochrosite by Brillouin spectroscopy, Am. Mineral., 86, 1525–1529, 2001.
Christensen, N. I.: Compressional wave velocities in possible mantle rocks to pressures of 30 kbars, J. Geophys. Res., 79, 407–412, 1974.
Christoffel, E. B.: Über die Fortpflanzung von Stössen durch elastische, feste Körper, Annali di Matematica, 8, 193–243, 1877.
Cyprych, D., Piazolo, S., and Almqvist, B.: Seismic anisotropy from compositional banding in granulites from the deep magmatic arc of Fiordland, New Zealand, Earth Planet. Sc. Lett., 477, 156–167, 2017.
David, M., Fountain, D. M., Boundy, T. M., Austrheim, H., and Rey, P.: Eclogite-facies shear zones–deep crustal reflectors?, Tectonophysics, 232, 411–424, https://doi.org/10.1016/0040-1951(94)90100-7, 1994.
De Bresser, J. H. P.: Calcite c-axis textures along the Gavarnie thrust zone, central Pyrenees, Geol. Mijnbouw, 68, 367–375, 1989.
Delle Piane, C., Burlini, L., and Kunze, K.: The influence of dolomite on the plastic flow of calcite Rheological, microstructural and chemical evolution during large strain torsion experiments, Tectonophysics, 467, 145–166, 2009.
Erdman, M. E., Hacker, B. R., Zandt, G., and Seward, G.: Seismic anisotropy of the crust: Electron-backscatter diffraction measurements from the Basin and Range, Geophys. J. Int., 195, 1211–1229, https://doi.org/10.1093/gji/ggt287, 2013.
Erskine, B. G., Heidelbach, F., and Wenk, H. R.: Lattice preferred orientations and microstructures of deformed Cordilleran marbles; correlation of shear indicators and determination of strain path, J. Struct. Geol., 15, 1189–1205, 1993.
Fountain, D. M., Boundy, T. M., Austrheim, H., and Rey, P.: Eclogite-facies shear zones–deep crustal reflectors?, Tectonophysics, 232, 411–424, https://doi.org/10.1016/0040-1951(94)90100-7, 1994.
Frezzotti, M. L., Selverstone, J., Sharp, Z. D., and Compagnoni, R.: Carbonate dissolution during subduction revealed by diamond-bearing rocks from the Alps, Nat. Geosci., 4, 703–706, 2011.
Fujimoto, Y., Kono, Y., Hirajima, T., Kanagawa, K., Ishikawa, M., and Arima, M.: Pwave velocity and anisotropy of lawsonite and epidote blueschists: constraints on water transportation along subducting oceanic crust, Phys. Earth Planet. Int., 183, 219–228, 2010.
Godard, G. and Van Roermund, H. L. M.: Deformation-induced clinopyroxene fabrics from eclogites, J. Struct. Geol., 17, 1425–1443, 1995.
Gouzu, C., Itaya, T., Hyodo, H., and Matsuda, T.: Excess 40Ar-free phengite in ultrahigh-pressure metamorphic rocks from the Lago di Cignana area, Western Alps, Lithos, 92, 418–430, 2006.
Groppo, C., Beltrando, M., and Compagnoni, R.: The P–T path of the ultra-high pressure Lago di Cignana and adjoining meta-ophiolitic units: insights into the evolution of the subducting Tethyan slab, J. Met. Geol., 27, 207–231, 2009.
Hacker, B. R. and Christie, J. M.: Brittle/ductile and plastic/cataclastic transitions in experimentally deformed and metamorphosed amphibolite, AGU Monograph, 56, 127–147, 1990.
Helmstaedt, H., Anderson, D. L., and Gavasci, A. T.: Petrofabric studies of eclogite, spinel websterite, and spinel-lherzolite xenoliths from kimberlite-bearing breccia pipes in southeastern Utah and northeastern Arizona, J. Geophys. Res., 77, 4350–4365, 1972.
Heyliger, P., Ledbetter, H., and Kim, S.: Elastic constants of natural quartz, J. Acoust. Soc. Am., 114, 644–650, 2003.
Hill, R.: The elastic behavior of a crystalline aggregate, Proc. Phys. Soc. A, 65, 349–354, 1952.
Humbert, P. and Plique, F.: Propriétés élastiques de carbonates rhombohédriques monocristallins calcite, magnésite, dolomite, C.R. Acad. Sci. Paris, 275, 391–394, 1972.
Ivankina, T. I., Kern, H., and Nikitin, A. N.: Directional dependence of P- and S-wave propagation and polarization in foliated rocks from the Kola superdeep well: evidence from laboratory measurements and calculations based on TOF neutron diffraction, Tectonophysics, 407, 25–42, 2005.
Ivankina, T. I., Nikitin, A. N., and Telepnev, A.: Textures and physical properties of marbles deformed at 20–250 ∘C, High Pres. Res., 17, 335–346, https://doi.org/10.1080/08957950008245922, 2000.
Ivankina, T. I., Nikitin, A. N., and Telepnev, A. S.: The effect of temperature and long-term mechanical stresses on the deformational, thermal, and textural characteristics of marble, Izvestiya, Phys. Sol. Earth, 37, 46–58, 2001.
Kästner, F., Pierdominici, S., Elger, J., Zappone, A., Kück, J., and Berndt, C.: Correlation of core and downhole seismic velocities in high-pressure metamorphic rocks: a case study for the COSC-1 borehole, Sweden, Solid Earth, 11, 607–626, https://doi.org/10.5194/se-11-607-2020, 2020.
Kern, H. and Wenk, H. R.: Calcite texture development in experimentally induced ductile shear zones, Contrib. Mineral. Petr., 83, 231–236, 1983.
Kern, H., Jin, Z., Gao, S., Popp, T., and Xu, Z.: Physical properties of ultrahigh-pressure metamorphic rocks from the Sulu terrain, eastern central China: implications for the seismic structure at the Donghai (CCSD) drilling site, Tectonophysics, 354, 315–330, 2002.
Kern, H., Ivankina, T. I., Nikitin, A. N., Lokajicek, T., and Pros, Z.: The effect of oriented microcracks and crystallographic and shape preferred orientation on bulk elastic anisotropy of a foliated biotite gneiss from Outokumpu, Tectonophysics, 457, 143–149, 2008.
Keppler, R.: Crystallographic preferred orientations in eclogites – A review, J. Struct. Geol., 115, 284–296, 2018.
Keppler, R., Ullemeyer, K., Behrmann, J. H., and Stipp, M.: Potential of full pattern fit methods for the texture analysis of geological materials: implications from texture measurements at the recently upgraded neutron time-of-flight diffractometer SKAT, J. Appl. Crystallogr., 47, 1520–1534, https://doi.org/10.1107/S1600576714015830, 2014.
Keppler, R., Ullemeyer, K., Behrmann, J. H., Stipp, M., Kurzawski, R. M., and Lokajíček, T.: Crystallographic preferred orientations of exhumed subduction channel rocks from the Eclogite Zone of the Tauern Window (Eastern Alps, Austria), and implications on rock elastic anisotropies at great depth, Tectonophysics, 647–648, 89–104, 2015.
Keppler, R., Stipp, M., Behrmann, J. H., Ullemeyer, K., and Heidelbach, F.: Deformation inside a paleosubduction channel – insights from microstructures and crystallographic preferred orientations of eclogites and metasediments from the Tauern Window, Austria, J. Struct. Geol., 82, 60–79, 2016.
Keppler, R., Behrmann, J. H., and Stipp, M.: Textures of eclogites and blueschists from Syros island, Greece: inferences for elastic anisotropy of subducted oceanic crust, Geophys. Res.-Sol. Ea., 122, 5306–5324, https://doi.org/10.1002/2017JB014181, 2017.
Keppler, R., Vasin, R., Stipp, M., Lokajícek, T., Petruzálek, M., and Froitzheim, N.: Elastic anisotropies of deformed upper crustal rocks in the Alps, Solid Earth Discuss. [preprint], https://doi.org/10.5194/se-2021-27, in review, 2021.
Khazanehdari, J., Rutter, E. H., and Brodie, K. H.: High-pressure-high-temperature seismic velocity structure of the midcrustal and lower crustal rocks of the Ivrea-Verbano zone and Serie dei Laghi, NW Italy, J. Geophys. Res., 105, 13843–13858, 2000.
Kim, D., Katayama, I., Michibayashi, K., and Tsujimori, T.: Deformation fabrics of natural blueschists and implications for seismic anisotropy in subducting oceanic crust, Phys. Earth Planet. In., 222, 8–21, 2013.
Kirst, F. and Leiss, B.: Kinematics of syn- and post-exhumational shear zones at Lago di Cignana (Western Alps, Italy): constraints on the exhumation of Zermatt–Saas (ultra)high-pressure rocks and deformation along the Combin Fault and Dent Blanche Basal Thrust, Int. J. Earth Sci., 106, 215–236, 2016.
Kurz, W.: Constriction during exhumation: evidence from eclogite microstructures, Geology, 33, 37–40, 2005.
Kurz, W., Jansen, E., Hundenborn, R., Pleuger, J., Schäfer, W., and Unzog, W.: Microstructures and crystallographic preferred orientations of omphacite in Alpine eclogites: implications for the exhumation of (ultra-) high-pressure units, J. Geodyn., 37, 1–55, 2004.
Lapen, T. J., Johnson, C. M., Baumgartner, L. P., Mahlen, N. J., Beard, B. L., and Amato, J. M.: Burial rates during prograde metamorphism of an ultrahigh-pressure terrane: an example from Lago di Cignana, Western Alps, Italy, Earth Planet. Sc. Lett., 215, 57–72, 2003.
Leiss, B., Siegesmund, S., and Weber, K.: Texture asymmetries as shear sense indicators in naturally deformed mono- and poly-phase carbonate rocks, Texture. Microstruct., 33, 61–74, 1999.
Link, F. and Rümpker, G.: Crustal anisotropy in the European Alps inferred from crustal phases in receiver functions and first implications for the mantle dynamics, Geophys. Res. Abstr., EGU2019-7235, EGU General Assembly 2019, Vienna, Austria, 2019.
Lister, G. S. and Hobbs, B. E.: The simulation of fabric development during plastic deformation and its application to quartzite: the influence of deformation history, J. Struct. Geol., 2, 355–371, 1980.
Llana-Fúnez, S. and Brown, D.: Contribution of crystallographic preferred orientation to seismic anisotropy across a surface analog of the continental Moho at Cabo Ortegal, Spain, Geol. Soc. Am. Bull., 124, 1495–1513, 2012.
Lokajicek, T., Svitek, T., Kern, H., and Wenk, H.-R.: Rock Elastic Anisotropy Study by X-ray Synchrtron, Neutron Diffraction and Ultrasonic Methods, Proced. Eng., 191, 467–475, 2017.
Lutterotti, L.: Total pattern fitting for the combined size-strain-stress-texture determination in thin film diffraction, Nucl. Instrum. Meth. B, 268, 334–340, 2010.
Lutterotti, L., Matthies, S., Wenk, H.-R., Schultz, A. J., and Richardson, J. W.: Combined texture and structure analysis of deformed limestone from time-of-flight neutron diffraction spectra, J. Appl. Phys., 81, 594–600, 1997.
Lutterotti, L., Chateigner, D., Ferrari, S., and Ricote, J.: Texture, residual stress and structural analysis of thin films using a combined X-ray analysis, Thin. Solid Films, 450, 34–41, 2004.
Mainprice, D. and Humbert, M.: Methods of calculating petrophysical properties from lattice preferred orientation data, Surv. Geophys., 15, 575–592, 1994.
Mainprice, D. and Ildefonse, B.: Seismic anisotropy of subduction zone minerals – contribution of hydrous phases, in: Subduction Zone Geodynamics, edited by: Lallemand, S. and Funiciello, F., Springer-Verlag, Berlin Heidelberg, 63–84, 2009.
Manzotti, P., Zucali, M., Ballèvre, M., Robyr, M., and Engi, M.: Geometry and kinematics of the Roisan-Cignana Shear Zone, and the orogenic evolution of the Dent Blanche Tectonic System (Western Alps), Swiss J. Geosci., 107, 23–47, 2014.
Matthies, S.: On the combination of self-consistent and geometric mean elements for the calculation of the elastic properties of textured multi-phase samples, Solid State Phenom., 160, 87–93, 2010.
Matthies, S.: GEO-MIX-SELF calculations of the elastic properties of a textured graphite sample at different hydrostatic pressures, J. Appl. Crystallogr., 45, 1–16, 2012.
Matthies, S. and Humbert, M.: On the principle of a geometric mean of even-rank symmetric tensors for textured polycrystals, J. Appl. Crystallogr., 28, 254–266, 1995.
Matthies, S., Lutteroti, L., and Wenk, H. R.: Advances in Texture Analysis from Diffraction Spectra, J. Appl. Cryst., 30, 31–42, 1997.
McNamara, D. D., Wheeler, J., Pearce, M., and Prior, D. J.: Fabrics produced mimetically during static metamorphism in retrogressed eclogites from the Zermatt-Saas zone, Western Italian Alps, J. Struct. Geol., 44, 167–178, 2012.
Mookherjee, M. and Mainprice, D.: Unusually large shear wave anisotropy for chlorite in subduction zone settings, Geophys. Res. Lett., 41, 1506–1513, https://doi.org/10.1002/2014gl059334, 2014.
Müller, W. F., Xu, Z., and Walte, N. P.: Transmission electron microscopy of omphacite and other minerals in eclogites from the CCSD borehole, China: indications for their deformation and temperature history, Eur. J. Mineral., 23, 645–659, 2011.
Neufeld, K., Ring, U., Heidelbach, F., Dietrich, S., and Neuser, R. D.: Omphacite textures in eclogites of the Tauern Window: implications for the exhumation of the eclogite zone, eastern Alps, J. Struct. Geol., 30, 976–992, 2008.
Nikitin, A. N. and Ivankina, T. I.: Neutron scattering in geosciences, Part. Nucl. Sci. Rev. J., 35, 348–407, 2004.
Nikitin, A. N., Ivankina, T. I., and Sobolev, G. A.: Neutron diffraction study of intracrystalline strains and stresses in a marble sample at high temperatures and external load, Izvestiya. Phys. Sol. Earth, 40, 83–90, 2004.
Oberhänsli, R. and Bucher, K.: Tectonometamorphic evolution of the Dent Blanche nappe, Terra Cognita, 7, p. 95, 1987.
Okaya, D. A. and Christensen, N. I.: Anisotropic effects of non-axial seismic wave propagation in foliated crustal rocks, Geophys. Res. Lett., 29, 1507–1511, 2002.
Okaya, D., Vel, S. S., Song, W. J., and Johnson, S. E.: Modification of crustal seismic anisotropy by geological structures (“structural geo–metric anisotropy”): Geosphere, 15, XXX–XXX, https://doi.org/10.1130/GES01655.1, 2018.
Peacock, S. M.: The importance of blueschist → eclogite dehydration reactions in subducting oceanic crust, Geol. Soc. Am. Bull., 105, 684–694, 1993.
Pleuger, J., Roller, S., Walter, J. M., Jansen, E., and Froitzheim, N.: Structural evolution of the contact between two Penninic nappes (Zermatt-Saas zone and Combin zone, Western Alps) and implications for the exhumation mechanism and palaeogeography, Int. J. Earth Sci., 96, 229–252, 2007.
Prior, D. J. and Wheeler, J.: Feldspar fabrics in a greenschist facies albite-rich mylonite from electron backscatter diffraction, Tectonophysics, 303, 29–49, 1999.
Pros, Z., Lokajíček, T., Přikryl, R., and Klíma, K.: Direct measurement of 3D elastic anisotropy on rocks from the Ivrea zone (Southern Alps, NW Italy), Tectonophysics 370, 31–47, https://doi.org/10.1016/S0040-1951(03)00176-8, 2003.
Puelles, P., Beranoaguirre, A., Ábalos, B., Gil Ibarguchi, J. I., García de Madinabeitia, S., Rodríguez, J., and Fernández-Armas, S.: Eclogite inclusions from subducted metaigneous continental crust (Malpica-Tui Allochthonous Complex, NW Spain): petrofabric, geochronology and calculated seismic properties, Tectonics, 36, 1376–1406, 2017.
Puntero, G., Kunze, K., Heilbronner R., Stünitz, H., and Schmid, S. M.: Microfabrics of calcite ultramylonites as records of coaxial and non-coaxial deformation kinematics: Examples from the Rocher de l'Yret shear zone (Western Alps), Tectonophysics, 424, 69–97, 2005.
Ratschbacher, L., Wenk, H. R., and Sintubin, M.: Calcite textures; examples from nappes with strain-path partitioning, J. Struct. Geol., 13, 369–384, 1991.
Reddy, S. M., Wheeler, J., and Cliff, R. A.: The geometry and timing of orogenic extension: an example from the Western Italian Alps, J. Met. Geol., 17, 573–589, 1999.
Reddy, S. M., Wheeler, J., Butler, R. W. H., Cliff, R. A., Freeman, S., Inger, S., Pickles, C., and Kelley, S. P.: Kinematic reworking and exhumation within the convergent Alpine Orogen, Tectonophysics, 365, 77–102, 2003.
Reynard, B., Gillet, P., and Willaime, C.: Deformation mechanisms in naturally deformed glaucophanes: a TEM and HREM study, Eur. J. Mineral., 1, 611–624, 1989.
Reuss, A.: Berechnung der Fließgrenze von Mischkristallen auf Grund der Plastizitätsbedingung für Einkristalle, Z. Angew. Math. Mech., 9, 49–58, 1929.
Satsukawa, T., Ildefonse, B., Mainprice, D., Morales, L. F. G., Michibayashi, K., and Barou, F.: A database of plagioclase crystal preferred orientations (CPO) and microstructures – implications for CPO origin, strength, symmetry and seismic anisotropy in gabbroic rocks, Solid Earth, 4, 511–542, https://doi.org/10.5194/se-4-511-2013, 2013.
Siegesmund, S. and Vollbrecht, A.: Complete seismic properties obtained from microcrack fabrics and textures in an amphibolite from the Ivrea zone, Western Alps, Italy, Tectonophysics, 1999, 13–24, 1991.
Siegesmund, S., Takeshita, T., and Kern, H.: Anisotropy of Vp and Vs in an amphibolite of the deeper crust and its relationship to the mineralogical, microstructural and textural characteristics of the rock, Tectonophysics, 157, 25–38, 1989.
Siegesmund, S., Vollbrecht, A., Chlupac, T., Nover, G., Dürrast, H., Müller, J., and Weber, K.: Fabric-controlled anisotropy of petrophysical properties observed in KTB core samples, Sci. Drill., 4, 31–54, 1993.
Schmid, S. M., Fügenschuh, B., Kissling, E., and Schuster, R.: Tectonic map and overall architecture of the Alpine orogeny, Eclogae Geol. Helv., 97, 93–117, 2004.
Schmid, S. M. and Casey, M.: Complete fabric analysis of some commonly observed quartz c-axis patterns, Geophys. Monogr., 36, 263–286, 1986.
Stipp, M., Stünitz, H., Heilbronner, R., and Schmid, S. M.: Dynamic recrystallization of Quartz: Correlation Between Natural and Experimental Conditions, in: Deformation Mechanisms, Rheology and Tectonics: Current Status and Future Perspectives, edited by: De Meer, S., Drury, M. R., De Bresser, J. H. P., and Pennock, G. M., Geological Society of London, Special Publications, 200, 171–190, 2002.
Trullenque, G., Kern, H., Cirrincione, R., Mazzoleni, P., and Pezzino, A.: P- and S-wave velocities and densities in silicate and calcite rocks from the Peloritani Mountains, Sicily (Italy): The effect of pressure, temperature and the direction of wave propagation, Tectonophysics, 409, 55–72, 2006.
Ullemeyer, K., Spalthoff, P., Heinitz, J., Isakov, N. N., Nikitin, A. N., and Weber, K.: The SKAT texture diffractometer at the pulsed reactor IBR-2 at Dubna: experimental layout and first measurements, Nucl. Instrum. Meth., 412, 80–88, 1998.
Ullemeyer, K., Braun, G., Dahms, M., Kruhl, J. H., Olesen, N. Ø., and Siegesmund, S.: Texture analysis of a muscovite-bearing quartzite: a comparison of some currently used techniques, J. Struct. Geol., 22, 1541–1557, 2000.
Ullemeyer, K., Siegesmund, S., Rasolofosaon, P. N. J., and Behrmann, J. H.: Experimental and texture-derived P-wave anisotropy of principal rocks from the TRANSALP traverse: an aid for the interpretation of seismic field data, Tectonophysics, 414, 97–116, 2006.
Ullemeyer, K., Leiss, B., and Stipp, M.: Textures and Microstructures in Peridotites from the Finero Complex (Ivrea Zone, Alps) and its Influence on the Elastic Rock Properties, Solid State Phenomen., 160, 183–188, 2010.
Ullemeyer, K., Nikolayev, D. I., Christensen, N. I., and Behrmann, J. H.: Evaluation of intrinsic velocity–pressure trends from low-pressure P-wave velocity measurements in rocks containing microcracks, Geophys. J. Int., 185, 1312–1320, 2011.
Vasin, R. N., Lebensohn, R. A., Matthies, S., Tome, C. N., and Wenk, H.-R.: The influence of grain shape and volume fraction of sheet silicates on elastic properties of aggregates: biotite platelets in an isotropic matrix, Geophysics, 79, 433–441, 2014.
Vasin, R. N., Kern, H., Lokajíek, T., Svitek, T., Lehmann, E., Mannes, D. C., Chaouche, M., and Wenk, H.-R.: Elastic anisotropy of Tambo gneiss from Promontogno, Switzerland: a comparison of crystal orientation and microstructure-based modelling and experimental measurements, Geophys. J. Int., 209, 1–20, 2017.
Vaughan, M. T. and Guggenheim, S.: Elasticity of muscovite and its relationship to crystal structure, J. Geophys. Res., 91, 4657–4664, 1986.
Vel, S., Cook, A. C., Johnson, S. E., and Gerbi, C.: Computational homogenization and micromechanical analysis of textured polycrystalline materials, Comput. Method. Appl. M., 310, 749–779, 2016.
Voigt, W.: Lehrbuch der Kristallphysik, Teubner, Leipzig, 1928.
Von Dreele, R. B.: Quantitative texture analysis by rietveld refinement, J. Appl. Cryst., 30, 517–525, 1997.
Wang, Q., Burlini, L., Mainprice, D., and Xu, Z.: Geochemistry, petrofabrics and seismic properties of eclogites from the Chinese Continental Scientific Drilling boreholes in the Sulu UHP terrane, eastern China, Tectonophysics, 475, 251–266, https://doi.org/10.1016/j.tecto.2008.09.027, 2009.
Weiss, T., Siegesmund, S., Rabbel, W., Bohlen, T., and Pohl, M.: Seismic Velocities and Anisotropy of the Lower Continental Crust: A Review, Pure Appl. Geophys., 156, 97–122, 1999.
Wenk, H.-R. and Takeshita, T.: Pure shear and simple shear calcite textures. Comparison of experimental, theoretical and natural data, J. Struct. Geol., 9, 731–745, 1987.
Wenk, H.-R., Matthies, S., Donovan, J., and Chateignier, D.: BEARTEX, a Windows-based program system for quantitative texture analysis, J. Appl. Cryst., 31, 262–269, 1998.
Wenk, H.-R., Lutterotti, L., and Vogel, S. C.: Rietveld texture analysis from TOF neutron diffraction data, Powder Diffraction, 25, 283–296, 2010.
Wenk, H.-R., Vasin, R. N., Kern, H., Matthies, S., Vogel, S. C., and Ivankina, T. I.: Revisiting elastic anisotropy of biotite gneiss from the Outokumpu scientific drill hole based on new texture measurements and texture-based velocity calculations, Tectonophysics, 570–571, 123–134, 2012.
Worthington, J. R., Hacker, B. R., and Zandt, G.: Distinguishing eclogite from peridotite: EBSD-based calculations of seismic velocities, Geophys. J. Int., 193, 489–505, 2013.
Zertani, S., John, T., Tilmann, F., Motra, H. B., Keppler, R., Andersen, T. B., and Labrousse, L.: Modification of the seismic properties of subducting continental crust by eclogitization and deformation processes, J. Geophys. Res.-Sol. Ea., 124, 9731–9754, https://doi.org/10.1029/2019JB017741, 2019.
Zhang, J. F. and Green, H. W.: On the deformation of UHP eclogite: From laboratory to nature, Int. Geol. Rev., 49, 487–503, 2007.
Zhang, J. F., Wang, Y. F., and Jin, Z. M.: CPO-induced seismic anisotropy in UHP eclogites, Sci. China Ser. D, 51, 11–21, 2008.
Zulauf, G.: Constriction due to subduction: evidence for slab pull in the Mariánské Lázně complex (central European Variscides), Terra, Nova, 9, 232-236, 1997.
- Abstract
- Introduction
- Geological overview of the study area
- Methods
- Composition and microfabrics of the samples studied
- Results
- Discussion
- Conclusion
- Appendix A
- Data availability
- Author contributions
- Competing interests
- Disclaimer
- Special issue statement
- Acknowledgements
- Financial support
- Review statement
- References