the Creative Commons Attribution 4.0 License.
the Creative Commons Attribution 4.0 License.
 | 12 Oct 2021
Elastic anisotropies of deformed upper crustal rocks in the Alps
Ruth Keppler
Roman Vasin
Michael Stipp
Tomás Lokajícek
Matej Petruzálek
Nikolaus Froitzheim
The crust within collisional orogens is very heterogeneous both in composition and grade of deformation, leading to highly variable physical properties at small scales. This causes difficulties for seismic investigations of tectonic structures at depth since the diverse and partially strong upper crustal anisotropy might overprint the signal of deeper anisotropic structures in the mantle. In this study, we characterize the range of elastic anisotropies of deformed crustal rocks in the Alps. Furthermore, we model average elastic anisotropies of these rocks and their changes with increasing depth due to the closure of microcracks. For that, pre-Alpine upper crustal rocks of the Adula Nappe in the central Alps, which were intensely deformed during the Alpine orogeny, were sampled. The two major rock types found are orthogneisses and paragneisses; however, small lenses of metabasites and marbles also occur. Crystallographic preferred orientations (CPOs) and volume fractions of minerals in the samples were measured using time-of-flight neutron diffraction. Combined with single crystal elastic anisotropies these were used to model seismic properties of the rocks. The sample set shows a wide range of different seismic velocity patterns even within the same lithology, due to the microstructural heterogeneity of the deformed crustal rocks. To approximate an average for these crustal units, we picked common CPO types of rock forming minerals within gneiss samples representing the most common lithology. These data were used to determine an average elastic anisotropy of a typical crustal rock within the Alps. Average mineral volume percentages within the gneiss samples were used for the calculation. In addition, ultrasonic anisotropy measurements of the samples at increasing confining pressures were performed. These measurements as well as the microcrack patterns determined in thin sections were used to model the closure of microcracks in the average sample at increasing depth. Microcracks are closed at approximately 740 MPa yielding average elastic anisotropies of 4 % for the average gneiss. This value is an approximation, which can be used for seismic models at a lithospheric scale. At a crustal or smaller scale, however, local variations in lithology and deformation as displayed by the range of elastic anisotropies within the sample set need to be considered. In addition, larger-scale structural anisotropies such as layering, intrusions and brittle faults have to be included in any crustal-scale seismic model.
- Article
(11847 KB) - Full-text XML
- Companion paper
- BibTeX
- EndNote


Geophysical studies of the Earth's crust and mantle are continuously improving allowing for more and more detailed structural investigations due to higher resolutions at increasingly greater depth. High-resolution geophysical imaging of 3D structures is currently carried out within the AlpArray initiative using a high-end seismological array in the Alpine orogeny (Heteìnyi et al., 2018). For this as well as other similar projects around the world precise knowledge of the physical properties of the rocks at depth is required. In particular elastic anisotropy data are of importance, since they reflect shearing at depth. Elastic anisotropy of mantle rocks is in large parts caused by the crystallographic preferred orientation (CPO) of the constituent mineral phases (Silver, 1996; Montagner and Guillot, 2003). Besides CPO other rock fabrics such as compositional layering, grain and aggregate size and shape, grain boundaries, and shape preferred orientation can bear an influence. At shallower depth microcracks additionally modify elastic properties by both lowering the seismic velocity and increasing the elastic anisotropy in deformed rocks. The elastic rock properties can be either be gained by measurements using ultrasound, including experiments at high pressures and temperatures (e.g., Christensen, 1965, 1979; Babuška, 1968; Christensen and Mooney, 1995; Kern and Wenk, 1990; Pros et al., 2003), or modeled using the CPO data of the constituent minerals and their corresponding single crystal elastic anisotropies (e.g., Mainprice and Humbert, 1994; Bascou et al., 2001; Cholach and Schmitt, 2006; Llana-Fúnez and Brown, 2012; Almqvist and Mainprice, 2017; Puelles et al., 2018). Many works combine these two approaches to highlight the effect of individual minerals on elastic wave velocities in bulk rock, or to infer the influence of pores and fractures (e.g., Ji and Salisbury, 1993; Ji et al., 1993, 2003; Barruol and Kern, 1996; Mauler et al., 2000; Ivankina et al., 2005; Kitamura, 2006; Kern et al., 2008; Ábalos et al., 2010; Lokajicek et al., 2014; Keppler et al., 2015; Vasin et al.,2017; Ullemeyer et al., 2018). During experimental measurements, microcracks in rock samples are not completely closed, despite pressure vessels operating at up to hundreds of MPa during measurements (e.g., Christensen, 1974; Kern et al., 2008; Matthies, 2012; Vasin et al., 2017). That is why resulting data are only comparable to elastic anisotropies of crustal depth, whereas the modeled anisotropies yield results for a crack-free medium at higher depths (e.g., within thickened crust or at mantle depth).
When using elastic anisotropy data of natural rocks as input parameters for seismic investigation the gap between the kilometer scale of detectable units in seismic imaging at depth and the centimeter-sized rock samples taken from outcrops in meter scales must be considered. This difference in scale is less problematic for the relatively homogenous mantle rocks with a fairly simple mineralogy (e.g., Mainprice et al., 2000; Karato et al., 2008), but even in the mantle compositional heterogeneities leading to elastic anisotropies have been observed (Faccenda et al., 2019). Not only are crustal rocks polymineralic but lithologies vary significantly in composition. Additionally, deformation is also very heterogeneous within the crust. In particular subduction zones and collisional orogens show a complex deformational history (e.g., Schmid et al., 2004; Simancas et al., 2005; Zhang et al., 2012). This results in a large variety of CPO patterns throughout a kilometer-scale geological unit (Schmidtke et al., 2021). Averaging the calculated or measured elastic anisotropies may lead to the assumption of an unrealistically isotropic medium, for these strongly deformed parts of the crust. There are only a few studies, which aim to close the gap between the elastic anisotropy gained from hand-sample-sized volumes and the one measured in seismic experiments of the crust and mantle (Okaya et al., 2019; Zertani et al., 2020). Okaya et al. (2019) investigated the influence of local structures such as folds, domes or shear zones on the bulk anisotropic properties of larger units. Using tensor algebra they separate these local structures from an already overall anisotropic rock, which allows the role of macroscale structures to be quantified. Zertani et al. (2020) used the finite element method to model petrophysical properties of meter- to kilometer-scale eclogite units, which could allow structures in active subduction and collision zones to be visualized by geophysical methods.
In the present work, we classify the crust according to its composition and grade of deformation in order to define larger units which can be summarized. Since only deformed parts of the crust exhibit elastic anisotropy, this study is focused on the Adula Nappe of the Central Alps. Originating from pre-Alpine upper crust mainly made up of granitoids and Mesozoic sediments, the Adula Nappe was intensely deformed during the Alpine Orogeny. CPO as well as volume percentages of all mineral phases from a large set of samples of this unit were determined. Subsequently, elastic anisotropies of the samples were calculated. These show a wide range of seismic properties of deformed crustal rocks in the Alps. Most of the samples are gneisses, which represent the most common rock type in the Adula Nappe. Based on the characteristic CPO types, average CPO strengths and average volume percentages of the relevant mineral phases, we calculated the elastic anisotropy of an “average rock”, which represents an average anisotropy for deformed crustal rocks in collisional orogens. The two major lithologies are orthogneisses and paragneisses, which is why the “average rock” has typical gneiss CPO and composition. Because of the importance of microcracks at shallow depth, we used data from ultrasonic measurements as well as thin section analysis to determine typical crack patterns in the samples. From these the influence of microcracks on elastic properties was quantified, as well as the changes in elastic anisotropy with increasing depth up to the point where all microcracks are presumably closed.
This is, of course, a simplification of the very heterogeneous crust of the Alps, as already shown by the variability of elastic anisotropy of the individual samples from the Adula Nappe. Yet, such an average rock can be used for lithospheric- and upper-mantle-scale seismic models, in which the crust is implemented as a single unit with an average anisotropy. At crustal scale the heterogeneity of different rocks caused by variable composition as well as variable deformation have to be considered. While it is difficult to present a universal average anisotropy for the very heterogeneous crust within collisional orogens, this contribution aims to bridge the scale gap between elastic anisotropy data of rock samples and the kilometer-scale structures measured in seismic investigations by considering heterogeneities in composition and structure as well as the reduction of crack porosity with increasing depth.
The Alpine orogen exhibits a mountain-belt-parallel seismic anisotropy (e.g., Silver, 1996; Smith and Ekström, 1999; Bokelmann et al., 2013; Petrescu et al., 2020), which is not completely understood. In the Western Alps this anisotropy was illustrated by teleseismic shear wave splitting and interpreted as a result of asthenospheric flow beneath the lithospheric slab, although a further influence by lithospheric anisotropy due to Alpine deformation could not be excluded (Barruol et al., 2004, 2011). Fry et al. (2010), on the other hand, determined seismic anisotropies within the Alps by passive seismic imaging using Rayleigh wave phase velocities. Their results suggest two distinct vertically distributed layers of anisotropy – an orogen-parallel fast direction down to 30 km and an orogen-perpendicular one between 30 and 70 km depth – with differing geodynamic origins. The authors interpret the orogen-parallel anisotropy as a consequence of the CPO of crustal minerals (e.g., amphibole and biotite) in response to compression and consider the deeper, orogen-perpendicular anisotropy to result from bending and flow of the European lithospheric mantle. This two-layer anisotropy was also detected from SKS splitting in the transition to the Eastern Alps. The two layers were interpreted as asthenospheric flow above a detached lithospheric slab fragment with mountain-chain-parallel CPO (Qorbani et al., 2015; Link and Rümpker, 2021).
The Alps have a fairly complicated tectonic history with two major collisional events involving several oceans and microcontinents. While the Cretaceous Eoalpine event only involved the Eastern Alps, the Tertiary deformation incorporated the complete Alpine orogen. Here, we concentrate on the deep structure of the Western and Central Alps that mainly result from Paleogene and Neogene tectonics when the Penninic ocean basins were subducted and Adria, Iberia and other continental fragments collided with Europe. We consider a simplified version of the NFP-20 EAST&EGT profile (Fig. 1a; Schmid and Kissling, 2000) and exclude nappe structures in the shallowest part of the profile, like the Helvetic nappes. This results in a profile including the following upper crustal units: the Aar and Gotthard massifs representing weakly deformed European basement; the Lucomagno, Simano and Adula nappes of deformed European basement and Mesozoic cover; and relatively undeformed Apulian upper crust. To simplify, we therefore subdivide the profile into
-
weakly deformed and isotropic upper crust and
-
strongly deformed anisotropic upper crust mostly comprising gneiss (Fig. 1b).
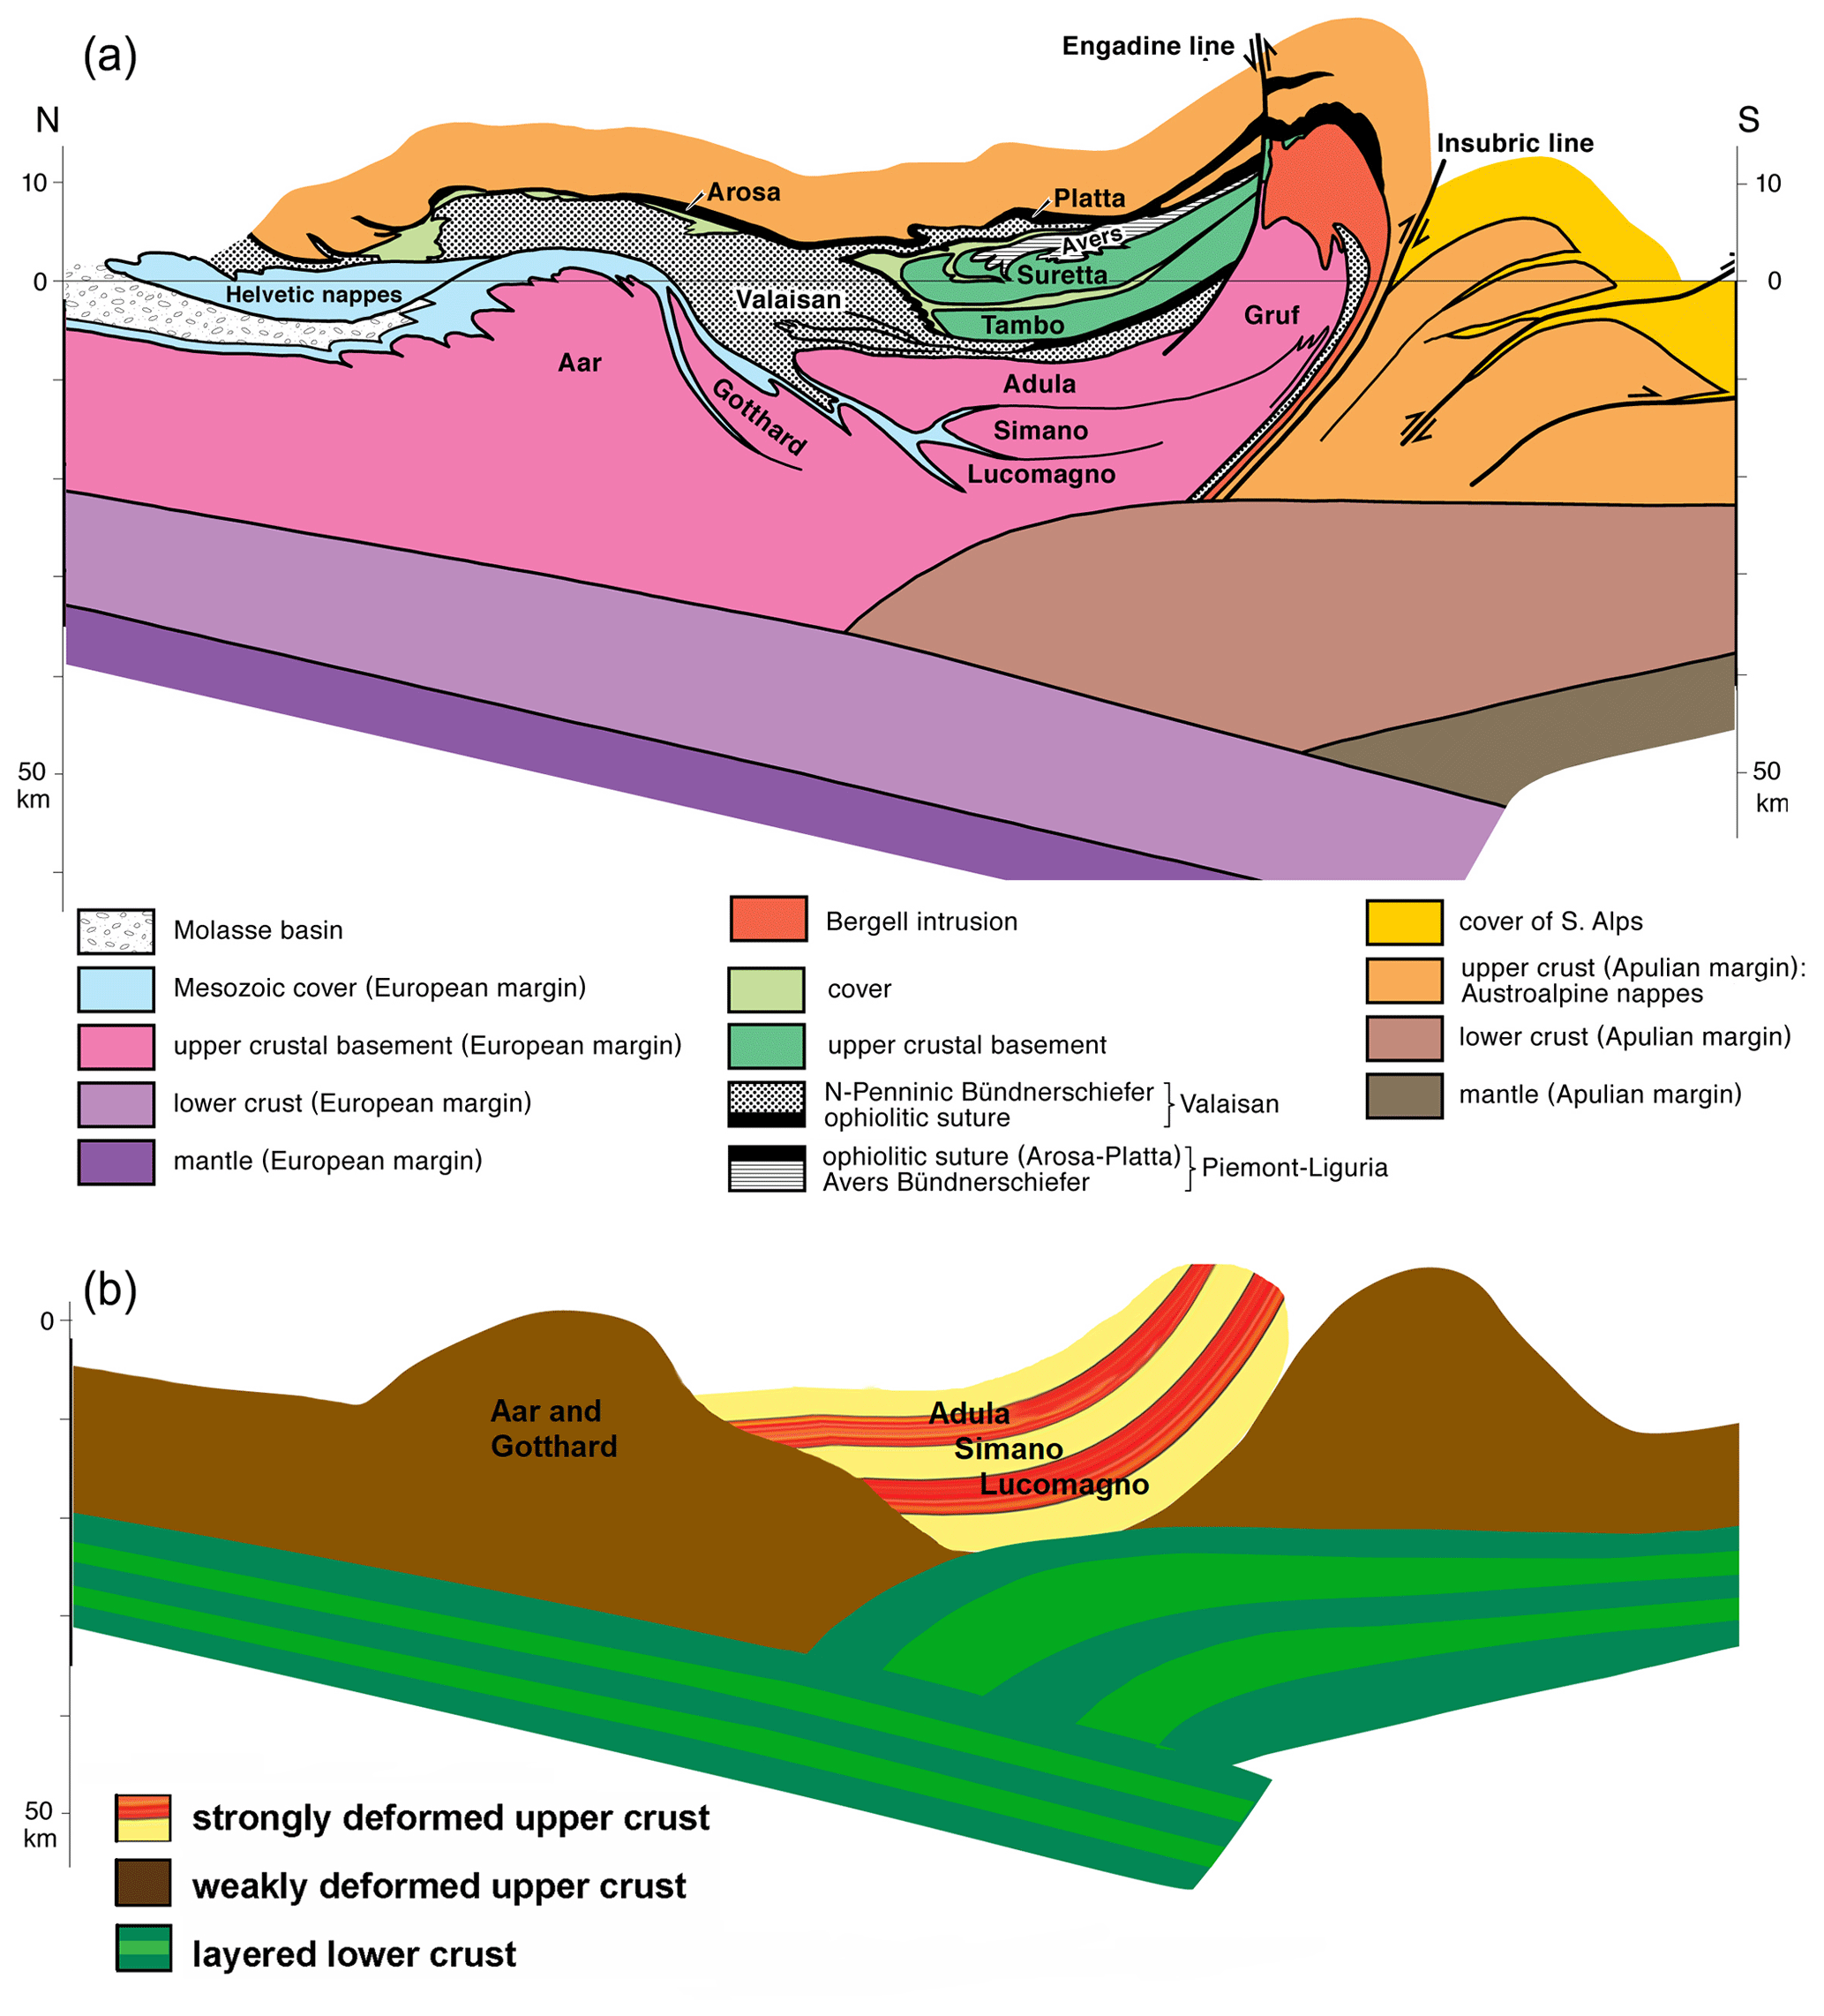
Figure 1(a) North–south tectonic profile through the central Alps showing all major units (NFP-20 EAST&EGT; Schmid and Kissling, 2000) and (b) strongly simplified profile consisting of the predominant rock units and neglecting the sedimentary cover and ophiolite units.
2.1 Weakly deformed Alpine upper crust
In this study, both the crystalline massifs in the northern part of the central Alps and the Adriatic basement in the Southern Alps are assumed to show weak or no elastic anisotropy.
The Aar and Gotthard massifs contain large Variscan granitoid bodies which intruded into a pre-Variscan basement. These units were only weakly overprinted by Alpine metamorphism and deformation (e.g., Abrecht, 1994; Schaltegger, 1994; Oliot et al., 2010). However, some greenschist to amphibolite facies shear zones have been documented, which have to be considered for any large-scale model (Challandes et al., 2008; Goncalves et al., 2012; Wehrens et al., 2017), in addition to structures related to the evolution of Gondwana in the pre-Variscan basement, in which the granitoids intruded (e.g., von Raumer et al., 2013). Furthermore, Jurassic rifting structures are present in parts of the Penninic nappes (e.g., Froitzheim and Manatschal, 1996). Even though these structures are mostly related to brittle deformation, they might cause local seismic anisotropies.
In the Southern Alps, metamorphic grade during deformation was generally low. Deformation in the basement is limited to large-scale thrust faults during Alpine tectonics (e.g., Laubscher 1985). For simplification, we are assuming an elastically isotropic medium for both the Aar and Gotthard massifs of the European margin and the Southern Alps due to the lack of pervasive CPO forming deformation. However, local ductile shear zones as well as large brittle faults also have an influence on the overall elastic anisotropy (e.g., Almqvist et al., 2013).
Of course one needs to bear in mind that considering the crystalline massifs in the northern part of the central Alps and the Adriatic basement as isotropic is a strong simplification of complex structures with a long deformational history. In addition to brittle deformation structures, lithological layering as well as intrusions may be further factors influencing the overall anisotropy of crustal-scale seismic models.
2.2 Strongly deformed Alpine upper crust
As indicated by numerous geological field studies as well as strong reflectors in the original NFP-20-east seismic profile (Pfiffner et al., 1988), the crustal units in the main part (concerning their position in the N–S-running profile) of the central Alps have been strongly deformed during subduction and subsequent continental collision (Fig. 1b).
The Adula Nappe together with the Simano and Lucomagno nappes constitutes the Lepontine dome, which mostly consists of Alpine nappes including Variscan basement and its Mesozoic cover (e.g., Engi et al., 1995; Nagel et al., 2002). In this study, the Adula Nappe is taken as an example for the strongly deformed parts of the Alps, representing a relatively coherent unit with stratigraphic basement-cover contacts. It comprises orthogneisses from Cambrian, Ordovician, and Permian protoliths (Cavargna-Sani et al., 2014); paragneisses with metabasic lenses; and some layers of marble (Fig. 2). It was originally part of the distal European continental margin and entered a south-dipping subduction zone in which the Valais (North Peninnic) Ocean had been consumed. The unit shows peak conditions of 12–17 kbar/500–600 ∘C in the north and 30 kbar/800–850 ∘C in the south (e.g., Heinrich, 1986; Löw,1987; Meyre et al., 1997; Nagel et al., 2002; Dale and Holland, 2003). Lu–Hf garnet ages revealed an Eocene age for UHP metamorphism (35–38 Ma; Sandmann et al., 2014). All lithologies found in the nappe were sampled; however, most samples are orthogneisses and paragneisses, since these lithologies make up the largest part of the nappe and other lithologies might be too small a scale to be detected in seismic imaging. However, since these layers of different lithology could be significant for the overall anisotropy two metabasalts as well as a marble sample have been included in the sample set.
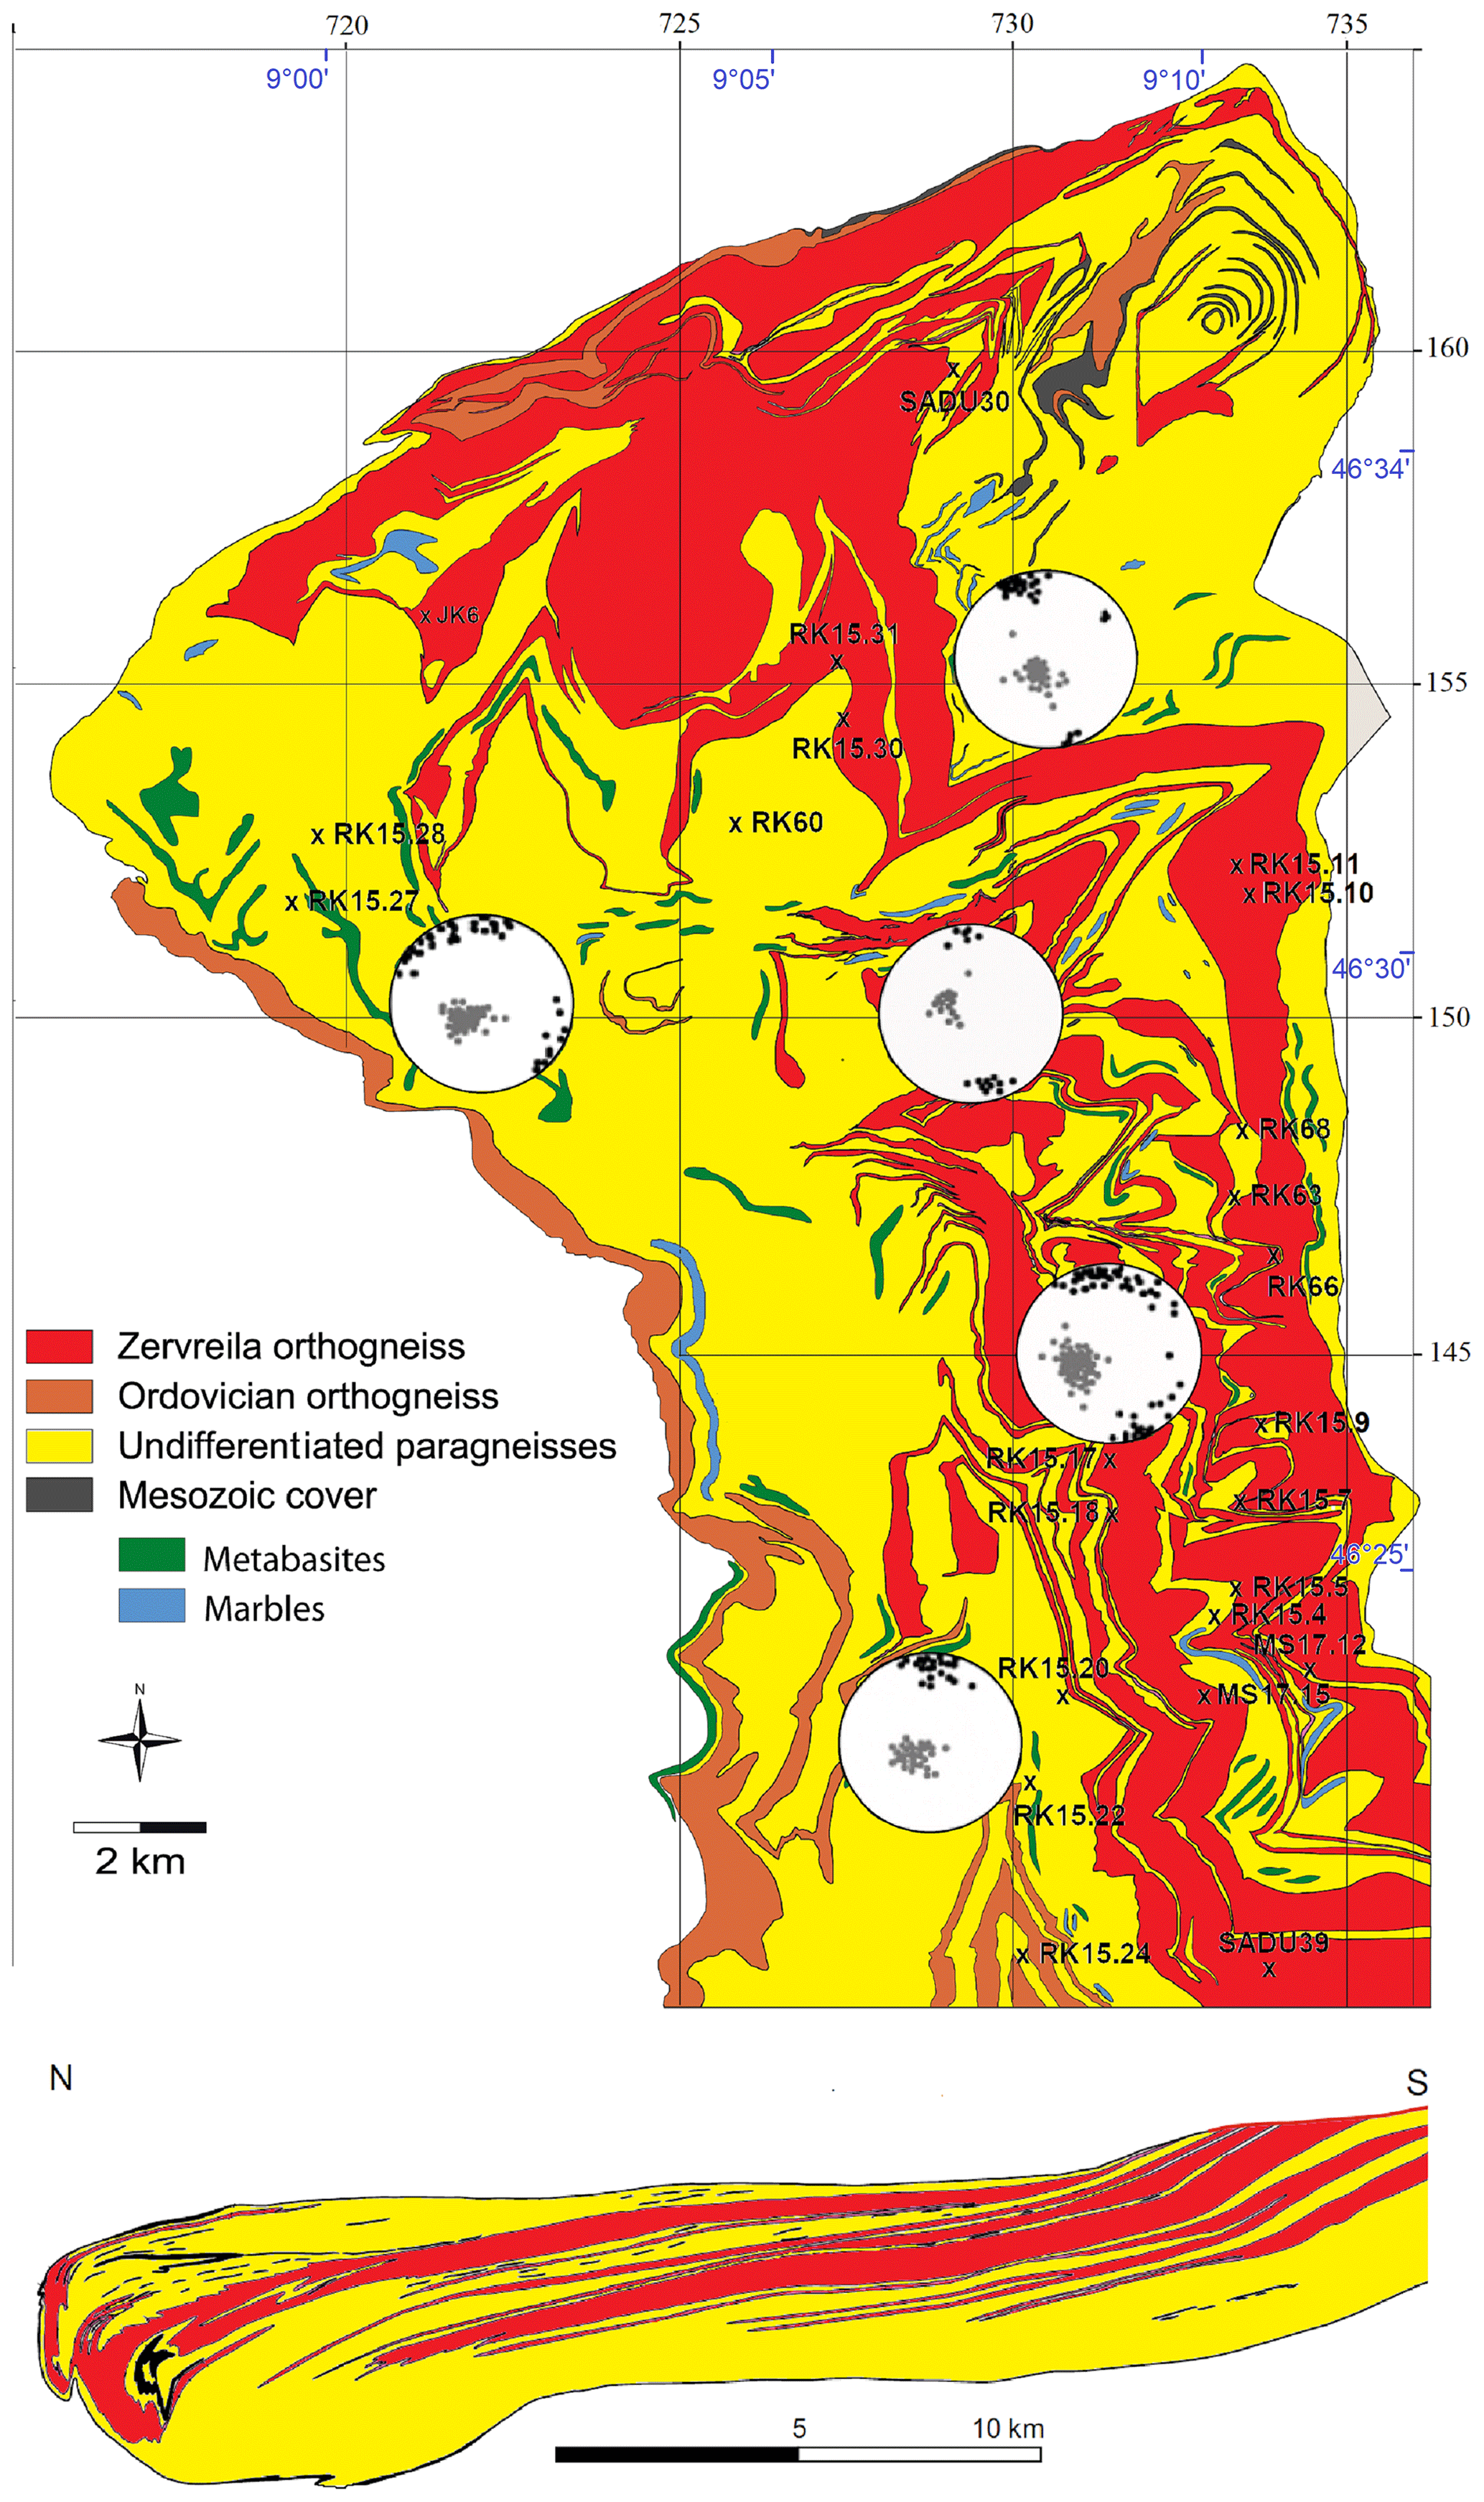
Figure 2Simplified tectonic map and north–south profile (along 730 line of longitude) of the Adula Nappe (modified after Nagel, 2008, and Cavargna-Sani et al., 2014). Grey and black dots indicate poles of main foliation and stretching lineation, respectively, of the central Adula Nappe. Sample locations are indicated. Swiss coordinates are marked in black; UTM coordinates are marked in blue.
From peak conditions to its current position within the Lepontine dome, the Adula Nappe underwent several deformation phases. The oldest, peak to post-peak deformation phase is the eclogite facies Zapport phase, which is well documented in the central part of the nappe, where it was not overprinted by younger deformation phases (e.g., Löw, 1987; Meyre et al., 1993; Pleuger et al., 2003). The Zapport phase records the earliest stages of exhumation and led to boudinage of the eclogite lenses, isoclinal folding, an axial plane foliation, a N–S-trending stretching lineation and a top-to-the-north sense of shear (Meyre et al., 1993). Samples used for this study are from this area and represent deformed crustal parts of the Alps.
3.1 CPO analysis
CPO measurements were performed at the neutron time-of-flight (TOF) texture diffractometer SKAT at the Frank Laboratory of Neutron Physics at JINR, Dubna, Russia (Ullemeyer et al., 1998; Keppler et al., 2014). The high penetration capability of neutrons into matter together with the large beam cross section of the SKAT (50 × 95 mm2) allow measurements of large-volume samples. In this study, roughly spherical samples with volumes of about 65 cm3 were measured. Since the investigated samples are usually coarse-grained this guarantees good grain statistics. Moreover, since diffraction patterns are recorded in a TOF experiment over a large interval of lattice spacings, often containing hundreds of diffraction peaks, the so-called “Rietveld Texture Analysis” can be used for the texture evaluation, allowing the simultaneous determination of all mineral textures even for samples with complex mineralogy (Von Dreele, 1997; Matthies et al. 1997), as well as defining the rock mineral composition. We used the MAUD software for the texture evaluation (Lutterotti et al., 1997; Wenk et al., 2010; Schmidtke et al., 2021). For every sample, a sample coordinate system XYZ representing the three directions of the finite strain ellipsoid was chosen. X is the lineation direction, Y is within the foliation plane perpendicular to the lineation and Z is the foliation normal.
3.2 Modeling of elastic anisotropies
From the orientation distribution function (ODF) of the main rock constituents, their volume fractions in each sample and particular single crystal elastic constants, the elastic moduli of bulk rock were calculated using the BEARTEX software (Wenk et al., 1998). For that purpose, averaging schemes are often used, such as the Voigt approach (Voigt, 1887) or Reuss approach (Reuss, 1929). The former assumes that all crystallites in the polycrystal are under the same strain, while the latter considers equal stress state in all crystallites. To get a first approximation on the different elastic anisotropy patterns within the set of samples, we used the Voigt averaging scheme that provides reasonably good agreement of rock petrofabric data and laboratory measurements (Ben Ismail and Mainprice, 1998), while noting that the recalculated elastic properties represent the upper boundary of the polycrystal stiffness.
The single crystal elastic constants for the calculation were taken from the literature (muscovite: Vaughan and Guggenheim, 1986; quartz: Heyliger et al., 2003; albite: Brown et al., 2006; calcite: Dandekar, 1968; dolomite: Humbert and Plique, 1972; hornblende: Aleksandrov and Ryzhova, 1961; epidote: Aleksandrov et al., 1974; garnet: Zhang et al., 2008; omphacite: Bhagat et al., 1992). Phase elastic wave velocities were calculated from bulk elastic tensors of rocks using the Christoffel equation.
To calculate the elastic anisotropy of the “average rock”, representative of crustal lithology, and its changes with overburden depth due to closure of the microcracks (see Sect. 4.5), a more sophisticated approach to the calculation of rock elastic properties is necessary. We used a modified self-consistent method GeoMIXself (GMS; Matthies, 2010, 2012), which combines the standard self-consistent routines (e.g., Morris 1970) with elements of the geometric mean averaging (Matthies and Humbert, 1995). This method is able to take CPO, morphologies and shape preferred orientations (SPOs) of grains, as well as pores and cracks, into account. Similar to self-consistent approach, in GMS all rock constituents (mineral grains, pores or microcracks) are approximated by oblate spheroids. Details and limitations of this approach for an application to polymineral rocks are discussed in, for example, Vasin et al. (2013, 2017) and Lokajicek et al. (2021).
3.3 Ultrasonic measurements
From the sample set, two samples with common CPO patterns and strengths of their constituent mineral phases were picked for ultrasonic measurements of P-wave velocity distributions at the pressure apparatus of the Institute of Geology ASCR, Prague, Czech Republic (e.g., Lokajicek et al., 2014). The measurements were conducted on spherical samples with diameters of 41.0 mm (RK15-17) and 39.4 mm (RK15-22), respectively. Before the measurement, the samples were dried at 100 ∘C for 24 h. Afterwards they were covered by a thin layer of epoxy resin to protect inner pore space of the sample against the hydrostatic pressure. Transformer oil served as the hydraulic medium. Ultrasonic signals were excited and recorded using a pair of piezoceramic sensors with a resonant frequency of 2 MHz. P-wave velocities were measured during loading in 132 independent directions at differing confining pressure levels from ambient conditions to a maximum pressure of 300 or 400 MPa.
The orthogneiss samples consist of quartz, plagioclase, kalifeldspar and mica (Table 1a). Mica is mostly white mica but a few samples also contain biotite. Mica is frequently aligned within the foliation plane. It occurs in layers in some samples but exhibits single grains or clusters scattered within a matrix of quartz and feldspar in most orthogneisses. Microcracks in mica grains are mostly aligned with its basal plane; however, there are also some mircocracks cutting across basal planes (Fig. 3a–c). Quartz exhibits the full range of dynamic recrystallization microstructures from grain boundary migration to subgrain rotation recrystallization and bulging.
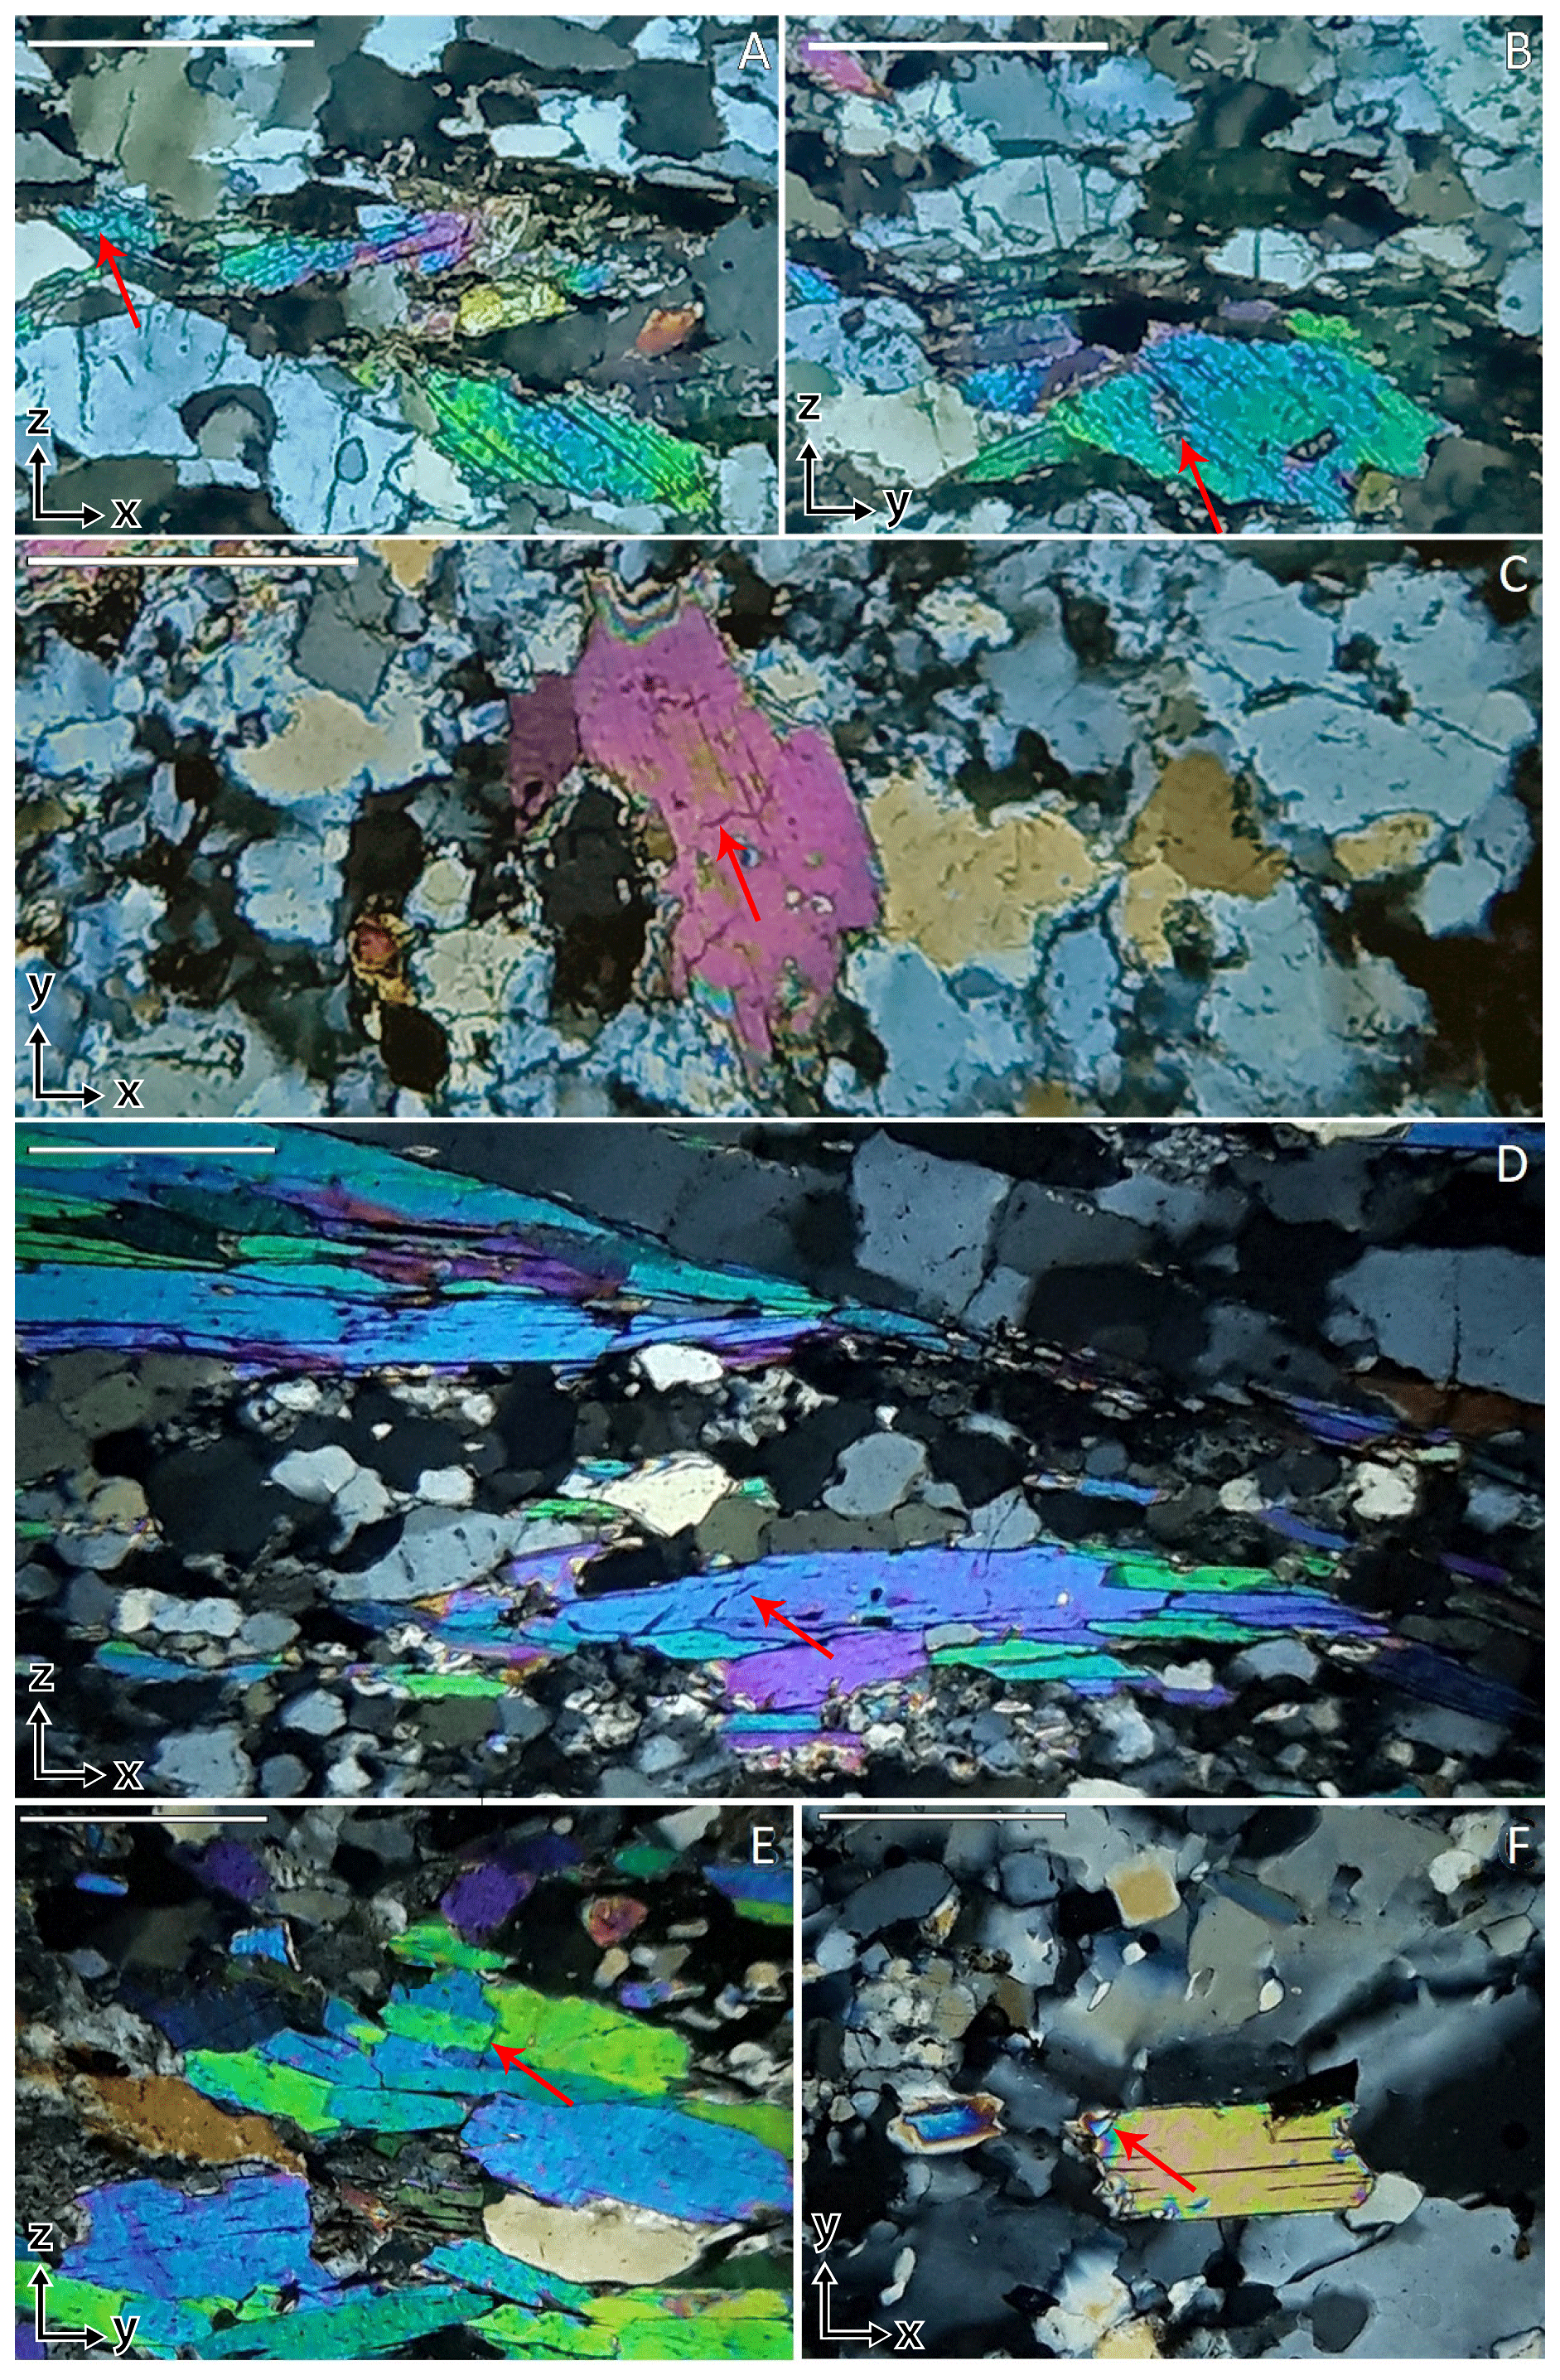
Figure 3Thin sections of RK15-17, a typical orthogneiss (a, b, c) and RK15-22, a typical paragneiss (d, e, f) under crossed polarizers for the XZ (a, d), YZ (b, e) and XY plane (c, f), showing examples microcracks (red arrows) in mica. Arrows in left corner indicate the three directions of the finite strain ellipsoid. White bar on upper left corner in each picture shows the length of 500 µm.
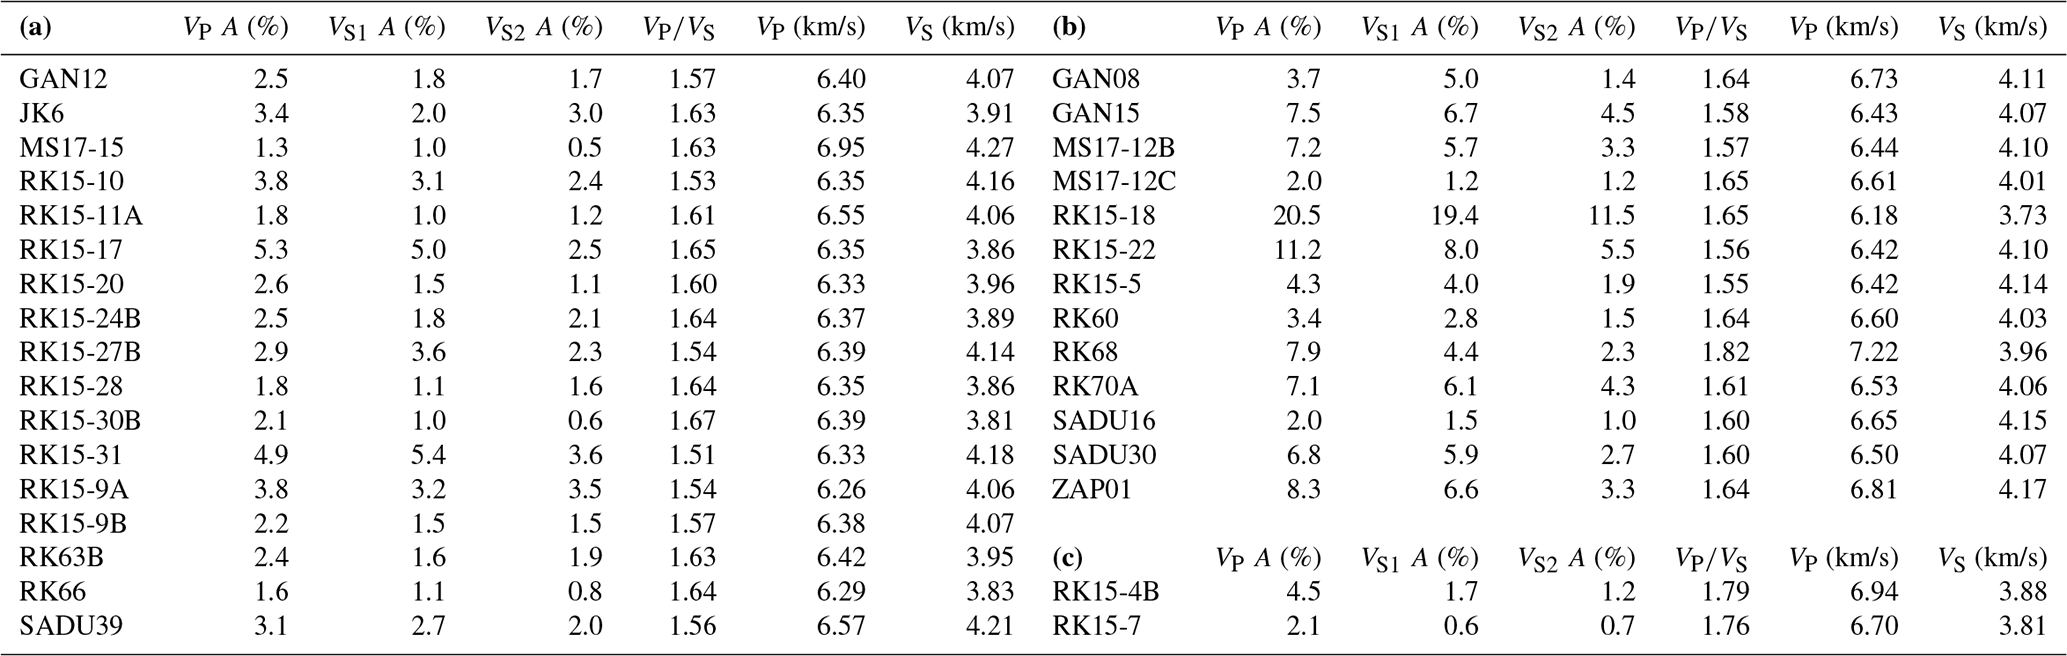
Table 1Sample locations in Swiss coordinates and mineral volume percentages of (a) orthogneisses, (b) paragneisses and (c) metabasites. Cc: calcite, Czo: clinozoisite, Dol: dolomite, Grt: garnet, Hbl: hornblende, Kfs: kalifeldspar, Omp: omphacite, Plg: plagioclase, Qz: quartz.
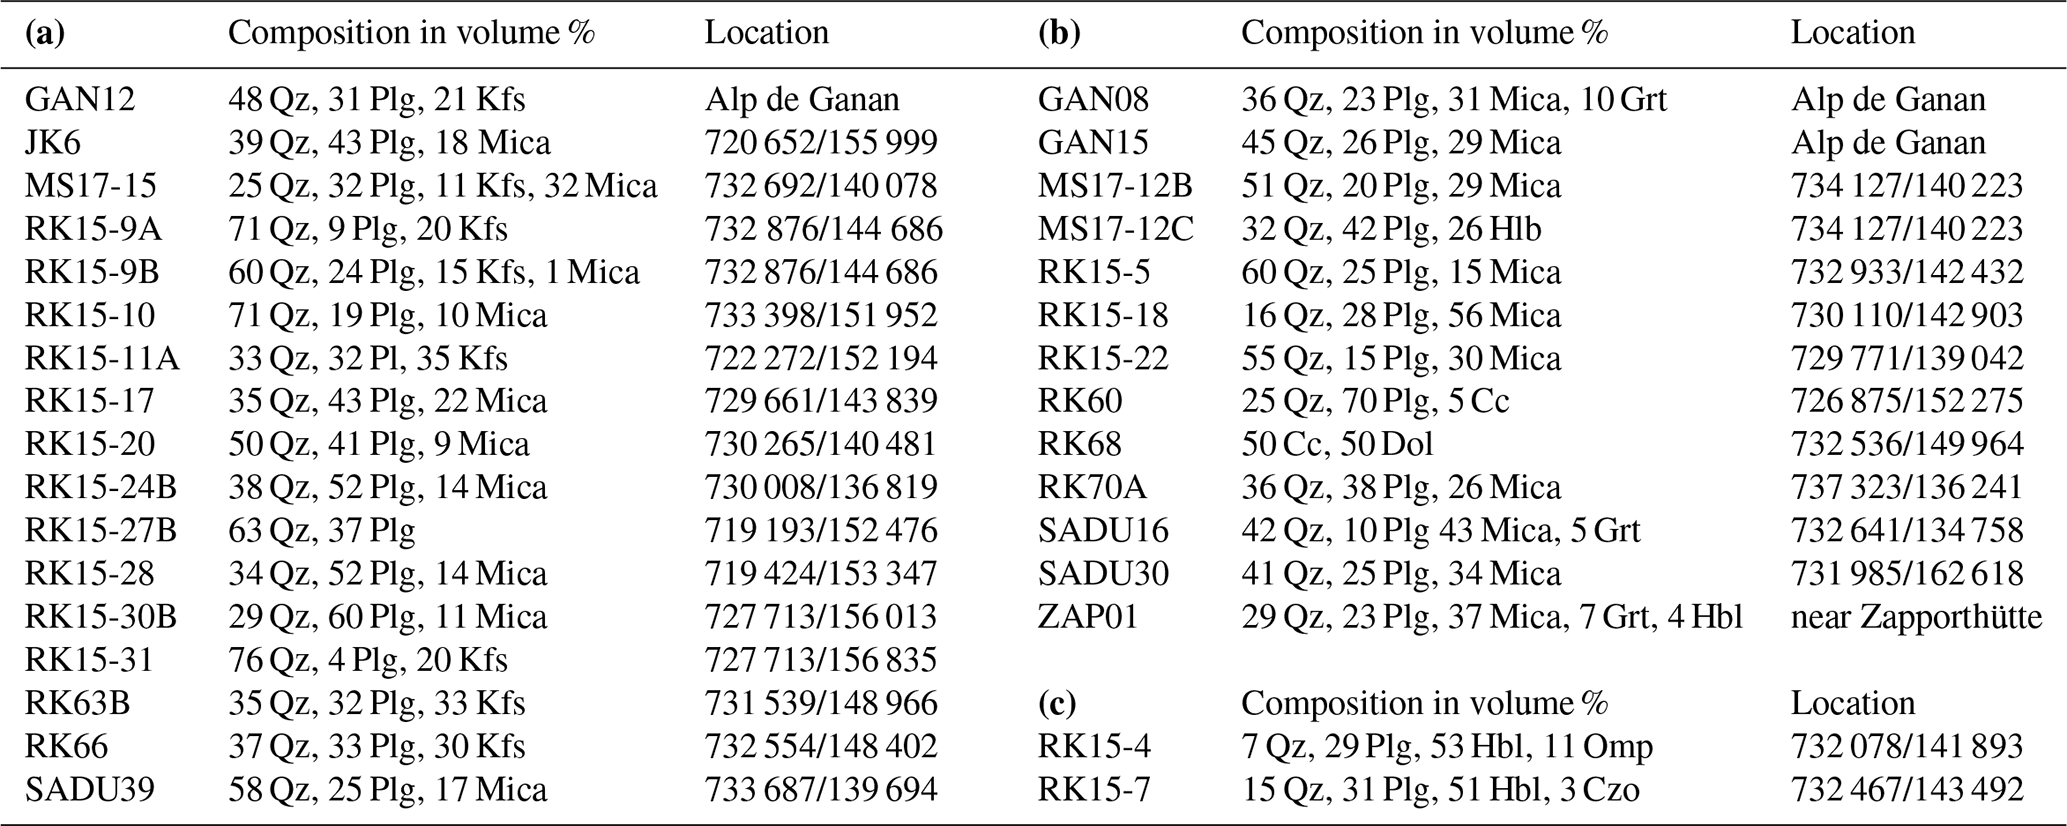
The mineral compositions of the paragneisses is more variable. Similar to the orthogneiss samples, the paragneisses consist of quartz, plagioclase and mica; however, there is no kalifeldspar in the samples and the mica contents are generally higher (Table 1b). A few samples (RK15-18, SADU16) have a high mica content of up to 56 % and are therefore correctly termed mica schists. As they fall into the same category of clastic metasediments, they are counted among the paragneisses which are the predominant rock type of that group. They were also considered for the calculation of the average sample, concerning composition and CPO. White mica is more common in the paragneisses than in the orthogneisses. However, even biotite occurs more frequently in the paragneisses. One of the paragneiss samples contains hornblende and several of the samples contain garnet. Mica appears more frequently aligned in layers compared to the orthogneisses. Microcracks are mostly parallel to the mica basal plane with some exceptions (Fig. 3d–f). Quartz microstructures also correspond to those of the orthogneisses.
The marble sample comprises equal amounts of calcite and dolomite, both of which exhibit an SPO with an alignment in the foliation. The metabasites are strongly retrogressed eclogites consisting of about 50 % hornblende and variable amounts of quartz, plagioclase, omphacite and clinozoisite (Table 1c). Hornblende shows an alignment within the foliation plane and is preferentially oriented parallel to the stretching lineation.
5.1 Crystallographic preferred orientation
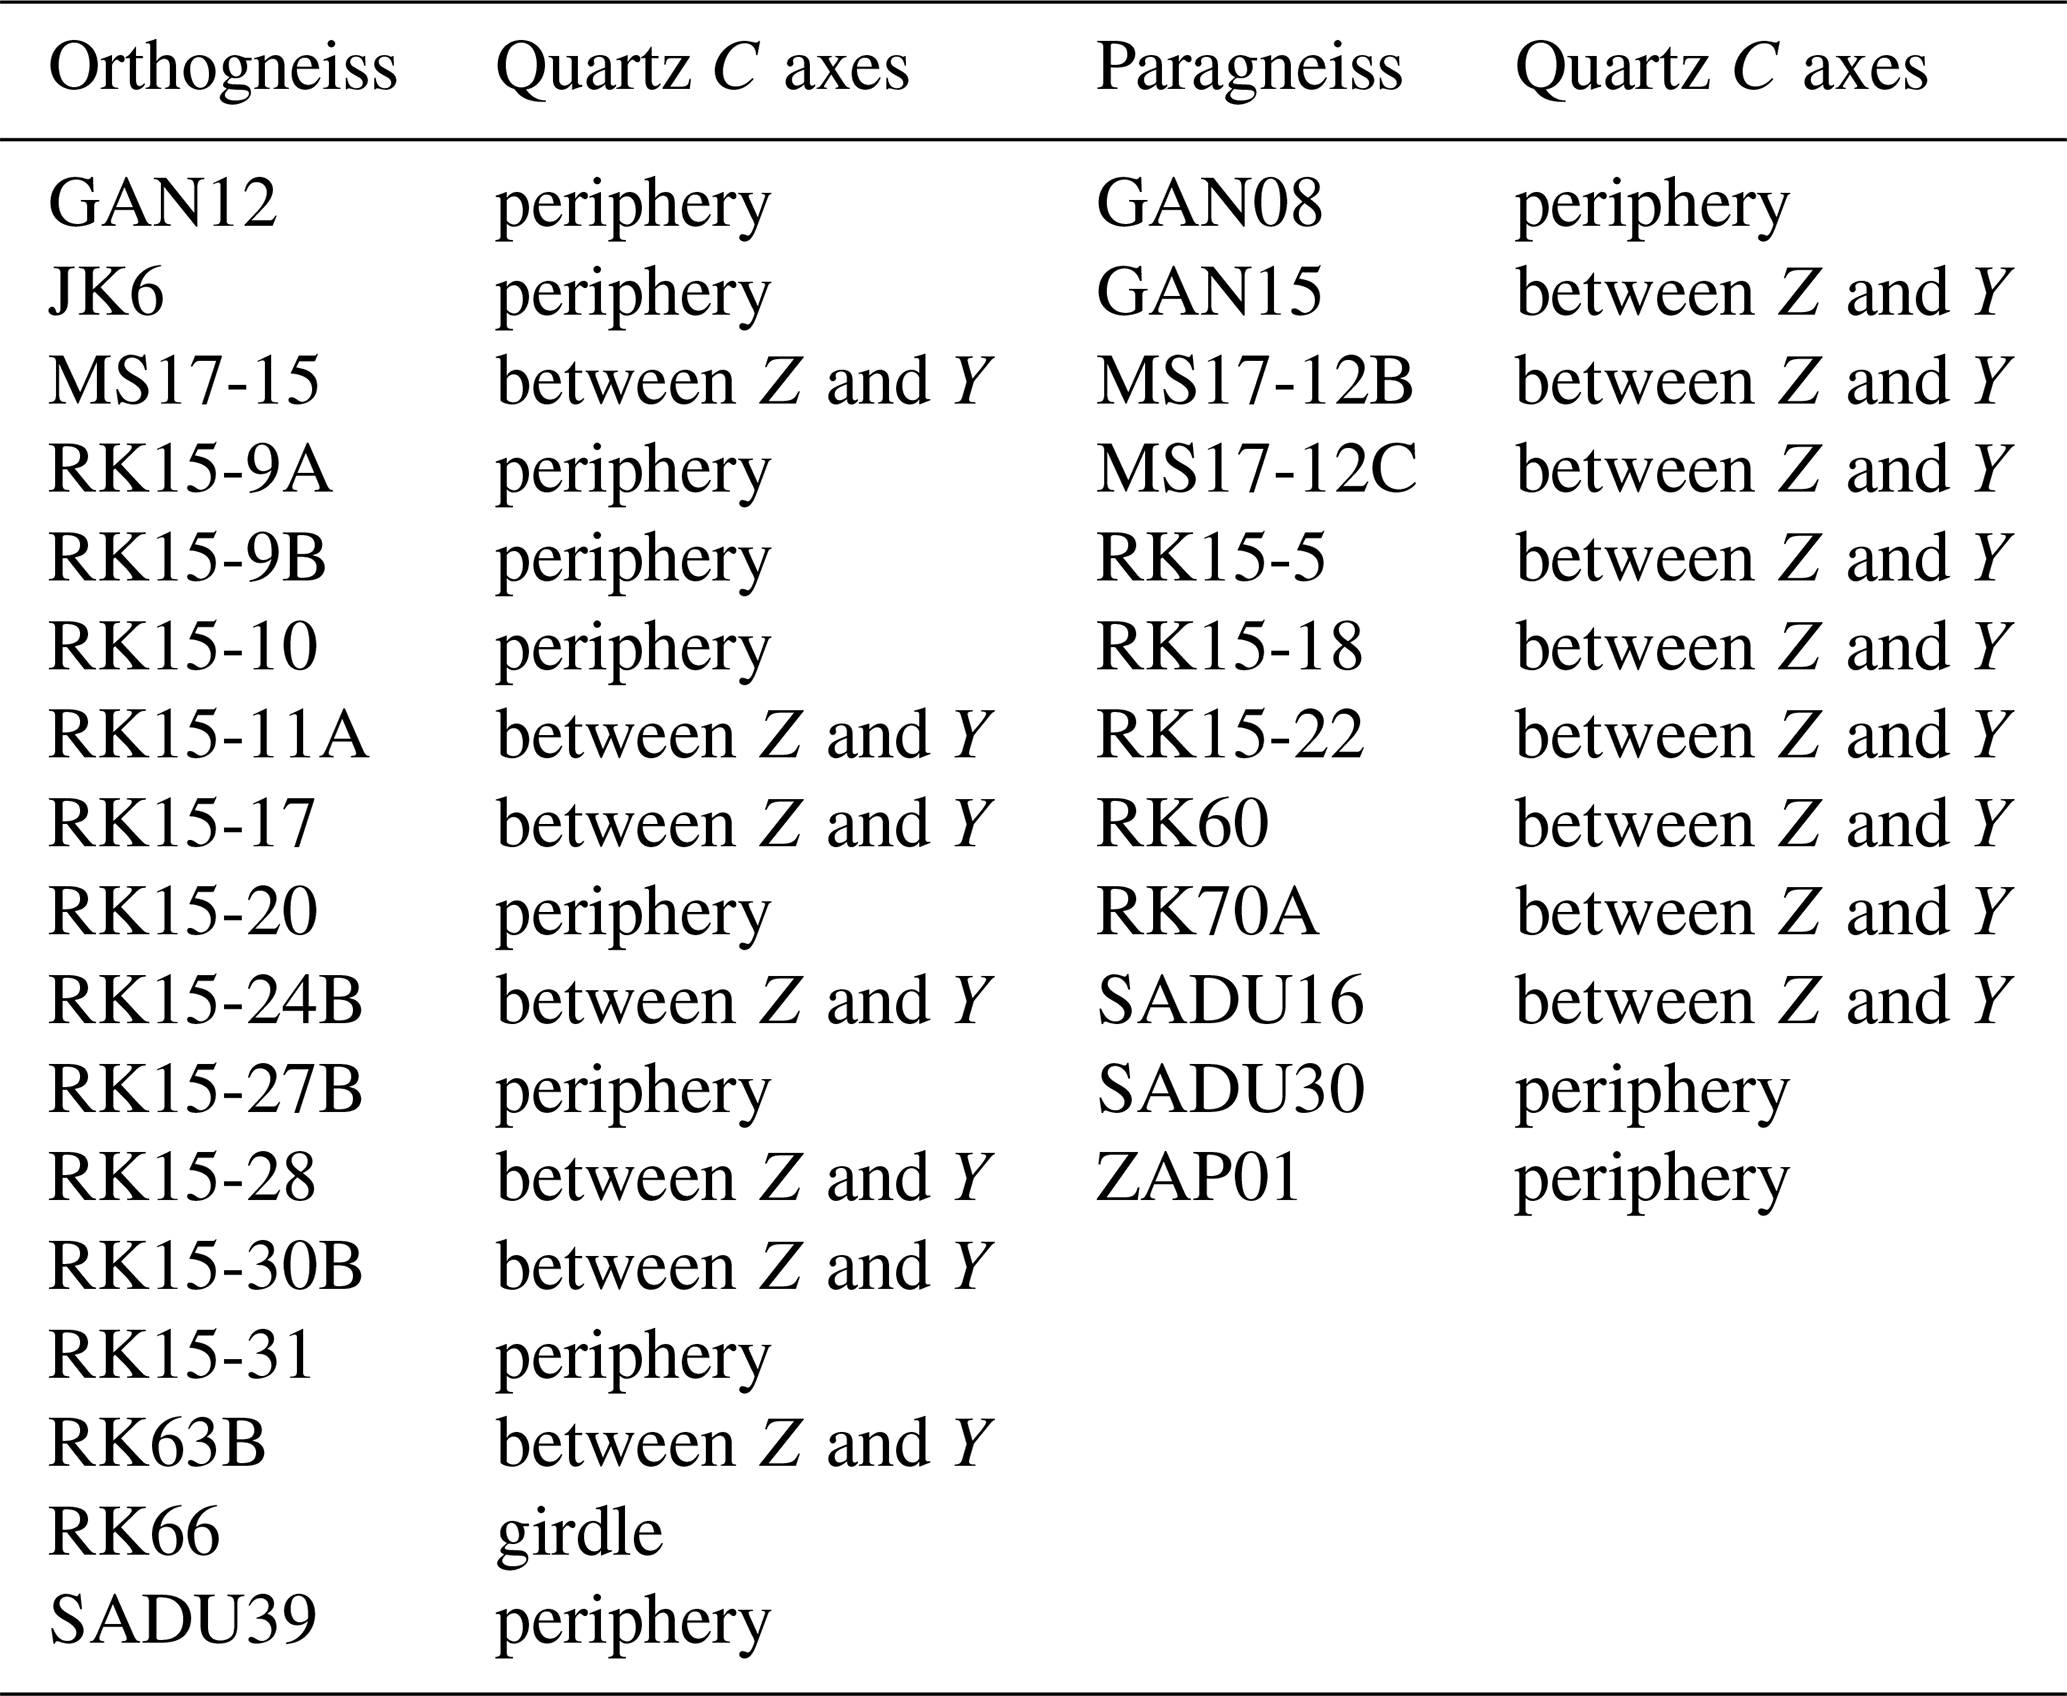
Within the gneiss samples two major CPO patterns occur for quartz. In the first, quartz (0001) yields a maximum between the Z and Y directions of the pole figure. This pattern occurs in 55 % of the samples containing quartz. In the second pattern, quartz (0001) exhibits peripheral maxima at an angle to the foliation normal, occurring in 45 % of the samples (Fig. 4a and Table A1 in the Appendix). Both fabrics can contain subordinate girdle distributions. Similar quartz (0001) fabrics have been described for other high-pressure gneiss samples (e.g., Kurz et al., 2002; Keller and Stipp, 2011; Keppler et al., 2015). Although the two patterns occur throughout the sample set, the former is more common in the paragneisses, while the latter occurs more frequently in the orthogneiss samples. In all samples quartz (0001) and (11–20) show an asymmetry, which represents a sinistral motion indicating a top-to-the-north sense of shear. This is in accordance with literature and shows Zapport phase deformation in the Adula nappe (e.g., Löw, 1987; Meyre et al., 1993; Pleuger et al., 2003). Different orientation patterns of quartz pole figures (10–11) and (01–11) may be attributed to mechanical Dauphiné twinning or induced by active rhombohedral slip (e.g., Stipp and Kunze, 2008; Wenk et al., 2019). Both biotite and white mica show a strong CPO with a pronounced alignment of their basal planes within the foliation in the gneiss samples (Fig. 4a). It should be noted that in texture analysis (and in texture-based modeling of elastic properties) monoclinic crystals are commonly first defined in a monoclinic setting (Matthies and Wenk, 2009), while a more common second setting is used in this paper with (001) as a cleavage plane of mica. Both plagioclase and kalifeldspar show a very weak to random CPO with only a few exceptions.
The marble sample yields a distinct calcite and dolomite CPO. Calcite exhibits an alignment of (0001) in the Z direction and an alignment of (11–20) in the X direction (Fig. 4c). Both (0001) and (11–20) of dolomite show an angle to the Z and Y direction respectively. In the metabasites, hornblende is the only mineral yielding a pronounced CPO (Fig. 4d). It shows a strong alignment of (010) in Z direction and (001) in X direction in both samples.
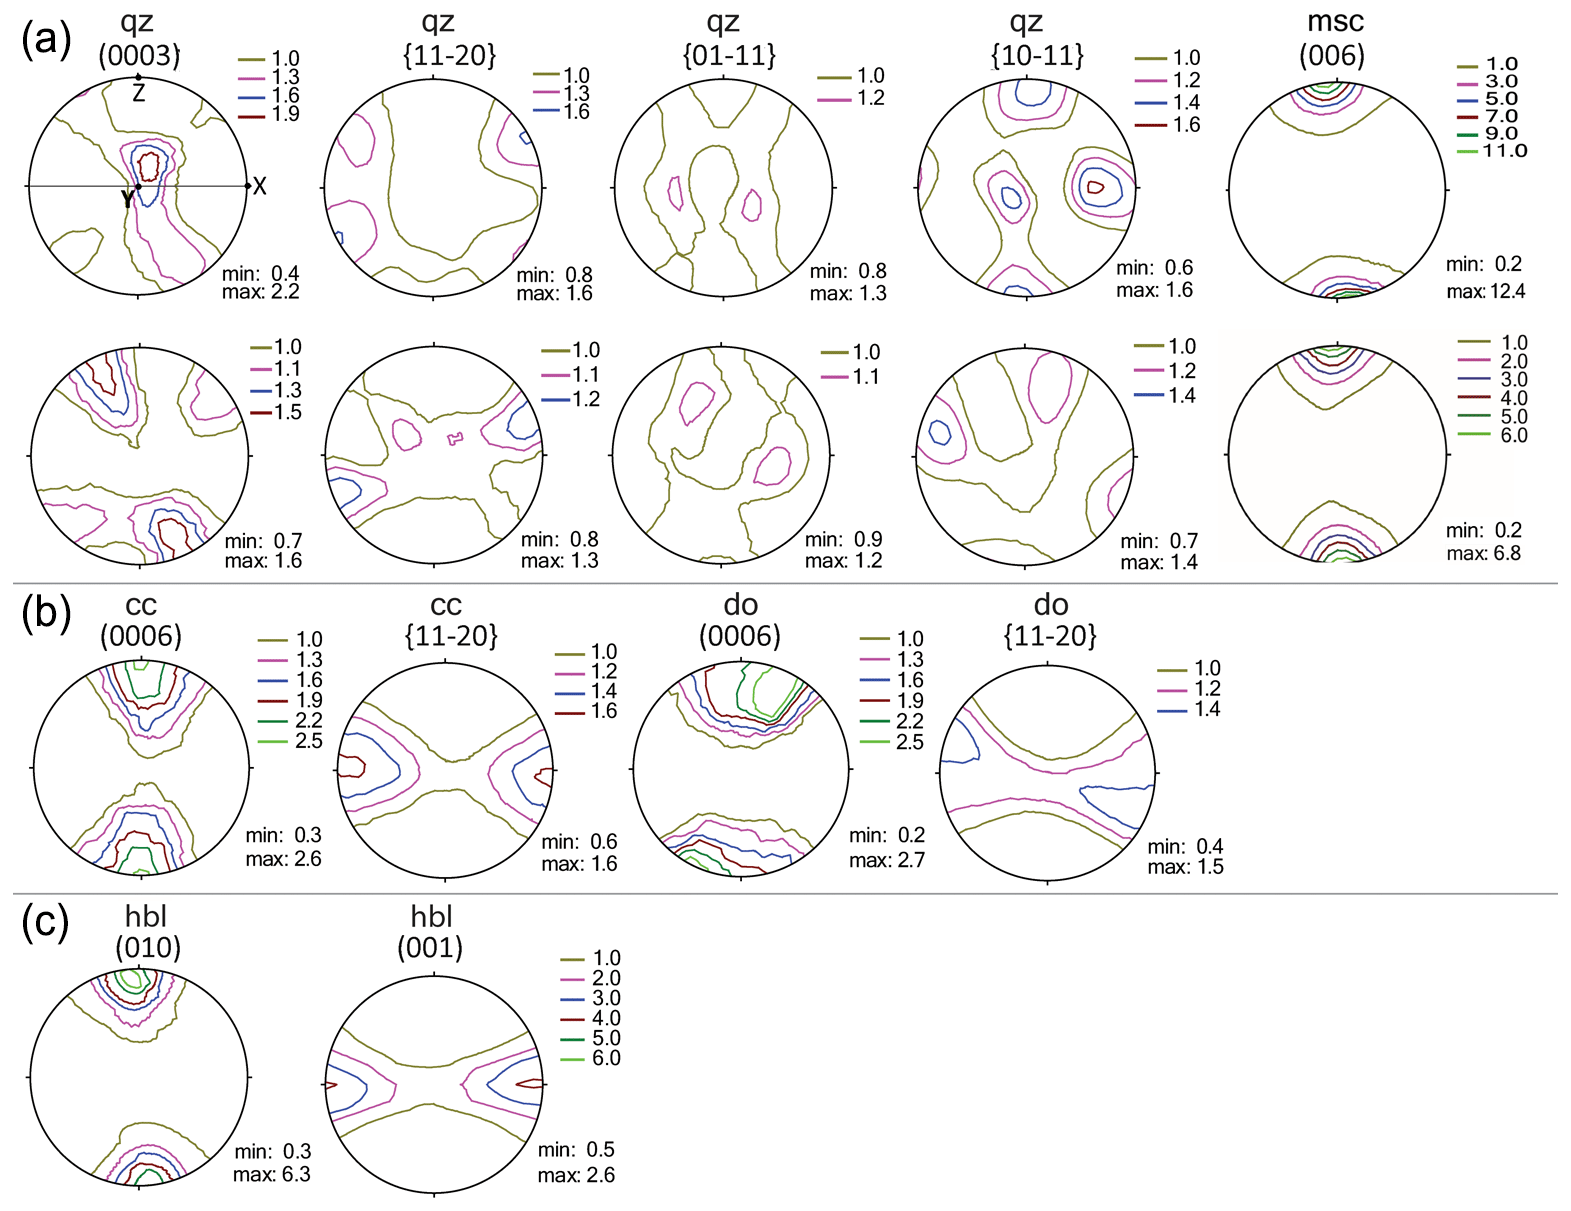
Figure 4CPO types in the sample set: (a) common quartz (top: RK15-28; bottom: JK6) and mica (top: RK15-5; bottom: RK15-28) CPO in the orthogneisses and paragneisses; (b) calcite and dolomite CPO in the marble sample (RK68); (c) typical hornblende CPO in the metabasites (RK15-4). All pole figures are lower hemisphere equal area projections. The foliation normal (Z) is vertical, the lineation (X) is horizontal and north is left.
5.2 Modeled elastic anisotropies of natural samples
5.2.1 Orthogneisses
P-wave anisotropy (AVP) is defined as %. The orthogneisses show two main patterns, one of which yields the highest P-wave velocity (VP) at an angle to the foliation normal, the other exhibiting a VP maximum in the lineation direction with a distribution of high VP values in the foliation plane in some samples (Fig. 5a). The maxima at an angle to the foliation normal are frequently elongated or even show two distinct maxima within an area of higher VP (GAN12, RK15-9A, RK15-27B). Only a few samples deviate from these two patterns showing maxima between the Y direction and the foliation normal (RK63B, RK66) or several maxima within the foliation plane (MS17-15, SADU39). AVP lies between 1.3 % and 5.3 % with an average of 2.9 %. ratios are between 1.51 and 1.67 (Table 2a) with an average of 1.60.
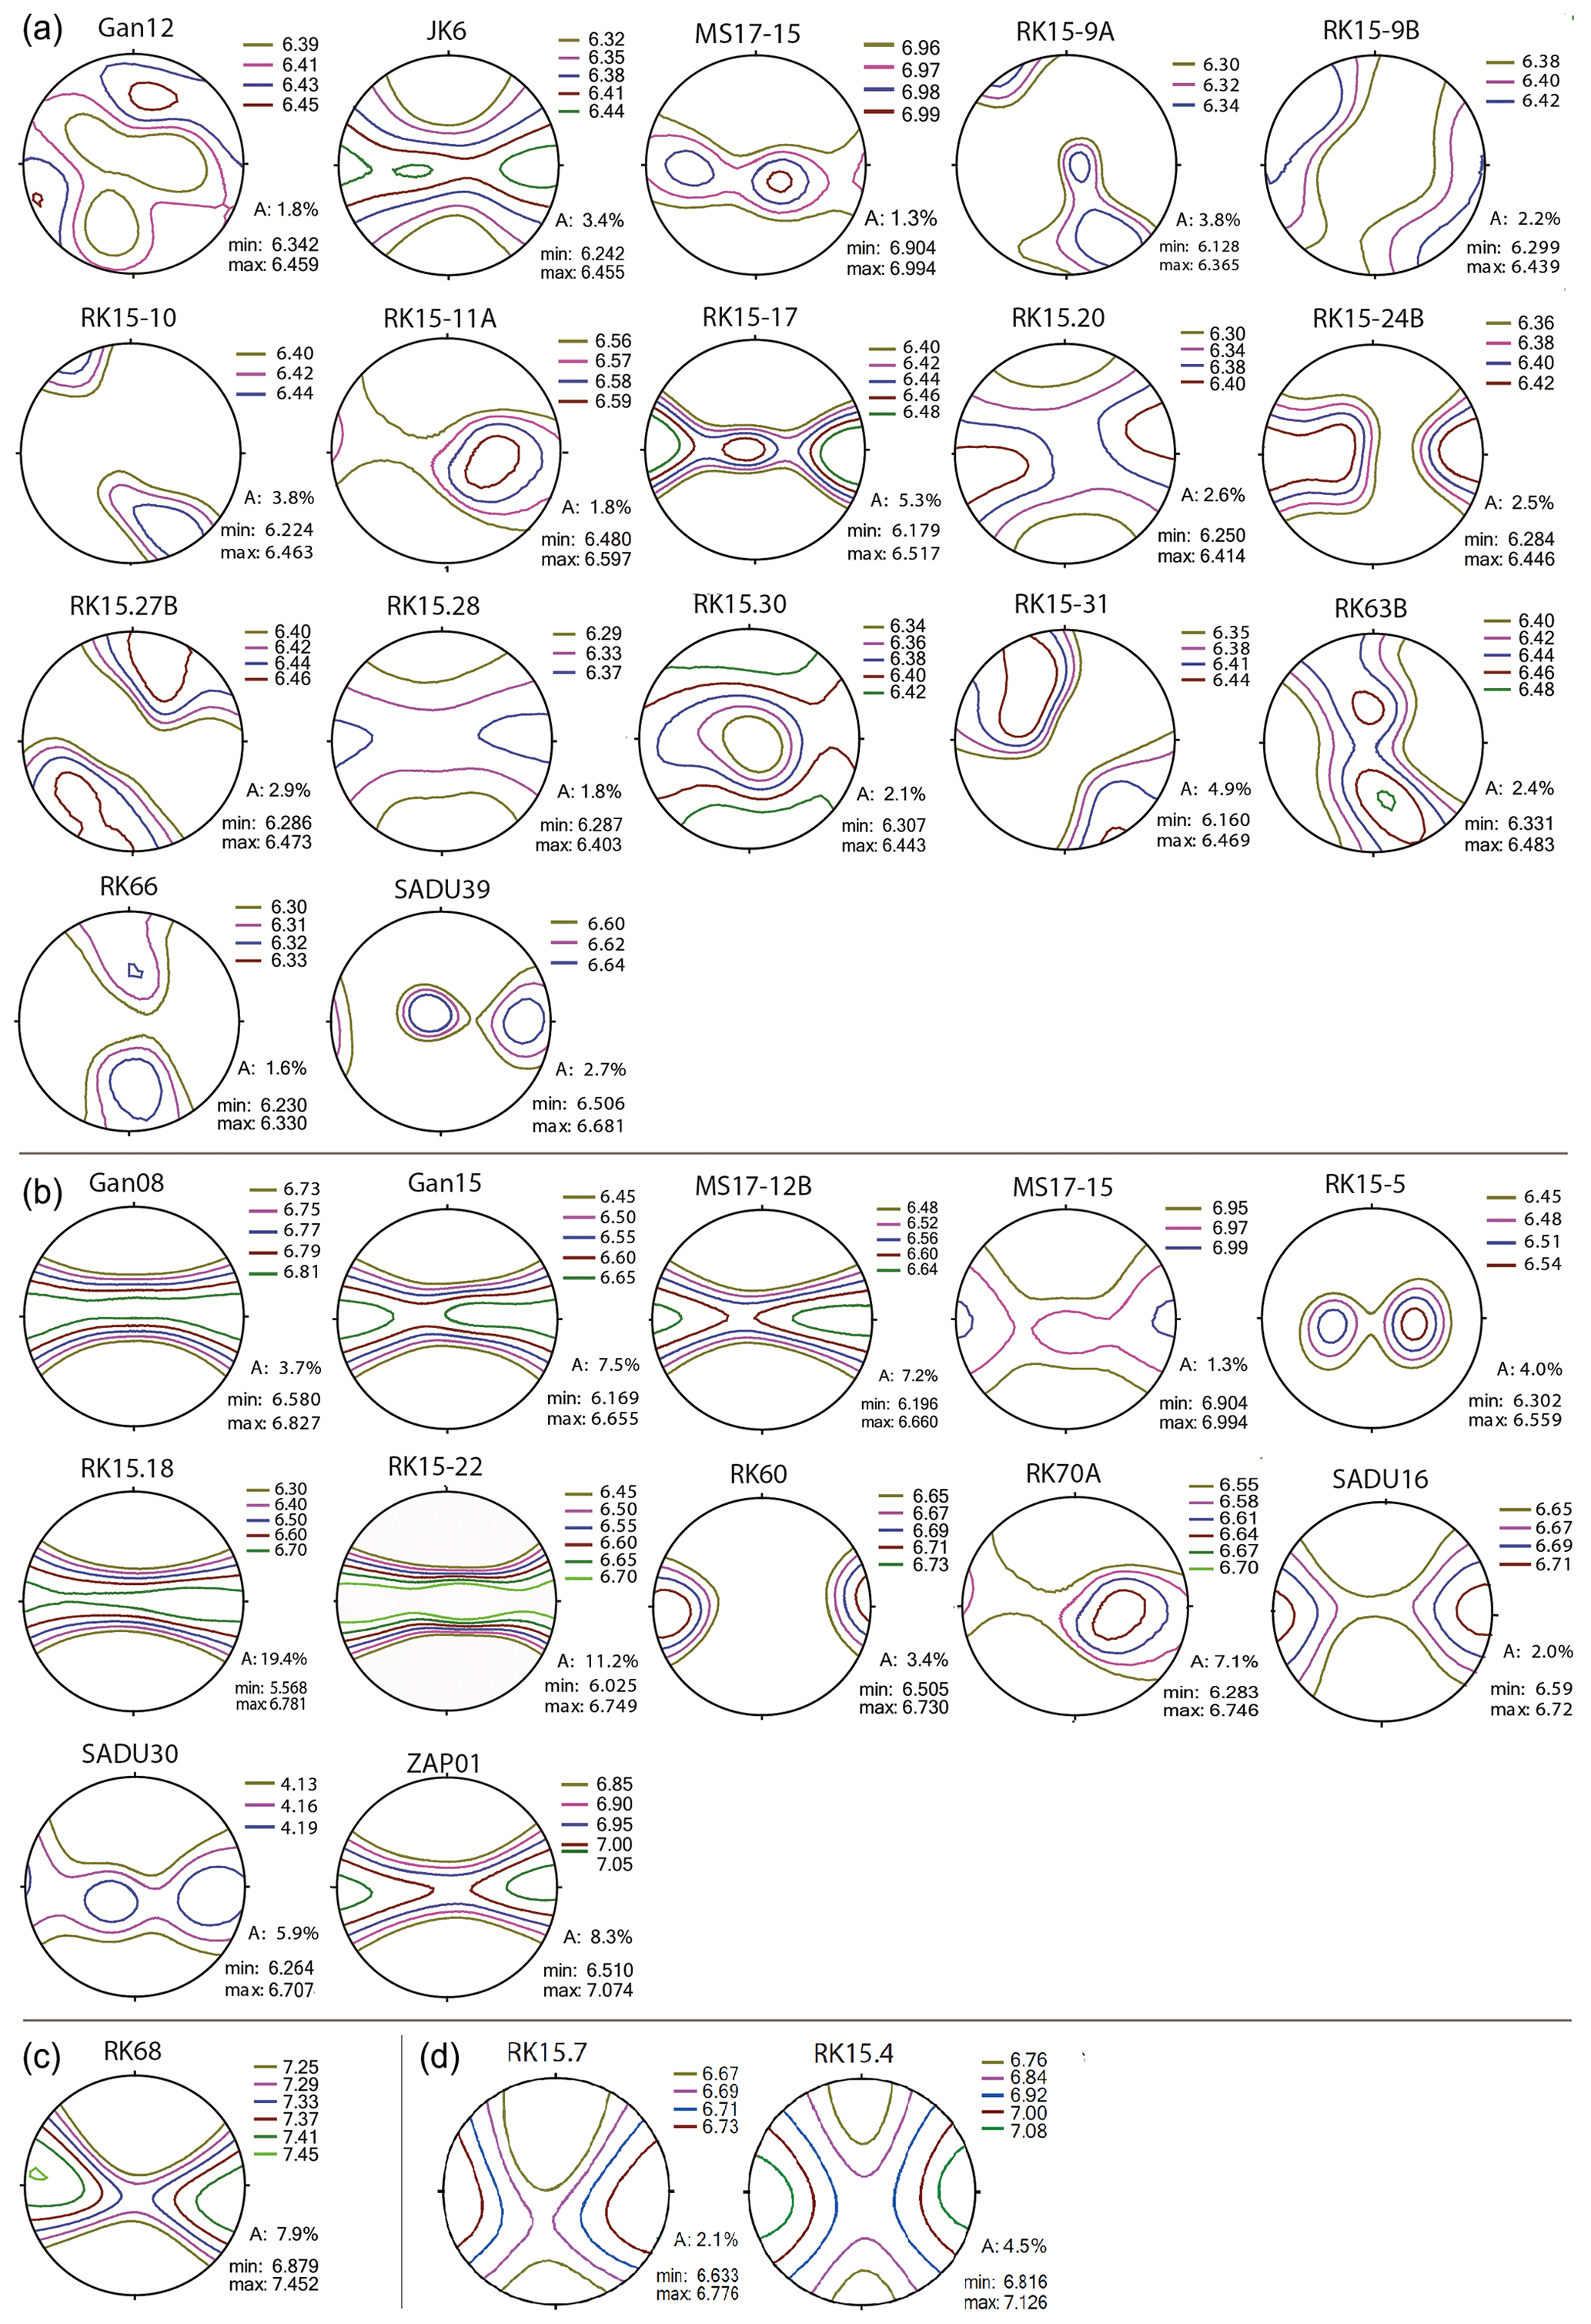
Figure 5Modeled P-wave anisotropies of all natural samples in equal area stereographic projection: (a) orthogneisses, (b) paragneisses, (c) marble and (d) metabasites. Contour lines as well as minima and maxima are in km/s. The foliation is perpendicular to the projection plane; the lineation is horizontal. XYZ orientation is the same as in Fig. 4.
Table 2P-wave and S-wave anisotropy, ratio, and Voigt average of P-wave and S-wave velocities of (a) orthogneisses, (b) metasediments and (c) metabasites.
5.2.2 Paragneisses
The paragneiss samples all show the highest VP value within the foliation plane (Fig. 5b). Most samples also yield a maximum in the lineation direction. There are two samples displaying maxima within the foliation plane but not aligned in the lineation direction (RK15-5; SADU30). The AVP of the paragneisses is highly variable ranging from 2.0 % to 20.5 % (Table 2b). Most samples, however, show a moderate AVP of 7 %–8 %. ratios lie between 1.55 and 1.65.
5.2.3 Minor lithologies
The marble sample RK68 exhibits an AVP of 7.9 % with a maximum at a small angle to the lineation direction and some distribution of high VP values in the foliation plane (Fig. 5c). Its ratio is 1.82 (Table 2b).
The VP distributions in the metabasites show a pronounced maximum in the lineation direction (Fig. 5d). Lowest VP is found parallel to the foliation normal. AVP values are 4.5 % and 2 % with ratios of 1.79 and 1.76, respectively (Table 2c).
5.3 Measured elastic anisotropies of natural samples
The VP distribution of the two gneiss samples, which were measured using ultrasound at different confining pressures, both show high VP in the foliation plane. The orthogneiss RK15-17 yields a maximum VP within the foliation plane at a slight angle to the lineation (Fig. 6a). At maximum pressures of 400 MPa its AVP is 14 %. The paragneiss RK15-22 was measured at a maximum pressure of 300 MPa. Maximum VP is aligned in the lineation direction (Fig. 6b). It exhibits an AVP of 17 %. Both samples show increasing VP values as well as decreasing AVP coefficients with increasing pressures during the experiment (Table 3). In general, the RK15-17 orthogneiss is elastically more isotropic and shows VP values comparable to the RK15-22 paragneiss at pressures over 100 MPa (Table 3), but at lower pressures P-wave velocities in the orthogneiss decrease drastically, and the elastic anisotropy significantly increases, reaching values much higher than in the paragneiss.

Figure 6P-wave anisotropies of (a) an orthogneisses (RK15-17) and (b) a paragneiss (RK15-22) measured using ultrasounding. Panels show P-wave distribution at maximum pressures in the experiments. VP distribution of RK15-22 modeled with GMS algorithm at 300 MPa (c) and at crack-free pressures (d). Contour lines, as well as minima and maxima are in km/s. XYZ orientation is the same as in Figs. 4 and 5.
5.4 “Average” rock concept and crack-free “average” rock
Elastic properties and elastic wave velocities in rocks are normally assessed in laboratory measurements on samples of several centimeters in length. To implement elastic anisotropies in geophysical models these laboratory-derived elastic properties need to be upscaled to a kilometer scale. It is necessary to calculate elastic properties of the rock massif in a long-wavelength approximation (Berryman, 1980), and thus a whole rock massif may be represented as an effective “average” rock. It should feature average CPOs, volume fractions and grain shapes of minerals, as well as average pore and crack patterns. Of course one needs to bear in mind that even in these larger massifs heterogeneities like the aforementioned lenses and layers of different lithologies exist.
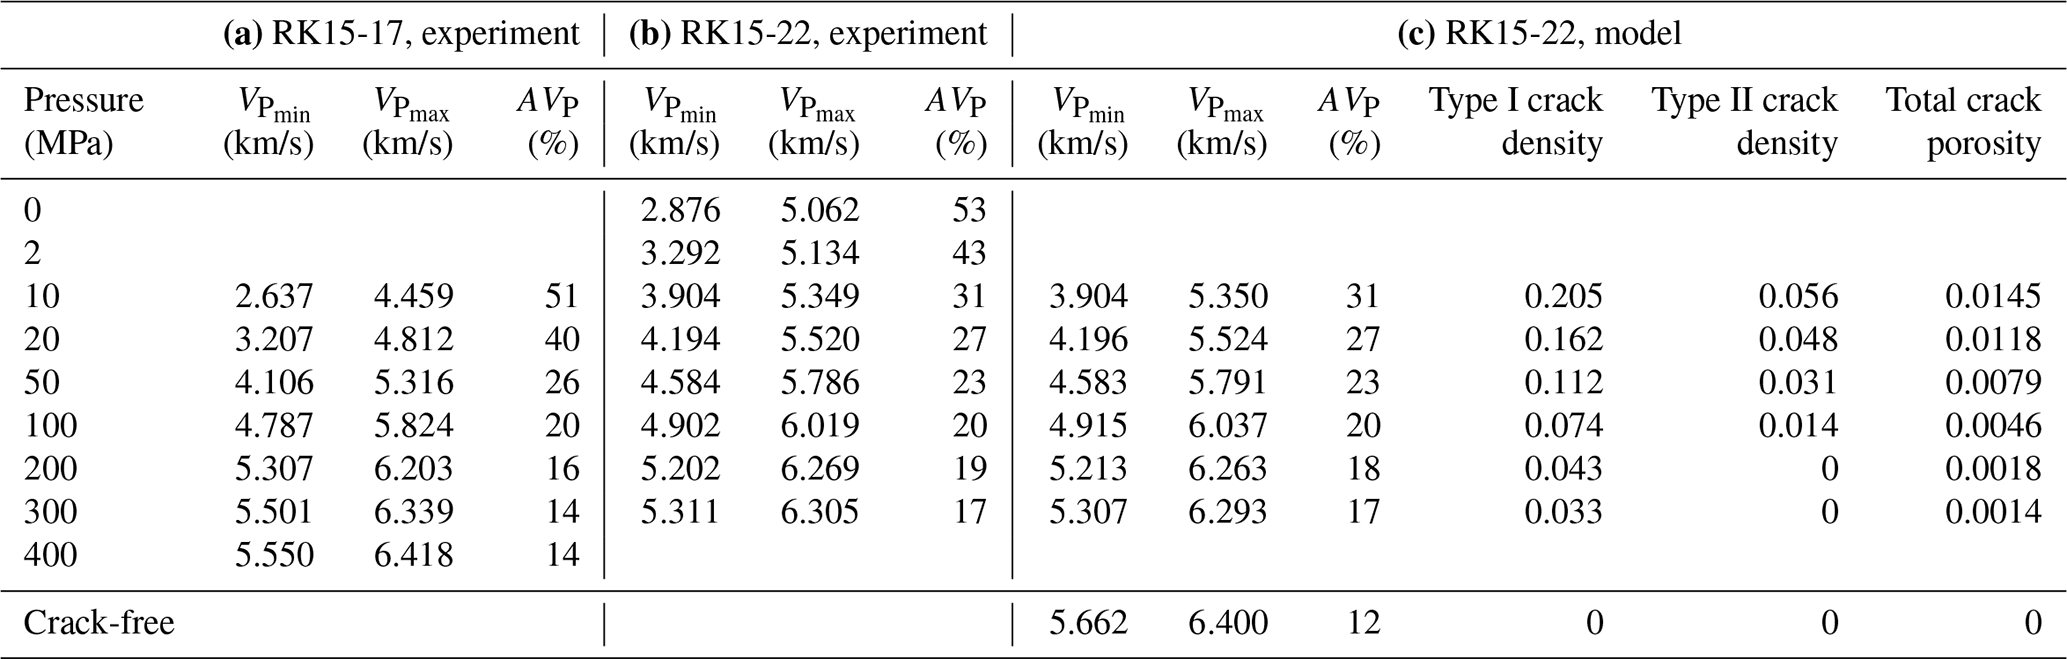
Table 3Results of ultrasonic measurements of (a) orthogneiss RK15-17 and (b) paragneiss RK15-22 showing VP and AVP at increasing pressures. (c) VP and AVP of RK15-22 modeled with GMS algorithm.
As a first approximation to the crustal properties, only major minerals were considered for the “average” rock: plagioclase, muscovite and quartz. Minor or uncommon mineral phases were omitted. From the selection of 30 natural crustal rocks, we identified characteristic CPO types and average CPO strengths for all common mineral phases. In general, feldspar shows weak to random CPO, even in strongly deformed samples. Furthermore, only minor differences have been observed between plagioclase and kalifeldspar. Therefore, the ODF of a representative plagioclase with weak texture was chosen for the “average” rock, namely, the albite ODF in the RK15-28 sample. Since white mica is most common in both orthogneisses and paragneisses, muscovite was chosen as representative mica for the average rock. In all samples mica shows a pronounced alignment of its basal plane in the foliation. The mica ODF of two samples (RK15-5; RK15-28) was combined in a 1:1 ratio to yield an average preferred orientation for the “average” sample. Likewise, the representative quartz ODF for the average sample was chosen as a combination of CPOs from two different samples (JK6; RK15-28) in a 5:6 ratio, based on the frequency of occurrence of each CPO pattern in the sample set. These two samples show the typical quartz CPO patterns mentioned in Sect. 4.4 and shown in Fig. 4a.
Based on the analysis of all samples, average mineral volume percentages in gneisses (43 % quartz, 40 % plagioclase, 17 % mica) were considered for the “average” rock. The corresponding density value is 2670.7 kg/m3. For the GMS method, grain shapes of minerals should be approximated by ellipsoids. Thin section analysis of samples revealed more or less equiaxed grain shapes of quartz and feldspar and elongated mica platelets with an average aspect ratio of ≈0.2 (Fig. A1). Numerical models revealed that aspect ratios of grains of mica and quartz within 0.1–1 range have only minor influence on bulk elastic properties (Nishizawa and Yoshino, 2001; Vasin et al., 2013; Huang et al., 2021). Consequently, for the “average” rock, we considered spherical grains of quartz and feldspar, and oblate spheroidal grains with an axis ratio for mica. As the shape of mica grains is related to cleavage, the corresponding SPO may be derived from the CPO by considering additional rotation of the crystallite coordinate system (Vasin et al., 2013).
The preferred orientations, mineral volume fractions and grain shapes were combined in a model of the elastic properties for the “average” rock using the GMS approach. The VP distribution in a crack-free “average” rock is shown in Fig. 7. There is a distribution of high VP values within the foliation plane, and the maximum VP direction is located between the lineation (X direction) and the Y direction. The AVP of the “average” crack-free gneiss is 4 %.
This “average” rock would be found at depths of at least 28 km, which means that considering an average crustal thickness most of the crust would be above this point. This is why it is also important to consider the microcrack pattern in such an average rock at lower depth.
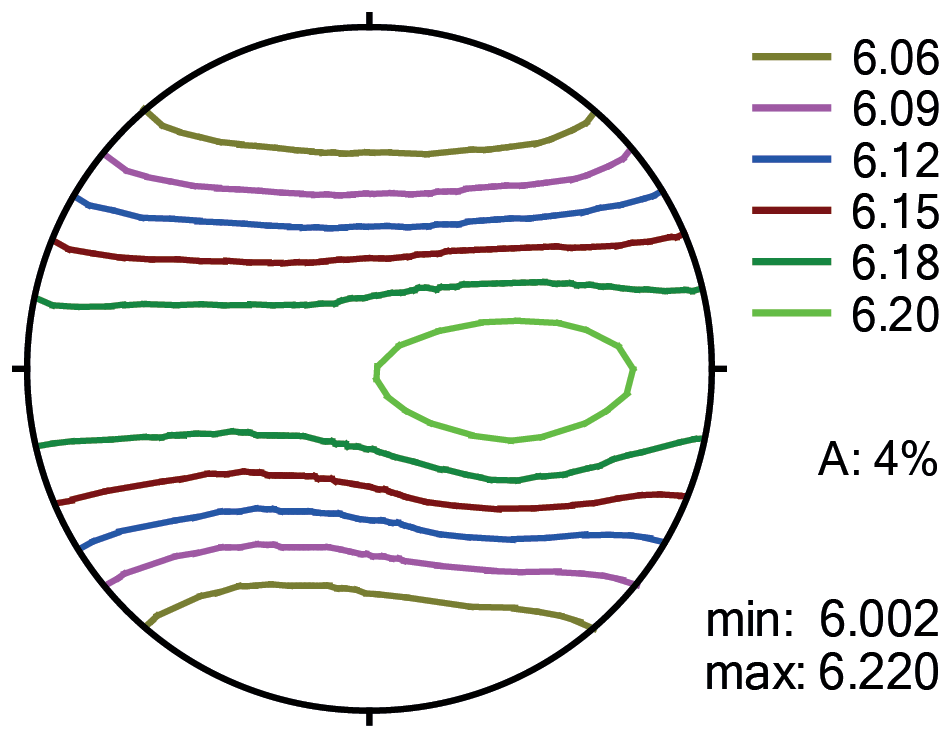
Figure 7Modeled P-wave anisotropies of an average gneiss at 740 MPa. Contour lines as well as minima and maxima are in km/s. XYZ orientation is the same as in Fig. 4.
5.5 “Average” rock with microcrack systems
As directly evident from thin section analysis (Fig. 3), low aspect ratio microcracks are present in the samples. At low overburden depths, these microcracks are open. As seen from Table 3, at low pressures measured elastic wave velocities are decreased and elastic anisotropy is increased compared to the high pressure, where the majority of microcracks are closed. To account for the change in elastic anisotropy of the “average” rock due to pressure or depth changes, it is necessary to include these microcracks and their closure with increasing pressure in the model.
Table 4VP, AVP and crack densities of “average” rock model at increasing pressures and corresponding depth. 740 MPa is an estimation of the pressure where the cracks are closed (see text). Cracks type I have the same ODF as mica.

Table 5Bulk elastic tensor components of the “average” rock model, rounded to first decimal digit.
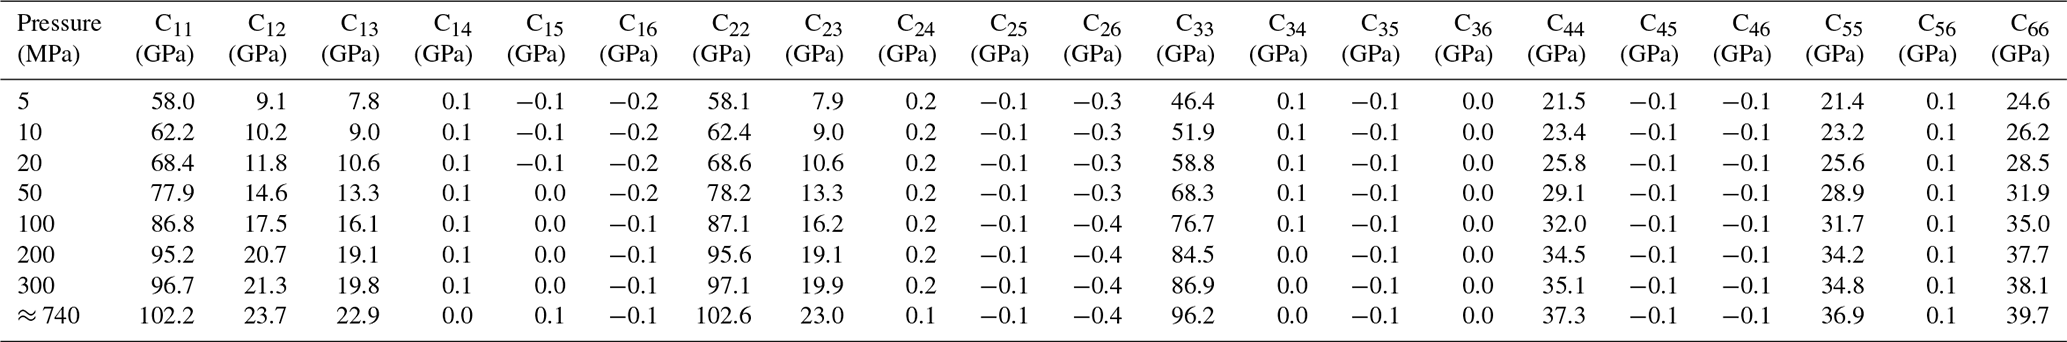
As a first approximation, we considered that the “average” rock should have the same crack distribution as one of the characteristic gneiss samples, i.e., sample RK15-22. From thin section analysis (Fig. 3d–f), two possible microcrack systems were identified. There is one set of microcracks mostly oriented along the muscovite platelets, and we denote this set as type I cracks. Type I cracks were assumed to have the same SPO as muscovite grains; and their aspect ratio was estimated to be ≈0.01 (Fig. A2). As these cracks are roughly parallel to mica platelets, within the GMS algorithm type I cracks were approximated by oblate ellipsoids with an axial ratio of . Another set of cracks – denoted as type II cracks – intersects quartz grains. These cracks are mostly oriented parallel to the Z axis. They display a broader range of aspect ratios with an average of ≈0.025 (Fig. A1). Since these cracks are mostly within equiaxed quartz grains, they were approximated by oblate ellipsoids with an axial ratio of . To determine the changes of crack densities of type I and II with pressure, the following procedure was applied.
Elastic properties of a crack-free RK15-22 gneiss were modeled with GMS algorithm using measured ODFs, mineral volume fractions (55 % quartz, 15 % albite and 30 % muscovite), and assuming spherical grain shapes for quartz and albite, and ellipsoidal grains for muscovite. Using mineral density values from the same references as mineral single crystal elastic properties, a density of 2702.3 kg/m3 was computed for a crack-free RK15-22. Using model elastic properties and this density value, the VP distribution in a crack-free RK15-22 was calculated (Fig. 6c).
Density measurements of RK15-22 at atmospheric pressure yield a value of 2658 kg/m3. Thus, crack porosity in RK15-22 is restricted to a maximum of about ∼ 1.7 %. Consequently, type I and type II cracks were added into the model crack-free RK15-22 gneiss to reproduce measured VP distributions at different pressures, similar to the procedure of porous polycrystalline graphite (Matthies, 2012). The only varying parameters are the type I and type II crack porosities, with the total crack porosity within the aforementioned limit. Using this procedure, an adequate description of experimental VP distributions with the GMS approach was achieved at all pressures above 2 MPa. The wave velocities and AVP values of RK15-22 models are given in Table 3.
At maximum pressure of 300 MPa the experimental VP values are 0.3–0.7 km/s lower than corresponding velocities in the crack-free RK15-22 with the biggest differences for minimum velocities. This implies a small amount of open microcracks in the experiment. Modeling suggests that type II cracks with a 0.025 aspect ratio are not necessary to describe bulk elastic properties of the RK15-22 sample at pressures of 200 MPa and higher. Thus, we assume that type II crack porosity is close to zero at 300 MPa. Since type I cracks orientation distribution is not random, and the material is elastically anisotropic with AVP=17 %, only a rough estimation of type I cracks closure pressure can be made. We averaged the stiffness tensor of crack-free RK15-22 over all directions and applied the relation derived by Walsh (1965) for an isotropic rock to obtain a closure pressure of ≈740 MPa for type I cracks at an aspect ratio of 0.01.
It is recognized that at low crack porosities effective elastic properties of the material depend on the crack density, while crack porosity is irrelevant (Vernik, 2016; Kachanov and Mishakin, 2019). Crack porosity and crack density may be related for certain types and distributions of cracks. For example, in the case where all cracks have the same aspect ratio, as type I or type II pores separately, there is a simple equation (Lokajicek et al., 2021) connecting crack porosity and crack density. Thus, in Table 4, crack densities are given for type I and type II cracks separately, as well as the total crack porosity. We assume that the same system of cracks exists in an “average” sample such as RK15-22, with the same orientation distribution and the same crack density values at corresponding confining pressure. The GMS algorithm was used to add this crack system to the crack-free “average” rock, and the density of the crack-free “average” rock was used to estimate the overburden from the pressure values. From that, the dependencies of all stiffness tensor components of the “average” rock on depth were obtained, as well as the elastic wave velocities and the AVP coefficients (Tables 4 and 5).
We note that the proposed model is intended to reproduce ultrasonic wave velocities measured during sample loading. It may be expected that during unloading, ultrasonic wave velocities would be higher at the same pressure levels due to irreversible closure of some microcracks. This effect would certainly adjust the depth estimates, but it may also change the rock anisotropy if the mechanism of irreversible closure is different for type I and type II cracks. The effect of crack closure should be studied in more detail with respect to rock massifs.
There are various factors influencing the elastic anisotropy of rocks. While the deformation-induced CPO is the main cause, there are other aspects like shape preferred orientation (SPO) of grains, or layering contributing to elastic anisotropy. Another important factor influencing elastic anisotropy, especially at lower depth, is the occurrence of microcracks. In the following, we discuss the elastic anisotropies – calculated and measured – of the natural samples from this study. We will elaborate the applicability of the model “average” rock to larger-scale crustal rock units and critically assess the controlling factors of the elastic anisotropy of crustal rocks.
6.1 Elastic anisotropy of natural samples
6.1.1 Orthogneisses
The AVP calculated from the CPO data of orthogneisses is largely influenced by CPOs of quartz and mica. Since feldspar generally shows weak or no CPO, its presence in the samples mainly contributes to a decrease in AVP. Mica adds to increased VP values within the foliation plane as well as the maxima in the lineation direction in some samples. Highest VP is found within the basal plane of mica single crystals, which defines the VP pattern caused by observed alignment of mica basal planes within the foliation. The maxima in the lineation direction are caused by a slight tilting of mica basal planes around the lineation. This leads to broadening of high VP region within the YZ plane and results in the highest VP in lineation direction. The highest VP values of quartz single crystals are observed to be close to normal to their rhombohedral planes. Patterns showing elongated VP maxima close to the periphery at an angle to the foliation and the patterns with several maxima for VP are due to the influence of quartz CPO. The frequently observed asymmetry in these patterns with respect to the reference frame of foliation and lineation reflects non-coaxial deformation of the rocks. All units in the central Adula Nappe show a top-to-the-north sense of shear (e.g., Nagel, 2008), thereby producing asymmetric quartz CPO, which in turn leads to the asymmetric VP distributions in the mica-poor orthogneisses. Both AVP as well as VP patterns are similar to those in previous studies, which either show high VP in the foliation with a maximum in the lineation direction (Ivankina et al., 2005; Ullemeyer et al., 2006; Kern et al., 2008; Zel et al., 2015; Ivankina et al., 2017; Schmidtke et al., 2021), at an angle to the lineation (Vasin et al., 2017), or elongated asymmetric maxima between the foliation normal and the foliation plane (Ullemeyer et al., 2006; Llana-Fúnez et al., 2009).
The orthogneiss sample RK15-17 measured in the lab shows high VP distributed within the foliation plane with a maximum at a slight angle to the lineation direction. While both the measured and the calculated velocity patterns for this sample show high VP distributed in the foliation plane, the AVP pattern calculated from CPO yields its maximum aligned in the lineation direction with an additional maximum in Y direction. The AVP coefficient calculated from measured P-wave velocities at a pressure of 400 MPa is higher than the calculated one by a factor 2.6, which is mostly due to still open microcracks, not considered within the Voigt averaging scheme. Due to a preferred orientation of microcracks parallel to the mica basal plane (Fig. 3a–c) and an alignment of mica in the foliation VP is slower normal to the foliation and AVP is higher in the samples measured in the lab, even at the highest pressures.
ratios in the orthogneiss samples are influenced by the volume percentage of the constituent mineral phases. Due to the low Poisson ratio of quartz and its generally large volume percentage in the orthogneisses their ratios of 1.51–1.67 are low.
6.1.2 Paragneisses
Like in the orthogneisses, the VP pattern of the paragneisses and mica schists is influenced by mica and quartz CPO with a larger mica contribution due to its generally higher volume content in paragneisses compared to the orthogneisses (Table 1b). Likewise, mica CPO leads to high VP values within the foliation plane and frequently to a VP maximum in the lineation direction. This VP pattern is similar to that of paragneisses in previous studies (e.g., Weiss et al., 1999; Erdman et al., 2013; Keppler et al., 2015; Ullemeyer et al., 2018). VP patterns showing maxima within the foliation plane, but not aligned with the lineation, are likely caused by a discrepancy between CPO formation of quartz and CPO formation of mica. The samples are oriented according to their visible mineral stretching lineation, which was formed by quartz in most samples. The alignment of high velocities is, however, caused mostly by mica CPO and undulating mica grains around the stretching lineation.
The sample measured in the lab, RK15-22, similar to the case of the orthogneiss sample, shows a higher influence of mica on AVP due to its alignment in the foliation and similarly oriented microcracks. While in the calculated VP distribution, high velocities are distributed within the foliation plane, the measured velocities show a distinct maximum in the lineation direction. The measured version also shows a higher AVP than the one calculated from the CPO. The difference, however, is not as large as for the orthogneiss sample. In the case of the paragneiss sample the measured AVP is higher than the calculated one by a factor of 1.5. Similar to the orthogneisses, this value is well in the range of published data comparing experimental and modeled anisotropy. While experimental anisotropies are always higher than the ones modeled using CPO, the factor is variable for gneiss samples ranging from 1.3 (e.g., Vasin et al., 2017) to 6.6 (e.g., Ullemeyer et al., 2006). Considering experimental and modeled elastic anisotropy data of 18 gneiss samples from different studies, experimental anisotropy is 3 times higher than the modeled ones on average (Ivankina et al., 2005, 2017; Punturo et al., 2005; Ullemeyer et al., 2006, 2018; Kern et al., 2008; Kern, 2009; Llana-Fúnez et al., 2009; Lokajicek et al., 2014; Zel et al., 2015; Vasin et al., 2017). ratios of the paragneisses are determined by the volume percentage of quartz and yield values of 1.55–1.64. Higher volume percentages of quartz lead to lower ratios.
Comparing the VP velocities calculated from the Voigt model (Fig. 5b) and the GMS crack-free model (Table 3) of the RK15-22 sample, it is evident that the Voigt model velocities are ≈300–400 m/s higher. Yet, symmetries of velocity distributions and AVP coefficients computed using these two models are quite close, suggesting that the Voigt modeling is reliable to assess the degree of elastic anisotropy of gneisses.
Tables 3 and 4 demonstrate a correlation of measured ultrasonic wave velocities and their anisotropy in RK15-22 gneiss as well as the GMS model based on the two types of cracks at pressures of 5–300 MPa as presented before. At 2 MPa, and also at atmospheric pressure, the proposed model was not able to correctly reproduce experimental VP patterns. At low confining pressure it is observed that both self-consistent and non-interactive theories may be inadequate to describe the elastic velocity behavior, which might be due to unknown crack geometries (Hadley, 1976). It is likely that another system of thinner microcracks is required to match the GMS model and experimental ultrasonic wave velocities in RK15-22 at very low confining pressure.
As expected, the GMS models of RK15-22 at higher pressure require lower crack densities/porosities to describe the experimental ultrasonic data. Modeling suggests that thinner type I cracks are closed at a faster rate with increasing pressure compared to thicker type II cracks. Yet, due to an initially lower crack density of type II cracks, the modeling suggests that their influence on the bulk elastic properties of model RK15-22 gneiss becomes negligible at and above a pressure of 200 MPa. In contrast, type I cracks are necessary to match the experimental and model P-wave velocities at a pressure of 300 MPa. To estimate the closing pressure of type I cracks, we disregarded RK15-22 elastic anisotropy and calculated the average Young's modulus and Poisson ratio of the gneiss. According to the simple model of crack closure in the isotropic rock (Walsh, 1965), the closing pressure of type I cracks is ≈740 MPa.
Naturally, the proposed model based on laboratory measurements of rock properties is quite simplistic, with some limitation coming from the modeling method itself, and others related to available experimental data. The GMS treats material as an infinite effective medium, which is filled by ellipsoidal inclusions without gaps or overlaps. Local heterogeneities, stress concentrators arising (e.g., on grain boundaries), correlations in grain positions or orientations, or size-related effects are not considered. For the “average” rock, accessory phases were discarded, and the most characteristic ODFs, volume fractions and grain shapes of the main minerals were used assuming that the studied set of samples represents the Adula Nappe sufficiently well. We assumed that microcrack systems and their closure with pressure in the “average” rock is the same as in the paragneiss sample. A shape-related distribution of microcracks, deviations of the assumed SPOs of the cracks from those actually present in the gneiss, possible dependence of microcrack SPO on shape of cracks, and changes of all these parameters with pressure, including irreversible closure of different microcracks, are neglected. Our results suggest that even small open crack densities at relatively high confining pressures have a notable influence on the elastic anisotropy of the paragneiss. Therefore, a comprehensive and precise quantification of the microcrack characteristics is necessary to simulate realistic models of pressure dependencies on the bulk elastic properties of rocks.
6.1.3 Marble
In the marble sample, the maximum VP is at a small angle to the lineation caused by the influence of both the dolomite and the calcite CPO. The AVP of marble in the literature is highly variable depending on the grade of deformation (Burlini and Kunze, 1999; Zappone et al., 2000; Punturo et al., 2005; Schmidkte et al., 2021). Since the marble lenses in the Adula Nappe only make up a few meters in thickness they do not contribute to the overall elastic anisotropy of the unit to a large extent. Depending on the thickness and distribution of such lenses or layers, they could be considered for carbonate-rich crustal models. The sample yields a high ratio of 1.82, which is influenced by both calcite and dolomite. These high ratios are typical for marble (e.g., Keppler et al., 2015). The combination of a high ratio as well as high AVP may constrain a very specific signal for marble-rich crust at depth and help to detect specific features such as large subducted carbonate platforms.
6.1.4 Metabasites
The AVP of the metabasites is dominated by hornblende, which has the highest volume percentage and is the only mineral showing a strong CPO. The highest VP is found within the lineation and caused by the alignment of (001), which is close to the highest VP in hornblende single crystals. Due to the stronger hornblende CPO of RK15-4, the AVP is higher in this sample. Studies on elastic anisotropies of metabasites mainly focus on eclogites and blueschists (e.g., Abalos et al., 2011; Bezacier et al., 2010; Keppler et al., 2017; Zertani et al., 2019). Many of the metabasic units exhumed during continental collision, however, are strongly retrogressed with large amounts of amphibole and/or chlorite. Recent studies show that these retrogressed rocks frequently show higher elastic anisotropy than pristine basalts, gabbros or also eclogites due to higher elastic anisotropy of amphibioles compared to pyroxenes, as well as a pronounced deformation during exhumation (e.g., Neufeld et al., 2008; Keppler et al., 2016; Park and Jung, 2020; Schmidtke et al., 2021). ratios of 1.79 and 1.76 for RK15-4 and RK15-7, respectively, are typical for metabasites (e.g., Worthington et al., 2013; Schmidtke et al., 2021).
6.2 Elastic anisotropy of the modeled “average” rock
Realistic upscaling of the rock elastic properties measured within limited scale or on laboratory samples to the seismic scale is of a long-standing interest, e.g., in hydrocarbon reservoirs (Sayers, 1998; Bayuk et al., 2008; Avseth et al., 2010). Here, we consider a rather homogeneous crystalline rock with low crack porosity, and we try to build an effective large-scale model using features of the studied rock massif: average mineral volume fractions, preferred orientations, grain shapes and microcracks systems.
As expected, the “average” rock shows a distribution of high VP values normal to the Z axis due to the preferred orientation of mica, with a maximum VP value at an angle to the X axis due to the influence of the preferred orientation of quartz (Fig. 7). This is a common pattern in the natural sample set (Fig. 5a, b). Some orthogneisses in the natural sample set show maxima at an angle to the foliation normal, which is different from the average sample (Fig. 5a). However, these samples generally show a low AVP and do not strongly contribute to the overall anisotropy. The model suggests decreasing AVP and increasing VP values with increasing depth due to the closure of microcracks. A crack-free “average” rock has VP values slightly over 6 km/s and a rather low AVP of 4 %, which is in between AVP values characteristic for paragneisses and orthogneisses. At lower confining pressure down to 5 MPa (corresponding to a depth of ≈200 m), the model suggests a decrease in VP values to ∼ 4.5 km/s, and an increase in AVP to 12 % (Table 4) due to open microcracks.
One of the main improvements of our model is the better quantification of microcrack systems, as explained in Sect. 6.1.2. Crack closure with increasing pressure in anisotropic gneisses should be studied in more detail to reliably expand the crack closure in RK15-22 paragneiss to large rock units in general. In addition to crack closure due to pressure, microcracks in quartz grains may be sealed by solution–precipitation processes (e.g., Brantley et al., 1990; Vollbrecht et al., 1991; Derez et al., 2015). Microfractures parallel to the r and z rhombohedral planes of quartz can heal after little or no shear displacement (e.g., Menegon et al., 2008). These healed cracks frequently occur as fluid inclusion trails in quartz grains. Experimentally deformed quartz showed that the trails are commonly arranged in planes parallel to the compression axis (Stünitz et al., 2017). Some inclusion trails found in the current samples could be part of the same process (Fig. A2). Intragranular microcracks can also be crystallographically controlled (Vollbrecht et al., 1999). Hence, when the CPO of quartz is strong, a preferred microcrack alignment can also be related to certain crystallographic orientations.
Further model improvement may be achieved by more detailed constraints on the mineral volume fractions and crystallographic textures within the rock massif via more extensive sampling.
The calculated “average” rock model is related to the XYZ coordinate frame, defined by rock foliation and lineation. To improve the model, it is necessary to account for possible foliation or lineation direction changes through the rock unit by relating all crystal and shape preferred orientations to the same global reference frame, e.g., geographical coordinates.
It is evident that the calculated model of the “average” rock does not consider large-scale layering. It may be introduced into the model by creating “average” rock layers consisting of the characteristic minerals with their preferred orientations and microstructures and using a Backus averaging to combine thin (relative to the lateral size) rock layers into a seismic-scale effective medium (Backus, 1962; Sayers, 1998). Furthermore, large-scale faults are an important factor when considering elastic anisotropy and have to be considered in any model of the Alps. Finally, only confining pressure and the density of the crack-free “average” rock were used to estimate the depth values. Compositional variations would change the depth estimates.
Despite all these simplifications of the current model, in principle, the proposed “average” rock may be constructed to represent effective elastic properties on any necessary scale if there is sufficient information on modal composition, textures and microstructures available from the selected samples. Then direct comparison of the “average” rock with seismic data on the uppermost layer of the crust can be made.
6.3 Elastic anisotropy in the Alps
The well-studied geology of the Alps provides comprehensive foliation and lineation maps (e.g., Steck 1990). Surface data can be correlated with seismic imaging making it possible to construct models for different tectonic structures at depth (e.g., Yosefnejad et al., 2017). For the present study, the Adula Nappe was chosen as a representative unit for deformed crust in the Alps. The central part of the Adula Nappe, where the samples for this study have been collected, exhibits a shallowly NE-dipping foliation and a NS-trending lineation mainly formed during peak pressure and early stages of exhumation. The northern and southern parts of the nappe, however, have been overprinted by younger deformation (e.g., Löw, 1987; Nagel, 2008; Kossak et al., 2017).
The aforementioned discrepancy between quartz lineation and mica CPO in several of the samples has not been well studied with respect to the seismic anisotropy. It could be a common issue for most upper crustal units in the Alps, exhibiting a complicated deformation history. Hence, maxima for elastic anisotropies in the lineation direction in mica rich rocks cannot simply be correlated to measurements in the field.
Microcrack distribution and orientation have not been investigated systematically throughout the rock units of the Alps and they might exhibit strong local variations corresponding to the large-scale fracture and fault pattern (e.g., Vilhelm et al., 2010). This has also a great effect on the travel times of P and S waves; i.e., VP and VS are significantly decreased (e.g., Yan et al., 2005; Kelly et al., 2017) and therefore needs to be considered for any large-scale section or model of the Alps (e.g., TRANSALP: Lüschen et al., 2004; Millahn et al., 2005; AlpArray: Hetényi et al., 2018; Molinari et al., 2020).
While deformed granitoids (e.g., orthogneisses) and deformed clastic metasediments (e.g., paragneisses) are the dominant lithologies, the rock spectrum found in the Alps and other collisional orogens ranges from sedimentary rocks as well as metasediments like marbles, micaschists and quartzites; metabasites like eclogites, blueschists, amphibolites and greenschists; and ultrabasic rocks like peridotites and serpentinites. These lithologies might occur as small layers within the larger gneiss massifs contributing to the overall seismic properties, but they also occur throughout the Alps as large coherent units, which have to be considered. Furthermore, volcanic and plutonic intrusions are a common occurrence in collisional orogens.
There are several nappes within the Alps dominated by (meta-)basic (e.g., the Zermatt–Saas zone: Angiboust et al., 2009) and ultrabasic rocks (e.g., the Ivrea Complex: Hartmann and Wedepohl, 1993), which have to be considered in some seismic profiles across the Alps. While we present data on some common minor lithologies, like amphibolite, marble and micaschist, we also refer the reader to data on metasediments (e.g., Punturo et al., 2005), metabasites (e.g., Abalos et al., 2011; Bezacier et al., 2010; Zertani et al., 2020; Schmidtke et al., 2021) and ultrabasic rocks (Mainprice et al., 2000; Ullemeyer et al., 2010). Within the NFP20 EAST profile considered in the present study, amphibolites and marbles mostly occur as small lenses of under 1 km of thickness. Detecting them within the bulk of paragneisses and orthogneisses is less likely. Whether they produce a seismic anisotropy signal will depend, of course, on the seismic wave length. Zertani et al. (2020), for example, used the finite element method to employ eclogite facies shear zones within granulites in models for petrophysical properties. In the present work, however, we consider the elastic anisotropy of major gneiss units most critical for the investigated part of the section and other rock units are negligible because of their small volume proportion. Therefore smaller lithological variations as well as geometrical irregularities have been ignored for the overall model. Gneiss samples in this as well as previous studies generally show an alignment of high VP within the foliation plane. That is why the foliation of gneisses and mica schists formed during continental collision and exhumation is likely a main factor controlling the elastic anisotropies of the continental crust in collisional orogens. The data presented in this study yield a first approximation for average crustal seismic properties with increasing depth as well as the specific seismic property spectrum of this deformed upper crustal section of the Alps.
-
The investigation of a large set of rocks collected in the Adula Nappe, which is considered to be representative of deformed upper crustal rocks in the Alps, indicates a large variety of elastic anisotropies.
-
The Adula Nappe is mostly made up of orthogneisses with modeled AVP between 1.3 % and 5.3 % and ratios between 1.51 and 1.67, as well as paragneisses with modeled AVP between 2.0 % to 20.5 % and ratios between 1.55 and 1.64.
-
Metabasites that make up only 100 m thick lenses show an AVP of 2 %–4.5 % and ratios of 1.76–1.79. Marble lenses of even smaller dimensions yield an AVP of 3.4 % and ratio of 1.83. Yet, these lenses are statistically of small significance for the considered section of paragneisses and orthogneisses.
-
Orthogneiss and paragneiss measured in the lab using ultrasound both show higher AVP as well as lower VP compared to the ones modeled using CPO, which is caused by open microcracks in the rocks at shallow depth.
-
Average elastic anisotropies were calculated for a typical gneiss using common CPO types of constituent mineral phases, mineral content, grain shapes and crack systems within the sample set. Calculated elastic constants are considered to be representative for the range of depths from a few hundred meters up to ≈28 km. The modeled “average” gneiss yields an AVP of 4 % at a depth of ≈28 km, where the vast majority of microcracks is closed. Due to the opening of microcracks, the elastic anisotropy of the model gneiss increases towards shallower depth and reaches AVP=12 % at ≈0.2 km. This makes it possible to either choose parameters of an average sample representative of rocks at depths higher than 28 km, or choose an average sample at increasingly lower depth with progressively opening microcracks, depending on the depth of interest.
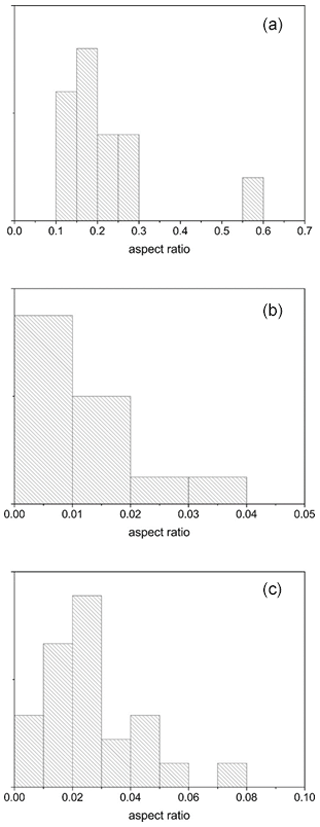
Figure A1Distributions of aspect ratios of mica grains (a), type I (b) and type II (c) cracks based on analysis of several RK15-22 thin sections
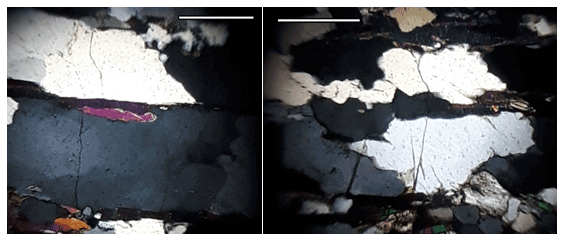
Figure A2Grains of quartz crossed by type II cracks, XZ plane. Parallel to them are some inclusion trails, which could be former microcracks sealed by solution precipitation. White scale bar is 0.4 mm.
Table A1CPO patterns of quartz C-axis maxima within the sample set.
The data are available at https://doi.org/10.6084/m9.figshare.16782766.v1 (Keppler, 2021).
RK wrote the main text and did the field work, the neutron diffraction measurements and the data analysis. RV did the GMS modeling and wrote the paragraphs concerning the models. MS provided expertise on microstructure analysis as well as the interpretation of elastic anisotropy data of rock samples. TL and MP performed the ultrasound measurements. NF provided expertise on Alpine geology.
The authors declare that they have no conflict of interest.
Publisher's note: Copernicus Publications remains neutral with regard to jurisdictional claims in published maps and institutional affiliations.
This article is part of the special issue “New insights into the tectonic evolution of the Alps and the adjacent orogens”. It is not associated with a conference.
We are grateful for the very constructive and elaborate reviews by Benito Abalos, Sascha Zertani, and the anonymous reviewer. These reviews strongly improved our paper. This study was funded by the German research foundation (DFG-grant no. KE 2268/2-1, STI298/9-1) as part of the DFG priority programme “Mountain Building Processes in 4 Dimensions”. Fruitful discussions within the priority programme are gratefully acknowledged. Furthermore, this study was partially supported by the Czech Science Foundation research grants 18-08826S, 21-26542S and by the Czech Academy of Sciences project RVO 67985831. Authors appreciate the access to the SKAT diffractometer at FLNP JINR. The project was partially supported by the JINR theme no. 04-4-1121-2015/2020.
This research has been supported by the Deutsche Forschungsgemeinschaft (grant nos. KE 2268/2-1 and ST 1298/9-1), the Czech Science Foundation (research grant nos. 18-08826S and 21-26542S), the Czech Academy of Sciences (project RVO 67985831), and the Joint Institute for Nuclear Research (theme no. 04-4-1121-2015/2020).
This paper was edited by Mirijam Vrabec and reviewed by Benito Abalos, Sascha Zertani, and one anonymous referee.
Ábalos, B., Fountain, D. M., Gil Ibarguchi, J. I., and Puelles, P.: Eclogite as a seismic marker in subduction channels: Seismic velocities,anisotropy, and petrofabric of Cabo Ortegal eclogite tectonite (Spain), Geol. Soc. Am. Bull., 123, 439–456, 2011.
Abrecht, J.: Geologic units of the Aar massif and their pre-Alpine rock associations: a critical review, Schweiz, Mineral. Petrogr. Mitt., 74, 5–27, 1994.
Aleksandrov, K. S., Alchikov, U. V., Belikov, B. P., Zaslavski, B. I., and Krupny, A. I.: Elastic wave velocities in minerals at atmospheric pressure and increasing precision of elastic constants by means of EVM, Izvestija Academy of Science USSR, Geol. Ser., 10, 15–24, 1974.
Aleksandrov, K. S. and Ryzhova, T. V.: The elastic properties of rock forming minerals, Izvestija Academy of Science USSR, Geophys. Ser., 12, 1799–1804, 1961.
Almqvist, B. S. G., Hirt, A. M., Herwegh, M., Ebert, A., Walter, J. M., Leiss, B., and Burlini, L.: Seismic anisotropy in the Morcles nappe shear zone: Implications for seismic imaging of crustal scale shear zones, Tectonophysics, 603, 162–178, 2013.
Almqvist, B. S. G. and Mainprice, D.: Seismic properties and anisotropy of the continental crust: Predictions based on mineral texture and rock microstructure, Rev. Geophys., 55, 367–433, 2017.
Angiboust, S., Agard, P., Jolivet, L., and Beyssac, O.: The Zermatt-Saas ophiolite: the largest (60-km wide) and deepest (c. 70–80 km) continuous slice of oceanic lithosphere detached from a subduction zone?, Terra Nova, 21, 171–180, 2009.
Avseth, P., Mukerji, T., Mavko, G., and Dvorkin, J.: Rock-physics diagnostics of depositional texture, diagenetic alterations, and reservoir heterogeneity in high-porosity siliciclastic sediments and rocks – A review of selected models and suggested work flows, Geophysics, 75, 31–47, 2010.
Babuška, V.: Elastic anisotropy of igneous and metamorphic rocks, Studia Geophysica et Geodaetica, 12, 291–303, https://doi.org/10.1007/BF02592385, 1968.
Backus, G. E.: Long-wave elastic anisotropy produced by horizontal layering, J. Geophys. Res., 67, 11, 4427–4440, 1962.
Barruol, G., Bonnin, M., Pedersen, H., Bokelmann, G. H. R., and Tiberi, C.: Belt-parallel mantle flow beneath a halted continental collision: The Western Alps, Earth Planet. Sc. Lett., 302, 429–438, 2011.
Barruol, G., Deschamps, A., and Coutant, O.: Mapping upper mantle anisotropy beneath SE France by SKS splitting indicates Neogene asthenospheric flow induced by Apenninic slab roll-back and deflected by the deep Alpine roots, Tectonophysics, 394, 125–138, 2004.
Barruol, G. and Kern, H.: Seismic anisotropy and shear-wave splitting in lower-crustal and upper-mantle rocks from the Ivrea Zone – Experimental and calculated data, Phys. Earth Planet. Int., 95, 175–194, 1996.
Bascou, J., Barruol, G., Vauchez, A., Mainprice, D., and Egydio-Silva, M.: EBSD-measured lattice-preferred orientations and seismic properties of eclogites, Tectonophysics, 342, 61–80, 2001.
Bayuk, I. O., Ammerman, M., and Chesnokov, E. M.: Upscaling of elastic properties of anisotropic sedimentary rocks, Geophys. J. Int., 172, 842–860, 2008.
Ben Ismail, W. and Mainprice, D. : An olivine fabric database: an overview of upper mantle fabrics and seismic anisotropy, Tectonophysics, 296, 145–157, 1998.
Berryman, J. G.: Long-wavelength propagation in composite elastic media I. Spherical inclusions, J. Acoust. Soc. Am., 68, 1809–1819, 1980.
Bezacier, L., Reynard, B., Bass, J. D., Wang, J., and Mainprice, D.: Elasticity of glaucophane, seismic velocities and anisotropy of the subducted oceanic crust, Tectonophysics, 494, 201–210, 2010.
Bhagat, S. S., Bass, J. D., and Smyth, J. R.: Single-crystal elastic properties of omphacite-C2/C by Brillouin spectroscopy, J. Geophys. Res.-Sol. Ea. 97, 6843–6848, 1992.
Bokelmann, G. H. R., Qorbani, E., and Bianchi, I.: Seismic anisotropy and large-scale deformation of the Eastern Alps, Earth Planet. Sc. Lett., 383, 1–6, 2013.
Brantley, S. L., Brantley, B., Evans, S. H., and Hickman, D. A.: Crerar: Healing of microcracks in quartz: Implications for fluid flow, Geology, 18, 136–139, 1990.
Brown, J. M., Abramson, E. H., and Angel, R. J.: Triclinic elastic constants for low albite, Phys. Chem. Miner., 33, 256–265, 2006.
Burlini, L. and Kunze, K.: Fabric and Seismic Properties of Carrara Marble Mylonite, Phys. Chem. Earth, 25, 133–139, 2000.
Challandes, N., Marquer, D., and Villa, I. M.: P-T-t modelling, fluid circulation, and 39Ar-40Ar and Rb-Sr mica ages in the Aar Massif shear zones (Swiss Alps), Swiss J. Geisci., 101, 269–288, 2008.
Christensen, N. I.: Compressional wave velocities in metamorphic rocks at pressures to 10 kbar, J. Geophys. Res., 70, 6147–6164, 1965.
Christensen, N. I.: Compressional wave velocities in rocks at high temperatures and pressures, critical thermal gradients, and crustal low-velocity zones, J. Geophys. Res.-Sol. Ea., 84, 6849–6857, 1979.
Christensen, N. I.: Compressional wave velocities in possible mantle rocks to pressures of 30 kilobars, J. Geophys. Res., 79, 407–412, 1974.
Cholach, P. Y. and Schmitt, D. R.: Intrinsic elasticity of a textured transversely isotropic muscovite aggregate: Comparisons to the seismic anisotropy of schists and shales. J. Geophys. Res., 111, B09410, https://doi.org/10.1029/2005JB004158, 2006.
Christensen, N. I. and Mooney, W. D.: Seismic velocity structure and composition of the continental crust: a global view, J. Geophys. Res., 100, 9761–9788, 1995.
Christoffel, E. B.: Über die Fortpflanzung von Stössen durch elastische, feste Körper, Annali di Matematica, 8, 193–243, 1877.
Dale, J. and Holland, T. B. J.: Geothermobarometry, P–T paths and metamorphic field gradients of high-pressure rocks from the Adula Nappe, Central Alps, J. Metamor. Geol., 21, 813–829, 2003.
Dandekar, D. P.: Variation in the elastic constants of calcite with pressure, Am. Geophys. Union Trans. 49, 323 pp., 1968.
Derez, T., Pennock, G., Drury, M., and Sintubin, M.: Low-temperature intracrystalline deformation microstructures in quartz, J. Struct. Geol., 71, 3–23, 2015.
Engi, M., Todd, S. C. and Schmatz, D. R.: Tertiary metamorphic conditions in the eastern Lepontine Alps, Schweizerische Mineralogische und Petrographische Mitteilungen, 75, 347–396, 1995.
Erdman, M. E., Hacker, B. R., Zandt, G., and Seward, G.: Seismic anisotropy of the crust: Electron-backscatter diffraction measurements from the Basin and Range, Geophys. J. Int., 195, 1211–1229, https://doi.org/10.1093/gji/ggt287, 2013.
Faccenda, M., Ferreira, A. M. G., Tisato, N., Lithgow-Bertelloni, C., Stixrude, L., and Pennacchioni, G.: Extrinsic Elastic Anisotropy in a Compositionally Heterogeneous Earth's Mantle, J. Geophys. Res.-Sol. Ea., 124, 1671–1687, 2019.
Froitzheim, N. and Manatschal, G.: Kinematics of Jurassic rifting, mantle exhumation, and passive-margin formation in the Austroalpine and Penninic nappes (eastern Switzerland), Geol. Soc. Am. Bull., 108, 1120–1133, 1996.
Fry, B., Deschamps, F., Kissling, E., Stehly, L., and Giardini, D.: Layered azimuthal anisotropy of Rayleigh wave phase velocities in the European Alpine lithosphere inferred from ambient noise, Earth Planet. Sc. Lett., 297, 95–102, 2010.
Goncalves, P., Oliot, E., Marquer, D., and Connolly, J.: Role of chemical processes on shear zone formation: an example from the Grimsel metagranodiorite (Aar massif, Central Alps), J. Metamor. Geol., 30, 703–722, https://doi.org/10.1111/j.1525-1314.2012.00991.x, 2012.
Hadley, K.: Comparison of calculated and observed crack densities and seismic velocities in Westerly granite, J. Geophys. Res., 81, 3484–3494, 1976.
Hartmann G. and Wedepohl K. H.: The composition of peridotite tectonites from the Ivrea Complex, northern Italy: Residues from melt extraction, Geochim. Cosmochim. Ac., 57, 1761–1782, 1993.
Heinrich, C. A.: Eclogite facies regional metamorphism of hydrous mafic rocks in the Central Alpine Adula nappe, J. Petrol., 27, 123–154, 1986.
Heteìnyi G., Molinari, I., Clinton, J., Bokelmann, G., Bondár, I., Crawford, W. C., Dessa, J.-X., Doubre, C., Friederich, W., Fuchs, F., Giardini, D., Gráczer, Z., Handy, M. R., Herak, M., Jia, Y., Kissling, E., Kopp, H., Korn, M., Margheriti, L., Meier, T., Mucciarelli, M., Paul, A., Pesaresi, D., Piromallo, C., Plenefisch, T., Plomerová, J., Ritter, J., Rümpker, G., Sipka, V., Spallarossa, D., Thomas, C., Tilmann, F., Wassermann, J., Weber, M., Wéber, Z., Westergom, V., Zivic, M., AlpArray Seismic Network Team, AlpArray OBS Cruise Crew, and AlpArray Working Group: The AlpArray Seismic Network: a large-scale European experiment to image the Alpine orogeny, Surv. Geophys., 39, 1009–1033, 2018.
Hetényi, G., Plomerová, J., Bianchi, I., Kampfová Exnerová, H., Bokelmann, G., Handy, M. R., and Babuška, V.: From mountain summits to roots: crustal structure of the Eastern Alps and Bohemian Massif along longitude 13.3∘ E, Tectonophysics, 744, 239–255, 2018.
Heyliger, P., Ledbetter, H., and Kim, S.: Elastic constants of natural quartz, J. Acoust. Soc. Am., 114, 644–650, 2003.
Huang, J., Devoe, M., Gomez-Barreiro, J., Ren, Y., Vasin, R., and Wenk, H.-R.: Preferred orientation and anisotropy of Slates from Northern Spain, Int. J. Earth Sci., submitted, 2021.
Humbert, P. and Plique, F.: Propriétés élastiques de carbonates rhombohédriques monocristallins calcite, magnésite, dolomite, C. R. Acad. Sci. Paris, 275, 391–394, 1972.
Ivankina, T. I., Kern, H., and Nikitin, A. N.: Directional dependence of P- and S-wave propagation and polarization in foliated rocks from the Kola superdeep well: evidence from laboratory measurements and calculations based on TOF neutron diffraction, Tectonophysics, 407, 25–42, 2005.
Ivankina, T. I., Zel, I. Y., Lokajicek, T., Kern, H., Lobanov, K. V., and Zharikov, A. V.: Elastic anisotropy of layered rocks: ultrasonic measurements of plagioclase-biotite-muscovite (sillimanite) gneiss versus texture-based theoretical predictions (effective media modeling), Tectonophysics, 712–713, 82–94, https://doi.org/10.1016/j.tecto.2017.05.005, 2017.
Ji, S. and Salisbury, M. H.: Shear-wave velocities, anisotropy and splitting in high-grade mylonites, Tectonophysics, 221, 453–473, 1993.
Ji, S., Salisbury, M. H., and Hanmer, S.: Petrofabric, P-wave anisotropy and seismic reflectivity of highgrade mylonites, Tectonophysics, 222, 195–226, 1993.
Ji, S., Wang, Q., and Xia, B.: P-wave velocities of polymineralic rocks: comparison of theory and experiment and test of elastic mixture rules, Tectonophysics, 366, 165–185, 2003.
Kachanov, M. and Mishakin, V. V.: On crack density, crack porosity, and the possibility to interrelate them, Int. J. Eng. Sci., 142, 185–189, 2019.
Karato, S., Jung, H., Katayama, I., and Skemer, P.: Geodynamic Significance of Seismic Anisotropy of the Upper Mantle: New Insights from Laboratory Studies, Annu. Rev. Earth Planet. Sci., 36, 59–95, 2008.
Kelly, C. M., Faulkner, D. R., and Rietbrock, A.: Seismically invisible fault zones: Laboratory insights into imaging faults in anisotropic rocks, Geophys. Res. Lett., 44, 8205–8212, 2017.
Keppler, R.: raw SKAT data, figshare [data set], https://doi.org/10.6084/m9.figshare.16782766.v1, 2021.
Keppler, R., Behrmann, J. H., and Stipp, M.: Textures of eclogites and blueschists from Syros island, Greece: inferences for elastic anisotropy of subducted oceanic crust, J. Geophys. Res.-Sol. Ea., 122, 5306–5324, https://doi.org/10.1002/2017JB014181, 2017.
Keppler, R., Stipp, M., Behrmann, J. H., Ullemeyer, K., and Heidelbach, F.: Deformation inside a paleosubduction channel – insights from microstructures and crystallographic preferred orientations of eclogites and metasediments from the Tauern Window, Austria, J. Struct. Geol., 82, 60–79, 2016.
Keppler, R., Ullemeyer, K., Behrmann, J. H., and Stipp, M.: Potential of full pattern fit methods for the texture analysis of geological materials: Implications from texture measurements at the recently upgraded neutron time-of-flight diffractometer SKAT, J. Appl. Crystallogr., 47, 1520–1535, 2014.
Keppler, R., Ullemeyer, K., Behrmann, J. H., Stipp, M., Kurzawski, R., and Lokajíček, T.: Crystallographic preferred orientations of exhumed subduction channel rocks from the Eclogite zone of the Tauern Window (eastern Alps, Austia), and implications on rock elastic anisotropies at great depths, Tectonophysics, 647, 89–104, 2015.
Kern, H., Ivankina, T. I., Nikitin, A. N., Lokajicek, T., and Pros, Z.: The effect of oriented microcracks and crystallographic and shape preferred orientation on bulk elastic anisotropy of a foliated biotite gneiss from Outokumpu, Tectonophysics, 457, 143–149, 2008.
Kern, H. and Wenk, H.-R.: Fabric-related velocity anisotropy and shear wave splitting in rocks from the Santa Rosa mylonite zone, California, J. Geophys. Res., 95, 11213–11223. https://doi.org/10.1029/JB095iB07p11213, 1990.
Kitamura, K.: Constraint of lattice-preferred orientation (LPO) on Vp anisotropy of amphibole-rich rocks, Geophys. J. Int., 165, 1058–1065, 2006.
Kossak-Glowczewski, J., Froitzheim, N., Nagel, T. J., Pleuger, J., Keppler, R., Leiss, B., and Regent, V.: Along-strike shear-sense reversal in the Vals-Scaradra Shear Zone at the front of the Adula Nappe (Central Alps, Switzerland), Swiss J. Geosci., 110, 677–697, 2017.
Kurz, W., Fritz, H., Tenczer, V., and Unzog, W.: Tectonometamorphic evolution of the Koralm Complex (Eastern Alps): constraints from microstructures and textures of the “Plattengneis” shear zone, J. Struct. Geol., 24, 1957–1970, 2002.
Laubscher, H. P.: Large-scale, thin-skinned thrusting in the southern Alps: Kinematic models, GSA Bull., 96, 710–718, 1985.
Lespinasse, M. and Pêcher, A.: Microfracturing and regional stress field: a study of the preferred orientations of fluid inclusion planes in a granite from the Massif Central, France, J. Struct. Geol., 8, 169–180, 1986.
Link, F. and Rümpker, G.: Resolving seismic anisotropy in the lithosphere-asthenosphere in the Central/Eastern Alps beneath the dense SWATH-D network, Front. Earth Sci., 9, 652–667, https://doi.org/10.3389/feart.2021.679887, 2021.
Llana-Fúnez, S. and Brown, D.: Contribution of crystallographic preferred orientation to seismic anisotropy across a surface analog of the continental Moho at Cabo Ortegal, Spain, GSA Bull., 124, 1495–1513, 2012.
Llana-Fúnez, S., Brown, D., Carbonell, R., Álvarez-Marrón, J., and Salisbury, M.: Seismic anisotropy of upper mantle-lower continental crust rocks in Cabo Ortegal (NW Spain) from crystallographic preferred orientation (CPO) patterns, Trabajos de Geología, Universidad de Oviedo, 29, 432–436, 2009.
Lokajicek, T., Kern, H., Svitek, T., and Ivankina, T.: 3D velocity distribution of P- and S-waves in a biotite gneiss, measured in oil as the pressure medium: Comparison with velocity measurements in a multi-anvil pressure apparatus and with texture-based calculated data, Phys. Earth Planet. Int., 231, 1–15, 2014.
Lokajíček, T., Vasin, R., Svitek, T., Petružálek, M., Kotrlý, M., Turková, I., Onysko, R., and Wenk, H. R.: Intrinsic elastic anisotropy of Westerly granite observed by ultrasound measurements, microstructural investigations, and neutron diffraction, J. Geophys. Res.-Sol. Ea., 126, e2020JB020878, https://doi.org/10.1029/2020JB020878, 2021.
Löw, S: Die tektono-metamorphe Entwicklung der Nördlichen Adula-Decke. Beiträge zur Geologischen Karte der Schweiz N.F., 161, 1–84, 1987.
Lüschen, E., Lammerer, B., Gebrande, H., Millahn, K., and TRANSALP Working Group: Orogenic structure of the Eastern Alps, Europe, from TRANSALP deep seismic reflection profiling, Tectonophys, 388, 85–102, 2004.
Lutterotti, L., Matthies, S., Wenk, H.-R., Schultz, A. J., and Richardson, J. W.: Combined texture and structure analysis of deformed limestone from time-of-flight neutron diffraction spectra, J. Appl. Phys., 81, 594–600, 1997.
Mainprice, D., Barruol, G., and Ben Ismaïl, W.: The seismic anisotropy of the Earth's mantle: from single crystal to polycrystal, in: Earth's deep interior: mineral physics and seismic tomography: from atomic to global: AGU Geophysics Monograph, edited by: Karato, S.-I., Forte, A. M., Liebermann, R. C., Masters, G., and Stixrude, L., American Geophysical Union, 117, 237–264, 2000.
Mainprice, D. and Humbert, M.: Methods of calculating petrophysical properties from lattice preferred orientation data, Surv. Geophys., 15, 575–592, 1994.
Matthies, S.: On the combination of self-consistent and geometric mean elements for the calculation of the elastic properties of textured multi-phase samples, Solid State Phenom., 160, 87–93, 2010.
Matthies, S.: GEO-MIX-SELF calculations of the elastic properties of a textured graphite sample at different hydrostatic pressures, J. Appl. Crystallogr., 45, 1–16, 2012.
Matthies, S. and Humbert, M.: On the principle of a geometric mean of even-rank symmetric tensors for textured polycrystals, J. Appl. Crystallogr. 28, 254–266, 1995.
Matthies, S. and Wenk, H.-R.: Transformations for monoclinic crystal symmetry in texture analysis, J. Appl. Cryst., 42, 564–571, 2009.
Matthies, S., Lutteroti, L., and Wenk, H. R.: Advances in Texture Analysis from Diffraction Spectra, J. Appl. Cryst. 30, 31–42, 1997.
Mauler, A., Burlini, L., Kunze, K., Philippot, P., and Burg, J.-P.: P-wave anisotropy in eclogites and relationship to the omphacite crystallographic fabric, Phys. Chem. Earth, 15, 119–126, 2000.
Menegon, L., Pennacchioni, G., Heilbronner, R., and Pittarello, L.: Evolution of quartz microstructure and c-axis crystallographic preferred orientation within ductilely deformed granitoids (Arolla unit, Western Alps), J. Struct. Geol., 30, 1332–1347, 2008.
Meyre, C. and Pusching, A. R.: High-pressure metamorphism and deformation at Trescolmen, Adula nappe, Central Alps, Schweizerische Mineralogische und Petrographische Mitteilungen, 73, 277–283, 1993.
Meyre, C., De Capitani, C., and Partsch, J. H.: A ternary solid solution model for omphacite and its application to geothermobarometry of eclogites from the Middle Adula nappe (Central Alps, Switzerland), J. Metamor. Geol., 15, 687–700, 1997.
Millahn, K., Lüschen, E., Gebrande, H., and TRANSALP Working Group: TRANSALP-cross-line recording during the seismic reflection transect in the Eastern Alps, Tectonophys., 414, 39–49, 2005.
Molinari, I., Obermann, A., Kissling, E., Hetényi, G., Boschi, L., and AlpArray-EASI working group: 3D crustal structure of the Eastern Alpine region from ambient noise tomography, Results in Geophysical Sciences, 1–4, https://doi.org/10.1016/j.ringps.2020.100006, 2020.
Montagner, J.-P. and Guillot, L.: Seismic Anisotropy and global geodynamics, Mineral. Soc. Am., 51, 353–385, 2003.
Morris, P. R.: Elastic constants of polycrystals, Int. J. Eng. Sci., 8, 49–61, 1970.
Nagel, T. J.: Subduction, collision and exhumation recorded in the Adula nappe, central Alps, in: Tectonic Aspects of the Alpine–Dinarides–Carpathian System: Geological Society, edited by: Siegesmund, S., Fügenschuh, B., and Froitzheim, N., London, Special Publications, 298, 365–392, 2008.
Nagel, T., De Capitani, C., and Frey, M.: Isograds and P-T evolution in the eastern Lepontine Alps (Graubunden, Switzerland), J. Metamor. Geol., 20, 309–324, 2002.
Neufeld, K., Ring, U., Heidelbach, F., Dietrich, S., and Neuser, R. D.: Omphacite textures in eclogites of the Tauern Window: Implications for the exhumation of the Eclogite Zone, Eastern Alps, J. Struct. Geol., 30, 976–992, 2008.
Nishizawa, O. and Yoshino, T.: Seismic velocity anisotropy in mica-rich rocks: an inclusion model, Geophys. J. Int., 145, 19–32, 2001.
Okaya, D., Vel, S. S., Song, W. J., and Johnson, S. E.: Modification of crustal seismic anisotropy by geological structures (“structural geometric anisotropy”), Geosphere, 15, 146–170, 2019.
Oliot, E., Goncalves, P., and Marquer, D.: Role of plagioclase and reaction softening in a metagranite shear zone at mid-crustal conditions (Gotthard Massif, Swiss Central Alps), J. Metamor. Geol., 28, 849–871, 2010.
Park, M. and Jung, H.: Analysis of electron backscattered diffraction (EBSD) mapping of geological materials: precautions for reliably collecting and interpreting data on petro-fabric and seismic anisotropy, Geosci. J., 24, 679–687, https://doi.org/10.1007/s12303-020-0002-2, 2020.
Petrescu, L., Pondrelli, S., Salimbeni, S., Faccenda, M., and the AlpArray Working Group: Mantle flow below the central and greater Alpine region: insights from SKS anisotropy analysis at AlpArray and permanent stations, Solid Earth, 11, 1275–1290, https://doi.org/10.5194/se-11-1275-2020, 2020.
Pfiffner, O. A., Frei, W., Finckh, P., and Valasek, P.: Deep seismic reflection profiling in the Swiss Alps: Explosion seismology results for line NFP 20-EAST, Geology, 16, 987–990, 1988.
Pleuger, J., Hundenborn, R., Kremer, K., Babinka, S., Kurz, W., Jansen, E., and Froitzheim, N.: Structural evolution of Adula nappe, Misox zone, and Tambo nappe in the San Bernardino area: Constraints for the exhumation of the Adula eclogites. Mitteilungen der Österreichischen Geologischen Gesellschaft, 94, 99–122, 2003.
Pros, Z., Lokajíček, T., Přikryl, R., and Klima, K.: Direct measurement of 3D elastic anisotropy on rocks from the Ivrea Zone (Southern Alps, NW Italy), Tectonophysics, 370, 31–47, 2003.
Puelles, P., Ábalos, B., Gil Ibarguchi, J. I., and Rodríguez, J.: Scales of deformation partitioning during exhumation in a continental subduction channel: A petrofabric study of eclogites and gneisses from NW Spain, J. Metamor. Geol., 36, 225–254, 2018.
Punturo, R., Kern, H., Cirrincione, R., Mazzoleni, P., and Pezzino, A.: P- and S-wave velocities and densities in silicate and calcite rocks from the Peloritani mountains, Sicily (Italy): the effect of pressure, temperature and the direction of wave propagation, Tectonophysics, 409, 55–72, 2005.
Qorbani, E., Bianchi, I., and Bokelmann, G.: Slab detachment under the Eastern Alps seen by seismic anisotropy, Earth Planet. Sc. Lett., 409, 96–108, 2015.
Reuss, A.: Berechnung der Fließgrenze von Mischkristallen auf Grund der Plastizitätsbedingung für Einkristalle, Z Angewandte Mathematik Mechanik, 9, 49–58, 1929.
Sandmann, S., Nagel, T. J., Herwartz, D., Fonseca, R. O. C., Kurzawski, R. M., and Münker, C.: Lu–Hf garnet systematics of a polymetamorphic basement unit: new evidence for coherent exhumation of the Adula Nappe (Central Alps) from eclogite-facies conditions, Contrib. Mineral. Petrol., 168, 1–21, 2014.
Sayers, C.: Long-wave seismic anisotropy of heterogeneous reservoirs, Geophys. J. Int., 132, 667–673, 1998.
Schaltegger, U.: Unravelling the pre-Mesozoic history of Aar and Gotthard massifs (Central Alps) by isotopc dating – a review, Schweiz, Mineral. Petrogr. Mitt., 74, 41–51, 1994.
Schmid, S. M., Fügenschuh, B., Kissling, E., and Schuster, R.: Tectonic map and overall architecture of the Alpine orogeny, Eclogae Geologicae Helvetiae, 97, 93–117, 2004.
Schmid, S. M. and Kissling, E.: The arc of the western Alps in the light of geophysical data on deep crustal structure, Tectonics, 19, 62–85, 2000.
Schmidtke, M. J., Keppler, R., Kossak-Glowczewski, J., Froitzheim, N., and Stipp, M.: Elastic anisotropies of rocks in a subduction and exhumation setting, Solid Earth, 12, 1801–1828, https://doi.org/10.5194/se-12-1801-2021, 2021.
Silver, P. G.: Seismic anisotropy beneath the continents: probing the depths of geology, Annu. Rev. Earth Space Sci., 24, 385, https://doi.org/10.1146/annurev.earth.24.1.385, 1996.
Simancas, J. F., Tahiri, A., Azor, A., González Lodeiro, F. Martínez Poyatos, D., and El Hadi, H.: The tectonic frame of the Variscan-Alleghanian Orogen in Southern Europe and Northern Africa, Tectonophysics, 398, 181–198, 2005.
Smith, G. P. and Ekström, G.: A global study of Pn anisotropy beneath continents, J. Geophys. Res., 104, 963–980, 1999.
Steck, A.: Une carte des zones de cisaillement ductile desAlpes Central, Eclogae Geologicae Helvetiae, 83, 3, 603–627, 1990.
Stipp, M. and Kunze, K.: Dynamic recrystallization near the brittle-plastic transition in naturally and experimentally deformed quartz aggregates, Tectonophysics, 448, 77–97, https://doi.org/10.1016/j.tecto.2007.11.041, 2008.
Stünitz, H., Thust, A., Heilbronner, R., Behrens, H., Kilian, R., Tarantola, A., and Fitz Gerald, J. D.: Water redistribution in experimentally deformed natural milky quartz single crystals – Implications for H2O weakening processes, J. Geophys. Res.-Sol. Ea., 122, 866–894, 2017.
Ullemeyer, K., Leiss, B., and Stipp, M.: Textures and Microstructures in Peridotites from the Finero Complex (Ivrea Zone, Alps) and its Influence on the Elastic Rock Properties, Solid State Phenomena, 160, 183–188, 2010.
Ullemeyer, K., Lokajíček, T., Vasin, R. N., Keppler, R., and Behrmann, J. H.: Extrapolation of bulk rock elastic moduli of different rock types to high pressure conditions and comparison with texture-derived elastic moduli, Phys. Earth Planet. Int., 275, 32–43, 2018.
Ullemeyer, K., Siegesmund, S., Rasolofosaon, P. N. J., and Behrmann, J. H.: Experimental and texture-derived P-wave anisotropy of principal rocks from the TRANSALP traverse: an aid for the interpretation of seismic field data, Tectonophysics, 414, 97–116, 2006.
Ullemeyer, K., Spalthoff, P., Heinitz, J., Isakov, N. N., Nikitin, A. N., and Weber, K.: The SKAT texture diffractometer at the pulsed reactor IBR-2 at Dubna: Experimental layout and first measurements, Nuclear Instruments and Methods of Physical Research, 412, 80–88, 1998.
Vasin, R., Wenk, H.-R., Kanitpanyacharoen, W., Matthies, S., and Wirth, R.: Anisotropy of Kimmeridge shale, J. Geophys. Res.-Sol. Ea., 118, 3931–3956, 2013.
Vasin, R. N., Lebensohn, R. A., Matthies, S., Tome, C. N., and Wenk, H.-R.: The influence of grain shape and volume fraction of sheet silicates on elastic properties of aggregates: biotite platelets in an isotropic matrix, Geophysics, 79, 433–441, 2014.
Vasin, R.N., Kern, H., Lokajíek, T., Svitek, T., Lehmann, E., Mannes, D.C., Chaouche, M., and Wenk, H.-R.: Elastic anisotropy of Tambo gneiss from Promontogno, Switzerland: a comparison of crystal orientation and microstructure-based modelling and experimental measurements, Geophys. J. Int., 209, 1–20, 2017.
Vaughan, M. T. and Guggenheim, S.: Elasticity of muscovite and its relationship to crystal structure, J. Geophys. Res., 91, 4657–4664, 1986.
Vernik, L.: Seismic petrophysics in quantitative interpretation, chap. 3, 43–86, Society of Exploration Geophysicists, https://doi.org/10.1190/1.9781560803256, 2016.
Vilhelm, J., Rudajev, V., Zivor, R., Lokajícek, T., and Pros, Z.: Influence of crack distribution of rocks on P-wave velocity anisotropy – a laboratory and field scale study, Geophys. Prospect., 58, 1099–1110, 2010.
Voigt, W.: Theoretische Studien über die Elasticitätsverhältnisse der Krystalle, Dieterichsche Verlags-Buchhandlung, Göttingen, 100 pp., 1887.
Vollbrecht, A., Rust, S., and Weber, K.: Development of microcracks in granites during cooling and uplift: examples from the Variscan basement in NE-Bavaria (FRG), J. Struct. Geol., 13, 787–799, 1991.
Vollbrecht, A., Dürrast, H., Kraus, J., and Weber, K.: Paleostress directions deduced from microcrack fabrics in KTB core samples and granites from the surrounding area, Sci. Drill., 4, 233–241, 1994.
Vollbrecht, A., Stipp, M., and Olesen, N. Ø.: Crystallographic orientation of microcracks in quartz and inferred deformation processes: a study on gneisses from the German Continental Deep Drilling Project (KTB), Tectonophysics, 303, 279–297, 1999.
Von Dreele, R. B.: Quantitative texture analysis by rietveld refinement, J. Appl. Cryst., 30, 517–525, 1997.
Walsh, J. B.: The effect of cracks on the compressibility of rock, J. Geophys. Res., 70, 381–389, 1965.
Wehrens, P., Baumberger, R., Berger, A., and Herwegh, M.: How is strain localized in a meta-granitoid, mid-crustal basement section?, Spatial distribution of deformation in the central Aar massif (Switzerland), J. Struct. Geol., 94, 47–67, https://doi.org/10.1016/j.jsg.2016.11.004, 2016.
Weiss, T., Siegesmund, S., Rabbel, W., Bohlen, T., and Pohl, M.: Seismic Velocities and Anisotropy of the Lower Continental Crust: A Review, Pure Appl. Geophys., 156, 97–122, 1999.
Wenk, H.-R., Lutterotti, L., and Vogel, S. C.: Rietveld texture analysis from TOF neutron diffraction data, Powder Diffraction, 25, 283–296, 2010.
Wenk, H.-R., Matthies, S., Donovan, J., and Chateignier, D.: BEARTEX, a Windows-based program system for quantitative texture analysis, J. Appl. Cryst., 31, 262–269, 1998.
Wenk, H.-R., Yu, R., Vogel, S., and Vasin R. Preferred orientation of quartz in metamorphic rocks from the Bergell Alps, Minerals, 9, 277, https://doi.org/10.3390/min9050277, 2019.
Worthington, J. R., Hacker, B. R., and Zandt, G.: Distinguishing eclogite from peridotite: EBSD-based calculations of seismic velocitites, Geophys. J. Int. Seism., 193, 489–505, https://doi.org/10.1093/gji/ggt004, 2013.
Yan, Z., Clayton, R. W., and Saleeby, J.: Seismic refraction evidence for steep faults cutting highly attenuated continental basement in the central transverse ranges, California, Geophys. J. Int., 160, 651–666, 2005.
Zappone, A., Fernàndez, M., García-Duenas, V., and Burlini, L.: Laboratorymeasurements of seismic P-wave velocities on rocks from the Betic chain (southern Iberian Peninsula), Tectonophysics 317, 259–272, 2000.
Zel, I. Y., Ivankina, T. I., Levin, D. M., and Lokajicek, T.: P-wave ray velocities and the inverse acoustic problem for anisotropic media, Crystallography Reports, 61, 623–629, 2016.
Zertani, S., John, T., Tilmann, F., Motra, H. B., Keppler, R., Andersen, T. B., and Labrousse, L.: Modification of the seismic properties of subducting continental crust by eclogitization and deformation processes, J. Geophys. Res.-Sol. Ea., 124, 9731–9754, 2019.
Zertani, S., Vrijmoed, J. C., Tilmann, F., John, T., Andersen, T. B., and Labrousse, L.: P wave anisotropy caused by partial eclogitiation of descending crust demonstrated by modeling effective petrophysical properties, Geochem. Geophys. Geosys., 21, e2019GC008906, https://doi.org/10.1029/2019GC008906, 2020.
Zhang, J. F., Wang, Y. F., and Jin, Z. M.: CPO-induced seismic anisotropy in UHP eclogites, Sci. China Ser D-Earth Sci., 51, 11–21, 2008.
Zhang, J. J., Santosh, M., Wang, X. X., Guo, L., Yang, X. G., and Zhang, B.: Tectonics of the northern Himalaya since the India–Asia collision, Gondwana Res., 21, 939–960, 2012.
- Abstract
- Introduction
- Elastic anisotropies within the Alpine orogen
- Methods
- Sample description
- Results
- Discussion
- Summary and conclusion
- Appendix A
- Data availability
- Author contributions
- Competing interests
- Disclaimer
- Special issue statement
- Acknowledgements
- Financial support
- Review statement
- References