the Creative Commons Attribution 4.0 License.
the Creative Commons Attribution 4.0 License.
 | 08 Sep 2021
A revised image of the instrumental seismicity in the Lodi area (Po Plain, Italy)
Alessandra Schibuola
Maria Adelaide Romano
Marco Garbin
Mariangela Guidarelli
Denis Sandron
Enrico Priolo
We analysed the instrumental seismicity in a sector of the Po Plain (Italy) to define the baseline for seismic monitoring of a new underground gas storage plant that will use the depleted gas reservoir of Cornegliano Laudense, near Lodi. The target area – a square approximately 80 km × 80 km wide – is commonly considered aseismic. The analysed period, 1951–2019, includes all available instrumental data. We gathered the P- and S-phase readings collected by various agencies for more than 300 events, approximately located inside the target area. We processed the earthquakes uniformly, using absolute location algorithms and velocity models adopted by the regional and national monitoring networks. The relocated earthquake dataset depicts an image of weak and deep seismicity for this central sector of the Po Plain, which is quite different from the initial one derived from the existing earthquake catalogues. Within a distance of approximately 30 km from Lodi, earthquakes are extremely rare (on average 0.5 earthquakes per year, assuming a completeness magnitude Mc = 2.7 from the 1980s); only two weak events fall at less than 15 km distance from the reservoir in the whole period 1951–2019. The strongest events instrumentally recorded are related to the seismic sequence of Caviaga in 1951 that represent the first instrumental recordings for that area. Confirming the hypocentral depths recently proposed by Caciagli et al. (2015), the events are far from the gas reservoir; we suggest common tectonic stress of the main shock of 1951 and the M4.2 earthquake of 17 December 2020, based on the similarities in depth, location, and focal mechanism. While it is clear that the deep seismicity corresponds to the collision between the Northern Apennines and the Southern Alps, the characterization of the geological structures that generate earthquakes appears uncertain. Our results are a preliminary benchmark for the definition of seismogenic zones in the Lodi area, whose definition can be improved with the existing observational capabilities now available in the surroundings.
- Article
(16719 KB) - Full-text XML
-
Supplement
(192 KB) - BibTeX
- EndNote


The Po Plain is one of the most strategic areas of Italy with the highest concentration of inhabitants and economic activities. It runs through northern Italy almost east–west for about 300 km, hosting cities of historical value (e.g. Milan) and large industrial districts.
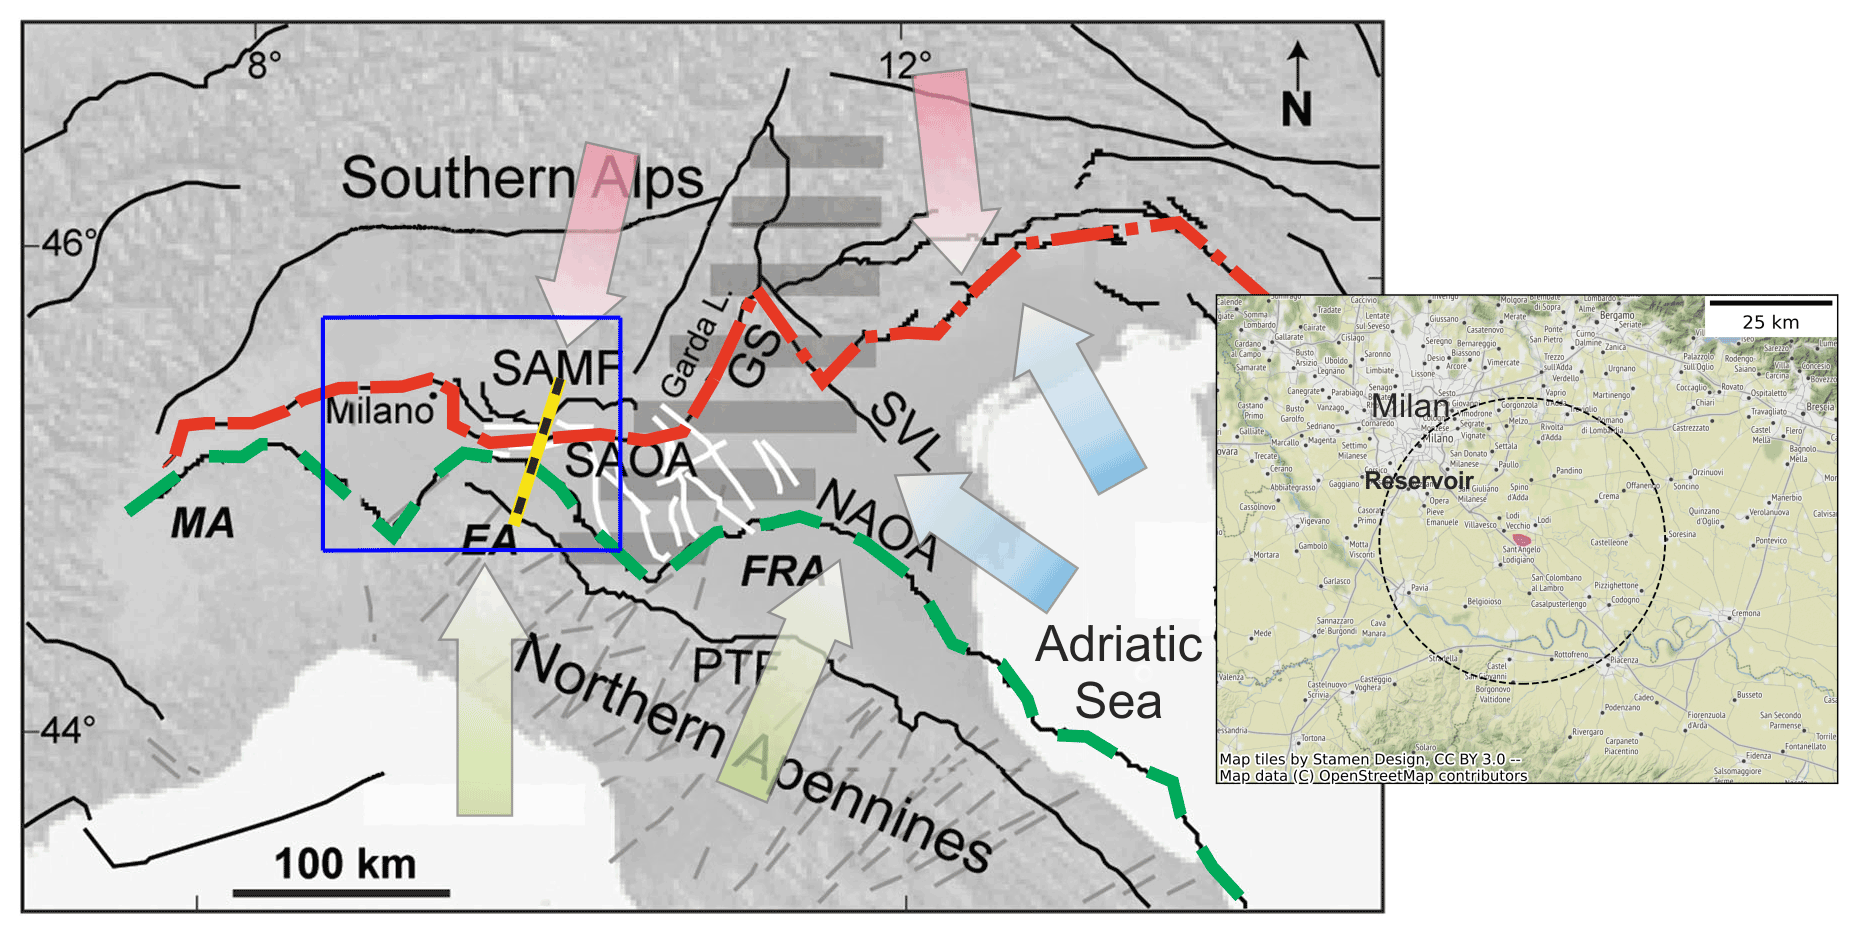
Figure 1Sketch of northern Italy with the opposite verging mountain systems that surround the Po Plain. Main panel: structural map modified after Vannoli et al. (2015). Black lines: main tectonic elements; white lines: inherited faults; horizontal grey shading: platform of Trento; grey thin traits: seismic profiles. The red and green dashed lines indicate the outermost fronts and arcs of the Southern Alps (SAMF, SAOA) and Northern Apennines (NAOA), respectively; the yellow line is approximately the trace of the profiles shown in Fig. 2. Other acronyms are as follows: SVL: Schio-Vicenza fault; GS: Giudicarie System; MA: Monferrato arc; EA: Emilian Arc; FRA: Ferrarese-Romagnolo arc; PTF: foothills of the Apennines. Coloured arrows show the approximate direction of convergence linked respectively to the Eurasia (red), Africa (green), and Adria plates (blue). In the inset, a blow-up of the study area, with the location of the Cornegliano Laudense USG (pink area), and a 30 km distance frame (OD domain, black dashed circle) (© OpenStreetMap contributors, 2021. Distributed under the Open Data Commons Open Database License (ODbL) v1.0.
The Po Plain is a foredeep basin, bounded by two mountain chains, the Northern Apennines southwards, and the Southern Alps northwards, with opposite vergence (Fig. 1). It is characterized by a thick cover of alluvial sediments, deposited by the Po river and its tributaries (Ogniben et al., 1975; Bigi et al., 1990). Due to the origin of its deposits, the Po Plain hosts several natural gas (i.e. methane) reservoirs that are mostly located at depths ranging on average between 1.1 and 1.8 km; the reservoir and sealing rocks are usually Pliocene sands and Lower Pleistocene clays, respectively (Fantoni and Franciosi, 2010; Boccaletti et al., 2011). The Po Plain is also one of the less seismically hazardous areas of Italy (Pagani et al., 2018), but the seismic risk is not negligible (Silva et al., 2018). In addition to the great exposure values, the vulnerability can also be high, since seismic provisions in this area have become mandatory only in the last decade (e.g. DGR, 2014; Peruzza and Pessina, 2016), and earthquakes in the magnitude range 5–6 can be devastating, as shown by the 2012 Emilia sequence (Liberatore et al., 2013; Centro Studi, 2014).
The largest gas reservoirs of the Po Plain were discovered in the 1940s by the Italian public company AGIP and have extensively been used for gas production since the 1950s (Dami, 1952; Bencini et al., 1999). They were the first large gas deposits discovered in Europe: for instance, the reservoir of Caviaga, with about 12 billion scm (standard cubic metre) of gas, was considered a giant reservoir for the time. Once depleted after production, several reservoirs have been re-utilized as underground gas storage (UGS) to hold the natural gas imported from other sites or countries. At present (2021), the Po Plain hosts 11 UGS sites of the 15 in operation in Italy; their storage capacity represents more than 60 % of the total UGS capacity of the country (17.6 billion scm; SNAM, 2018).
One of the most recent UGS facilities developed in Italy is “Cornegliano Stoccaggio”, located in Cornegliano Laudense, a small village near Lodi, about 30 km south of Milan; it is managed by Ital Gas Storage S.p.A. and it re-utilizes the homonymous reservoir discovered in 1951, used for gas production until depletion in 1997. The reservoir is located at a depth of 1.3–1.4 km and the concession extends over an area of approximately 24 km2 (MiSE-DGISSEG-UNMIG, 2021). The storage activity started in December 2018. Following the Italian guidelines for monitoring underground activities (MiSE-UNMIG, 2014), the company decided to implement an integrated seismic and geodetic monitoring voluntarily. The design and management of the monitoring system were commissioned to two Italian public research institutes, i.e. OGS-CRS (National Institute of Oceanography and Applied Geophysics – Centre of Seismological Research) and CNR-IREA (National Council of Research – Institute for Electromagnetic Sensing of the Environment). OGS-CRS is responsible for seismic monitoring (operational since 2017) and coordinates all monitoring activities, while CNR-IREA is responsible for geodetic monitoring. As recommended by the ministry guidelines, the seismic activity must be analysed, if possible, before the start of the storage operations, to define a baseline for the natural seismicity.
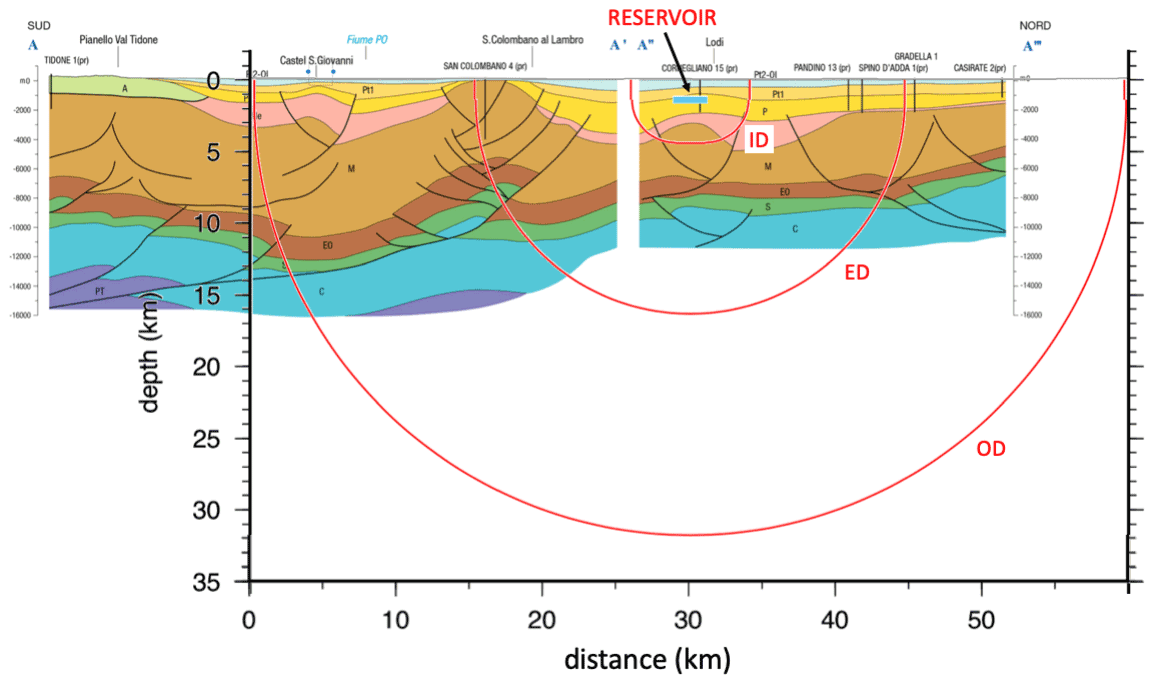
Figure 2Geological NNE–SSW cross sections in the Po Plain, modified after Martelli et al. (2016). The contour lines of the monitoring domains are represented by red circles. ID: inner domain; ED: extended domain; OD: outer domain. Light blue segment: UGS reservoir of Cornegliano Laudense. See text for more details.
We describe the results of the analysis aimed at establishing the seismic baseline before the start of the storage operations. The study area is defined according to the need to analyse the background seismicity in the volume surrounding the underground reservoir. Following the Italian guidelines (MiSE-UNMIG, 2014), two reference domains are identified for seismic monitoring (Fig. 2). The inner domain (ID) is the volume surrounding the reservoir up to a distance of 3 km from its outer edges, with a conventional reservoir depth of 1.4 km; the volume extends upwards to the surface. The extended domain (ED) is a spherical volume with a 15 km radius centred on the main location of the UGS facility (the so-called Cluster A) at the reservoir depth. Since our study area features rare and deep events, we introduce an additional domain, which is called the outer domain (OD) and is delimited by a spherical cap with a 30 km radius, centred like ED. Figure 2 shows the contour lines of the three domains along a vertical cross section approximately N–S oriented. The upper crust structure, as interpreted by Martelli et al. (2016) down to a depth of approximately 10 km, is superimposed. Note that the OD has volume and surface corresponding to approximately 8 and 4 times those of the ED, respectively.
We identify the study area approximately with the OD, for which we summarize the main seismotectonic features and re-analyse the past instrumental seismicity, available from the national and regional catalogues from the early instrumental period (i.e. after the Second World War) until 2019. We deliberately exclude from our analysis the data acquired by the new local seismic network of Cornegliano Laudense, implemented in 2016 and operational since 2017 within the UGS integrated seismic and geodetic monitoring system (http://rete-cornegliano.crs.inogs.it/, last access: 10 August, 2021).
The result of the present study is a revised dataset of instrumental earthquake locations that covers about 70 years. Although this catalogue does not feature uniform quality and completeness characteristics, it represents the most accurate and reliable view of the seismicity in the Lodi area available right now. To further strengthen the relevance of our results, we have also included a brief analysis of the most recent, deep M∼4 earthquake that occurred on 17 December 2020, near Milan. This study is also intended to be a critical view on the quality of earthquake catalogues in weakly seismic areas, and a stimulus for further studies, to improve our knowledge of the deep structures that characterize the collision between the Alps and the Apennines beneath the Po Valley.
Italy is an active tectonic province characterized by two mountain belts: the Alps and the Apennines. They were formed as the result of complex geodynamic processes linked to the progressive migration of the African plate towards the European plate. The two opposite verging fold-and-thrust belts face each other around the Po Plain that geologically coincides with the foreland of both the chains (Fig. 1); it also hosts their foredeeps, and for this reason it has undergone steady subsidence and sedimentation over the past 5 Myr (Fantoni and Franciosi, 2010). The Po Plain represents the north-westernmost buried sector of the Apulian indenter too (i.e. Adria plate, Dercourt et al., 1986). New insights into the tectonic evolution of the Alps and adjacent orogens are made available thanks to the AlpArray initiatives (see http://www.alparray.ethz.ch/en/home/, last access: 10 August 2021, and the special issue at https://se.copernicus.org/articles/special_issue1099.html, last access: 10 August 2021); despite our study area being quite marginal to the main experiments (e.g. Hetényi et al., 2018), some additional constraints, on the Moho depth, for example, are given by Kind et al. (2021). Global Positioning System (GPS) studies show that the convergence rate at the latitude of northern Italy is about 3–8 mm yr−1 (Serpelloni et al., 2007), while the shortening across the Po basin is estimated at 1–3 mm yr−1 and increases from west to east (Devoti et al., 2011).
The Po valley is formed by alluvial sediments deposited by the Po River and its tributaries coming from the southern Alpine and northern Apennine slopes; they are characterized by uneven thickness – the maximum thickness of approximately 7–8 km is located in the eastern Po Plain (Ghielmi et al., 2010) – and the subsidence is asymmetric. Below the alluvial and clastic Cenozoic deposits, the sedimentary sequence includes Mesozoic carbonates and a crystalline basement essentially formed by Hercynian metamorphic rocks. The main fault systems have evolved from extensional (Late Triassic–Early Jurassic) to compressional regimes (Late Cretaceous-Cenozoic), with the inversion of tectonic mechanisms. Triassic-Early Jurassic rift-related structures were locally re-arranged by Cretaceous contractional phases, with the reactivation of some of the existing normal faults (Dal Piaz et al., 2004); during Miocene and Pliocene times, the basin became the foreland of the Alps, and the Apennine belts and the Mesozoic rocks were deeply buried beneath the Palaeogene–Neogene clastics and the associated foredeep wedges. These late sedimentary formations, consisting of alternating shale and sandstone layers, permitted the accumulation of hydrocarbons derived from biogenic sources; sandstones are excellent reservoir rocks for oil and gas, thanks to their porosity, whilst shales with very low permeability act like impermeable barriers. Also, the underlying Triassic carbonates are great reservoir rocks, as in the Villafortuna–Trecate field, 30 km west of Milan. The Po Plain represents one of the major provinces of conventional hydrocarbons in continental Europe (Turrini et al., 2015).
Throughout geological time, both pre-Alpine (Mesozoic and pre-Mesozoic) and Alpine (mainly Cenozoic) orogenic phases have interacted to create the current structural and stratigraphic setting (Carminati and Doglioni, 2012). Three main outer arcs have been suggested or defined for the Northern Apennines, buried below the Pliocene–Quaternary marine and continental deposits. From west to east respectively they are (Fig. 1) the Monferrato Arc, the Emilian Arc (EA), and the Ferrara-Romagna Arc. On the opposite side of the Po Plain, one wide arc running from Milan to the Garda Lake is related to the Southern Alps (Vannoli et al., 2015). The above-mentioned arcs host active tectonic structures capable of generating earthquakes. In most cases, the faults in the Po Valley are blind; i.e. they do not reach the surface and hence cannot be identified by surficial geological-geomorphological surveys (Benedetti et al., 2003). According to the Database of Italian Seismogenic Sources (DISS Working Group, 2018), our study area does not intersect any of the seismogenic sources recognized to date. However, within a distance of approximately 10 km from it, there are the composite sources ITCS002 and ITCS115 towards the NE, belonging to the outer arc of the Southern Alps (SAOA), and ITCS044 towards the S, belonging to the EA. They are expected to have a maximum slip rate of 0.5 mm yr−1 (Maesano et al., 2015) and be capable of a maximum magnitude of 5.5–6.0.
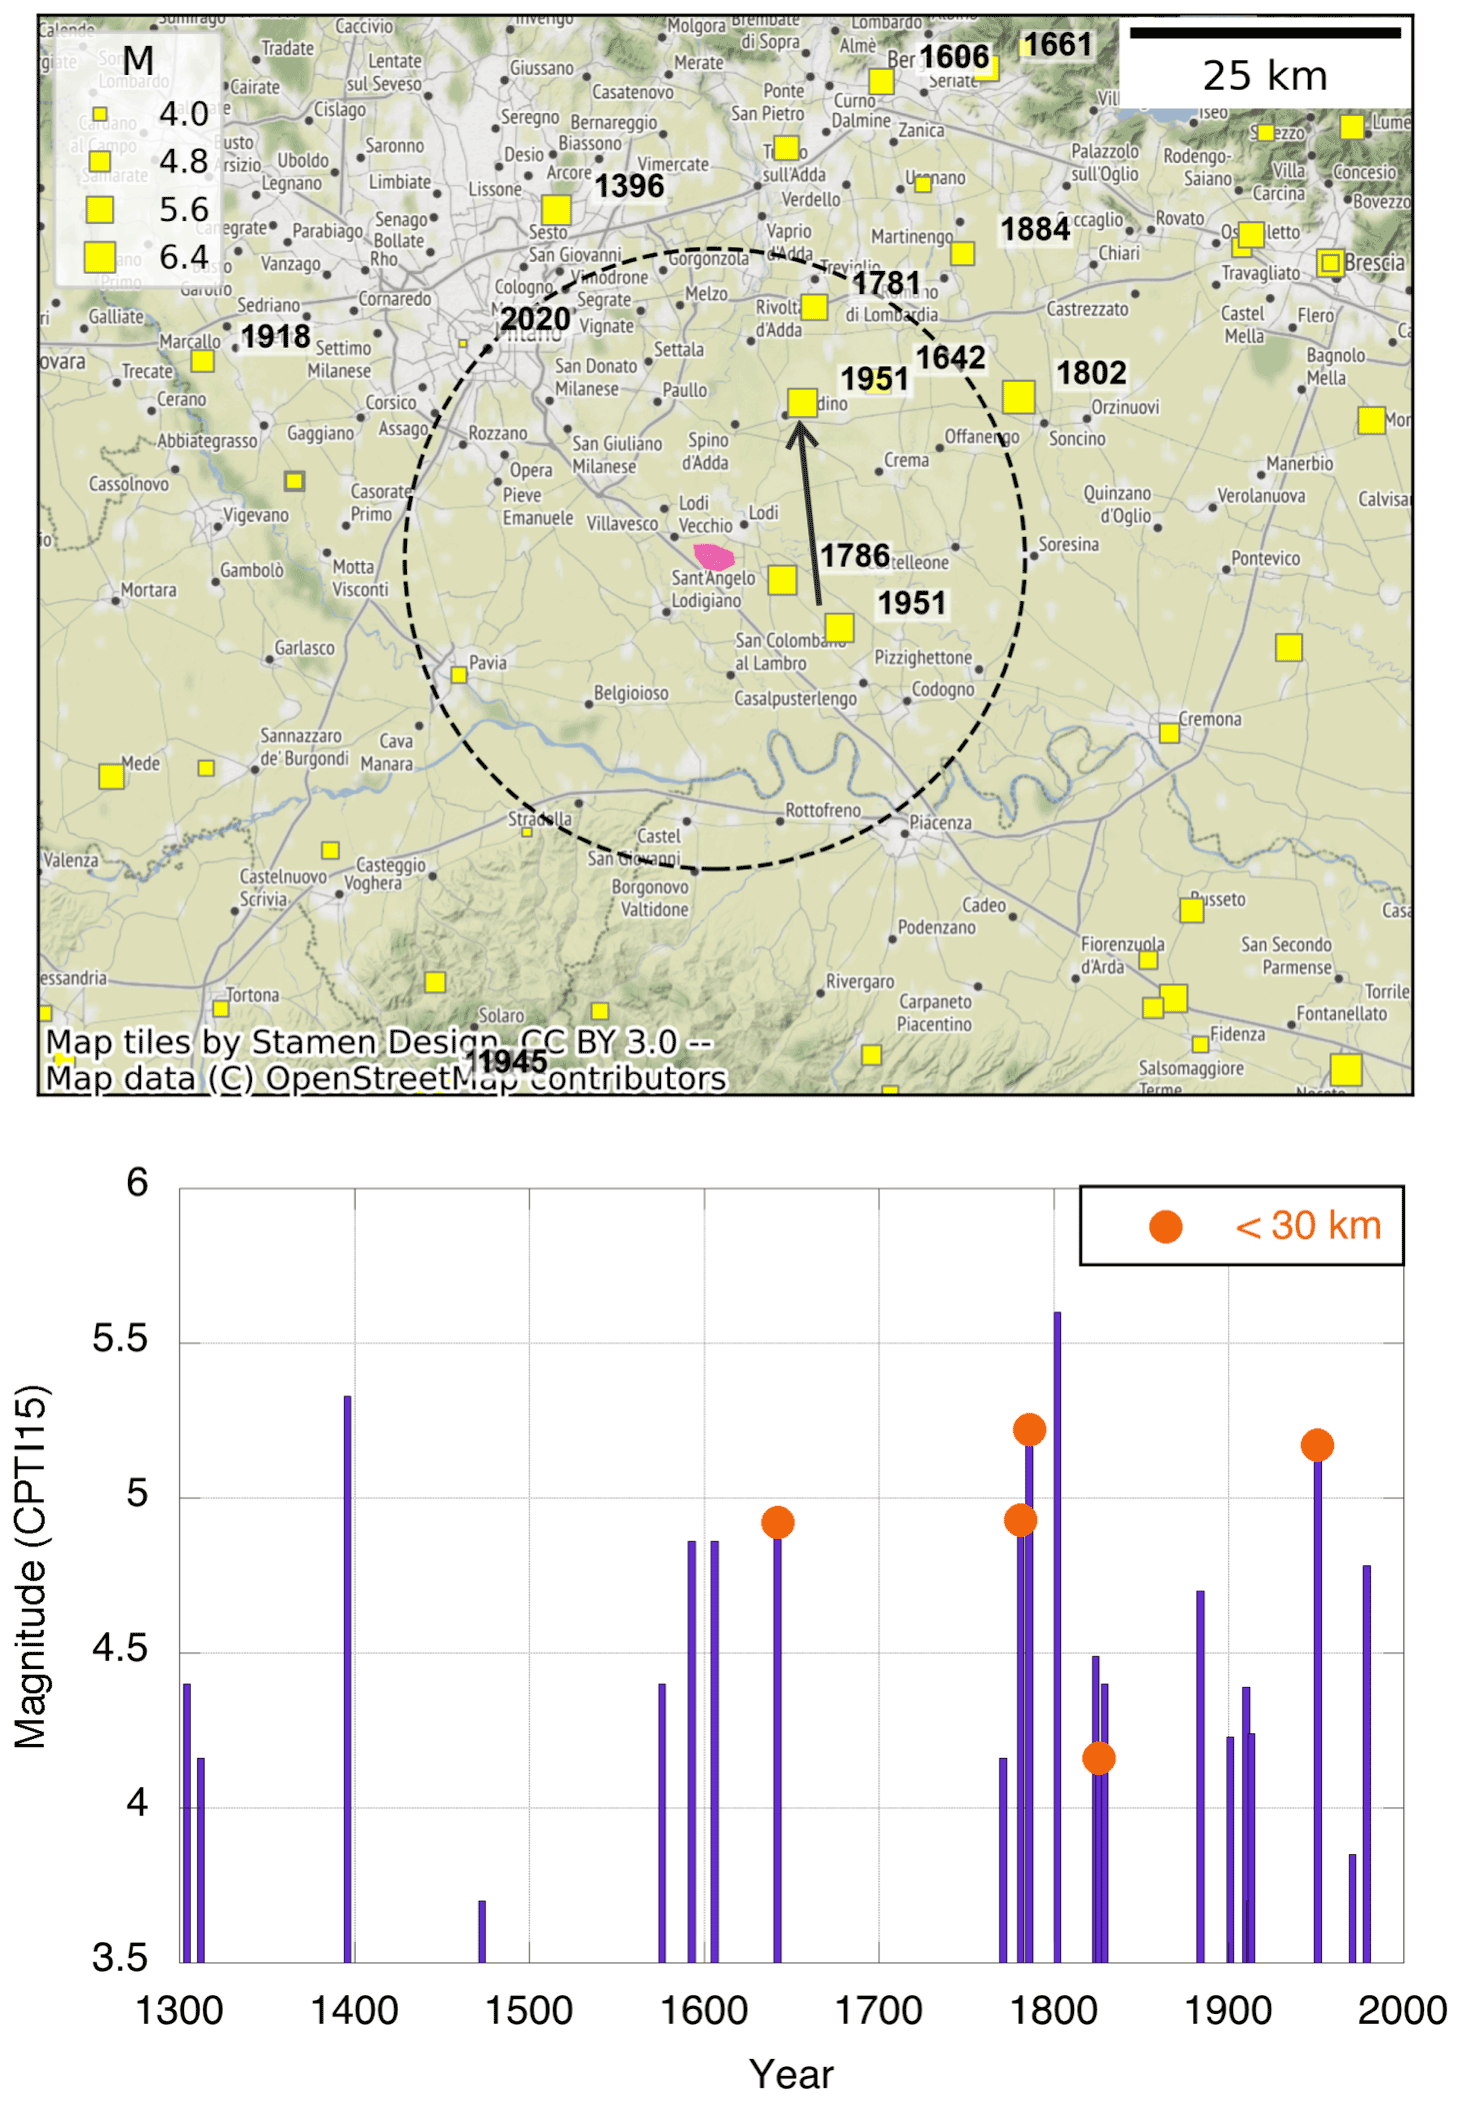
Figure 3Seismicity of the Lodi area according to CPTI15, v. 3.0 (Rovida et al., 2021); top panel: epicentral map (© OpenStreetMap contributors, 2021. Distributed under the Open Data Commons Open Database License (ODbL) v1.0) – the black arrow shows the shift between the macroseismic (lower) and one of the instrumental (upper) epicentres for the 1951 main event as relocated by Caciagli et al. (2015); bottom panel: plot of magnitude versus time for events located within 50 km distance of the reservoir.
The study area is characterized by weak to moderate seismicity. Figure 3 shows the main historical and instrumental earthquakes as reported by CPTI15 (Rovida et al., 2021): in the timeline (bottom panel), earthquakes within 50 km distance of the reservoir are represented, differently marked if within 30 km. The earthquakes of major interest for the area of Lodi are the events that occurred in 1781 and 1786 (magnitude M∼5, estimated by macroseismic data), and the earthquakes of 15–16 May 1951, also known as the Caviaga earthquakes. The earthquakes of 15 May at 22:54 UTC and 16 May at 02:27 UTC are the most important ones for our study area, for at least three reasons: (1) they are the only moderate events that occurred during the instrumental period; (2) they occurred in an area that was thought to be aseismic, until that time, and that was the core of international interests on hydrocarbon reserves for several decades; (3) for decades, they have been considered anthropogenic events, and they are still included in worldwide compilations of induced seismicity. The 15 May earthquake is yet considered the only M ≥ 5 gas-extraction-induced earthquake reported for Europe (Foulger et al., 2018). In their recent study, Caciagli et al. (2015) relocated the two major events (assigning an estimated MW=5.4 to the main event of 15 May 1951, and MW=4.6 to the aftershock of 16 May), by using phase readings reported in the International Seismological Summary (ISS), with the use of modern hypocentral location procedures. They provided some bounds for the uncertainty of the location parameters and estimated the variation of the stress field due to extraction activities. As a result of that study, the epicentral location of the two events is moved far away from the most damaged area of Caviaga toward N–NW, from a minimum of 12 km to a maximum of 25 km distance (in Fig. 3 we show the macroseismic and instrumental location of the main event, namely the solution quoted as “15b” in Caciagli et al., 2015). The depth of the source is estimated at 32–34 and 16–20 km for the main event and the aftershock, respectively, with statistical errors of 3–5 km; these are then locations compatible with inherited faults within the crystalline basement. With regard to the focal mechanism, this recent study did not suggest fault planes, as in some previous analyses (e.g. Ritsema, 1961; Gasparini et al., 1985). The stress perturbation induced by the coeval gas production is estimated to be far below any value usually taken as a triggering threshold. Therefore, today, the Caviaga earthquakes are attributed to a tectonic origin, as they are deep crustal events likely representing active sources at the contact between the Northern Apennines and the Southern Alps beneath the Po Plain.
The initial phase of the work was the collection and comparison of instrumental earthquake catalogues that are available for the area, namely catalogues released by either the main Italian institutions that manage seismic networks (the National Institute of Geophysics and Volcanology, INGV, authoritative centre for the National Seismic Network (RSN); the University of Genoa (UNIGE), which manages the regional seismic network of north-western Italy (RSNI); the National Institute of Oceanography and Applied Geophysics (OGS), with its regional seismic network of north-eastern Italy (NEI); international agencies (e.g. the International Seismological Centre, ISC, which handles seismic stations and network bulletins of world seismicity); or dedicated projects. A short description of the data providers and past initiatives in Italy is provided in Supplement 1.

Figure 4Magnitude versus time plot of earthquakes located within 30 km distance of the reservoir, as reported in the INGV databases and ISC Bulletin. The INGV data come from CPTI15 (Rovida et al., 2021) and ISIDe databases (ISIDe, 2007): 46 events with M > 1.5 are reported in the time interval 1985–2019. The ISC data start with the 1951 event and end in 2018. Magnitudes are not uniform and in some cases are not defined (see the blue circles labelled as nd along the x axis): in the case of multiple magnitudes no conversion rules are adopted, and values are selected on priority criteria (MW > MS > ML > MD).
We first collected the earthquake locations provided online and offline by the previously mentioned organizations and falling within the OD (Fig. 4). A preliminary working file has been compiled by stacking the hypocentral solutions provided by INGV, UNIGE, OGS, and ISC in the period 1980–2019. It was immediately clear that some events are present in one database only, while other earthquakes have many different solutions with large scatter in epicentral coordinates. To account for such differences, we did other searches over a larger area (target area, TA, white frame in Fig. 5, that envelopes the OD) and/or by individual earthquakes. The composite catalogue retains only one location for each event. Multiple locations are believed to belong to the same earthquake if the origin times differ by less than 20 s. In this case, the following priority rules are given to the data providers: INGV > UNIGE > OGS > ISC. If an event is reported inside the TA by only one agency we retain that location. With regard to the OGS data (available at http://rts.crs.inogs.it/, last access: 10 August 2021), it is worth mentioning that a very limited number of events are located inside the TA, as it is out of the NEI authoritative region; nonetheless, phase readings for non-located events are stored in the bulletins and have been used in the later steps.
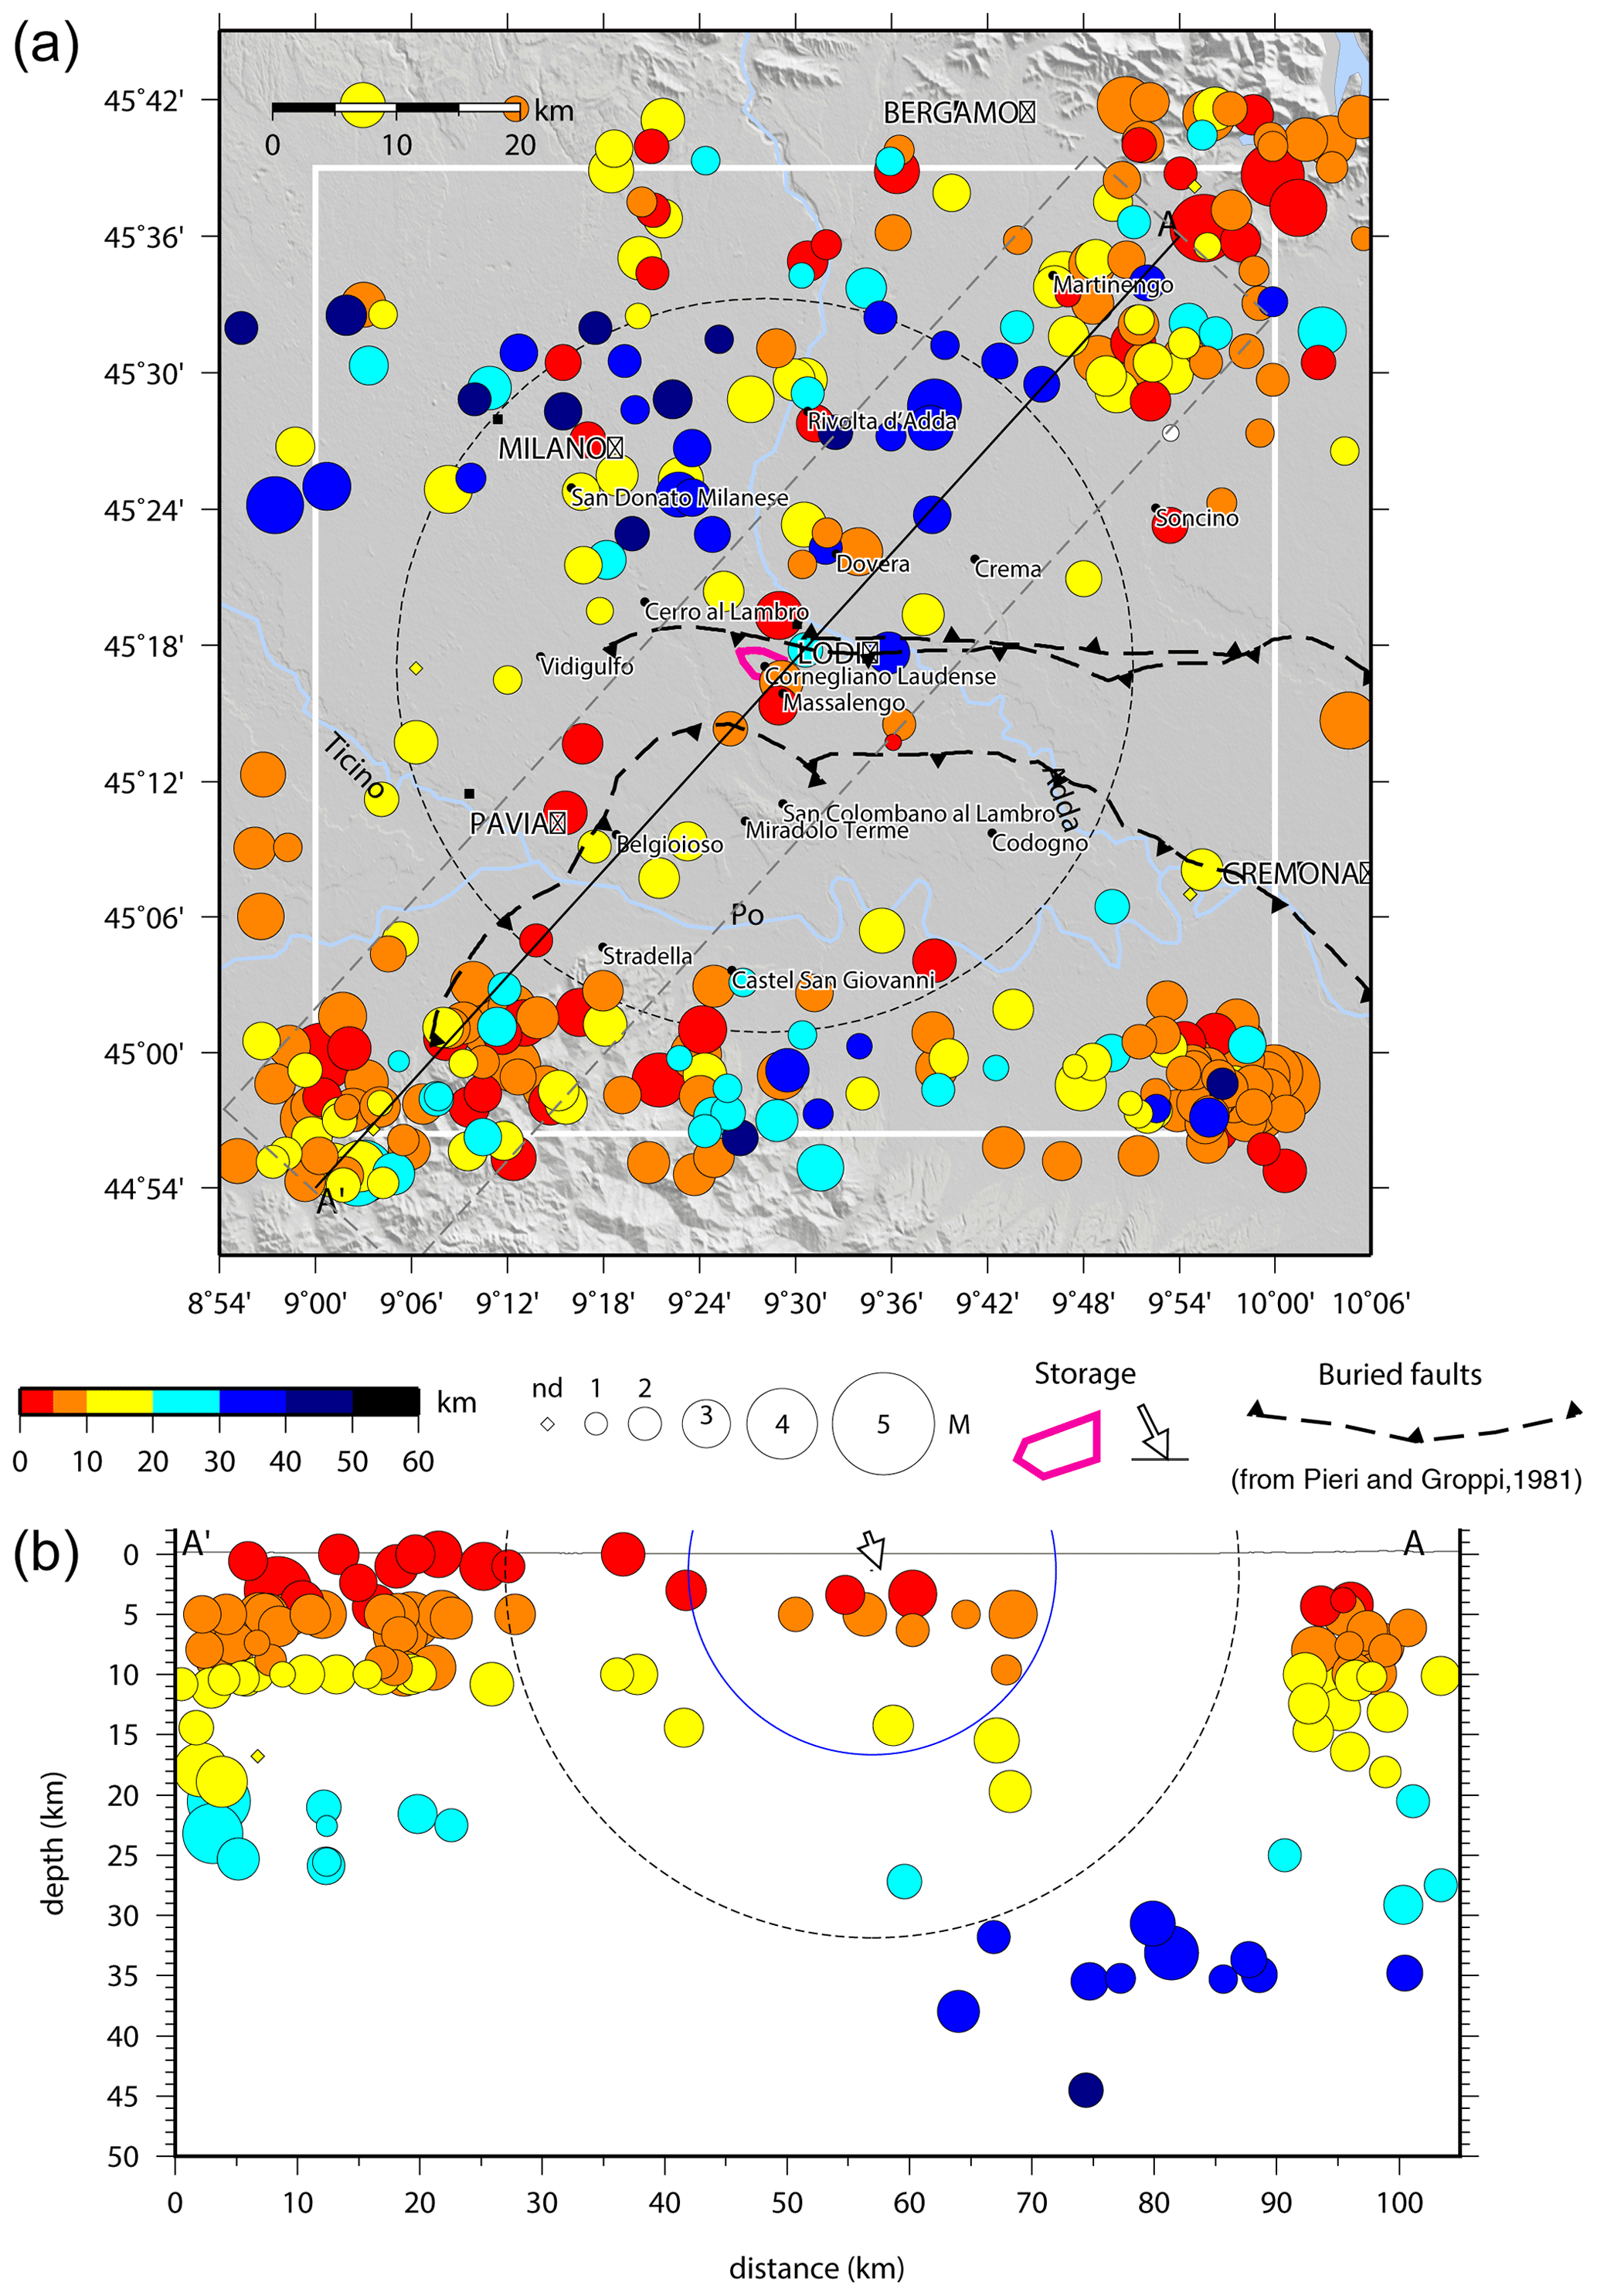
Figure 5Composite earthquake catalogue for the study area from 1980 to 2019: (a) epicentral map of events that approximately fall in the target area (latitude 44.94–45.65∘ N; longitude 9.00–10.00∘ E, white frame); (b) vertical cross section AA'. The 15 and 30 km distances from the reservoir (ED and OD domains) are marked by blue and black dashed circles, respectively; in the magnitude scale, nd means not defined; the reservoir is indicated by the pink polygon (map) and the arrow (section). The main buried faults are taken from Pieri and Groppi, 1981.
In Fig. 5 we represent the composite catalogue achieved after merging the events, located by the aforementioned agencies from 1980 to 2019. We identify three main clusters of shallow events (up to 20 km depth, red, orange and yellow in the colour legend in the NE, SE, and SW corners of the study area, respectively), and some scattered deep events (up to 50 km) in the northern sector of the OD and between the two southernmost clusters. These features are somehow compatible with the structural setting of Fig. 1, which shows, in this area, the northern Apennine EA facing the outermost fronts of the Southern Alps (SAMF, SAOA) separated at the surface by the sediment cover of the Po Plain. However, there are no clear correlations with the seismogenic sources proposed for this area. According to DISS v.3.2.1 (DISS Working Group, 2018), the closest composite sources to the reservoir are ITCS115 (Western S-Alps external thrust shallow west; min-max depth 2–6 km) and ITCS002 (Western S-Alps external thrust deep; 6–13 km) in the Southern Alps; ITCS044 (Portalbera-Cremona; 2–7 km), on the Apennine side. The distribution of earthquakes along the vertical cross section in Fig. 5 (A'A, SW–NE oriented) does not underline any particular geometry; several events are very shallow (less than 5 km depth) and a fixed/trial depth of 10 km is visible. Note also that the location uncertainties are not represented in the graphs, as location errors are usually not reported in the origin catalogues. Among the events closest to the reservoir (i.e. those inside the ED, represented as a blue semi-sphere of 15 km radius in Fig. 5), eight events are provided by the INGV database, and two are derived from the ISC bulletins, without a corresponding record on national or regional datasets.
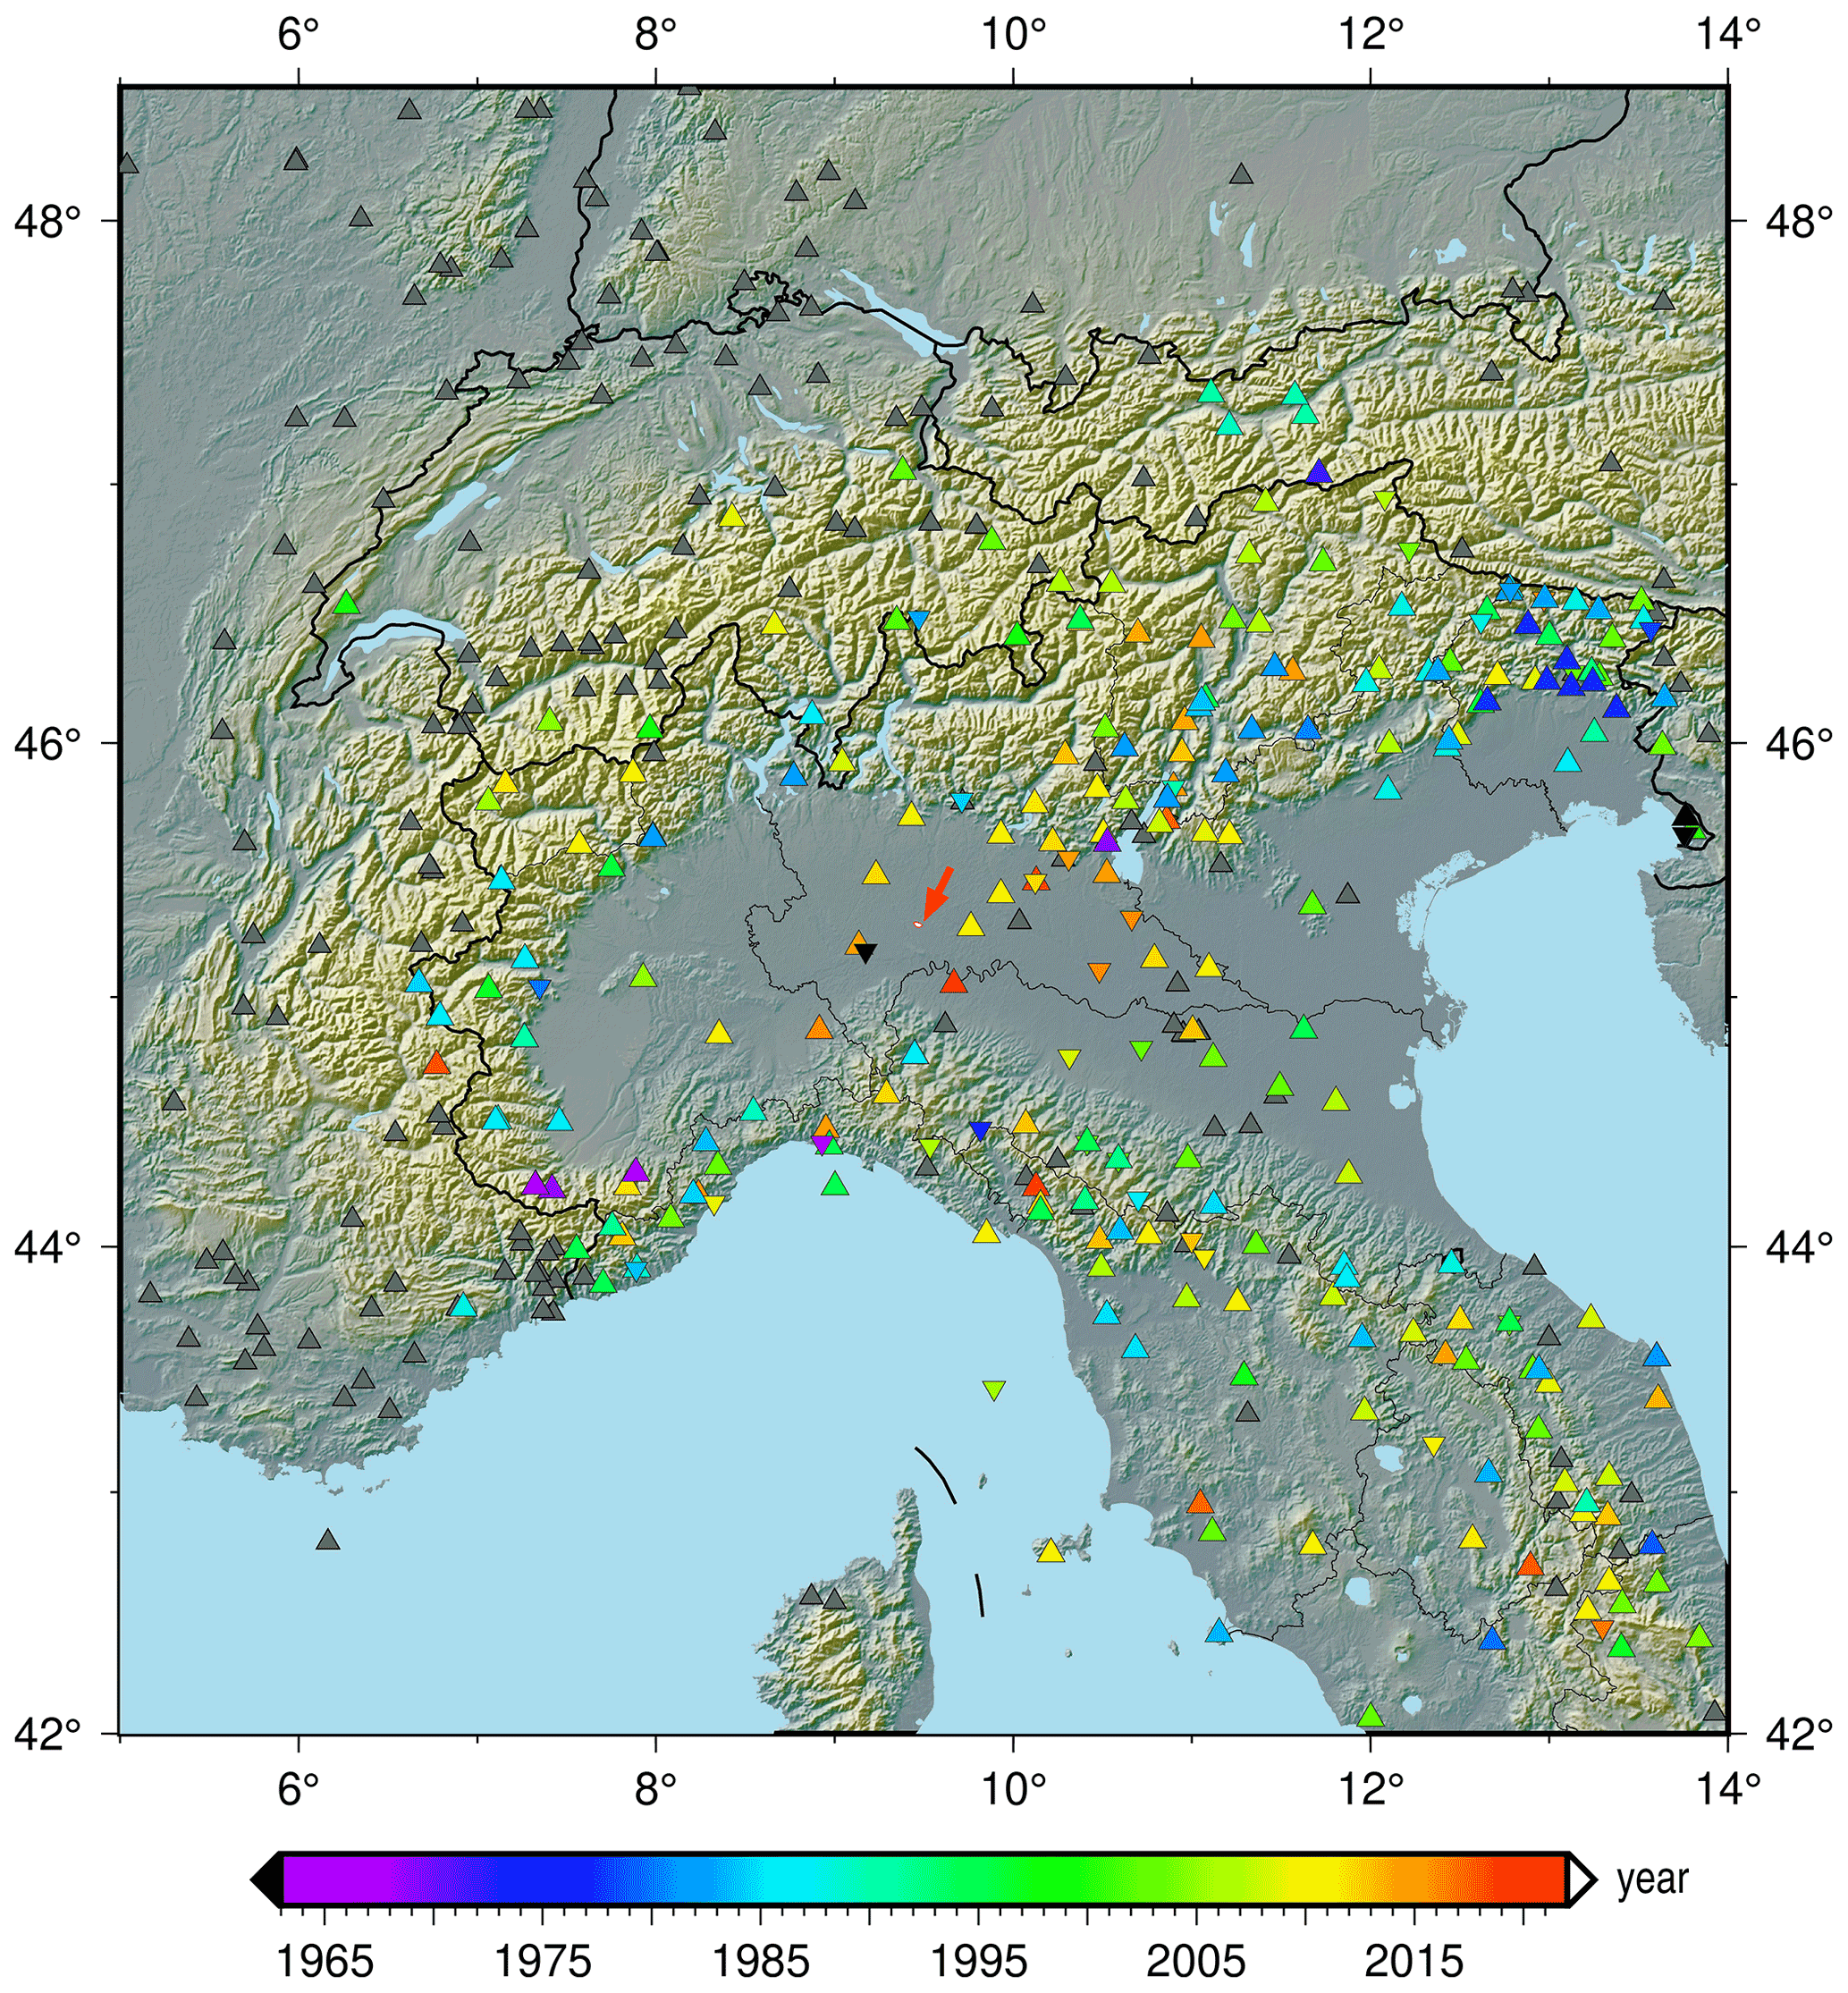
Figure 6Location map of seismic stations used for the relocations done in this study. The red arrow shows the location of the Cornegliano Laudense UGS. Stations are coloured according to the starting date, if known. Grey triangles are for unknown installation date, point-down triangles for stations that are no longer operative. Note that the stations mapped do not represent all the existing stations, but only the ones for which phase readings have been collected in this work.
This preliminary analysis motivated us in performing a global check and relocation of events for this sector of the Po Plain.
3.1 Toward a revised instrumental catalogue
After the identification of 344 earthquakes that potentially belong to the study area, we started the collection of P- and S-phase readings and station data, for uniform reprocessing; these data are only partially available on the web portals of the data providers.
The map in Fig. 6 is a simplified graphical representation of what is usually called “station book”, i.e. the information about location, operational conditions, instrumentation installed, and site response at each seismometric station, data usually managed by the station's owners. When a seismic station has a permanent installation, it can be registered with a unique code to international organizations (e.g. ISC; see Supplement 1). For local or temporary monitoring, sometimes station books are not so rigorous, and station code can duplicate existing names, keep the same code with some location changes, or conversely modify the code when different instrumentation is installed in the same site. For each station contributing to the event location of this study with one or more phase readings, we collected its geographical position and, if available, the installation time with the colour palette (Fig. 6). Stations closed during the investigated time given by the legend are indicated by point-down triangles. For the stations in grey, we did not recover the details of operational conditions.
The lack of stations in the Po plain is evident, especially before the mid-1990s. Around the reservoir area, this lack is confirmed at least until 2010–2015, if we exclude the Pavia station (black symbols westwards of the arrow) closed presumably before 1985.
This makes it clear that the detectability threshold of earthquakes in this area is worse than in adjacent sectors of northern Italy, with better station coverage since the 1980s. In addition, the completeness magnitude is strongly influenced by the level of background noise at the seismic stations, critical in this region too.
To quantify the noise level in the study area, we have analysed the continuous signal recorded at the ground surface by a set of temporary stations (13 sites) we deployed in July 2016, in the ED area, during the scouting phase carried out for designing the new monitoring seismic network for the Cornegliano Laudense UGS. In addition to our temporary stations, we have also analysed the signal of the INGV permanent station of Milano (MILN). We have to keep in mind that all those stations are located in a densely populated area – MILN is in the centre of Milan – which hosts several mid- to small-size cities and industry compartments. Figure 7 shows the median noise curves (McNamara et al., 2004) relative to 1 d of continuous recording measured at the 13 temporary sites (thin blue lines) and 1 week of the signal at the MILN station (thick red curve). The figure also shows the two curves known as new high-noise model (NHNM) and new low-noise model (NLNM) (lines in dark grey), respectively, obtained by Peterson (1993) from the analysis of the seismic microtremor data of 75 stations distributed in different parts of the world and generally used as a reference for estimating the quality of the signal recorded by a seismological station. For the temporary stations represented in Fig. 7, the noise curves are truncated at the period of 4 s, as the seismometer used is a Lennartz 3D-Lite with resonant period T=1 s. We see in Fig. 7 that all the recordings carried out at the ground surface feature a seismic noise level generally near to or higher than the NHNM line in the short-period range.
The impact of the background noise on the minimum detectable magnitude has been evaluated by Franceschina et al. (2015) for a site located in the Po Plain within a pilot project for CO2 geo-sequestration. In their study, the authors use both experimental data and theoretical arguments to determine the noise levels of the area, the detection capabilities of a future possible monitoring seismic network, and the improvement of borehole vs. surface installations. Based on a 1 year observation period, they show that the Po Plain features high seismic noise levels, although slightly smaller than our ones. They also estimate in ML1.9 the minimum detectable earthquake magnitude for an event-station distance of 20 km.
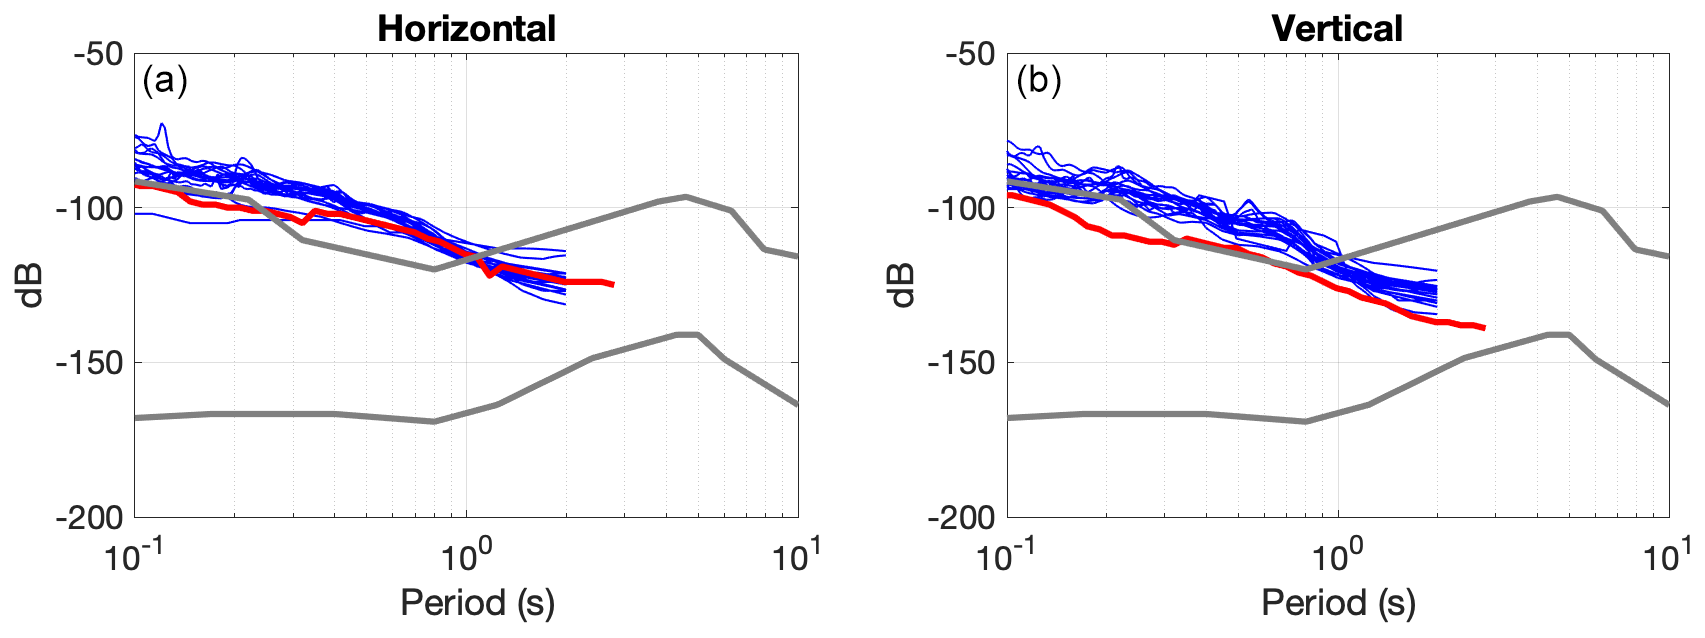
Figure 7Power spectral density of continuous seismic signal recorded by a set of stations in the study area. The two panels show the average of the horizontal components (a) and the vertical component (b), respectively. Thin blue lines: 1 d continuous signal recorded by 13 temporary stations deployed within the ED area in July 2016; thick red line: 1 week of continuous signal recorded in the same period at the MILN station belonging to the national network managed by INGV. The dark grey lines show the two reference curves known as NHNM and NLNM by Peterson (1993), used for estimating the quality of the signal recorded by a seismological station.
Considering that the average inter-station distance existing until 2016 in our study area is greater than 30 km, we can reasonably shift the detection magnitude threshold to ML∼2.5. As the completeness magnitude (Mc) of the catalogue is higher than the detection magnitude we can easily understand that the poor completeness magnitude value of the existing catalogues is the outcome of the high seismic noise existing there, combined with the low network density. Additional problems derive from the use of different standards for magnitude assessment in time, but we leave these issues as a subject for future analysis.
Table 1Summary table of the phases/events gathered by four data providers in different time frames. As multiple phase readings for the same stations are sometimes provided, for example in ISC archives, the number of available arrival times are counted by stations.

∗ They refer only to the readings provided in Caloi et al. (1956) for the event of 15 May 1951, not given in the ISC archive.
3.1.1 Collection of phase arrival times
We collected the phase arrival times from the following sources:
-
The extended list of data from the ISC Bulletin. Each event is represented by a text file that summarizes the hypocentral solutions provided by various agencies and the PRIME solution adopted by the bulletin: magnitude data and the list of stations, phase type, and arrival times, with additional metadata about the preferred solution (e.g. distance, azimuth, residual, station magnitude).
-
The list of data from the INGV website, as tables of arrival times for each event (e.g. http://terremoti.ingv.it/event/EVENTID, last access: 10 August 2021). These data are available jointly with the solution provided for the location, for all the events since 1985, with a uniform format but different criteria adopted, for example, for assigning the uncertainties and magnitude over the years.
-
The phase data provided by UNIGE. Some phase data are available online, but an extended search on the archives has been performed (Scafidi, personal communication, 2019), for also including non-located/badly located events that may be out of the authoritative area of the RSNI network. Readings are available in different formats, depending on the years.
-
The phase data of OGS, available in a uniform format in the online CRS Bulletins (http://www.crs.inogs.it/bollettino/RSFVG/RSFVG.en.html, last access: 10 August 2021) from 1977 on. In many cases, these data have never been used before in location procedures, because the events that were manually picked and reckoned outside the OGS authoritative region of monitoring have not been processed until the hypocentral solution. Unlocalized phase manual readings are available in particular during the so-called “analogic” period (see Gentili et al., 2011) and after the improvement of the Veneto Region monitoring (from 2005 on; see Bragato et al., 2021). Other unpublished data derive from the seismic monitoring of the Minerbio site that was performed by OGS on behalf of A.G.I.P. S.p.A. (Rebez, 1991), or have been searched on original seismograms on paper, available in the Sgonico headquarters of OGS. Note that the readings of Trieste station (station code TRS from 1904 to 1964; TRI from 1959 on) are usually available on the ISC archives, but for the earliest events they have been checked on original documents too.
Each earthquake is given a unique event identifier (OrigID), corresponding to the one assigned by the ISC (if the event is present in the international Bulletin), or given by a string that contains year, month, day, hour, and minute of first arrival time, in the case of multiple events on the same day. Considering the differences in data format, and the reliability of the final solutions, we processed the earthquakes in several time frames, as given in Table 1. Note that the period before 1985 starts with an earthquake reported by the ISC Bulletin in 1936 (OrigID = 903762, http://www.isc.ac.uk/cgi-bin/web-db-v4?event_id=903762&out_format=IMS1.0&request=COMPREHENSIVE, last access: 10 August 2021; for the bad location of the 31 July 1931 earthquake that hit the western side of the Garda Lake, see https://emidius.mi.ingv.it/CPTI15-DBMI15/event/19360731_1446_000, last access: 10 August 2021) for which no phases are listed. In practice the online dataset of arrival times begins with the aftershock of 1951: for the main event, phase readings have been integrated into this study too (Caloi et al., 1956).
Table 1 summarizes the number of phase arrivals by stations, as provided by the various agencies, and the total number of events processed, located, and discarded. Note that some phase/station data used by INGV and UNIGE can be duplicated, and they both are usually provided to the ISC Bulletin. OGS data are mainly original, as non-located phases are not provided to the international agency. ISC, collecting data worldwide, is the most represented dataset. The earthquakes not reported in the ISC Bulletin are usually the smallest events. Concerning magnitude, as in this study it is needed mainly for representation purposes, we avoided conversion relationships and retained the values assigned by the original agencies, selected on priority criteria (). As previously said, the uniform re-assessment of magnitude is a relevant problem that falls outside the schedule of this study, and it will be the focus of future efforts.
The phase data coming from the various providers have been then transformed into a common format, and merged, for their uniform processing by the selected location code, using a suite of original Bash scripts and Python codes, implemented for this study.
3.1.2 Relocation of selected events
Hypocentral location is performed by a standard code used in regional monitoring analyses, i.e. the software Hypo71 (Lee and Lahr, 1975) that uses simple 1D regional models, with a fixed value of . The choice of a robust method, although less sophisticated than other, more recent ones, is motivated by the need to accommodate the varying quality of the phase readings collected in more than 50 years and to treat all data using a common location algorithm, thus avoiding artefacts introduced by different relocation procedures. The complexity of finding robust solutions in an inverse problem, like hypocentral location, is well known in the literature: in their very recent paper Arrowsmith et al. (2020) state the superiority of global search methods which sample the full model space, using a standard iterative linear least-squares approach, as originally introduced by Geiger in 1912, and implemented by Hypo71 and its updated/improved versions. However, when dealing with datasets derived by the “merge” of phase readings published by several agencies throughout many decades, as was the dataset of this study, there are other problematic features and uncertainties to deal with, such as the following:
-
duplication of readings – phase readings used by various agencies may have redundancies, with the same or different arrival times;
-
unknown phase readings or phase readings that are not proper;
-
assessment of uncertainty given to the readings;
-
differences in the phase association performed by different agencies.
We decided to face these problems as follows:
-
As we have no “a priori” element to establish which are the “best” readings, in the case of multiple arrival times assigned to the same station/phase, we decided to let the duplications in. In theory, the duplication of the same equation in a linear system does not affect its solution; conversely, slightly different observations may “accommodate” the uncertainty of arrival times that we cannot verify on the original seismograms/time series. The evaluation of relevant discrepancies among data given for the same station is done by checking the printout of the locations, thus assigning different weights (e.g. 4, which means discard the reading, or 9, which uses the difference of arrival time of P and S phases only) to the high residuals (more than 2 s for P phases, 4 s for S phases). We thus consider the resulting statistical errors a relative measure of the goodness of the solutions within a uniformly processed dataset and not a physical reference for the point source approximation of the hypocentre. The literature on these subjects is wide-ranging (see for example Husen and Hardebeck, 2010; Arrowsmith et al., 2020) and some additional comments will be given in the final sections.
-
Phase types are often not explicitly indicated by the data providers (it happens mainly in the ISC dataset and for the last decades only); we decided to exclude distant stations (at distances larger than 400 km, after some sensitivity tests) and improper phase readings if explicitly labelled (e.g. Pn, Pg, P∗), and to retain unknown phase types as alternative arrival times, as previously mentioned. The removal of data is driven by an “a posteriori” check on the residuals of the theoretical travel times and giving priority to the proprietary data (i.e. readings for the stations managed by the agency).
-
It is not possible to assign a weight to the picking without checking the original seismogram. It was common practice in the past to assign the weight without declaring the assessment criteria, and mainly referring to the residuals on theoretical travel times. We decided to adopt in the first runs the weighting codes given by the data providers, if assigned, and to set standard values (0 – full weight for P readings; 1 for S) if not given. The careful analysis of each solution led to a revision of the weights based mainly on either outliers or readings that drive the algorithm to converge towards solutions with an anomalous root-mean-square (RMS) time residual, reckoned by a generalized increase in acceptable residuals (less than 2 s) in most of the stations.
-
Anomalies in phase associations have been found in very few cases, for cascading events. Sometimes the revision of associations led to the analysis of other events not selected at first according to the spatial rules.
After the station list and phase arrival dataset, the last but very important component of hypocentral locations is the velocity model. We, therefore, collected a set of 1D models (see Table 2), used at global (IASPEI91; Kenneth and Engdahl, 1991), national (INGV RSN1 and RSN2; see https://emidius.mi.ingv.it/CSTI/Versione1_0/Html/LOC.HTM, last access: 10 August 2021, and Marchetti et al., 2020; CSI, Chiarabba et al., 2005, modified to accommodate the inversion in velocity profile not allowed by the location code), and regional scale (UNIGE, Spallarossa et al., 2014, adopted for a study in north-western Italy, then further simplified and modified to accomplish the large interstation distance of our dataset; OGS, Bressan et al., 2003, used in north-eastern Italy). We selected the solutions obtained by the model that provides the minimum time residuals (in bold in Table 2) for the final map and profiles given in Figs. 8 and 9, acknowledging the huge variability in location parameters (mainly the value of depth) that results from the different velocity models, coupled with non-optimal station distribution and large uncertainties in phase pickings. Note that the selected model (no. 4 in Table 2) puts the Moho interface at 39.5 km, a value that is a reasonable average of lateral strongly variable depths sampled by teleseismic waves in Kind et al. (2021). Additional comments will be given in the results.
Table 2Summary table of the velocity models tested in this study. The results in Figs. 8 and 9 are obtained with the model that minimizes time residuals.
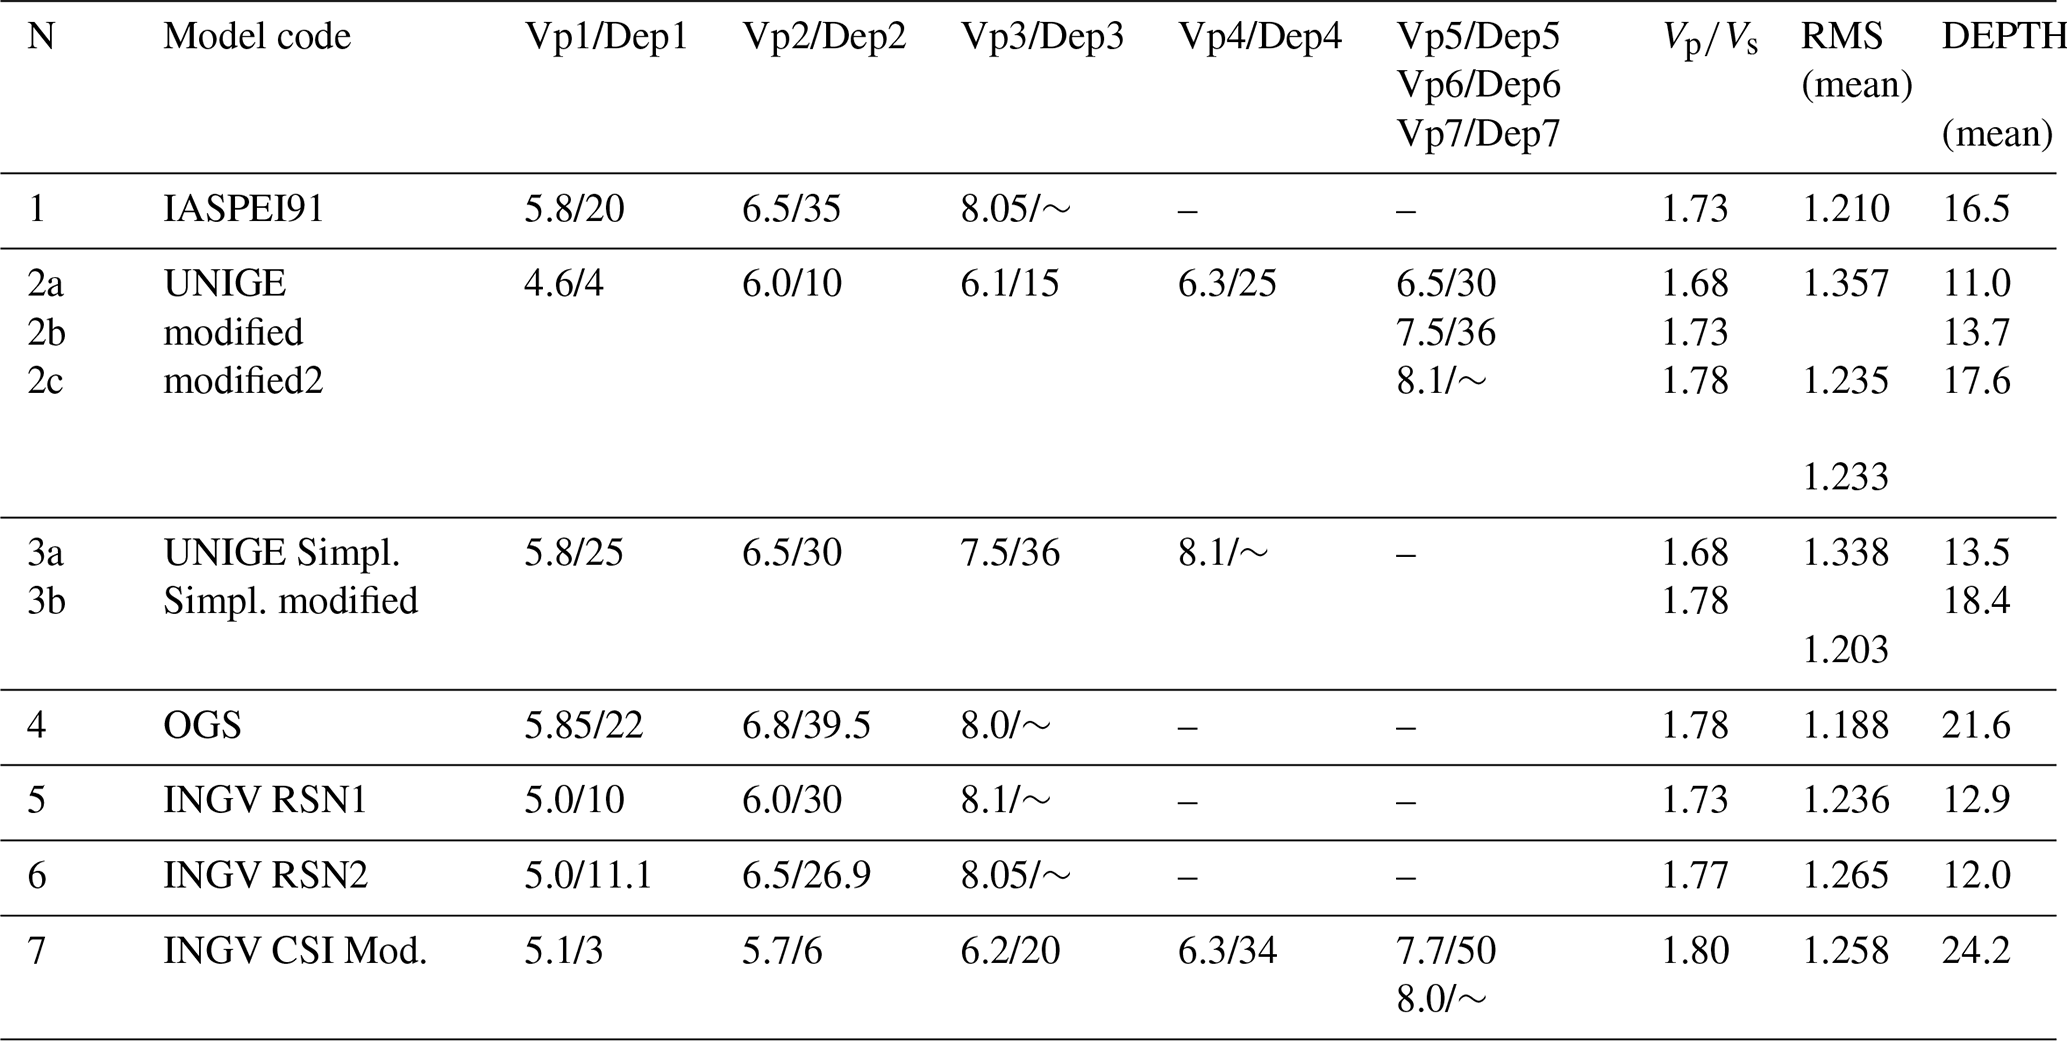
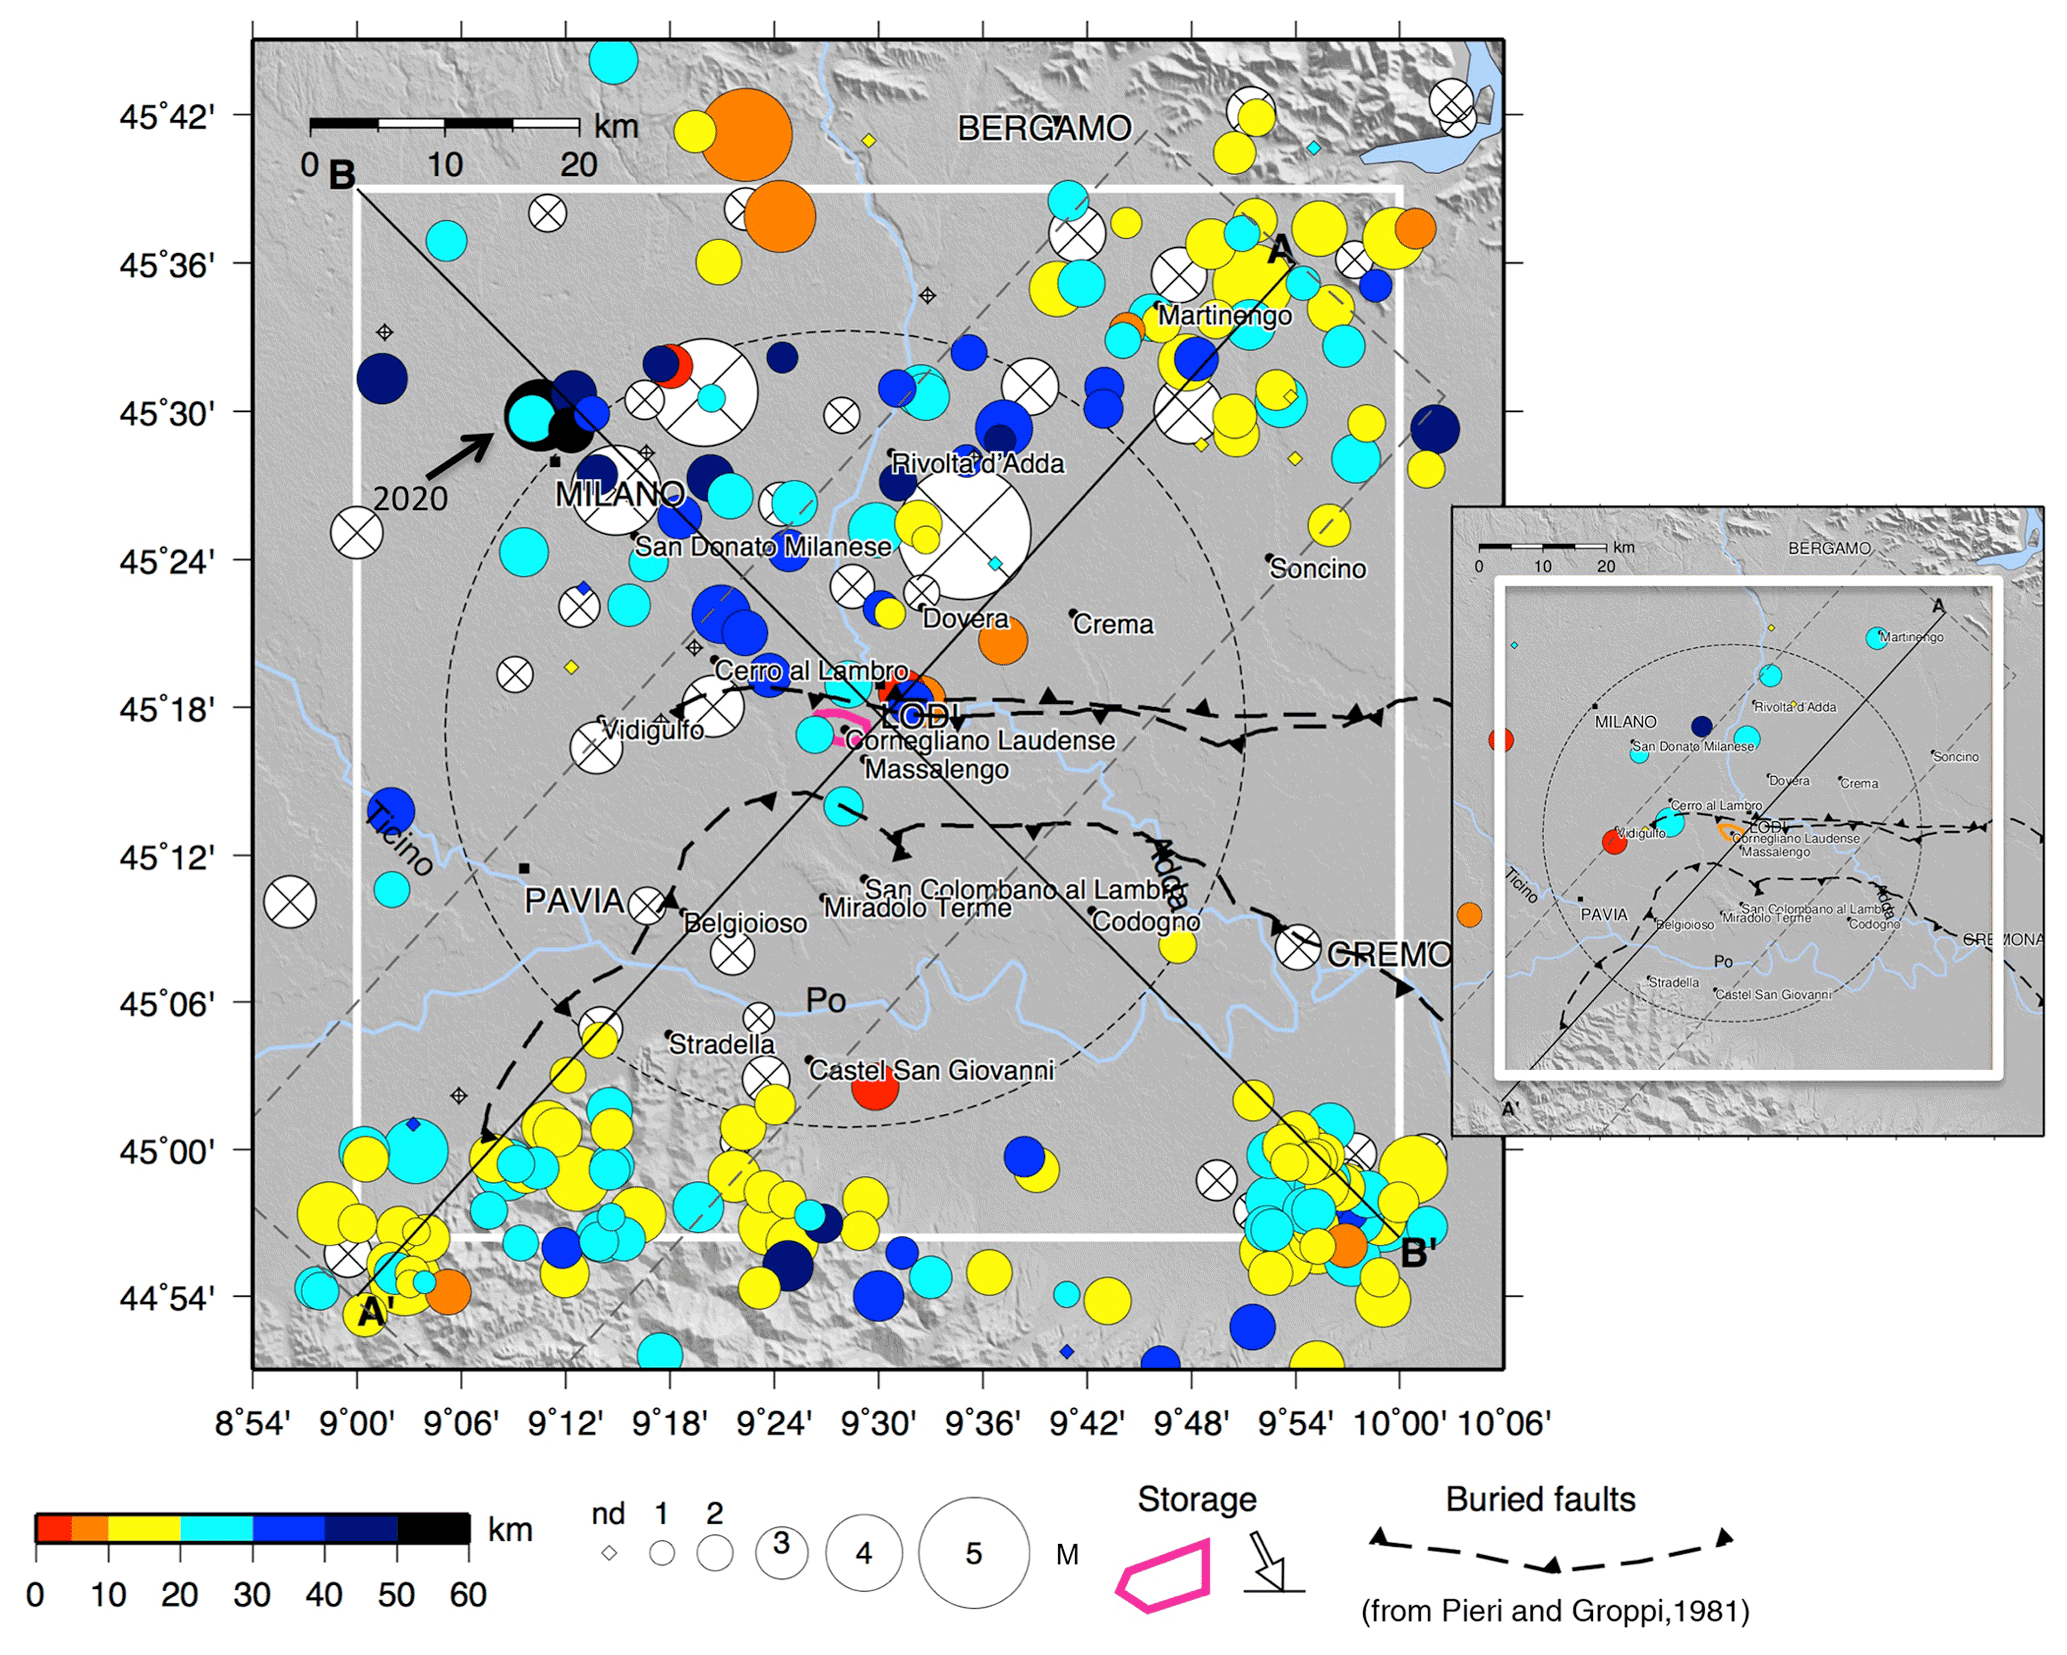
Figure 8Relocated earthquake catalogue for the study area, for the period 1951–2019. The black arrow and label show the location of the 17 December 2020 Milan earthquake, relocated in this study too and corresponding to the solution given by model 4 in Table 3. Main panel: epicentral map of events that fall approximately in the target area (white frame); inset: events discarded as probable fake locations. The 30 km distance from the reservoir is marked by a black dashed circle; the main buried faults are taken from Pieri and Groppi (1981). White crossed circles represent earthquakes with large standard errors in location (horizontal error ERH > 5 km or vertical error ERZ > 10 km).
Table 3(1–6) Hypocentral parameters of the 17 December 2020 Milan earthquake based on different velocity models and location codes; (7–8) hypocentral parameters of the two 1951 Caviaga events. SEHmax/SEZ: (maximum) horizontal and vertical single 68 % confidence estimates referred to hypocentral locations performed by Hypoellipse; ERH/ERZ: statistical horizontal and vertical location errors provided by Hypo71; DMIN: epicentral distance of the nearest station. In the last column, multiple solutions of focal mechanisms are reported if existing.
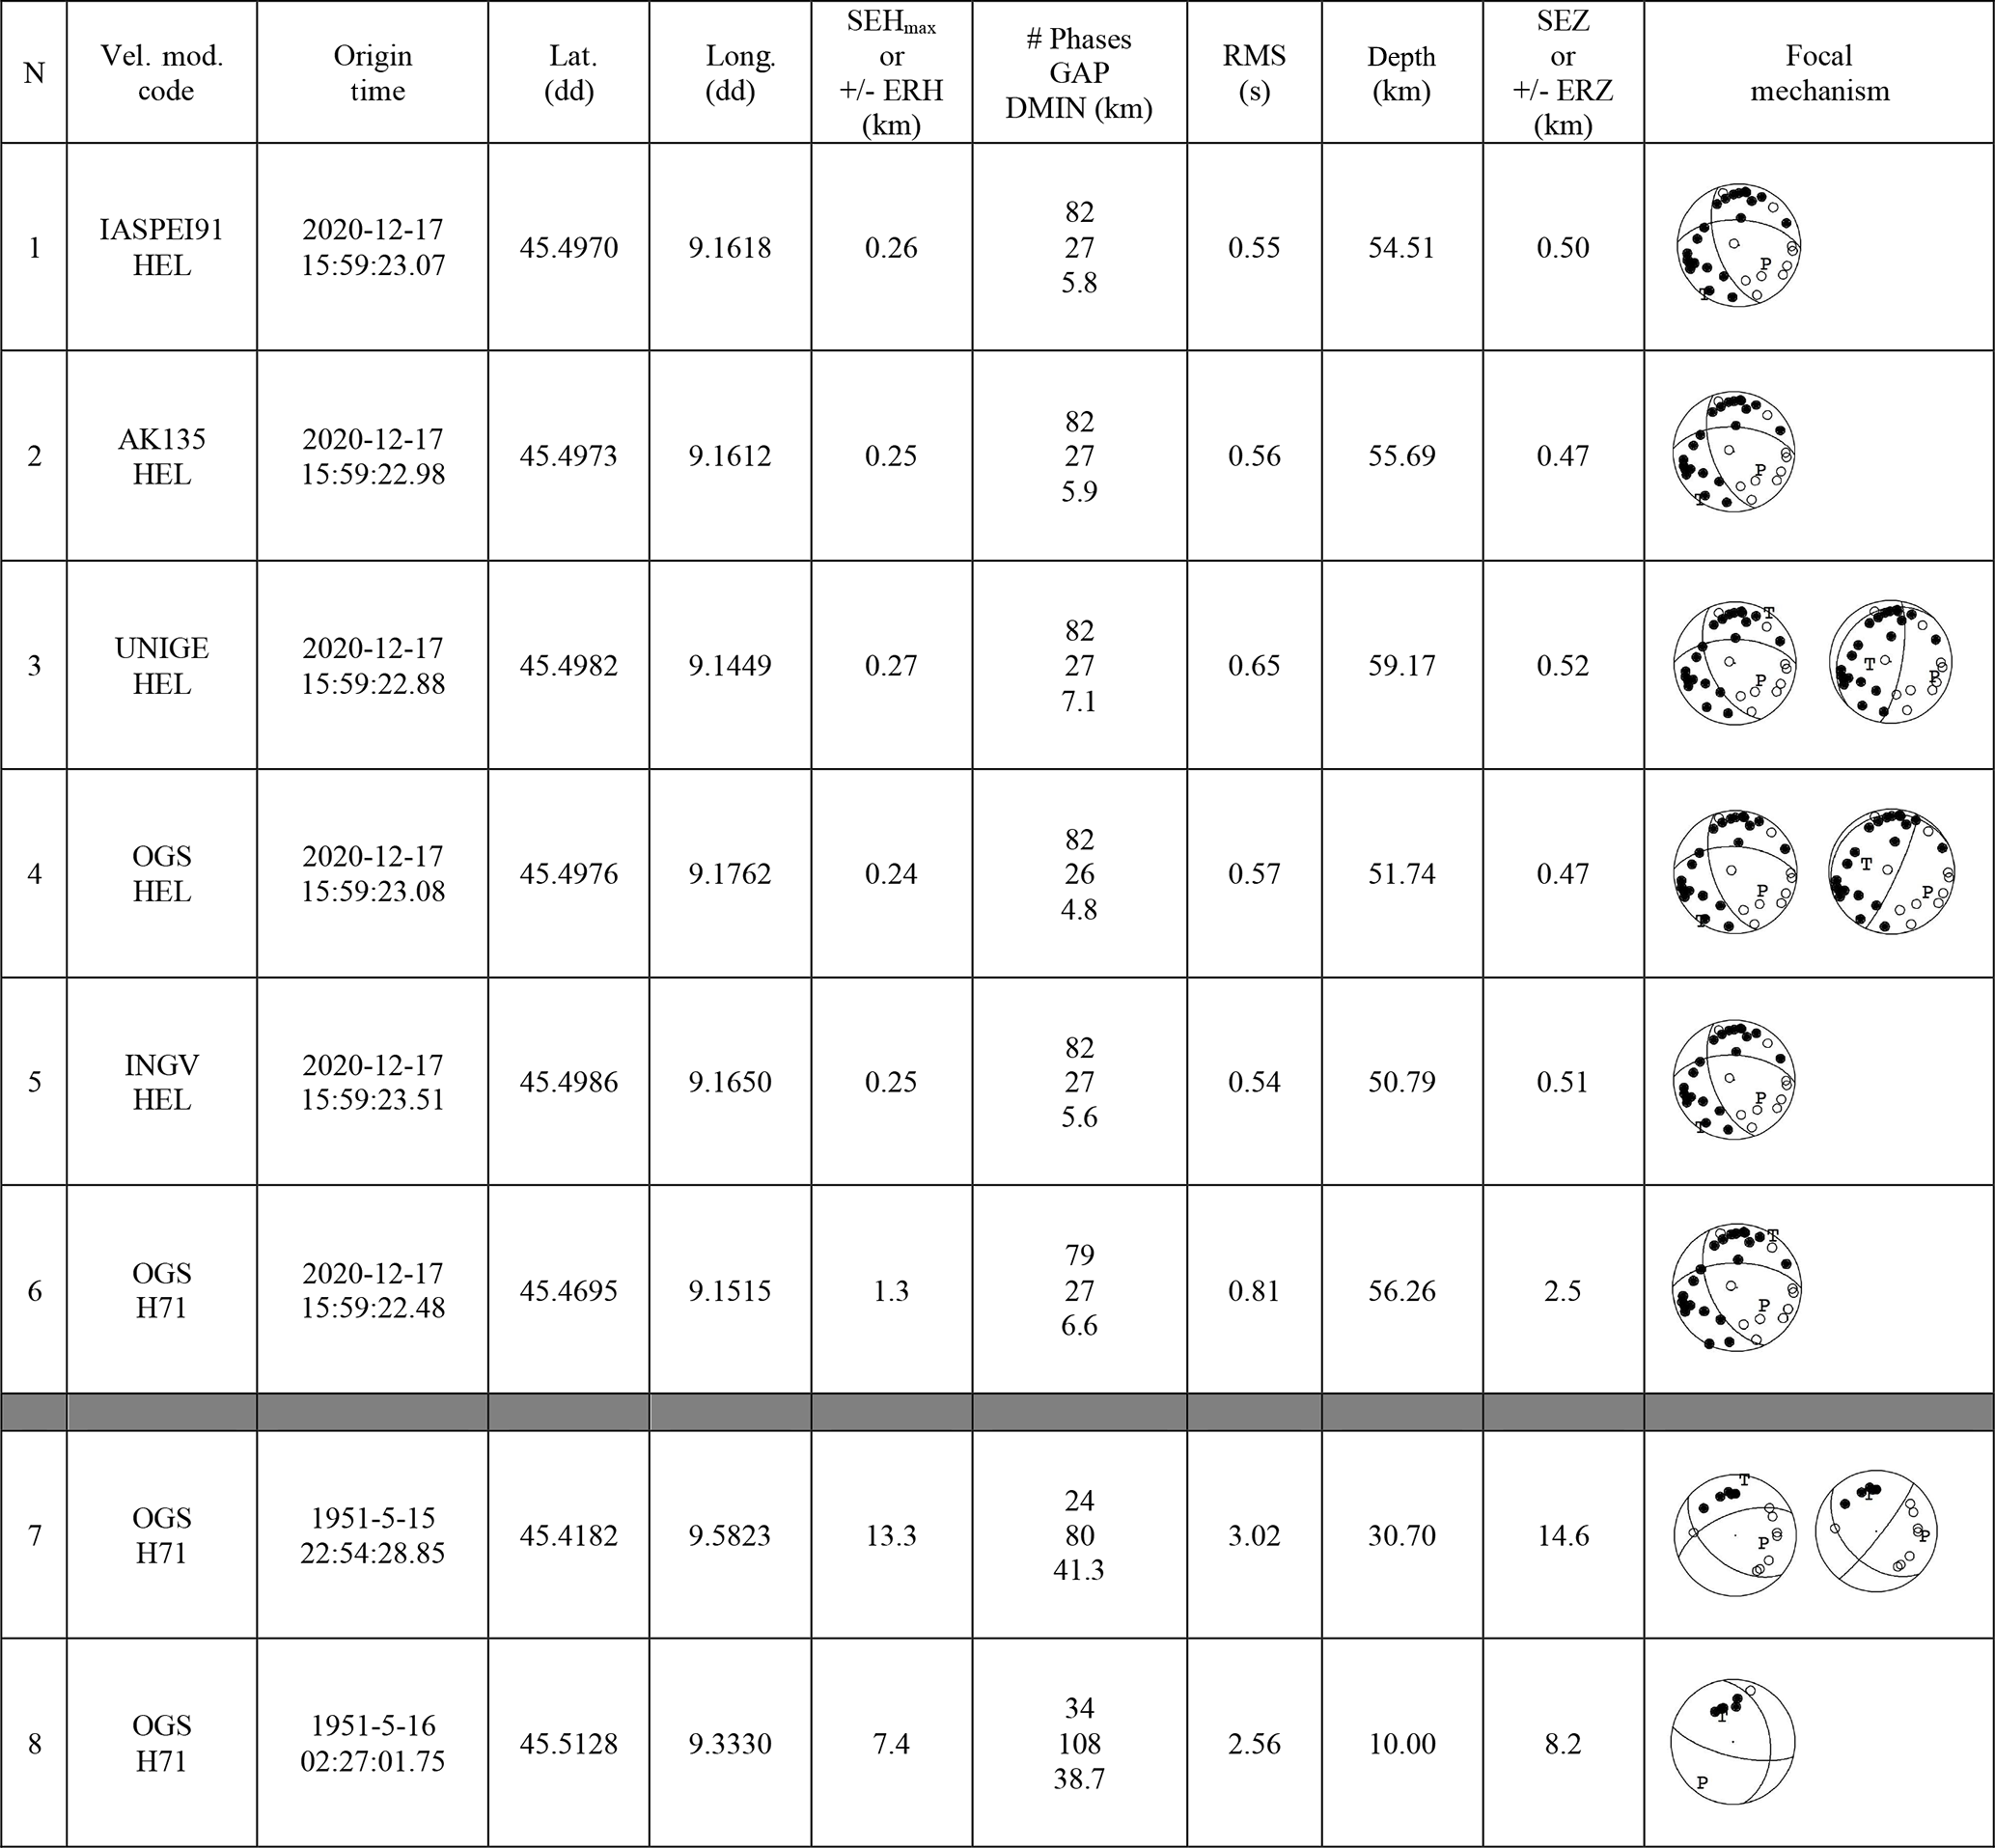
3.2 The Milan earthquake of 17 December 2020
On 17 December 2020 at 15:59:22 UTC an earthquake occurred near Milan, right while we were writing this paper. The Italian agencies INGV, UNIGE, and OGS notified it in nearly real time on their institutional channels and social media, as a deep event; the revised hypocentral determination given by INGV and UNIGE (http://terremoti.ingv.it/ and http://www.distav.unige.it/rsni, last access: 10 March 2021) assigned a local magnitude ML3.8 and 4.2, and hypocentral depth of 55 and 49.6 km, respectively. The event was widely felt in the Milan province, and somehow it surprised the population, convinced they were living in an aseismic area. No focal mechanism has been released by any Italian or foreign agencies up to now. Since the event occurred right within our study area, we decided to pick manually the arrival times and first polarities on available waveforms, to compare this earthquake with the results of our analysis. We selected the seismic stations within the cross-over distance for the area (130 km according to Spallarossa et al., 2014) from the best epicentre published by INGV, to be sure to pick only direct arrivals of P and S waves. The selected stations (45) belong to different networks from international to regional scale and are equipped with seismometers or accelerometric sensors. We picked 45 P (with 31 polarities) and 37 S arrival times, weighted according to the following scheme: code 0 for uncertainty in picked time Upt ≤0.1 s; code 1 for s; code 2 for s; code 3 for s; code 4 for Upt>2.0 s, not used in the location process.
We used both Hypo71 and Hypoellipse (Lahr, 1999) to locate the Milan earthquake, as the latter allows us to take into account the station elevation and to use velocity models featuring variable with depth, or velocity inversions.
We performed location tests using different velocity models: four models are the ones already described in Sect. 3.1.2, the fifth one is the well-known AK135 model (Kennet et al., 1995) used by Caciagli et al. (2015).
Table 3 lists the hypocentral parameters obtained for each location. The main difference is the hypocentral depth that ranges from 50.8 to 59.2 km, while all the other parameters are similar: no “best location” can be defined, in our opinion, based on statistical residuals. Therefore, we adopted the hypocentral solution given as 4 in Table 3, to be coherent and uniform with the relocated earthquake catalogue.
We then calculated the fault-plane solution based on first-arrival polarities, by using the classical code by Reasenberg and Oppenheimer (1985). All the focal mechanisms obtained are represented in Table 3: note the irrelevant changes in the plane orientation due to the differences in hypocentral location. Note also that the solutions obtained with the same model (OGS, no. 4 and 6) are invariant to the location code. A transtensive mechanism on NNW–SSE-to-E–W-oriented structures is common to all the models: in two models (no. 3 and 4 in Table 3) an alternative compressive solution is given too, on a low-angle thrust fault dipping to NW, or a nearly vertical N–S-oriented fault. For the preferred solution, the station distribution ratio (STDR) is always >0.63, suggesting a well-constrained result. We recognize that the data collected in this study do not allow us to overcome this uncertainty and a moment tensor analysis might be useful to obtain more robust solutions.
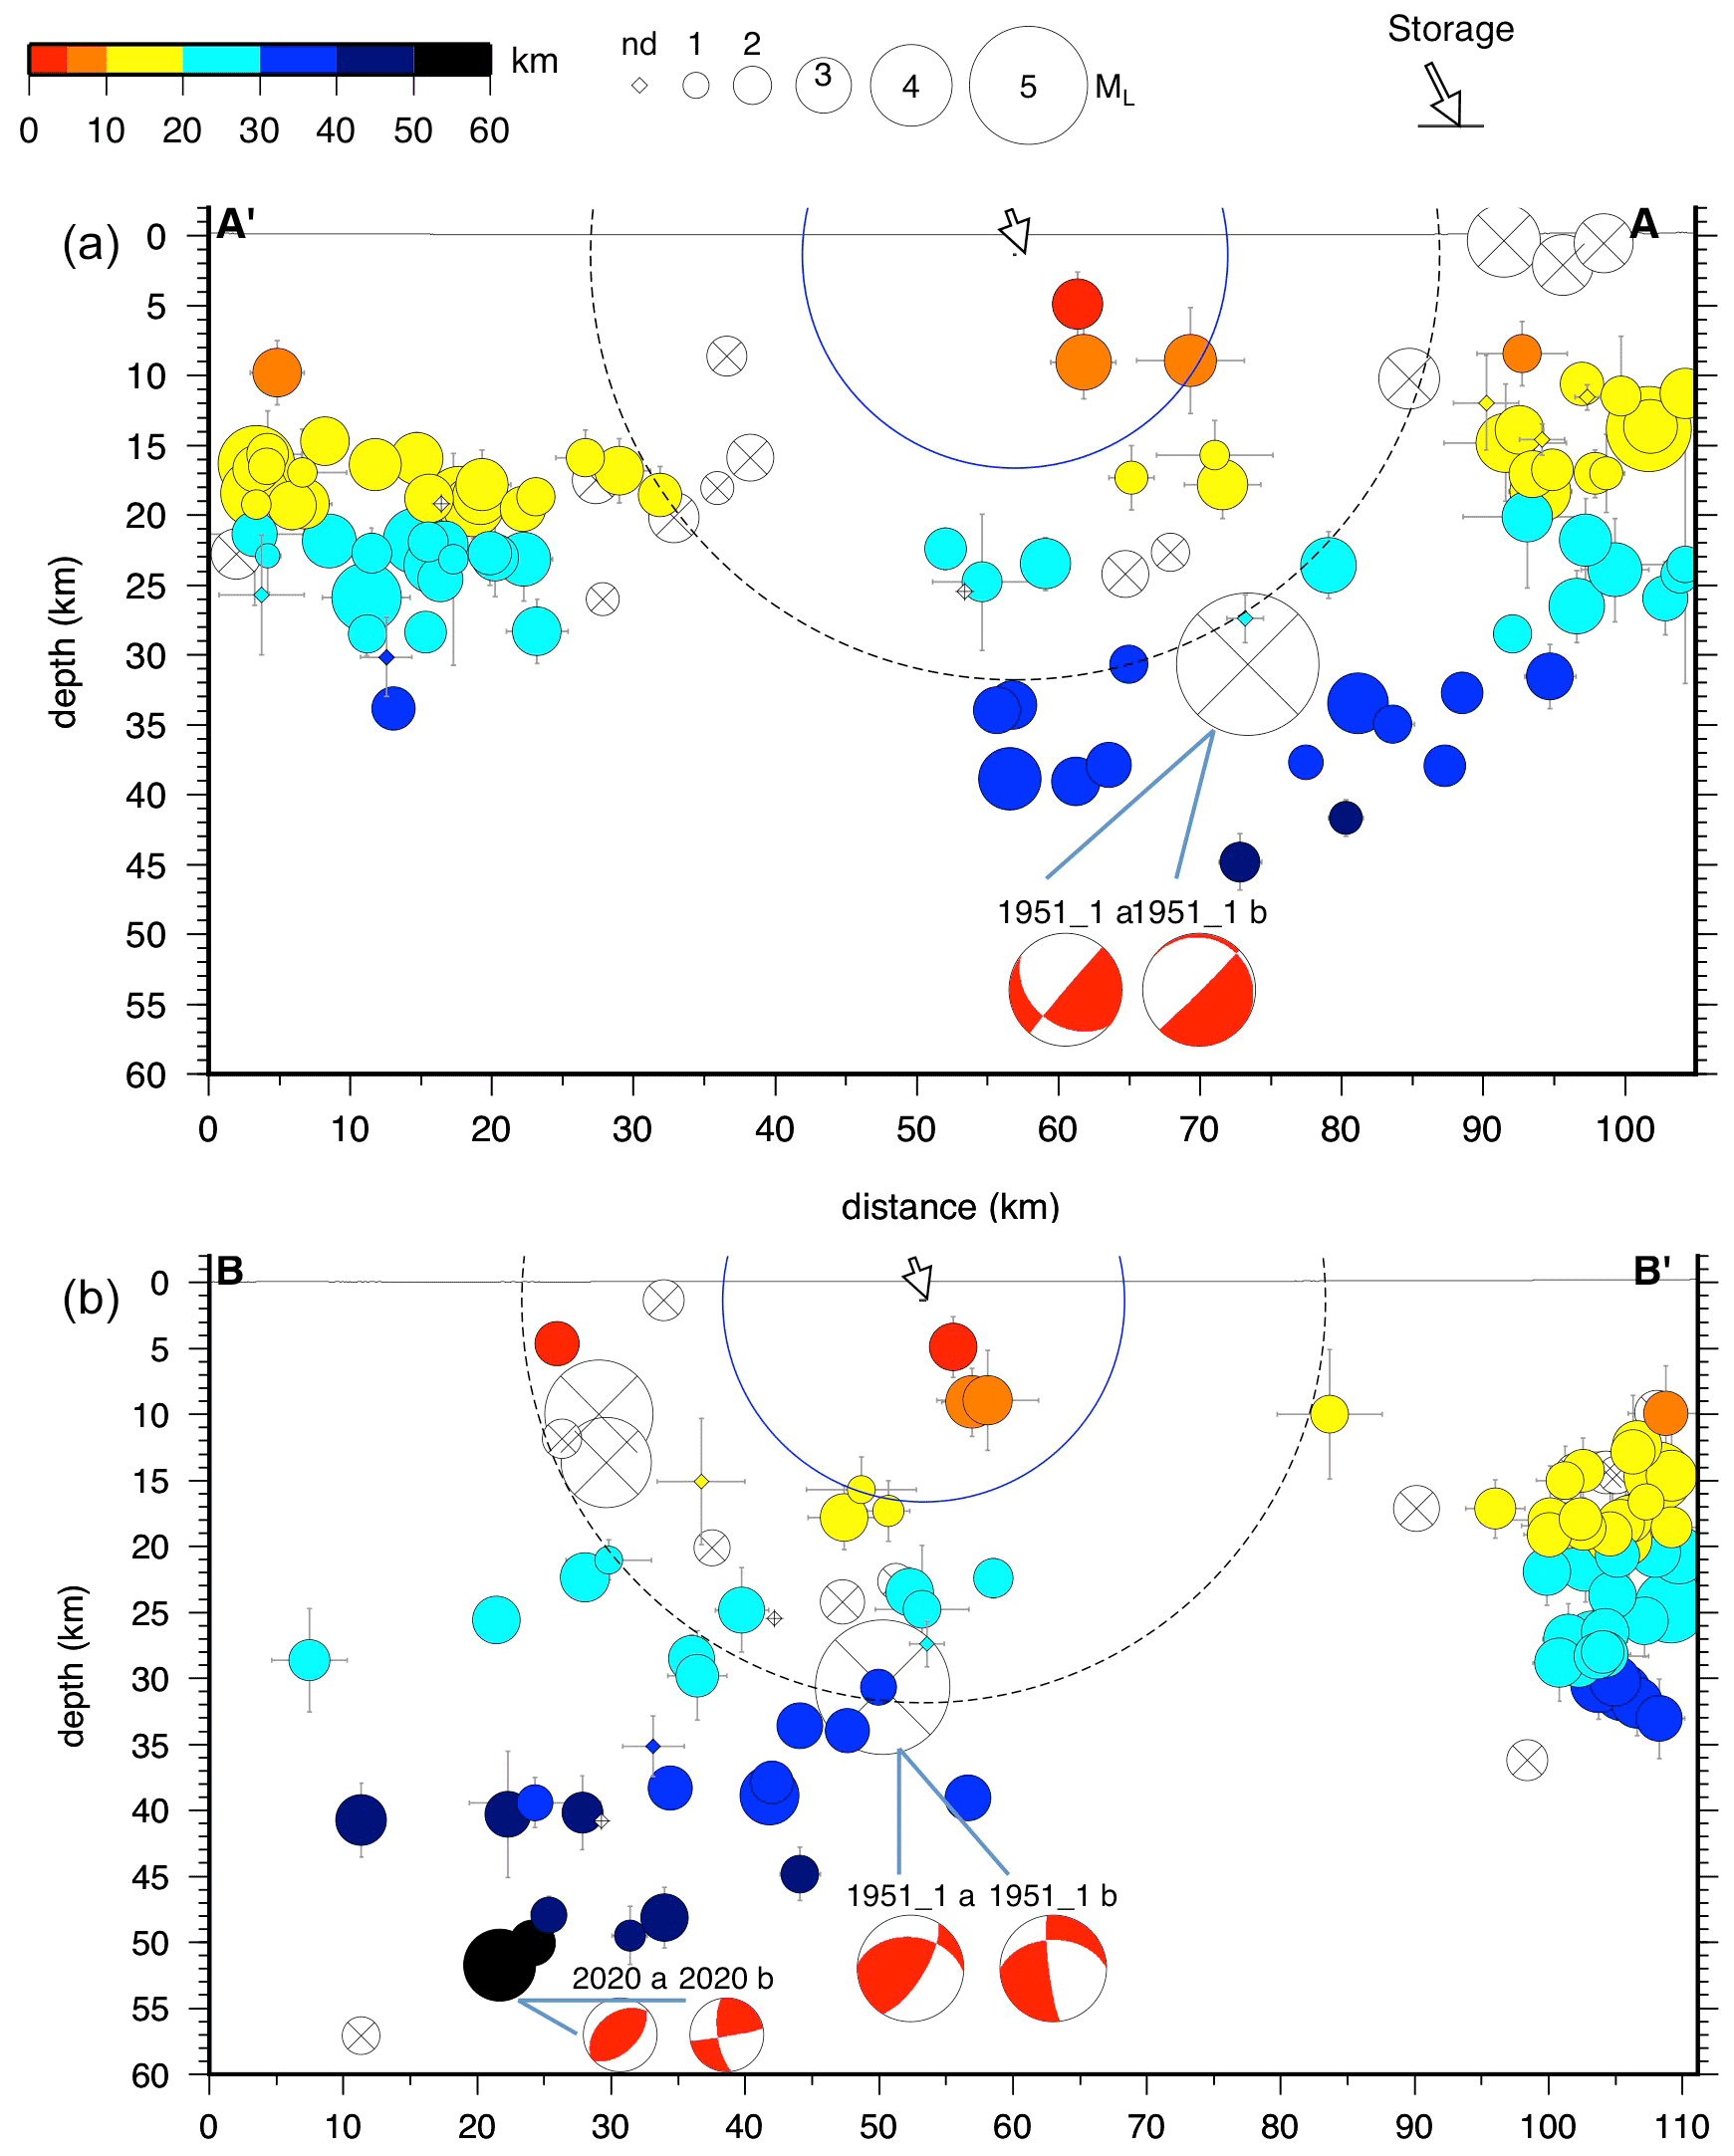
Figure 9Vertical cross sections of the relocated earthquake catalogue. (a) SW–NE cross section (AA' in Fig. 8) in which earthquakes within a 30 km thick stripe centred on the trace line are projected; (b) NW–SE cross section (BB' in Fig. 8), transversal to (a), with the same thickness. The reservoir is indicated by the arrow; the OD and ED domains are represented by black-dashed-line and blue-line half-circles, respectively. White crossed circles represent earthquakes with large standard errors in location (horizontal error ERH > 5 km, or vertical error ERZ > 10 km): error bars represent the statistical standard errors as defined in Hypo71. The multiple solutions of focal mechanisms obtained by first-motion polarity, and projected on the section planes, are the ones given in Table 3 for the events of 15 May 1951 (row 7) and 17 December 2020 (row 4), respectively. Other details as in Fig. 8.
Figures 8 and 9 show the map and cross sections of the final relocated catalogue of earthquakes, for the period 1951–2019. For Fig. 5, there is a generalized increase in the depth of events, and more concentrated patterns of earthquakes; some M>3 earthquakes appear due to the extension of the time interval represented before 1980, with the inclusion of the two strongest earthquakes of the 20th century (the Caviaga earthquakes in 1951). Several events, mainly during the early instrumental period, i.e. before the 1990s, have relevant standard errors (mapped with white, crossed symbols if they have ERH > 5 and ERZ > 10 km). According to the coordinates obtained, 197 events fall inside the TA; many of them shift toward the lower border of the plot area or are outside of the figure. At least a dozen of events inside the TA can still be considered fake locations, due to improper minimum search, as happens when the hypocentral coordinates move far away from the stations that recorded the event. The earthquakes represented in the inset, for example, are likely events that occurred in Switzerland or France, as suggested by their first-arrival phase data. They have been identified considering their horizontal and vertical standard errors but also using of the minimum distance of the first recording station (DMIN), a parameter that usually is not taken into account in the quality analyses, or it cannot be taken into account when the catalogues do not report the full solution parameters. These considerations explain why in the composite catalogue (Fig. 5) we found at least two events not identified by national or regional agencies: it is a first warning on the uncritical utilization of earthquake catalogues in low-seismicity and badly monitored areas. Then, we removed the earthquakes with DMIN > 70 km, adopting a threshold that corresponds to the 95 percentile of DMIN distances for the events in the target area: the remaining earthquakes are plotted in the cross sections of Figs. 9 and 10.
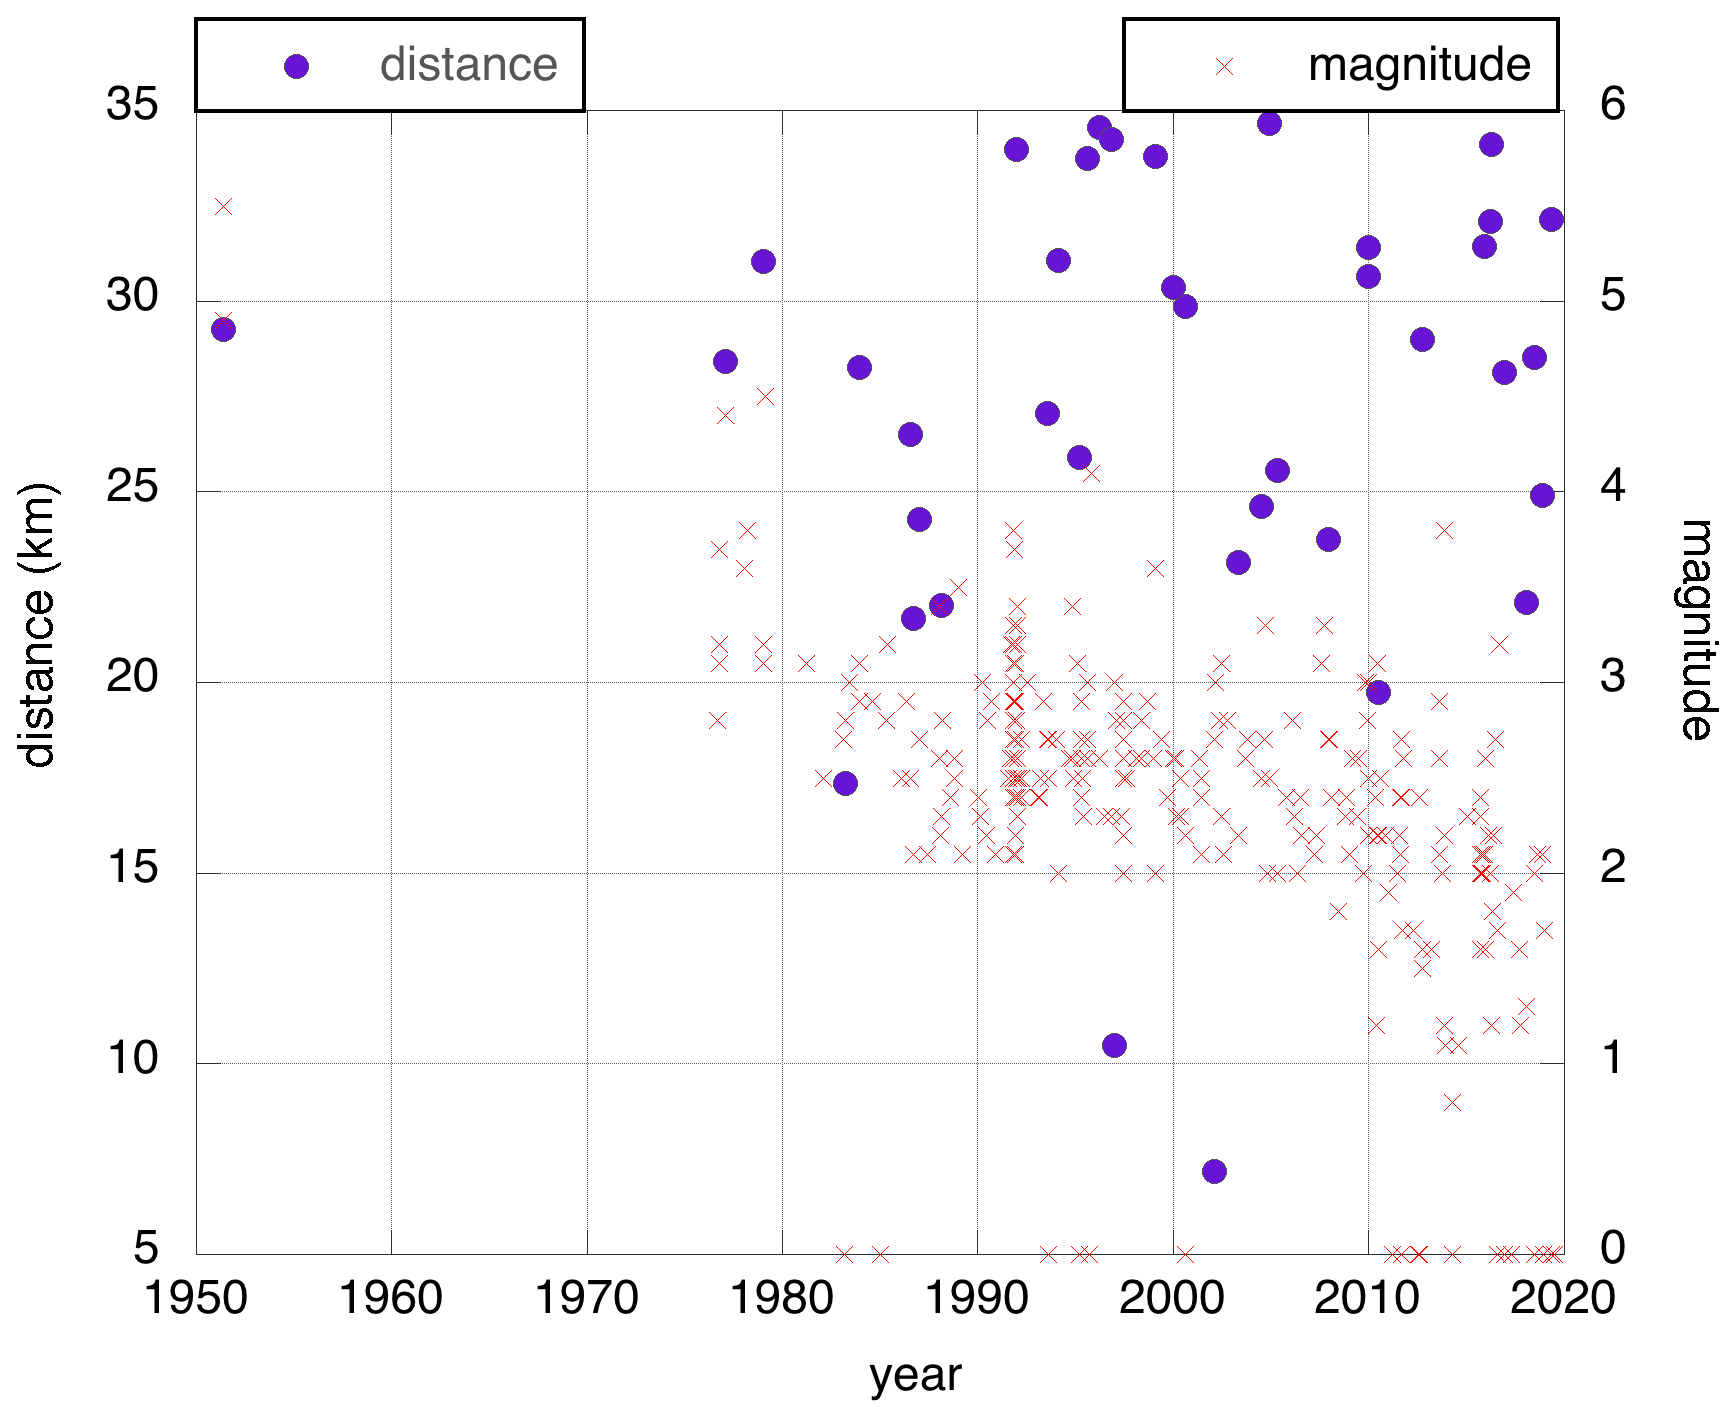
Figure 10Magnitude–distance plot of relocated events versus time. Blue bullets: hypocentre-to-reservoir distance (only events within 35 km distance are shown); red crosses: magnitude. Events with undefined magnitude are represented at magnitude equal to zero (whole dataset).
The distribution of relocated earthquakes now shows a more evident separation between the Apennines and Alpine domains. Earthquakes are in general deeper than in the composite catalogue (Fig. 5), especially towards the Apennines: if the “absolute” depths are confirmed by further studies, many earthquakes can be assigned to the lower crust (> 15 km depth). For the main event of 1951, we acknowledge the consistency of our location with one of the two solutions obtained by Caciagli et al. (2015), even if the parameters and algorithms used are different. In our study, in particular, phase readings were taken from the original paper of Caloi not included up to now in the ISC database; our relocation uses a regional model rather than a global model; we retain only stations up to 400 km distance, discarding the worldwide stations used by Caciagli and co-authors, and use regional relocation code (Hypo71) instead of global ones. Our relocation of the aftershock of 16 May 1951 is orthogonal to the NE–SW line obtained by the two solutions proposed by Caciagli et al. (2015) for this event; we think that the quality of the aftershock hypocentral solution is lower than the main event, despite the better statistical errors (see Table 3). The focal mechanism, obtained from the first polarity data in this study (Table 3), shows multiple or poorly constrained solutions: for the main event, the compressive solution is similar to the mechanisms already published (e.g. Martelli et al., 2016), but an alternative, statistically preferable, extensional mechanism is suggested, on NW–SE-to-WSW–ENE-oriented fault planes with a moderately dipping angle. Note, however, that the retrieved focal mechanisms do not help to fix the uncertainty in aftershock location and fault identification, or to associate the events with any of the seismogenic sources identified in the literature until now. The 15 May 1951 mechanisms, although not well constrained, have common elements with the 2020 ones, i.e. a comparable unusual depth, the same ambiguity between two contrasting solutions (transtensive vs. transpressive mechanism), and the maximum stress σ1 axis orientation (indicated by P in the plots in Table 3). Surprisingly, the σ1 is compatible with a NW migration of Adria plate, more than to the NNE–SSW-oriented convergence of the Alpine and Apennine systems. As proposed for the eastern Southern Alps (Caputo et al., 2010) this may suggest the presence of a low-angle decoupling level at an intermediate depth. These very preliminary considerations have to be confirmed by further analyses (e.g. full moment tensor, reflected and converted phase modelling at the Moho) that could probably help to constrain the rupture location and reduce the uncertainties.
Very few earthquakes are located within 30 km distance of the reservoir (dashed black circles in Figs. 8 and 9). The events that have DMIN < 70 km are plotted in the double-Y graph of Fig. 10, where the blue dots represent the hypocentre-to-reservoir distance (left axis), and red crosses the magnitude assigned by the origin agency, both plotted versus time. Only two events are located within the 15 km distance (Fig. 9), i.e. the M2.7 earthquake of 2 February 2002, and M3.0 earthquake of 24 December 1996: although their location features small standard errors, in both the cases the relevant distance from the first recording station (DMIN approximately 53 and 60 km) makes the reliability of the estimated depth still poor. Another event is located nearby, that is the M2.7 earthquake that occurred on 25 March 1983, at about 17 km distance from the reservoir (DMIN = 33 km).
Note in Fig. 10 the decrease in the minimum magnitude threshold versus time, which corresponds to an increase in the network sensitivity, and the lack of magnitude data for some events. We consider this picture a useful representation of the weak level of seismicity that characterizes the area near Lodi, as it (1) helps in driving the future investigations towards individual earthquakes, or specific sequences; (2) permits a 4D representation of the volumes surroundings the investigated site and is useful for comparison purposes too; and (3) provides a visual perception of the completeness magnitude, as a statistical treatment cannot be applied to such a small sample that is not uniform.
This study adds some new pieces of information to the knowledge of the seismicity of the Po Plain area around the Lodi town; however, we think that only an improvement of the existing observational capability will allow us to interpret which lithospheric structures are responsible for the earthquakes, both past and present, in the Lodi area. The new seismic monitoring network that has been recently accomplished for the Cornegliano Laudense UGS will surely contribute significantly to that purpose.
The uncritical use of existing earthquake catalogues can lead to biased representations of the seismicity, especially in weakly seismic or poorly monitored areas. This is the case for the Lodi area, in the central sector of the Po Valley.
The collection of instrumental data allowed us to identify more than 300 earthquakes from 1951 to 2019 (Fig. 5). Through their re-processing, we have located nearly 200 events within a target area (white rectangle in Fig. 8) defined around the Cornegliano Laudense gas storage. The hypocentral solutions are obtained with a standard absolute location method that, even if non-optimal, is a suitable choice to perform uniform processing for the whole period. Depths are influenced by the velocity model: the one we adopted for the final representation leads to the best statistical performances and depths that are compatible with the ones obtained by other recent analyses and in agreement with the results obtained for the very last earthquake that occurred in 2020. The location errors are relevant for the early instrumental period and decrease in the most recent years. While we recall that the statistical error cannot be considered a physical measure of hypocentral uncertainty, we underline that, in combination with a careful analysis of each event, and other solution parameters (e.g. the minimum event-station distance, DMIN), they help detect fake locations and permit a comparative evaluation of the hypocentral solutions.
This study also shows that the detection capability in Northern Italy increased after the 1976 Friuli earthquakes, and then in the early 80s, mainly because of the improvement of the regional networks; a second improvement consisting of a decrease in minimum magnitude threshold is observed in 2008–2010, probably due to the growth of the national networks that followed the 2009 L'Aquila earthquake. As we did not check the magnitude assessment, however, these data are not uniform: no conclusive remarks can be drawn on completeness magnitude versus time.
The seismicity in this sector of the Po Plain, where the Northern Apennines and the Southern Alps collide below a thick sedimentary cover, is weak and deep. This picture is quite clear, although the area is not monitored with quality comparable to that of the adjacent regions. With regard to the Lodi area, and in particular, to the outer domain (30 km distance; see Fig. 2) of the Cornegliano Laudense storage, the earthquakes identified in the last decades are extremely rare (on average 0.5 earthquakes per year, if we assume a completeness magnitude Mc∼2.7, from the 1980s). In the whole period 1951–2019, only two events fell within the volume with a radius of 15 km from the reservoir (external domain); the reliability of their hypocentral location can be further investigated by alternative location methods, given the limitations of the available recordings. The first instrumentally sufficiently recorded events are related to the seismic sequence of Caviaga, in 1951; they also represent the strongest events that occurred in the area. Our study confirms the elevated depth and large distance of these events from the Cornegliano Laudense reservoir, as already proposed by Caciagli et al. (2015). We further suggest a similarity between the focal mechanisms of the M5.4 earthquake of 15 May 1951, and the M4.2 earthquake of 17 December 2020, which occurred near Milan. Some hints about Adria indenter that moves towards NW, as a possible driving force at Moho depth, are hypothesized, but they have to be confirmed by additional studies. Finally, no reliable interpretation can be formulated on which are the lithospheric structures responsible for the earthquakes in this area. The seismogenic sources proposed for this area in the literature have to be reconsidered in the light of the new results here obtained: deep sources have to be accounted for in the databases.
Further studies for better knowledge and interpretation of seismogenic sources in this strategic area of the Po Plain are ongoing; the quality of the revised catalogue can be increased, for example, by approaching the hypocentral location with full grid search methods, by resorting to original seismograms in some cases, and especially by facing uniformly the assessment of magnitude values, not tackled in this work. Better insight will be gained by improving the existing observational capability, and, in this respect, the new seismic monitoring network of Cornegliano Laudense UGS will surely contribute significantly to these purposes.
Data are available from the corresponding author upon request. Graphics were made using GMT (https://www.generic-mapping-tools.org/, last access: 10 August 2021; Wessel et al., 2013); Kaleidagraph (https://www.synergy.com/, last access: 10 August 2021); © OpenStreetMap contributors, 2021, distributed under a Creative Commons BY-SA license; and other software cited in the text.
The supplement related to this article is available online at: https://doi.org/10.5194/se-12-2021-2021-supplement.
Conceptualization of the project was done by LP, AS, and EP. Data were collected and relocated by AS, LP, and MAR; noise analysis by DS and EP. Scripting and pre- and post-processing routines were written by MGa and LP. Figures were prepared by all the authors. The manuscript was drafted by LP, AS, and EP and completed with help of all the co-authors, who checked, improved, and approved the final release. AS worked on this research for her thesis at the University of Padua (2019), and during an extracurricular internship at OGS, during her MSc course at the University of Trieste.
The authors declare that they have no conflict of interest.
Publisher's note: Copernicus Publications remains neutral with regard to jurisdictional claims in published maps and institutional affiliations.
This article is part of the special issue “Tools, data and models for 3-D seismotectonics: Italy as a key natural laboratory”. It is a result of the workshop on “Tools, data and models for 3D seismotectonics: the Italian laboratory over time”, Perugia, Italy, 9–10 July 2019.
This study has been performed by the OGS National Institute of Oceanography and Applied Geophysics within the framework of the activities for the implementation of the integrated seismic and geodetic monitoring of the UGS concession “Cornegliano Stoccaggio”. The concession holder is IGS – Ital Gas Storage S.p.A., and it provided a substantial portion of the financial support needed. With the implementation of the integrated monitoring system, IGS adheres on a voluntary basis to the Italian Guidelines for monitoring the underground activities issued by the Italian Ministry for the Economic Development (MiSE) and General Directorate for the Infrastructures and Safety of the Energetic and Mining Systems of the National Mining Office for the Hydrocarbons and Geo-Resources (DGISSEG-UNMIG) in 2014.
We are also grateful to Davide Scafidi of the Genova University, who provided some phase readings of the UNIGE network not openly accessible; our colleagues of the OGS, CRS Section, Marco Romanelli and Giovanna Laurenzano, for the support given during the scouting phase with the deployment of a set of temporary seismological stations and the recovery of the seismic noise data, respectively; Giuseppe Gervasi and Stefano Lombardi of IGS for the important support given constantly for the success of the activity; the whole staff of national and regional Italian networks for their silent work of maintenance and daily duties in earthquake processing.
This research has been supported financially by Ital Gas Storage S.p.A., under a research contract established among Ital Gas Storage S.p.A., OGS, and CNR-IREA on 16 February 2018.
This paper was edited by Luca De Siena and reviewed by Riccardo Caputo and two anonymous referees.
Arrowsmith, S., Park, J., Che, I.-Y., Stump, B., and Averbuch, G.: Event Location with Sparse Data: When Probabilistic Global Search is Important, Seismol. Res. Lett., 92, 976–985, https://doi.org/10.1785/0220200292, 2020.
Bencini, R. (Ed): L'Italia, paese di idrocarburi. Assomineraria (Italian Mining and Petroleum upstream industrial association), 141 pp., 1999.
Benedetti, L. C., Tapponier, P., Gaudemer, Y., Manighetti, I., and Van der Woerd, J.: Geomorphic evidence for an emergent active thrust along the edge of the Po Plain: The Broni-Stradella fault, J. Geophys. Res., 108, 2238, https://doi.org/10.1029/2001JB001546, 2003.
Bigi, G., Castellarin, A., Coli, M., Dal Piaz, G. V., Sartori, R., Scandone, P., and Vai, G. B.: Structural Model of Italy Sheet 1–1:500.000, CNR, Progetto Finalizzato Geodinamica, Florence, Italy, 1, 1990.
Boccaletti, M., Corti, G., and Martelli, L.: Recent and active tectonics of the external zone of the northern Apennines (Italy), Int. J. Earth Sci. 100, 1331–1348, 2011.
Bragato, P. L., Comelli, P., Saraò, A., Zuliani, D., Moratto, L., Poggi, V., Rossi, G., Scaini, C., Sugan, M., Barnaba, C., Bernardi, P., Bertoni, M., Bressan, G., Compagno, A., Del Negro, E., Di Bartolomeo, P., Fabris, P., Garbin, M., Grossi, M., Magrin, A., Magrin, E., Pesaresi, D., Petrovic, B., Plasencia Linares, M.P., Romanelli, M., Snidarcig, A., Tunini, L., Urban, S., Venturini, E., and Parolai, S.: The OGS– Northeastern Italy Seismic and Deformation Network: Current Status and Outlook, Seismol. Res. Lett., 92, 1704–1716, https://doi.org/10.1785/0220200372, 2021.
Bressan, G., Bragato, P. L., and Venturini C.: Stress and strain tensors based on focal mechanisms in the seismotectonic framework of the Friuli-Venezia Giulia region (northeastern Italy), Bull. Seismol. Soc. Am., 93, 1280–1297, 2003.
Caciagli, M., Camassi, R., Danesi, S., Pondrelli, S., Salimbeni, S.: Can We Consider the 1951 Caviaga (Northern Italy) Earthquakes as Noninduced Events? Seismol. Res. Lett., 86, 5, 1335–1345, https://doi.org/10.1785/0220150001, 2015.
Caloi, P., de Panfilis, M., di Filippo, M., Marcelli, L., and Spadea, M. C.: Terremoti della Val Padana del 15–16 maggio 1951, Ann. Geophys. 9, 63–105, 1956 (in Italian).
Caputo, R., Poli, E., and Zanferrari, A.: Neogene–Quaternary tectonic stratigraphy of the eastern Southern Alps, NE Italy, J. Struct. Geol., 32, 1009–1027, https://doi.org/10.1016/j.jsg.2010.06.004, 2010.
Carminati, E. and Doglioni, C.: Alps vs. Apennines: the paradigm of a tectonically asymmetric Earth, Earth Sci. Rev. 112, 67–96, 2012.
Castello, B., Selvaggi, G., Chiarabba, C., and Amato, A.: CSI Catalogo della sismicità italiana 1981-2002, versione 1.1, INGV-CNT, Roma, https://doi.org/10.13127/CSI.1.1, 2006.
Centro Studi: The earthquake costs in Italy (I costi dei terremoti in Italia), Roma: Consiglio nazionale ingegneri, available at: http://cache.b.centrostudicni.it/images/pubblicazioni/ricerche/cr470_costi_terremoto_59a5d.pdf (last access: 10 August 2021), 2014.
Chiarabba, C., Jovane, L., and Di Stefano, R.: A new view of Italian seismicity using 20 years of instrumental recordings, Tectonophysics, 395, 251–268, 2005.
Dal Piaz, G. V., Bistacchi, A., and Massironi, M.: Geological outline of the Alps, Episodes 26, 175–180, 2004.
Dami, C.: L'economia degli idrocarburi nazionali (Parte 1), Moneta e credito 5, nos. 19/20, 306–329, ISSN 0026-9611, 1952 (in Italian).
Dercourt, J., Zonenshain, L. P., Ricou, L.-E., Kazmin, V. G., Le Pichon, X., Knipper, A. L., Grandjacquet, C., Sbortshikov, I. M., Geyssant, J., Lepvrier, C., Pechersky, D. H., Boulin, J., Sibuet, J.-C., Savostin, L.A., Sorokhtin, O., Westphal, M., Bazhenov, M. L., Laurer, J. P., and Biju-Duval, B.: Geological evolution of the Tethys belt from Atlantic to Pamirs since the Lias, Tectonophysics 123, 241–315, 1986.
DGR: Delibera Giunta Regionale: Aggiornamento delle zone sismiche in Regione Lombardia (l.r. 1/2000, art. 3, c. 108, lett. d) – n. X/2129, available at: http://www.cartografia.regione.lombardia.it/metadata/sismica/doc/DgR_2129_2014.pdf (last access: 10 August 2021), 2014.
Devoti, R., Esposito, A., Pietrantonio, G., Pisani, A. R., and Riguzzi, F.: Evidence of large scale deformation patterns from GPS data in the Italian subduction boundary, Earth Planet. Sc. Lett. 311, 230–241, https://doi.org/10.1016/j.epsl.2011.09.034, 2011.
DISS Working Group: Database of Individual Seismogenic Sources (DISS), Version 3.2.1: A compilation of potential sources for earthquakes larger than M 5.5 in Italy and surrounding areas, available at: http://diss.rm.ingv.it/diss/ (last access: 10 August 2021), Istituto Nazionale di Geofisica e Vulcanologia; https://doi.org/10.6092/INGV.IT-DISS3.2.1, 2018.
Eva, C., Barani, S., Carenzo, G., De Ferrari, R., Eva, E., Ferretti, G., Pasta, M., Pavan, M., Scafidi, D., Solarino, S., Spallarossa, D., Turino, C., and Zunino, E.: 30 years of seismicity in the South-Western Alps as recorded by the Regional Seismic network of Northwestern Italy, 29∘ Convegno Gruppo Nazionale Geofisica della Terra Solida, 26–28 Ottobre, Prato, Italy, 2010.
Fantoni, R. and Franciosi, R.: Tectono-sedimentary setting of the Po Plain and Adriatic foreland, Rendiconti Fisici dell'Accademia dei Lincei, 21, 197–209, 2010.
Foulger, G. R., Wilson, M. P., Gluyas, J. G., Juliana, B. R., and Davies, R. J.: Global review of human-induced earthquakes, Earth Sci. Rev., 178, 438–514, https://doi.org/10.1016/j.earscirev.2017.07.008, 2018.
Franceschina, G., Augliera, P., Lovati, S., and Massa,, M.: Surface seismic monitoring of a natural gas storage reservoir in the Po Plain (northern Italy), Bollettino di Geofisica Teorica e Applicata, 56, 489–504, https://doi.org/10.4430/bgta0165, 2015.
Gasparini, C., Iannaccone, G., and Scarpa, R.: Fault-plane solutions and seismicity of the Italian peninsula, Tectonophysics, 117, 59–78, 1985.
Gentili, S., Sugan, M., Peruzza, L., and Schorlemmer, D.: Probabilistic completeness assessment of the past 30 years of seismic monitoring in northeastern Italy, Phys. Earth Planet. In., 186, 81–96, https://doi.org/10.1016/j.pepi.2011.03.005, 2011.
Ghielmi, M., Minervini, M., Nini, C., Rogledi, S., Rossi, M., and Vignolo, A.: Sedimentary and tectonic evolution in the eastern Po-Plain and northern Adriatic Sea area from Messinian to Middle Pleistocene (Italy), Rendiconti Lincei, Scienze Fisiche e Naturali, 21, 131–166, https://doi.org/10.1007/s12210-010-0101-5, 2010.
Hetényi, G., Molinari I., Clinton J., and the AlpArray Working Group: The AlpArray Seismic Network: a large-scale European experiment to image the Alpine orogeny, Surv. Geophys., 39, 1009–1033, https://doi.org/10.1007/s10712-018-9472-4, 2018
Husen, S. and Hardebeck, J. L.: Earthquake location accuracy, Community Online Resource for Statistical Seismicity Analysis, 1–35, https://doi.org/10.5078/corssa-55815573, 2010.
Kennett, B. L. N. and Engdahl, E. R.: Travel times for global earthquake location and phase association, Geophys. J. Int., 105, 429–465, https://doi.org/10.17611/DP/9991809, 1991.
Kennett, B. L. N., Engdahl, E. R., and Buland, R.: Constraints on seismic velocities in the Earth from travel-times, Geophys. J. Int., 122, 108–124, 1995.
Kind, R., Schmid, S. M., Yuan, X., Heit, B., Meier, T., and the AlpArray and AlpArray-SWATH-D Working Groups: Moho and uppermost mantle structure in the greater Alpine area from S-to-P converted waves, Solid Earth Discuss. [preprint], https://doi.org/10.5194/se-2021-33, in review, 2021.
ISIDe Working Group: Italian Seismological Instrumental and Parametric Database (ISIDe), Istituto Nazionale di Geofisica e Vulcanologia (INGV), https://doi.org/10.13127/ISIDE, 2007.
Lahr, J. C.: HYPOELLIPSE: A computer program for determining local earthquake hypocentral parameters, magnitude and firstmotion pattern (Y2K compliant version), version 1.0, U.S. Geol. Surv. Open-File Rept. 99-23, On-Line Edition, 1999.
Lee, W. H. K. and Lahr, J. C.: Hypo71 (revised): a computer program for determining hypocenter, magnitude and first motion pattern of local earthquakes. USGS Open File Report 75-311, Menlo Park, 1975.
Liberatore, L., Sorrentino, L., Liberatore, D., and Decanini, L. D.: Failure of industrial structures induced by the Emilia (Italy) 2012 earthquakes, Engineering Failure Analysis, 34, 629–647, 2013.
Maesano, F. E., D'Ambrogi, C., Burrato, P., and Toscani, G.: Slip-rates of blind thrusts in slow deforming areas: Examples from the Po Plain (Italy), Tectonophysics, 643, 8–25, https://doi.org/10.1016/j.tecto.2014.12.007, 2015.
Marchetti, A., Arcoraci, L., Battelli, P., Berardi, M., Castellano, C., Margheriti, L., Mele, F., Nardi, A., and Rossi, A.: Bollettino Sismico Italiano 2013, Quad. Geofis., 159, 1–50, 2020.
Margheriti, L., Nostro, C., Cocina, O., Castellano, M., Moretti, M., Lauciani, V., Quintiliani, M., Bono, A., Mele, F.M., Pintore, S., Montalto, P., Peluso, R., Scarpato, G., Rao, S., Alparone, S., Di Prima, S., Orazi, M., Piersanti, A., Cecere, G., Cattaneo, M., Vicari, A., Sepe, V., Bignami, C., Valoroso, L., Aliotta, M., Azzarone, A., Baccheschi, P., Benincasa, A., Bernardi, F., Carluccio, I., Casarotti, E., Cassisi, C., Castello, B., Cirilli, F., D'Agostino, M., D'Ambrosio, C., Danecek, P., De Cesare, W., Della Bina, E., Di Filippo, A., Di Stefano, R., Faenza, L., Falco, L., Fares, M., Ficeli, P., Latorre, D., Lorenzino, M.C., Mandiello, A., Marchetti, A., Mazza, S., Michelini, A., Nardi, A., Pastori, M., Pignone, M., Prestifilippo, M., Ricciolino, P., Sensale, G., Scognamiglio, L., Selvaggi, G., Torrisi, O., Zanolin, F., Amato, A., Bianco, F., Branca, S., Privitera, E., and Stramondo, S: Seismic Surveillance and Earthquake Monitoring in Italy, Seismol. Res. Lett., 92, 1659–1671, https://doi.org/10.1785/0220200380, 2021.
Martelli, L., Bonini, M., Calabrese, L., Corti, G., Ercolessi, G., Molinari, F. C., Piccardi, L., Pondrelli, S., Sani, F., and Severi, P.: Carta sismotettonica della regione Emilia Romagna ed aree limitrofe. Regione Emilia Romagna, available at: https://ambiente.regione.emilia-romagna.it/it/geologia/pubblicazioni/cartografia-geo-tematica/carta-sismotettonica-della-regione-emilia-romagna-e-aree-limitrofe-edizione-2016 (last access: 10 August 2021), 2016.
McNamara, D. E. and Buland, R. P.: Ambient noise levels in the continental United States, Bull. Seismol. Soc. Am., 94, 1517–1527, https://doi.org/10.1785/012003001, 2004
MiSE-UNMIG: Guidelines for monitoring seismicity, ground deformation and pore pressure in subsurface industrial activities; Ministero per lo Sviluppo Economico (MiSE) – Ufficio nazionale minerario per gli idrocarburi e le georisorse (UNMIG); English version, available at: https://unmig.mise.gov.it/index.php/it/sicurezza/geomonitoraggi/linee-guida (last access: 10 August 2021), 2014.
MiSE-DGISSEG-UNMIG: Stoccaggio del gas naturale; Ministero per lo Sviluppo Economico (MiSE) – Direzione Generale per le Infrastrutture e la Sicurezza dei Sistemi Energetici e Geominerari (DGISSEG) – UfficioNazionale Minerario per gli Idrocarburi e le Georisorse (UNMIG), Only in italian, available at: https://unmig.mise.gov.it/index.php/it/dati/stoccaggio-del-gas-naturale, last access: 10 August 2021.
Ogniben, L., Parotto, M., and Praturlon, A.: Structural model of Italy, Quaderni de “La ricerca scientifica”, Progetto finalizzato Geodinamica: Risultati finali, Consiglio Nazionale delle Ricerche, Roma, Italy, 1975.
Pagani, M., Garcia-Pelaez, J., Gee, R., Johnson, K., Poggi, V., Styron, R., Weatherill, G., Simionato, M., Viganò, D., Danciu, L., and Monelli, D.: Global Earthquake Model (GEM) Seismic Hazard Map (version 2018.1 – December 2018), https://doi.org/10.13117/GEM-GLOBAL-SEISMIC-HAZARD-MAP-2018.1, 2018.
Peruzza, L. and Pessina, V.: Zone sismiche e pericolosità in Italia: dalle norme regionali alla comunicazione del rischio, Geologia tecnica & ambientale, available at: http://hdl.handle.net/2122/10366 (last access: 10 August 2021), Consiglio Nazionale dei Geologi, 1, 16–31, 2016.
Peterson, J.: Observation and modeling of seismic background noise, U.S. Geol. Surv. Tech. Rept., 93, 1–95, 1993.
Pieri, M. and Groppi, G.: Subsurface geological structure of the Po Plain, Italy. CNR, Prog. Final. Geodinamica, pubbl., Napoli, 414, 1981.
Postpischl, D.: Catalogo dei terremoti italiani dall'anno 1000 al 1980, Quaderni della Ricerca Scientifica, 114, 2B, Bologna, 239 pp., 1985.
Rebez, A.: Studio microsismico a reti unificate dei giacimenti di Cavone e Minerbio – Relazione conclusiva, A.G.I.P. S.p.A., Relazione OGS n. REL/91-24/SIM-02/18.06, 1991 (in Italian).
Reasenberg, P. A. and Oppenheimer, D.: FPFIT, FPPLOT and FPPAGE: FORTRAN computer programs for calculating and displaying earthquake fault-plane solutions, U.S. Geol. Surv. Open-File Rept., 85-739, 109 pp., 1985.
Ritsema, A. R.: Some 1951 earthquake mechanisms based on P and PKP data, Geophys. J. Int., 5, 254–258, 1961.
Rovida, A., Locati, M., Camassi, R., Lolli, B., Gasperini, P., and Antonucci, A.: Catalogo Parametrico dei Terremoti Italiani (CPTI15), versione 3.0, Istituto Nazionale di Geofisica e Vulcanologia (INGV), https://doi.org/10.13127/CPTI/CPTI15.3, 2021.
Sandron, D., Gentile, F., Gentili, S., Saraò, A., Rebez, A., Santulin, M. and Slejko, D.: The Wood Anderson of Trieste (NE Italy): One of the last operating torsion seismometers, Seismol. Res. Lett., 86, 1645–1654, https://doi.org/10.1785/0220150047, 2015.
Serpelloni, E., Vannucci, G., Pondrelli, S., Argnani, A., Casula, G., Anzidei, M., Baldi, P., and Gasperini, P.: Kinematics of the Western Africa-Eurasia plate boundary from focal mechanisms and GPS data, Geophys, J. Int. 169, 1180–1200, https://doi.org/10.1111/j.1365-246X.2007.03367.x, 2007.
Silva, V., Amo-Oduro, D., Calderon, A., Dabbeek, J., Despotaki, V., Martins, L., Rao, A., Simionato, A., Viganò, D., Yepes, C., Acevedo, A., Horspool, N., Crowley, H., Jaiswal, K., Journeay, M., and Pittore, M.: Global Earthquake Model (GEM) Seismic Risk Map (version 2018.1), https://doi.org/10.13117/GEM-GLOBAL-SEISMIC-RISK-MAP-2018.1, 2018.
SNAM: Piano decennale di sviluppo della rete di trasporto del gas naturale 2018 – 2027, available at: http://pianodecennale.snamretegas.it/includes/doc/2/2019012208362018-decennale_web.pdf (last access: 10 August 2021), 2018.
Spallarossa, D., Ferretti, G., Scafidi, D., Turino, C., and Pasta, M.: Performance of the RSNI-Picker, Seismol. Res. Lett., 85, 1243–1254, https://doi.org/10.1785/0220130136, 2014.
Sugan, M. and Peruzza, L.: Distretti sismici del Veneto, Boll. Geof. Teor. Appl., 52, 3–90, https://doi.org/10.4430/bgta0057, 2011 (in Italian).
Turrini, C., Angeloni, P., Lacombe, O., Ponton, M., and Roure, F.: Threedimensional seismo-tectonics in the Po Valley basin, Northern Italy, Tectonophysics, 661, 156–179, https://doi.org/10.1016/j.tecto.2015.08.033ff, 2015.
Vannoli, P., Burrato, P., and Valensise, G.: The Seismotectonics of the Po Plain (Northern Italy): Tectonic Diversity in a Blind Faulting Domain, Pure Appl. Geophys., 172, 1105–1142, https://doi.org/10.1007/s00024-014-0873-0, 2015.
Wessel, P., Smith, W. H. F., Scharroo, R., Luis, J., and Wobbe, F.: Generic Mapping Tools: Improved Version Released [data set], EOS Trans. AGU, 94, 409–410, https://doi.org/10.1002/2013EO450001, 2013.