the Creative Commons Attribution 4.0 License.
the Creative Commons Attribution 4.0 License.
 | 30 Sep 2021
COVID-19 lockdown effects on the seismic recordings in Central America
Mario Arroyo-Solórzano
Diego Castro-Rojas
Frédérick Massin
Lepolt Linkimer
Ivonne Arroyo
Robin Yani
A noticeable decrease in seismic noise was registered worldwide during the lockdown measures implemented in 2020 to prevent the spread of COVID-19. In Central America, strong lockdown measures started during March of 2020. In this study, we used seismic stations from Costa Rica, Guatemala, El Salvador, and Nicaragua to study the effects of these measures on seismic records by characterizing temporal variations in the high-frequency band (4–14 Hz) via spectral and amplitude analyses. In addition, we studied the link between the reduction in seismic noise and the number of earthquake detections and felt reports in Costa Rica and Guatemala. We found that seismic stations near the capitals of Costa Rica, Guatemala, and El Salvador presented a decrease in their typical seismic noise levels, from 200 to 140, from 100 to 80, and from 120 to 80 nm, respectively. Our results showed that the largest reduction of ∼ 50 % in seismic noise was observed at seismic stations near main airports, busy roads, and densely populated cities. In Nicaragua, the seismic noise levels remained constant (∼ 40 nm), as no lockdown measures were applied. We suggest that the decrease in seismic noise levels may have increased earthquake detections and the number of felt reports of low-magnitude earthquakes. However, the variations observed in several seismic parameters before and after the lockdown are not significant enough to easily link our observations or separate them from other contributing factors. Our results imply that the study of seismic noise levels can be useful to verify compliance with lockdown measures and to explore their effects on earthquake detection and felt reports.
- Article
(26406 KB) - Full-text XML
- BibTeX
- EndNote


The seismic noise recorded by seismometers includes microseisms and atmospheric, anthropogenic, or cultural noise (Nimiya et al., 2020). The anthropogenic seismic noise in urban areas tends to be rowdier and more complex than elsewhere. This includes seismic signals generated by human activities such as transportation and industrial activities (Groos and Ritter, 2009; Díaz et al., 2017; Hong et al., 2020). It is difficult to identify precisely how and at what frequencies different human activities are represented in seismic records (McNamara and Buland, 2004; Green et al., 2017; Lecoq et al., 2020a). Indeed, seismic noise includes various anthropogenic noises as a function of frequency, time, and distance in a range usually between 1 and 40 Hz (Kuzma, 2009; Riahi and Gerstoft, 2015; Díaz et al., 2017).
A reduction in the seismic noise worldwide has been observed coinciding with the lockdown measures to prevent the spread of COVID-19, which was declared a pandemic by the World Health Organization in March 2020 (Sohrabi et al., 2020). This effect was first described for Shillong (India) by Somala (2020), for northern Italy by Poli et al. (2020), and at a global scale by Lecocq et al. (2020a). Governments have tried to prevent or delay the spread of COVID-19 by enforcing social distancing via measures such as limiting nonessential activities, closing schools and universities, restricting the mobility of the citizens, and shutting down workplaces (Piccinini et al., 2020).
Central America has been severely affected by the of COVID-19 pandemic with an estimated death toll of 18 145 people by the end of 2020 (SICA, 2020). This small land bridge (1400 km long and 80–400 km wide) between the Americas is home to about 50 million inhabitants. It is located mostly on the Caribbean Plate and the Panama Microplate, surrounded by four major tectonic plates: the Cocos Plate to the southwest, the Nazca Plate to the south, and the North American and South American plates to the north and southeast, respectively. The boundary between the Cocos and Caribbean plates occurs at the Middle America Trench (MAT), where the Cocos Plate subducts underneath the Caribbean Plate and the Panama Microplate. The North Panama Deformed Belt (NPDB) constitutes the Caribbean Plate–Panama Microplate boundary, and the Polochic–Motagua Fault System (PMFS) marks the Caribbean–North American Plate boundary (Fig. 1) (e.g., Adamek et al., 1988; Kellogg and Vega, 1995; Trenkamp et al., 2002; Vargas and Mann, 2013). This complex and active tectonic setting in Central America generates high seismicity rates and volcanic activity. For instance, some of the deadliest earthquakes (Fig. 1) were the 1910 M 6.4 Cartago earthquake in Costa Rica, the 1972 M 6.3 Managua earthquake in Nicaragua, the 1976 M 7.5 Guatemala earthquake, and the 1986 M 5.7 San Salvador earthquake in El Salvador, with ∼ 600, ∼ 20 000, ∼ 23 000, and ∼ 6000 fatalities, respectively (Espinosa, 1976; Mann et al., 1990; Harlow et al., 1993; Alonso-Henar et al., 2013).
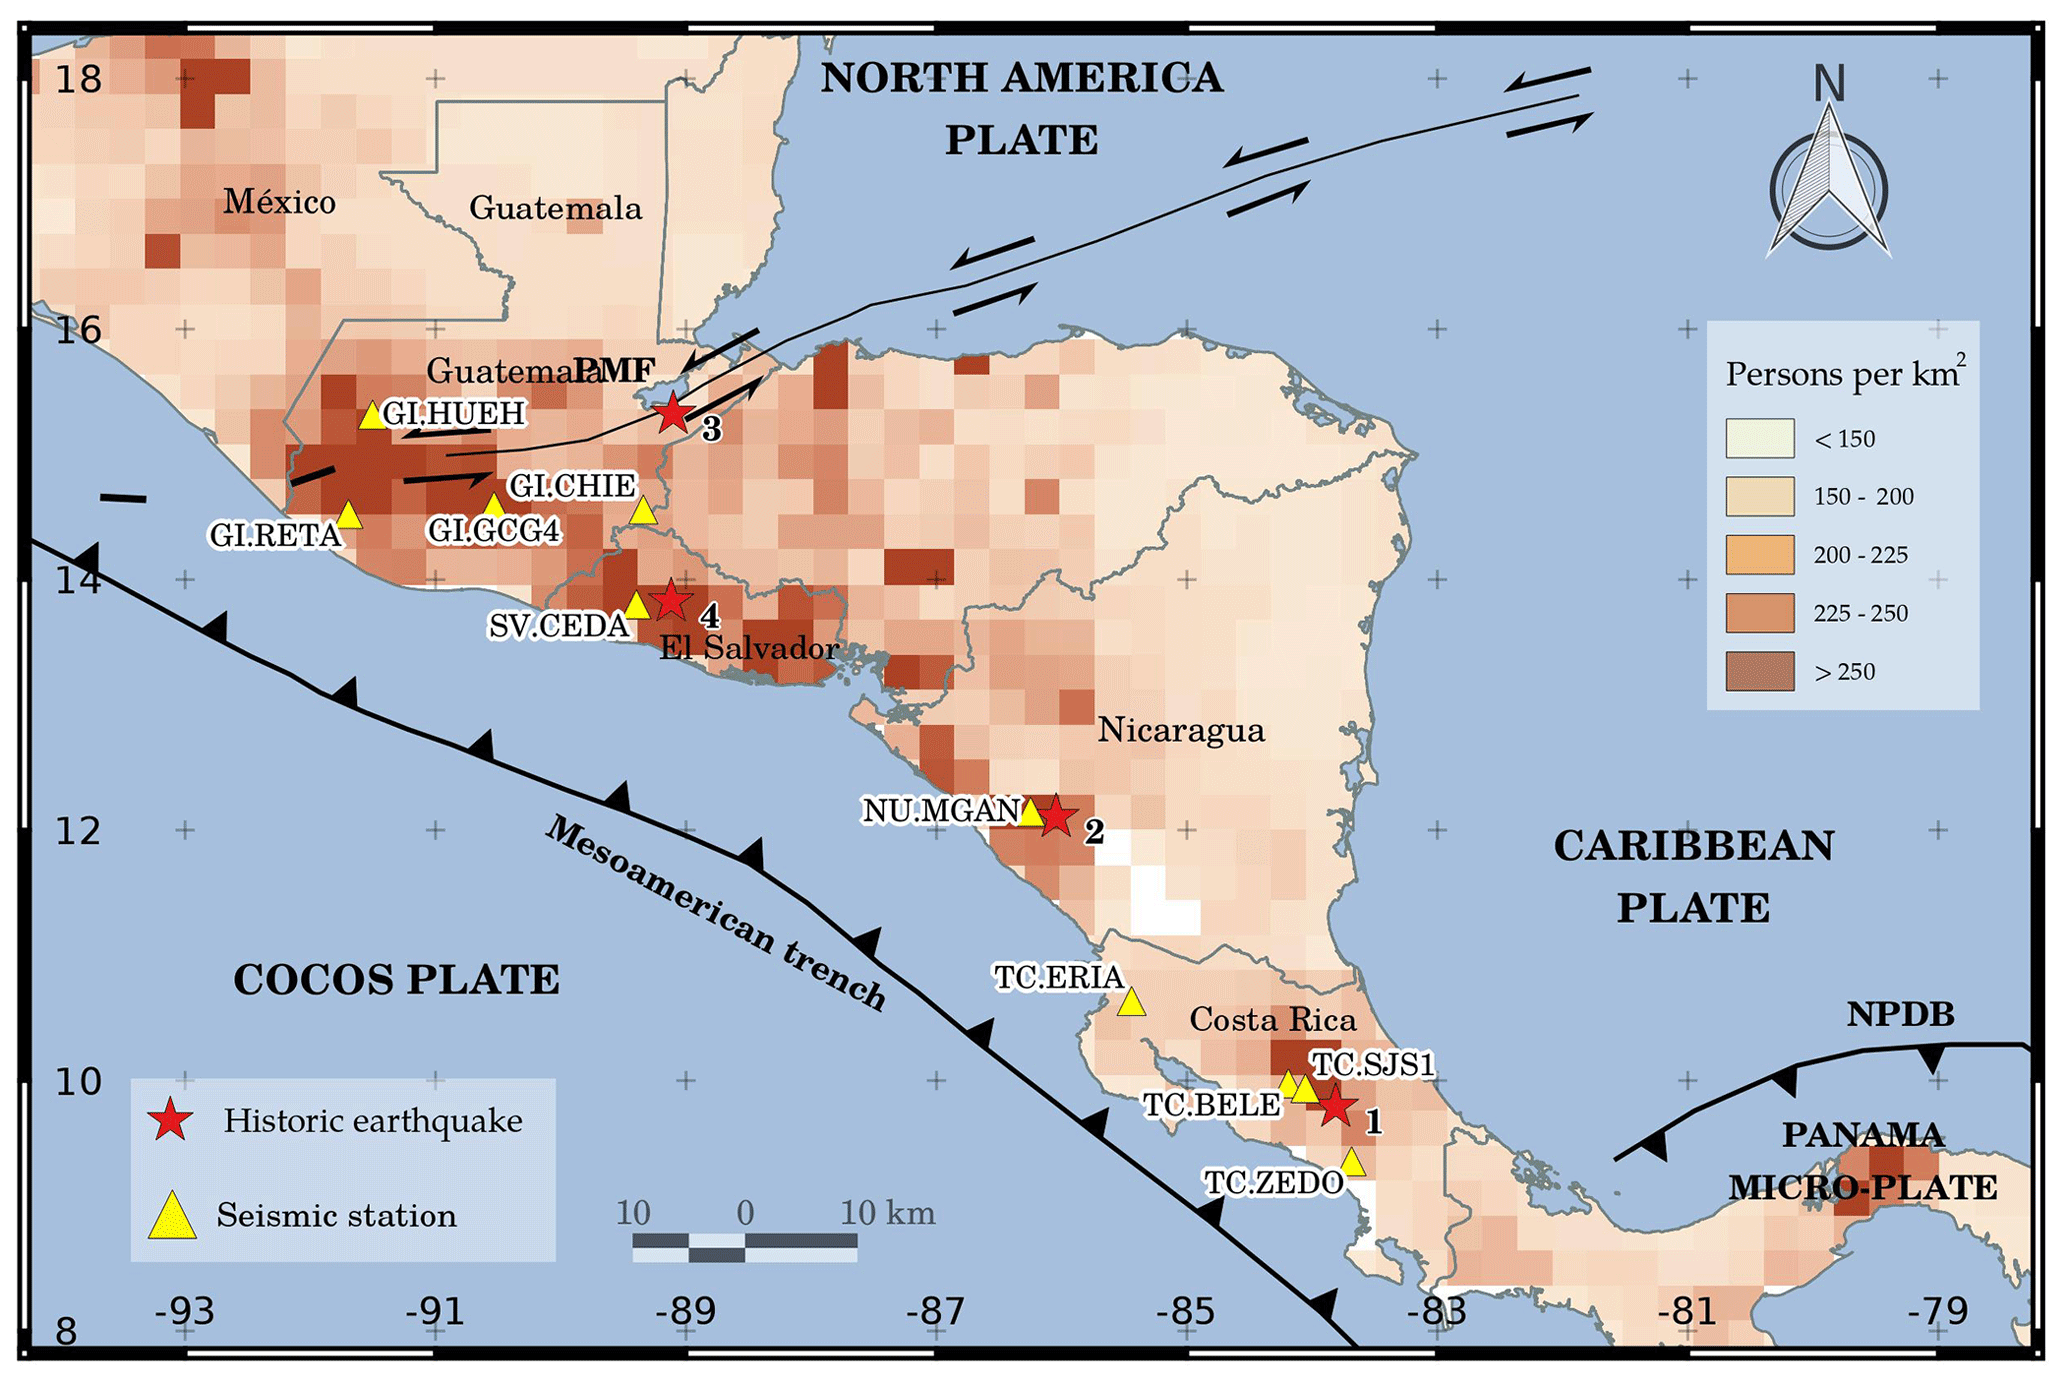
Figure 1Map of Central America and the location of the selected seismic stations from Costa Rica, Guatemala, El Salvador, and Nicaragua that are used in this work. The map shows the approximate location of the North Panama Deformed Belt (NPDB) and the Polochic–Motagua Fault (PMF). Darker red tones indicate areas with higher population density. The numbered stars represent the deadliest historic earthquakes mentioned in the text: (1) 1910 M 6.4 Cartago, Costa Rica; (2) 1972 M 6.3 Managua, Nicaragua; (3) 1976 M 7.5 Guatemala; and (4) 1986 M 7.5 San Salvador, El Salvador. © ESRI and its data partners (ArcGis Services, 2020).
Seismometers in urban settings optimize the spatial coverage of seismic networks in these areas and warn of local geological hazards, for example, the amplification of seismic waves (Ashenden et al., 2011). Some of the main institutions in charge of the permanent monitoring of seismicity in Central America are the National Institute of Seismology, Volcanology, Meteorology and Hydrology (INSIVUMEH, in Guatemala); the National Service for Territorial Studies (SNET, in El Salvador); the Nicaraguan Institute for Territorial Studies (INETER, in Nicaragua); the National Seismological Network of the University of Costa Rica (RSN-UCR, in Costa Rica); and the Volcanological and Seismological Observatory of the National University of Costa Rica (OVSICORI-UNA, in Costa Rica). Belize and Honduras lack an official seismic service, and Panama has several local networks, such as the Chiriqui and the University of Panama (UPA).
As the high root mean square (RMS) levels of the high-frequency seismic anthropogenic noise displacement (HFSAND-RMS) hamper the ability to detect signals from earthquakes and volcanic eruptions, the analysis and delimitation of the HFSAND-RMS is of the utmost importance (Lecoq et al., 2020a). The objective of this work is to present the first study of the HFSAND-RMS during COVID-19 in Central America. We used seismic stations in Central America (Fig. 1) to evaluate the effects of lockdown measures on the seismic record near urban centers of four countries in the region: Costa Rica, Guatemala, El Salvador, and Nicaragua. In addition, specific sites near populated centers and airports in Costa Rica and Guatemala are also analyzed. Finally, we explore the possible impact of the low noise levels on the capability to detect earthquakes and on the number of felt reports during the lockdown.
2.1 Seismic stations and data
We consider data from vertical-component seismometers from 10 seismic stations located in Costa Rica, Guatemala, El Salvador, and Nicaragua. Four of them are operated by the RSN (Costa Rica), four are operated by the INSIVUMEH (Guatemala), one belongs to the Ministry of Environment and Natural Resources (MARN in El Salvador), and one belongs to the INETER (Nicaragua) (Figs. 1 and A1 in the Appendix). Most of these stations have been selected within or near the capitals of each country in order to obtain an overview of the changes in the seismic records induced by the lockdown measures. In Costa Rica and Guatemala, where we had more access to the records, we also selected three stations close to other populated centers or airports.
The selected stations include both broadband seismometers (BB) and short-period geophones (SP). For Costa Rica, we use the TC.SJS1 station (BB, GÜRALP CMG-6TD) located at the main campus of the University of Costa Rica in San José. This station is 3 m below ground level, and the sensor is installed in a concrete pillar. We also inspected the TC.BELE, TC.ERIA, and TC.ZEDO stations (SP, Sixaola instruments manufactured by Raspberry Shake), located in urban areas at fire station buildings at ground level, close to Juan Santamaría International Airport, Liberia, northwestern Costa Rica, and in San Isidro, Pérez Zeledón, southeastern Costa Rica, respectively. For Guatemala, we used the GI.GCG4 station (SP, OSOP Sixaola) located in an urban area, close to the Aurora International Airport. This station is 3 m below ground level, and the sensor is also installed in a concrete pillar. Furthermore, we analyzed GI.HUEH, GI.RETA, and GI.CHIE stations (BB, GÜRALP CMG-3ESP), located in urban areas, close to local airports and the downtown areas of Huehuetenango, Retalhuleu, and Esquipulas, respectively. These stations are at ground level inside a dedicated vault with a concrete pillar.
For El Salvador and Nicaragua, we use the SV.CEDA station (BB, Nanometrics Trillium 120P), located close to the Pan-American Highway in the city of La Libertad, and NU.MGAN station (BB, Streckeisen STS-2), located at INETER in the downtown area of Managua. The continuous seismic data for Costa Rica and Guatemala were obtained directly from the seismological networks of each country (INSIVUMEH, 2013; RSN, 2017) and from IRIS for El Salvador and Nicaragua, via the FDSN (the International Federation of Digital Seismograph Network) web services (INETER, 1975; SNET, 2004). We analyzed data over a time span covering 1 year from 1 November 2019 to 31 October 2020.
2.2 Seismic noise analyses
A spectral and amplitude analysis was carried out to characterize temporal variations in high-frequency (4–14 Hz) seismic signals dominated by the anthropogenic noise using the RMS. We computed the high-frequency seismic noise amplitude prior to and during the pandemic lockdown measures (before 16 March 2020). The results have been compared to the lockdown measures implemented by the governments for each country, as documented in Table A1 in the Appendix (SICA, 2020), and their compliance by the population.
The high-frequency seismic noise amplitudes were computed following the method described by Lecoq et al. (2020a) and using the code provided by Lecoq et al. (2020b). In this technique, the method of Welch (1967) is applied: a power spectral density (PSD) is calculated for each 30 min time window with a 50 % overlap, converted into equivalent displacement, and combined into a single RMS value per time window (Blackman et al., 1958). This reduces the numerical noise in the power spectra at the expense of reducing the frequency resolution due to frequency binning, but this effect is minimized with a conservative smoothing parameterization (Lecoq et al., 2020a). Moreover, to highlight the general temporal pattern of the amplitude of the seismic noise, the displacement RMS time series with four samples per hour were averaged each day between 06:00 and 16:00 LT (local time, UTC−6). Additionally, for some stations in Costa Rica and Guatemala, the median displacement RMS of each hour was computed, for each day, comparing the result before and during the lockdown. Finally, an analysis of the percentage change in the HFSAND-RMS was performed to obtain a median amplitude value for the whole period during the major restrictive measures, from 16 March to 15 May 2020, and to compare it with the median of the period before lockdown measures, from 15 January to 15 March 2020.
2.3 Earthquake detection capability and felt reports
For Costa Rica and Guatemala, the effect of the reduction in the HFSAND-RMS on earthquake detection was explored during the lockdown period, using the seismic catalogs of the RSN (Costa Rica) and the INSIVUMEH (Guatemala). At both observatories, earthquakes are located automatically by SeisComP3 (Gempa, 2019) and manually using SEISAN software (Havskov et al., 2020). With this objective, a period before lockdown from 1 November 2019 to 15 March 2020 (4.5 months) was taken as a reference to compare with a proportional period during the confinement measures, from 16 March to 31 July 2020 (4.5 months).
Using curves of an earthquake magnitude–frequency distribution, we inspected earthquakes with moment magnitude (Mw) ≤ 4.0 before and during lockdown, as small events better reflect the variations in the detection capability. Furthermore, we quantified the average number of seismic phases per earthquake as function of the magnitude, obtaining linear regressions for the two data sets. In addition, to explore the increase in the number of earthquakes detected as a function of magnitude, we calculated the Gutenberg–Richter relationship (Gutenberg and Richter, 1944) before and during the lockdown. To calculate these seismic parameters and their uncertainties, we used the classical maximum likelihood technique of Aki (1965) modified by Weichert (1980). To run this methodology, we used the OpenQuake software (GEM, 2020). The magnitude of completeness (Mc) was estimated using the MAXC method, which corresponds to the maximum point in the noncumulative graph of the Gutenberg–Richter relationship (e.g., Wiemer and Wyss, 2000; Woessner and Wiemer, 2005).
We also investigated the effect of lockdown measures on the number of earthquakes felt by the population. For both Costa Rica and Guatemala, we counted the number of felt earthquakes in different magnitude intervals. In these two countries, the population reports earthquakes via smartphones and social networks. Furthermore, to analyze if there is a correlation between the decrease in the HFSAND-RMS and the increase in low-magnitude felt events as well as between the low-magnitude felt events and the hour of the day, we explored the spatial context of these events with a map of felt seismicity and its occurrence hour, before and during lockdown.
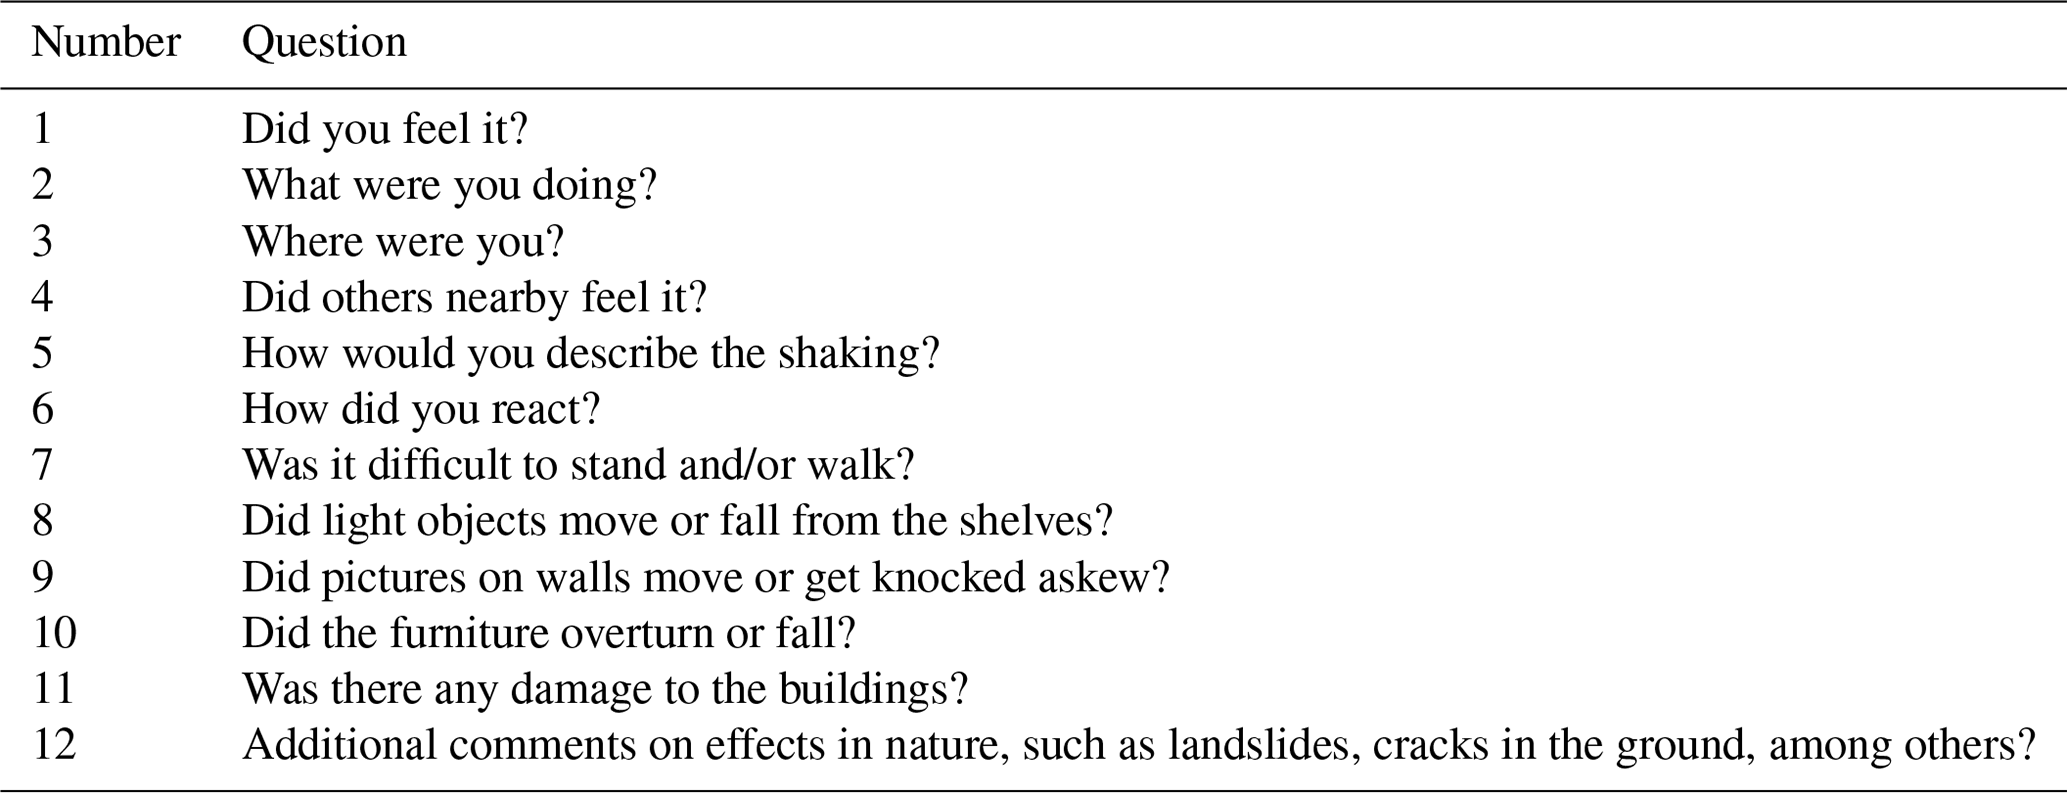
Additionally, the RSN maintains an interactive application for smartphones called “RSN”, which includes the “¿Lo sentiste?” module (Linkimer and Arroyo, 2020), also available on the RSN website. This app was developed by the RSN based on the “Did you feel it?” questionnaire from the United States Geological Service (USGS) (Atkinson and Wald, 2007; Wald et al., 2011), which was translated into Spanish and simplified and adapted to Costa Rica. The users access the app, answer 12 simple questions (Table A2), and obtain a quick estimation of the intensity determined by the community decimal intensity (CDI), which is an aggregate of the average sums of the indexes associated with the questions (Dengler and Dewey, 1998). All the reports are shown in an emoticon map that updates continuously and can be accessed in real time in the app or on the RSN website. Finally, after enough ( 300) reports and outliers have been manually removed, an average intensity map is generated (Linkimer and Arroyo, 2020). We use this tool to complement the felt earthquakes analysis in Costa Rica, collecting the number of felt earthquakes reported through this app, before and during lockdown, including only the events with at least three reports and with Mw<5.0. These events were also averaged by magnitude intervals.
3.1 Seismic noise and lockdown measures
The stronger lockdown measures in Central America started on 16 March. In Costa Rica, some of the main restrictions implemented by the governments were the closure of borders, schools, nonessential stores, and beaches as well as the prohibition of massive public events (e.g., concerts and soccer games) and home-office implementation. Although no curfew was imposed on citizens in Costa Rica, a strict vehicle mobility restriction has been maintained throughout the pandemic. For Guatemala and El Salvador, the lockdown measures were very similar to those implemented in Costa Rica; however, in some cases, the former included restrictions on the mobility of citizens and curfews. These measures have been softened or hardened as the pandemic has evolved in each of these countries (Table A1). Very few lockdown measures were taken in Nicaragua to prevent the spread of COVID-19, and no specific measures were applied to restrict social mobility.
An important decrease in the HFSAND-RMS is shown in seismic stations located near the capitals of Costa Rica (University of Costa Rica campus, San José), Guatemala (close to the Aurora International Airport, Guatemala City), and El Salvador (close to the Pan-American Highway) (Fig. A1). This has been observed during the lockdown measures (Table A1; Figs. 2, 3), except for Nicaragua (urban area, at INETER, Managua).
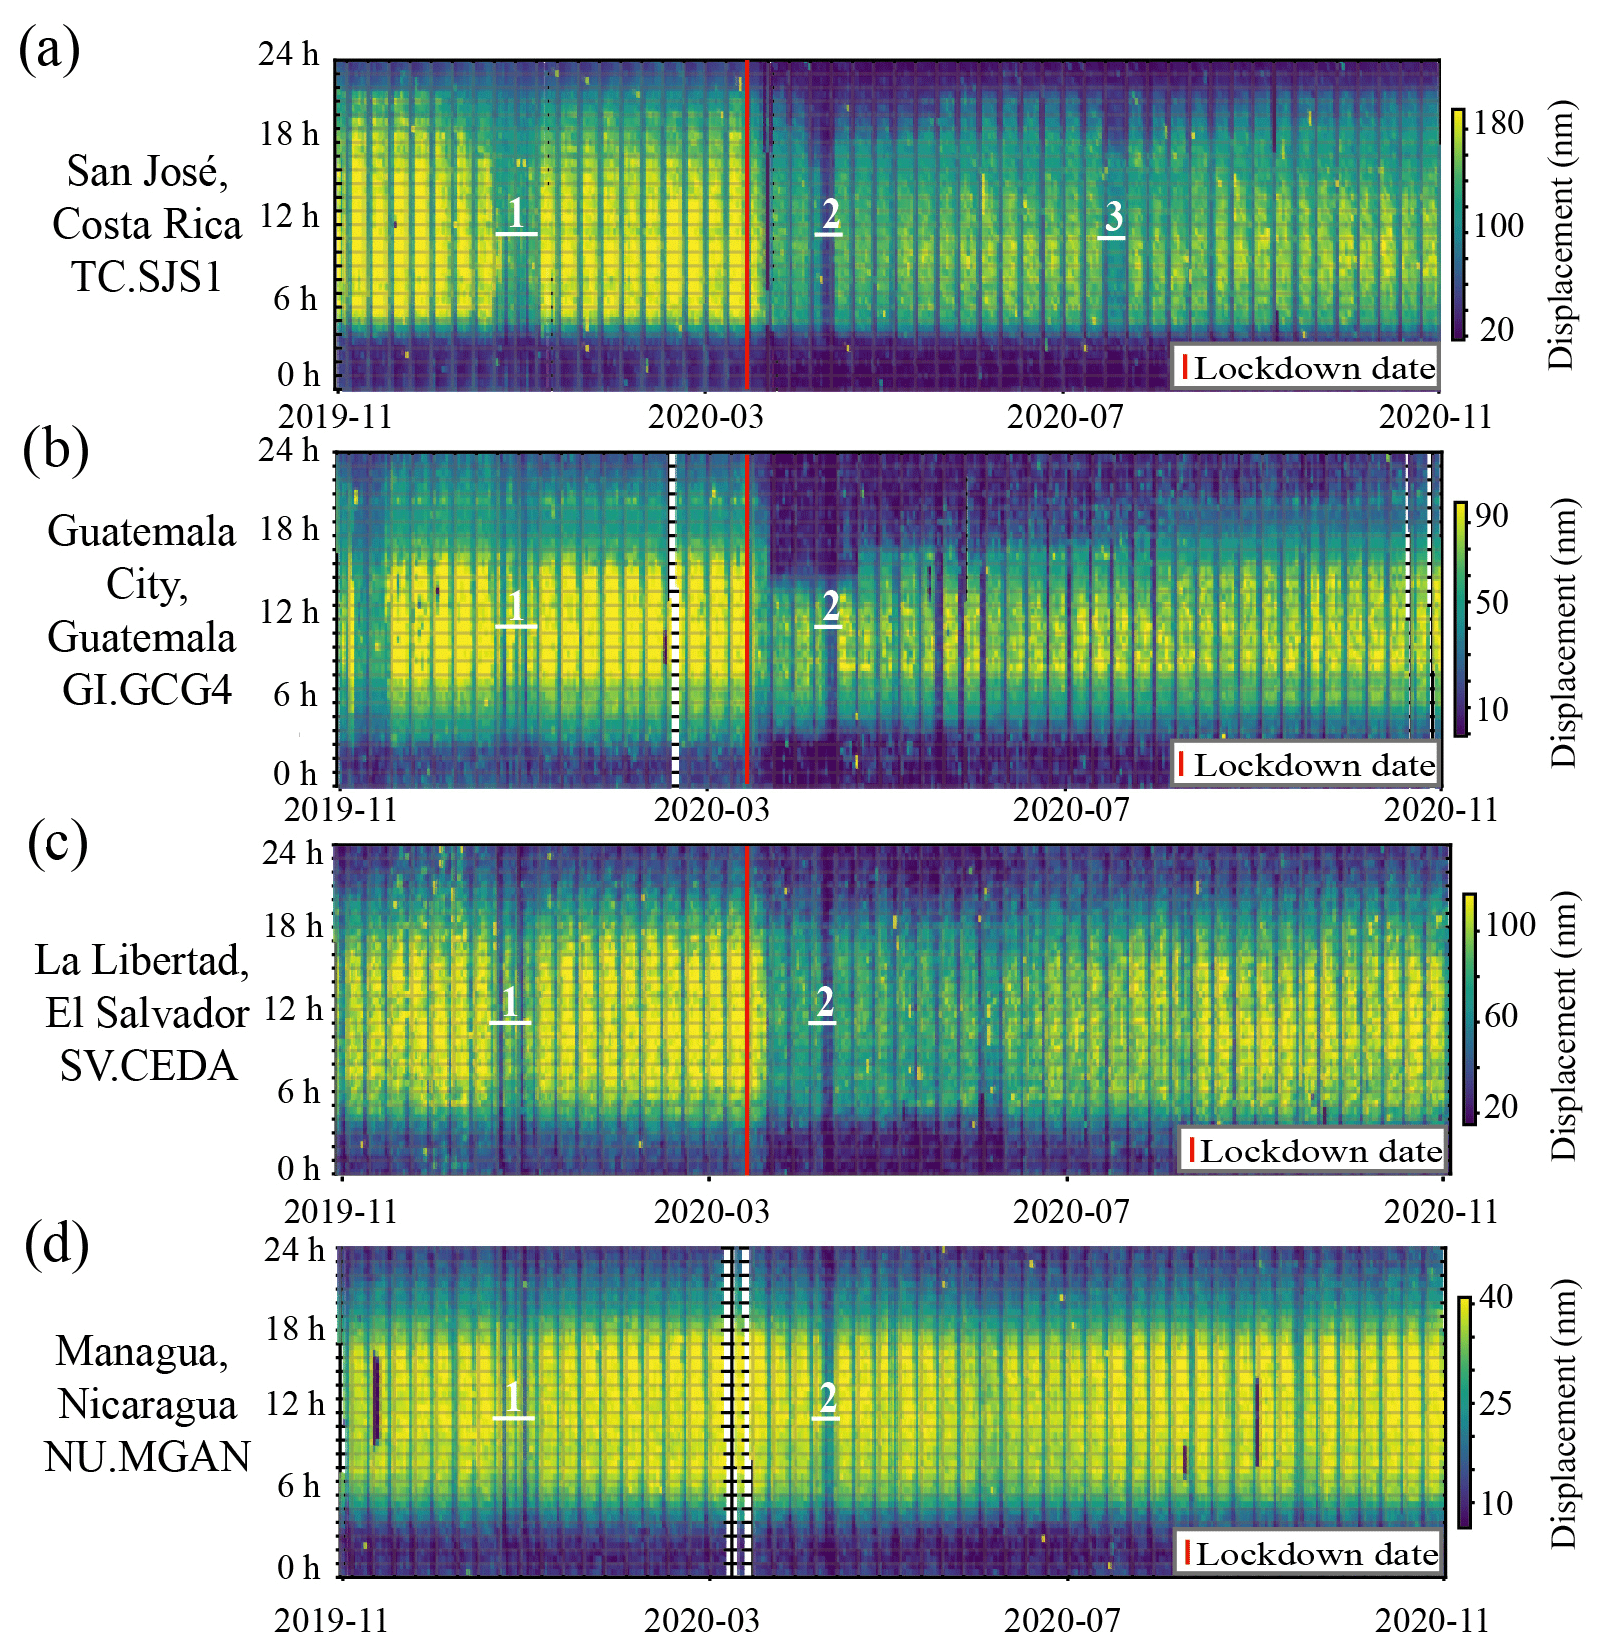
Figure 2High-frequency seismic anthropogenic noise displacement (HFSAND-RMS) evolution near the capitals of the countries studied, shown using an hourly grid representation: (a) TC.SJS1 station in San José, Costa Rica; (b) GI.GCG4 station in Guatemala City, Guatemala; (c) SV.CEDA station, near San Salvador in the city of La Libertad; and (d) NU.MGAN station in Managua, Nicaragua. Gaps correspond to periods for which seismic data were unavailable, and the vertical red lines indicate the time when the first lockdown measures started in Central America. The numbers 1, 2, and 3 show the New Year holidays of 2019, Easter of 2020, and a brief period in July 2020 when a strict return of lockdown measures was implemented in Costa Rica, respectively.
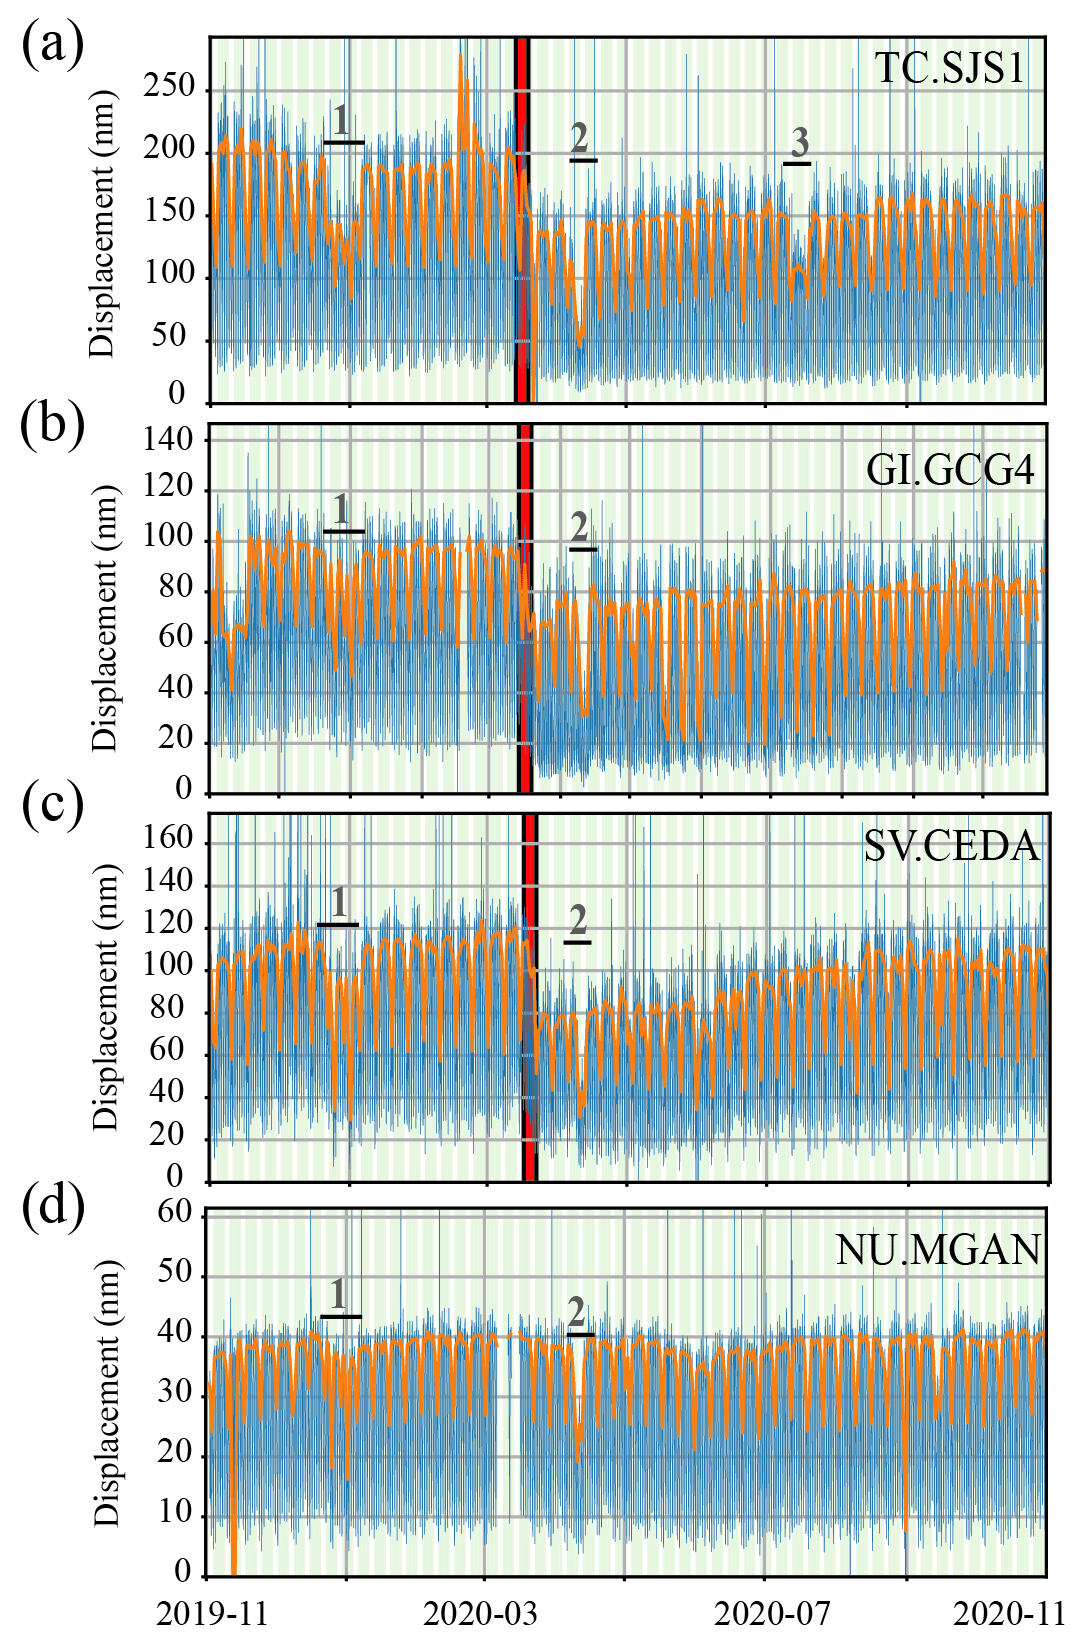
Figure 3High-frequency seismic anthropogenic noise displacement (HFSAND-RMS) evolution at the seismic stations near the capitals of the countries studied: (a) TC.SJS1 station in San José, Costa Rica; (b) GI.GCG4 station in Guatemala City, Guatemala; (c) SV.CEDA station, near San Salvador in the city of La Libertad; and (d) NU.MGAN station in Managua, Nicaragua. The blue line corresponds to the RMS amplitude time series of the vertical component, filtered between 4 and 14 Hz, and the orange line corresponds to median daytime, between 06:00 and 16:00 LT (local time). Gaps correspond to periods for which seismic data were unavailable, and the vertical red lines indicate the time when the first lockdown measures started in Central America. The numbers 1, 2, and 3, show the New Year holidays of 2019, Easter of 2020, and a brief period in July 2020 when a strict return of lockdown measures was implemented in Costa Rica, respectively.
Figure 2 shows the time of day on the vertical axis, the period analyzed on the horizontal axis, and the high-frequency displacement RMS using colors: blue for the lowest level and yellow for the maximum. The graph clearly shows the stillness of the night (blue colors between 22:00 and 05:00 LT), the relative quiet of weekends (vertical blue bars that alternate periodically), and the hustle and bustle from day to day (yellow colors). Figure 3 shows the displacement on the vertical axis and time on the horizontal axis. The orange line represents the median recorded displacement, which usually has its maximum during daytime, when more seismic noise is present, and its minimum during the night. In addition, Fig. 3 also show that the noise level is lower on the weekends. In these figures, we marked the beginning of the social distancing measures on 16 March (red line), the period of the end of the year holidays 2019 (1), Easter 2020 (2), and a brief period in July 2020 when there was a strict return of lockdown measures in Costa Rica (3) (Table A1).
In both types of graphs (Figs. 2, 3), for the stations in Costa Rica, Guatemala, and El Salvador, the effect of the social distancing measures can be clearly seen beginning on 16 March, as a notable drop in seismic noise (displacement). At the station in Managua, Nicaragua, where no important measures were adopted to limit urban mobility and economic activities, there is no change in the seismic record (Figs. 2d, 3d). In Costa Rica, Guatemala, and El Salvador, the seismological stations show that the measures of social distancing produced a decrease in the seismic noise levels similar to those observed in the 2019 New Year holidays.
For the TC.SJS1 station in San José, Costa Rica (Figs. 2a, 3a), the displacement during a typical working day before the lockdown used to be up to 200 nm, whereas during the social distancing measures, these values decreased to 140 nm on average. In the case of the GI.GCG4 station in Guatemala City (Figs. 2b, 3b), the usual displacement before the lockdown was 100 nm on average, and during social distancing measures, these values decreased to 80 nm on average. At the SV.CEDA station, near San Salvador (Figs. 2c, 3c), the usual displacement before the lockdown was on average about 120 nm, whereas these values decreased to 80 nm on average during the lockdown.
The lower displacement values tended to return to their usual average values as the restrictive measures were progressively eliminated. Even so, the values had not yet returned to their usual pre-pandemic levels by November 2020, when the average values were ∼ 160 nm for San José, ∼ 85 nm for Guatemala City, and ∼ 110 nm near San Salvador. This shows that some of the social distancing measures were still in place during November 2020 (Table A1) or that other factors were affecting the station environment (permanent or long-term activity loss, e.g., company shutdown) (Figs. 2, 3). However, the levels were closer to their usual averages at La Libertad near San Salvador. The most drastic effect of the limitation on the mobility of inhabitants was observed during Easter in April of 2020: values observed for this period were ∼ 60 nm in San José and ∼ 50 nm in Guatemala City and near San Salvador.
In the case of the NU.MGAN station in Managua, Nicaragua (Figs. 2d, 3d), the registered displacement values have remained constant before and during the pandemic, without any variation with respect to the usual displacement records of this station (40 nm). It is a low-noise site compared with the other capitals because it has particular conditions that favor its isolation from environmental noise.
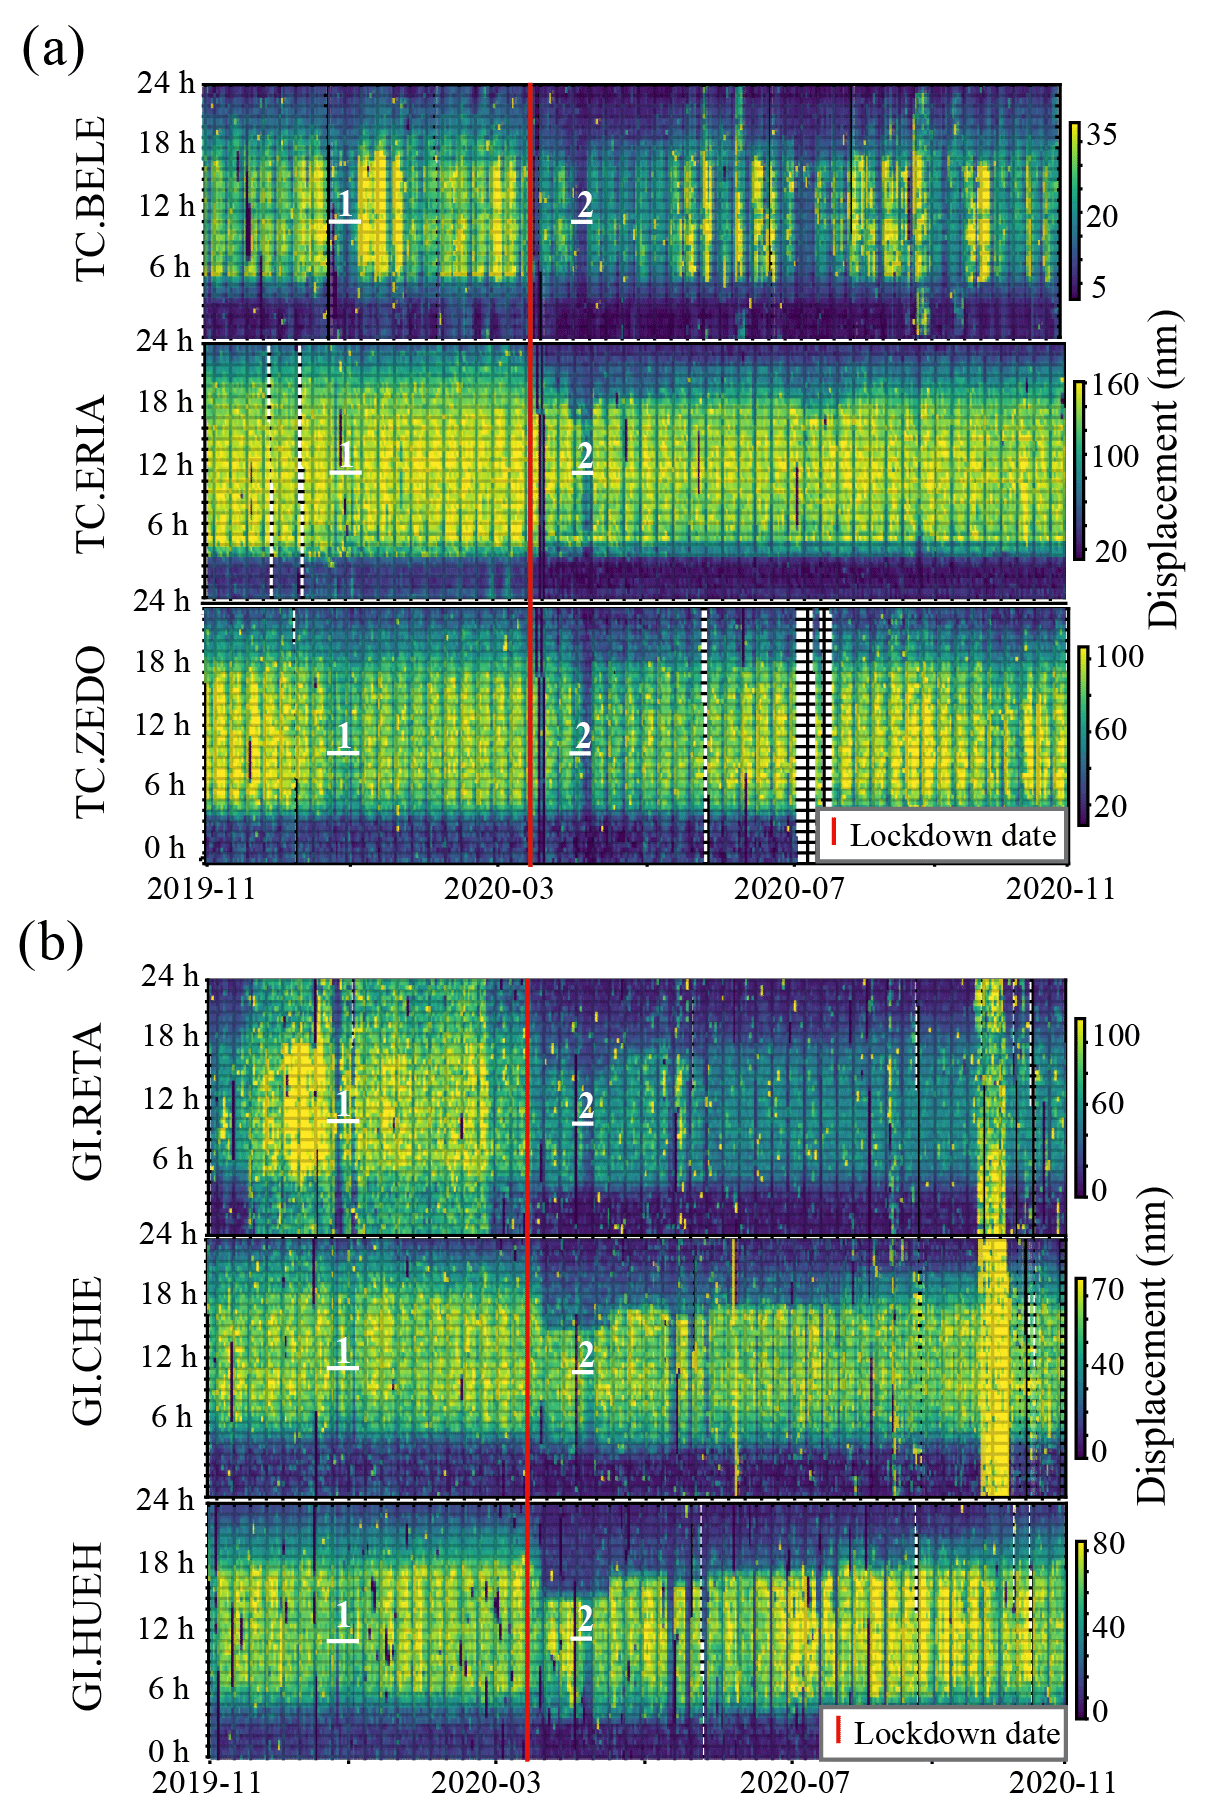
Figure 4High-frequency seismic anthropogenic noise displacement (HFSAND-RMS) evolution for specific sites in Costa Rica and Guatemala, shown using an hourly grid representation: (a) TC.BELE (central Costa Rica, near Juan Santamaría International Airport), TC.ERIA (northern Costa Rica, urban area), and TC.ZEDO (southern Costa Rica, urban area); (b) GI.HUEH (northwest of Guatemala, urban area), GI.RETA (southwest of Guatemala, urban area), and GI.CHIE (east of Guatemala, urban area). The gaps correspond to the time periods for which seismic data were unavailable, and the vertical red lines indicate the time when the first lockdown measures started in Central America. The numbers 1 and 2 show the New Year holidays of 2019 and Easter of 2020, respectively.
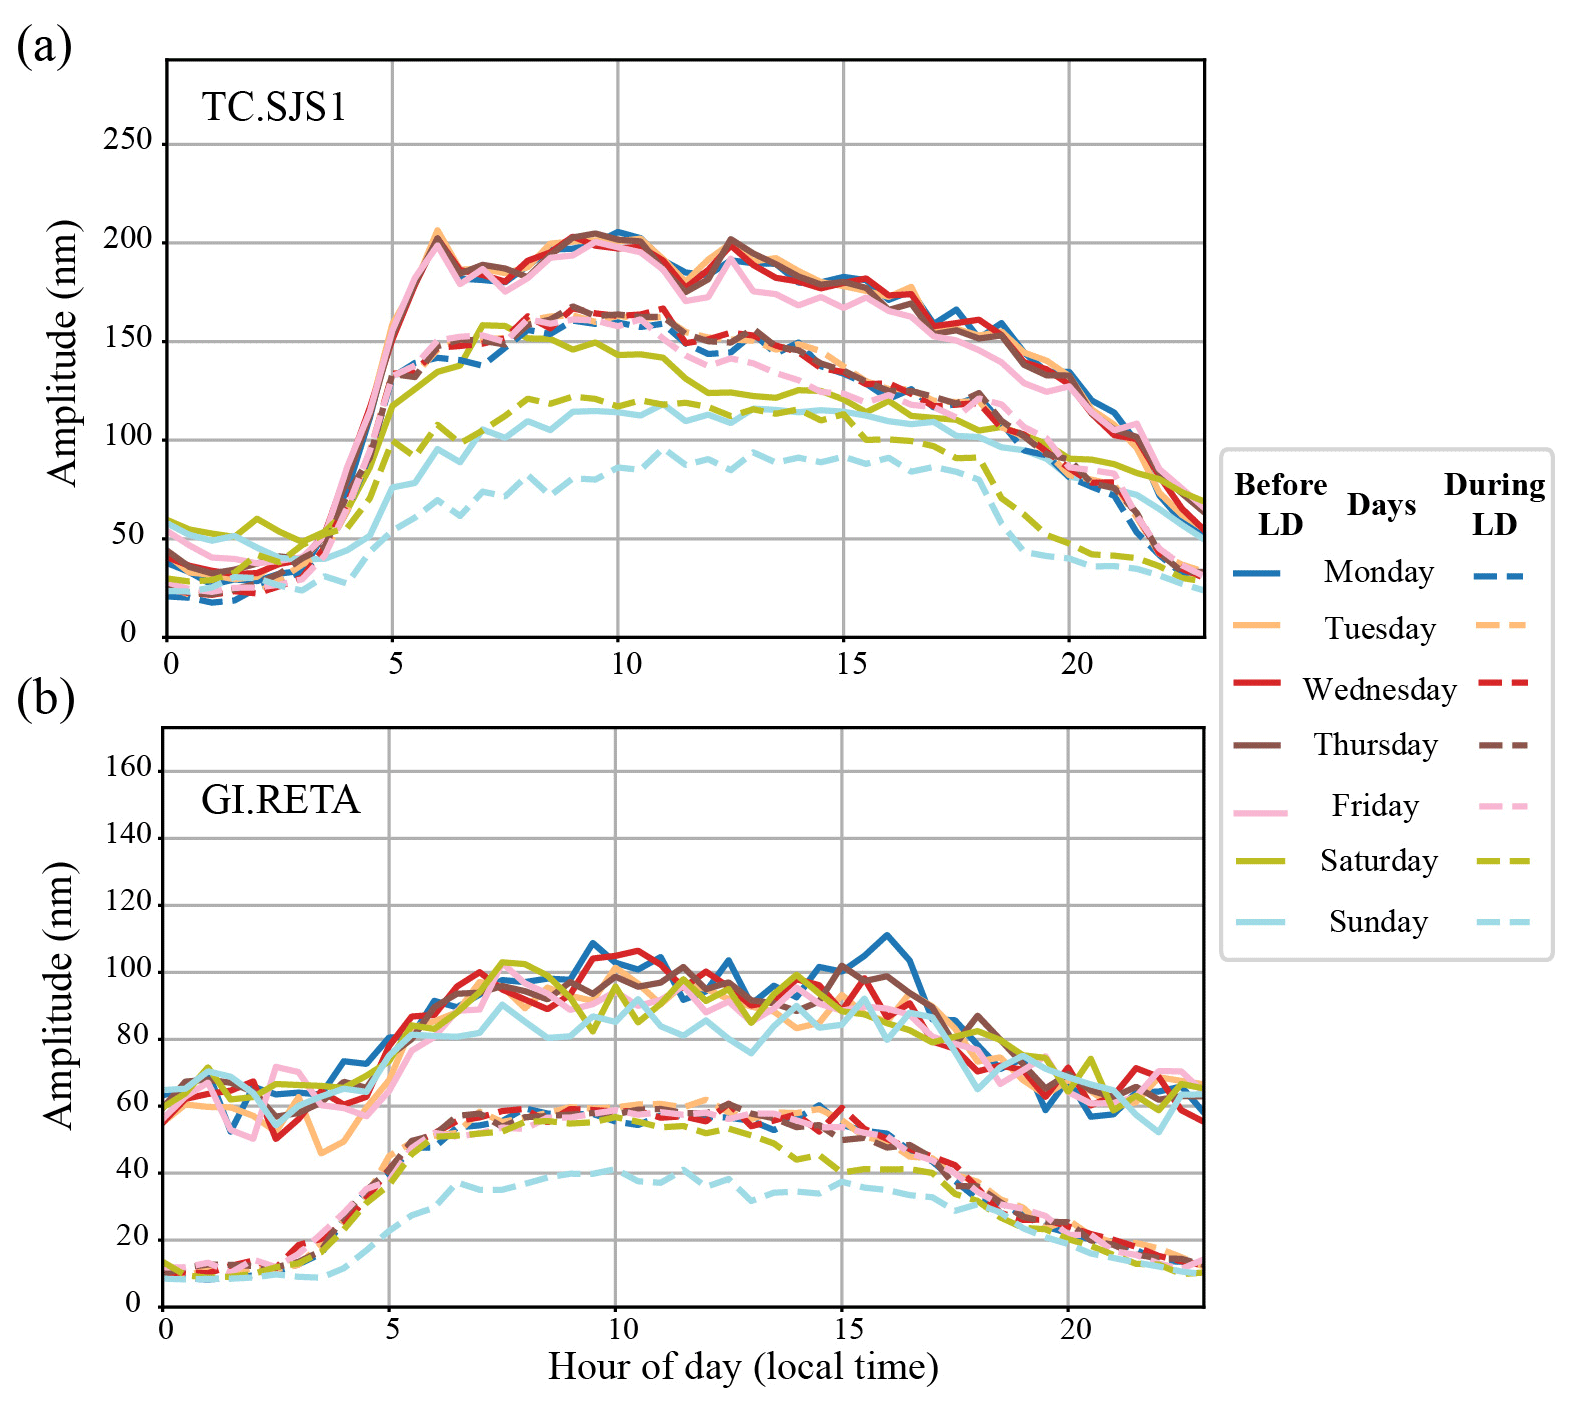
Figure 5Daily variation in the median seismic noise for each weekday before and during the lockdown (LD): (a) TC.SJS1 station in San José, Costa Rica; (b) GI.RETA station in Retalhuleu, southwest of Guatemala.
Results for the Costa Rican stations of TC.BELE, TC.ERIA, and TC.ZEDO are presented in Fig. 4a, and results for the Guatemalan stations of GI.HUEH, GI.RETA, and GI.CHIE are shown in Fig. 4b. All of these stations also show a decrease in displacement RMS since the application of lockdown measures. However, this reduction, as well as the pattern of the displacement RMS time series, is very specific to each station. For Costa Rica (Fig. 4a), the largest percentage difference in the station record is found in the TC.BELE station, located near (∼ 3 km) the country's main airport and in the “Greater Metropolitan Area” (GAM) (Fig. 1). This station varied from ∼ 40 nm before lockdown to ∼ 20 nm during the lockdown measures. For Guatemala (Fig. 4b), similar behavior was observed at the GI.RETA station, towards the western part of the country, which is one of the most touristic regions. This station varied from ∼ 100 nm before lockdown to ∼ 50 nm during the lockdown measures.
In addition, the daily variation in the average seismic noise per weekday before and during the pandemic was inspected for the TC.SJS1 station in Costa Rica (Fig. 5a) and for the GI.RETA station in Guatemala (Fig. 5b). At both stations, the typical pattern of the HFSAND-RMS is also shown, with minimums on weekends and at night, and maximums during the week and at daytime (Fig. 5). This is also highlighted during the lockdown due to the measures adopted by each country (Table A1). Costa Rica, despite not imposing a curfew, established vehicular restrictions from 19:00 to 05:00 LT at its most strict stage. This is highlighted at the TC.SJS1 station, which shows a great decrease in the HFSAND-RMS during these hours (Fig. 5a). For Guatemala, the GI.RETA station clearly shows the effect of the curfew (imposed from 17:00 to 05:00 LT) in its most restrictive stage (Fig. 5b).
The percentage HFSAND-RMS decrease was determined for the 10 stations analyzed here, in the same frequency band (4–14 Hz). Figure 6a shows the change obtained for the stations in Guatemala and El Salvador, and Fig. 6b shows the percentage obtained for the stations in Nicaragua and Costa Rica. Four categories of seismic noise reduction were identified: very high (36 %–49 %), high (26 %–35 %), intermediate (16 %–25 %), and low (6 %–15 %). The most outstanding seismic noise reduction (very high) due to the lockdown measures was obtained at the GI.RETA and TC.BELE stations. These values are explained by the site characteristics described above: strong sources of noise at stations close to major cities, highways, and high-traffic airports. The stations that showed a high decrease were GI.GCG4, SV.CEDA, and TC.SJS1. These changes are closely related to the locations of these sites with respect to the populated capital cities of San José and Guatemala City and to the Pan-American Highway near San Salvador (Fig. 1). Intermediate decrease values were identified at the GI.HUEH, GI.CHIE, and TC.ERIA stations. In this case, these values are associated with cities with a lower population density (Fig. 1) but significant activity and proximity to touristic airports, such as Liberia, in northwestern Costa Rica. Finally, low changes were identified at the NU.MGAN and TC.ZEDO stations. In Managua, this is due to the lack of social distancing measures. In the case of Pérez Zeledón (Costa Rica), it could be related to a lower population density, a station site building that is more isolated from population and environment dynamics, or the lack of compliance with lockdown measures.
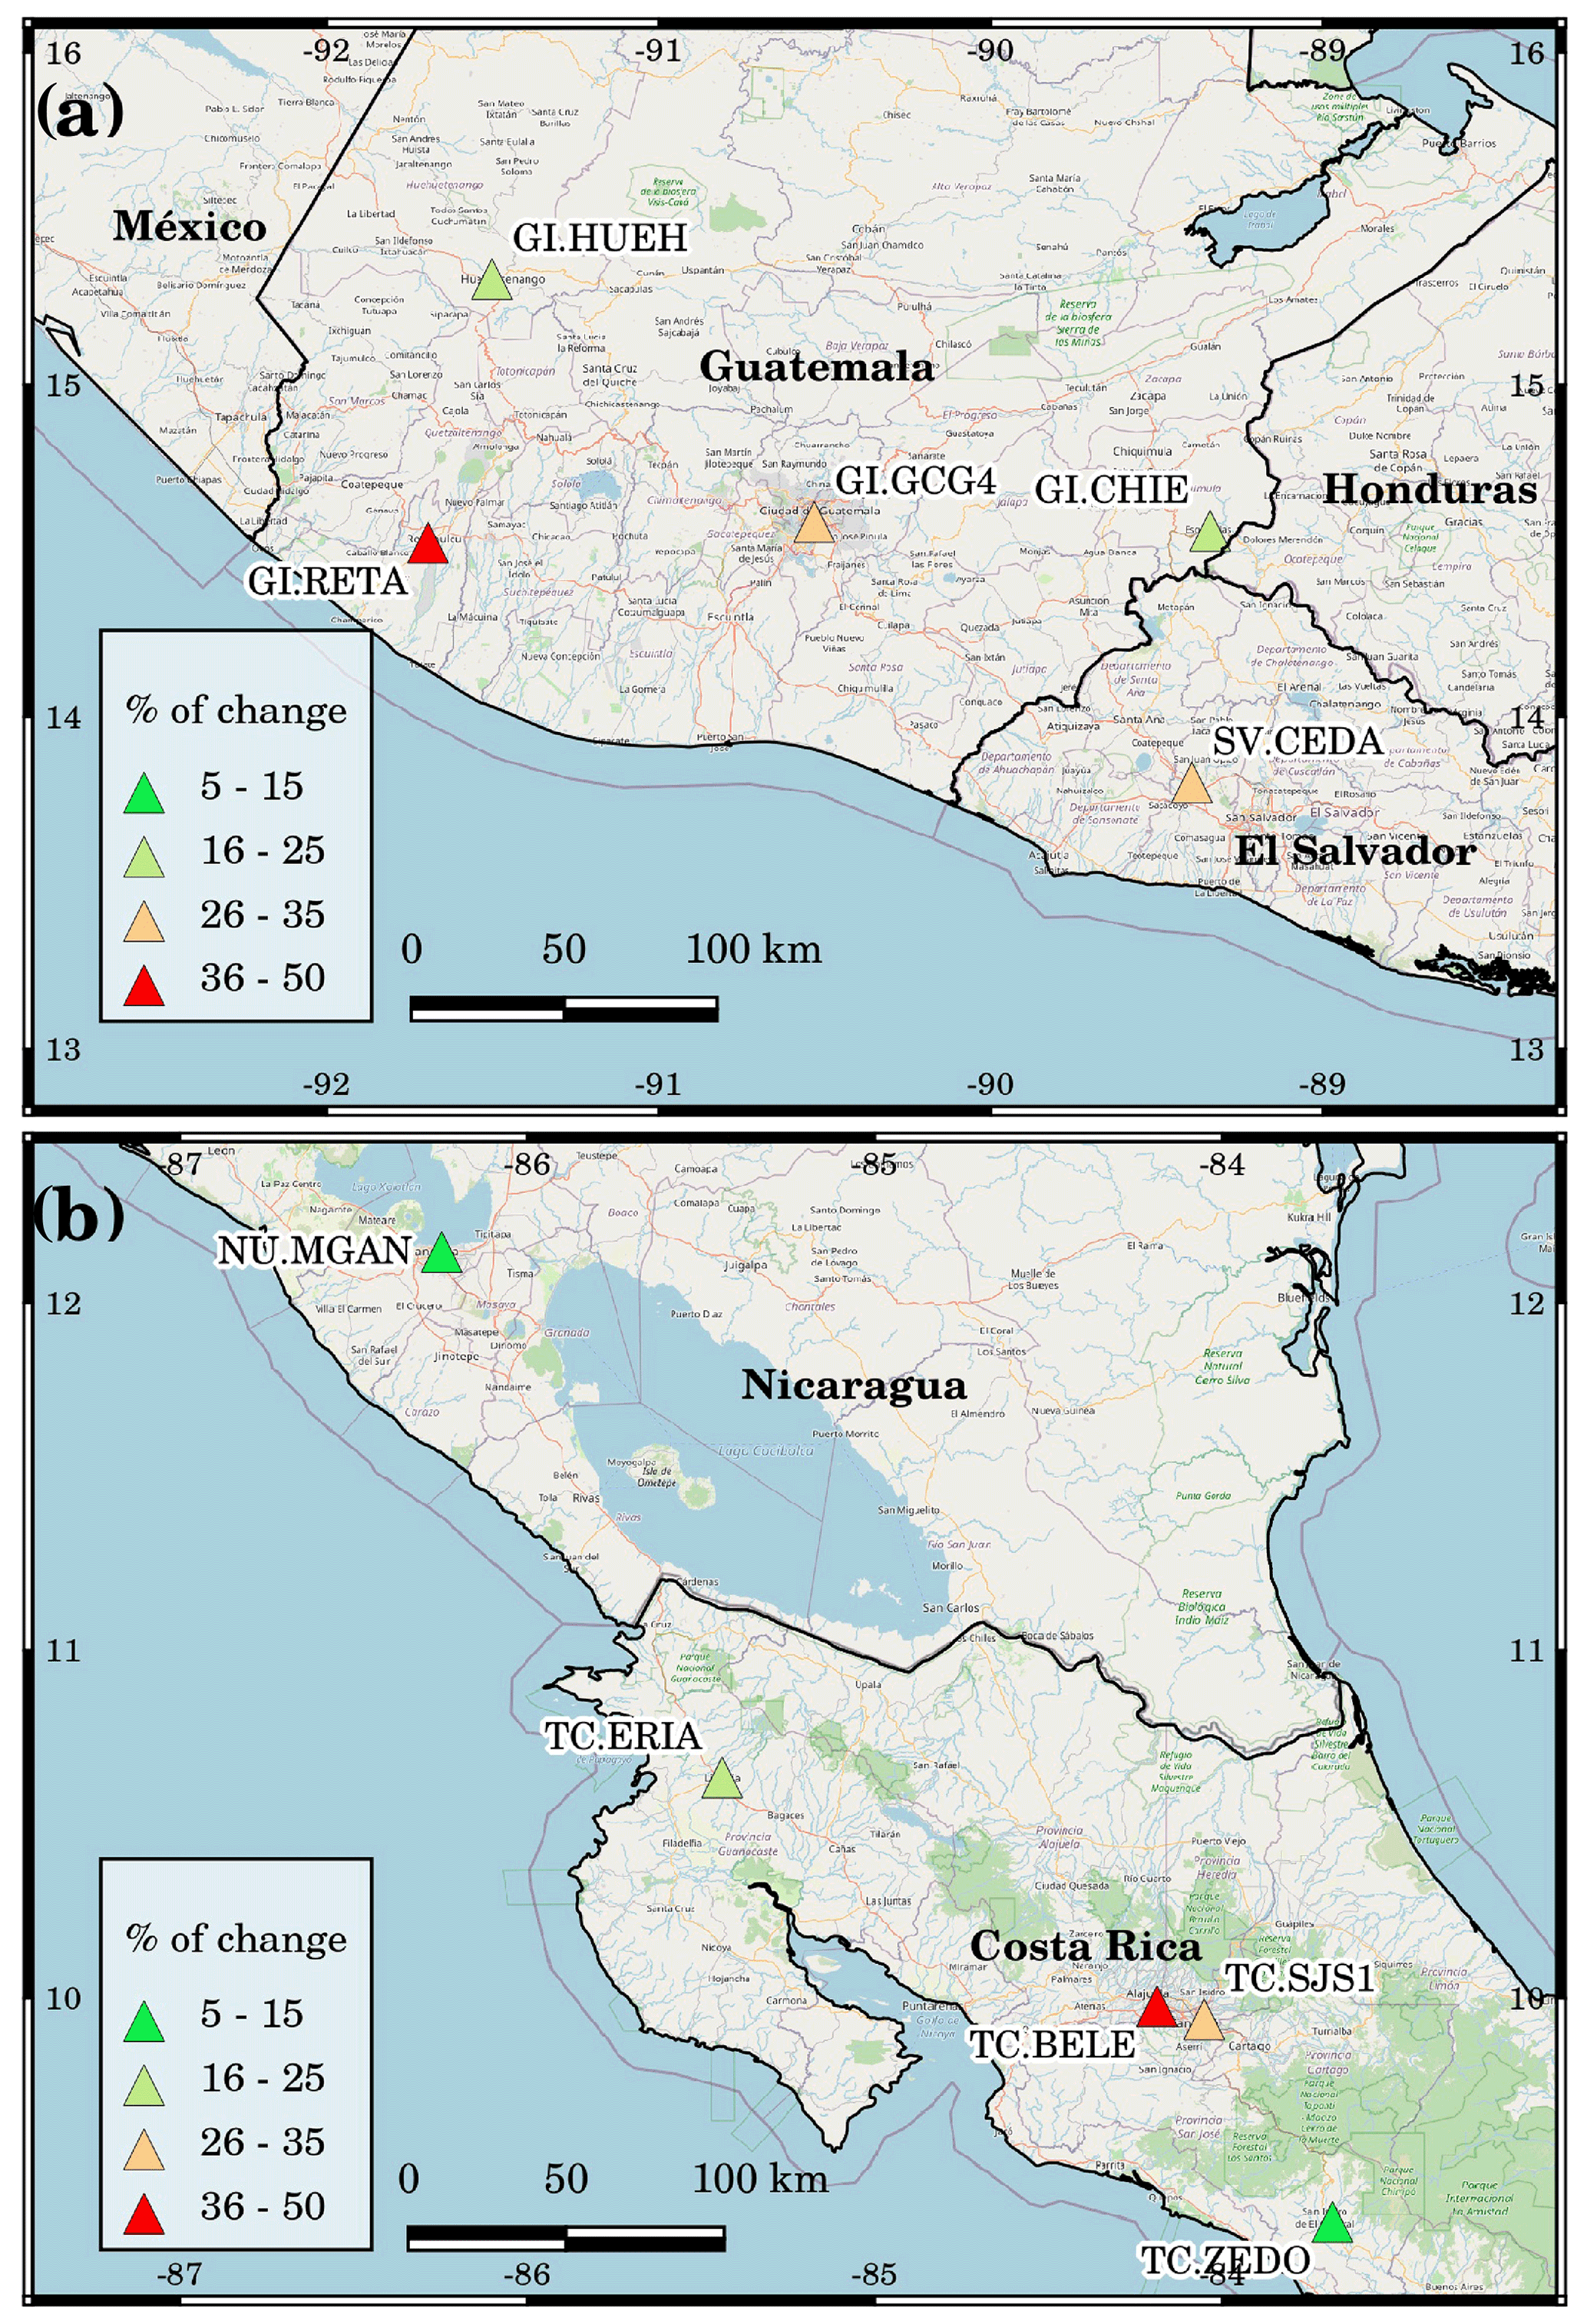
Figure 6Percent change in the high-frequency seismic anthropogenic noise displacement (HFSAND-RMS) in the 4–14 Hz band during the period from 15 January to 15 March 2020 (before lockdown measures) with respect to the time interval from 16 March to 15 May 2020 (after the lockdown measures were applied). (a) Percent change in the seismic stations of Guatemala and El Salvador. (b) Percent change in the seismic stations of Nicaragua and Costa Rica. © OpenStreetMap contributors 2020. Distributed under the Open Data Commons Open Database License (ODbL) v1.0.
3.2 Possible effects of the lockdown in earthquake detection and felt reports
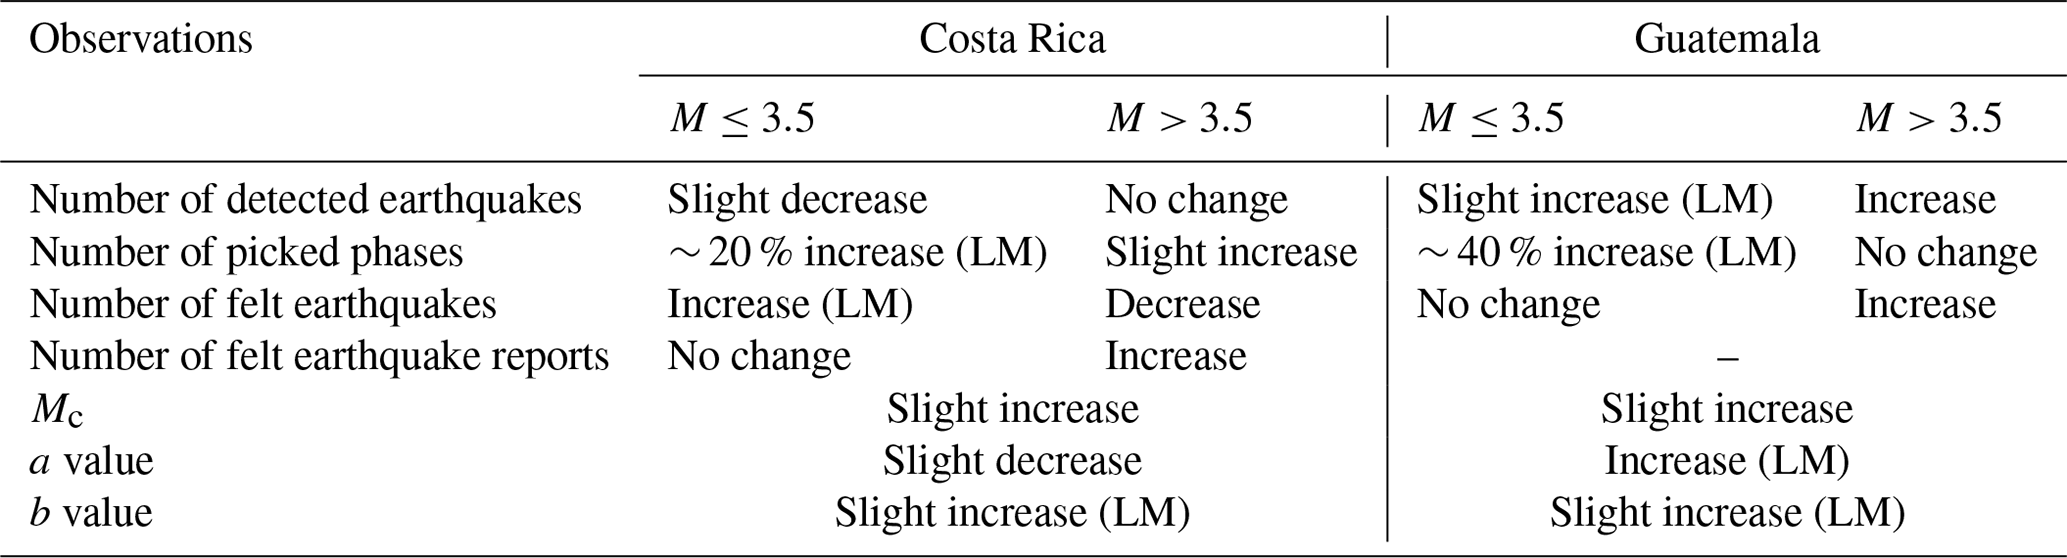
There were no significant earthquakes in Costa Rica and Guatemala during the time this study was conducted. Before lockdown, the biggest earthquakes in Costa Rica had a Mw of 5.6 on 21 January 2020, and the biggest earthquakes in Guatemala had a Mw of 6.2 on 19 November 2019. During lockdown, the largest events were a Mw 5.5 earthquake on 15 April 2020 in Costa Rica and a Mw 5.7 on 26 March 2020 in Guatemala. All of these events were offshore earthquakes related to the interplate seismogenic zone. We conclude that the seismic rates during the time periods considered in this work were not affected by any specific large event. In Table 1, we summarize the main observations when comparing the earthquake detections and felt reports from the time before and the time during the lockdown for Costa Rica and Guatemala.
Table 1Summary of observations when comparing the earthquake detections and felt reports from the time before the lockdown (BL) and the time during lockdown (DL) for Costa Rica and Guatemala (see also Figs. 7, 8, 9, 10, and A2). The observations that favor an increase in lower-magnitude earthquakes (LM) are marked.
3.2.1 Costa Rica
Since 2018, the RSN network consists of around 160 sites, qualifying as a robust network with a high capacity for detecting low-magnitude earthquakes (Linkimer et al., 2018). Figure 7 shows the comparison of the number of seismic events recorded by the RSN and the reports of earthquakes felt before and during the lockdown measures.

Figure 7Event detection and felt earthquakes reported in Costa Rica before (1 November 2019–15 March 2020) and during (16 March–31 July 2020) lockdown (LD) measures. (a) The number of detected earthquakes. (b) Earthquake magnitude versus the average number of P-wave picks per Mw for the events with Mw<4.0, and the corresponding linear fits. The inset graph shows the average difference in the number of picks for magnitude bins for the time periods before (BL) and during (DL) the lockdown. (c) Number of felt earthquakes in Costa Rica. (d) Magnitude versus the number of reports from the population through the RSN application for smartphones “¿Lo sentiste?” for events with Mw<5.0, and the corresponding linear fits.
Figure 7a shows the number of earthquakes on the vertical axis, and the range of magnitude on the horizontal axis, grouped in intervals of 0.5, from Mw 2.0 to 5.5. The graph shows that there is no increase in the capacity to detect earthquakes during the lockdown measures, and it even seems that more seismicity was detected in the period before lockdown, possibly due to higher seismic productivity in that period. The Mc shows that the impact of the lockdown measures on the detected earthquakes is not significant, as Mc varies from 2.9 before to 3.0 during lockdown (Fig. 8a, b). Moreover, the a and b values obtained were very consistent and similar to recent studies for Costa Rica (i.e., Arroyo-Solórzano and Linkimer, 2021). The a value decreased slightly during the lockdown from 3.62 to 3.56 (Fig. 8a, b), showing a general decrease in the seismic rate. On the other hand, the increase in the b value from 0.76 to 0.77 (Fig. 8a, b) could be explained as an increment in the number of low-magnitude earthquakes compared with the number of higher-magnitude events. This b value could support the idea that more low-magnitude earthquakes were detected during the lockdown period (Table 1). However, as can be seen, the variations are too small to allow for such a strong conclusion; therefore, this requires extra seismic noise analyses or specific site noise characterization. The observed variations could also be explained by other contributing factors or could even be random coincidence.
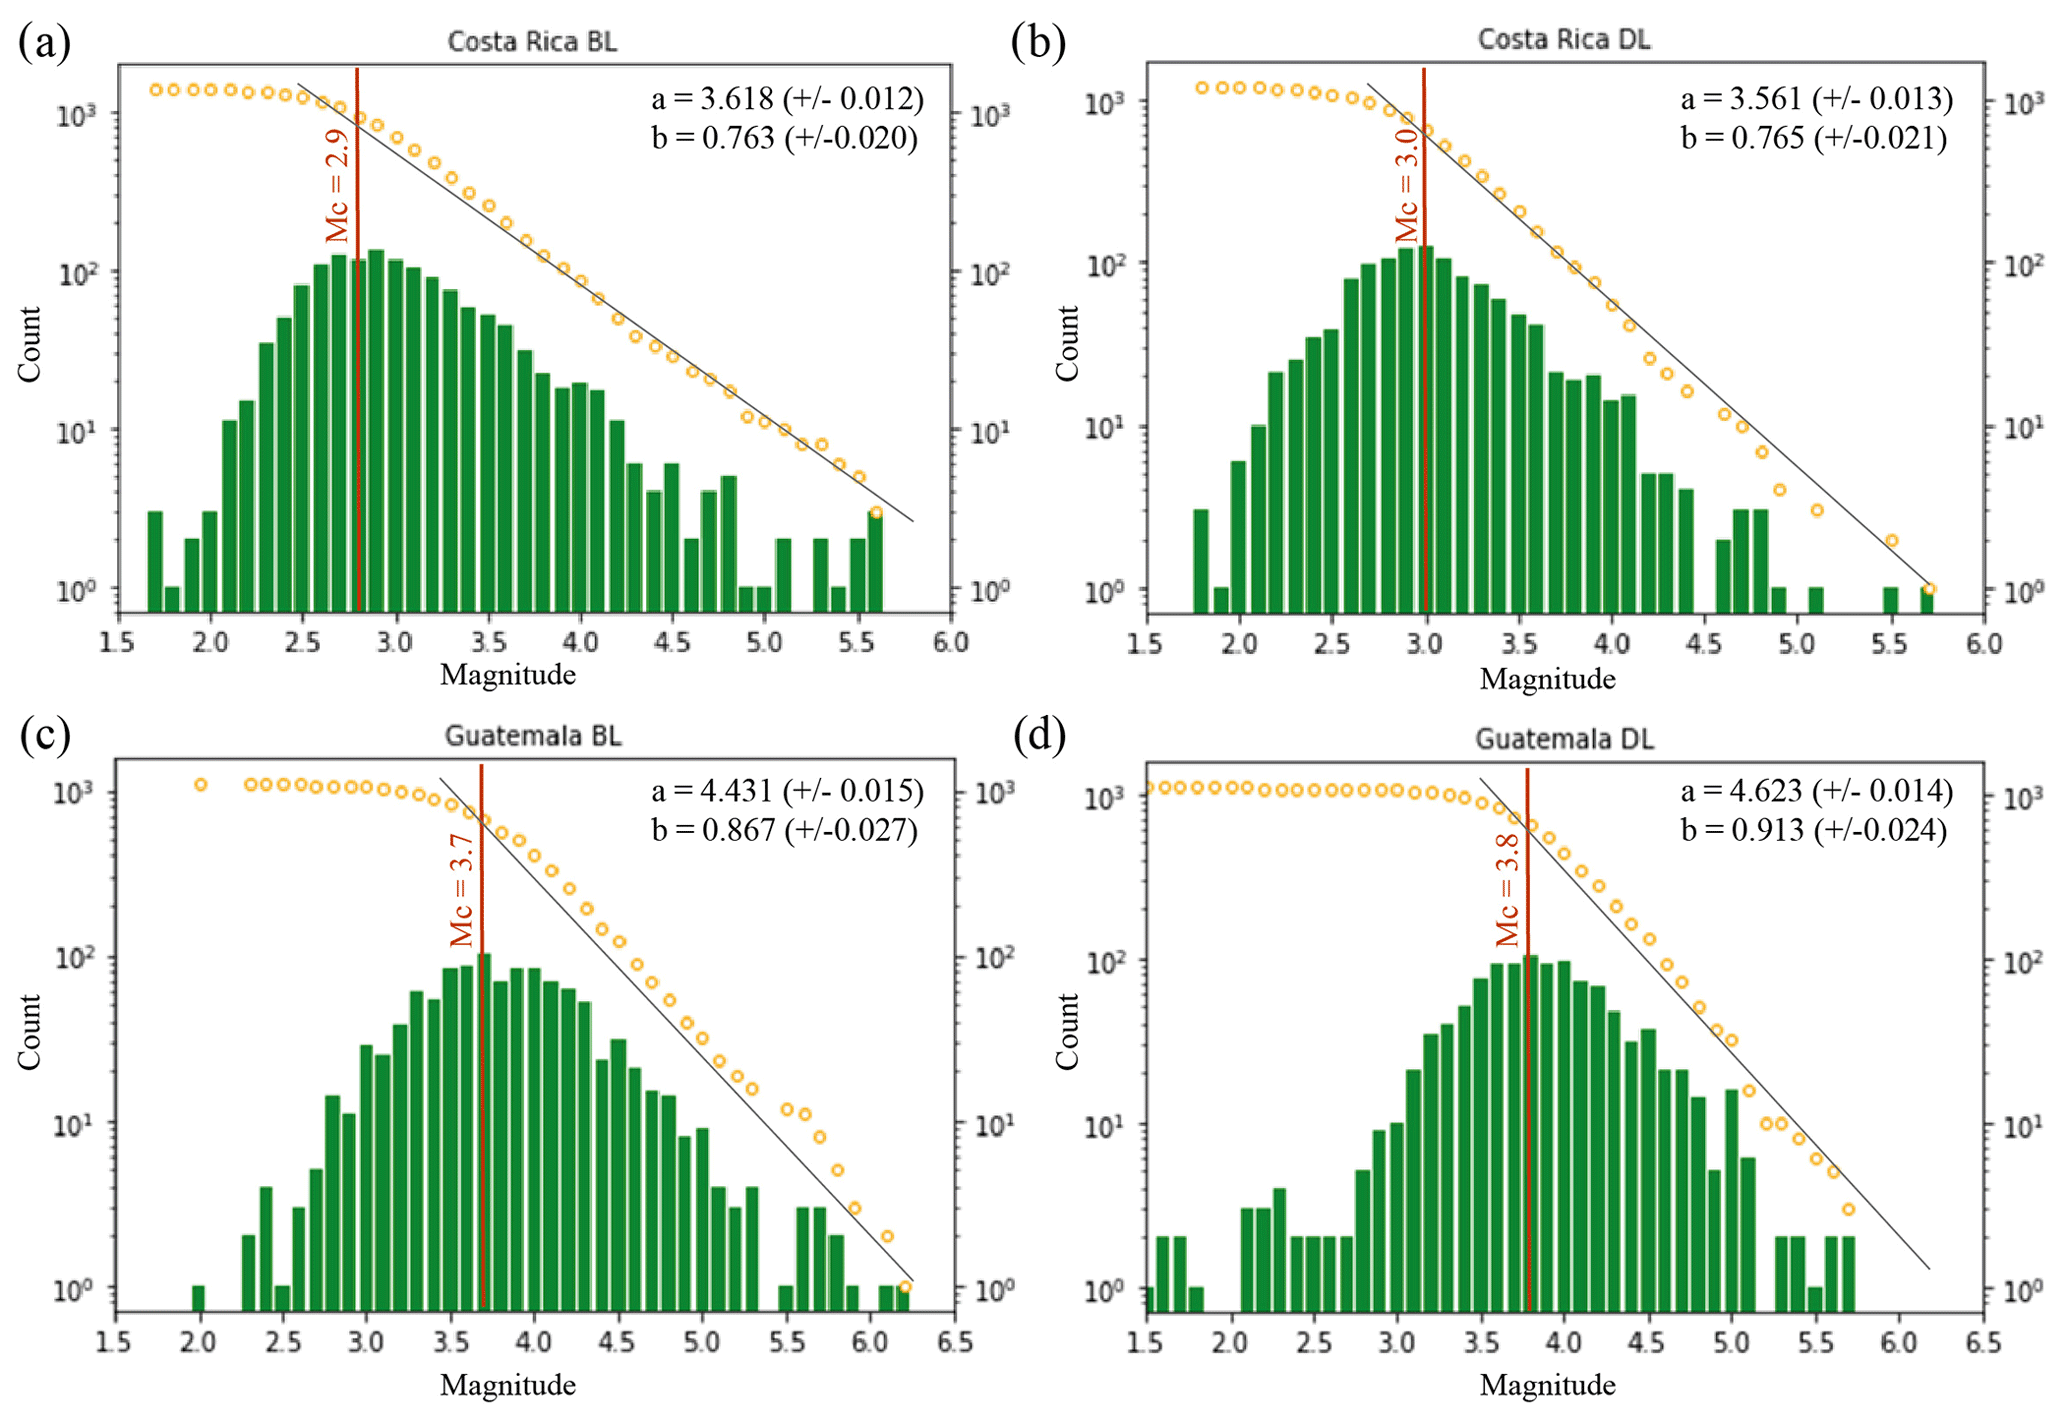
Figure 8Magnitude–frequency distribution of earthquakes for (a) Costa Rica before lockdown, (b) Costa Rica during lockdown, (c) Guatemala before lockdown, and (d) Guatemala during lockdown. Green bars represent the incremental (noncumulative) number of earthquakes, and yellow circles represent the cumulative distribution of events. The gray solid line fits the data points for the cumulative distribution above the magnitude of completeness (Mc). Vertical lines indicate the Mc estimated from the maximum curvature (MAXC) method.
In Fig. 7b, we show the average number of P-wave phases per earthquake for earthquakes with M≤4.0. Although the difference in the number of P-wave arrivals before and during the pandemic is not too high (between 1 and 5 picks for magnitudes between 1.8 and 4.0), the values are consistently higher (on average ∼ 20 %) during the pandemic, especially for the lower magnitudes (M≤3.5). This additional observation also favors the idea that the decrease in the HFSAND-RMS during lockdown may have had an effect on the earthquake detection capability of the RSN (Table 1).
Figure 7c shows the number of felt earthquakes reported through social networks or telephone calls with respect to an Mw range from 2.0 to 5.5. This graph shows that there were a greater number of earthquakes with Mw>3.5 reported as felt before the lockdown measures, but during the confinement, a greater number of reports for low-magnitude earthquakes (M<3.5) were collected (Table 1). In addition, based on reports through the RSN application ¿Lo sentiste?, we present the average number of reports for M<5.0 by magnitude intervals (Fig. 7d). The trend lines Fig. 7d show how the application ¿Lo sentiste? collected, on average, more felt reports for M<5.0 during the lockdown measures. These figures suggest a greater sensitivity of the population to low-magnitude earthquakes, possibly because increased time at home, the implementation of home office, and restrictions on mobility allowed people to perceive more events and subsequently report them to seismic agencies (Table 1).
Figure 9 shows the geographical distribution of felt events reported by the RSN (Fig. 7c) before (1 November 2019–15 March 2020) and during (16 March–31 July 2020) lockdown measures in Costa Rica. Even though the number of earthquake reports was higher before (99) than during (74) the lockdown measures, the percentage of low-magnitude (M<3.5) felt earthquakes was clearly higher (46 %) during the lockdown than before it (only 27 %). These numbers suggest that the quiescence of the environment could be an important contributing factor to more small earthquakes being reported (Table 1). Another aspect is that there were a greater number of higher-magnitude earthquakes (M>4.5) before the lockdown (20) than during it (11), and these events were located onshore and closer to population centers (Fig. 9).
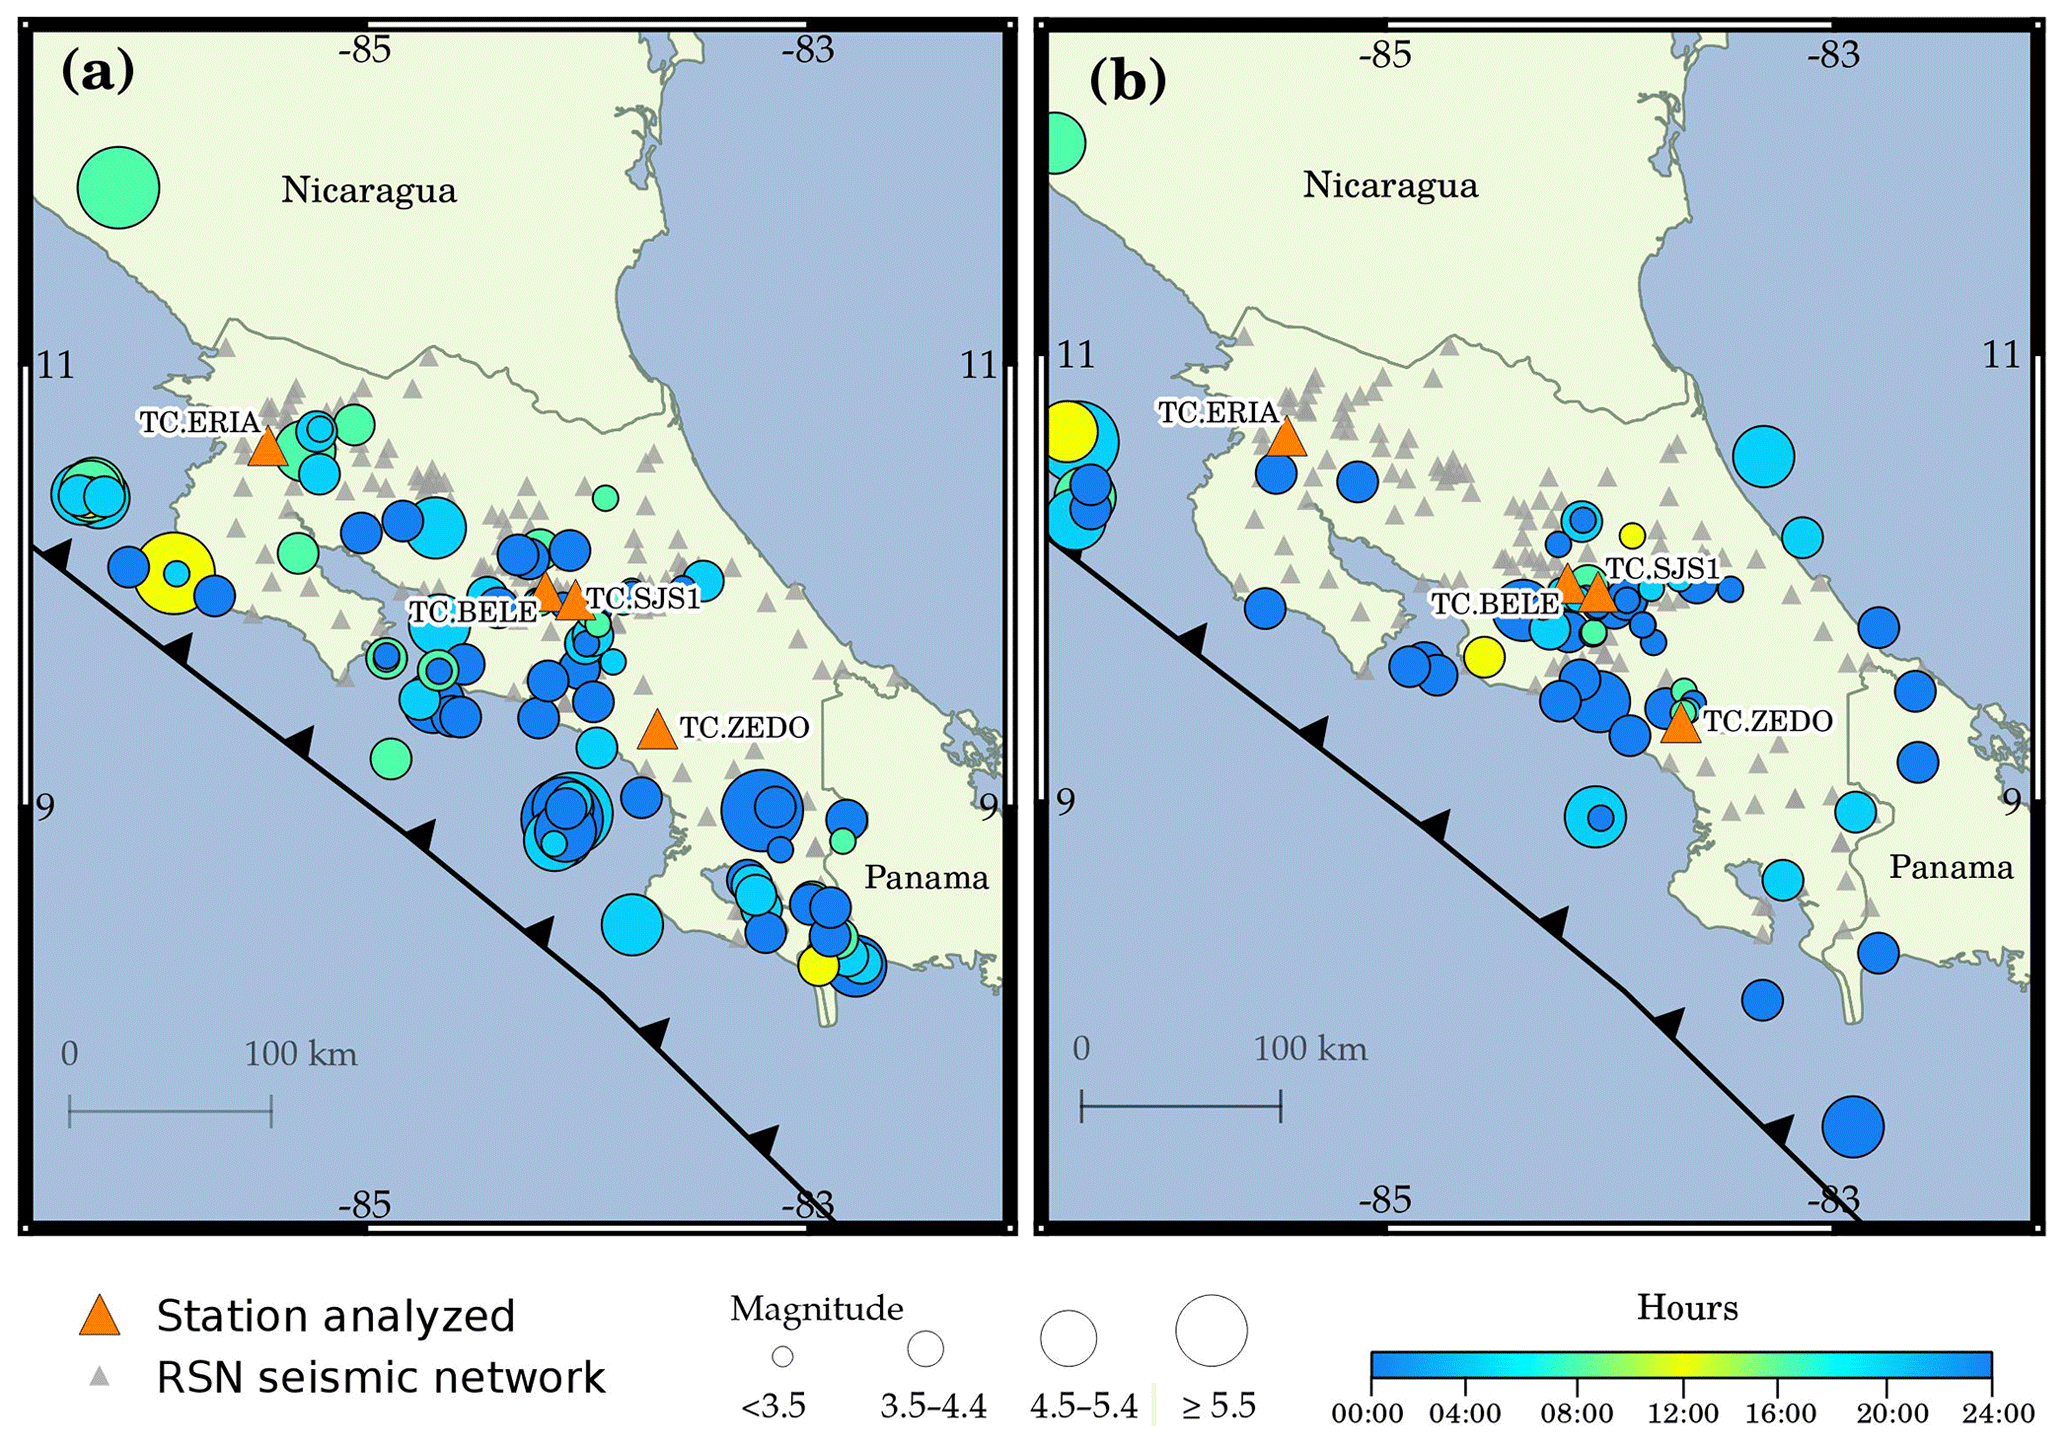
Figure 9Map of felt earthquakes reported in Costa Rica (a) before lockdown measures (1 November 2019–15 March 2020) and (b) during lockdown measures (16 March–31 July 2020).
We also checked the correlation between felt events (before and during lockdown) and the decrease in the HFSAND-RMS of the four seismic stations analyzed in Costa Rica. A correlation seems to exist in three of them, with two located in the metropolitan area of central Costa Rica (TC.SJS1 and TC.BELE) and the other in an urban area in southeastern Costa Rica (TC.ZEDO). There were 25 felt earthquakes for central Costa Rica before the lockdown, and 17 of them had a low magnitude (M<3.5). These numbers are lower than those during lockdown, when there were 36 felt earthquakes, including 28 of low magnitude (Fig. 9). For southeastern Costa Rica, near the Pérez Zeledón urban area (TC ZEDO), only five felt earthquakes were reported before the lockdown, all of them with M>3.5, but during lockdown, seven events were reported as felt, with four of them of low magnitude (Fig. 9, Table 1). These observations again suggest an increase in felt reports from small earthquakes in these regions. These felt events, as expected, were more often perceived during the nighttime hours, from 18:00 to 06:00 LT (Fig. 9).
3.2.2 Guatemala
The INSIVUMEH seismic network is still under development. This network consists of 24 seismic stations, most of them GÜRALP broadband sensors, with some installed inside the main military detachments or national airports, whereas others are installed in the main tourist cities of the country. For this reason, these stations can reach high levels of seismic noise, which is why detecting low-magnitude earthquakes under pre-pandemic conditions was challenging.
In Fig. 10a, we present a comparison of the statistics before and during the lockdown measures. Similar to Costa Rica, this graph shows that a higher number of events was recorded for Guatemala during the lockdown measures (Table 1). However, the analyses of other seismic parameters are not conclusive: Mc varies only slightly from 3.7 to 3.8 from before to during the lockdown, which does not imply a significant increase in earthquake detection (Fig. 8c, d); however, the a and b values seem to suggest an increment in low-magnitude earthquakes, changing from 4.43 to 4.63 for the a value and from 0.87 to 0.91 for the b value (Fig. 8c, d), for the periods of before and during the lockdown.
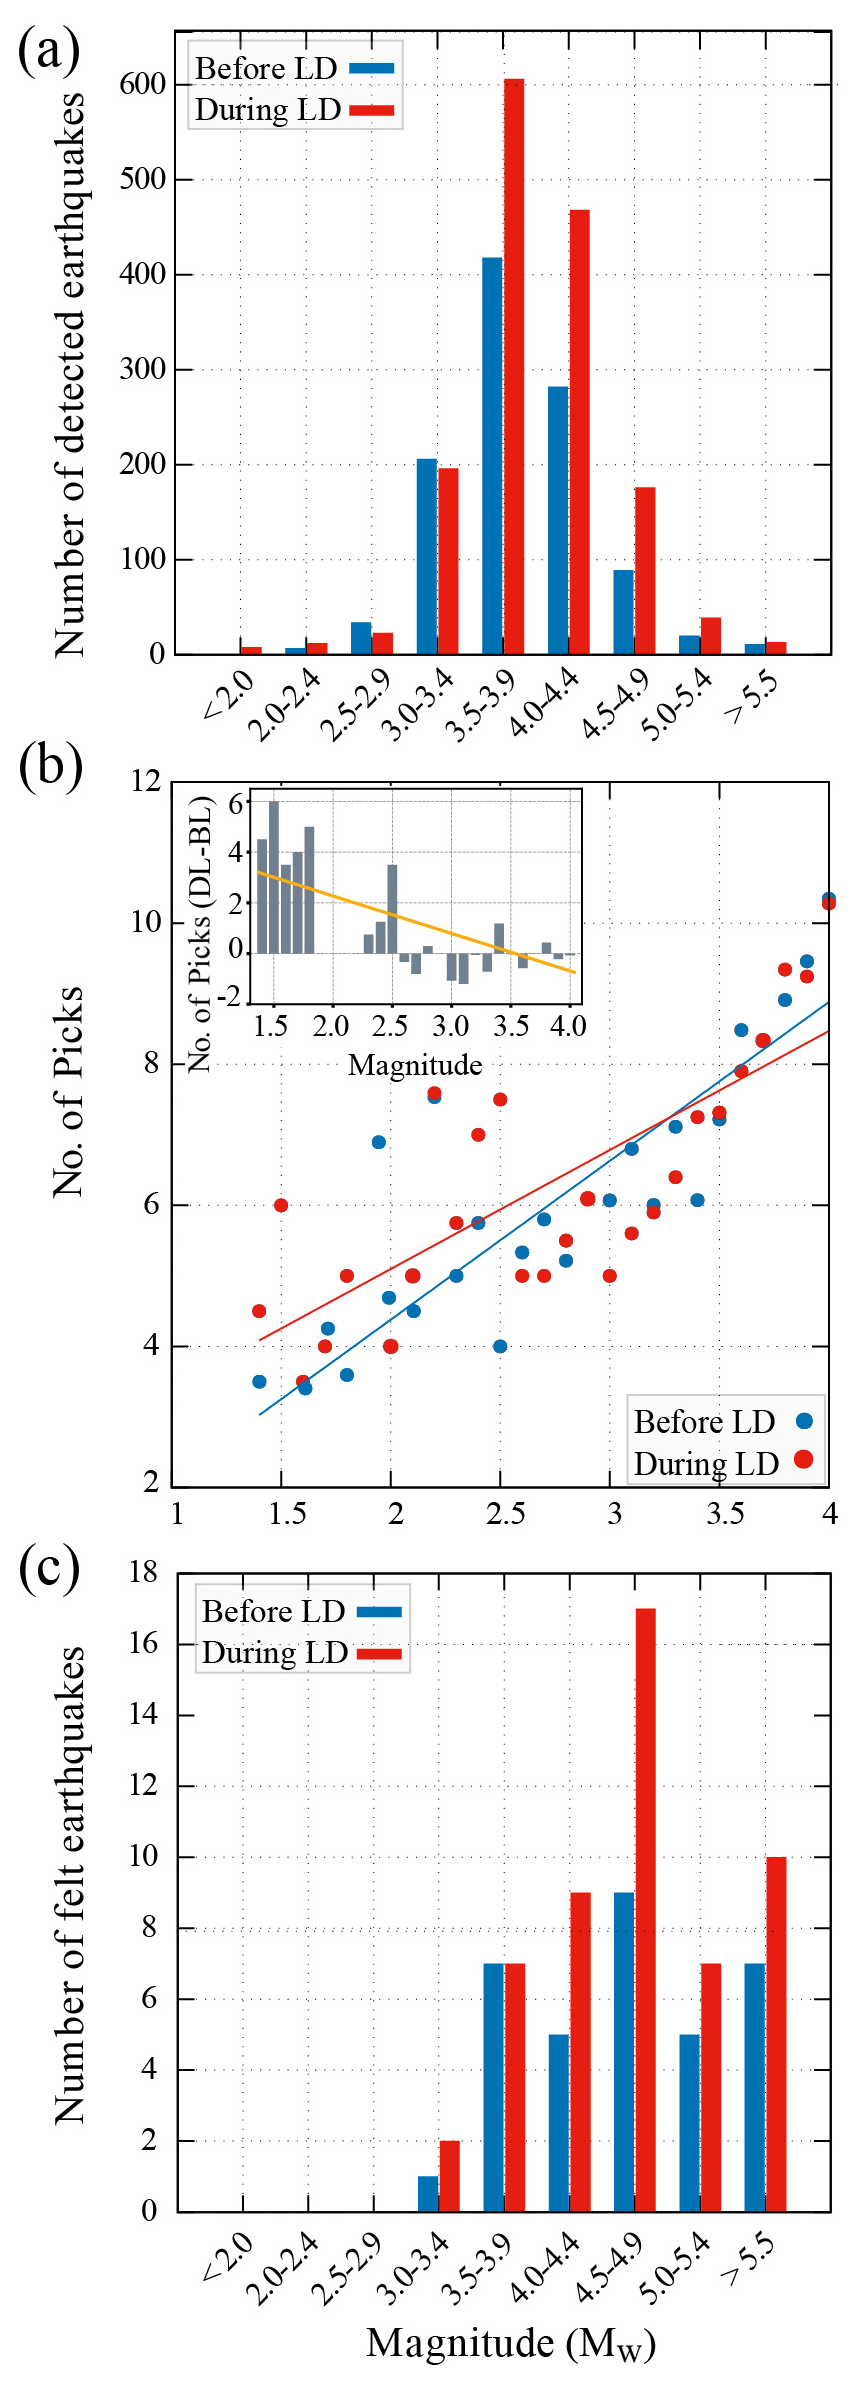
Figure 10Event detection and felt earthquakes reported in Guatemala before (1 November 2019–15 March 2020) and during (16 March–31 July 2020) lockdown (LD) measures. (a) The number of detected earthquakes. (b) Earthquake magnitude versus the average number of P-wave picks per Mw for the events with Mw<4.0, and the corresponding linear fits. The inset graph shows the average difference in the number of picks for magnitude bins for the periods before (BL) and during (DL) lockdown. (c) The number of felt earthquakes in Guatemala.
In Guatemala, the average number of seismic phases per event of the same magnitude clearly increases for magnitudes lower than 3.0 during the lockdown (on average ∼ 40 %) (Fig. 10b). Hence, the possible effect of the lower levels of seismic noise on the detection of more low-magnitude earthquakes could be stronger in Guatemala than in Costa Rica (Table 1). This may be related to the much lower seismic station density of Guatemala. Furthermore, it should be noted that the lockdown measures implemented by the Guatemalan government were more drastic than in Costa Rica. Moreover, the number of felt events reported by the population again shows the interesting trend of a general increase during the lockdown period, but in the case of Guatemala, this is visible for M≥3.5 (Fig. 10c, Table 1).
Figure 11 shows the distribution of the felt earthquakes reported to INSIVUMEH (Fig. 10c) before and during the lockdown. Before the lockdown, a total of 34 seismic felt events were reported, whereas that number increased to 47 during lockdown. The earthquake magnitudes were higher before lockdown (Fig. 11a), with 21 earthquakes above M 4.5 (62 % of the total felt events in this period), than during lockdown (Fig. 11b), with 19 earthquakes above M 4.5 (40 % of the total felt events in this period). Hence, during the lockdown, there were more felt earthquakes of lower magnitude (M<4.5), including three earthquakes below M 3.5, in contrast to just one before the lockdown. Once more, this trend suggests a correlation between the quiescence of the environment and an increment in low-magnitude felt events during the lockdown (Table 1). These felt events, as expected, were more often perceived during the nighttime hours, from 18:00 to 06:00 LT (Fig. 11).

Figure 11Map of felt earthquakes reported in Guatemala (a) before lockdown measures (1 November 2019–15 March 2020) and (b) during lockdown measures (16 March–31 July 2020).
Finally, from the spatial distribution of felt earthquakes during lockdown, we observed that, unlike the pre-pandemic period, more events originated onshore and mainly close to populated areas, such as Guatemala City and Huehuetenango. These are epicentral locations near two of the seismic stations for which the decrease in the HFSAND-RMS was observed: GI.GCG4 and GI.HUEH. In a seismic network under development like the INSIVUMEH, with fewer stations, a high percentage of the low-magnitude seismicity is likely not detected due to ambient noise, but the observations provided above seem to support the idea that the lockdown measures have caused an improvement in the detection capacity of this network.
An important decrease in the high-frequency seismic noise was detected at stations in three Central American countries during the lockdown measures adopted to prevent the spread of COVID-19. In Costa Rica, Guatemala, and El Salvador, the social distancing measures produced seismic noise levels comparable to those observed during the New Year holidays in previous years. The displacement observed decreased from 200 to 140 nm in San José, from 100 to 80 nm in Guatemala City, and from 120 to 80 nm in the city of La Libertad near San Salvador. In Nicaragua, which had very few measures in place, there were no effects on the seismic noise levels of the station analyzed, although this station also happens to be a quiet site (40 nm).
The decrease in the high-frequency seismic anthropogenic noise displacement is strongly dependent on the location of the station and on the lockdown measures. Four categories of seismic noise reduction were identified (very high, high, intermediate, and low), and significant (∼ 50 %) decreases in seismic noise were observed at stations near airports, busy roads, and densely populated cities. The greatest impact on the noise levels started on 16 March and was specifically related to the closure of educational centers and nonessential stores, the curfew from 17:00 to 05:00 LT in Guatemala, and the restriction on vehicular mobility from 19:00 to 05:00 LT in Costa Rica. The most drastic effect of the limitation on the mobility of the inhabitants was observed during Easter in April of 2020, when the values observed were as low as ∼ 60 nm in San José and ∼ 50 nm in Guatemala City and near San Salvador.
We suggest that the lower seismic noise levels in Costa Rica allowed for the detection of a higher number of seismic phases (∼ 20 % more per magnitude) and, therefore, the location of more small earthquakes than usual; more low-magnitude earthquakes (M<3.5) were also reported as felt. Similarly, in Guatemala, where the seismic network is still under development, we suggest a similar effect with a ∼ 40 % increase in the phase picking amount for low-magnitude events and the detection of a higher number of low-magnitude earthquakes (<2.5) than before the lockdown. In addition, there were more felt reports during lockdown in both countries, mainly in the urban areas of central and southeastern Costa Rica, and in Guatemala City and Huehuetenango. Although we present some evidence that links the reduction in seismic noise and the increase in earthquake detections and felt reports, the variations in the magnitude of completeness and the a and b values are not significant enough before and during the lockdown to confirm causality or to discriminate other possible contributing factors.
Finally, we suggest that there could be a connection between the lockdown measures and the number of felt reports for smaller earthquakes (M<3.5) in Costa Rica and Guatemala. This possible effect may have been induced by a more quiescence environment: people spending more time at home and the implementation of home office might have stimulated a higher sensitivity to feel low-magnitude earthquakes and to subsequently report them to the seismic agencies. This work demonstrates that seismic networks can monitor population mobility and can, consequently, be used to verify compliance with lockdown measures and to explore the consequences of reducing seismic noise in earthquake detection and felt reports.
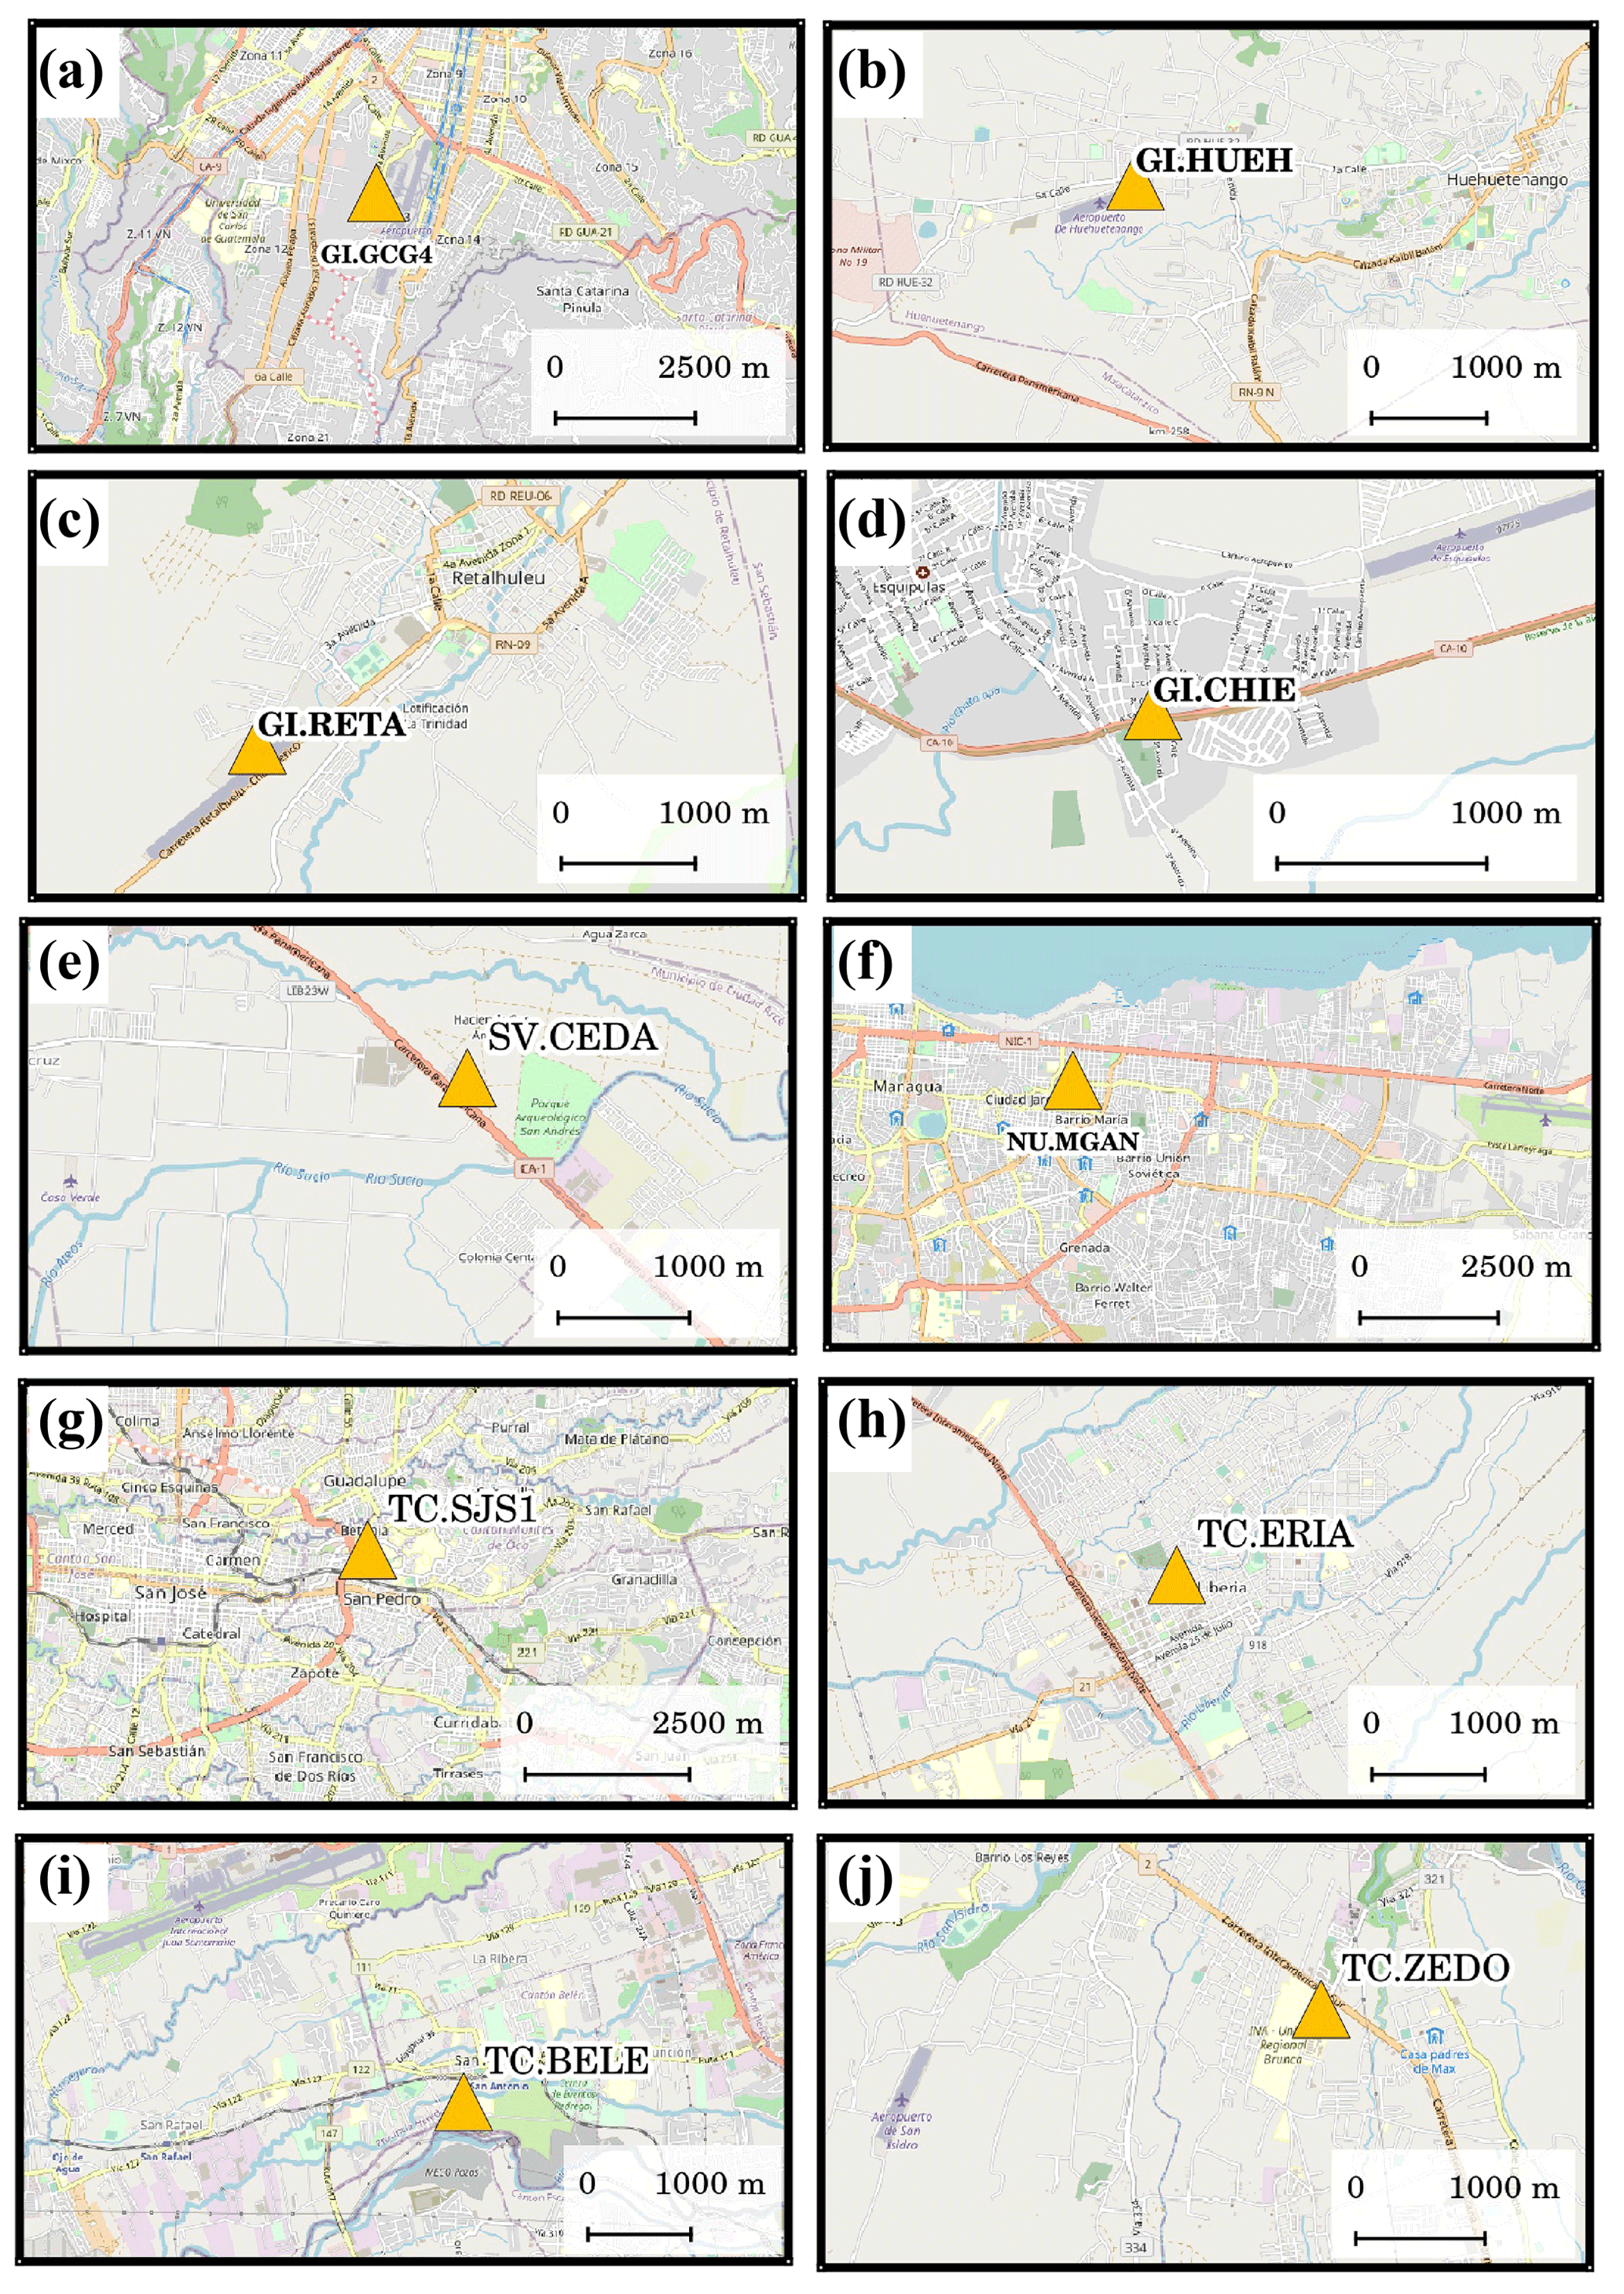
Figure A1Images from Open Street Maps of the site areas where the seismic stations (orange triangles) used in this work are located. © OpenStreetMap contributors 2020. Distributed under the Open Data Commons Open Database License (ODbL) v1.0.
Table A1Main mobility lockdown measures in Costa Rica, Guatemala, and El Salvador between March and October 2020 during the COVID-19 pandemic according to the “Sistema de Integración Centroamericana” (SICA) (2020). Nicaragua did not establish lockdown measures with respect to social mobility. On March 18, the first positive case of COVID-19 was found in Nicaragua.
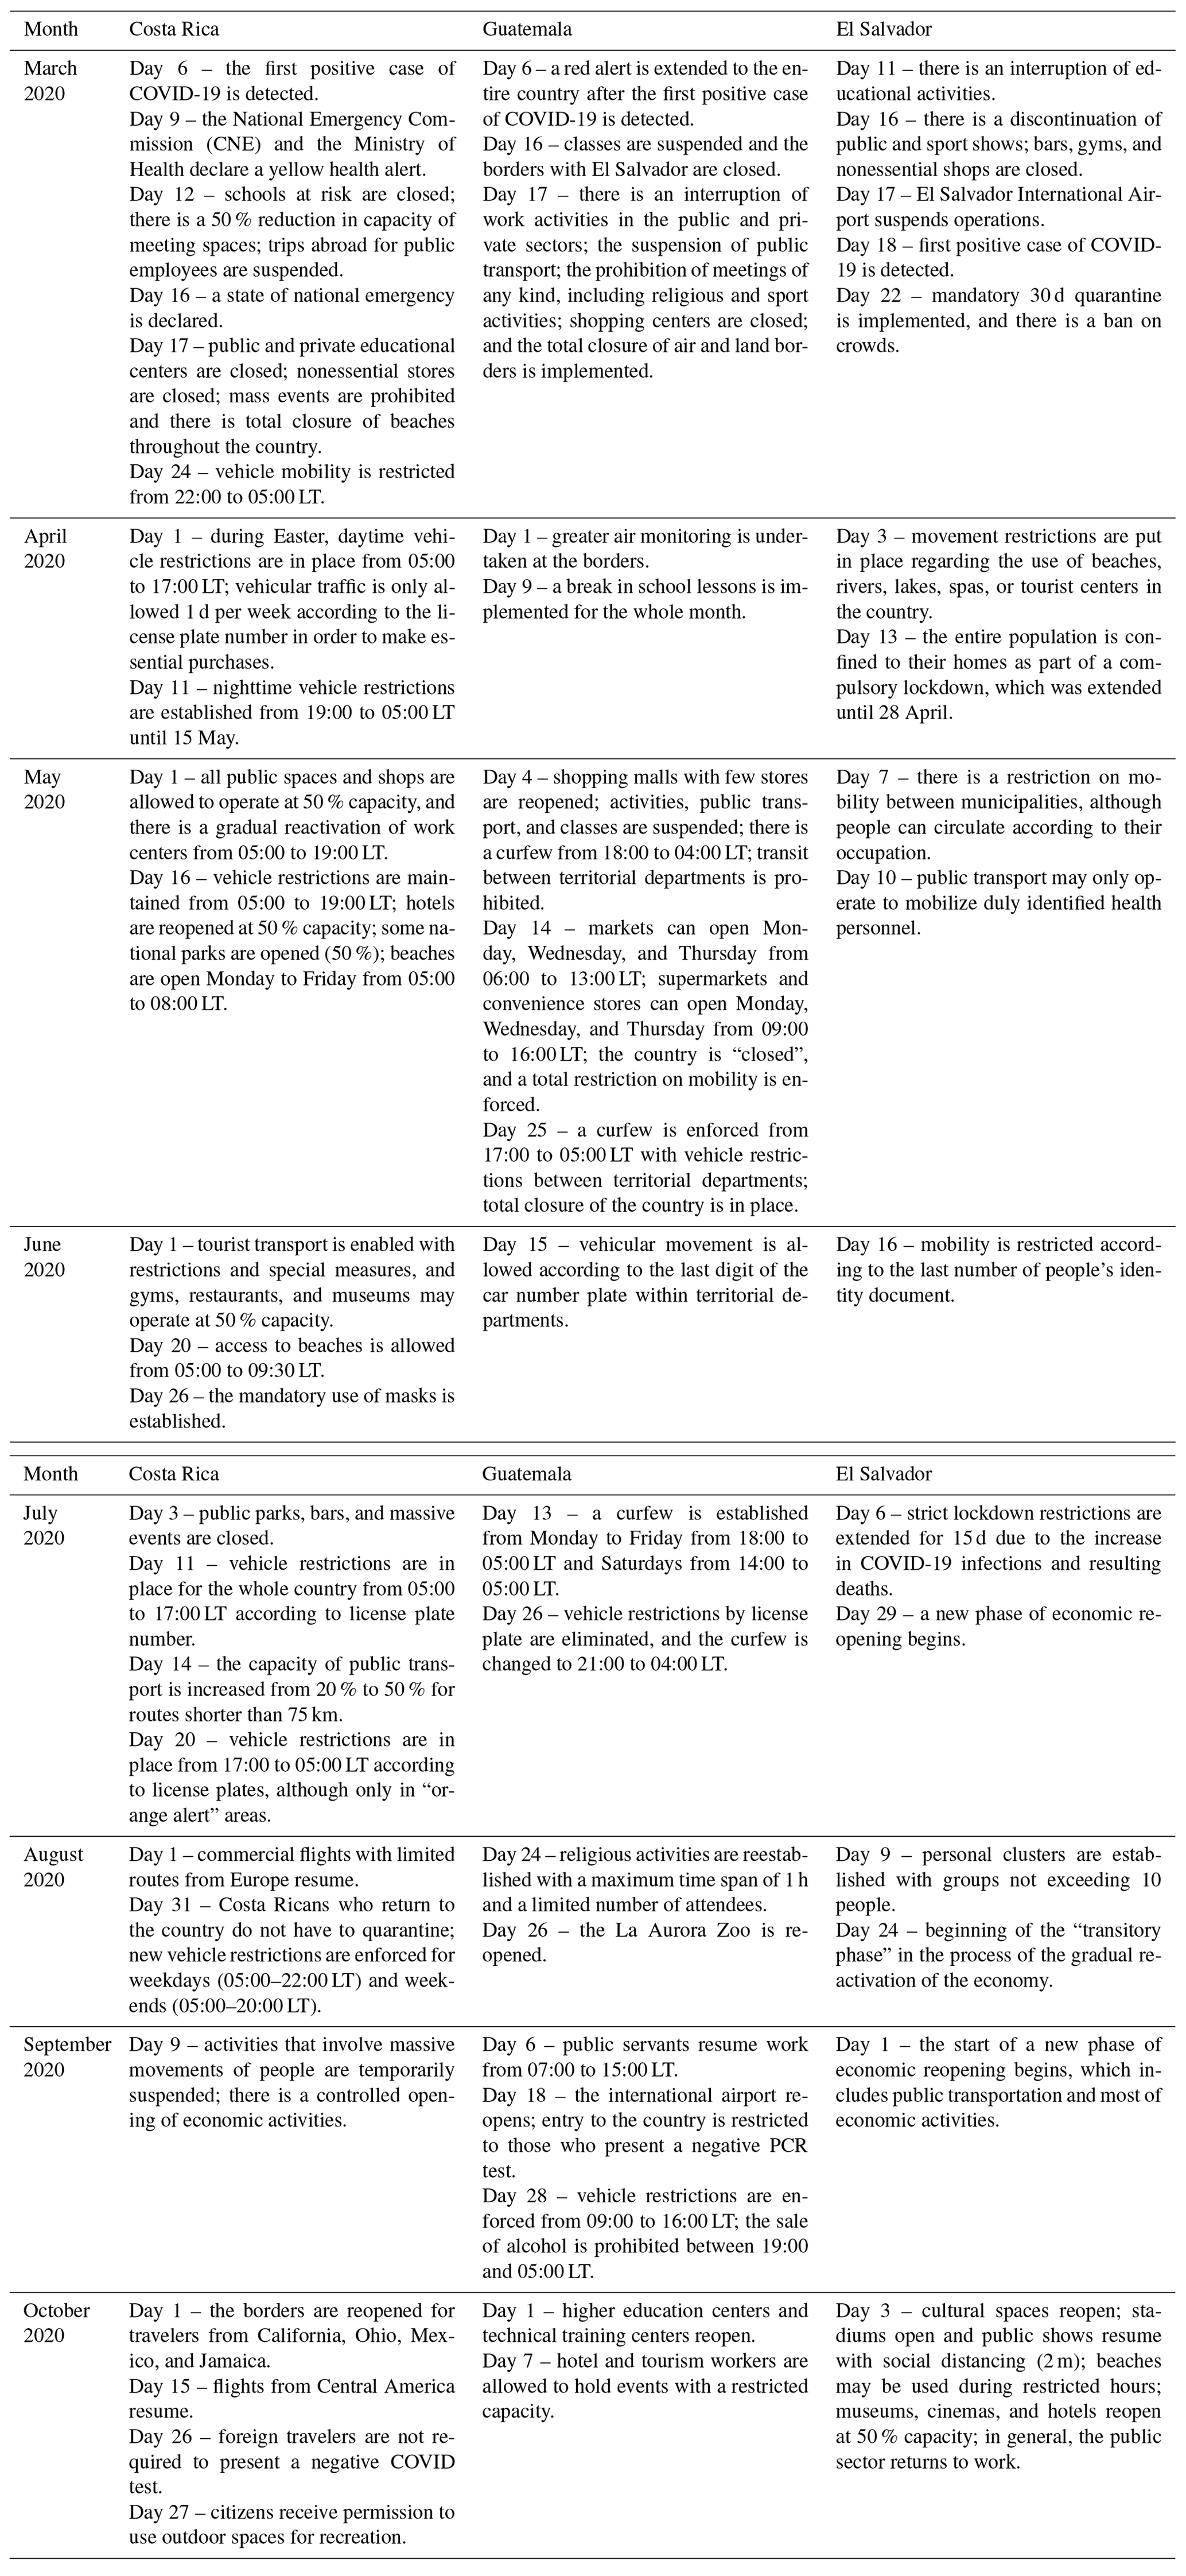
Table A2Questions on the RSN module “¿Lo sentiste?” (Linkimer and Arroyo, 2020).
All of the codes used to analyze the seismic data are available in Lecocq et al. (2020b, https://doi.org/10.5281/zenodo.3820046).
The data are available from the FDSN web services for the INSIVUMEH and RSN-UCR seismic networks (INSIVUMEH, 2013, https://doi.org/10.7914/SN/GI; RSN-UCR, 2017, https://doi.org/10.15517/TC).
MA designed the study and wrote the paper with contributions from all co-authors. MA and DC processed the seismic data and made the figures. All of the authors interpreted and analyzed the results and revised the article.
The authors declare that they have no conflict of interest.
Publisher’s note: Copernicus Publications remains neutral with regard to jurisdictional claims in published maps and institutional affiliations.
This article is part of the special issue “Social seismology – the effect of COVID-19 lockdown measures on seismology”. It is not associated with a conference.
We thank the topical editor, Koen Van Noten, and the referees, Valerio de Rubeis and Alan Kafka, for their comments and suggestions, which improved the paper. We are also grateful to the personnel of the Central American seismic networks for maintaining the seismic instruments, locating systems, and computer programs, often under very difficult conditions.
This work was partially supported by the University of Costa Rica (UCR) in the framework of project nos. 113-B5-704 “Vigilancia sísmica de Costa Rica” and 113-B9-911 “Programa de Investigación Red Sismológica Nacional”. Financial support for seismic instrumentation at the RSN has mainly been provided by the UCR and law no. 8488 of the Republic of Costa Rica. Financial support for seismic instrumentation at the INSIVUMEH has been mainly provided by the government of Guatemala.
This paper was edited by Koen Van Noten and reviewed by Alan Kafka and Valerio de Rubeis.
Adamek, S., Frohlich, C., and Pennington, W.: Seismicity of the Caribbean-Nazca Boundary: Constraints on Microplate Tectonics of the Panama Region, J. Geophys. Res., 93, 2053–2075, https://doi.org/10.1029/JB093iB03p02053, 1998.
Aki, K.: Maximum likelihood estimated of b in the formula and its confidence limits, Rev. Earthquakes Res. Inst, Tokyo Univ., 43, 237–239, 1965.
Alonso-Henar, J., Montero, W., Martínez-Díaz, J., Álvarez-Gómez, J., Insua-Arévalo, J., and Rojas, W.: The Aguacaliente Fault, source of the Cartago 1910 destructive earthquake (Costa Rica), Terra Nova, 25, 368–373, https://doi.org/10.1111/ter.12045, 2013.
Arroyo-Solórzano, M. and Linkimer, L.: Spatial variability of the b-value and seismic potential in Costa Rica, Tectonophysics, 814, 228951, https://doi.org/10.1016/j.tecto.2021.228951, 2021.
Ashenden, C., Lindsay, J., Sherburn, S., Smith, I., Miller, C., and Malin, P.: Some challenges of monitoring a potentially active volcanic field in a large urban area: Auckland volcanic field, New Zealand, Nat. Hazards, 59, 507–528, https://doi.org/10.1007/s11069-011-9773-0, 2011.
Atkinson, G. and Wald, D.: “Did You Feel It?” intensity data: A surprisingly good measure of earthquake ground motion, Seismol. Res. Lett., 78, 362–368, 2007.
Blackman, R., Tukey, J., and Tukey, W.: The measurement of power spectra from the point of view of communications engineering – Part I, Bell Syst. Tech. J., 37, 185–282, https://doi.org/10.1002/j.1538-7305.1958.tb03874.x, 1958.
Dengler, L. A. and Dewey, J. W.: An Intensity Survey of Households Affected by the Northridge, California, Earthquake of 17 January 1994, B. Seismol. Soc. Am., 88, 441–462, 1998.
Díaz, J., Ruiz, M., Sánchez-Pastor, P. S., and Romero, P.: Urban Seismology: On the origin of earth vibrations within a city, Sci. Rep.-UK, 7, 1–11, 2017.
Espinosa, A. F.: The Guatemalan Earthquake of February 4, 1976, US Geol. Surv. Prof. Pap. 1002, 90, 1976.
GEM: The OpenQuake-engine User Manual, Global Earthquake Model (GEM) OpenQuake Manual for Engine version 3.9.0, 183 pp., available at: https://docs.openquake.org/manuals/OpenQuake%20Manual%203.9.pdf (last access: 28 September 2021), 2020.
Gempa: SeisComp 3 Real time data acquisition and processing [software computacional], available at: https://www.seiscomp.de/doc/index.html (last access: 20 December 2020), 2019.
Green, D., Bastow, I., Dashwood, B., and Nippress, S.: Characterizing Broadband Seismic Noise in Central London, Seismol. Res. Lett., 88, 113–124, https://doi.org/10.1785/0220160128, 2017.
Groos, J. C. and Ritter, J. R. R.: Time domain classification and quantification of seismic noise in an urban environment, Geophys. J., 179, 1213–1231, https://doi.org/10.1111/j.1365-246X.2009.04343.x, 2009.
Gutenberg, B. and Richter, C.: Frequency of earthquakes in California, B. Seismol. Soc. Am., 34, 185–188, 1944.
Harlow, D. H., White, R. A., Rymer, M. J., and Alvarez, S.: The San Salvador earthquake of 10 October 1986 and its historical context, B. Seismol. Soc. Am., 83, 1143–1154, 1993.
Havskov, J., Voss, P. H., and Ottemöller, L.: Seismological observatory software: 30 Yr of SEISAN, Seismol. Res. Lett., 91, 1846–1852, https://doi.org/10.1785/0220190313, 2020.
Hong, T.-K., Lee, J., Lee, G., Lee, J., and Park, S.: Correlation between Ambient Seismic Noises and Economic Growth, Seismol. Res. Lett., 91, 2343–2354, https://doi.org/10.1785/0220190369, 2020.
INSIVUMEH (Instituto Nacional De Sismologia, Vulcanologia, Meteorologia e Hidrología de Guatemala): Red Sismológica Nacional, International Federation of Digital Seismograph Networks [data set], https://doi.org/10.7914/SN/GI, 2013.
Instituto Nicaragüense De Estudios Territoriales (INETER): Nicaraguan Seismic Network, Instituto Nicaragüense de Estudios Territoriales (INETER) [data set], https://doi.org/10.7914/SN/NU, 1975.
Kellogg, J. N. and Vega, V.: Tectonic development of Panama, Costa Rica and the Colombian Andes: constraints from global positioning geodetic systems and gravity, in: Geologic and Tectonic Development of the Caribbean Plate Boundary in Southern Central America, edited by: Mann, P., 75–90 (GSA Special Paper, 295), Geological Society of America, Colorado, USA, 1995.
Kuzma, H. A.: Vehicle traffic as a source for near-surface passive seismic imaging, Symposium on the Application of Geophysics to Engineering and Environmental Problems, 2009 609–615, https://doi.org/10.4133/1.3176748, 2009.
Lecocq, T., Hicks, S. P., van Noten, K., et al.: Global quieting of high-frequency seismic noise due to COVID-19 pandemic lockdown measures, Science, 369, 1338–1343, https://doi.org/10.1126/science.abd2438, 2020a.
Lecocq, T., Massin, F., Satriano, C., Vanstone, M., and Megies, T.: Seismo RMS – A simple Python/Jupyter Notebook package for studying seismic noise changes, Zenodo [code], https://doi.org/10.5281/zenodo.3820046, 2020b.
Linkimer, L. and Arroyo, I.: Ciencia ciudadana y herramientas de comunicación en la Red Sismológica Nacional de la Universidad de Costa Rica, Revista Comunicación, 29, 5–21, ISSN:0379-3974/e-ISSN1659-3820, 2020.
Linkimer, L., Arroyo, I. G., Alvarado, G. E., Arroyo, M., and Bakkar, H.: The National Seismological Network of Costa Rica (RSN): An Overview and Recent Developments, Seismol. Res. Lett., 89, 392–398, https://doi.org/10.1785/0220170166, 2018.
Mann, P., Schubert, C., and Burke, K.: Review of Caribbean neotectonics, in: The Caribbean Region. The Geology of North America, edited by: Dengo, G. and Case, J. E., Geol. Soc. Amer. Boulder, Colorado, 307–338, 1990.
McNamara, D. and Buland, R.: Ambient Noise Levels in the Continental United States, B. Seismol. Soc. Am., 94, 1517–1527, https://doi.org/10.1785/012003001, 2004.
Nimiya, H., Ikeda, T., and Tsuji, T.: Temporal changes in anthropogenic seismic noise levels associated with economic and leisure activities during the COVID-19 pandemic, Research Square, https://doi.org/10.21203/rs.3.rs-77786/v1, 2020.
Piccinini, D., Giunchi, C., and Olivieri, M.: COVID-19 lockdown and its latency in Northern Italy: seismic evidence and socio-economic interpretation, Sci. Rep.-UK, 10, 16487, https://doi.org/10.1038/s41598-020-73102-3, 2020.
Poli, P., Boaga, J., Molinari, I., Cascone, V., and Boschi, L.: The 2020 coronavirus lockdown and seismic monitoring of anthropic activities in Northern Italy, Sci. Rep.-UK, 10, 9404, https://doi.org/10.1038/s41598-020-66368-0, 2020.
Riahi, N. and Gerstoft, P.: The seismic trafic footprint: Tracking trains, aircraft, and cars seismically, Geophys. Res. Lett., 42, 2674–2681, https://doi.org/10.1002/2015GL063558, 2015.
RSN-UCR (Información de la Red Sismológica Nacional de Costa Rica): National Seismological Network of Costa Rica, Universidad de Costa Rica [data set], https://doi.org/10.15517/TC, 2017.
SNET (Servicio Nacional de Estudios Territoriales), El Salvador (SNET-BB): International Federation of Digital Seismograph Networks, available at: https://www.fdsn.org/networks/detail/SV/ (last access: 28 March 2021), 2004.
SICA (Sistema de Integración Centroamericana): Observatorio Regional SICA-COVID 19, available at: https://www.sica.int/coronavirus/observatorioSICACOVID19/medidas/Costarica, last access: 20 December 2020.
Sohrabi, C., Alsafi, Z., O'Neill, N., Khan, M., Kerwan, A., Al-Jabir, A., Iosifidis, C., and Agha, R.: World Health Organization declares global emergency: A review of the 2019 novel coronavirus (COVID-19), Int. J. Surg., 76, 71–76, https://doi.org/10.1016/j.ijsu.2020.02.034, 2020.
Somala, S. N.: Seismic noise changes during COVID-19 pandemic: a case study of Shillong, India, Nat. Hazards, 103, 1623–1628, https://doi.org/10.1007/s11069-020-04045-1, 2020.
Trenkamp, R., Kellogg, J. N., Freymeuller, J. T., and Mora, H. P.: Wide plate margin deformation, southern Central America and northwestern South America, CASA GPS observations, J. S. Am. Earth Sci., 15, 157–171, 2002.
Vargas, C. A. and Mann, P.: Tearing and breaking off of subducted slabs as the result of collision of the Panama arc-indenter with northwestern South America, B. Seismol. Soc. Am., 103, 2025–2046, 2013.
Wald, D. J., Quitoriano, V., Worden, C. B., Hopper, M., and Dewey, J. W.: USGS “Did You Feel It?” Internet-based Macroseismic Intensity Maps, Ann. Geophys., 54, 688–707, https://doi.org/10.4401/ag-5354, 2011.
Weichert, D.: Estimation of the Earthquake Recurrence Parameters for Unequal Observation Periods for Different Magnitudes, B. Seismol. Soc. Am., 70, 1337–1346, 1980.
Welch, P.: The use of fast Fourier transform for the estimation of power spectra: A method based on time averaging over short, modified periodograms, IEEE Trans. Audio Electroacoust, 15, 70–73, https://doi.org/10.1109/TAU.1967.1161901, 1967.
Wiemer, S. and Wyss, M.: Minimum Magnitude of Completeness in Earthquake Catalogs: Examples from Alaska, the Western United States, and Japan, B. Seismol. Soc. Am., 90, 859–869, 2000.
Woessner, J. and Wiemer, S.: Assessing the Quality of Earthquake Catalogues: Estimating the Magnitude of Completeness and Its Uncertainty, B. Seismol. Soc. Am., 95, 684–698, 2005.