the Creative Commons Attribution 4.0 License.
the Creative Commons Attribution 4.0 License.
 | 01 Nov 2021
Marine forearc structure of eastern Java and its role in the 1994 Java tsunami earthquake
Jacob Geersen
Dirk Klaeschen
Bo Ma
Dietrich Lange
Michael Riedel
Michael Schnabel
Heidrun Kopp
We resolve a previously unrecognized shallow subducting seamount from a re-processed multichannel seismic profile crossing the 1994 Mw 7.8 Java tsunami earthquake rupture area. Seamount subduction occurs where the overriding plate experiences uplift by lateral shortening and vertical thickening. Pronounced back-thrusting at the landward slope of the forearc high and the formation of splay faults branching off the landward flank of the subducting seamount are observed. The location of the seamount in relation to the 1994 earthquake hypocentre and its co-seismic slip model suggests that the seamount acted as a seismic barrier to the up-dip co-seismic rupture propagation of this moderate-size earthquake.
- Article
(16143 KB) - Full-text XML
-
Supplement
(6039 KB) - BibTeX
- EndNote


Tsunami earthquakes represent a special class of seismic events that rupture the very shallow portion of a subduction plate boundary (Kanamori, 1972; Satake and Tanioka, 1999). They are characterized by a longer source duration compared to conventional earthquakes with a similar magnitude that nucleate at greater depth (e.g. Bilek and Lay, 2002). Despite being of only moderate surface wave magnitude, tsunami earthquakes commonly trigger an anomalously large tsunami. Due to the lack of severe ground shaking, coastal communities are often caught by surprise by the associated tsunami, resulting in potentially high numbers of fatalities (Satake et al., 2013). In spite of their often severe consequences, our current knowledge on tsunami earthquakes is insufficient to comprehensively understand their seismo-tectonic genesis and to identify regions that are particularly endangered.
The reduced rupture speed, large shallow slip, and moderate shaking of earthquakes that break the shallow plate boundary might be preconditioned by low rigidity in the outermost forearc (Bilek and Lay, 2002; Sallarès and Ranero, 2019; Şen et al., 2015). Structural features invoked to explain the unusual slow rupture of tsunami earthquakes include the presence of excess topography on the subducting plate, which may act as a localized asperity (Abercrombie et al., 2001; Tanioka et al., 1997). Further explanations include rupture within unconsolidated subducted sediments (Kanamori, 1972; Satake and Tanioka, 1999), re-activated splay-faulting in the upper plate (Fan et al., 2017; von Huene et al., 2016; Wendt et al., 2009), vertical pop-up expulsion (Hananto et al., 2020), or inelastic shoving of unconsolidated sediments under the action of shallow slip (Seno, 2002; Tanioka and Seno, 2001).
With only 13 known events since 1896, tsunami earthquakes occur sporadically but are observed globally (Geersen, 2019). The Java margin, which constitutes the eastern portion of the Sunda Arc (Kopp et al., 2006) was, however, affected twice by tsunami earthquakes in recent times (1994 and 2006). The 1994 Mw 7.8 earthquake (2 June 1994 18:17:34 UTC) ruptured the shallow part of the plate boundary off the coast of easternmost Java (Fig. 1; Abercrombie et al., 2001). The co-seismic slip model is characterized by a non-uniform pattern, with the maximum slip under the forearc high (Abercrombie et al., 2001; Bilek and Engdahl, 2007). The induced ground motion and seafloor perturbation resulted in a severe tsunami with run-up heights of up to ∼14 m (Tsuji et al., 1995), causing significant damage to the local coastal area and approximately 250 casualties (Polet and Kanamori, 2000). The tsunami modelling for the 1994 Java earthquake reveals that the source of the larger-than-expected tsunami run-up could be linked to the horizontal displacement of the steep seafloor slope on the overriding plate (Tanioka and Satake, 1996).
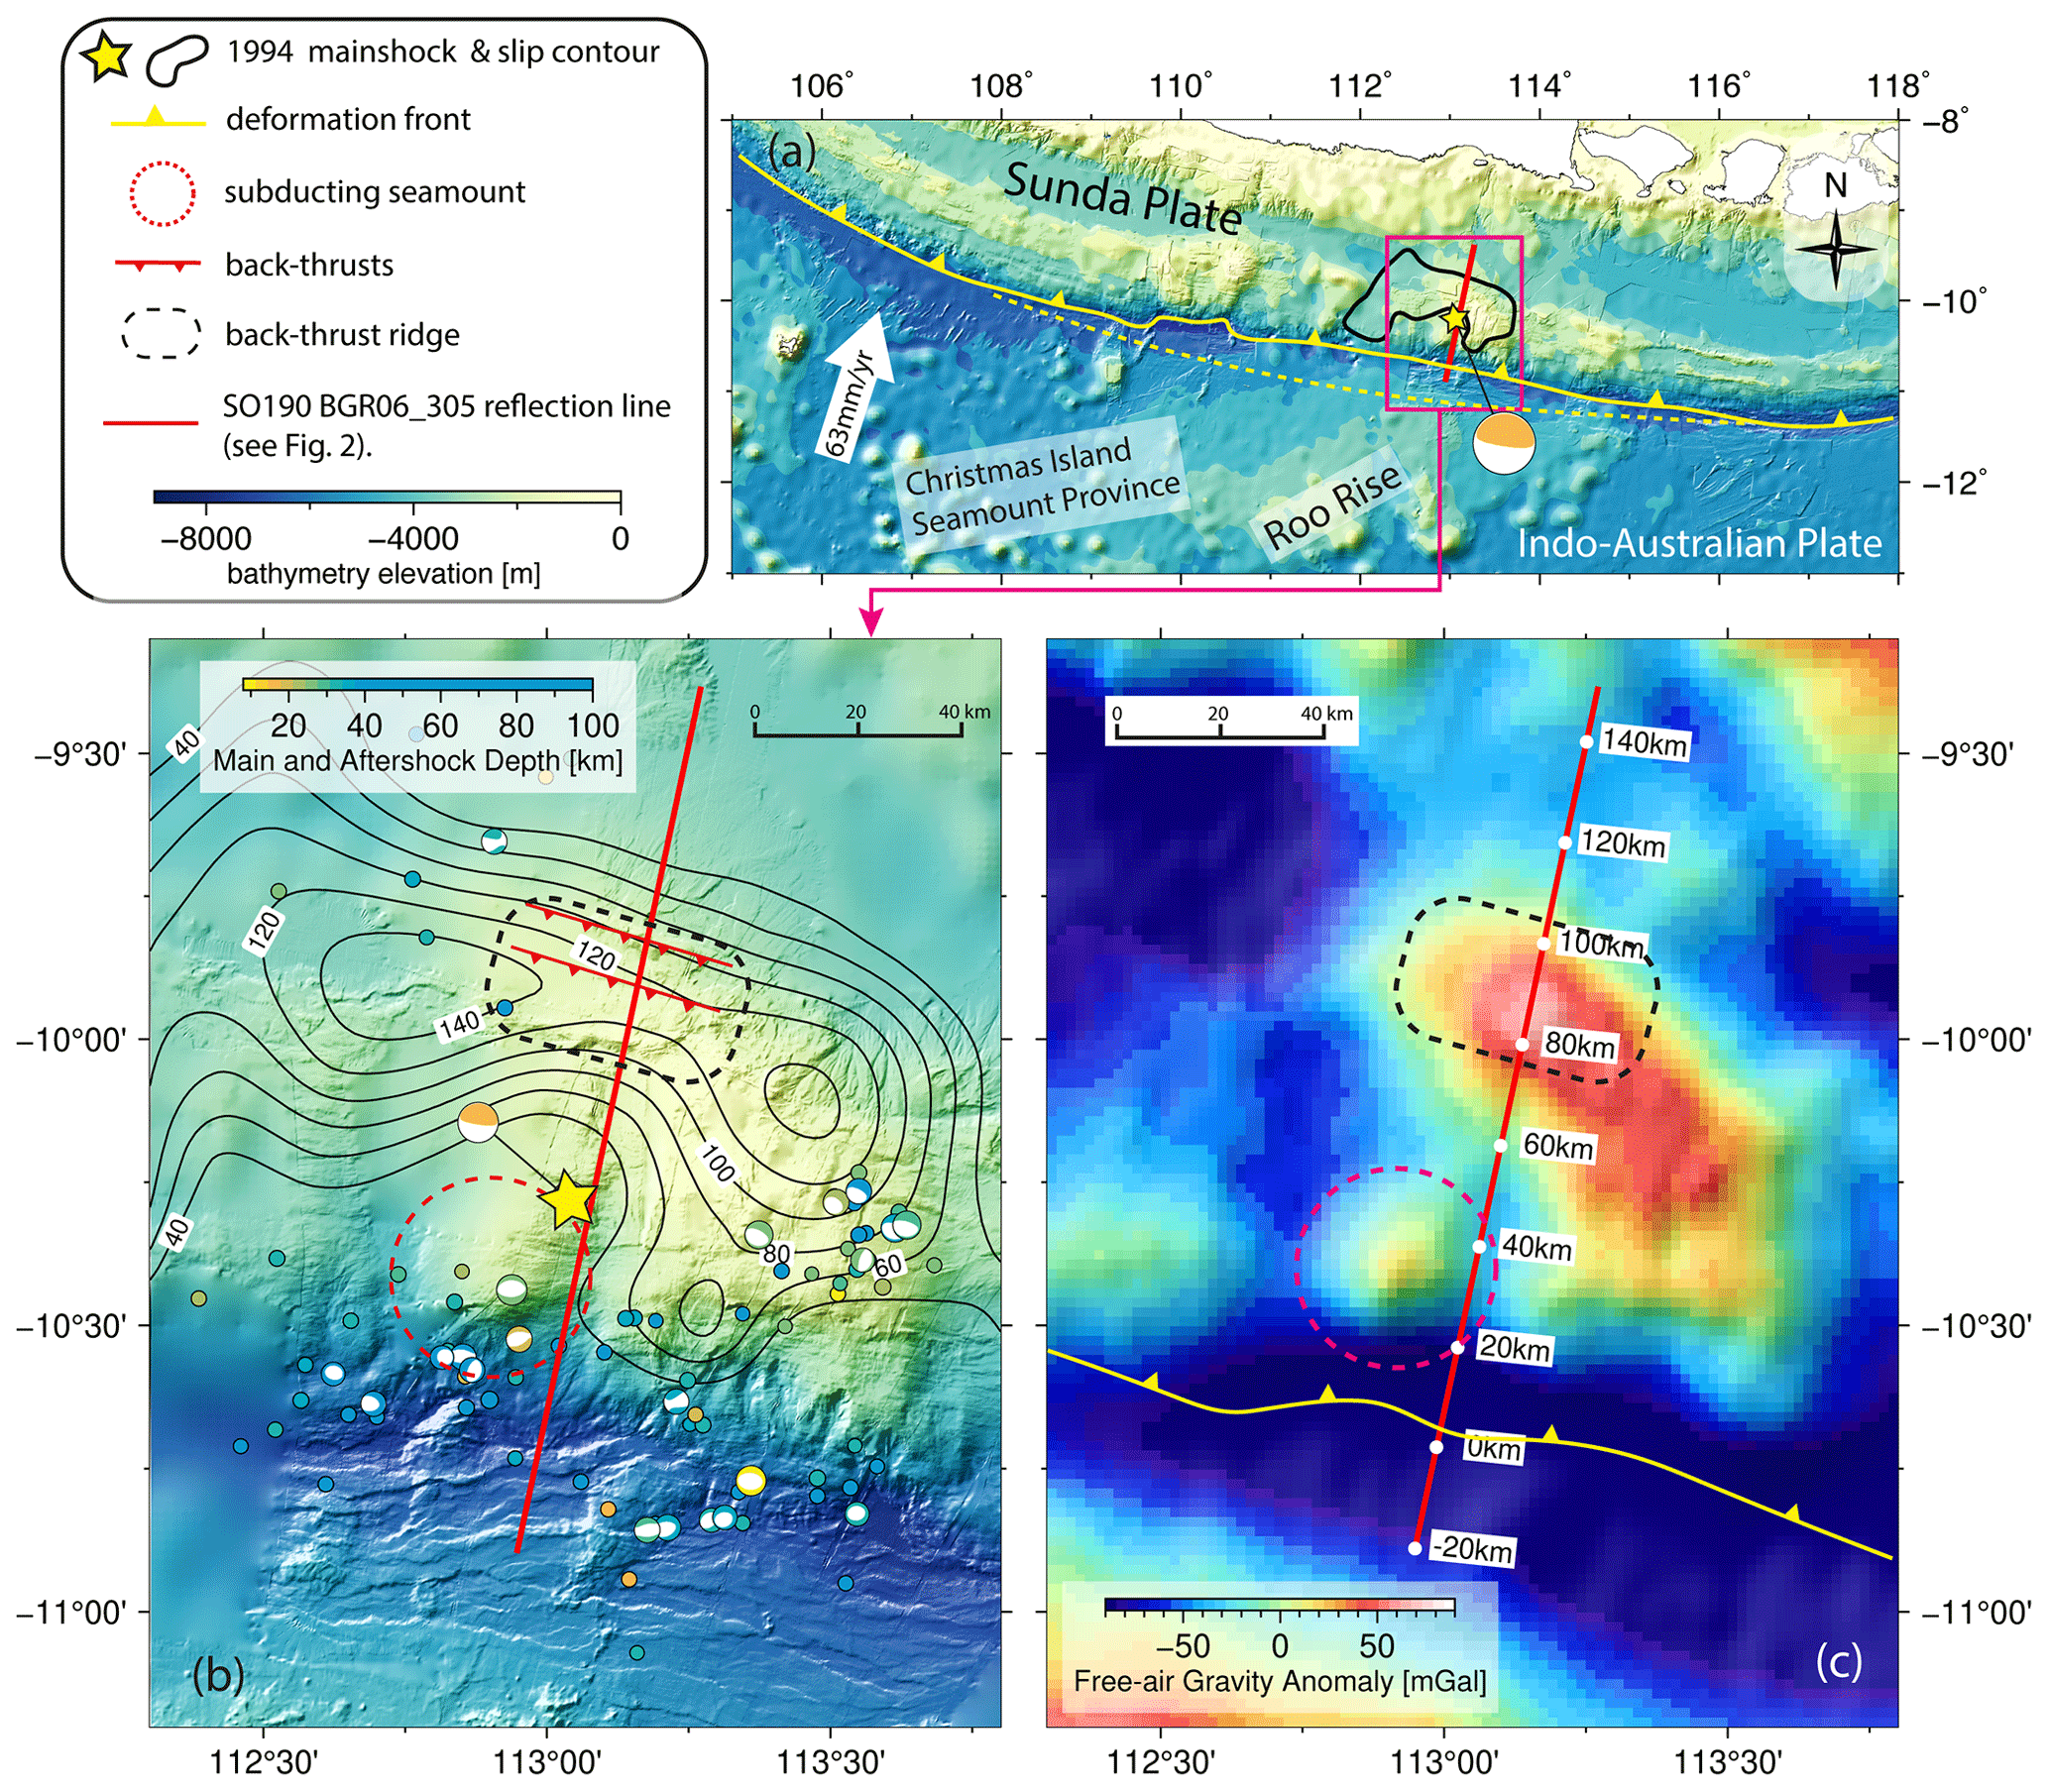
Figure 1(a) Bathymetric overview, from the General Bathymetric Chart of the Oceans (GEBCO, 2020), of the eastern Java Margin. Yellow line: deformation front. Dashed yellow line: assumed trend of the deformation front prior to frontal erosion related to the Roo Rise (Kopp et al., 2006). Yellow star: 1994 Java Tsunami earthquake epicentre. The moment tensor of the 1994 mainshock (gCMT, Dziewonski et al., 1981; Ekström et al., 2012) is plotted at the position of the 1994 epicentre from the ISC-EHB Bulletin catalogue (Engdahl et al., 2020). Black line: rupture area of the 1994 Java Tsunami earthquake (Bilek and Engdahl, 2007). Red line: Seismic line SO190 BGR06_305 shown in Fig. 2. (b) Local bathymetry acquired during SO190 cruise overlain on the GEBCO_2020 grid. Black lines are slip contours (in cm) of the 1994 Java tsunami earthquake from Bilek and Engdahl (2007). The locations of the mainshock and largest aftershocks (3 June–14 October 1994) are from the ISC-EHB Bulletin catalogue (Engdahl et al., 2020) and focal mechanisms from the gCMT catalogue (Dziewonski et al., 1981; Ekström et al., 2012). The black dashed rectangle and the red triangle markers indicate the back-thrust ridge. The red dashed circle marks the bathymetric elevation associated with the shallow subducting seamount. Note the decrease in co-seismic slip and bending of contour lines around the subducting seamount. (c) Free-air gravity anomaly (Sandwell et al., 2014).
The 1994 Java tsunami earthquake has been interpreted as having ruptured over a subducting seamount that induces a localized asperity within an overall low-coupled shallow plate boundary environment (Abercrombie et al., 2001; Bilek and Engdahl, 2007). This interpretation is based on the presence of multiple seamounts within the Java trench as recognized in early side-scan data (Masson et al., 1990), the presence of a well-developed shallow forearc high (Fig. 1b), a positive gravity anomaly under the forearc high (Fig. 1c), and the dominance of normal faulting aftershocks in the outer rise (Abercrombie et al., 2001). To date, the presence of the seamount in the peak slip region of the 1994 earthquake has not been confirmed by marine seismic data (Lüschen et al., 2011; Shulgin et al., 2011). The previous interpretation (Abercrombie et al., 2001; Bilek and Engdahl, 2007) is in contrast to the notion that subducting seamounts affect the plate interface as a geometrical irregularity, induce permanent brittle deformation of the overriding plate, and develop a heterogeneous stress field which does not support the generation of large earthquakes (M>8) but rather favours moderate and small events (4<M<8) or aseismic creep (Kodaira et al., 2000; Ruh et al., 2016; Wang and Bilek, 2011; Martínez-Loriente et al., 2019).
In this study, we image the structure of the Java margin using multichannel reflection seismic data (MCS) in the region of the 1994 tsunami earthquake in order to resolve the relation of subducting lower plate topography and upper plate structure to the co-seismic slip distribution. Our study is based on enhanced processing of a multichannel seismic reflection line crossing the epicentral area. Re-processing of the profile aimed to improve the subsurface velocity model and to enhance the multiple suppression to augment the imaging quality. Pre-stack depth migration refines a combined P-wave velocity model from a MCS reflection tomography (Xia et al., 2021) and ocean bottom seismometer (OBS) refraction tomography (Shulgin et al., 2011).
The multichannel seismic reflection profile SO190 BGR06_305 was acquired in 2006 under the scope of the Sindbad Project during R/V Sonne cruise SO190 conducted by the Federal Institute for Geosciences and Natural Resources (BGR) (Müller and Neben, 2006). The profile is part of a 2D survey covering the marine forearc off the coast of eastern Java and the Lesser Sunda Islands (Lüschen et al., 2011; Planert et al., 2010; Shulgin et al., 2011). BGR's G-Gun airgun array was used as a seismic source with a maximum total volume of 3100 in3 (50.8 L) and a towing depth of 6 m. Seismic signals were recorded by the 3000 m long digital cable of BGR's SEAL System, which consists of 20 seismic sections with 240 channels in total.
Seismic pre-processing is summarized in Table S1 and is based on a routine that includes geometry set-up, common midpoint (CMP) binning, zero offset traces padding, bandpass filtering, shot interpolation, and random noise attenuation. We employed a free surface-related multiple prediction method to predict the multiple waves from the primary events based on the Kirchhoff integral (Verschuur et al., 1992) (Fig. S1 in the Supplement). An adaptive subtraction was used to eliminate the multiple (Guitton and Verschuur, 2004) and was applied using cascaded frequency bands (Table S1, Figs. S1, S2). Three bands of frequency (0–12, 12–50, and 50–90 Hz) are defined in the adaptive subtraction to fit the spectrum discrepancies of the two inputs of the original data and modelled multiple (Fig. S2). This novel multiple suppression strategy greatly improved the resolution at depth by unveiling and preserving the deeper reflections previously blurred and covered by the seafloor multiple (Figs. S3, S4). Figure S4 illustrates the efficiency of this application. The multiple overprinted on the primaries in Fig. S4a are step-by-step eliminated by the adaptive subtraction, Radon dip filter, and the amplitude clipping. Remarkably, the adaptive subtraction of modelled multiple (Fig. S4c) removed most of the multiples with similar dipping angle as the primaries, which are difficult to discriminate using a conventional dip filter (e.g. Radon filter in Fig. S4d) at the near-offset. The initial velocity analysis is performed in the time domain with a CMP increment of 250 m and converted to the depth domain. This MCS p-wave velocity (vp) model is subsequently merged with the OBS refraction model of Shulgin et al. (2011) to correct the vp field at greater depth (2–4 km below seafloor), from where little effective MCS reflection signal and move-out sensitivity is recorded (marked as the white band in Fig. S5). The merging of the velocity models is conducted with a smooth taper zone with a width of ∼2 km to eliminate any abrupt vp changes. We used the final merged vp model as the initial model for the pre-stack depth migration. Subsequently, we conducted an iterative ray-based reflection depth tomography with a warping method to minimize the residual depth error to retrieve an optimized vp model (Xia et al., 2021). Most significant are the image improvements compared to Lüschen et al. (2011, Fig. 3) in the shallow subsurface structure of splay faults a, b, and c (Fig. 2) and in the deeper parts where the seafloor multiple overprinted the primary reflections.
Multibeam bathymetric data were collected during the SO190 cruise, using a SIMRAD EM120 multibeam echo sounder. The bathymetry survey was edited and merged with the GEBCO_2020 bathymetry (GEBCO, 2020) in the areas not covered by the multibeam soundings. Gravity data in this study are from Sandwell et al. (2014) based on satellite radar measurements.
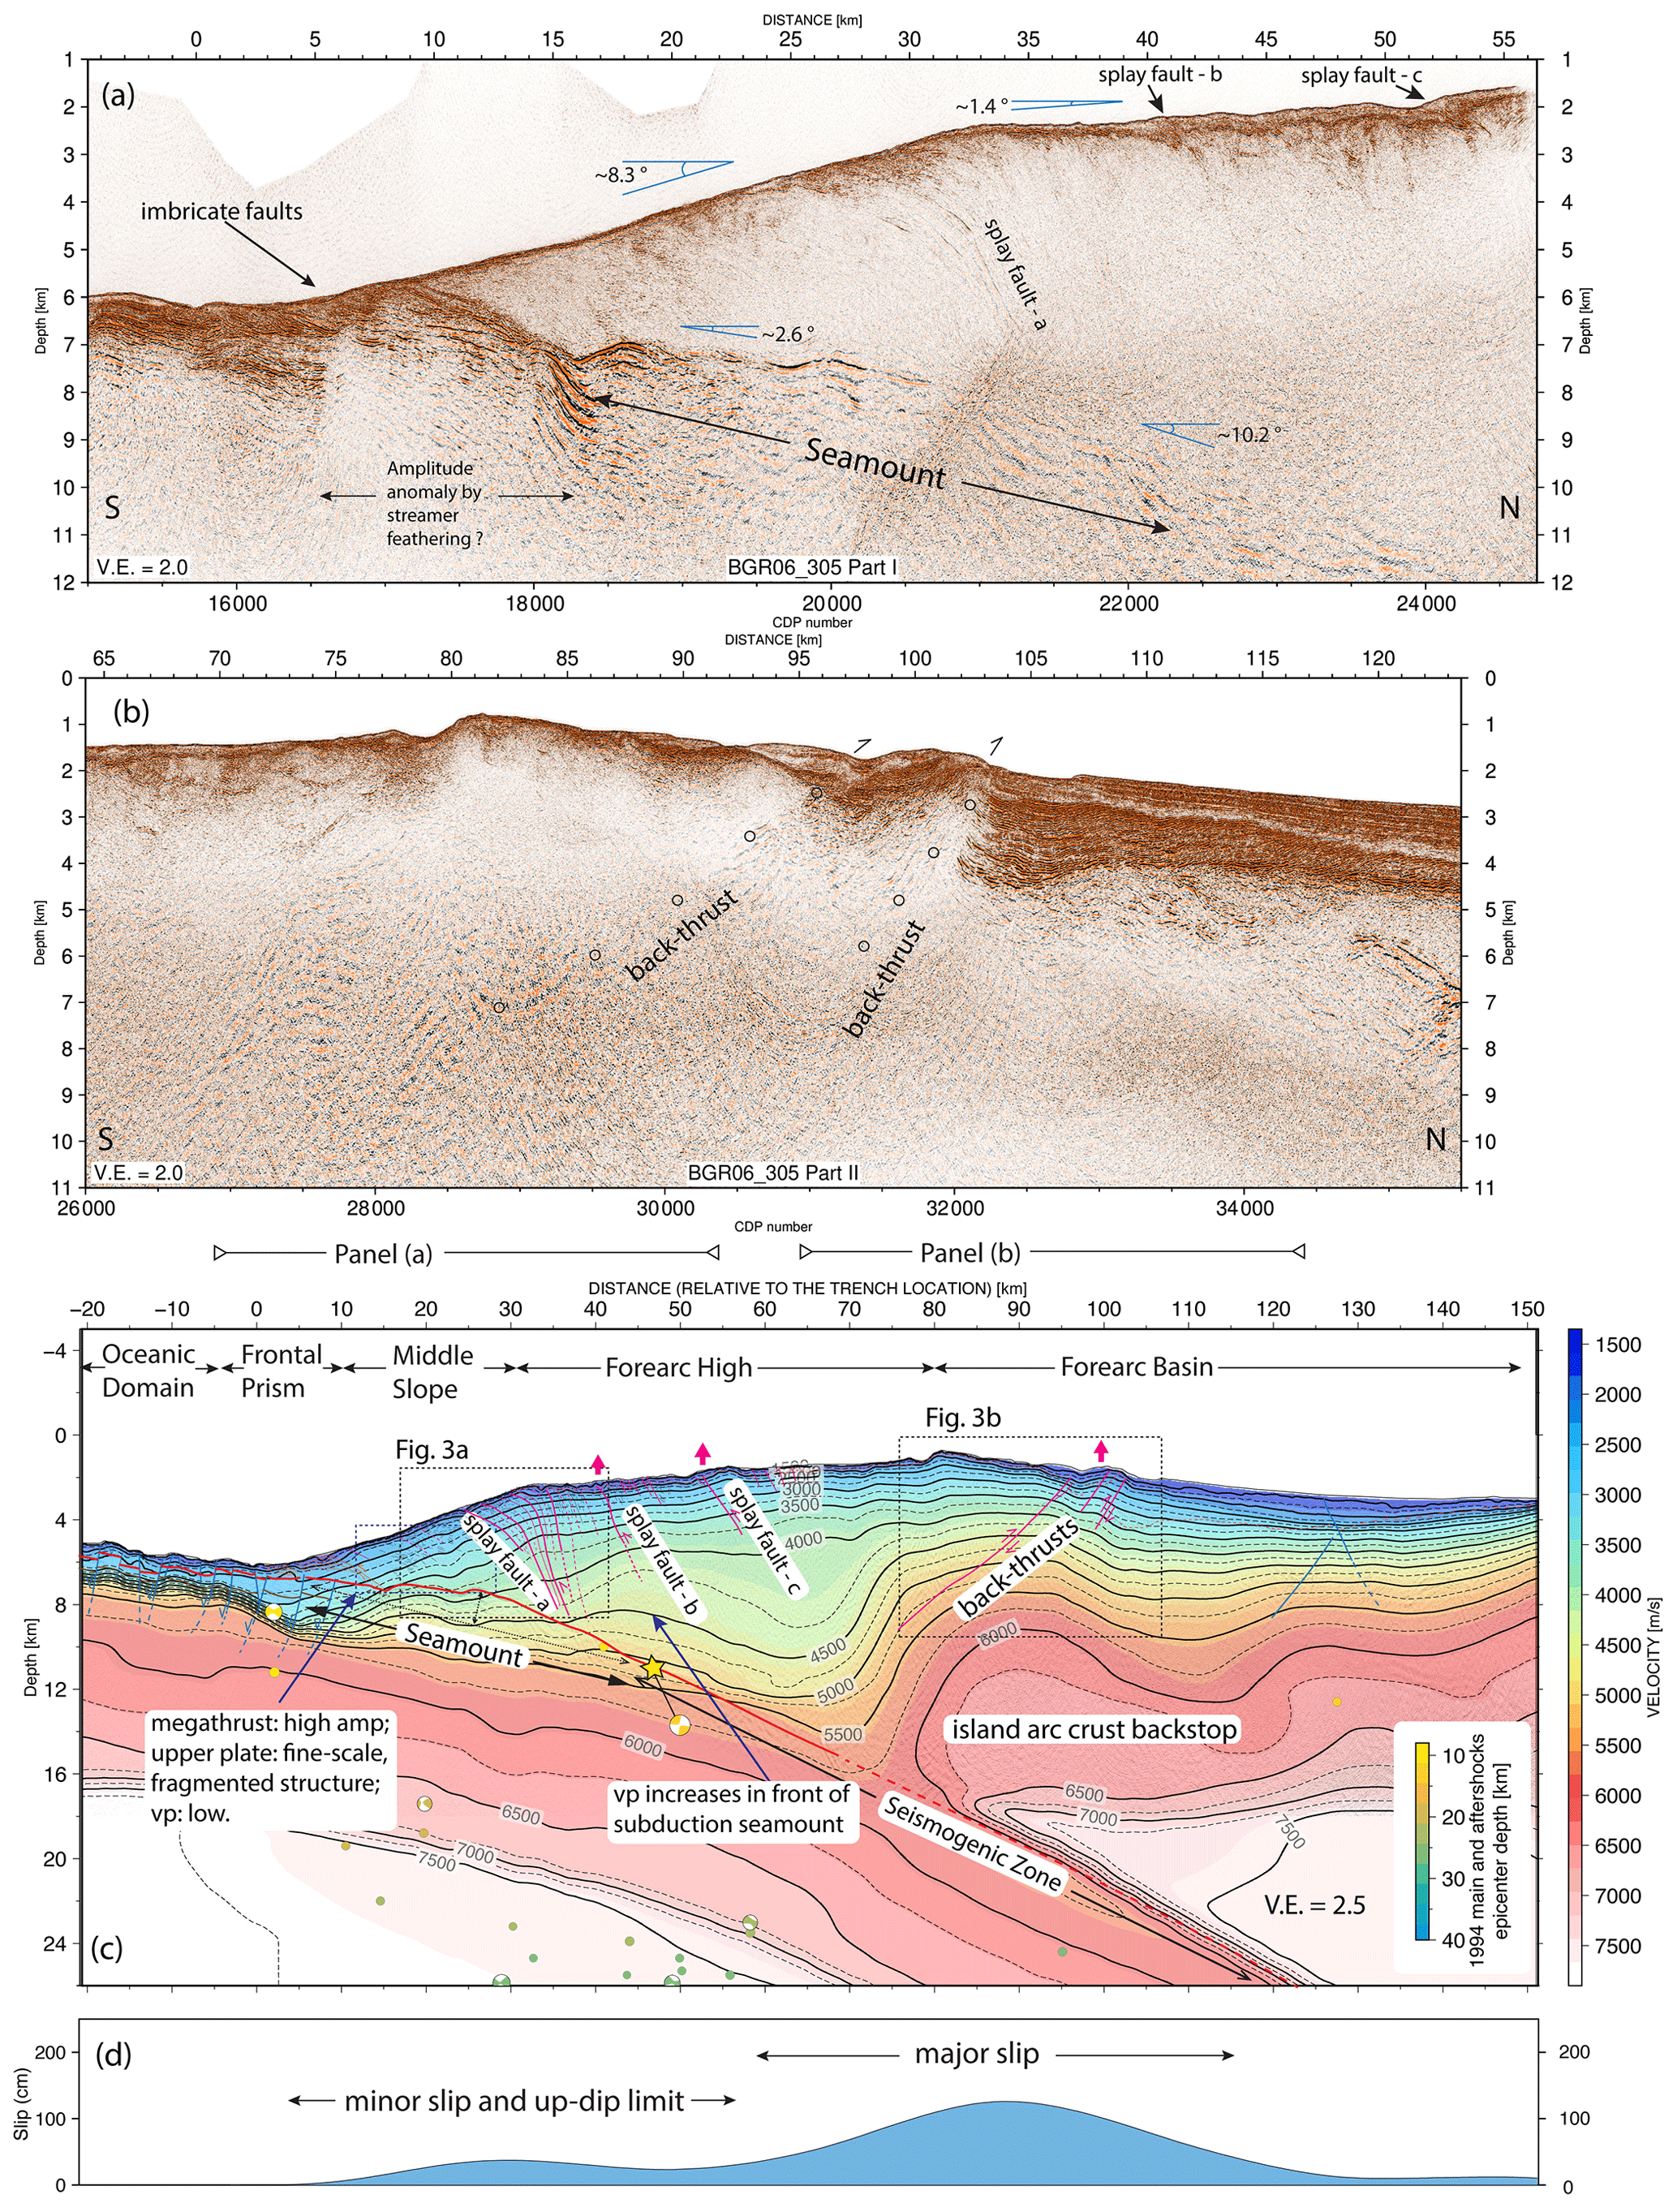
Figure 2(a) Pre-stack depth-migrated section of seismic profile SO190 BGR06_305 from the trench to the forearc high domain. (b) Pre-stack depth-migrated section of seismic profile SO190 BGR06_305 covering the transition from the forearc high to the forearc basin.(c) Seismic section overlain by the vp model (based on MCS reflection tomography above 3 km depth, velocities below from Shulgin et al., 2011; see Fig. S5), our structural interpretation, and the aftershock seismicity (from catalogue ISC-EHB Bulletin; Engdahl et al., 2020) of the 1994 Java tsunami earthquake. The hypocentre is marked as a yellow star. Coloured circles and beach balls are aftershocks (time span: 3 June 1994–14 October 1994) from the ISC-EHB Bulletin catalogue (Engdahl et al., 2020) and focal mechanisms from the gCMT catalogue (Dziewonski et al., 1981; Ekström et al., 2012). The well-developed forearc high (75–100 km) results from back-thrusting above the island arc crust backstop. A subducting seamount between kilometres 5–45 is overlain by upper plate splay faults. (d) Co-seismic slip model of the 1994 earthquake along the profile (Bilek and Engdahl, 2007). Peak slip occurred underneath the backstop (55–105 km) and decreased towards the subducting seamount (5–45 km).
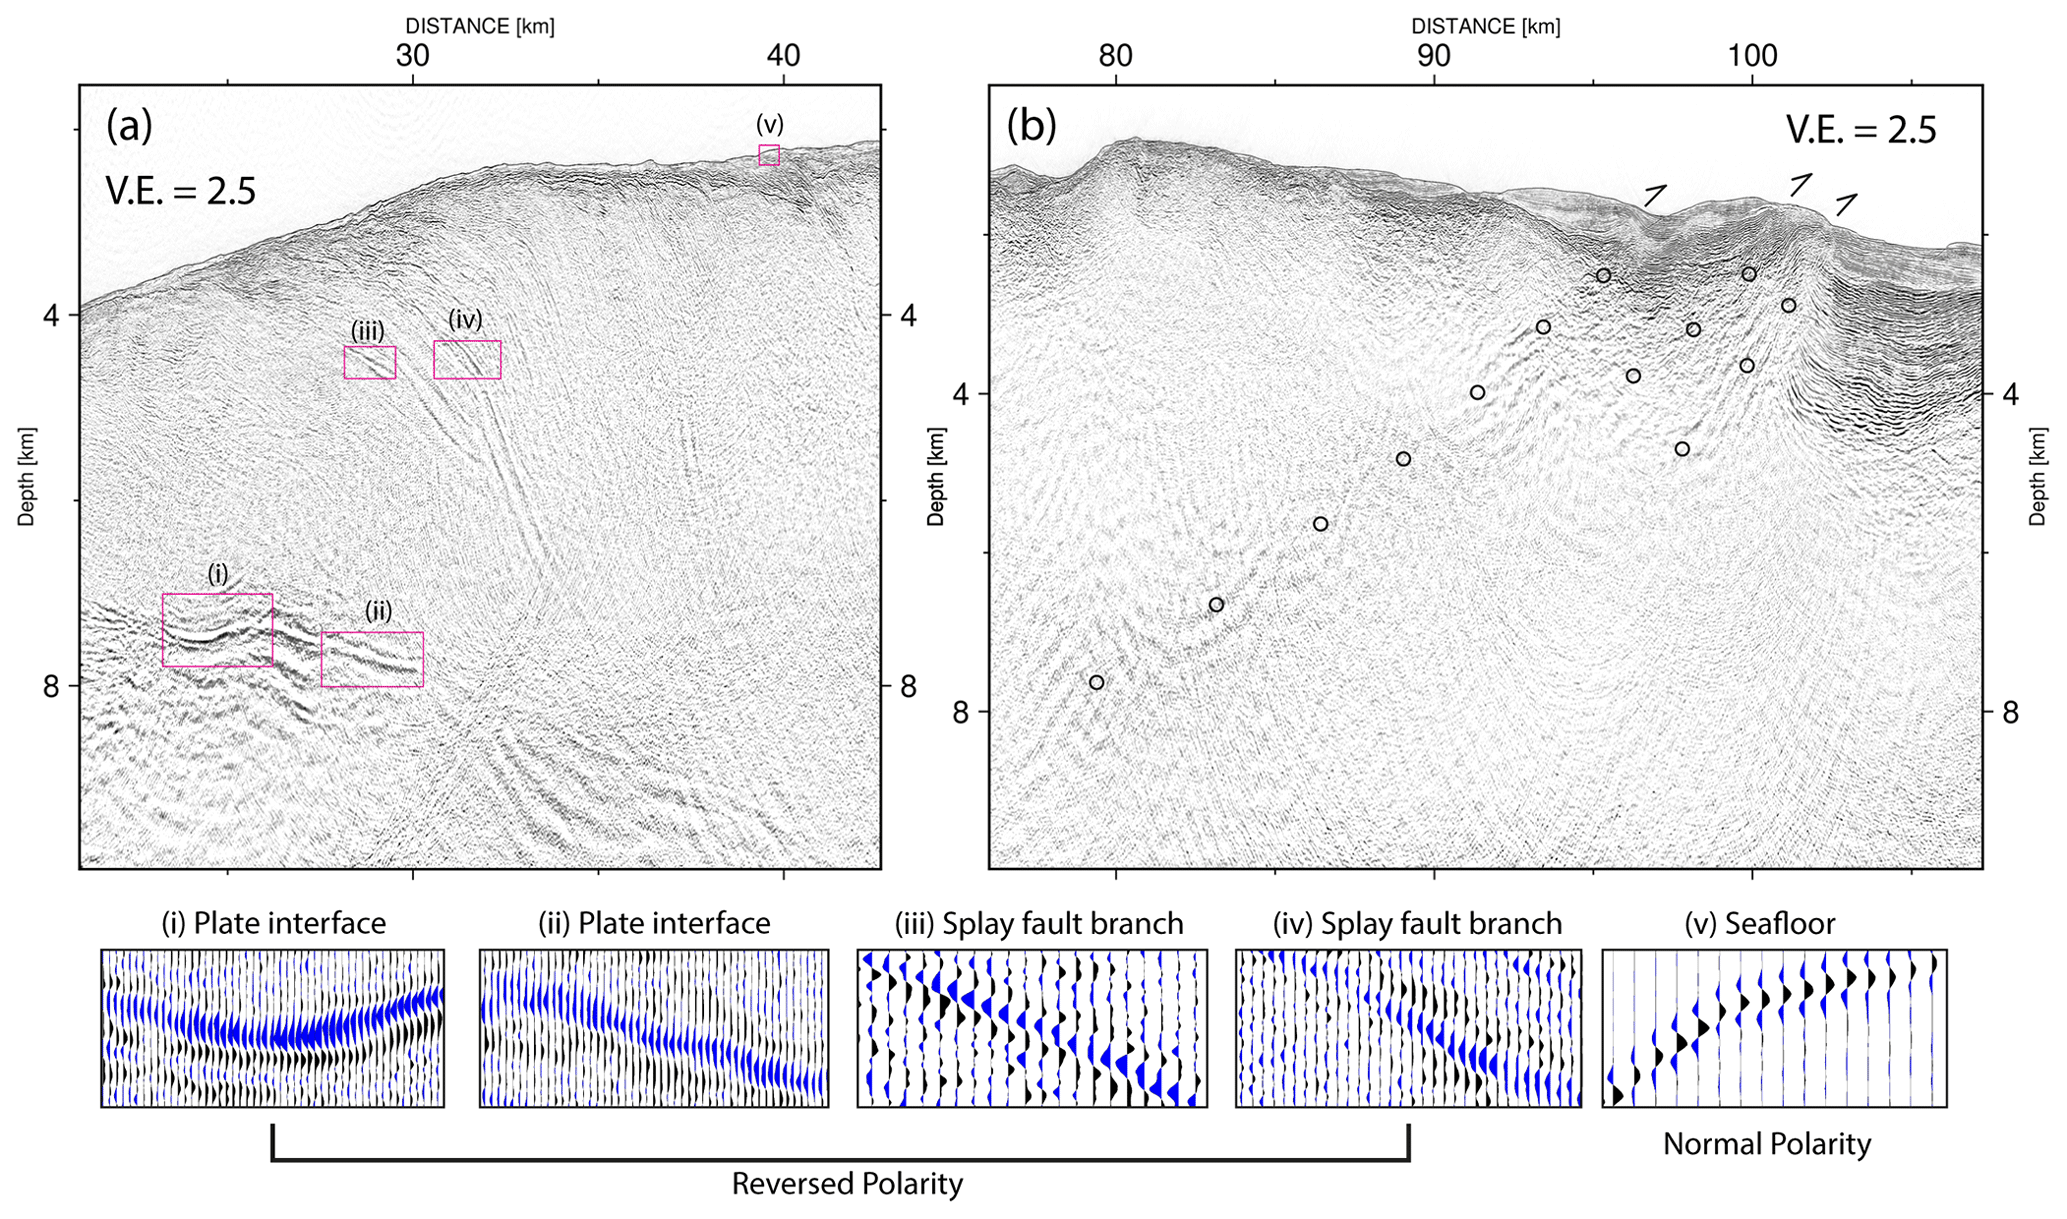
Figure 3(a) Seismic section with a close-up view of the splay fault a (compare Fig. 2c for location) branching from the landward side of the subducting seamount. Red boxes indicate close-up views shown in the lower panels. Reversed polarity reflections (relative to the seafloor) are observed at the plate interface seaward of the seamount and along the splay fault. The black and blue colours present positive and negative wavelet polarity, respectively. (b) Seismic section with a close-up view of the back-thrust (compare Fig. 2c for location). Black circles mark the back-thrust fault planes.
The oceanic Indo-Australian Plate off Java features a large number of seamounts and oceanic plateaus (e.g. the Roo Rise) that form the northern extension of the Christmas Island Seamount Province (Fig. 1a). In the region of the 1994 earthquake, oceanic basement relief breaching the sediment infill is observed in the trench and currently colliding with the marine forearc (Fig. 1b) (Masson et al., 1990; Kopp, 2011). The oceanic plate, which locally carries up to 1000 m of sediment, is shaped by bending related normal faults. The normal faults repeatedly offset the oceanic basement and shallow trench sediments, including the seamounts, leading to prominent seafloor escarpments (Fig. 1b). From around kilometre 5 landward of the trench, the décollement forms a ∼40 km wide bulge or topographic elevation (Fig. 2c). The dip angle of the subducting oceanic basement increases from 2.6∘ on the seaward side of the bulge to ∼10.2∘ on its landward side (Fig. 2a). With a height of ∼2 km (Fig. 2) and a possible width of 40 km (interpreted from the bathymetry and free-air gravity; Fig. 1b–c), this large subducting ridge or seamount (hereafter referred to as seamount) corresponds to some of the broad and wide topographic highs observed in the seafloor bathymetry that are associated with the Christmas Island Seamount Province (Fig. 1a). The seismic reflection pattern of the plate boundary differs substantially up-dip and down-dip of the seamount (Fig. 2a). High amplitude and negative polarity patches are imaged on the seaward side of the seamount crest (Figs. 2a, 3a, kilometres: 15–30), and associated a low vp (2500–3500 m s−1) in the outermost forearc (Fig. 2c, depth 6–8 km, kilometres: 15–30). On the landward side, an increased vp (4000–5000 m s−1) is inferred from the wide-angle seismic data (Shulgin et al., 2011) at the leading edge of the seamount (Fig. 2c, kilometres: 35–60, depth: 8–12 km) followed by a slight decrease farther landward (kilometres: 60–70, depth: 12–14 km).
Below the lowermost continental slope (Fig. 2a, kilometres: 0–12), a distinct set of landward-dipping imbricate faults with high amplitudes defines the actively deforming frontal prism. The internal structure of the middle slope regime (Fig. 2a, kilometres: 12–32) is characterized by lower amplitudes and an overall fine-scale fragmented reflection pattern (Fig. 2a). Comparable imbricate faults are much less distinct underneath the middle slope (Fig. 2a) than underneath the frontal prism. Both the frontal prism and middle slope domain host a steep seafloor with an inclination of about 8.3∘ (Fig. 2a, c). A distinct change in the slope of the seafloor at kilometre 32 defines the transition from the steeply inclined middle slope to the almost flat forearc high that extends between kilometres 32–102 (Fig. 2). The transition correlates with a prominent splay fault system that connects from the landward flank of the subducting seamount to the seafloor (Fig. 2a, c: “splay fault – a”, and 3a). At shallow depths (<5 km), the main splay fault divides into several branches that crop out at the seafloor between kilometres 24–30 (Figs. 2a, c, 3a). Reversed polarity reflections relative to the seafloor are observed along the splay fault branches (Fig. 3a, insets iii and iv). At kilometres 40 and 52 in the forearc high, splay faults are also imaged from the seafloor to a depth of 3.5 km below the seafloor (Fig. 2a, c: “splay fault b” and “splay fault c”. The transition from the forearc high into the forearc basin (Fig. 2, kilometres: 95–105) is defined by a pronounced back-thrust (Figs. 2b, c, and 3b). The back-thrust dips seaward and is traced to 9–12 km depth, where seismic resolution diminishes and blurs a possible connection to the plate boundary below (Figs. 2b, 3b). It offsets the shallow sediments (vertical throw of 600 m) and links to a compressional ridge at the seafloor (Figs. 1b, 2b, 3b, 4b).
A distinct positive gravity anomaly outlines the forearc high (dashed rectangle in Fig. 1c). This anomaly, however, does not correlate with a subducting topographic feature, as suggested in previous studies (Abercrombie et al., 2001; Bilek and Engdahl, 2007). Projected onto the seismic line (Fig. 2b), it correlates with a prominent block of high vp (6–7 km s−1) in the island arc crust that has been interpreted as a forearc backstop (Shulgin et al., 2011). The above-mentioned back-thrust evolves along the edge of this high-velocity feature (Figs. 2c and 5). A smaller, circular positive gravity anomaly is visible farther up-dip close to the deformation front (red dashed circle in Fig. 1c). This anomaly correlates to the shallow subducting seamount under the middle slope identified in the seismic line.
The depth section of seismic line SO190 BGR06_305 (Fig. 2a–b), which is based on advanced seismic processing techniques, resolves the tectonic structure in the region of the 1994 Java tsunami earthquake at a level of detail that largely exceeds earlier studies (Lüschen et al., 2011; Shulgin et al., 2011). In contrast to Lüschen et al. (2011), who interpreted multiple small subducting seamounts in the shallow subduction zone, the improved imaging quality of the seismic profile reveals a single broad subducting seamount at the shallow plate boundary seaward of the forearc high. The distinct change in the dip of the décollement from ∼2.6∘ under the outermost forearc to >10∘ seaward of kilometre 40 outlines the flanks of the seamount. The seamount modulates the seafloor bathymetry, causing a small circular bathymetric elevation (red circle in Fig. 1b) and is further manifested in the circular free-air gravity anomaly close to the trench (red circle in Fig. 1c). Consistent with other well-imaged subducting seamounts (e.g. Kodaira et al., 2000; Bell et al., 2010) and results from analogue and numerical modelling (Ruh et al., 2016; Sun et al., 2020), we observe intensified compressional features at the leading edge of the seamount (Fig. 2a, c, kilometres: 32–65). In contrast, gravitational relaxation (e.g. decreased vp, fine-scale fragmented internal reflection, and high plate-boundary amplitudes with reversed polarity) is observed at the trailing edge of and above the seamount (Fig. 2a, c, kilometres: 15–32). Based on the extent of the seamount (2 km high, possibly 40 km wide) and the moderate crest angle (∼10∘), we speculate that the true dimension of the seamount is even larger (∼40–60 km) as the seismic line might only cross the seamount's eastern flank (compare the location of the bathymetry and gravity anomaly in Fig. 1c).
In the seismic profile, we observe splay faults, which feature seismic reflections with a strong amplitude, merging at the landward side of the seamount (Figs. 2a, c: splay fault a, b, and c, 3a, 4b). The reversed reflection polarity on the splay fault branches and shallow décollement (Fig. 3a) suggest that these faults act as fluid conduits and are weak, likely due to high porosity and high fluid content. Splay fault b (Fig. 2a) causes a minor seafloor offset in the seismic section, while splay fault c offsets the seafloor by ∼500 m as seen both in the seismic section (Fig. 2a) and bathymetry map (Fig. 4b), indicating recent activity. Generically, splay faults form when the primary fault, in this case the plate interface, becomes critically misaligned with the original principal stresses on the optimum plane (Scholz et al., 2010). Though a variety of scenarios could result in such a change of principal stress, we note that the structural modification of the plate boundary dipping angle induced by the subducting seamount at its leading edge will cause such a misalignment of the primary stress with the basal fault and further enhances the vertical thickening and lateral shortening of the upper plate (Lallemand and Le Pichon, 1987).
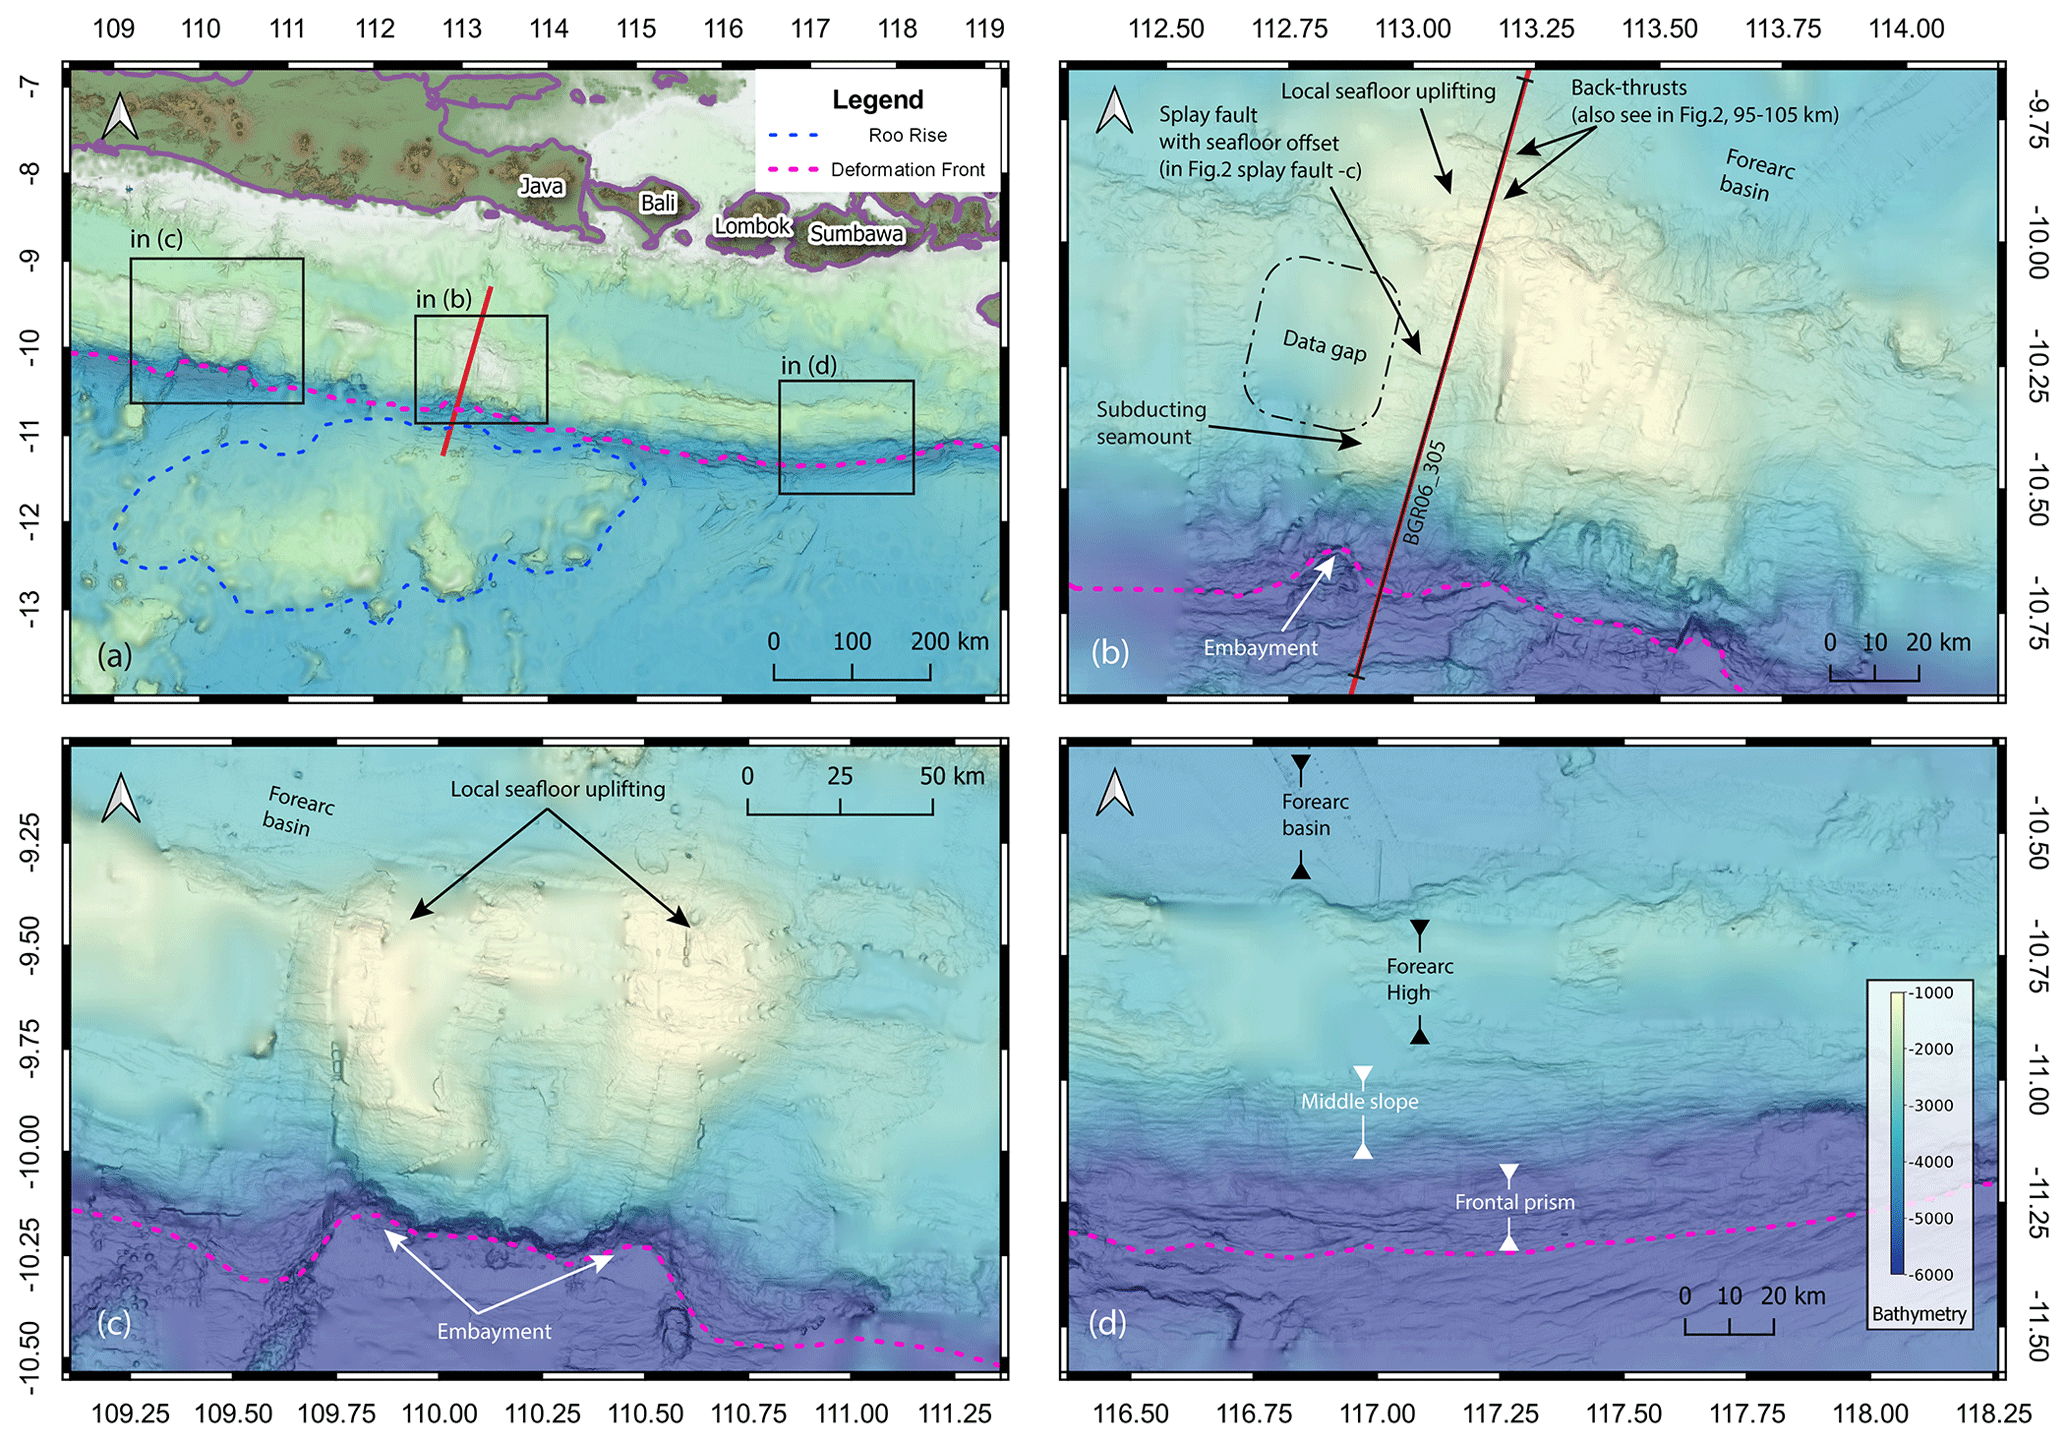
Figure 4Global satellite bathymetry merged with ship-based multibeam data along the Java margin and Lesser Sunda islands (Bali, Lombok, and Sumbawa). Black squares indicate locations of close-up views in (b–d); red line indicates location of MCS profile BGR06_305 discussed in this study. (a) Bathymetry from 108.5 to 119.5∘ E. The accretionary wedge from 109 to 115∘ E is deformed and disturbed by the subducting seamounts and ridges associated with the Roo Rise. In comparison, the accretionary wedge from 115 to 119∘ E forms a more homogeneous structure compared to the western area. (b) A close-up view of the bathymetry in the vicinity of MCS profile BGR06_305. An embayment of the deformation front is observed at the trailing edge of the subducting seamount. A thrust fault offsets the seafloor landward of the seamount. The forearc high and the southern margin of the forearc basin experience uplift to a water depth less than 1000 m. (c) A close view of the seafloor bathymetry off central Java. The accretionary wedge and forearc high are uplifted to shallow water depth of ∼750 m, and the deformation front is characterized by a large embayment at the trench. (d) The seafloor bathymetry map off the coast of Lombok–Sumbawa reveals a much more homogenous accretionary wedge compared to its western counterparts.
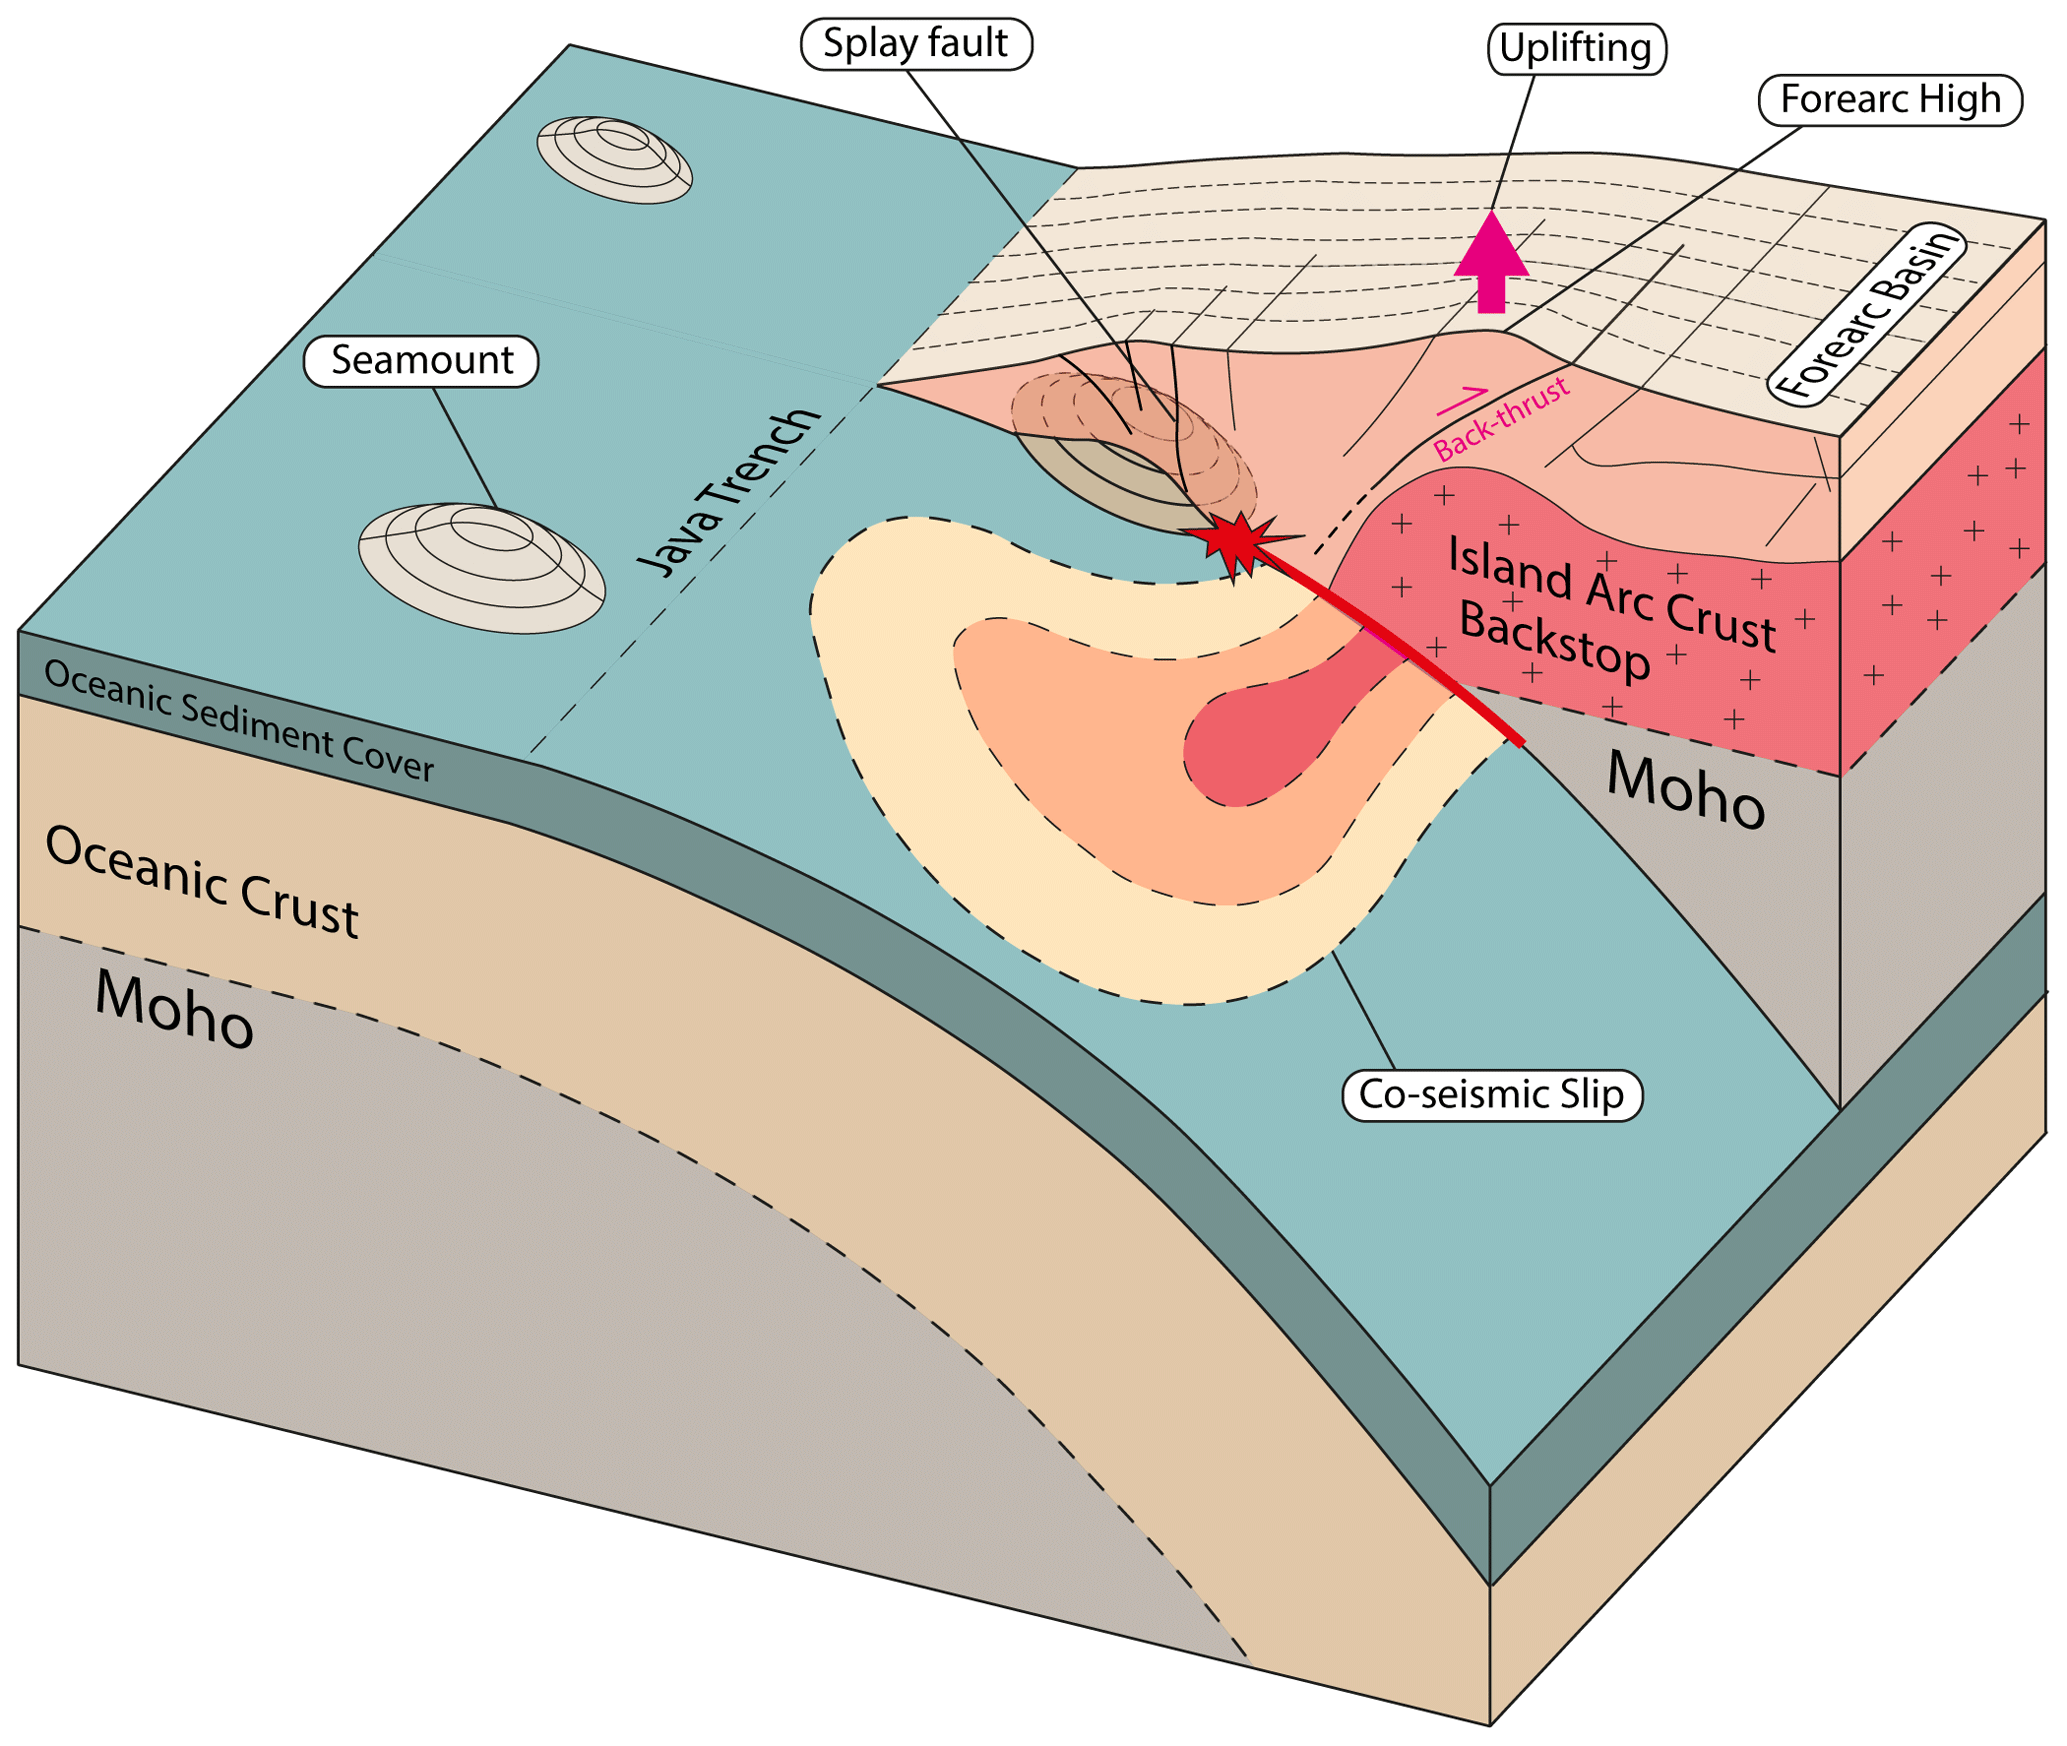
Figure 5Conceptual seismo-tectonic model of the eastern Java margin in the region of the 1994 tsunami earthquake. Back-thrusting above the island arc crust backstop causes locally enhanced uplift of the forearc high. The 1994 hypocentre (red star) originated at the leading edge of a subducting seamount. The seamount stalled the co-seismic slip propagation locally along the plate boundary.
The forearc high in the region of the 1994 Java tsunami earthquake is more evolved (i.e. shallower seafloor) compared to the adjacent regions along the margin (Fig. 1). This, in combination with the collocated gravity anomaly (dashed rectangle in Fig. 1b–c; kilometres: 75–105 in Fig. 2b), has fostered speculations about the presence of a subducting seamount in the peak slip region of the 1994 earthquake (e.g. Abercrombie et al., 2001). The re-processed seismic reflection image, however, suggests that the shallow forearc high is associated with lateral shortening and vertical thickening of the upper plate ahead of a seamount currently underthrust at shallow depth. Regional uplift of the forearc slope might be enhanced by the presence of an island arc backstop (Byrne et al., 1993). The backstop underneath the forearc high is expressed as a high vp block interpreted as crystalline island arc crust due to its vp of 6–7 km s−1 (Shulgin et al., 2011). The strong lateral velocity gradient underneath the crest of the forearc high is associated with an abrupt change in material properties, manifested in back-thrusting along the well-imaged fault plane (Fig. 3b–c) and the development of thrust ridges in the bathymetry at the seafloor outcrop of the back-thrust fault (Figs. 1b and 4b). Along this line of argumentation, the mature forearc high reaching shallower water depths compared to its vicinity (Figs. 1b and 4b), in the peak slip region of the 1994 Java tsunami earthquake, likely results from the combined effect of increased horizontal stress (pushing) ahead of the seamount and the presence of island arc crust serving as a rigid backstop. The resulting shortening and thickening of the upper plate are elucidated through a series of seaward vergent upper plate splay faults above the seamount and at least two well-imaged landward vergent backthrusts along the edge of the island arc backstop.
The rugged topography of the marine forearc in the central-eastern Java segment of the Sunda margin between 110–115∘ E stands in contrast to adjacent regions off the coast of western Java or the Lesser Sunda islands (Kopp, 2011). Figure 4 shows high-resolution bathymetric data acquired during cruises SO176, SO179, and SO190 with R/V Sonne, merged with global satellite bathymetry (GEBCO, 2020). The subduction of the pronounced seafloor relief of the Christmas Island Seamount province literally breaks up the formerly coherent slopes of the forearc (Fig. 4a), as observed to the west and east. This is evident from the crooked trend of the deformation front in this segment (Fig. 4b–c) compared to the uniformly developed lower and middle slope to the east (Fig. 4d). Between 110–114∘ E the pronounced forearc basin found off the coast of western Java and the Lesser Sunda islands is virtually squeezed together, as the forearc high and middle and lower slopes are offset to the north (Figs. 1a, 4a). These regional-scale processes are associated with local seafloor uplift, as observed in our study area (Fig. 4b) or around 110∘ E (Fig. 4c), where water depth above the forearc high is even shallower (750 m). It should be noted in this context, though, that the 2006 Java tsunami earthquake (Ammon et al., 2006; Bilek and Engdahl, 2007), for which the reactivation of splay faults has been discussed (Fan et al., 2017), occurred west of the subduction of the Christmas Island Seamount province at 107.4∘ E and that splay faults have also been imaged off the coast of the Sunda Strait and western Java (Kopp and Kukowski, 2003).
Abercrombie et al. (2001) and Bilek and Engdahl (2007) relocated the 1994 hypocentre and modelled the co-seismic slip. Both studies share a similar event location and a grossly similar characteristic of the co-seismic slip models. The relocated hypocentre of the 1994 earthquake and the main co-seismic slip patch are located at the leading edge of the shallow subducting seamount (Fig. 1). The co-seismic slip further seems to taper around the subducting seamount, whereas in the seamount region (red dashed circle in Fig. 1b), the slip value decreases significantly (Figs. 1b, 2c–d, kilometres: 5–45). These observations lead us to reconsider if the 1994 Java tsunami earthquake ruptured across a subducting seamount or if the seamount might have played a different role in the event. From numerical models, there is evidence that subducting seamounts induce overpressures and increase shear stress at their leading edge in a region that is equivalent to their own size (Ruh et al., 2016). This would be approximately 1250 km2 for a seamount of over 40 km in diameter, as is the one observed, which could be enough to generate an earthquake of M 7–8 (Blaser et al., 2010). From this, we conclude that increased shear stress in front of the subducting seamount may have preconditioned the 1994 Java tsunami earthquake.
The warping of the slip model isolines around the subducting seamount (Fig. 1b) indicates that the seamount acted as a geometrical barrier at shallow depth during the co-seismic phase. Along the seismic section BGR06_305, the co-seismic slip value tracked from the model of Bilek and Engdahl (2007) illustrates a low slip value in the seamount region, compared to a much higher value further down-dip (Fig. 2d). Yang et al. (2012, 2013) modelled a dynamic rupture scenario with a seamount as a seismic barrier. The seamount imaged on our seismic profile may have halted seismic rupture at its leading edge, while rupture might have progressed closer to the trench to the west and east of the seamount (Figs. 1b and 5). Due to the lack of 3D seismic coverage of the rupture area, the exact structural control on the three-dimensional evolution of the rupture cannot be constrained. A similar mechanism of plate boundary rupture terminating against subducting lower plate relief is, however, discussed for the 2006 Java tsunami earthquake (Bilek and Engdahl, 2007) as well as numerous other plate boundary events (Wang and Bilek, 2011, and references therein).
A re-processed multichannel seismic reflection image with effective seafloor multiple suppression and a combined subsurface velocity from reflection and refraction tomography reveals a large subducting seamount at shallow depth (2–8 km below seafloor) trench-ward of the rupture area of the 1994 Java tsunami earthquake. Lateral shortening and vertical thickening of the upper plate control the uplift of the forearc high, manifested in active back-thrusting along distinct fault planes above the island arc crust backstop (Fig. 5). The 1994 earthquake main shock hypocentre and main co-seismic slip patch were located in front of the shallow subducting seamount. The wrapping of the co-seismic slip contours around this seamount suggests that it may have acted as a seismic barrier during the 1994 Java tsunami earthquake (Fig. 1). These observations suggest that the seamount diverted the co-seismic rupture propagation in the up-dip direction and document the control of the shallow marine forearc structure on co-seismic rupture distribution (Fig. 5).
The pre-stack depth migration section of the profile BGR06_305 is available upon reasonable request. Bathymetric data from R/V Sonne cruise SO190 can be requested through the German Bundesamt für Seeschifffahrt und Hydrographie (2021, BSH; http://www.bsh.de). Aftershock data displayed in Figs. 1b and 2c are available through the ISC-EHB Bulletin catalogue (https://doi.org/10.31905/PY08W6S3; Engdahl et al., 2020). Focal mechanisms are available through the gCMT catalogue (https://www.globalcmt.org/; Dziewonski et al., 1981; Ekström et al., 2021). The free-air gravity data shown in Fig. 1c are available through https://topex.ucsd.edu/marine_grav/mar_grav.html (Sandwell et al., 2014).
The supplement related to this article is available online at: https://doi.org/10.5194/se-12-2467-2021-supplement.
YX and DK performed the computations and are responsible for the main processing. YX, JG, DK, BM, MR, MS, DL and HK helped to strengthen the overall scope and added to interpretational aspects and the discussion of the presented results. MS made the data available and was responsible for the navigation and geometry processing. YX, JG, and HK wrote the article, and all authors contributed equally to proofreading and final preparation of the paper.
The contact author has declared that neither they nor their co-authors have any competing interests.
Publisher’s note: Copernicus Publications remains neutral with regard to jurisdictional claims in published maps and institutional affiliations.
The seismic data were processed with Schlumberger's Omega2 seismic processing suite OMEGA and Seismic Unix – an open-source software package for seismic research and processing, Centre for Wave Phenomena, Colorado School of Mines. Bathymetry and seismic images are plotted by the Generic Mapping Tools (GMT). We thank Susan L. Bilek, and Rachel E. Abercrombie for sharing the co-seismic slip models of the 1994 Java tsunami earthquake. We thank Nathan L. Bangs and Sara Martínez-Loriente for insightful comments and suggestions that helped us improve the paper. Figs. 1 and 4 were prepared using GMT (Wessel et al., 2019).
This research has been supported by the Bundesministerium für Bildung und Forschung (grant nos. 03G0190A and 03G0190B) and the China Scholarship Council (grant no. 201506400067).
The article processing charges for this open-access publication were covered by the GEOMAR Helmholtz Centre for Ocean Research Kiel.
This paper was edited by Mark Allen and reviewed by Sara Martínez-Loriente and Nathan Bangs.
Abercrombie, R. E., Antolik, M., Felzer, K., Ekstrom, G., and Ekström, G.: The 1994 Java tsunami earthquake: Slip over a subducting seamount, J. Geophys. Res. Solid Earth, 106, 6595–6607, https://doi.org/10.1029/2000jb900403, 2001.
Ammon, C. J., Kanamori, H., Lay, T., and Velasco, A. A.: The 17 July 2006 Java tsunami earthquake, Geophys. Res. Lett., 33, 1–5, https://doi.org/10.1029/2006GL028005, 2006.
Bell, R., Sutherland, R., Barker, D. H. N., Henrys, S., Bannister, S., Wallace, L., and Beavan, J.: Seismic reflection character of the Hikurangi subduction interface, New Zealand, in the region of repeated Gisborne slow slip events, Geophys. J. Int., 180, 34–48, https://doi.org/10.1111/j.1365-246X.2009.04401.x, 2010.
Bilek, S. L. and Engdahl, E. R.: Rupture characterization and aftershock relocations for the 1994 and 2006 tsunami earthquakes in the Java subduction zone, Geophys. Res. Lett., 34, L20311, https://doi.org/10.1029/2007GL031357, 2007.
Bilek, S. L. and Lay, T.: Tsunami earthquakes possibly widespread manifestations of frictional conditional stability, Geophys. Res. Lett., 29, 1–4, https://doi.org/10.1029/2002GL015215, 2002.
Blaser, L., Krüger, F., Ohrnberger, M., and Scherbaum, F.: Scaling relations of earthquake source parameter estimates with special focus on subduction environment, Bull. Seismol. Soc. Am., 100, 2914–2926, https://doi.org/10.1785/0120100111, 2010.
Bundesamt für Seeschifffahrt und Hydrographie (BSH): Homepage, available at: https://www.bsh.de/, last access: 25 October 2021.
Byrne, D. E., Wang, W., and Davis, D. M.: Mechanical role of backstops in the growth of forearcs, Tectonics, 12, 123–144, https://doi.org/10.1029/92TC00618, 1993.
Dziewonski, A. M. and Anderson, D. L.: Preliminary reference Earth model, Phys. Earth Planet. Inter., 25, 297–356, https://doi.org/10.1016/0031-9201(81)90046-7, 1981 (data available at: https://www.globalcmt.org/, last access: 4 December 2018).
Ekström, G., Nettles, M., and Dziewoński, A. M.: The global CMT project 2004–2010: Centroid-moment tensors for 13,017 earthquakes, Phys. Earth Planet. Inter., 200–201, 1–9, https://doi.org/10.1016/j.pepi.2012.04.002, 2012 (data available at: https://www.globalcmt.org/, last access: 4 December 2018).
Engdahl, E. R., Di Giacomo, D., Sakarya, B., Gkarlaouni, C. G., Harris, J., and Storchak, D. A.: ISC-EHB 1964–2016, an Improved Data Set for Studies of Earth Structure and Global Seismicity, Earth Sp. Sci., 7, 1–13, https://doi.org/10.1029/2019EA000897, 2020 (data available at: https://doi.org/10.31905/PY08W6S3).
Fan, W., Bassett, D., Jiang, J., Shearer, P. M., and Ji, C.: Rupture evolution of the 2006 Java tsunami earthquake and the possible role of splay faults, Tectonophysics, 721, 143–150, https://doi.org/10.1016/j.tecto.2017.10.003, 2017.
GEBCO Bathymetric Compilation Group 2020: The GEBCO_2020 Grid – a continuous terrain model of the global oceans and land. British Oceanographic Data Centre, National Oceanography Centre [data set], NERC, UK, https://doi.org/10/dtg3, 2020.
Geersen, J.: Sediment-starved trenches and rough subducting plates are conducive to tsunami earthquakes, Tectonophysics, 762, 28–44, https://doi.org/10.1016/j.tecto.2019.04.024, 2019.
Guitton, A. and Verschuur, D. J.: Adaptive subtraction of multiples using the L1-norm, Geophys. Prospect., 52, 27–38, 2004.
Hananto, N. D., Leclerc, F., Li, L., Etchebes, M., Carton, H., Tapponnier, P., Qin, Y., Avianto, P., Singh, S. C., and Wei, S.: Tsunami earthquakes: Vertical pop-up expulsion at the forefront of subduction megathrust, Earth Planet. Sci. Lett., 538, 1–14, https://doi.org/10.1016/j.epsl.2020.116197, 2020.
Kanamori, H.: Mechanism of tsunami earthquakes, Phys. Earth Planet. Inter., 6, 346–359, https://doi.org/10.1016/0031-9201(72)90058-1, 1972.
Kodaira, S., Takahashi, N., Nakanishi, A., Miura, S., and Kaneda, Y.: Subducted seamount imaged in the rupture zone of the 1946 Nankaido earthquake, Science 289, 104–106, https://doi.org/10.1126/science.289.5476.104, 2000.
Kopp, H., Flueh, E. R., Petersen, C. J., Weinrebe, W., Wittwer, A., and Meramex Scientists: The Java margin revisited: Evidence for subduction erosion off Java, Earth Planet. Sci. Lett., 242, 130–142, https://doi.org/10.1016/j.epsl.2005.11.036, 2006.
Kopp, H.: The Java convergent margin: Structure, seismogenesis and subduction processes, Geol. Soc. Spec. Publ., 355, 111–137, https://doi.org/10.1144/SP355.6, 2011.
Kopp, H. and Kukowski, N.: Backstop geometry and accretionary mechanics of the Sunda margin, Tectonics, 22, 1072, https://doi.org/10.1029/2002TC001420, 2003.
Lallemand, S. and Le Pichon, X.: Coulomb wedge model applied to the subduction of seamounts in the Japan Trench, Geology, 15, 1065–1069, https://doi.org/10.1130/0091-7613(1987)15<1065:CWMATT>2.0.CO;2, 1987.
Lüschen, E., Müller, C., Kopp, H., Engels, M., Lutz, R., Planert, L., Shulgin, A., Djajadihardja, Y. S.: Structure, evolution and tectonic activity of the eastern Sunda forearc, Indonesia, from marine seismic investigations, Tectonophysics, 508, 6–21, https://doi.org/10.1016/j.tecto.2010.06.008, 2011.
Martínez-Loriente, S., Sallarès, V., R. Ranero, C., B. Ruh, J., Barckhausen, U., Grevemeyer, I., and Bangs, N.: Influence of Incoming Plate Relief on Overriding Plate Deformation and Earthquake Nucleation: Cocos Ridge Subduction (Costa Rica), Tectonics, 38, 4360–4377, https://doi.org/10.1029/2019TC005586, 2019.
Masson, D. G., Parson, L. M., Milsom, J., Nichols, G., Sikumbang, N., Dwiyanto, B., and Kallagher, H.: Subduction of seamounts at the Java Trench: a view with long-range sidescan sonar, Tectonophysics, 185, 51–65, https://doi.org/10.1016/0040-1951(90)90404-V, 1990.
Müller, C. and Neben, S.: Research Cruise SO190 Leg 1, SINDBAD, Seismic and geoacoustic investigations along the Sunda-Banda Arc transition (Seismische und geoakustische Untersuchungen entlang des Übergangs vom Sunda- zum Banda-Bogen) with RV SONNE, Jakarta, Indonesia 9 October, Bundesanstalt für Geowissenschaften und Rohstoffe, Hannover, Germany, 142, https://doi.org/10.2312/cr_so190_1, 2006.
Planert, L., Kopp, H., Lueschen, E., Mueller, C., Flueh, E. R., Shulgin, A., Djajadihardja, Y., and Krabbenhoeft, A.: Lower plate structure and upper plate deformational segmentation at the Sunda-Banda arc transition, Indonesia, J. Geophys. Res.-Sol. Ea., 115, 1–25, https://doi.org/10.1029/2009jb006713, 2010.
Polet, J. and Kanamori, H.: Shallow subduction zone earthquakes and their tsunamigenic potential, Geophys. J. Int., 142, 684–702, https://doi.org/10.1046/j.1365-246X.2000.00205.x, 2000.
Ruh, J. B., Sallarès, V., Ranero, C. R., and Gerya, T.: Crustal deformation dynamics and stress evolution during seamount subduction: High-resolution 3-D numerical modeling, J. Geophys. Res.-Sol. Ea., 121, 6880–6902, https://doi.org/10.1002/2016JB013250, 2016.
Sallarès, V. and Ranero, C. R.: Upper-plate rigidity determines depth-varying rupture behaviour of megathrust earthquakes, Nature, 576, 96–101, https://doi.org/10.1038/s41586-019-1784-0, 2019.
Sandwell, D. T., Müller, R. D., Smith, W. H. F., Garcia, E., and Francis, R.: New global marine gravity model from CryoSat-2 and Jason-1 reveals buried tectonic structure, Science, 346, 65–67, https://doi.org/10.1126/science.1258213, 2014 (data available at: https://topex.ucsd.edu/marine_grav/mar_grav.html, last access: 8 July 2021).
Satake, K., Fujii, Y., Harada, T., and Namegaya, Y.: Time and space distribution of co-seismic slip of the 2011 Tohoku earthquake as inferred from Tsunami waveform data, Bull. Seismol. Soc. Am., 103, 1473–1492, https://doi.org/10.1785/0120120122, 2013.
Satake, K. and Tanioka, Y.: Sources of Tsunami and Tsunamigenic Earthquakes in Subduction Zones, Pure Appl. Geophys., 154, 467–483, https://doi.org/10.1007/s000240050240, 1999.
Scholz, C. H., Ando, R., and Shaw, B. E.: The mechanics of first order splay faulting: The strike-slip case, J. Struct. Geol., 32, 118–126, https://doi.org/10.1016/j.jsg.2009.10.007, 2010.
Şen, A. T., Cesca, S., Lange, D., Dahm, T., Tilmann, F., and Heimann, S.: Systematic changes of earthquake rupture with depth: A case study from the 2010 Mw 8.8 Maule, Chile, earthquake aftershock sequence, Bull. Seismol. Soc. Am., 105, 2468–2479, https://doi.org/10.1785/0120140123, 2015.
Seno, T.: Tsunami earthquakes as transient phenomena, Geophys. Res. Lett., 29, 1419, https://doi.org/10.1029/2002gl014868, 2002.
Shulgin, A., Kopp, H., Mueller, C., Planert, L., Lueschen, E., Flueh, E. R., and Djajadihardja, Y.: Structural architecture of oceanic plateau subduction offshore Eastern Java and the potential implications for geohazards, Geophys. J. Int., 184, 12–28, https://doi.org/10.1111/j.1365-246X.2010.04834.x, 2011.
Sun, T., Saffer, D., and Ellis, S.: Mechanical and hydrological effects of seamount subduction on megathrust stress and slip, Nat. Geosci., 13, 249–255, https://doi.org/10.1038/s41561-020-0542-0, 2020.
Tanioka, Y. and Satake, K.: Tsunami generation by horizontal displacement of ocean bottom, Geophys. Res. Lett., 23, 861–864, https://doi.org/10.1029/96GL00736, 1996.
Tanioka, Y., Ruff, L., and Satake, K.: What controls the lateral variation of large earthquake occurrence along the Japan Trench?, Isl. Arc, 6, 261–266, https://doi.org/10.1111/j.1440-1738.1997.tb00176.x, 1997.
Tanioka, Y. and Seno, T.: Sediment effect on tsunami generation of the 1896 Sanriku Tsunami Earthquake, Geophys. Res. Lett., 28, 3389–3392, https://doi.org/10.1029/2001GL013149, 2001.
Tsuji, Y., Imamura, F., Matsutomi, H., Synolakis, C. E., Nanang, P. T., Jumadi, Harada, S., Han, S. S., Arai, K., and Cook, B.: Field survey of the East Java earthquake and tsunami of June 3, 1994, Pure Appl. Geophys. PAGEOPH, 144, 839–854, https://doi.org/10.1007/BF00874397, 1995.
Verschuur, D. J., Berkhout, A. J., and Wapenaar, C. P. A.: Adaptive surface-related multiple elimination, Geophysics, 57, 1166–1177, 1992.
von Huene, R., Miller, J. J., Klaeschen, D., and Dartnell, P.: A Possible Source Mechanism of the 1946 Unimak Alaska Far-Field Tsunami: Uplift of the Mid-Slope Terrace Above a Splay Fault Zone, Pure Appl. Geophys., 173, 4189–4201, https://doi.org/10.1007/s00024-016-1393-x, 2016.
Wang, K. and Bilek, S. L.: Do subducting seamounts generate or stop large earthquakes?, Geology, 39, 819–822, https://doi.org/10.1130/G31856.1, 2011.
Wendt, J., Oglesby, D. D., and Geist, E. L.: Tsunamis and splay fault dynamics, Geophys. Res. Lett., 36, 1–5, https://doi.org/10.1029/2009GL038295, 2009.
Wessel, P., Luis, J. F., Uieda, L., Scharroo, R., Wobbe, F., Smith, W. H. F., and Tian, D.: The Generic Mapping Tools Version 6, Geochemistry, Geophys. Geosystems, 20, 5556–5564, https://doi.org/10.1029/2019GC008515, 2019.
Yang, H., Liu, Y., and Lin, J.: Effects of subducted seamounts on megathrust earthquake nucleation and rupture propagation, Geophys. Res. Lett., 39, 2–7, https://doi.org/10.1029/2012GL053892, 2012.
Yang, H., Liu, Y., and Lin, J.: Geometrical effects of a subducted seamount on stopping megathrust ruptures, Geophys. Res. Lett., 40, 2011–2016, https://doi.org/10.1002/grl.50509, 2013.
Xia, Y., Klaeschen, D., Kopp, H., and Schnabel, M.: Reflection tomography by depth warping: A case study across the Java trench, Solid Earth Discuss. [preprint], https://doi.org/10.5194/se-2021-40, in review, 2021.