the Creative Commons Attribution 4.0 License.
the Creative Commons Attribution 4.0 License.
 | 20 Dec 2021
Deep oceanic submarine fieldwork with undergraduate students: an immersive experience with the Minerve software
Marianne Métois
Jean-Emmanuel Martelat
Jérémy Billant
Muriel Andreani
Javier Escartín
Frédérique Leclerc
We present the content and scripting of an active tectonic lab session conceived for third-year undergraduate students studying Earth sciences at Observatoire des Sciences de l'Univers in Lyon. This session is based on a research project conducted on the submarine Roseau active fault in the Lesser Antilles. The fault morphology is particularly interesting to map as this structure in the deep ocean is preserved from weathering. Thus, high-resolution models computed from remotely operated vehicle (ROV) videos provide exceptional educational material to link fault morphology and coseismic displacement. This class includes mapping exercises on geographical information systems and virtual fieldwork to provide basic understanding of active tectonics and active fault morphology in particular. The work has been conducted either in a full remote configuration via 3D online models or in virtual reality (VR) in a dedicated room using the Minerve software. During the VR sessions, students were either alone in the VR environment or participated as a group that included the instructor (physically in the classroom or remotely from another location), which is to our knowledge one of the first attempts of this kind in France. We discuss the efficiency of virtual fieldwork using VR based on feedback from teachers and students. We conclude that VR is a promising tool to learn observational skills in Earth sciences, subject to certain improvements that should be possible in the years to come.
- Article
(7688 KB) - Full-text XML
-
Supplement
(7157 KB) - BibTeX
- EndNote


The seismic hazard in Metropolitan France is relatively low (e.g., Duverger et al., 2021). Some Mw 6+ destructive earthquakes were registered in the past (such as the 1909 Lambesc, Provence, earthquake, e.g., Baroux et al., 2003), and the 2019 Mw 5 Le Teil earthquake that reactivated a branch of the Cevennes fault system reminds us that seismic hazard is not absent (Ritz et al., 2020; Cornou et al., 2021). However, because Metropolitan France is a very slowly deforming region where deformation is diffuse (Masson et al., 2019), the morphological signature associated with potentially active faults is often subtle. Taking undergraduate students to the field to observe an active fault with a clear morphological trace requires therefore to go abroad to more tectonically active areas (e.g., Italy, Greece), thus involving rather long and expensive fieldwork sessions.
It is generally admitted in the geosciences community that fieldwork is essential in the Earth sciences learning process (e.g., Boyle et al., 2007; Mogk and Goodwin, 2012; Petcovic et al., 2014). The observation of geological objects in situ and their 3D and 2D representation are key to decipher their nature and geological history, and field camps usually provide alternative and efficient ways to access a deeper and less theoretical learning than that acquired in the classroom (Lonergan and Andresen, 1988). While often considered attractive for students that appreciate engaging with the subjects of study and benefiting from enhanced group cohesion (Boyle et al., 2007), fieldwork may be unfeasible (e.g., dangerous, remote or submarine sites, or otherwise unreachable for disabled people, e.g., Gilley et al., 2015). We may instead require virtual imaging or to access specific sites of interest to make a proper fieldwork-like analysis. The development of 3D visualization and virtual-reality immersion in geosciences offers an alternative path that is being explored and developed both in education and research (e.g., Cliffe, 2017; Jitmahantakul and Chenrai, 2019; Mead et al., 2019; Janiszewski et al., 2020; Klippel et al., 2019).
In Lyon, the ICAP service (Innovation, Conception et Accompagnement pour la Pédagogie) from Université Lyon 1 opened a dedicated room for virtual-reality teaching during spring 2020, equipped with 10 Oculus Rift S headsets connected to desktop computers, an interactive white board, and collaborative facilities that include multiple devices capable of screen-sharing (Mersive Solstice system, see https://virtuallab.univ-lyon1.fr/, last access: 3 December 2021). Simultaneously, a team of researchers involved in projects aiming at understanding the active tectonics of the French Lesser Antilles (Escartín et al., 2016; Leclerc et al., 2016; Istenič et al., 2020) developed an interactive free and open-source software (Minerve; see Billant et al., 2019) to collaborate on very-high-resolution (∼ 1 m to 10 cm) DEMs and DOMs (digital elevation models and digital outcrop models, respectively) of the submarine active normal Roseau fault scarp that was reactivated during the 2004 Les Saintes earthquake (Mw 6.3) (Escartín et al., 2016).
These submarine studies provided a unique opportunity to bring our students to the field, at 1200 m b.s.l., through virtual reality, and we describe this experiment in this paper.
During the 2013 ODEMAR and 2017 SUBSAINTES cruises of the Flotte Océanographique Française (Escartín and Andreani, 2013; Escartín et al., 2017), the Roseau fault, which has a maximum vertical relief of 200 m, was locally imaged optically with the remotely operated vehicle (ROV) VICTOR, complementing matching autonomous underwater vehicle (AUV) microbathymetric surveys (Escartín et al., 2016; Istenič et al., 2020; Hughes et al., 2021). This deep-sea ROV acquired high-resolution videos at the base of the fault scarp and along vertical transects of the fault plane to study the rupture associated with the 2004 earthquake. Georeferenced and scaled DOMs were calculated by applying and developing structure from motion techniques using the videos (Istenič et al., 2020); see also https://doi.org/10.17882/84249 and https://doi.org/10.17882/79217 (last access: 3 December 2021). In addition to these ROV optical surveys, the autonomous underwater vehicles AsterX (Ifremer, France) and Abyss (GEOMAR, Germany) acquired near-bottom high-resolution bathymetric data allowing for the generation of 1 m resolution DEMs. Both the optical and the high-resolution acoustic data were used to describe and quantify the coseismic displacement of the 2004 event and to better understand and quantify the submarine landscape evolution processes that shape the submarine fault morphology (Escartín et al., 2016; Hughes et al., 2021).
However, existing software allowing for simultaneous work on DEMs and DOMs are scarce, are usually not open source, or are ill-suited for this purpose as they often lack georeferencing (e.g., Meshlab). Several of these systems also allow the user to interact with the 3D data on screens only and not in a virtual-reality (VR) environment (e.g., MATLAB, QPS Fledermaus, Matisse, Arnaubec et al., 2021), in addition to other limitations. Therefore, to precisely analyze and inspect structures from 3D models, in this case the fine scarp topography and texture of a fault rupture underwater, the Minerve Virtual Reality software was developed (Billant et al., 2019). Minerve is intended to be used as a quantifying tool and is provided as a free and open-source software (FOSS), which allows easy distribution in the teaching and research communities. In Minerve, the user can move freely in a georeferenced space at a 1:1 scale. The tools allow for measuring strike, dip, rake, and distances and mapping geological features that can be exported in geographical information system (GIS)-like format for further work. Lastly, several users can meet remotely and collaborate in the same VR environment, allowing teamwork or facilitating training and teaching. The possibilities for interaction with the 3D models offered by Minerve are key skills that students in geosciences should master at the end of the third-year of undergraduate study.
The Minerve software was used to perform a paleo-seismological study of the Roseau fault outcrops (Billant et al., 2018). Although the fault was imaged in 2013, 13 years after the earthquake, the morphology and visual texture of the coseismic markers are astonishingly well preserved, since at this oceanic depth (∼ 1200 m) weathering and sedimentation rates are very low (Escartín et al., 2016) and constitute textbook normal-fault outcrops. Such markers are much more ephemeral in subaerial environments. For instance, light coseismic ribbons at the base of darker cumulative scarps usually disappear rapidly inland, whereas the color change is still clearly visible along the Roseau fault. Several markers of pre-seismic seafloor levels imprinted on the fault mirror, such as thin lines of sediment stuck on the fault mirror, are also preserved at different elevations. This makes the Roseau fault outcrops unique for the discussion of the seismic cycle and interaction of the tectonic and submarine surface processes, especially as a student's first contact with active tectonics.
The lab session presented in this study has been built for third-year undergraduate geosciences students (L3) and has been tested by students following the General Geology undergraduate program at Université Lyon 1 and École Normale Supérieure de Lyon. It aims at providing them with a basic understanding of active tectonics in the frame of a much more general course on “Structural Geology and Tectonics”. The lab session is associated with a 3 h lecture on seismic cycle, scaling laws, and morphology of active faults. At the end of the course unit, the students can be evaluated on their ability to (i) understand tectonic context based on fault maps, focal mechanisms, earthquake catalogues, and DEMs; (ii) estimate a recurrence time for a given fault based on historical earthquake timeline and tectonic strain rate; and (iii) estimate the maximum magnitude and type of earthquake that could generate a fault based on the scarp morphology, the length of the fault, and the standard scaling laws. Because of the wide variety of topics covered by the course, the course unit assessment may or may not include active tectonics each year. Because of the pandemic and resulting student difficulties during this period, we focus our efforts on the set up of virtual fieldwork. The assessment strategy remains to be properly settled (see Sect. 4).
The teaching sequence, adapted for groups of up to 12 students, starts by mapping exercises and understanding the tectonic context using vector and raster images gathered on a GIS project on the free and open-source QGIS software. After identifying potential candidate faults for the 2004 Les Saintes rupture at a large scale using a 10 m resolution DEM covering the whole fault system (Deplus and Feuillet, 2010; Leclerc et al., 2016), students ideally switch to VR immersion for a finer analysis using 1 m resolution DEM and the centimeter-scale resolved DOMs. Student feedback was collected immediately after the lab session via an online inquiry, and its analysis will contribute to future improvements of both the virtual fieldwork for the students and the Minerve software itself (ergonomics, functionalities, tools).
Because of the Covid-19 sanitary restrictions, we adapted the first session conducted in spring 2020 during full lockdown in France in a 100 % virtual lab session. In spring 2021, during partial lockdown, we conducted the sessions at the university with four reduced groups composed of four to six students each during short 2 h sessions, including 1 h dedicated to VR fieldwork.
3.1 Using GIS tools to analyze the tectonic context and geomorphology
GISs are now used in a very wide variety of fields, including Earth sciences. This lab session is the first contact for the third-year undergraduate students with GIS software and aims to introduce basic digital mapping tools and familiarize the students with the tectonic context. The free and open-source QGIS software (QGIS Development Team, 2021) was used during our courses.
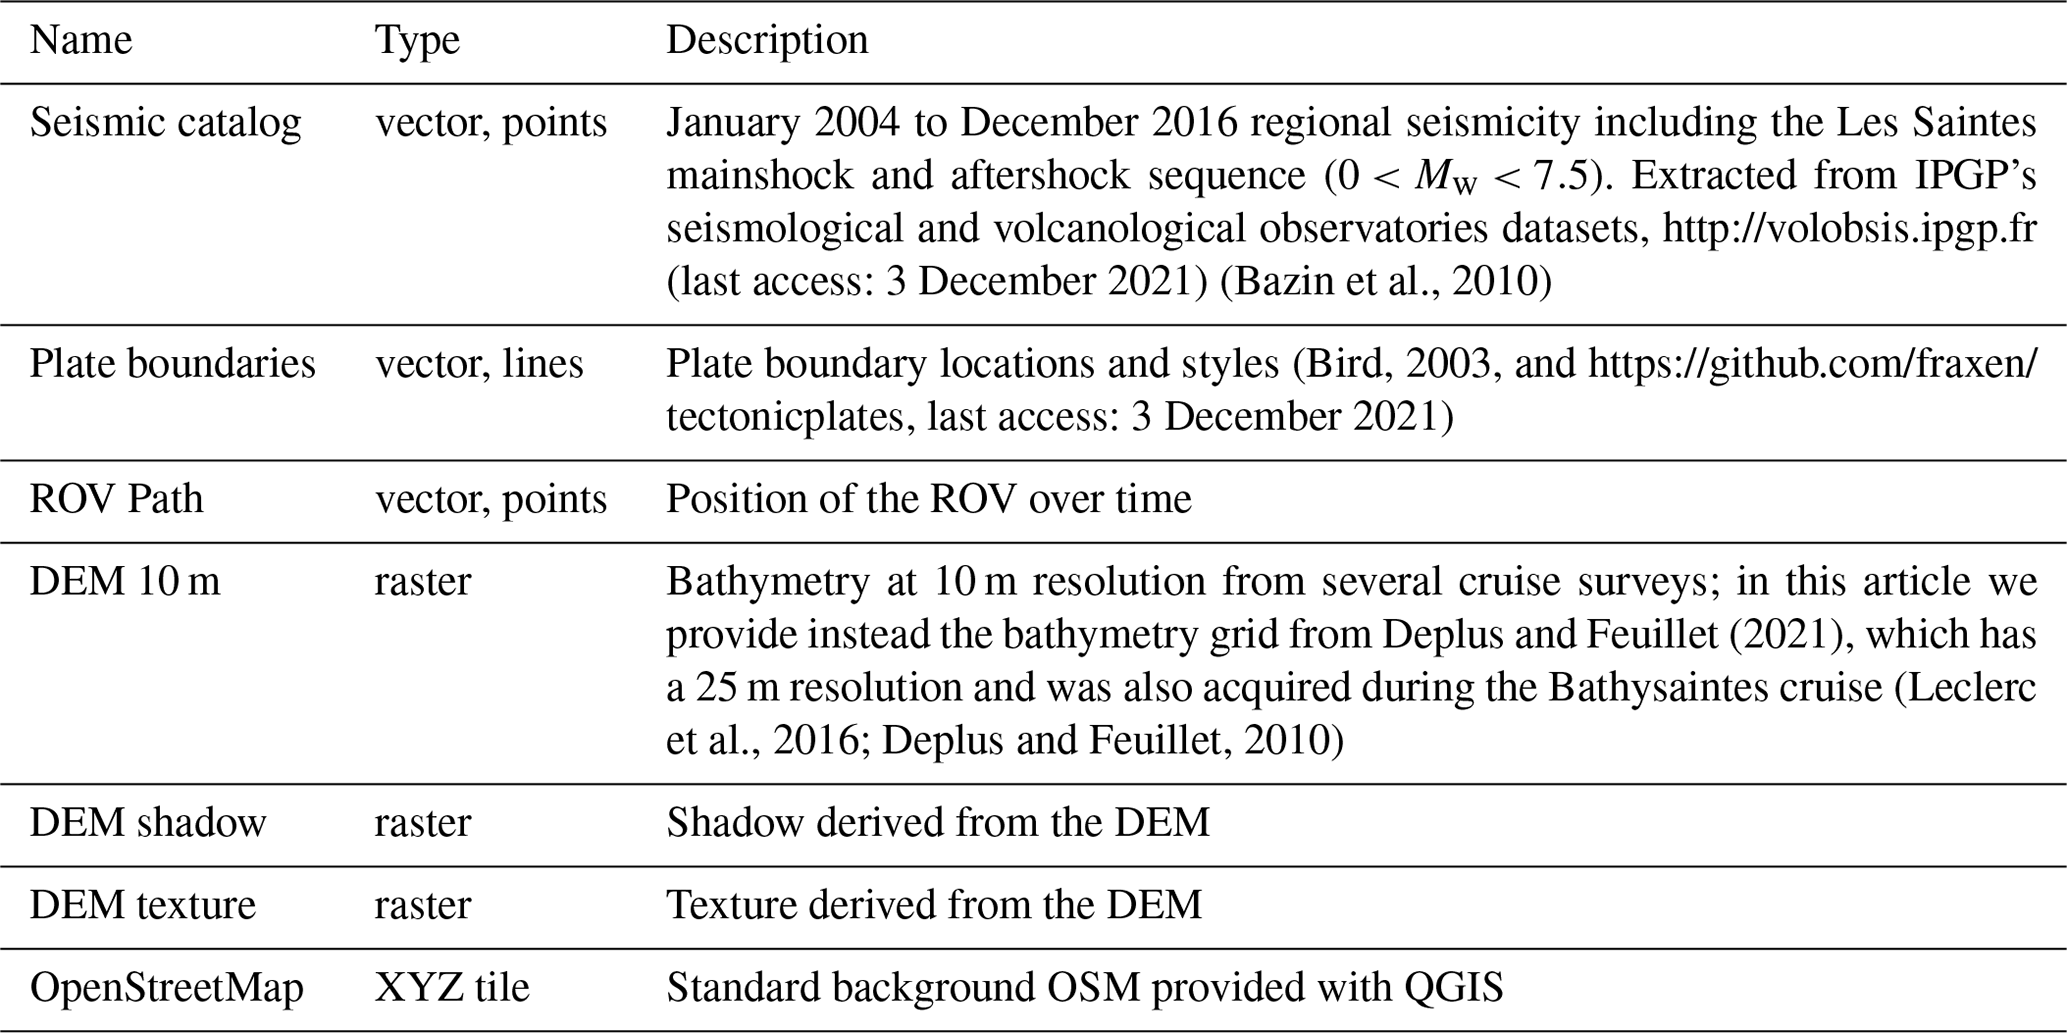
In addition to standard documents extracted from the scientific bibliography (context figures extracted from Feuillet et al., 2002; Leclerc et al., 2016, and the USGS description of the 2004 Les Saintes mainshock, including the focal mechanism and intensity map; see https://earthquake.usgs.gov/earthquakes/eventpage/usp000d8w3/executive, last access: 3 December 2021), students are provided with a zip file including a QGIS project file and associated layers (provided in the Supplement). The project file can be opened directly by QGIS (version > 2.7 in this work), requiring no manual tuning of projection parameters and symbology or loading of additional layers (operations that students do not yet know how to perform). The project includes vector and raster layers that are listed in Table 1.
(Bazin et al., 2010)Bird, 2003Deplus and Feuillet (2021)(Leclerc et al., 2016; Deplus and Feuillet, 2010)Table 1Description of the layers imported in the QGIS project (see Supplement).
As a first step, students are asked to describe the overall tectonic context (plates in contact, type of plate boundaries, expected long-term motions) and to discuss the occurrence of a major normal-fault earthquake in a context of subduction based on the standard documents provided. They are then guided through the QGIS project to have a closer look at the seismicity catalog and to identify the 2004 sequence via simple requests on the attribute table (sorting, request on attribute value, etc.). Guidance on this first use of SIG software is provided via online discussions on the Discord app forum and teacher-made video tutorials in the 100 % remote strategy, while oral explanations are provided in the classroom for the two other strategies.
As a second step, students work on the interpretation of the shaded and textured 10 m local DEM. They explore the DEM via the “identify features” tool to get absolute bathymetry value at each pixel and the “terrain profile” additional plugin (https://github.com/PANOimagen/profiletool, last access: 3 December 2021) that allows on-the-fly drawing of topographic profiles (see Fig. 1). This additional plugin is activated directly by the students via the “manage and install plugin” window as it is included in the Qgis Official Plugin Repository. Bathymetric profiles perpendicular to the Roseau fault system can be easily interpreted as representative of an active graben since cumulative fault scarps are very well preserved. Students are asked to use drawing tools (line, polygons) to provide a simplified structural map of the area, including active faults, volcanoes, and reef plateaus (Fig. 2). In doing so, they are required to reflect on the nature of the relationship between these structures and propose a chronology for their setting. After a short briefing on how to use the layout manager included in QGIS to produce simple maps and associated captions, the students can finalize their work in the form of a synthetic and commented map.
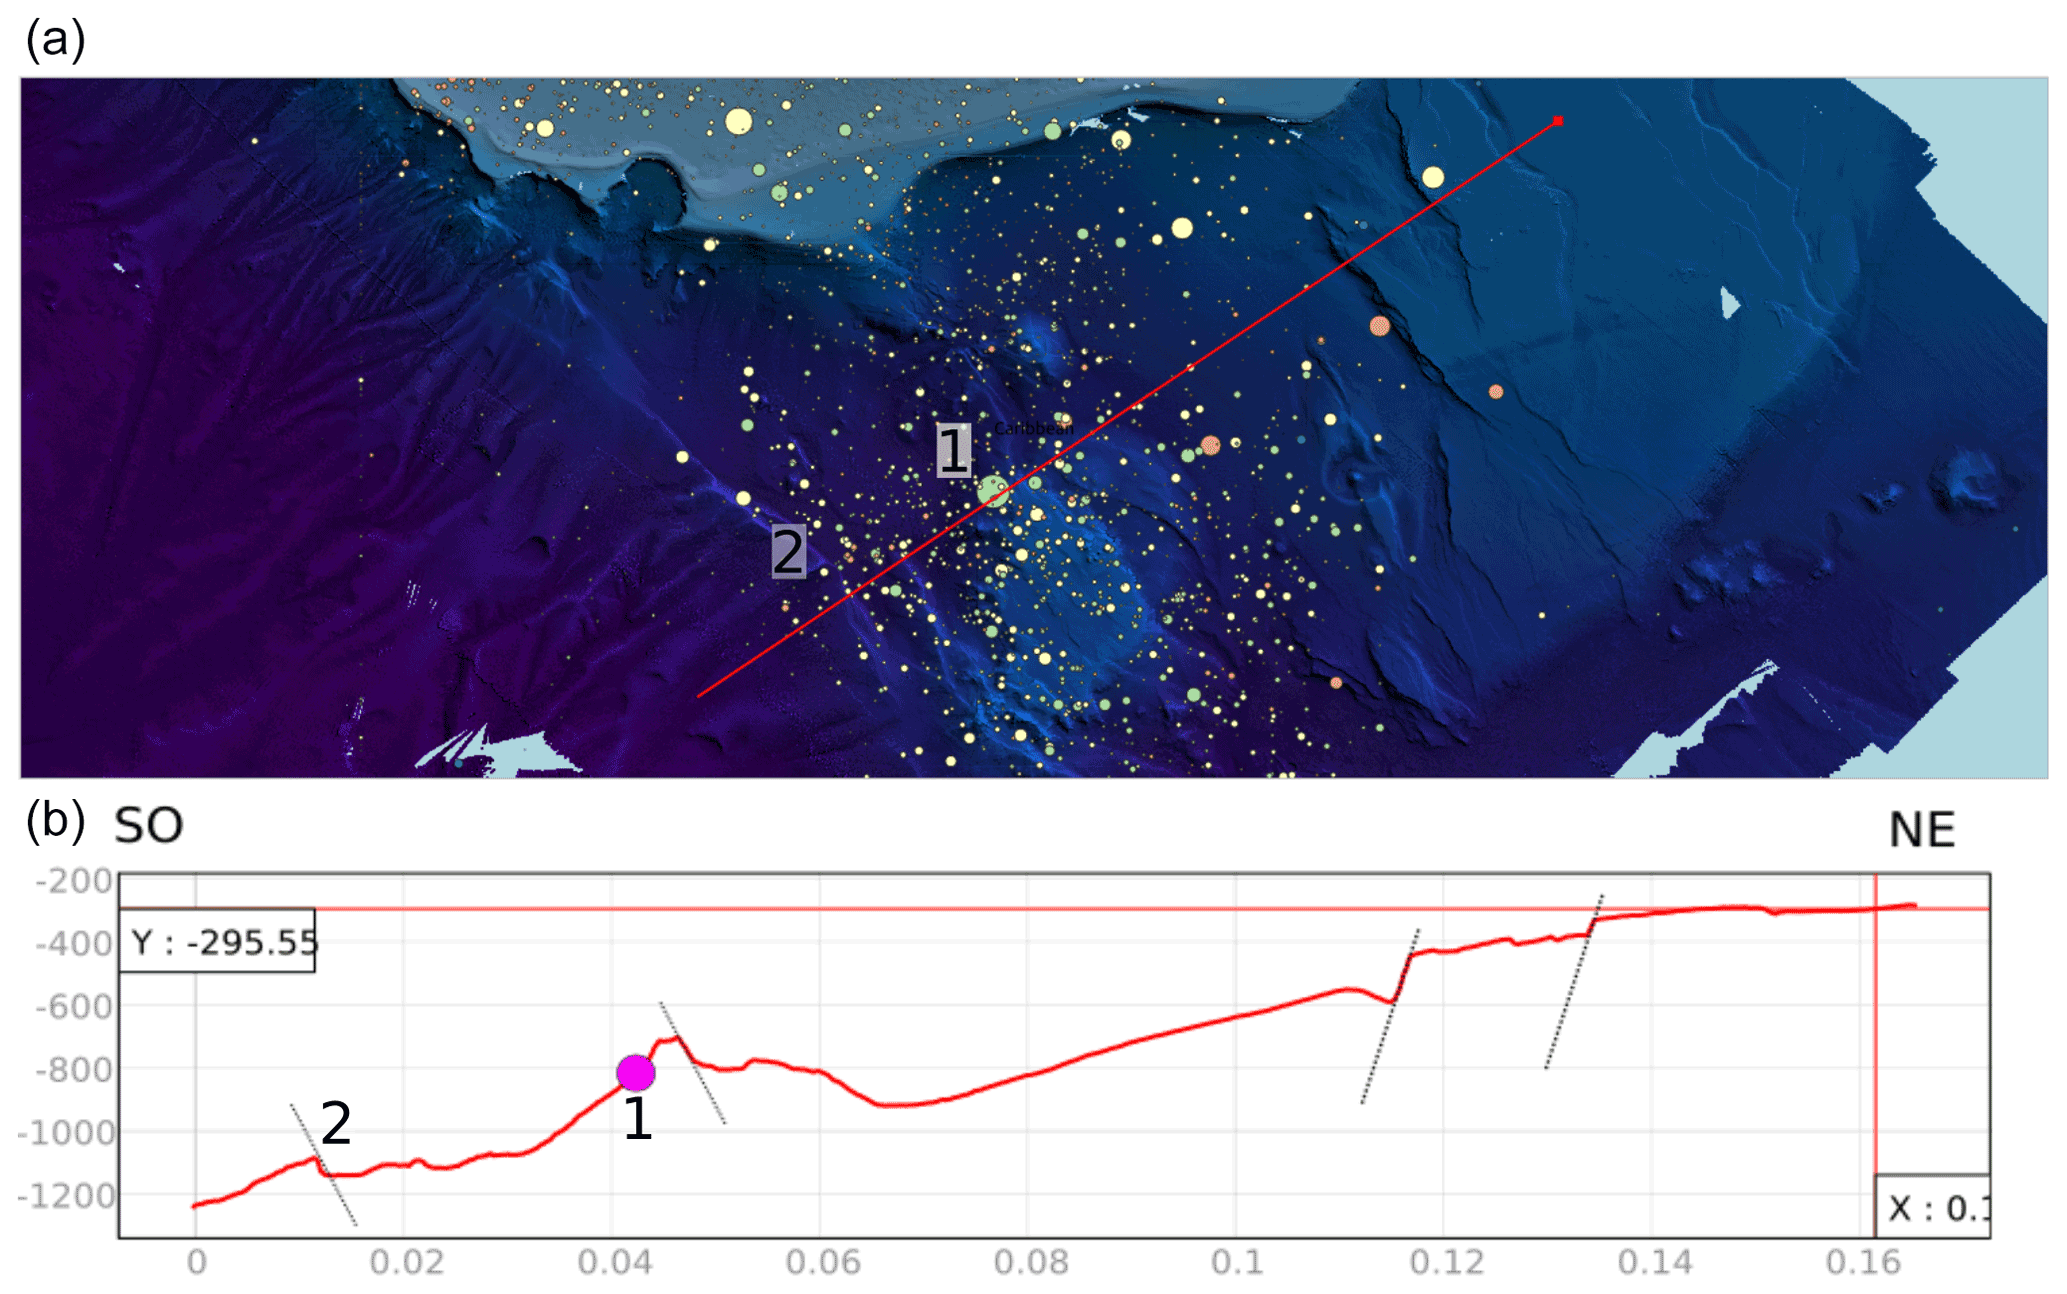
Figure 1Snapshot of the QGIS desktop showing an example of interpretation by a student of a bathymetric profile (b) crossing the normal fault system perpendicularly (red line in a) using the terrain profile tool. The student has represented supposed normal fault planes with a dashed line and the mainshock epicenter with a purple dot (1). The Roseau fault is indicated in both the map and profile view (2).
Once this mapping exercise is over, students are asked to use their morphological observations to propose a fault as the best candidate for hosting the 2004 Les Saintes event during a class discussion. To do so, they are required to recall lecture material and remember that (i) such a large earthquake (Mw 6.3) requires a ∼ 15 km long fault segment to rupture if agreeing with standard scaling laws and that (ii) the epicentral location is often shifted from the surface fault trace due to fault dip and depth of the rupture (here 12 km), and therefore (iii) the students have to take into account a fault dip, in theory between 60–65∘ for normal faults (Anderson, 1951; Olive and Behn, 2014). All together, these parameters should lead students to conclude that detailed submarine fieldwork should be conducted on the Roseau fault to look for a fresh scarp.
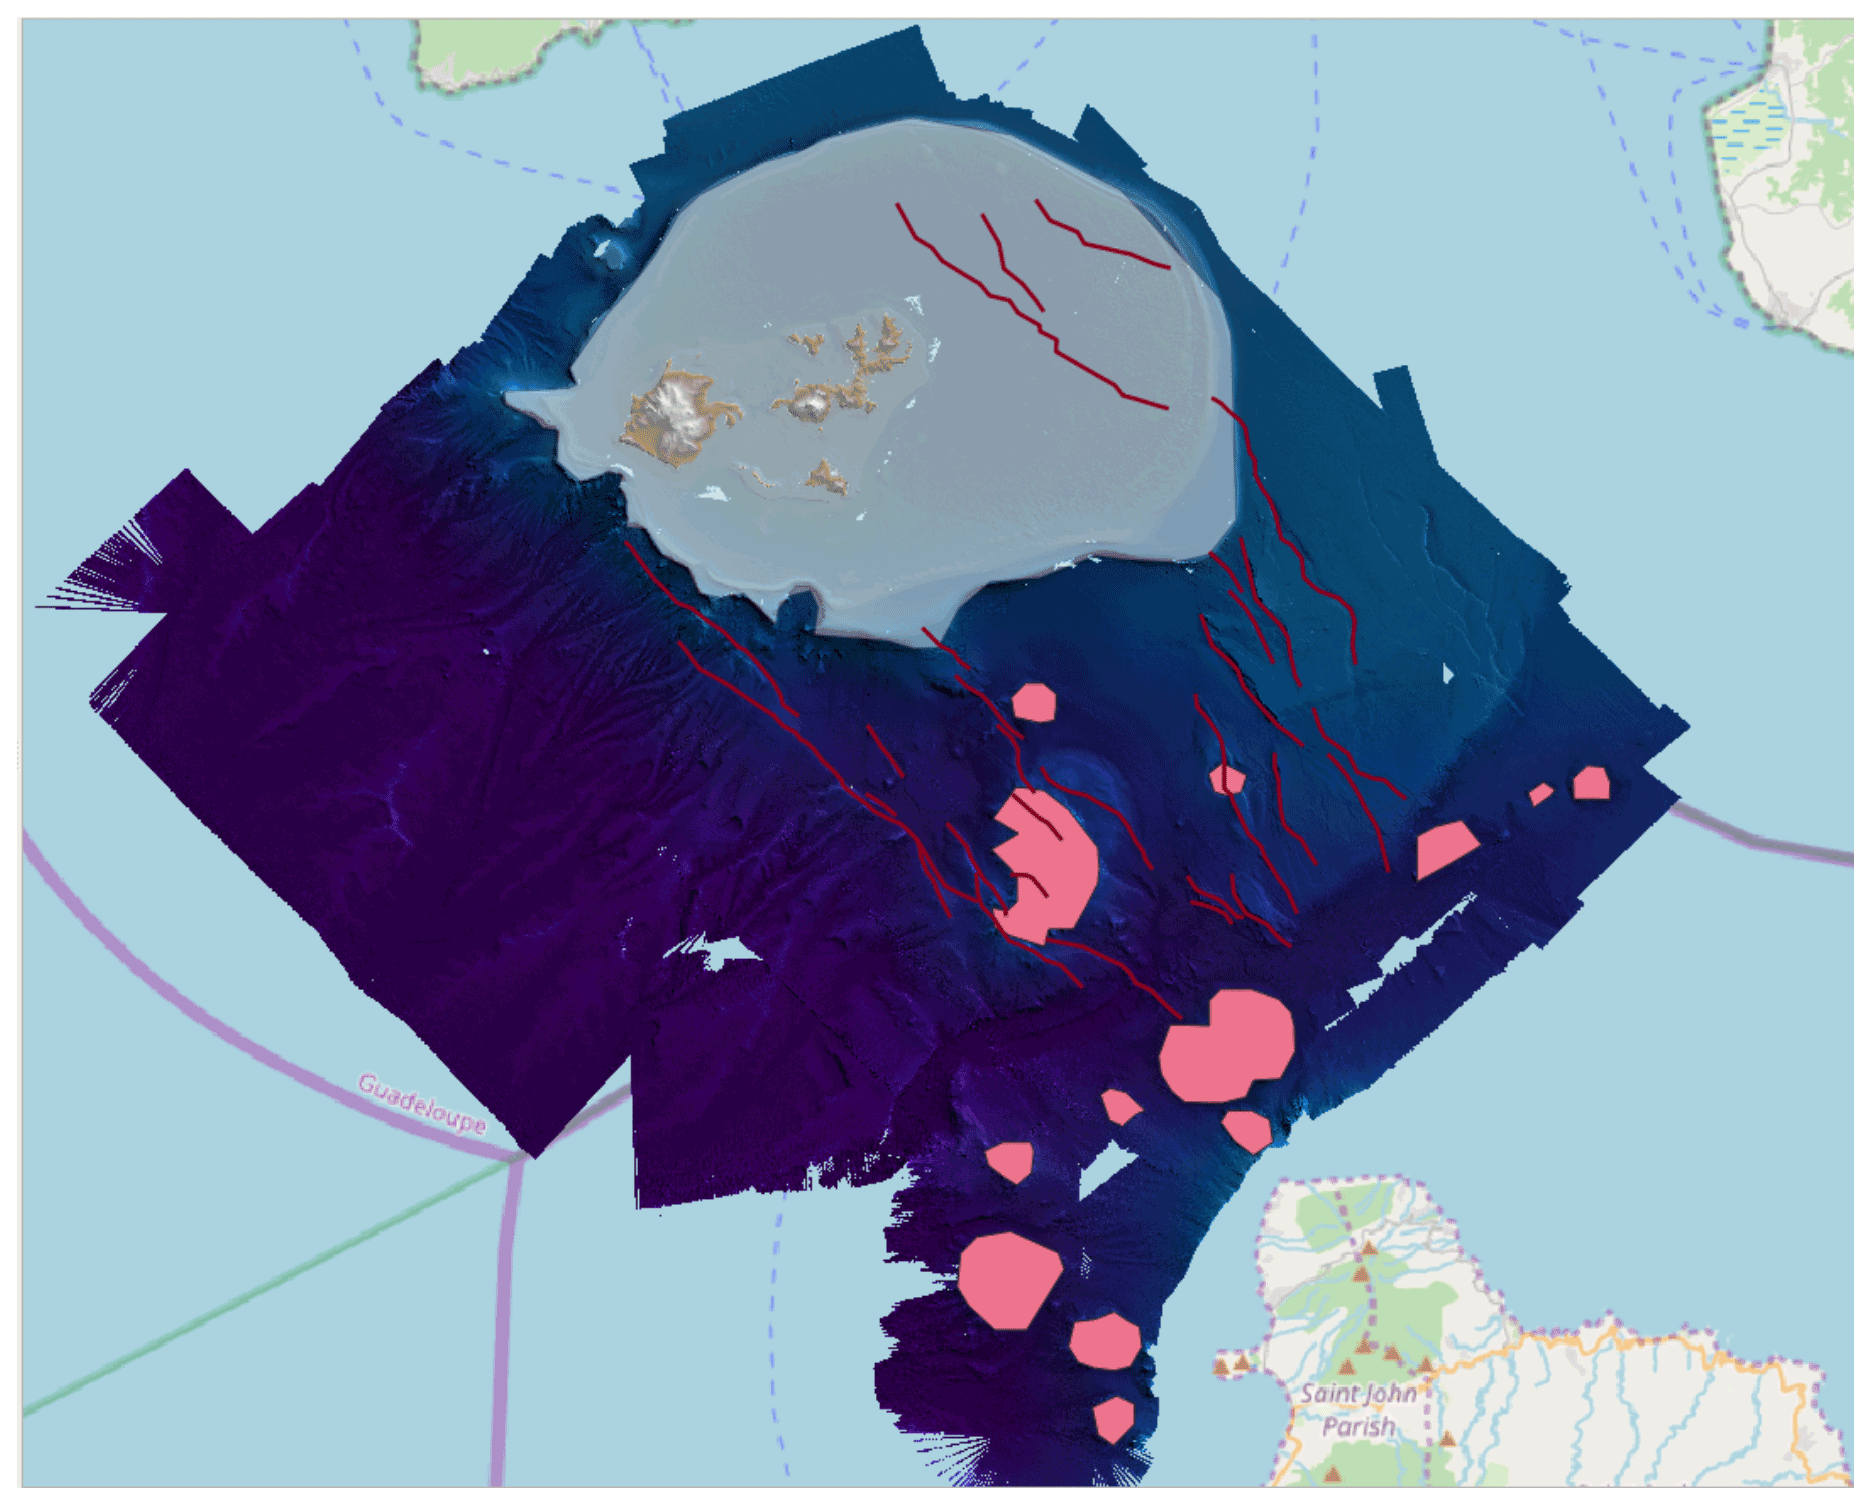
Figure 2Snapshot of the QGIS desktop showing an example of expected first-order interpretation of the 10 m DEM using QGIS drawing tools. The Les Saintes reef plateau is contoured in transparent white, submarine volcanoes are shown in pink, and active fault scarps are shown in red. Erosional features like canyons could also be mapped since they are often detected by students and may be misidentified as tectonic scarps.
3.2 In the field: virtual reality and 3D models
Before accessing the virtual field, students are provided with a excerpt of the raw video taken by the ROV during the SUBSAINTES cruise (ROV Dive 563) from which the detailed DEM is built (see https://www.youtube.com/watch?v=TV3TUeRfxoc, last access: 3 December 2021). This video enables discussion of the technical difficulties that arise when doing submarine exploration. In addition to the absence of a landscape view that provides a general reference to the user, these data illustrate several limiting factors: restricted field of view, poor visibility due to sediment particles, artificial lighting that is thus distance dependant, no direct scaling, difficulties in orientation due to camera and vehicle motion and lack of external references, no GPS positioning, etc. (Istenič et al., 2020). At the same time, some advantages of submarine exploration and fieldwork can also be pointed out, such as the very limited erosion rates, good preservation of submarine structures, and the accessibility to the outcrop, as it is not covered by vegetation as would be the case on land.
With the virtual fieldwork, the students' goals are describing and identifying the morphology associated with the active fault, measuring the last coseismic displacement on fault scarps, estimating the moment magnitude of the last earthquake, mapping the fault, and understanding the erosive and sedimentary processes interacting with tectonics (dejection cones, roughness of the scarp, etc.). Students ultimately propose scenarios of fault behavior during the seismic cycle and of long-term fault scarp evolution.

Figure 3Teaching strategies tested for virtual fieldwork sessions and a view of the studied outcrop. (a) The 100 % remote strategy based on the Discord app and the use of a 3D model hosted on the Sketchfab platform. (b) The alone in the field or single-user strategy taking place in the virtual lab with the teacher (dark silhouette) remaining outside the VR environment and guiding the students via the Solstice system. (c)The together in the field or multi-user strategy in the virtual lab with two teachers connected to the VR environment.
We have tested three different teaching strategies pictured in Fig. 3. In the first strategy, named 100 % remote, students work from home on their own laptop during the entire session. They are connected to a dedicated voice channel on a Discord server hosting the other students and the teachers. The fieldwork is conducted based on a short portion of the 3D DEM and DOM (centimetric resolution) of the Roseau scarp loaded in degraded resolution (50 Mb in total size, presenting a quarter of the complete model at less than a quarter of the initial resolution explored in other strategies) on a Sketchfab account (see https://sketchfab.com/3d-models/la-rf-fpa-85002c5cd5f54a8fbeb736576b7d9e91, last access: 3 December 2021). A few annotations are added to the model in order to discuss some specific points with the students and provide a rough estimate of the outcrop's scale.
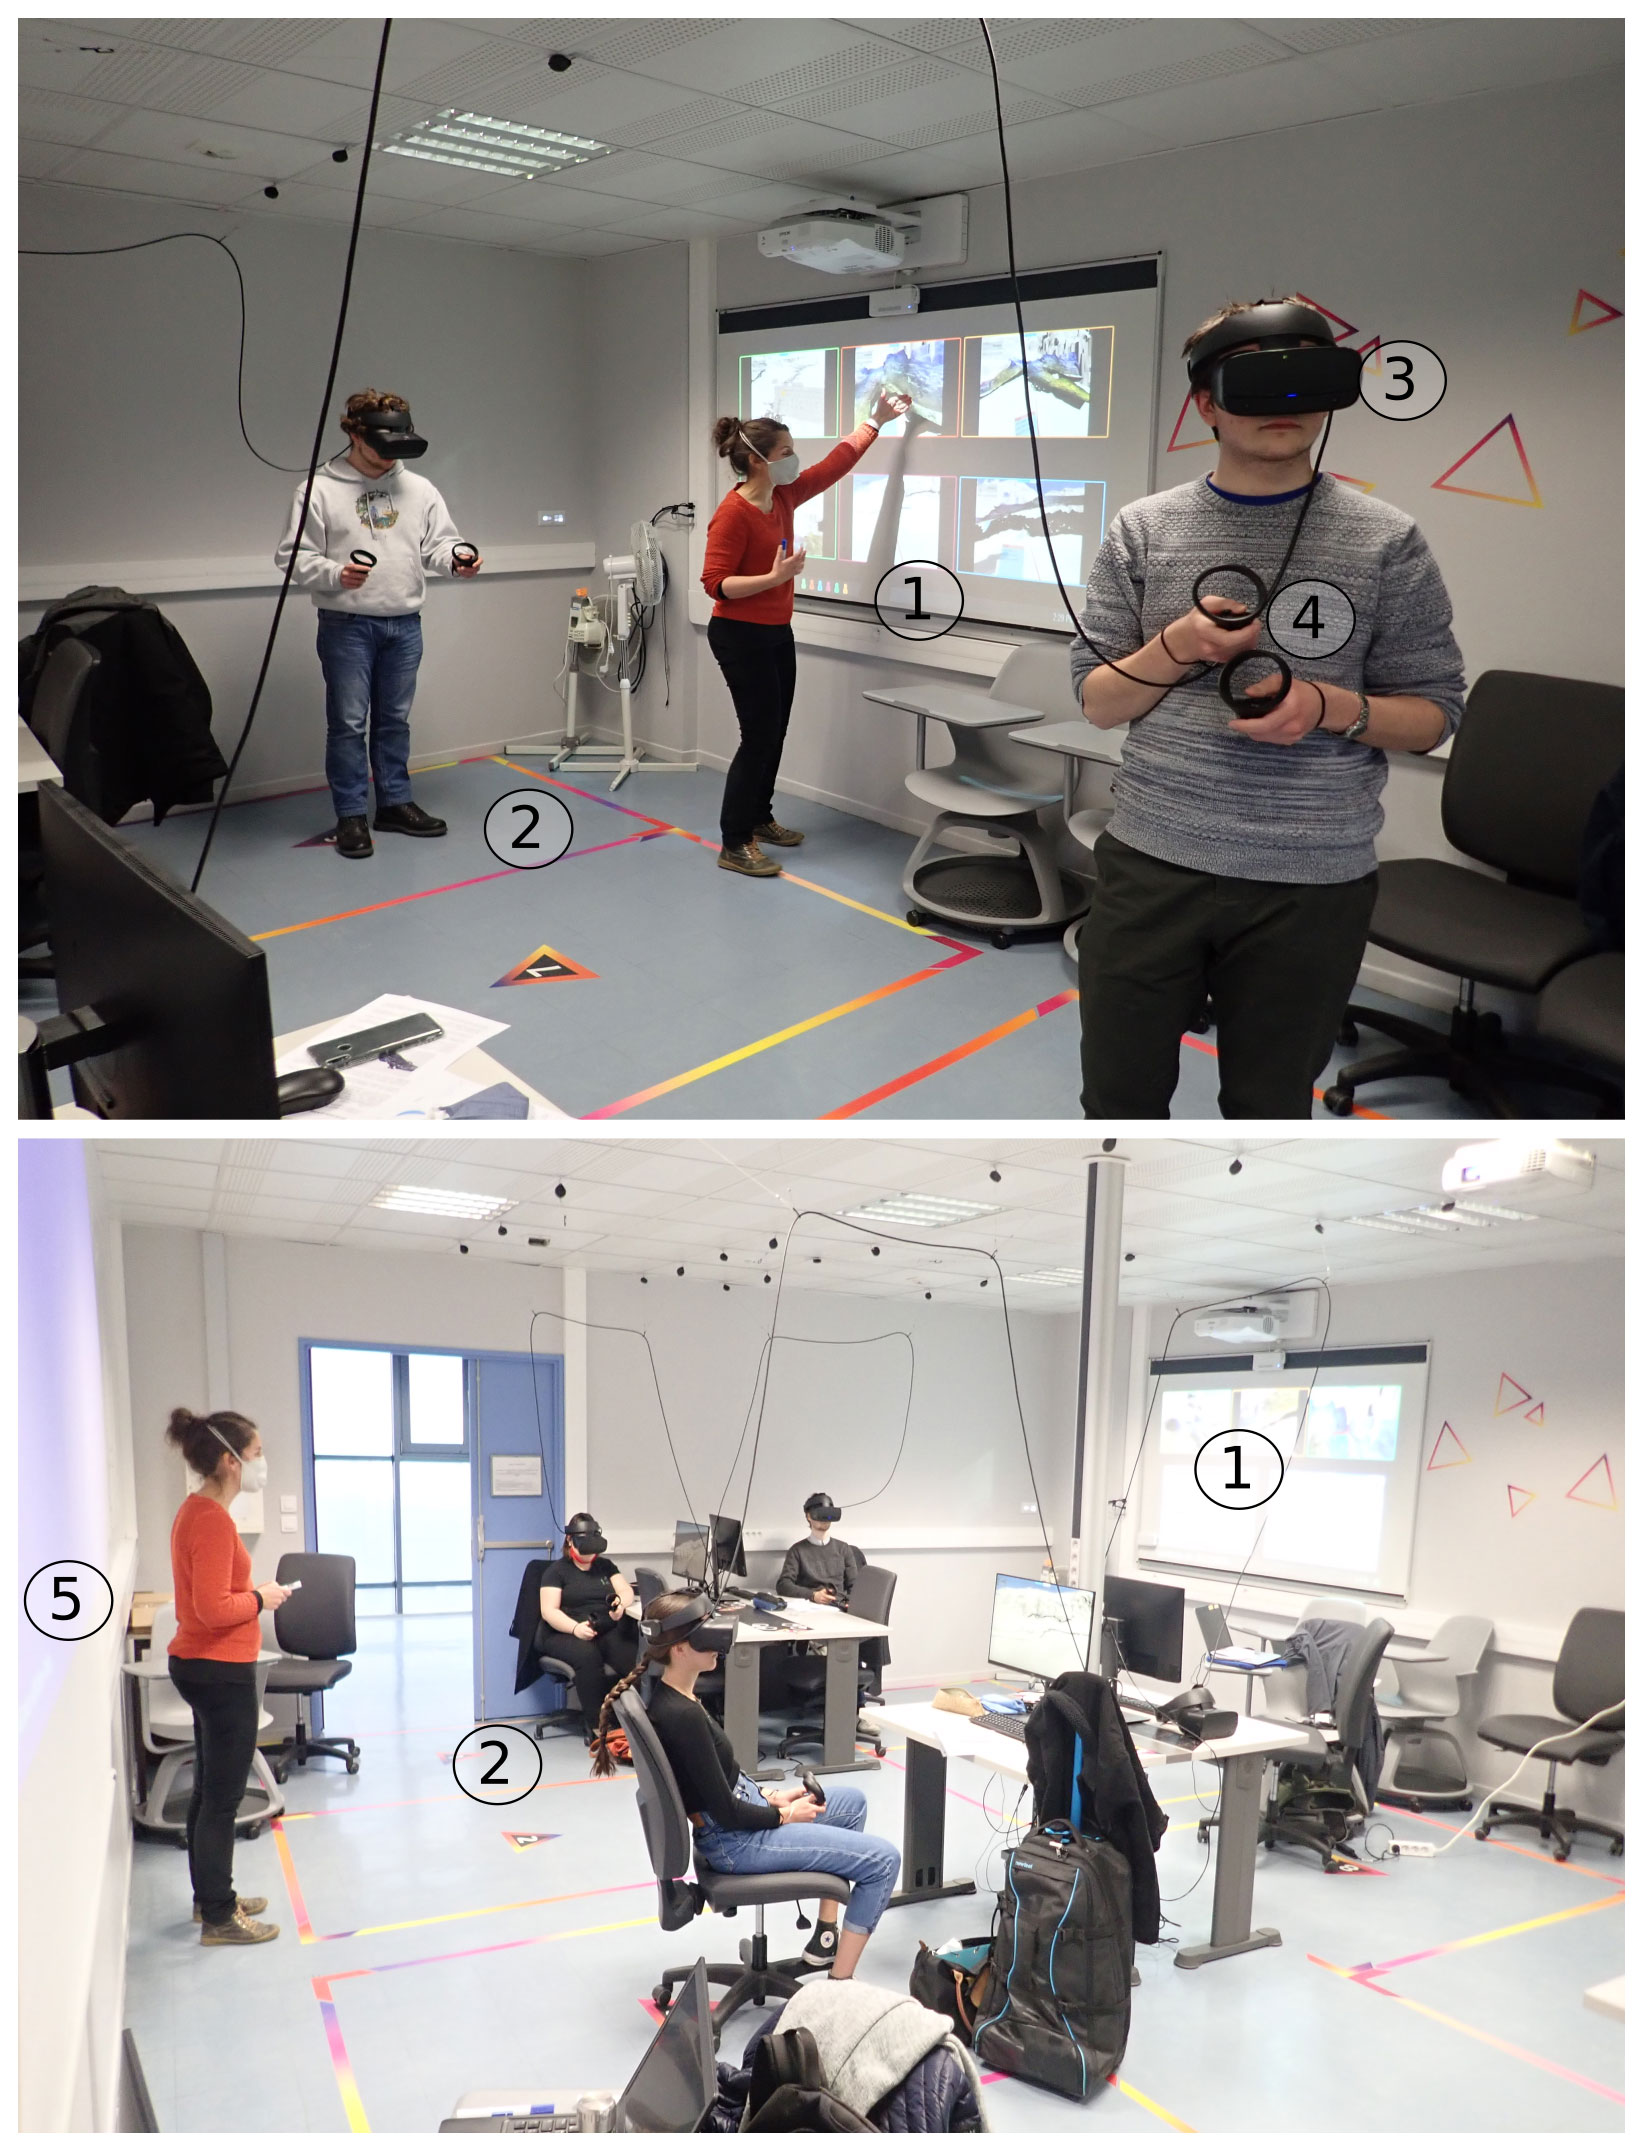
Figure 4Views of virtual lab room in the alone in the field or single-user mode in which teacher (in orange) is outside the virtual environment. (1) Solstice collaborative screen-sharing system, (2) virtual box where limited real displacements of the user are allowed, (3) Oculus Rift S headset, (4) controllers, and (5) projection screen for teacher computer are all shown. It is worth noting that some students prefer to operate in VR while seated, while others find it more natural to be standing or moving within the limits of their virtual box (2).
In the second strategy, named “alone in the field” or “single-user mode”, the students are present on the same classroom but separated into two different groups and sessions. They are alone in the virtual field and guided by a teacher from outside the VR environment in the Univ. Lyon 1 virtual lab (see Figs. 3b and 4). The teacher can follow the displacements of the students and share their view via multiple screen-sharing programs projected onto the digital board (see annotation 1 in Fig. 4).
In the third strategy, named “together in the field” or “multi-user mode”, the students are separated into two small groups (six students per group) and are all included together in a single VR environment with the instructor (J. Billant), teaching remotely from Nice (see Figs. 3c and 5). A “local” teacher is also present in the virtual lab and in the VR environment depending on student needs. A short sequence of the lab session in multi-user mode is available in Supplement.
For the two strategies involving virtual reality, we dedicated limited time (5–10 min) to take control of the virtual tools and motion modes in the virtual environment (rotation, translation at different speeds, teleportation, flying mode). We take advantage of this period during which the students are still not autonomous in the field to make them look at the 3D model in its entirety, i.e., from above using the flying mode (Fig. 5a, b). This first step allows the students to orient themselves, to measure the overall fault azimuth using the wrist compass, and to appreciate the total height of the cumulative scarp (i.e. ∼ 200 m) and length of the mapped model. Particular care is taken to help the students with spotting the artifacts of the rough large-scale DEM (1 m resolution) in order to avoid misinterpretations. It gives the opportunity to discuss the technical difficulties in building such a DEM from on-site measurements (e.g., Debese, 2013).
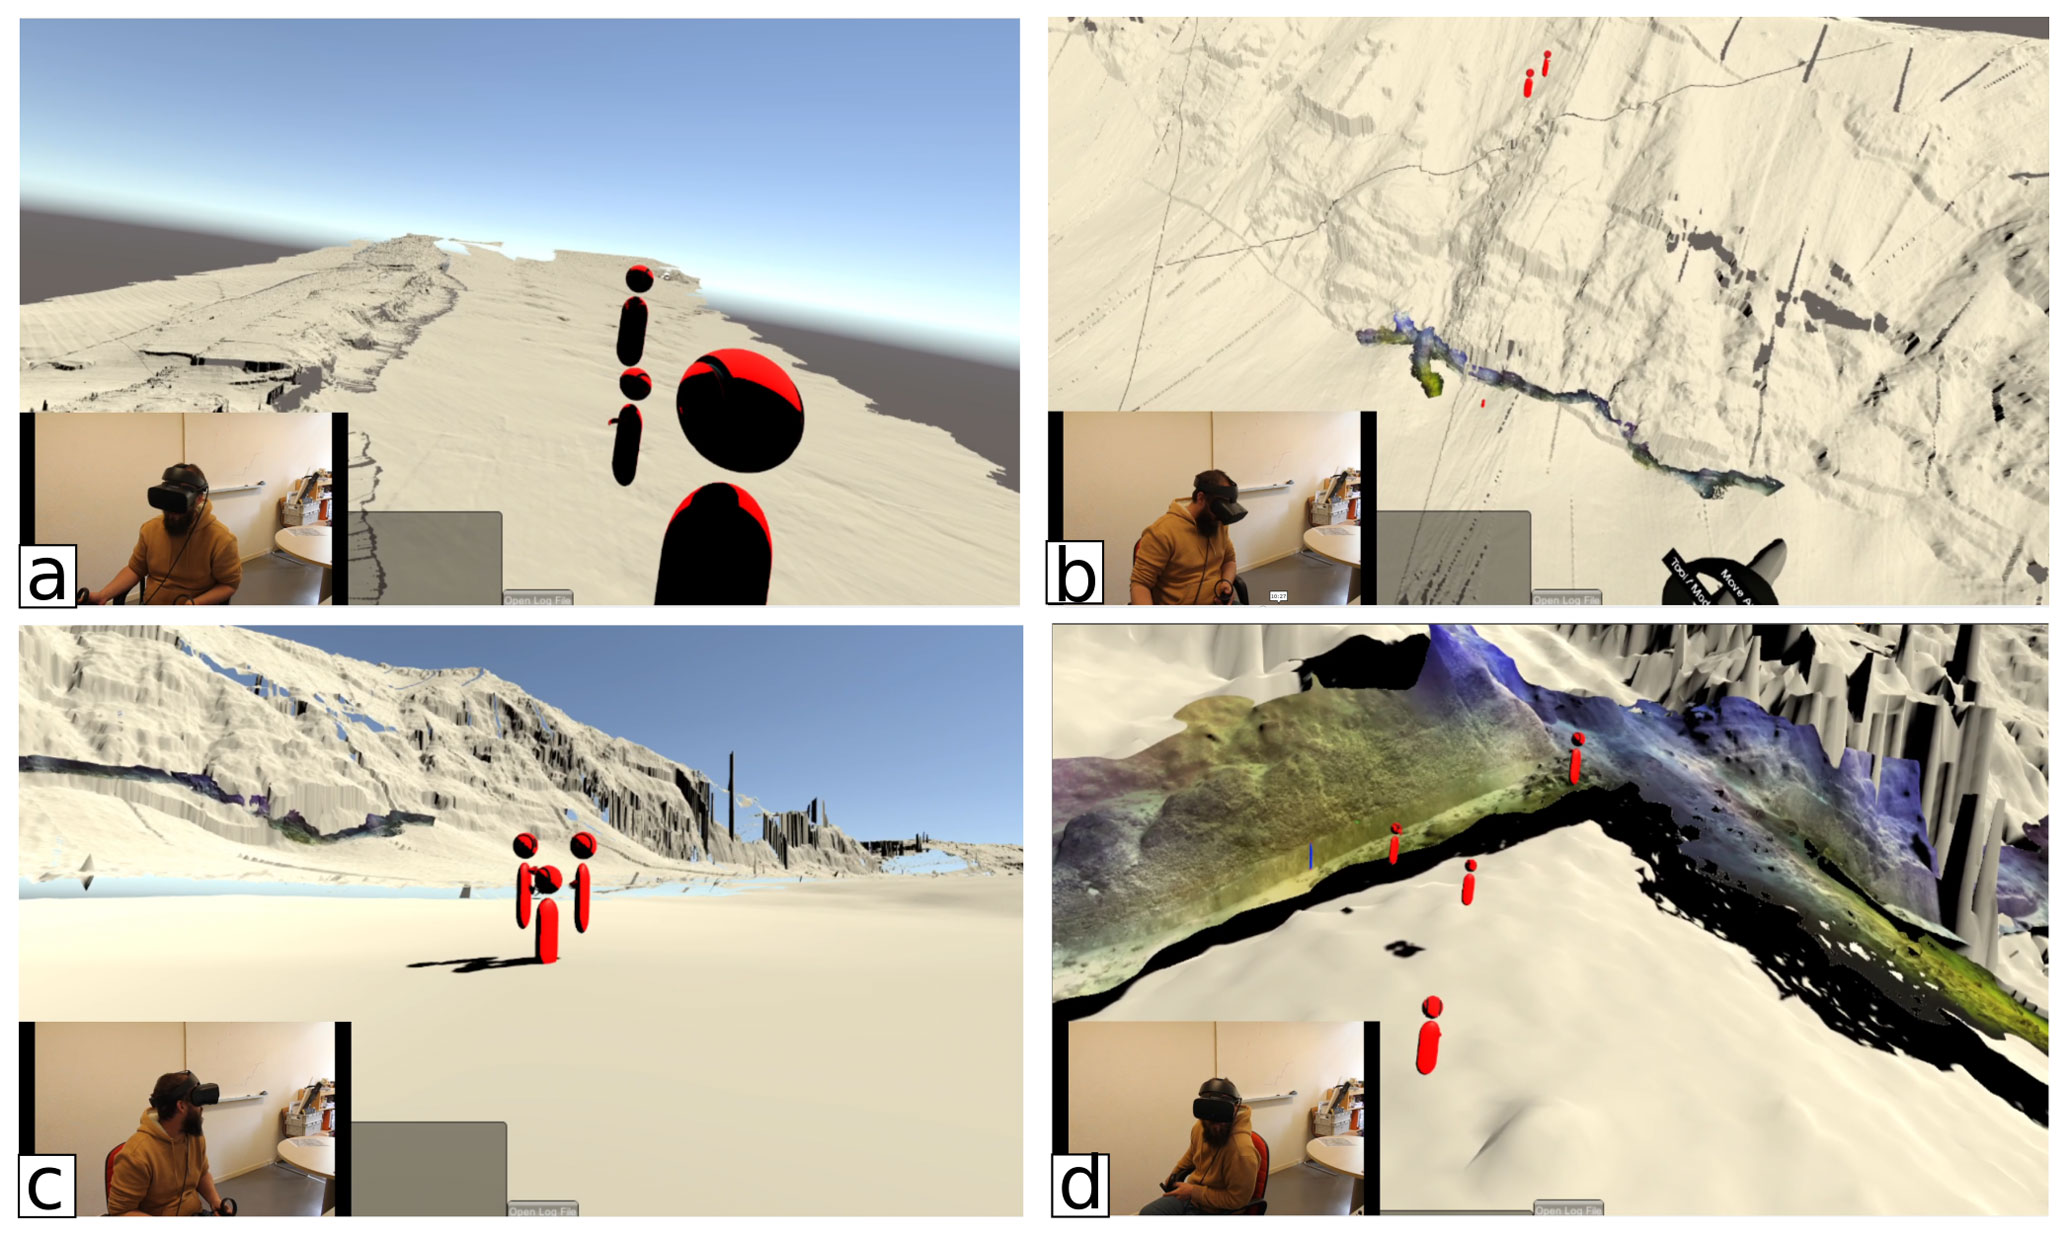
Figure 5Views of the virtual environment in the together in the field or multi-user mode from the remote teacher perspective (insert in c). (a) Distant view of the 1 m resolution DEM (beige), reconstruction artifacts are shown as greyish zones. The teacher presents the entire tectonic structure that is 200 m high. The colored portion of the scarp is the centimeter-resolution DOM of the fresh scarp (6 m height and 220 m long). Students are red avatars. Panels (a) and (c) show the student discussing the structure and moving closer. (d) Field mapping of details observable in the HR model at 1:1 scale.
In a second step, the students are free to explore the model and are encouraged to have a closer look to the very-high-resolution part of the DOM (1–5 cm) that covers a 220 m long and 6 m high portion of the scarp (Fig. 5b, c). They have to propose a precise mapping of the fault (draw line tool) and an estimate of the slip associated with the most recent 2004 earthquake (distance measurement), and they are also required to measure the strike and dip of the fault plane and rake of the striae (compass tool). All of these measurements can be saved in a comma-separated value format as georeferenced features with attributes and can therefore be loaded into the student's QGIS project built in a first step (see Sect. 3.1) to complete their analysis.
Finally, the teacher guides students through the detailed geological interpretation of the outcrop in order to detect changes in scarp roughness or color, traces of old sediments on the fault scarp, erosive steps, etc. that should help the students in producing an annotated synthetic sketch of the outcrop and discussing the regularity of the seismic cycle over this major fault. For a complete and detailed analysis of the outcrop, see Escartín et al. (2016); Hughes et al. (2021); Billant et al. (2018).
Not all of these quantitative measurements could be reached using the 100 % remote strategy as it limits the students analysis of the outcrop to a qualitative description of a very limited part of the 3D model. Therefore, this strategy is instead a virtual tour rather than actual virtual fieldwork. In the following section, we analyze the drawbacks and advantages of all three educational approaches.
4.1 Teaching strategies: comparison from teacher point of view
The actual teaching team was composed of two and four teachers during the 100 % remote and the two other strategies, respectively. Following each teaching sequence, we conducted short debriefing sessions that allowed us to make an inventory of problems encountered and successful tries. Below, we summarize our feelings as teachers that are all used to teach on the field during classical field trips, but who are not all specialized in active tectonics.
The 100 % remote strategy is obviously the least optimal, both regarding the GIS study of the tectonic context and virtual fieldwork. This is the least suitable approximation of in-person on location fieldwork. All the students were able to install QGIS on their personal laptop and were able to handle the layers of the project, at least for visualization purposes. Most of them were successful in creating some bathymetric profiles and their own vector layers and sent us screenshots (see Fig. 1). However, remote debugging is difficult and many students did not participate in the oral discussion (either because of technical sound problems or usual reluctance in public speaking), which makes it difficult to assess their actual understanding of the concepts. In-person lab sessions are more efficient to help the students both with technical issues (QGIS is already installed in the latest version, plugins can be easily installed, problems in saving the new shapefiles can be directly solved, etc.) and for guiding the interpretation of the DEM (by ensuring the student is looking at the proper structure). For this step and for small groups of students (six students), the projection of all the active screens on the wall provided in the Lyon 1 Virtual Lab is a real advantage: it allows the teacher and the students to share their screen and easily discuss some features that may be difficult to locate or describe otherwise.
The virtual fieldwork via 3D online models on the screen suffered mainly from the emergency context of the 2020 lockdown and from the relative lack of preparedness of our team in using 3D online platforms such as Sketchfab or V3Geo (Buckley et al., 2021). Our attempt therefore suffered from several technical limitations that will be overcome in the future but also from inherent issues due to fully remote teaching. The use of a free Sketchfab account limited in features imposed a reduction in the size of the model, preventing a detailed analysis of some fine structures and forcing the students to explore a limited part of the global DEM (for instance, the model is cut in the middle of a dejection cone that is therefore difficult to identify). Scale and orientation markers were not provided at the time but could be loaded in the 3D model directly via free software like 3D Builder or Blender (see https://skfb.ly/onW7t (last access: 3 December 2021), for instance). Interactive tools were not used at that time, but some promising new functions have been developed and could be used in the future (see https://labs.sketchfab.com/experiments/measurements/#!/models/3070ae00d83844e680ead63292140e43 (last access: 3 December 2021) for distance measurements on a 3D model or associated V3Geo platform tools (Buckley et al., 2021)).
More importantly, as each student works on their own model, it is difficult to show structures and to guide them through the outcrop. Furthermore, there is no connection between the 3D model and the GIS project built in the first part of the lab session; therefore, no further mapping work could be done based on fieldwork measurements, thus reducing the gain of fieldwork for deeper learning by losing part of its integration into the overall teaching sequence.
When the students are immersed in their own VR environment with guidance from outside the environment (alone in the field or single-user strategy), the user experience is greatly improved. Firstly, the students are facing the outcrop and can suddenly perceive its scale and overall aspect, and they avoid common misinterpretations that can be due to localized artifacts in the DEM for instance or because no common scaling is visible at first glance on the outcrop since we are underwater (no floral or faunal elements). The shared-screen facility mentioned above is then absolutely necessary for the teacher to guide each student and provide them with personalized advice. Often spotted technical problems such as difficulties in using travel tools or the compass tool to measure plane orientation and dip can easily be detected and solved by a one-to-one discussion with the student. The discussion is highly facilitated between the teacher and each student since the teacher directly sees the zone the student is currently looking at. Some specific details can be specifically pointed at and can be orally discussed. The multiple shared-screen facility is also of great help for students that suffer from VR-induced motion sickness since they can follow their classmates exploration on a screen, share their observations, and feel less excluded from their peers' experiences (Gilley et al., 2015).
The most serious drawback of the alone in the field strategy is the difficulty for the teacher to conduct some group briefings as it is commonly done during field class and has been shown to be useful for the learning process (Lonergan and Andresen, 1988; Kent et al., 1997). In classical fieldwork situations, after leaving the students looking at the outcrop for a while, possibly with an exercise, briefings led by the teacher are times when group discussion and experience-sharing take place between students but also when the teacher can correct some misconceptions and show the students some key observations that could have otherwise been missed. In the alone in the field strategy, guidance comes only from outside the VR environment, and there is no way to share a common view of the outcrop with the group: those briefings are therefore mainly oral and too theoretical.
In this respect, the together in the field or multi-user strategy is very close to usual fieldwork teaching. Students and teachers are sharing the same virtual environment and are viewing each other as avatars whose motions are visible (which gives a sensation of reality and allow body language communication; see Fig. 5). Group briefings thus become very natural, and students can feel less isolated than in previous strategies, reinforcing the effect of domain-based learning (Boyle et al., 2007). Some drawbacks obviously remain: first, as during classical fieldwork and classes, students can be distracted and have the temptation to play with their classmate's avatar, which usually does not last long (see Fig. 5c for instance) and could also be beneficial for overall learning by creating a relaxed learning atmosphere (Boyle et al., 2007; Lonergan and Andresen, 1988). Second, as is also the case during real fieldwork, when students are exploring the outcrop on their own they can end up gathered in a specific place of the 3D model and disturb each other measurements; third, the motion of several avatars in the field of vision can increase the sickness for some users. Finally, because all microphones are shared via a video-conference facility, there is no room for private talks, chattering, or whispering. This last aspect could be useful since even the comments made in a hushed voice by shy students can be clearly heard by the teacher.
The presence of a teacher in the VR environment that is physically distant (as was tested in our case between the classroom in Lyon and the teacher in Nice) opens novel perspectives for fieldwork. Indeed, students can benefit from guidance and advice from a researcher who is an expert of a given area or discipline and could therefore present in detail how fieldwork observations are used in the current research process. Note that such work requires two teachers at the same time. A first expert is present in the VR environment. The second teacher is physically on site and can help students with controllers or discuss with students who prefer being outside VR by directly showing them structures on the shared screen.
Unfortunately, because of the sanitary restrictions that have been imposed to split the students into smaller groups and to divide the dedicated sessions into 2 h sessions rather than 4 h ones, we ran out of time to properly conduct the last steps of the lab session for both the together and alone in the field strategies. We initially wanted the students to make an observation diagram of the outcrop directly in their notebook that could eventually be assessed, but this task requires time to go in and out the VR environment. We also wanted the students to load the measurements made in VR into their QGIS project. This last step could be easily done in a standard 4 h lab session and would probably help the students synthesize 3D and 2D data together by giving them the skills to properly map their own field measurements.
4.2 Learning in VR: students feedback
In addition to direct feedback given by the students at the end or during the lab session, an online inquiry was carried out in the days following the lab session to collect the students feedback on the VR experiment. A total of 14 students answered (70 % of the whole class). The results presented in Fig. 6 give an initial overview of their feelings after this unusual lab session.
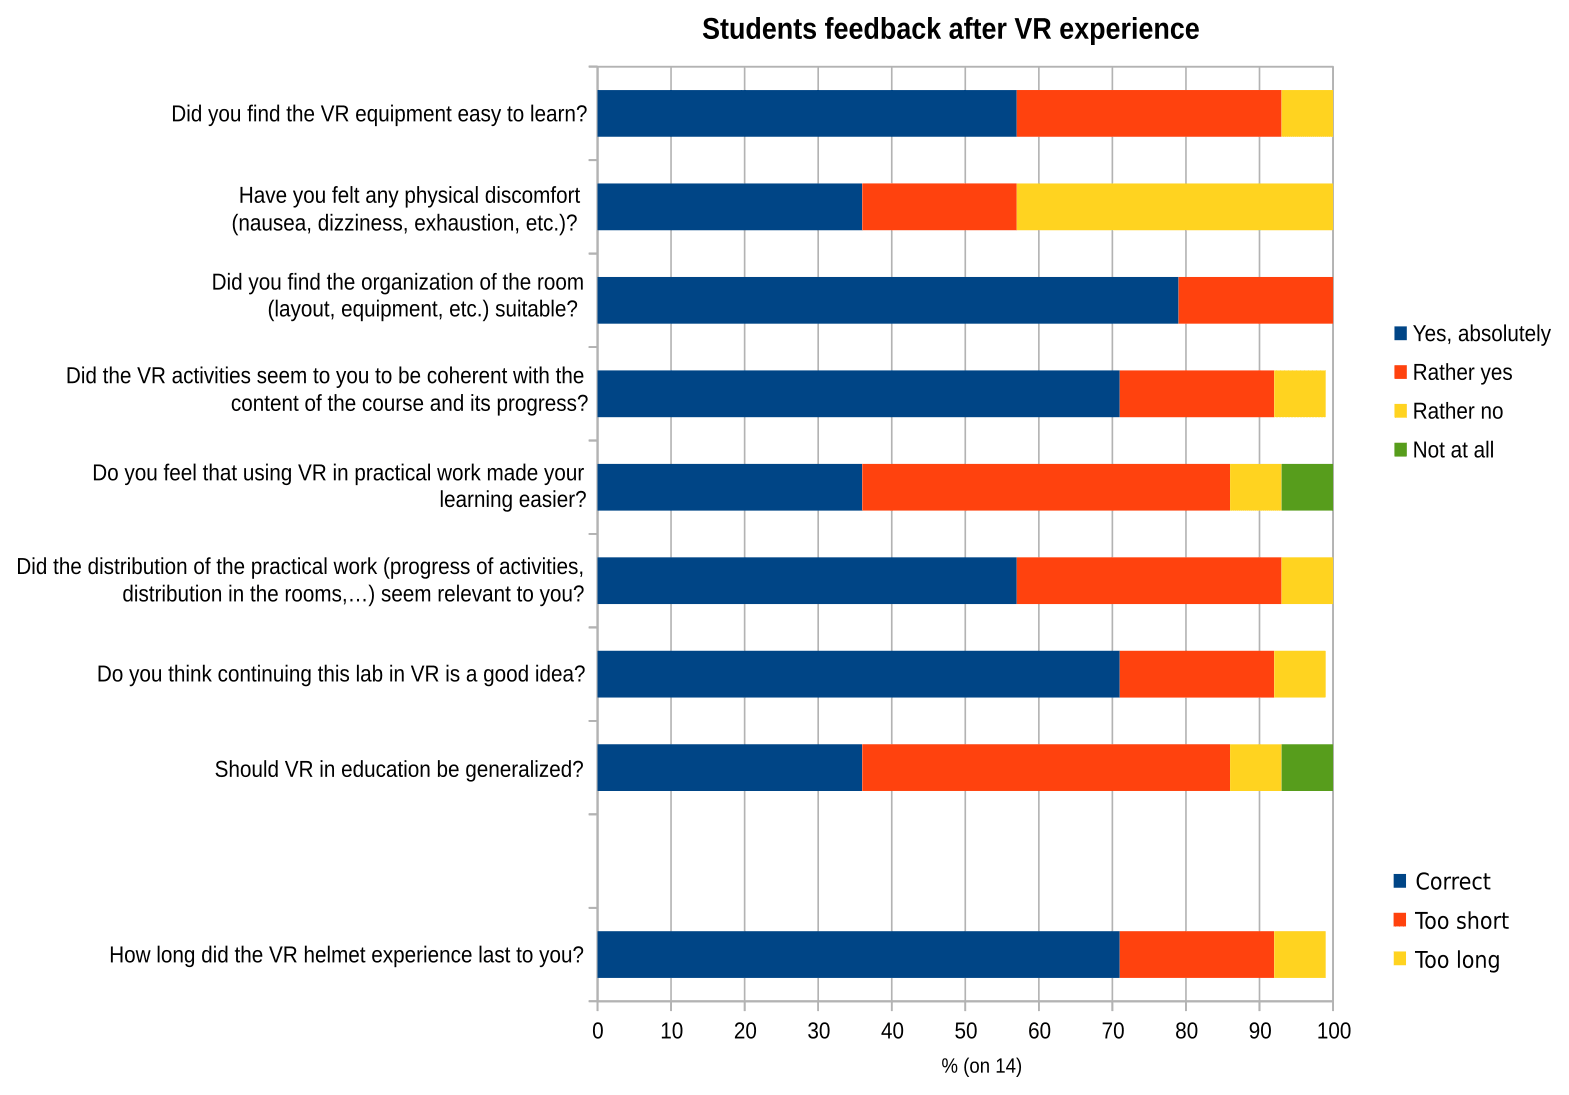
Figure 6Results from the online inquiry given to the students who participated in the VR lab session. A total of 14 out of 20 students answered. Questions have been translated from French by the authors.
It is noteworthy that 3 out of the 20 students that participated to the VR lab session in 2021 were not able to stay in the VR environment for more than few minutes because they were sick and felt uncomfortable. They were able to follow the session by looking at the projected shared screens. More than 60 % of the students who answered the survey say they experienced a certain level of discomfort, which is not negligible. However, one student that expressed concern before trying the VR because she is subject to aquaphobia (abnormal fear of water and being immersed) was able to perform very well, which is encouraging from the perspective of more inclusive fieldwork (Gilley et al., 2015).
In general, no major difficulty arises from the handling of the controllers, which is confirmed by the survey and was rather unexpected by the teaching team. The students felt that the virtual lab is adapted to the lab session and that the use of VR is both consistent with the progress of the course and could help them learning. Logically, students that felt sick were not so enthusiastic.
Some students left some detailed remarks about the VR lab session that are listed below after being translated from French by the authors.
-
“It was really great, I loved the experience and I find that it opens new perspectives if it is done in complement to the real field trips. The duration of the immersion was a bit long, we were 4 out of 5 with nausea at the end, and I had sweating that stung my eyes. Maybe the COVID mask also accentuated this effect.”
-
“It might be interesting to split the time with the VR headset with breaks to limit symptoms such as nausea, dizziness etc.”
-
“The only drawback is that it is difficult to take notes during the lab session. It must be done from memory afterwards.”
-
“Too bad not to use what we saw in the virtual lab afterwards.”
-
“Interesting even if for me nothing should replace the human contact between the teacher and the student, the VR can be a real bonus. The course was very interesting but the expectations in the field were not so clear.”
These remarks clearly point to two serious drawbacks of these first attempts to use VR in lab sessions: the physical discomfort that very often comes after an extended immersion and the need to go back to 2D mapping after the virtual fieldwork to really integrate the observations into the tectonic analysis conducted with QGIS. We also must recognize that the VR lab session took place in a very specific context, i.e. the situation of partial restrictions in teaching activities due to the COVID-19 pandemic in spring 2021 in France. This overall context has imposed the partial use of facial masks in the virtual lab and physical distancing, which could influence the student's comfort during the VR experiment.
Finally, this experiment does not allow us to definitively conclude on the efficiency of our strategies on student learning because learning outcomes were not assessed in the alone in the field and together in the field strategies conducted in 2021. Theoretical active-tectonics-related skills were tested in 2020 following the 100 % remote lab session and related course via online assessments during which students had to analyze maps presenting fault traces, focal mechanisms, and coseismic surface displacements and had to make first-order calculations based on usual scaling laws. In the future, we would like to evaluate the understanding of the Les Saintes virtual fieldwork by asking for both an interpretative structural map of the area built on QGIS and an observational scheme of the DOM.
4.3 Perspectives
In general, the together in the field or multi-user option appears to be the more promising option and should be developed in the coming years. However, both the 100 % virtual and alone in the field strategies could be improved and useful in the future depending on the intended use. If homework is expected, then it appears more appropriate to make the students work on a 3D model hosted directly on the web if interactive tools are available rather than asking them to install the Minerve software and providing them with a VR apparatus, especially since the software requires an expensive computer with a powerful graphics card. To evaluate one student's technical skills at the end of the class, the alone in the field configuration could be adapted so that no interaction could easily be done with classmates, while the teacher can follow the behavior of the student in the field.
Some technical improvements could make the VR experience more efficient and will be considered for future development in the Minerve software. There is for instance a need for a laser pointer visible by all participants in the shared virtual environment, which is for the moment not the case: each participant can see their own pointer only. Being able to recognize the students and teachers avatar could help for personalized discussions (different colors or apparent names could be included) and would reinforce the collaborative learning (Boyle et al., 2007; Lonergan and Andresen, 1988). When working in a together in the field configuration, each student can save their own measurements but cannot share them with the other participants, which could slow team work and learning (Duret et al., 2018). Finally, the sound environment could be improved using spatialization technologies that provide perception of the sound depending on the distance. These techniques are often used in video games and VR and could be implemented in Minerve (e.g., Tsingos et al., 2004, 2009).
These first lab sessions using VR and the Minerve software have been conducted during time-limited sessions that required being nearly continuously immersed in the virtual environment. This continuous immersion has two severe drawbacks: it favors physical discomfort and prevent students to taking notes or reporting observations in their notebooks, the latter being often considered as a technical skill by itself (Lonergan and Andresen, 1988). Software development will allow for taking snapshots and notes; in order to limit motion sickness, better management of the teleportation could be implemented in addition to other techniques aimed at limiting this discomfort, such as the reduction of the field of view during displacement (e.g., Fernandes and Feiner, 2016). Moreover, in the future, longer sessions will be dedicated to this virtual fieldwork, and regular pauses should be imposed on the students in order to conduct step-by-step debriefings (Lonergan and Andresen, 1988; Kent et al., 1997). This could be done via a detailed scripting of the course including exercises as schematic representations of some observations and reporting of measurements that could be assessed by the teachers. In the future, students could also work in pairs, one student being immersed in the VR environment and the other guiding and taking notes. Roles of these students pair should be exchanged during the session. Last but not least, significant time should be dedicated to uploading the measurements made in the field into the QGIS project and carrying out a final briefing.
Learning how to observe and interpret outcrops is one of the most important skills that undergraduate students in Earth sciences should learn, and field camps are still the best places to do so. However, they are sometimes impossible to set up due to major physical disabilities of the students (e.g., Gilley et al., 2015), the pandemic, or the inaccessibility of the outcrop (high-altitude or deep submarine outcrops, active volcanoes, unique outcrop located very far from the teaching location, planetary bodies, etc.). Virtual alternatives are being considered more and more by the Earth sciences community via 3D online models or virtual-reality tools, as evidenced by this special issue.
In this study we presented an attempt to take the third year undergraduate students of the Observatoire des Sciences de l'Univers de Lyon to a very-well-preserved active fault scarp and its associated coseismic rupture, a type of geological site that is rare in Metropolitan France, using exclusively free and open-source software in order to make our experiment reproducible. We take advantage of the very detailed bathymetric study conducted by the ODEMAR and SUBSAINTES French cruises in the Lesser Antilles over the Les Saintes plateau, and the Roseau fault in particular, and of the imagery and high-resolution bathymetry acquired there. This submarine fault produced the 2004 Les Saintes Mw 6.3 normal fault earthquake and is exceptionally well preserved in the bathymetry.
In a first step, the students explore the seismotectonic context of the Les Saintes earthquake using georeferenced data gathered on a QGIS project and results coming from scientific publications. In doing so, they acquire basic skills in GIS mapping that are often considered as secondary during classical fieldwork but are widely used in geosciences. Following this, we use both the Sketchfab online utility and the Minerve open-source virtual-reality software developed by Billant et al. (2019) to explore the detailed DEM and DOM of the fault scarp with the students. We chose three different configurations to conduct this virtual fieldwork that all present advantages and disadvantages that we analyze from teacher and student feedback. Based on the student and teacher feedback, we find that the Minerve virtual-reality software, when used in multi-user mode (i.e., the students are sharing the same virtual environment together with the teachers), provide a very satisfactory framework that could still be technically improved. Students can measure strike, dip, rake, and orientation and save their observations in a file that could be imported in any GIS software afterwards. Teachers find this mode very flexible. Expected learning outcomes therefore include technical skills often acquired during classical field camps, GIS mastering, and the ability to work in group. Interestingly, it is possible to combine various scales of observation from large landscape view to very fine observation on the outcrop and offer a good interactivity with the students. Moreover, a specialist of the outcrop or of the thematic can be virtually present providing that they are equipped with headset and controllers and have the Minerve software locally installed. In the future, students skills should be evaluated in a systematic way before and after the VR lab session to measure its teaching efficiency.
The students surveyed were in general enthusiastic to experiment with virtual fieldwork, and it is therefore a proper tool to increase their empathy with the discipline (Lonergan and Andresen, 1988), even if physical discomfort is common. This could be reduced by shortening the duration of the sessions in immersion in the virtual environment, ensuring breaks, and adding software solutions. Even if it is clear that a virtual observation does not replace a field observation, virtual reality could be a fantastic tool to bring students to remote or even inaccessible places such as submarine fault scarp or planetary bodies. It therefore opens new perspectives for teaching Earth sciences, and we plan to use the Minerve software in other contexts in the coming years.
The Minerve software is developed by Jérémy Billant under an open-source under an open-source license and is available on request. The centimetric DEM and DOM are not open-source but can be made available on request and is described in Billant et al. (2019). Data used during the QGIS mapping exercise are available in the Supplement, including a subset of the different 3D textured models acquired along the Roseau Fault https://doi.org/10.17882/84249 (last access: 3 December 2021).
A video of a group of students during the together in the field strategy is available from the following link: https://mediacenter.univ-lyon1.fr/videos/?video=MEDIA211029153532899 (last access: 29 October 2021, Billant and Métois, 2021). We share the view of the teacher J. Billant located in his office in Nice, while the students are all together in the virtual lab at Univ. Lyon 1. English subtitles are provided (T: teacher; S1: student 1; S2: student 2).
The supplement related to this article is available online at: https://doi.org/10.5194/se-12-2789-2021-supplement.
Nora Van Reeth, Félix Moquet, and Amandine Minjollet (iCAP, Innovation, Conception, Accompagnement pour la Pédagogie, University Lyon 1 43 Bd du 11 novembre, 69622 Villeurbanne, France)
JB developed the Minerve software. JB, MM, and JEM designed the teaching experiment and actually taught. AM helped during the lab session and the class conception. JE and FL processed and gave access to the scientific data, provided an expert external view, and were beta testers for the Minerve software. The ICAP team took care of the technical issues and helped with the use of the virtual lab. MM and JB led the writing process of this article. All authors contributed and approved its final version.
The contact author has declared that neither they nor their co-authors have any competing interests.
Publisher's note: Copernicus Publications remains neutral with regard to jurisdictional claims in published maps and institutional affiliations.
This article is part of the special issue “Virtual geoscience education resources”. It is not associated with a conference.
The authors would like to thank all the researchers, technicians, and crew involved in the ODEMAR and SUBSAINTES cruises, whose findings are open for educational purposes. We thank Christine Deplus and Nathalie Feuillet for sharing the large-scale 25 m DEM from Bathysaintes, and Aurélien Arnaubec, Klemen Istenic, and N. Gracias for their role in processing 3D data used here. We thank Julia Bozzinio and Loïc Dornel for their participation in the development of Minerve. We are grateful to L3 students from 2019–2020 and 2020–2021 promotions for their feedback and resilience during this very difficult period. Special thanks are due to Felix Moquet and Nora Van Reeth from the ICAP team (U. Lyon) for their patience in explaining VR to beginners, to Antoine Triantafyllou for useful discussions and perspectives, and Amandine Minjollet for help with the figures. The thorough comments of Gaël Caravaca and an anonymous reviewer helped us in improving the manuscript. This project was partially supported by ANR Sersurf (ANR-17-687 CE31-0020). We also thank the scientists, crew, and officers of the different cruises that acquired data used here. We also thank the QGIS development team, and we use base map and data from OpenStreetMap and the OpenStreetMap Foundation.
This research has been supported by the Agence Nationale de la Recherche (grant no. ANR-17-687 CE31-0020).
This paper was edited by Marlene Villeneuve and reviewed by Gwénaël Caravaca and one anonymous referee.
Anderson, E.: The dynamics of faulting (Oliver and Boyd, Edinburgh), GC Onyedim and JW Norman, 193, 1951. a
Arnaubec, A., Escartín, J., Opderbecke, J., Matabos, M., and Gracias, N.: Underwater 3D terrain reconstruction from video or still imagery: Processing and exploitation software (Matisse & 3DMetrics), submitted to Computers and Geosciences, 2021. a
Baroux, E., Pino, N. A., Valensise, G., Scotti, O., and Cushing, M. E.: Source parameters of the 11 June 1909, Lambesc (Provence, southeastern France) earthquake: A reappraisal based on macroseismic, seismological, and geodetic observations, J. Geophys. Res.-Sol. Ea., 108, https://doi.org/10.1029/2002JB002348, 2003. a
Bazin, S., Feuillet, N., Duclos, C., Crawford, W., Nercessian, A., Bengoubou-Valerius, M., Beauducel, F., and Singh, S.: The 2004–2005 Les Saintes (French West Indies) seismic aftershock sequence observed with ocean bottom seismometers, Tectonophysics, 489, 91–103, 2010. a
Billant, J., and Métois, M.: Submarine fieldwork using the Minerve sofware, Copernicus Publications, https://doi.org/10.5446/55071, 2021. a
Billant, J., Leclerc, F., Escartin, J., Gracias, N., Istenic, K., Arnaubec, A., Nathalie, F., and Deplus, C.: Submarine expression of the earthquake cycle: morphotectonics analysis of the normal Roseau fault (Lesser Antilles, France) from high resolution bathymetry and 3D photogrammetric models to reconstruct its slip history, in: AGU Fall Meeting Abstracts, Vol. 2018, S41D–0579, 2018. a, b
Billant, J., Bozzinio, J., Leclerc, F., Escartin, J., Gracias, N., Istenic, K., Arnaubec, A., and Garcia, R.: Performing submarine field survey without scuba gear using GIS-like mapping in a Virtual Reality environment, in: OCEANS 2019-Marseille, IEEE, 1–6, https://doi.org/10.1109/OCEANSE.2019.8867408, 2019. a, b, c
Bird, P.: An updated digital model of plate boundaries, Geochemistry, Geophysics, Geosystems, 4, https://doi.org/10.1029/2001GC000252, 2003. a
Boyle, A., Maguire, S., Martin, A., Milsom, C., Nash, R., Rawlinson, S., Turner, A., Wurthmann, S., and Conchie, S.: Fieldwork is good: The student perception and the affective domain, Journal of Geography in Higher Education, 31, 299–317, 2007. a, b, c, d, e
Buckley, S., Howell, J., Naumann, N., Lewis, C., Ringdal, K., Vanbiervliet, J., Tong, B., Maxwell, G., and Chmielewska, M.: V3Geo: A cloud-based platform for sharing virtual 3D models in geoscience, in: EGU General Assembly Conference Abstracts, EGU21–13042, 2021. a, b
Cliffe, A. D.: A review of the benefits and drawbacks to virtual field guides in today’s Geoscience higher education environment, International Journal of Educational Technology in Higher Education, 14, 1–14, 2017. a
Cornou, C., Ampuero, J.-P., Aubert, C., Audin, L., Baize, S., Billant, J., Brenguier, F., Causse, M., Chlieh, M., Combey, A., et al.: Rapid response to the Mw 4.9 earthquake of November 11, 2019 in Le Teil, Lower Rhône Valley, France, Comptes Rendus, Géoscience, 353, 1–23, 2021. a
Debese, N.: Bathymétrie – Sondeurs, traitement des données, modèles numériques de terrain – Cours et exercices corrigés (niveau C), Technosup, Ellipses, 2013. a
Deplus, C. and Feuillet, N.: BATHYSAINTES cruise, RV Pourquoi pas?, French Oceanographic Cruises, https://doi.org/10.17600/10030020, 2010. a, b
Deplus, C. and Feuillet, N.: Bathymetry from Les Saintes area (Lesser Antilles volcanic arc): 25 m grid from the Bathysaintes cruise, Seanoe, https://doi.org/10.17882/81174, 2021. a
Duret, D., Christley, R., Denny, P., and Senior, A.: Collaborative learning with PeerWise, Research in Learning Technology, 26, 1–13, 2018. a
Duverger, C., Mazet-Roux, G., Bollinger, L., Guilhem Trilla, A., Vallage, A., Hernandez, B., and Cansi, Y.: A decade of seismicity in metropolitan France (2010–2019): the CEA/LDG methodologies and observations, BSGF-Earth Sciences Bulletin, 192, 25, https://doi.org/10.1051/bsgf/2021014, 2021. a
Escartín, J. and Andreani, M.: ODEMAR cruise, RV Pourquoi Pas?, French Oceanographic Cruises, https://doi.org/10.17600/13030070, 2013. a
Escartín, J., Leclerc, F., Olive, J.-A., Mevel, C., Cannat, M., Petersen, S., Augustin, N., Feuillet, N., Deplus, C., Bezos, A., Bonnemains, D., Chavagnac, V., Choi, Y., Godard, M., Haaga, K. A., Hamelin, C., Ildefonse, B., Jamieson, J. W., John, B. E., Leleu, T., MacLeod, C. J., Massot-Campos, M., Nomikou, P., Paquet, M., Rommevaux-Jestin, C., Rothenbeck, M., Steinführer, A., Tominaga, M., Triebe, L., Campos, R., Gracias, N., Garcia, R., Andreani, M., and Vilaseca, G.: First direct observation of coseismic slip and seafloor rupture along a submarine normal fault and implications for fault slip history, Earth Planet. Sc. Lett., 450, 96–107, https://doi.org/10.1016/j.epsl.2016.06.024, 2016. a
Escartín, J., Leclerc, F., Olive, J.-A., Mevel, C., Cannat, M., Petersen, S., Augustin, N., Feuillet, N., Deplus, C., Bezos, A., et al.: First direct observation of coseismic slip and seafloor rupture along a submarine normal fault and implications for fault slip history, Earth Planet. Sc. Lett., 450, 96–107, 2016. a, b, c, d, e
Escartín, J., Le Friant, A., and Feuillet, N.: SUBSAINTES cruise, RV L Atalante, French Oceanographic Cruises, https://doi.org/10.17600/17001000, 2017. a
Fernandes, A. S. and Feiner, S. K.: Combating VR sickness through subtle dynamic field-of-view modification, in: 2016 IEEE Symposium on 3D User Interfaces (3DUI), 2016, 201–210, https://doi.org/10.1109/3DUI.2016.7460053, 2016. a
Feuillet, N., Manighetti, I., Tapponnier, P., and Jacques, E.: Arc parallel extension and localization of volcanic complexes in Guadeloupe, Lesser Antilles, J. Geophys. Res.-Sol. Ea., 107, ETG–3, https://doi.org/10.1029/2001JB000308, 2002. a
Gilley, B., Atchison, C., Feig, A., and Stokes, A.: Impact of inclusive field trips, Nat. Geosci., 8, 579–580, 2015. a, b, c, d
Hughes, A., Escartín, J., Olive, J.-A., Billant, J., Deplus, C., Feuillet, N., Leclerc, F., and Malatesta, L.: Quantification of gravitational mass wasting and controls on submarine scarp morphology along the Roseau fault, Lesser Antilles, J. Geophys. Res.-Earth, 126, e2020JF005892, https://doi.org/10.1029/2020JF005892, 2021. a, b, c
Istenič, K., Gracias, N., Arnaubec, A., Escartín, J., and Garcia, R.: Automatic scale estimation of structure from motion based 3D models using laser scalers in underwater scenarios, ISPRS Journal of Photogrammetry and Remote Sensing, 159, 13–25, 2020. a, b, c, d
Janiszewski, M., Uotinen, L., Merkel, J., Leveinen, J., and Rinne, M.: Virtual Reality learning environments for rock engineering, geology and mining education, in: 54th US Rock Mechanics/Geomechanics Symposium, American Rock Mechanics Association, 2020. a
Jitmahantakul, S. and Chenrai, P.: Applying virtual reality technology to geoscience classrooms, Review of International Geographical Education Online, RIGEO, 9, 577–590, https://doi.org/10.33403/rigeo.592771, 2019. a
Kent, M., Gilbertson, D. D., and Hunt, C. O.: Fieldwork in geography teaching: A critical review of the literature and approaches, Journal of Geography in higher education, 21, 313–332, 1997. a, b
Klippel, A., Zhao, J., Jackson, K. L., La Femina, P., Stubbs, C., Wetzel, R., Blair, J., Wallgrün, J. O., and Oprean, D.: Transforming earth science education through immersive experiences: Delivering on a long held promise, Journal of Educational Computing Research, 57, 1745–1771, 2019. a
Leclerc, F., Feuillet, N., and Deplus, C.: Interactions between active faulting, volcanism, and sedimentary processes at an island arc: Insights from Les Saintes channel, Lesser Antilles arc, Geochemistry, Geophysics, Geosystems, 17, 2781–2802, 2016. a, b, c, d
Lonergan, N. and Andresen, L. W.: Field-based education: Some theoretical considerations, Higher education research and development, 7, 63–77, https://doi.org/10.1080/0729436880070106, 1988. a, b, c, d, e, f, g
Masson, C., Mazzotti, S., Vernant, P., and Doerflinger, E.: Extracting small deformation beyond individual station precision from dense Global Navigation Satellite System (GNSS) networks in France and western Europe, Solid Earth, 10, 1905–1920, https://doi.org/10.5194/se-10-1905-2019, 2019. a
Mead, C., Buxner, S., Bruce, G., Taylor, W., Semken, S., and Anbar, A. D.: Immersive, interactive virtual field trips promote science learning, Journal of Geoscience Education, 67, 131–142, 2019. a
Mogk, D. W. and Goodwin, C.: Learning in the field: Synthesis of research on thinking and learning in the geosciences, Geological Society of America Special Papers, 486, 131–163, 2012. a
Olive, J.-A. and Behn, M. D.: Rapid rotation of normal faults due to flexural stresses: An explanation for the global distribution of normal fault dips, J. Geophys. Res.-Sol. Ea., 119, 3722–3739, 2014. a
Petcovic, H. L., Stokes, A., and Caulkins, J. L.: Geoscientists’ perceptions of the value of undergraduate field education, GSA Today, 24, 4–10, 2014. a
QGIS Development Team: QGIS Geographic Information System, QGIS Association, available at: https://www.qgis.org, last access: 3 December 2021. a
Ritz, J.-F., Baize, S., Ferry, M., Larroque, C., Audin, L., Delouis, B., and Mathot, E.: Surface rupture and shallow fault reactivation during the 2019 Mw 4.9 Le Teil earthquake, France, Commun. Earth Environ., 1, 1–11, 2020. a
Tsingos, N., Gallo, E., and Drettakis, G.: Perceptual audio rendering of complex virtual environments, ACM Transactions on Graphics (TOG), 23, 249–258, 2004. a
Tsingos, N., Viaud-Delmon, I., and Alloza, D.: Réalité virtuelle: Simulation sonore en trois dimensions par Nicolas Tsingos, Phobies à l'épreuve du virtuel, entretien avec Isabelle Viaud-Delmon; propos recueillis par Dominique Chouchan, Le jeu vidéo est un produit de très haute technologie par David Alloza, Les Cahiers de l'INRIA-La Recherche, 4–8, 2009. a
- Abstract
- Introduction
- Digital outcrop model visualization: from research to teaching
- Experience design: an introduction to active tectonics
- Discussion
- Conclusions
- Code and data availability
- Video supplement
- Team list
- Author contributions
- Competing interests
- Disclaimer
- Special issue statement
- Acknowledgements
- Financial support
- Review statement
- References
- Supplement