the Creative Commons Attribution 4.0 License.
the Creative Commons Attribution 4.0 License.
 | 13 Jan 2021
Characterization of discontinuities in potential reservoir rocks for geothermal applications in the Rhine-Ruhr metropolitan area (Germany)
Martin Balcewicz
Benedikt Ahrens
Kevin Lippert
Erik H. Saenger
The importance of research into clean and renewable energy solutions has increased over the last decade. Geothermal energy provision is proven to meet both conditions. Therefore, conceptual models for deep geothermal applications were developed for different field sites regarding different local conditions. In Bavaria, Germany, geothermal applications were successfully carried out in carbonate horizons at depths of 4000 to 6000 m. Matrix permeability and thermal conductivity was mainly studied in karstified carbonates from the Late Jurassic reef facies. Similar to Bavaria, carbonates are located in the east of the Rhenohercynian Massif, in North Rhine-Westphalia (NRW), for which quantification of the geothermal potential is still lacking. Compared to Bavaria, a supraregional carbonate mountain belt is exposed at the Remscheid-Altena anticline (in NRW) from the Upper Devonian and Lower Carboniferous times. The aim of our study was to examine the potential geothermal reservoir by field and laboratory investigations. Therefore, three representative outcrops in Wuppertal, Hagen-Hohenlimburg, and Hönnetal were studied. During field surveys, 1068 discontinuities (139 open fractures without any filling, 213 joints, 413 veins filled with calcite, and 303 fractures filled with debris deposits) at various spatial scales were observed by scanline surveys. These discontinuities were characterized by trace length, true spacing, roughness, aperture, and filling materials. Discontinuity orientation analysis indicated three dominant strike orientations in NNW–SSE, NW–SE, and NE–SW directions within the target horizon of interest. This compacted limestone layer (Massenkalk) is approximately 150 m thick and located at 4000 to 6000 m depth, dipping northwards at a dip angle of about 30 to 40∘. An extrapolation of the measured layer orientation and dip suggests that the carbonate reservoir could hypothetically extend below Essen, Bochum, and Dortmund. Our combined analysis of the field and laboratory results has shown that it could be a naturally fractured carbonate reservoir. We evaluated the potential discontinuity network in the reservoir and its orientation with respect to the prevailing maximum horizontal stress before concluding with implications for fluid flow: we proposed focusing on prominent discontinuities striking NNW–SSE for upcoming geothermal applications, as these (1) are the most common, (2) strike in the direction of the main horizontal stress, (3) have a discontinuity permeability that significantly exceeds that of the reservoir rock matrix, and (4) only about 38 % of these discontinuities were observed with a calcite filling. The remaining discontinuities either showed no filling material or showed debris deposits, which we interpret as open at reservoir depth. Our results indicate that even higher permeability can be expected for karstified formations related to the reef facies and hydrothermal processes. Our compiled data set, consisting of laboratory and field measurements, may provide a good basis for 3D subsurface modelling and numerical prediction of fluid flow in the naturally fractured carbonate reservoir.
- Article
(9620 KB) - Full-text XML
- BibTeX
- EndNote


The Rhine-Ruhr metropolitan region in western Germany is one of the largest metropolitan areas in Europe. It has the largest European district heating network (AGFW, 2009) and is one of the largest energy systems in the world that is predominantly fed by fossil fuels (Klaus et al., 2010). In recent decades, the Ruhr metropolitan area has been subject to structural changes associated with the ending of traditional coal mining and steel industry, as well as accelerated urbanization. Considering effective climate change, these processes pose local to global challenges for a post-fossil energy future. The polycentric structure of the Rhine-Ruhr area is particularly promising for the requirements imposed by the energy transition (Wegener et al., 2019). To account for the increasing demand for energy supply (e.g., Scheer et al., 2013; Araújo, 2014), the successful implementation of sustainable non-fossil energy concepts, such as geothermal energy projects, is required (Fridleifsson et al., 2008; Goldstein et al., 2011).
In recent years, many economically successful geothermal energy projects in Bavaria, southern Germany, have been realized and could serve as a valuable model for the Rhine-Ruhr area. The Bavarian part of the South German Molasse Basin has a high hydrothermal energy potential (Schellschmidt et al., 2010; Böhm et al., 2010; Stober, 2014; Homuth, 2014), which can be extracted from pre-existing discontinuity and karst systems in deep carbonate rocks (e.g., limestone deposits Fritzer et al., 2010). Similar to deep Bavarian deposits, carbonate rocks were accumulated in western Germany. Geothermal systems aiming for comparable geological carbonate horizons in the Rhine-Ruhr area, located at depths relevant for deep geothermal applications (DEKORP Research Group, 1990), are promising solutions to initiate the energy transition (Knutzen, 2017). A feasibility study including extensive subsurface reservoir characterization and local geological site assessment is essential to describe the hydrothermal potential of presumably fractured and faulted carbonates in the Rhine-Ruhr area.
The estimation and description of individual discontinuities and entire discontinuity networks in deep reservoirs is of elementary importance when it comes to reservoir characterization. Discontinuities and discontinuity networks have a decisive influence on the fluid flow within the reservoir (e.g. Odling et al., 1999) and also on its stability (e.g. Cappa et al., 2005). They are typical observations at analogue outcrops and can be measured there (see review by Bonnet et al., 2001). While the origin of these typically tectonically driven discontinuities can be discussed extensively, the influence on reservoir permeability is obvious. Compared to the matrix permeability of the host rock, the permeability of discontinuities is generally several orders of magnitude higher (e.g. Nelson and Handin, 1977; Kranz et al., 1979; Evans et al., 1997; Ahrens et al., 2018). Detailed discontinuity analysis is essential to model reservoir quality, optimal well location, and well performance (Nelson, 2001). Field surveys are both the first and one of the most crucial steps in the exploitation of the reservoir (van Golf-Racht, 1982; Agosta et al., 2010), i.e. the investigation of the discrete fracture network (DFN). Furthermore, since direct information on in situ properties is limited and inaccessible (e.g. seismic tomography or well and borehole data), outcrop characterizations and laboratory measurements can provide the basis for reservoir characterization and the estimation of the potential reservoir behaviour under in situ conditions.
In this integrated study, we examine the geothermal potential of deep carbonates in the Rhine-Ruhr area by combining field and laboratory investigations of pre-existing discontinuities and discontinuity networks at outcrop and sample scales. The combined analysis of field and laboratory measurements allows us to describe the potential carbonate reservoir by characterizing its natural fracture systems. Three outcrop analogues on the eastern side of the northern Rhenohercynian Massif have been chosen for field survey and sample collection. All quarries are located within the Devonian Reef Complex. The dominant stratigraphic unit in those quarries is the Massenkalk facies from the Middle and Upper Devonian (Krebs, 1970; Paeckelmann, 1979; Schudack, 1993). Dominant discontinuity systems and different facies have been documented and sampled. Most of these measurements have been conducted by one-dimensional scanline surveys (Priest and Hudson, 1976, 1981). Representative fresh rock samples have been taken directly from the outcrop wall and petrophysically characterized by different laboratory methods.
In the following, we first introduce the geology of the Devonian Reef Complex. We proceed by describing the outcrops and the employed field and laboratory methods. Following the presentation of the measurements results, we conclude by discussing the geothermal potential of the geological subsurface model, i.e. the deep carbonate layers and their discontinuity systems.
2.1 Geological setting: the Devonian Reef Complex
The Rhenohercynian Massif is the northernmost mountain belt of Europe, which shows the results of the Hercynian orogeny with its numerous northeast striking folds and thrusts at the northern edge. During the early Devonian a passive continental margin developed south of Laurussia, which was affected by crustal thinning. A shelf sea formed above the thin crust, which is called the Rhenish-Hercynian Basin. The shallow sea, which ranged from Brittany across Belgium to Germany, was filled with clastic shelf deposits and carbonates from Laurussia. During the Early Devonian, the sedimentation in the offshore belt decreased, and the horizons are characterized by a transition from siliceous, deltaic shallow marine environments (Rhenish facies) to open marine shale and purely limestone-dominated facies (Hercynian facies) (Krebs, 1970; Grabert, 1998; Pas et al., 2013; Meschede, 2018). In the late Middle Devonian, the continued northwestward movement favoured the growth of submarine volcanic mounds and thus also that of carbonates and coral and stromatoporoid reefs on the shelf (Jux, 1960; Grabert, 1998; Dallmeyer et al., 2013; Franke et al., 2017). Along the coast of Laurussia an elongated reef complex developed, the so-called Devonian Reef Complex (Krebs, 1970). In the Late Devonian, the first coral reefs disappeared in the course of the Late Devonian extinction (Kellwasser event), which was first favoured by a marine transgression and then by rapid regression (e.g. Meschede, 2018).
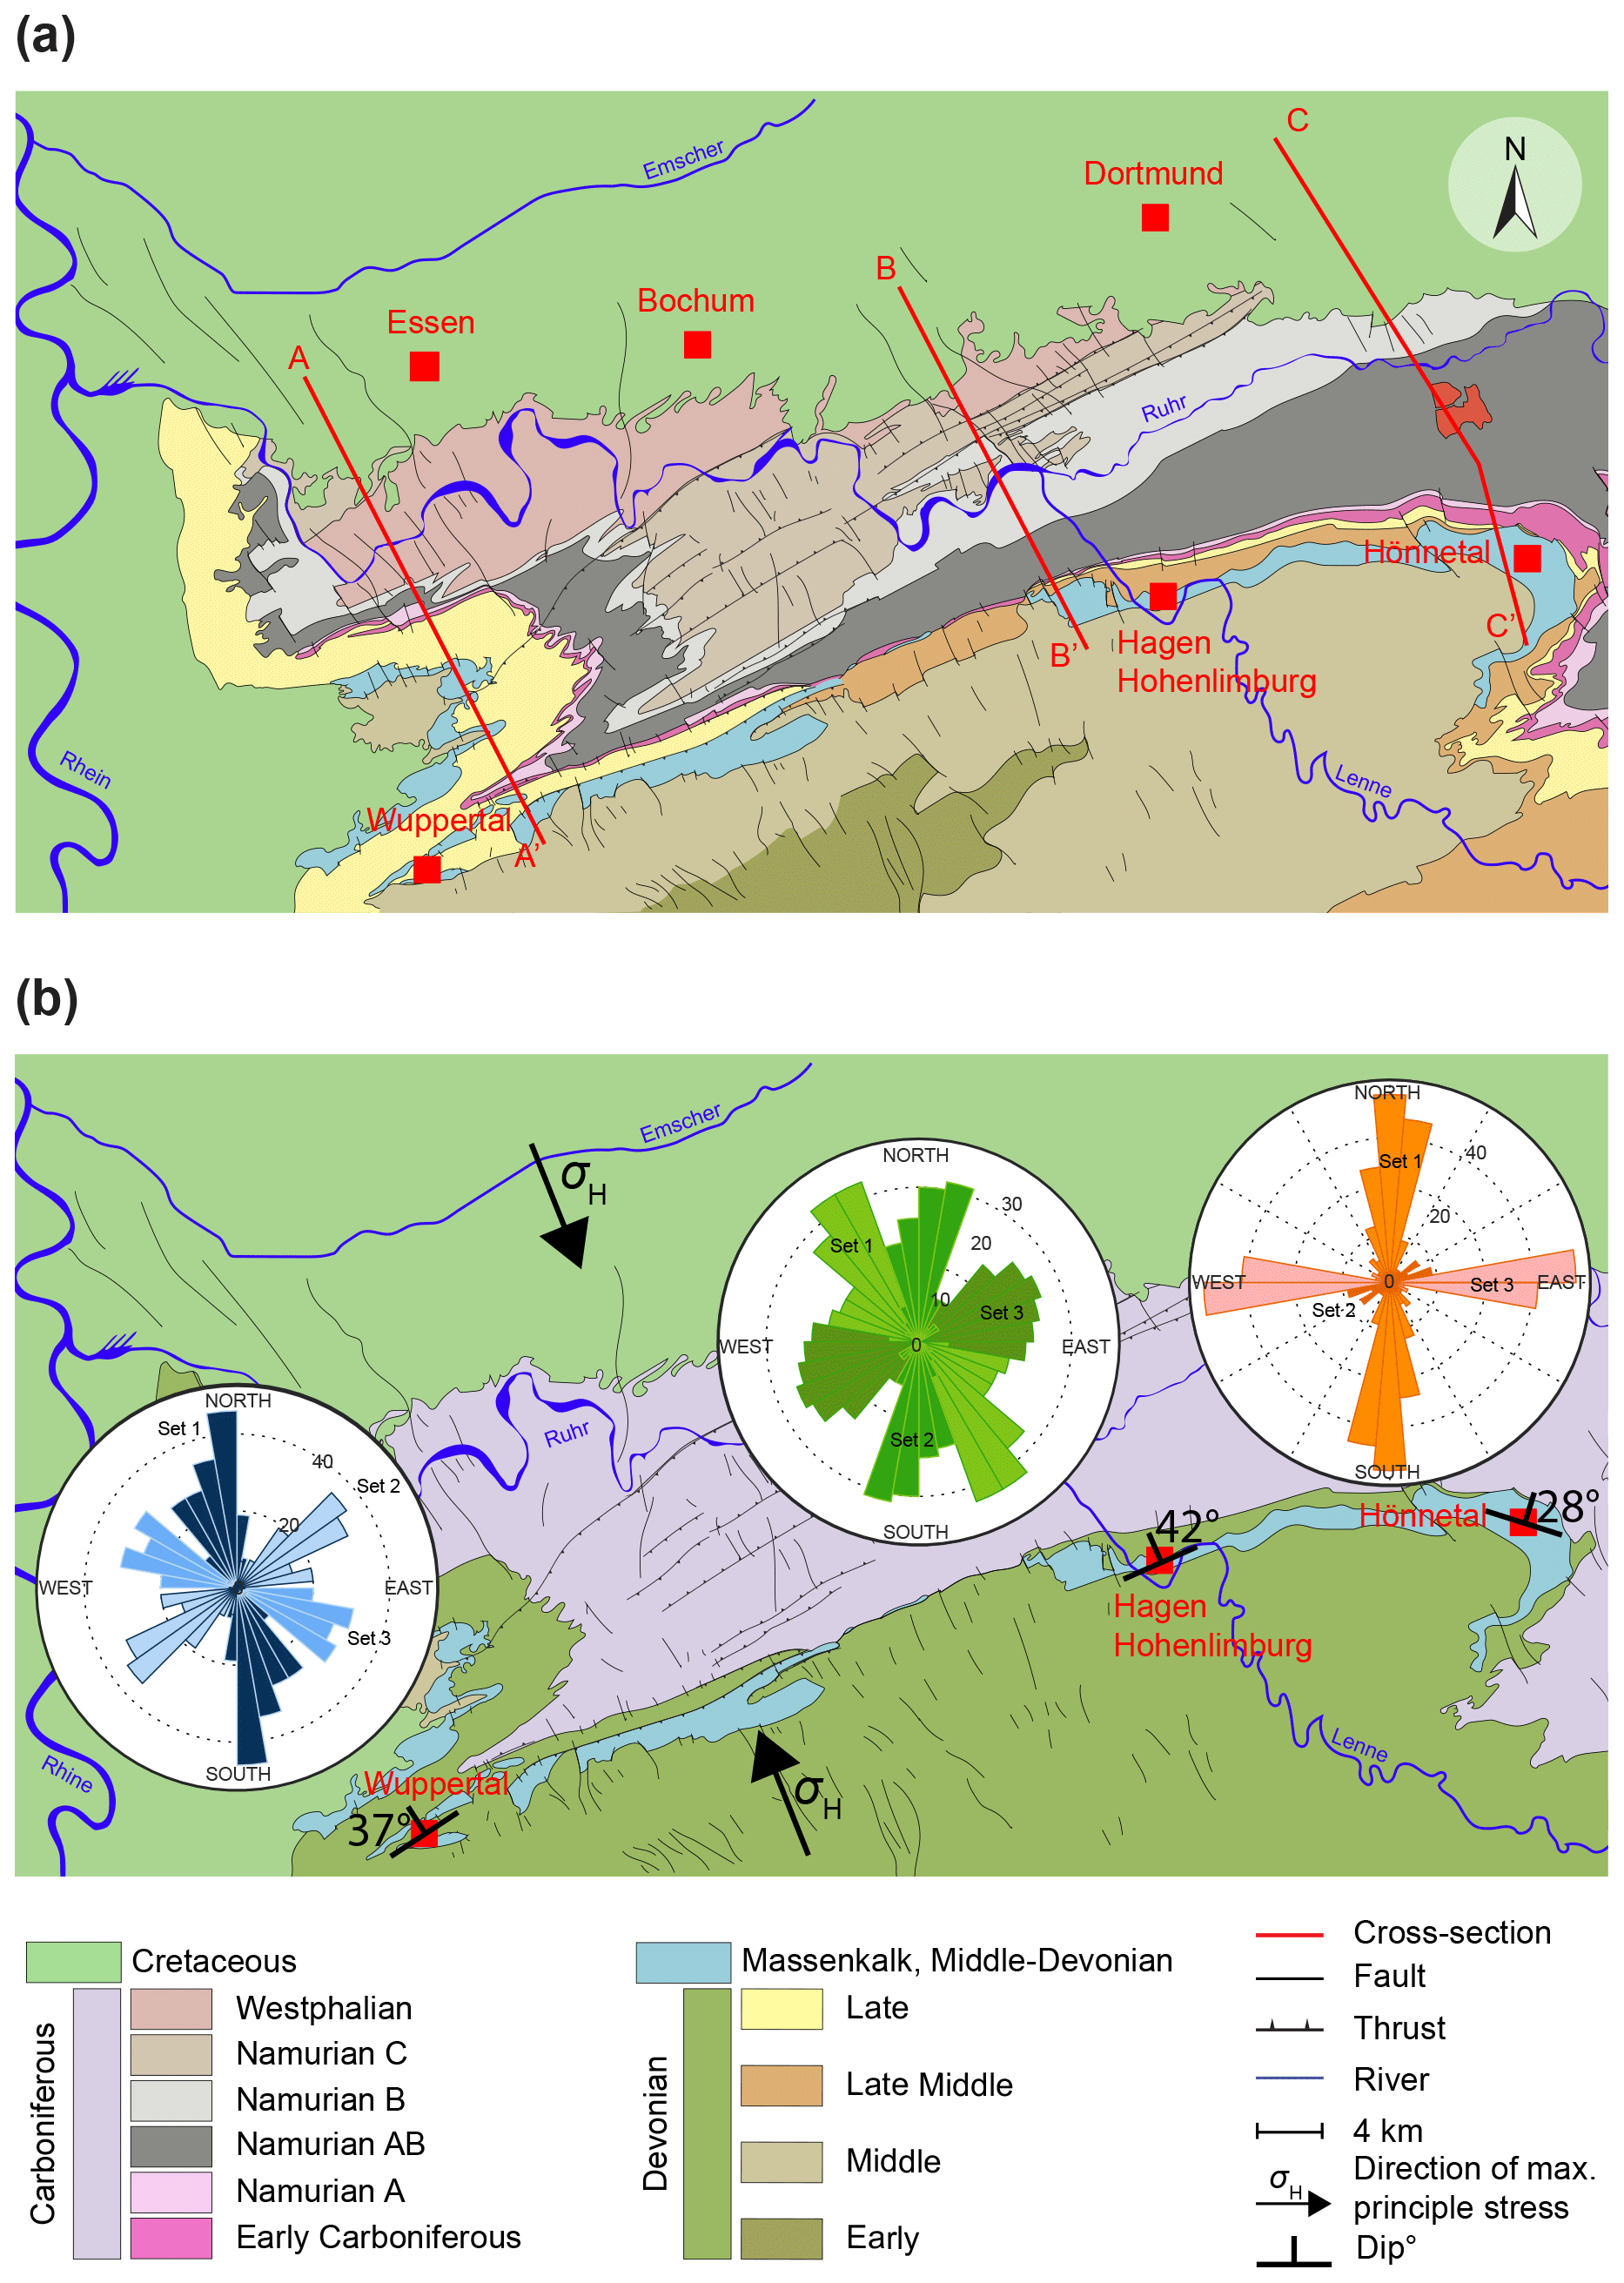
Figure 1(a) Simplified geological map of the Rhine-Ruhr metropolitan area, Germany (modified from Jansen et al., 1986; Drozdzewski et al., 2007). Here, three stone pits have been chosen for field surveys: Osterholz (Wuppertal), Oege (Hagen), and Asbeck (Hönnetal), which are part of the Devonian Reef Complex (Massenkalk). The red lines indicate the three geological cross sections as shown in Fig. 2. In panel (b), the geological map from panel (a) was further simplified, and in addition the rose diagrams of the discontinuity sets as measured by scanline investigations at the quarries in Wuppertal (blue), Hagen-Hohenlimburg (green), and Hönnetal (orange) are added (for more detail, see Figs. 4 to 6). The arrows indicate the direction of maximum horizontal stress σH according to the World Stress Map (Heidbach et al., 2016). The specific directions and angles of incidence of the investigated, exposed limestone layers are also shown in panel (b).

Figure 2Simplified cross sections of the Remscheid-Altena anticline (modified after Jansen et al., 1986; Drozdzewski et al., 2007). The exact position and orientation of the three cross sections is illustrated in Fig. 1a.
The Devonian Reef Complex extends over the area from Neandertal (Düsseldorf) across Dornap, Wuppertal, Schwelm, Hagen-Hohenlimburg, Letmathe, Sundwig, Iserlohn, Hemer, and Balve (Fig. 1a). Furthermore, these horizons can also be observed from drilling in northern Germany (e.g. Fig. 2; Hesemann, 1965, Münsterland 1). During the Early Carboniferous, the sedimentation changed during the closure of the Rhenohercynian basin. Primarily caused by tipping blocks and faults, first greywacke turbidites and second a quartz-rich sandstone was deposited in the foreland. Marine regressions occurred due to the mentioned sediment deposits. This was followed by a gradual subsidence of the bedrock. These periodic marine transgressions (i.e. sea level rises) and regressions (i.e. sea level falls) can be followed in the Upper Carboniferous Ruhr sequences (cyclothems) in today's Rhine-Ruhr area. From the Lower Carboniferous onwards, the deposited sediments were compacted and folded by the Hercynian orogeny. In the meantime, the thick sediment accumulations (3 to 12 km) were thrusted by reactivated listric normal faults during the NW movement (Oncken, 1997; Franke et al., 1990; Engel et al., 1983; Franke and Engel, 1982; Holder and Leversidge, 1986; Meschede, 2018). Between the Early Triassic and the Late Cretaceous at least two further extension sequences developed, which caused a NE–SW-directed shortening (Brix et al., 1988; Drozdzewski and Wrede, 1994). Since the Eocene, the complex tectonic environment is affected by another extension regime (Kley, 2013).
2.2 Study area
Three stone pits have been chosen for field studies within the Devonian Reef Complex: (1) Osterholz stone pit, located in Wuppertal; (2) Oege quarry, located in Hagen-Hohenlimburg; and (3) Asbeck quarry, located in Hönnetal (Fig. 1a). The outcrops in Osterholz, Oege, and Asbeck are active open-pit mines and are driven by the following independent companies: Kalkwerke H. Oetelshofen GmbH & Co. KG, Hohenlimburger Kalkwerke GmbH, and Rheinkalk GmbH, respectively. The entrances of the three quarries are located at (1) 51.248219∘ N, 7.042342∘ E, (2) 51.347811∘ N, 7.581534∘ E, and (3) 51.400452∘ N, 7.842271∘ E (Fig. 3). In the following, the outcrops will be referred according to their geographical location: Wuppertal (WOH), Hagen-Hohenlimburg (HKW), and Hönnetal (HLO).
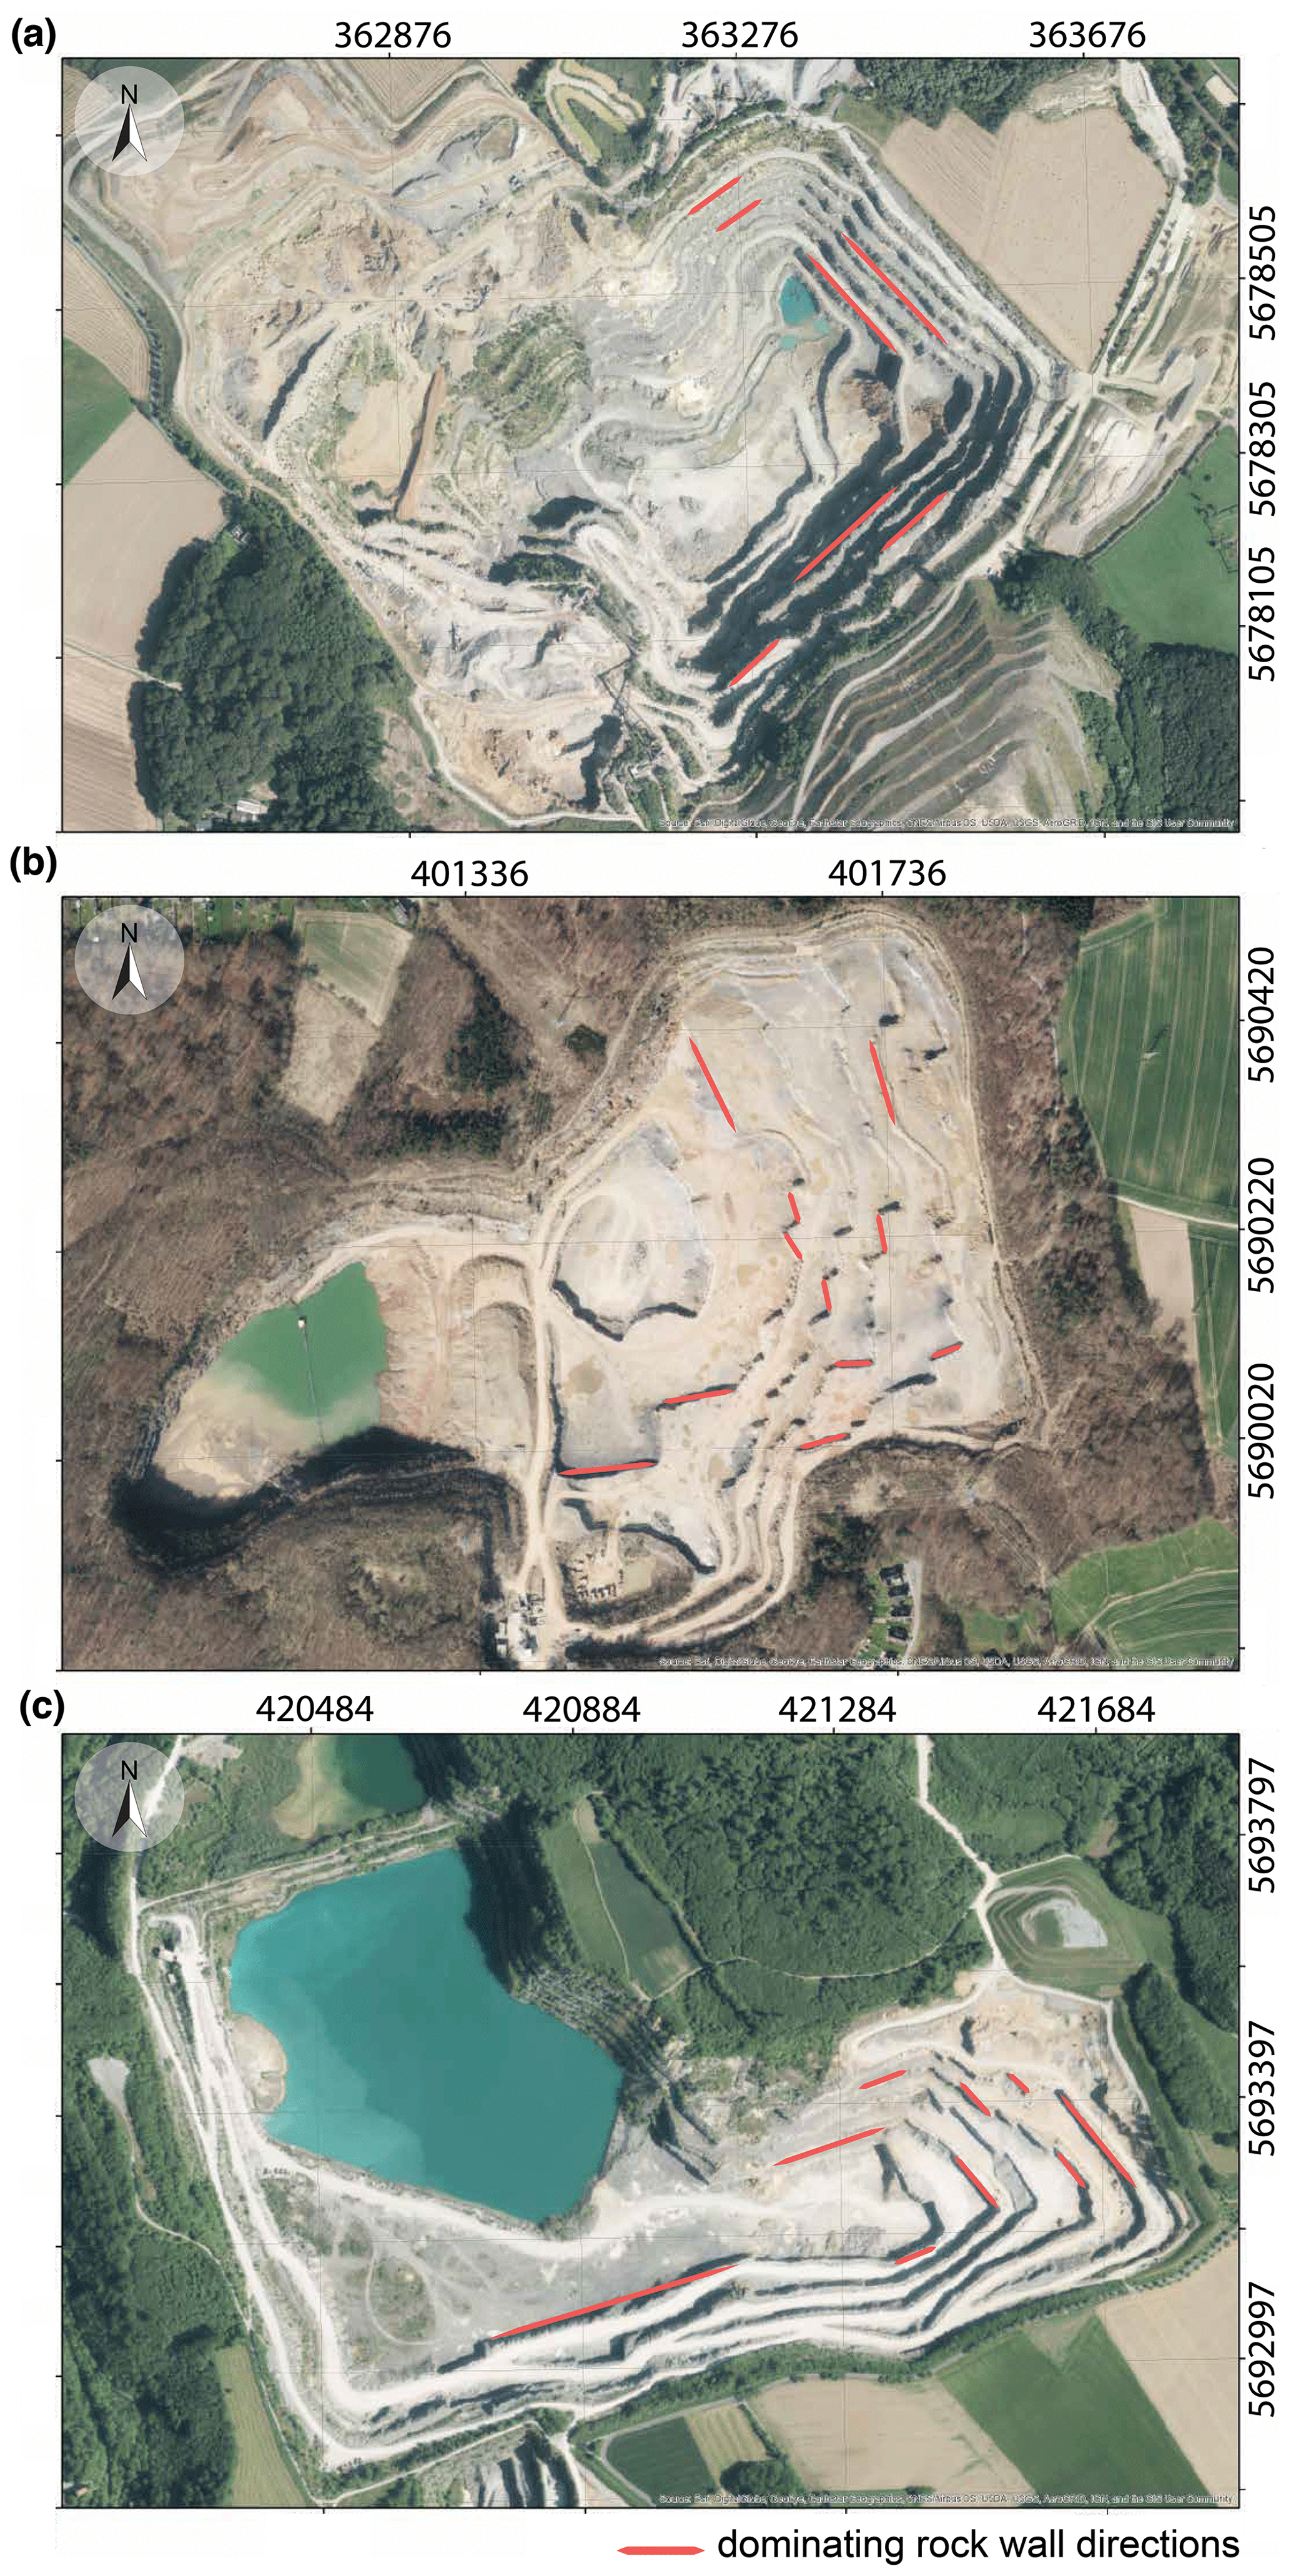
Figure 3Map view of all three study areas in which scanline surveys were carried out: (a) the Osterholz stone pit, which is operated by Kalkwerke H. Oetelshofen GmbH & Co. KG in Wuppertal; (b) the Oege stone pit, operated by Hohenlimburger Kalkwerke GmbH in Hagen-Hohenlimburg; (c) the Asbeck rock mine, managed by Lhoist Deutschland, Rheinkalk GmbH in Hönnetal. Red lines indicate the predominant rock walls, i.e. the direction of the mining. In each of the three outcrops there were two dominant mining directions, which were approximately perpendicular to each other. This figure was created using ArcGIS® software by Esri (Basemap, World Imagery: http://www.arcgis.com/home/item.html?id=10df2279f9684e4a9f6a7f08febac2a9, last access: 24 March 2020). © ArcGIS and ArcMap™ are the intellectual property of Esri and are used herein under license. © Esri. All rights reserved. For more information about Esri™ software, please visit http://www.esri.com (last access: 24 March 2020).
The Osterholz quarry in Wuppertal is located in the Osterholz graben, which is limited by the Herzkamper syncline to the north and the Wupper river to the south (Fig. 1a). The regional geology is dominated by WSW–ENE-striking folds, which are associated with the Hercynian orogeny (Paeckelmann, 1979). This local tectonic regime was mainly affected by the Hercynian orogeny and became further compressed by recent folding processes in the south. The stratigraphic unit of the quarry Osterholz in Wuppertal is Upper Givetian (approx. 382 Ma), primarily the Schwelm facies (according to Krebs, 1970). The studied limestone layers, with a mean thickness of 1 to 5 m, showed greyish, compacted layers of well-bedded carbonates with corals, stromatoporoids, and bioclastic materials. This approximately 150 m thick horizon sits on top of dolomitic carbonates and is related to the brachiopoda- and coral-rich series or stromatoporoid series. The limestone bed boundaries show mechanical and fracture stratigraphy.
The regional tectonic structure is characterized by the Remscheider anticline, the Ennepe thrust, and the Großholthausener fault in Hagen-Hohenlimburg (Fig. 1a). In the Remscheider anticline's northern limb, where the studied quarry was set, the Hasper anticline and Voerder syncline are located. Both folds are monoclines, and their steep limbs rapidly end when intersecting the regional strike–slip fault, the Großholthausener fault. The Oege quarry in Hagen-Hohenlimburg is based in the eastern part of the Großholthausener fault. Krebs (1970), Flügel and Hötzl (1976), and Koch-Früchtel and Früchtel (1993) characterized the local compacted limestone in the quarry Oege as Schwelm facies. The quarry is enriched in dolomite due to hydrothermal veins (von Kamp and Ribbert, 2005). These dolomitic carbonates manifest in a high degree of fractured blocks and karst formations, which were filled by Tertiary and Cretaceous sediments, respectively. The carbonates, which were untouched by the hydrothermal veins, contain brachiopoda, bivalves, crinoids, corals, gastropoda, stromatoporoids and micrite. These carbonates are identified as Middle Devonian (Givetian according to Basse et al., 2016).
The Asbeck quarry in Hönnetal is located to the north of the Remscheid-Altena anticline (Fig. 1a). The exposed compacted limestone deposits dip gently to the north and are surrounded by Lower Devonian sediments in the south and Upper Devonian to Lower Carboniferous sediments to the north. The regional setting is dominated by NNW–SSE-striking strike–slip faults, which are associated with the folding mechanics during Hercynian orogeny like the Großholthausener fault in Hagen-Hohenlimburg (Paeckelmann, 1938). Those strike–slip faults can be tracked along with the major Remscheid-Altena anticline structure. At the most eastern part of the Remscheid-Altena anticline, the fold's tip plunges in the NNE direction. The local stratigraphy of the Asbeck quarry in Hönnetal consists of an initial bank stadium (Schwelm facies) that developed into a true bioherm complex, i.e. Dorp facies (Becker et al., 2016). Schudack (1993) has investigated the different facies and cyclic depositions of the reef and back-reef lagoon facies and subdivided these facies into six subfacies, which were investigated in more detail by Kloke (2007). The greyish, highly compacted limestones (approx. 600 m thickness) containing corals, stromatoporoids, and brachiopods are associated with late Middle Devonian (Givetian) or early Late Devonian (Frasnian). Except for some minor parts that were mentioned by Kloke (2007), no dolomitic rocks were documented.
The mean bedding orientation in the quarries Wuppertal, Hagen-Hohenlimburg, and Hönnetal is approximately 327, 345, and 18∘ in dip direction, with an average dip angle of about 37, 42, and 28∘. Each stone pit's working levels were approximately oriented perpendicular to each other and strike NNW–SSE and NE–SW (Fig. 3).
2.3 Field method and theoretical estimation: 1D outcrop scanline surveys and 2D discontinuity connectivity
The term discontinuity and its origin can be looked up in many textbooks on structural and engineering geology (e.g. Priest, 1995). In the following, we define a discontinuity as a weak zone within a rock mass that can be referred to as a fracture, joint, vein, or fault. Unlike the International Society for Rock Mechanics (ISRM, 1978), we neglect weak bedding planes or schistosity planes in the field surveys. Nevertheless, we distinguish between natural discontinuities, which are associated with geological origins, and artificial discontinuities, which result from anthropogenic processes (e.g. drilling, blasting, or excavation).
Table 1Overview of the documented discontinuity properties and their classification as defined for scanline surveys (modified from Markovaara-Koivisto and Laine, 2012). In our observations we distinguish between open, closed, and filled discontinuities. Open discontinuities are those that are neither filled with calcite nor with debris. Closed discontinuities are in fact joints. Filled discontinuities are not categorized as closed ones, since both discontinuity surfaces are not in direct contact with each other. Filled discontinuities can either be filled with calcite or with debris (i.e. veins). The roughness of the discontinuities was classified on field scale (> 10−1 m) and on a mesoscopic scale (⩽ 10−1 m).

The discontinuities were recorded by a scanline sampling technique according to Priest and Hudson (1981). The advantages and disadvantages of this method have already been discussed in detail in several studies over the last few decades (e.g. Attewell and Farmer, 1976; Priest and Hudson, 1981). Based on our field observations, we simply assume that spatially homogeneous discontinuity networks dominate in the exposures, depending on the spatial observation scale. In regions with spatially heterogeneous discontinuity networks, however, more complex methods than the scanline sampling technique are required for discontinuity characterization (e.g. Watkins et al., 2015). Following the study of Priest and Hudson (1981), our paper focuses only on the most important parts of this technique. The setting of a scanline survey is a tape line, which is fixed firmly to the exposed rock wall and shows a start and an endpoint. The length of a scanline can range from a few decimetres to several metres. Estimates of all possible error sources have shown that the number of measured and recorded discontinuities is more significant than the length of the scanline (Priest and Hudson, 1981). Therefore, we selected representative, safe rock walls for each quarry where at least 30 measurable discontinuities (number of discontinuity observations n ≥ 30) could be recorded. After the tape line was fixed, the trend and plunge angles of the tape line were measured. The trend angle reflects the orientation of the tape line ( north; south), which corresponds to the strike of the rock wall. The tape's line levelling is defined by the angle of plunge (approx. ). After the tape line was installed, each discontinuity that intersected the tape line was recorded and categorized according to the following six properties (see also Table 1):
-
Intersecting distance. The intersecting distance corresponds to the distance between each intersecting discontinuity and the fixed starting point of the tape line.
-
Discontinuity length. The installed tape line and the intersecting discontinuity meet at an intersecting point. The trace length above and below the tape towards the discontinuity tips indicates the length of the discontinuity. If both tips exceed the rock wall height, the discontinuity is recorded as “through-going”. Accordingly, discontinuities of which one or both ends are visible are categorized as “one end visible” or “both ends visible”. On rare occasions, neither end can be recorded, and thus the discontinuity is documented as “neither end visible”.
-
Orientation. The dip and dip direction of the intersecting discontinuities were recorded.
-
Roughness. Roughness is the inherent alignment and waviness of the surface at the mean level of a discontinuity. A large-area waviness may also alter the dip locally. All roughness measurements were recorded manually. Therefore, we distinguish between “smooth”, “slightly rough”, and “rough”, both on mesoscopic and field scales. On the mesoscopic scale, the discontinuity surfaces were analysed for mineral steps, stylolites, or plumose structures. On the field scale, the discontinuity roughness was determined by subjective (qualitative) and visual evaluation of wavelength measurements with a tape line. The specified roughness classes correspond to the average roughness on the respective scale.
-
Aperture. Aperture is the perpendicular distance between adjacent rock walls of a discontinuity where the space between them is filled with a material, i.e. filling. The determined values correspond to the mean apertures determined by geometric (qualitative) analysis of the respective total discontinuity lengths.
-
Filling. Filling is the material that separates the adjacent rock wall of a discontinuity and is usually weaker than the parent rock. In our study, typical filling materials are calcite, clay, or debris. These include thin mineral coatings and healed discontinuities such as quartz and calcite veins.
In spite of the above-mentioned records, it must be emphasized again how important the calculation of the intersecting angle is. Due to an irregular outcrop wall, the distance between the starting point and the recorded discontinuity (i.e. apparent spacing) is measured incorrectly. This apparent distance distorts the true orientation of the discontinuity. The true angle δ between the scanline orientation (trend and plunge) and the normal to recorded discontinuity was calculated according to
where αs, βs, αn, and βn denote the trend direction of the tape line (scanline), the plunge direction of the tape line with regard to trend orientation, and the dip direction and dip of the normal to the discontinuity, respectively. Further, the true angle δ and the apparent spacing χs between two discontinuities were used to calculate the true spacing assuming a homogeneous discontinuity pattern χr=cos (δ)χs. By evaluating the ratio of true discontinuity spacing χr and the number of discontinuity observations, the mean discontinuity spacing was determined, where λ denotes the discontinuity frequency. The evaluation of the mean discontinuity track length with respect to the required accuracy has already been discussed in detail by Priest and Hudson (1981). The authors have made various suggestions when the end of a discontinuity trace on an investigated rock wall may not be visible, for example, due to geological events or anthropogenic processes. In our study, the proposed solution for censored semi-trace length sampling was adopted to evaluate the mean discontinuity track length μi. If the distribution of trace length over the recorded rock wall follows a power-law distribution, then the frequency f(l) is given by . Following the approach of Priest and Hudson (1981), for censored semi-trace length analysis, the mean discontinuity trace length was determined according to
where μ and c denote mean population frequency and concealed trace length of the recorded discontinuity, respectively. Typically, the concealed trace length is an order of magnitude smaller than the recorded trace length. Note that discontinuities exceeding the height of the outcrop wall could be detected at the nearest level above and/or below the quarry.
In addition, the simplified 2D discontinuity connectivity of discontinuities aligned perpendicular to the examined outcrop face, i.e. the average number of discontinuity intersections per discontinuity P, was estimated for each opencast mine according to Ozkaya (2011)
where Δθjk, dj, and Lj denote the angle between the average striking directions of two discontinuity sets j and k, the number of discontinuities per total scanline length (i.e. discontinuity density), and the mean discontinuity length of each discontinuity set, respectively. In each outcrop we encountered three sets of discontinuities (n=3) in the respective investigated carbonate layers. Therefore, the average discontinuity connectivity P of each exposed carbonate layer was estimated on the basis of three average discontinuity densities and mean discontinuity lengths.
The recorded discontinuities were evaluated with MATLAB (2018) following Hudson (2005) and Markovaara-Koivisto and Laine (2012). Markovaara-Koivisto and Laine (2012) developed an open-source MATLAB code for the visualization of scanline survey results that was adapted to the purpose of this study. All measurements were recorded according to the metric system of measurement.
2.4 Laboratory measurements: petrophysical characterization of samples
During the fieldwork, loose rock blocks were taken in each quarry for further petrophysical characterization. Compacted limestones, dolomites, and red dolomitic rocks were named MKB (black Massenkalk), MKY (yellow Massenkalk), and MKR (red Massenkalk), respectively. After sampling, the rocks were named according to the sampled quarry, sampled working level, rock type, and sample number. Representative cylindrical cores with a diameter of 40 mm were extracted from each of these blocks by diamond core drilling perpendicular to the bedding direction. All samples were saw-cut perpendicular to the core axis and their end faces were ground square to the maximal possible length l. All steps of the preparation were conducted with water as coolant and for rinsing removed material. Following preparation, samples were oven-dried at 60 ∘C for about 48 h. Basic petrophysical properties were determined on identically prepared samples at ambient conditions, except permeability, which was derived under elevated pressures.
Bulk density ρgeo was calculated from the geometrical volume of the cylindrical samples and their dry masses. Grain density ρgrain was gained from pycnometer measurements on rock powder, produced by crushing and grinding of leftover rock fragments, in compliance with the German (NABau, 2011) standard. By evaluating the ratio between bulk and grain density, the total porosity was determined according to . The connected porosity, i.e. the externally accessible and connected pore volume, was determined using the difference of the masses of dry and saturated samples with distilled water (see Duda and Renner, 2013).
Ultrasonic P- and S-wave velocities, vP and vS, were determined on dry and saturated samples from first-arrival measurements using an ultrasound benchtop unit composed of a waveform generator, two identical broadband ultrasound sensors (1 MHz centre frequency and 0.5 in., i.e. 12.7 mm, diameter), and a digital storage oscilloscope (200 MHz sampling frequency). Measurements were performed parallel to the cylinder axis, i.e. the drilling direction. Velocities were calculated by dividing the sample length by the determined arrival times, less the assembly parts' travel time. Drained dynamic Young's modulus and Poisson's ratio were calculated by dry P- and S-wave velocities, vP,dry and vS,dry, and bulk density assuming isotropy (see Mavko et al., 2020). Moreover, saturated P- and S-wave velocity, vP,sat and vS,sat, and the density of the fluid-saturated sample was used to calculate undrained Poisson's ratio and Young's modulus , assuming isotropy and employing Gassmann's hypothesis (Gassmann, 1951) that S-wave velocity remains unaffected by the presence of a fluid ().
Thermal conductivity κdry of the dry sample cores was determined by a thermal conductivity scanner using an optical scanning method at ambient conditions (Popov, 1997). The scanner consists of an emitter and a measuring unit that is moved along the sample at a fixed distance. The emitted light and heat radiation are focused on the sample's surface, which heats up the sample pointwise. To ensure absolute absorption of the energy, a part of the sample, usually a strip, was painted black. Furthermore, it was ensured that the samples for thermal conductivity measurements meet the geometrical requirements for sample size in order to reduce boundary effects. Infrared temperature sensors are located at a fixed distance from the emitter (lead sulfide infrared receiver) and measure the sample's temperature difference before and after heating. The thermal conductivity was determined by comparison with known standards. In this study, we used the standards of quartz (κqtz=1.35 W (m K)−1) and titanium alloy (κTi=6.05 W (m K)−1). According to the manufacturer (Lippmann and Rauen GbR; TCS no. 2010-013), the determination of thermal conductivity is subject to an absolute error of approximately 3 %.
Permeability k of the samples was determined using Darcy's law (Darcy, 1856) and a conventional Hoek cell (Hoek and Brown, 1997) to apply the axial load, pore-fluid pressure, and confining pressure. Axial pistons and the pre-saturated samples were jacketed by a rubber tube to prevent oil from penetrating the sample, i.e. a connection between confining and pore pressure. In addition, confining and pore-fluid pressure were kept below the axial pressure. A hand pump was operated, supplying the axial load (12 MPa). A computer-controlled, high-pressure metering pump was used to apply confining pressure on the sample by compressing distilled water (10 MPa). The axial pore-fluid flow was ensured through central bores in the axial loading pistons. Distilled water was pumped from a water reservoir through the lower end face of the samples either by applying constant flow rates (0.001 to 0.15 L h−1). The lower axial loading piston was equipped with an outlet pipe discharging fluid pressure to the atmosphere (i.e. 100 kPa). The temperature and pressure of the pore fluid were measured to calculate the temperature- and pressure-dependent fluid viscosity, according to Wagner (2009). Each permeability of the samples corresponds to the arithmetic mean value of all experiments conducted with various flow rates for steady-state fluid flow conditions.
3.1 Field discontinuity observations and discontinuity connectivities
A total of 1068 discontinuity observations were recorded and classified (e.g. discontinuity type, filling, and roughness) by using the field surveys in the three outcrops in Wuppertal, Hagen-Hohenlimburg, and Hönnetal (Table 2). To map all the features of the outcrop, we decided to carry out surveys at different levels of the quarry. During the field observations in Wuppertal, scanline surveys were taken in two orientations: NNW–SSE and NE–SW (Fig. 3a). In contrast, the scanline investigations in Hagen-Hohenlimburg and Hönnetal were conducted on two exposed rock faces, each with the orientations NNW–SSE and ENE–WSW (Fig. 3b, c). Comparable scanline surveys over total lengths of 66.60, 76.15, and 62.76 m were measured in Wuppertal (461 discontinuities), Hagen-Hohenlimburg (361 discontinuities), and Hönnetal (246 discontinuities), respectively. It was found that in all quarries the majority of the discontinuities were filled (Table 2). In Wuppertal most of the discontinuities were filled with debris, whereas in the other two outcrops calcite was the dominant filling material. In general, most of the ends of all discontinuities were visible on the outcrop wall. On the field scale the discontinuities had a smooth roughness and on a smaller (mesoscopic) scale they were slightly rough. The mean discontinuity trace lengths clearly differed between the outcrops, so that the largest one was determined in Wuppertal with 6.65 m and the smallest in Hagen-Hohenlimburg with 1.23 m. The mean discontinuity spacing of the quarries were all in the same order of magnitude, amounting to 0.15, 0.24, and 0.27 m in Wuppertal, Hagen-Hohenlimburg, and Hönnetal, respectively.
Table 2Overview of the recorded properties and their classification of the measured discontinuities in the three studied outcrops in Wuppertal, Hagen-Hohenlimburg, and Hönnetal. See the text and Table 1 for a detailed description of the classes.
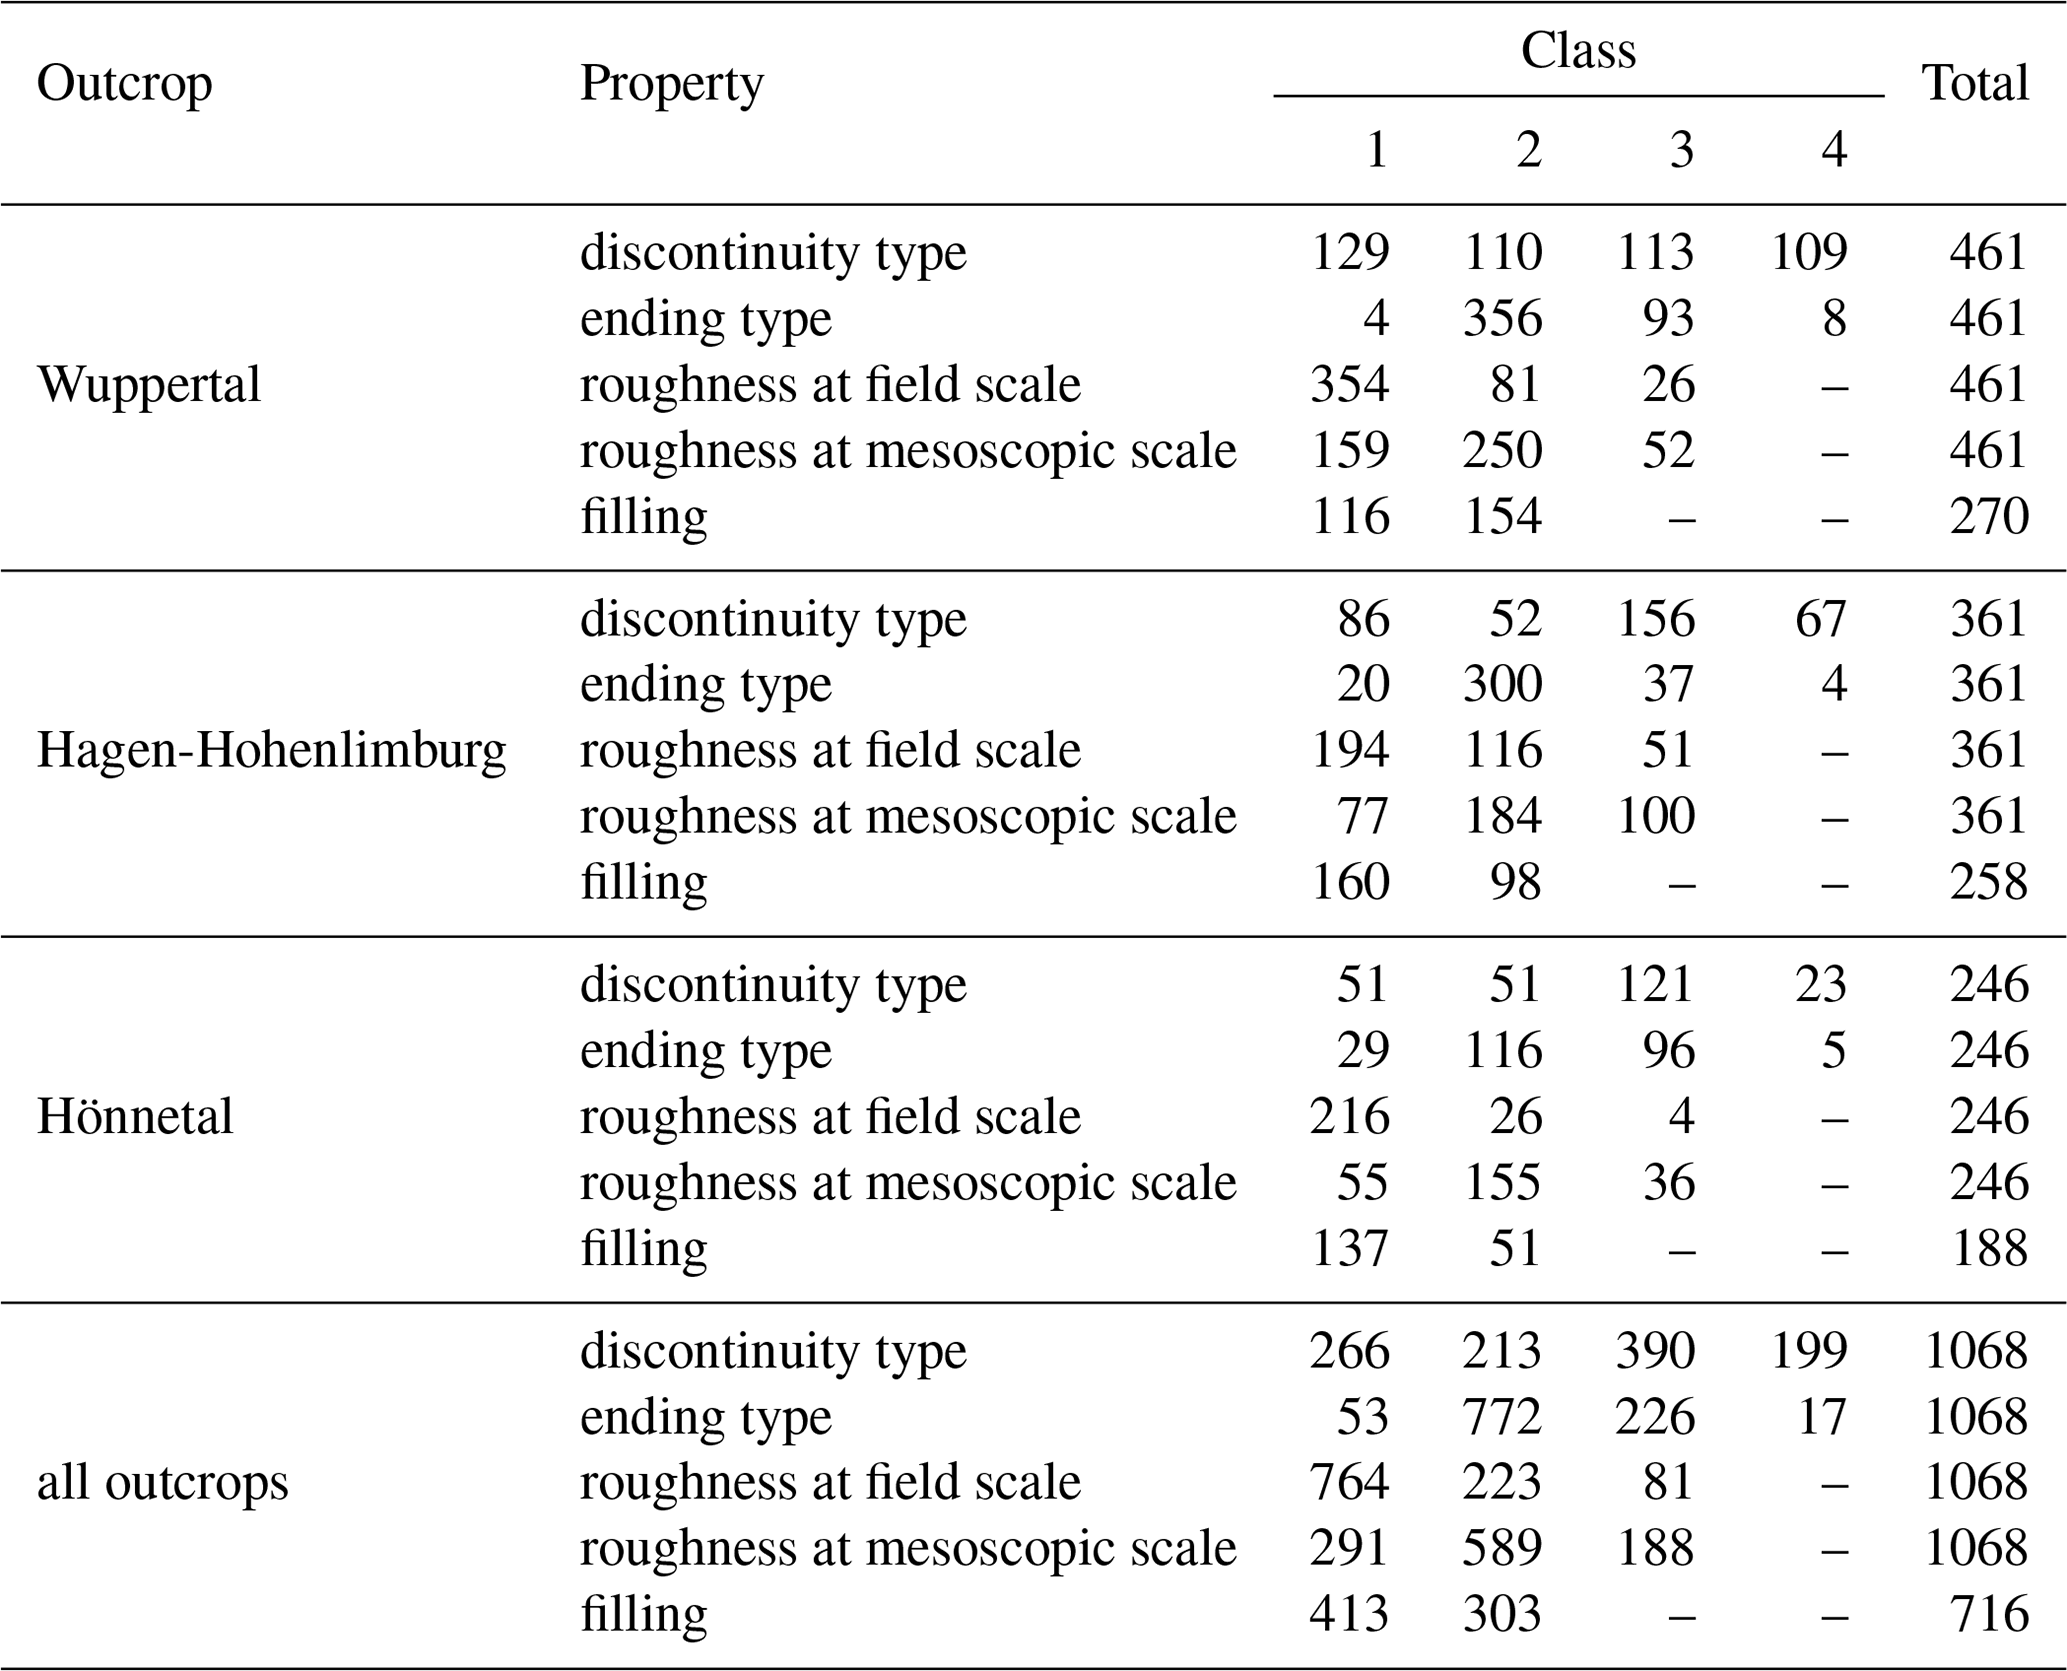
Table 3Overview of the settings and the results of the scanline surveys performed on rock walls in the outcrops Wuppertal (WOH), Hagen-Hohenlimburg (HKW), and Hönnetal (HLO). The abbreviations MKY, MKB, and MKR correspond to the coloured rock types Massenkalk yellow (dolomite), Massenkalk black (limestone), and Massenkalk red (dolomite), respectively. Three main families or sets of discontinuity orientations were found to be predominant in all outcrops.

lscan: scanline length; n: number of discontinuities; : mean trace length; : mean discontinuity aperture; : mean discontinuity spacing. The resolution of the length measurements amounts to 0.01 m.
Three sets of discontinuity orientations were predominant in all outcrops (Table 3). In Wuppertal the sets were grouped into the arithmetic mean discontinuity azimuth directions of strike 172∘ (181 discontinuities), 55∘ (142 discontinuities), and 105∘ (138 discontinuities) (Fig. 4c, d; Table 6). In contrast, the discontinuity sets in Hagen-Hohenlimburg and Hönnetal were oriented towards 135∘ (134 discontinuities), 12∘ (95 discontinuities), and 75∘ (132 discontinuities) and 176∘ (140 discontinuities), 65∘ (24 discontinuities), and 87∘ (82 discontinuities), respectively (Figs. 5c, d; 6c, d; Table 6). The dip angles of the discontinuities were documented as very steep, i.e. between 80 and 90∘ (dip) in all three quarries (Table 3). By further differentiating the strike directions of the classified discontinuity sets according to their filling material, no strike rotation between calcite- and debris-filled veins and fractures was identified (Fig. 7). Besides, several generations of repeated cracking and sealing were observed that were located within the recorded veins in Hagen-Hohenlimburg. A precise analysis of the individual vein generations is currently the subject of recent studies and could not be provided within the scope of this study.
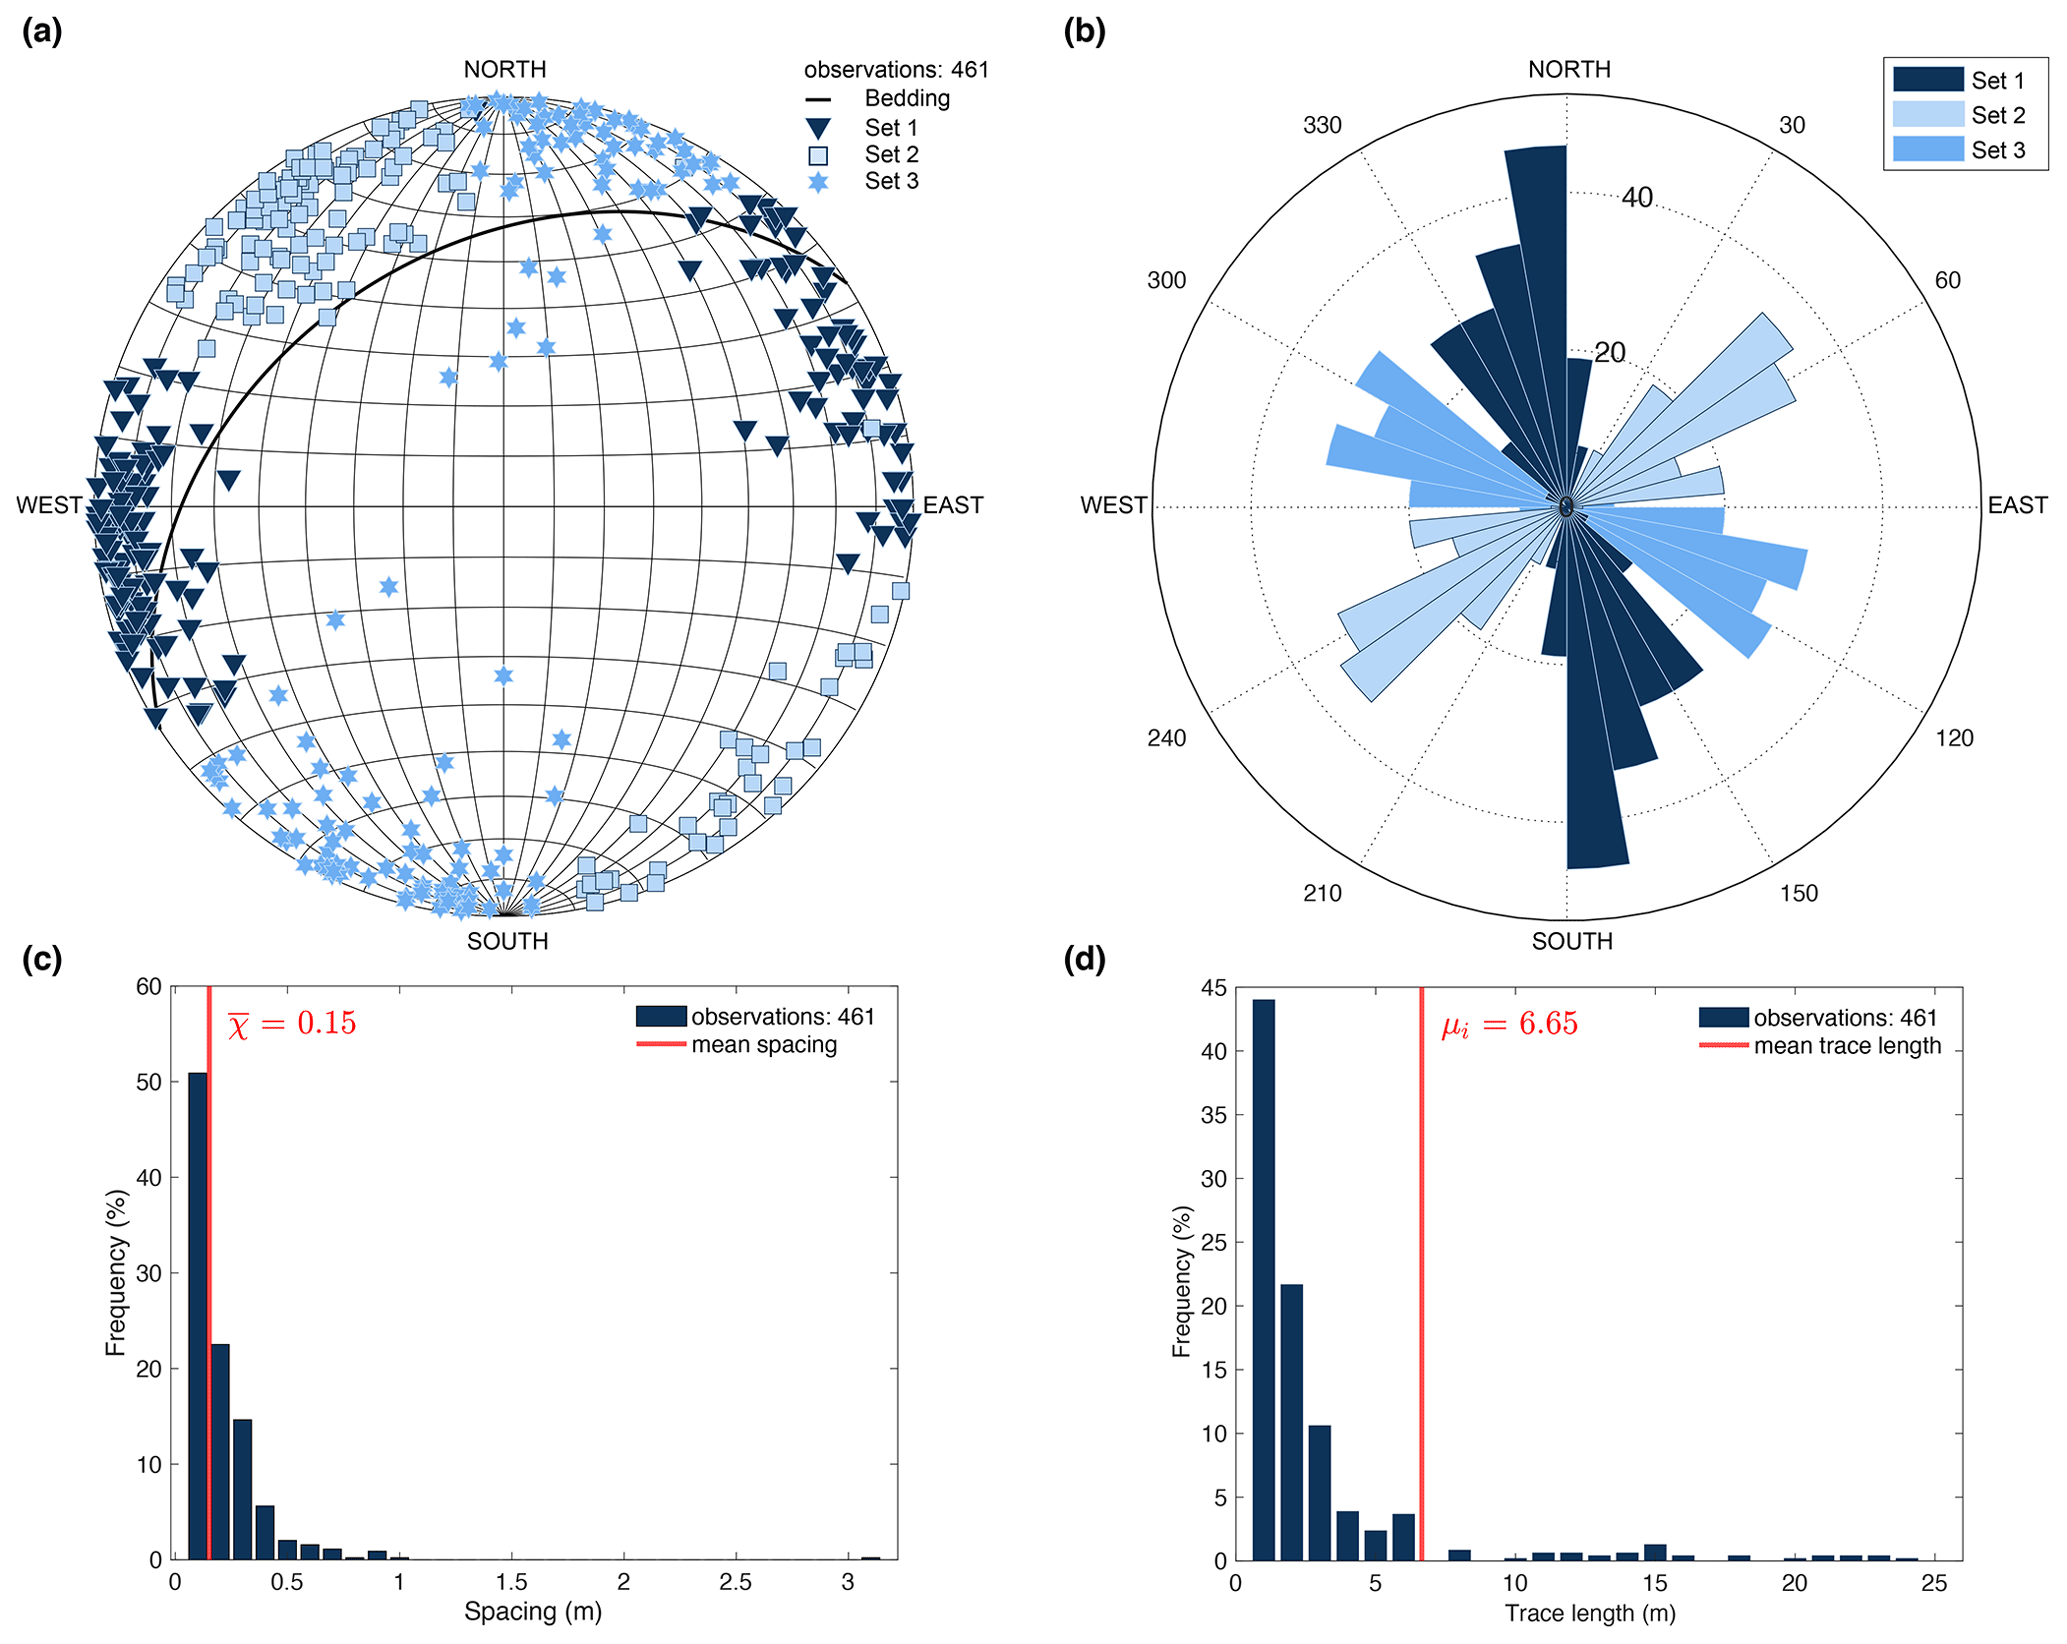
Figure 4Results of all scanline investigations at the quarry in Wuppertal: (a) stereogram of measured discontinuity sets and a (b) rose diagram of rotated discontinuity orientations according to the bedding layer in panel (a) for a horizontal position, (c) discontinuity spacing diagram, and (d) discontinuity trace length diagram.

Figure 5Results of all scanline investigations at the quarry in Hagen-Hohenlimburg: (a) stereogram of measured discontinuity sets and a (b) rose diagram of rotated discontinuity orientations according to the bedding layer in panel (a) for a horizontal position, (c) discontinuity spacing diagram, and (d) discontinuity trace length diagram.
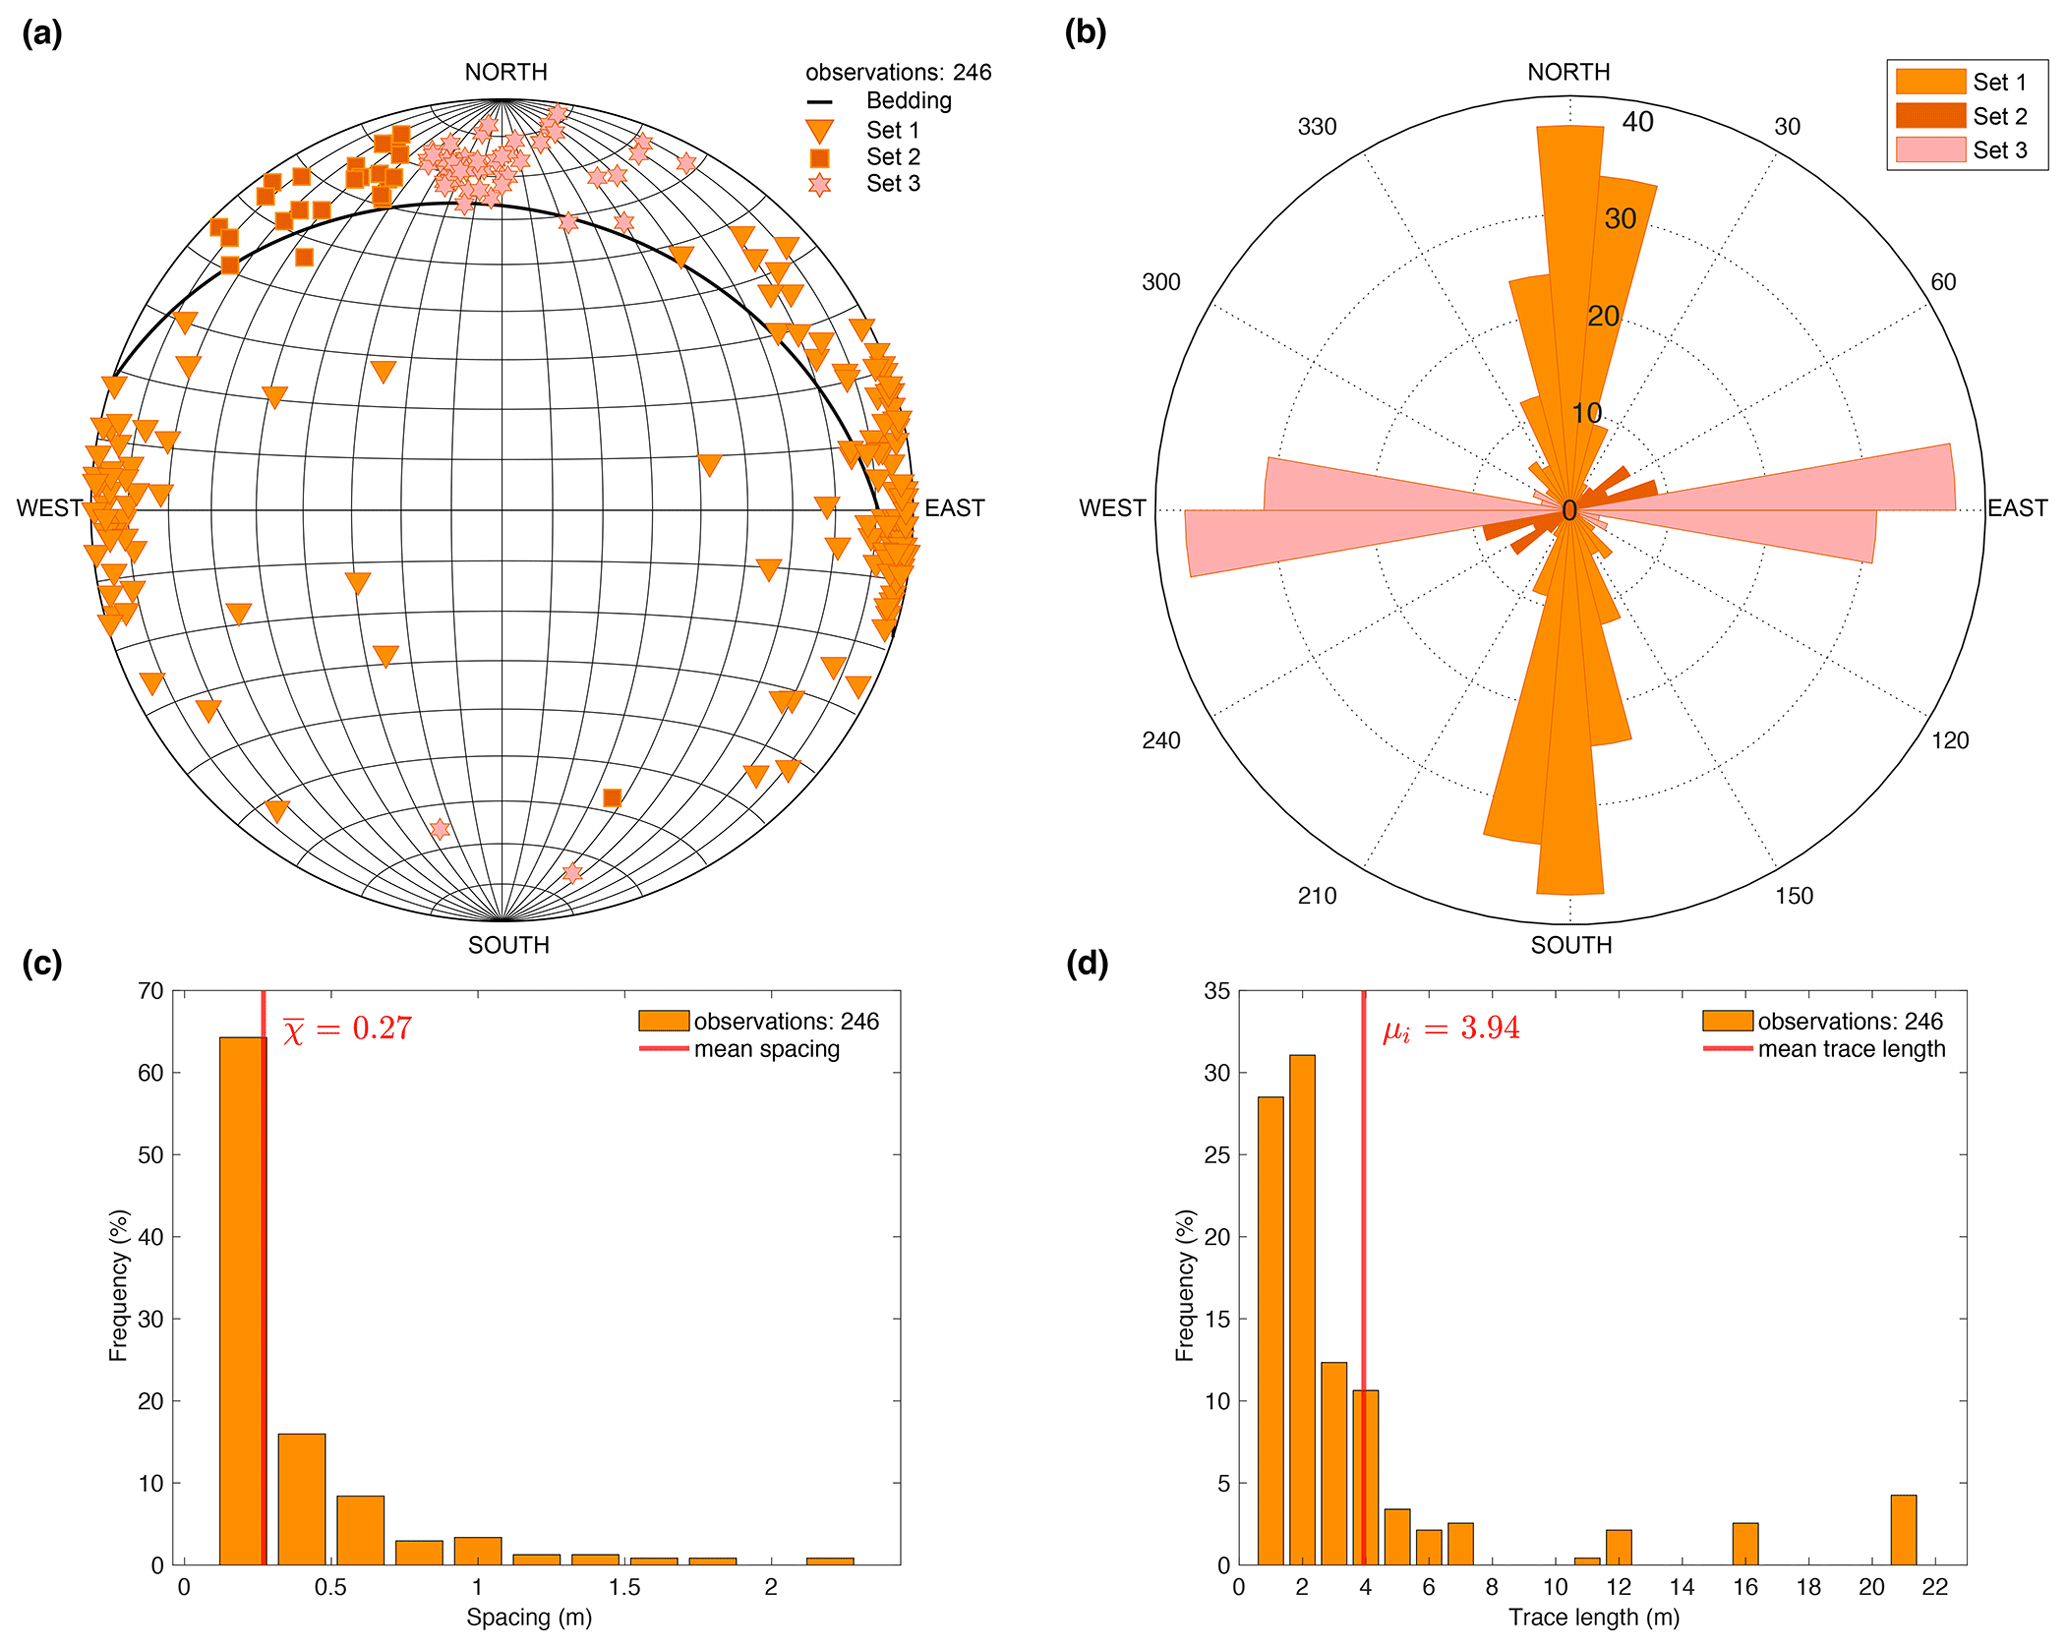
Figure 6Results of all scanline investigations at the quarry in Hönnetal: (a) stereogram of measured discontinuity sets and a (b) rose diagram of rotated discontinuity orientations according to the bedding layer in panel (a) to a horizontal position, (c) discontinuity spacing diagram, and (d) discontinuity trace length diagram.
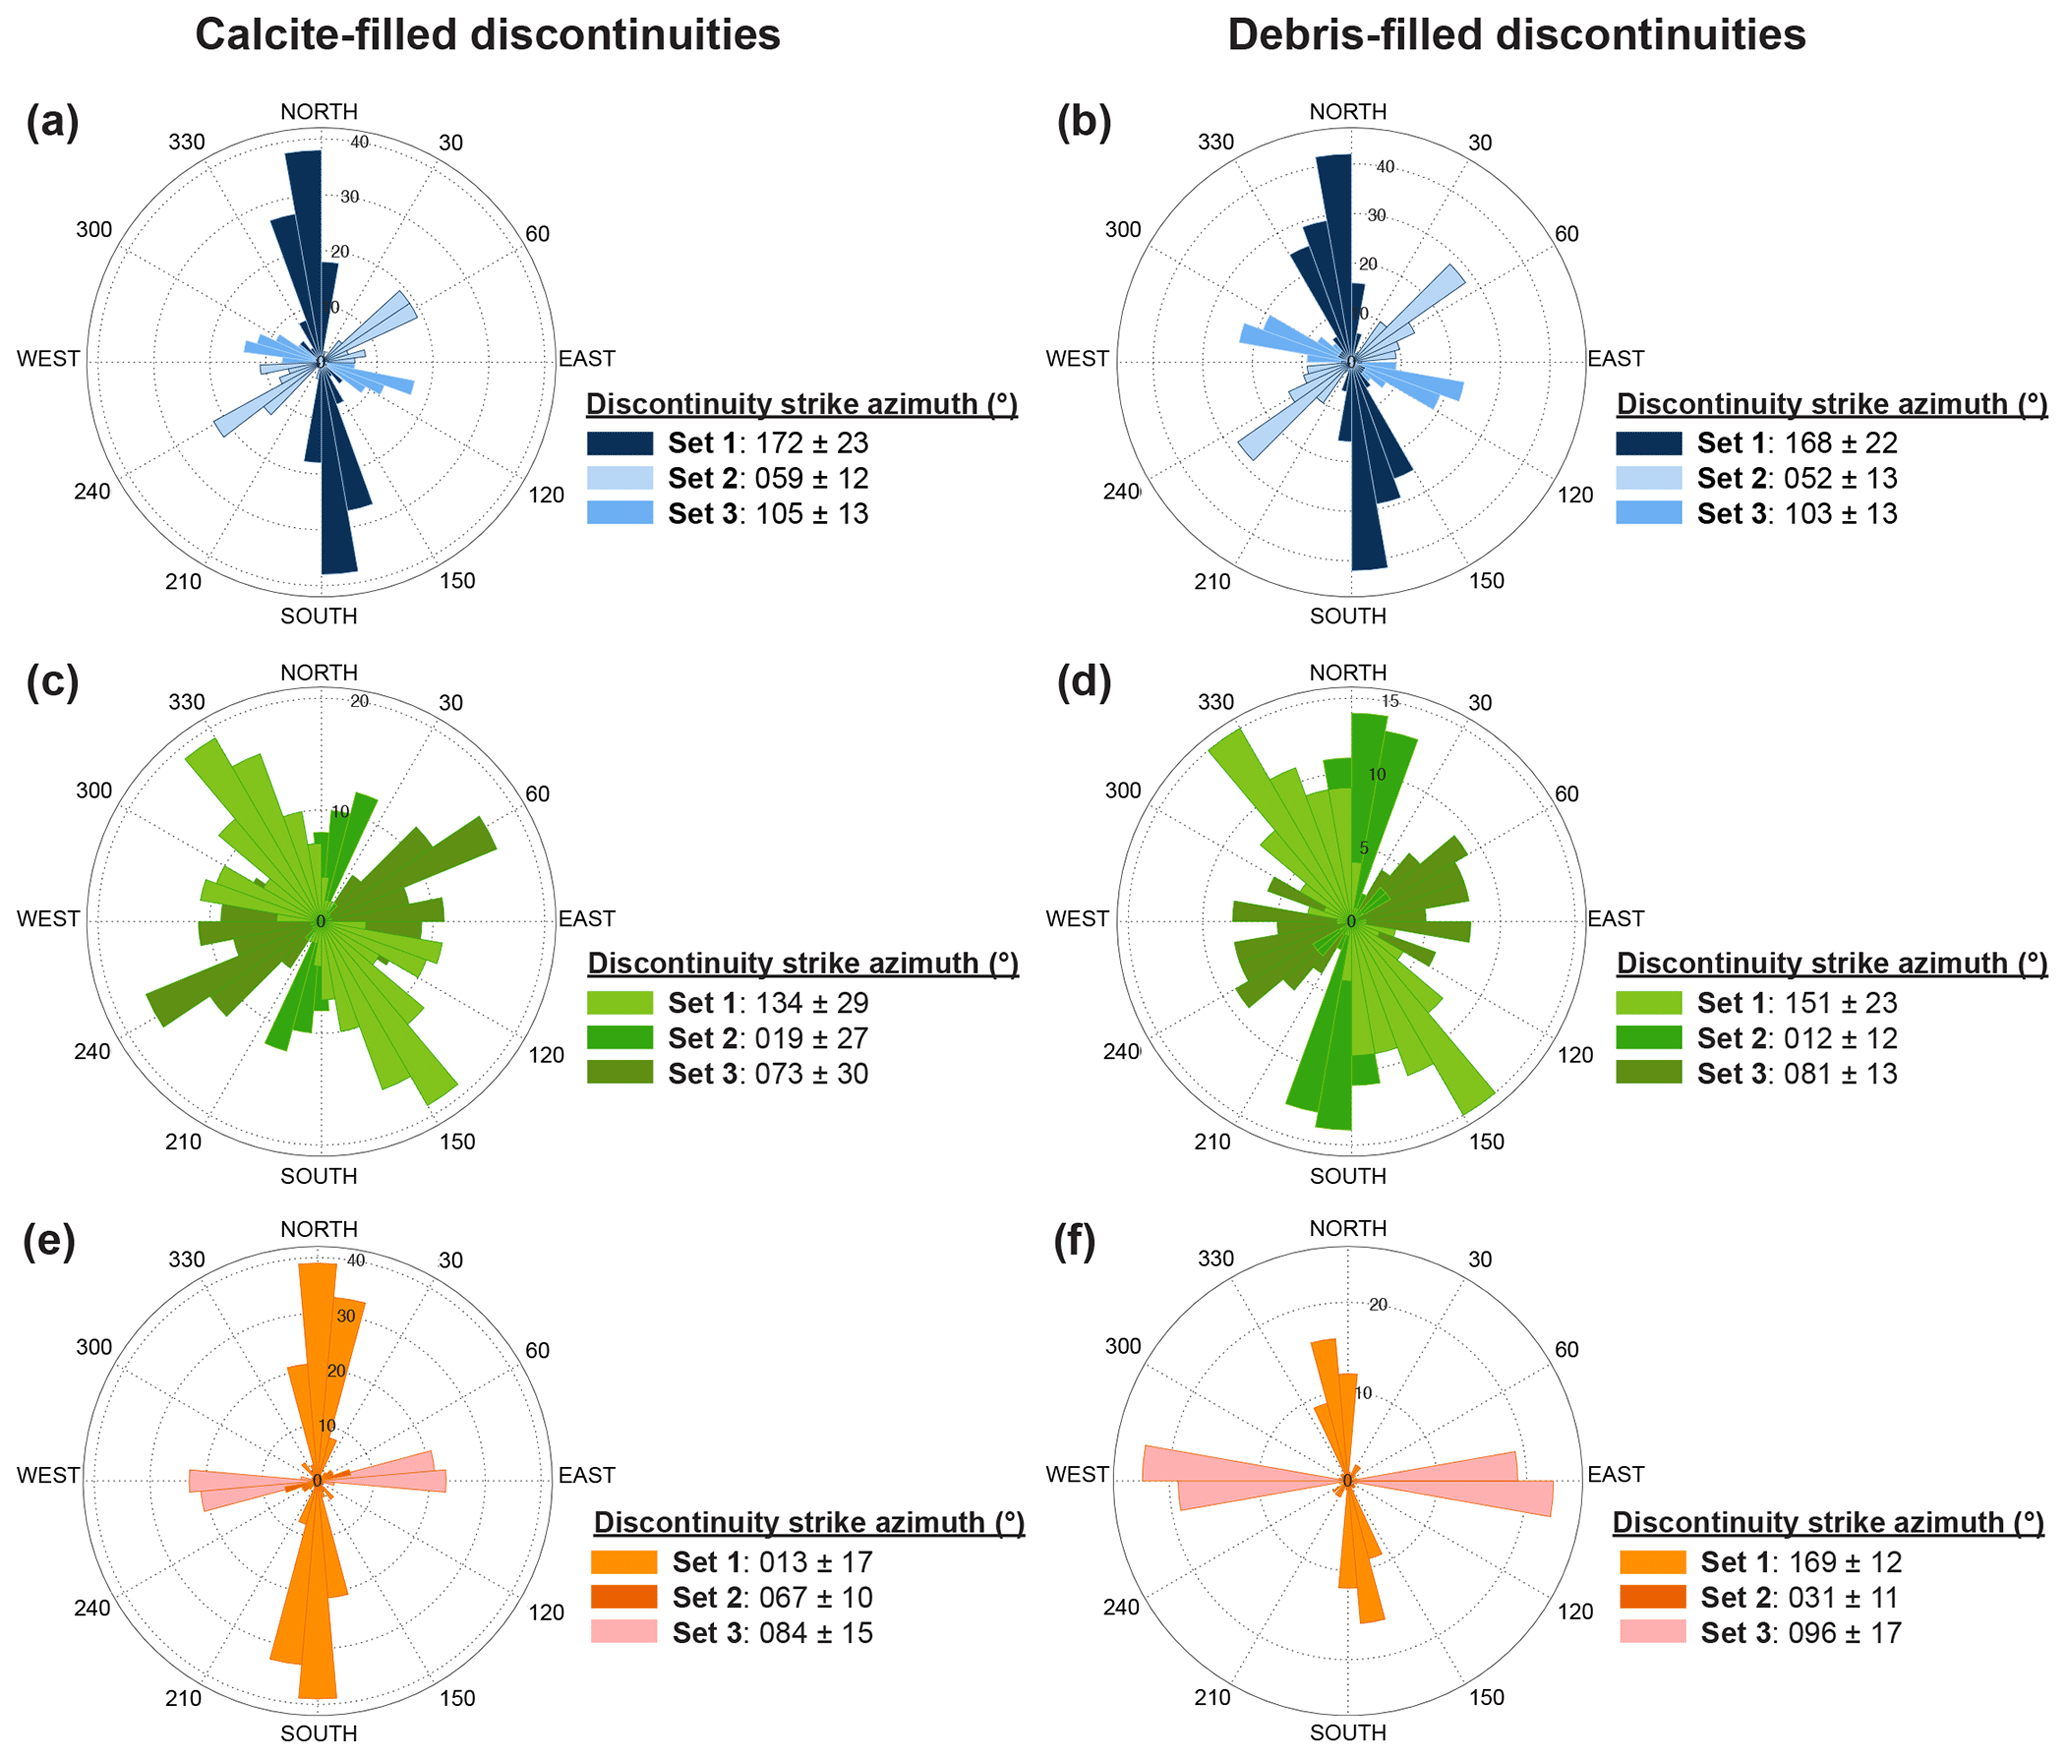
Figure 7Rose diagrams of measured discontinuity sets at the quarries (a, b) Wuppertal, (c, d) Hagen-Hohenlimburg, and (e, f) Hönnetal as a function of their discontinuity filling, i.e. whether the discontinuities are filled with (a, c, e) calcite or (b, d, f) debris. The discontinuity strike azimuths given next to the figures correspond to the arithmetic mean values and the corresponding standard deviations.
The statistical analysis of the three subdivided sets from Wuppertal and Hagen-Hohenlimburg showed that although the mean discontinuity lengths differed significantly, the discontinuity densities were comparable (Table 6). In Wuppertal and Hagen-Hohenlimburg the discontinuity densities ranged from about 2.00 to 2.75 and 1.25 to 1.75 m−1, respectively. Only in Hönnetal were clear differences in both mean discontinuity lengths and discontinuity densities found between the three sets of discontinuities. Here, the mean discontinuity length and the discontinuity densities amounted to 4.51, 5.57, and 2.85 m and 2.23, 0.38, and 1.31 m−1, respectively. The identified 2D discontinuity connectivity was about 6 to 8 times higher in Wuppertal (P=21.42) than in the other outcrops at Hagen-Hohenlimburg (P=3.71) and Hönnetal (P=2.49).
3.2 Laboratory characterizations
Samples could be obtained from all outcrops of dolomitic carbonates and limestone rocks, although it was challenging to obtain samples from the Hönnetal due to the lack of revealed outcrops. Most of the exposed Hönnetal limestone rocks were purely calcitic and showed a low grade of dolomitization. Nevertheless, some dolomitic carbonates have been sampled. Dolomitic carbonate samples from Hagen-Hohenlimburg occurred as highly fractured rocks with karst and highly porous formations, ranging from a few millimetres to several centimetres.
Table 4Matrix properties, permeabilities, and thermal conductivities as determined by laboratory measurements on limestone and dolomite samples from Wuppertal (WOH), Hagen-Hohenlimburg (HKW), and Hönnetal (HLO). The abbreviations MKY, MKB, and MKR indicate the coloured rock types Massenkalk yellow (dolomite), Massenkalk black (limestone), and Massenkalk red (dolomite), respectively.
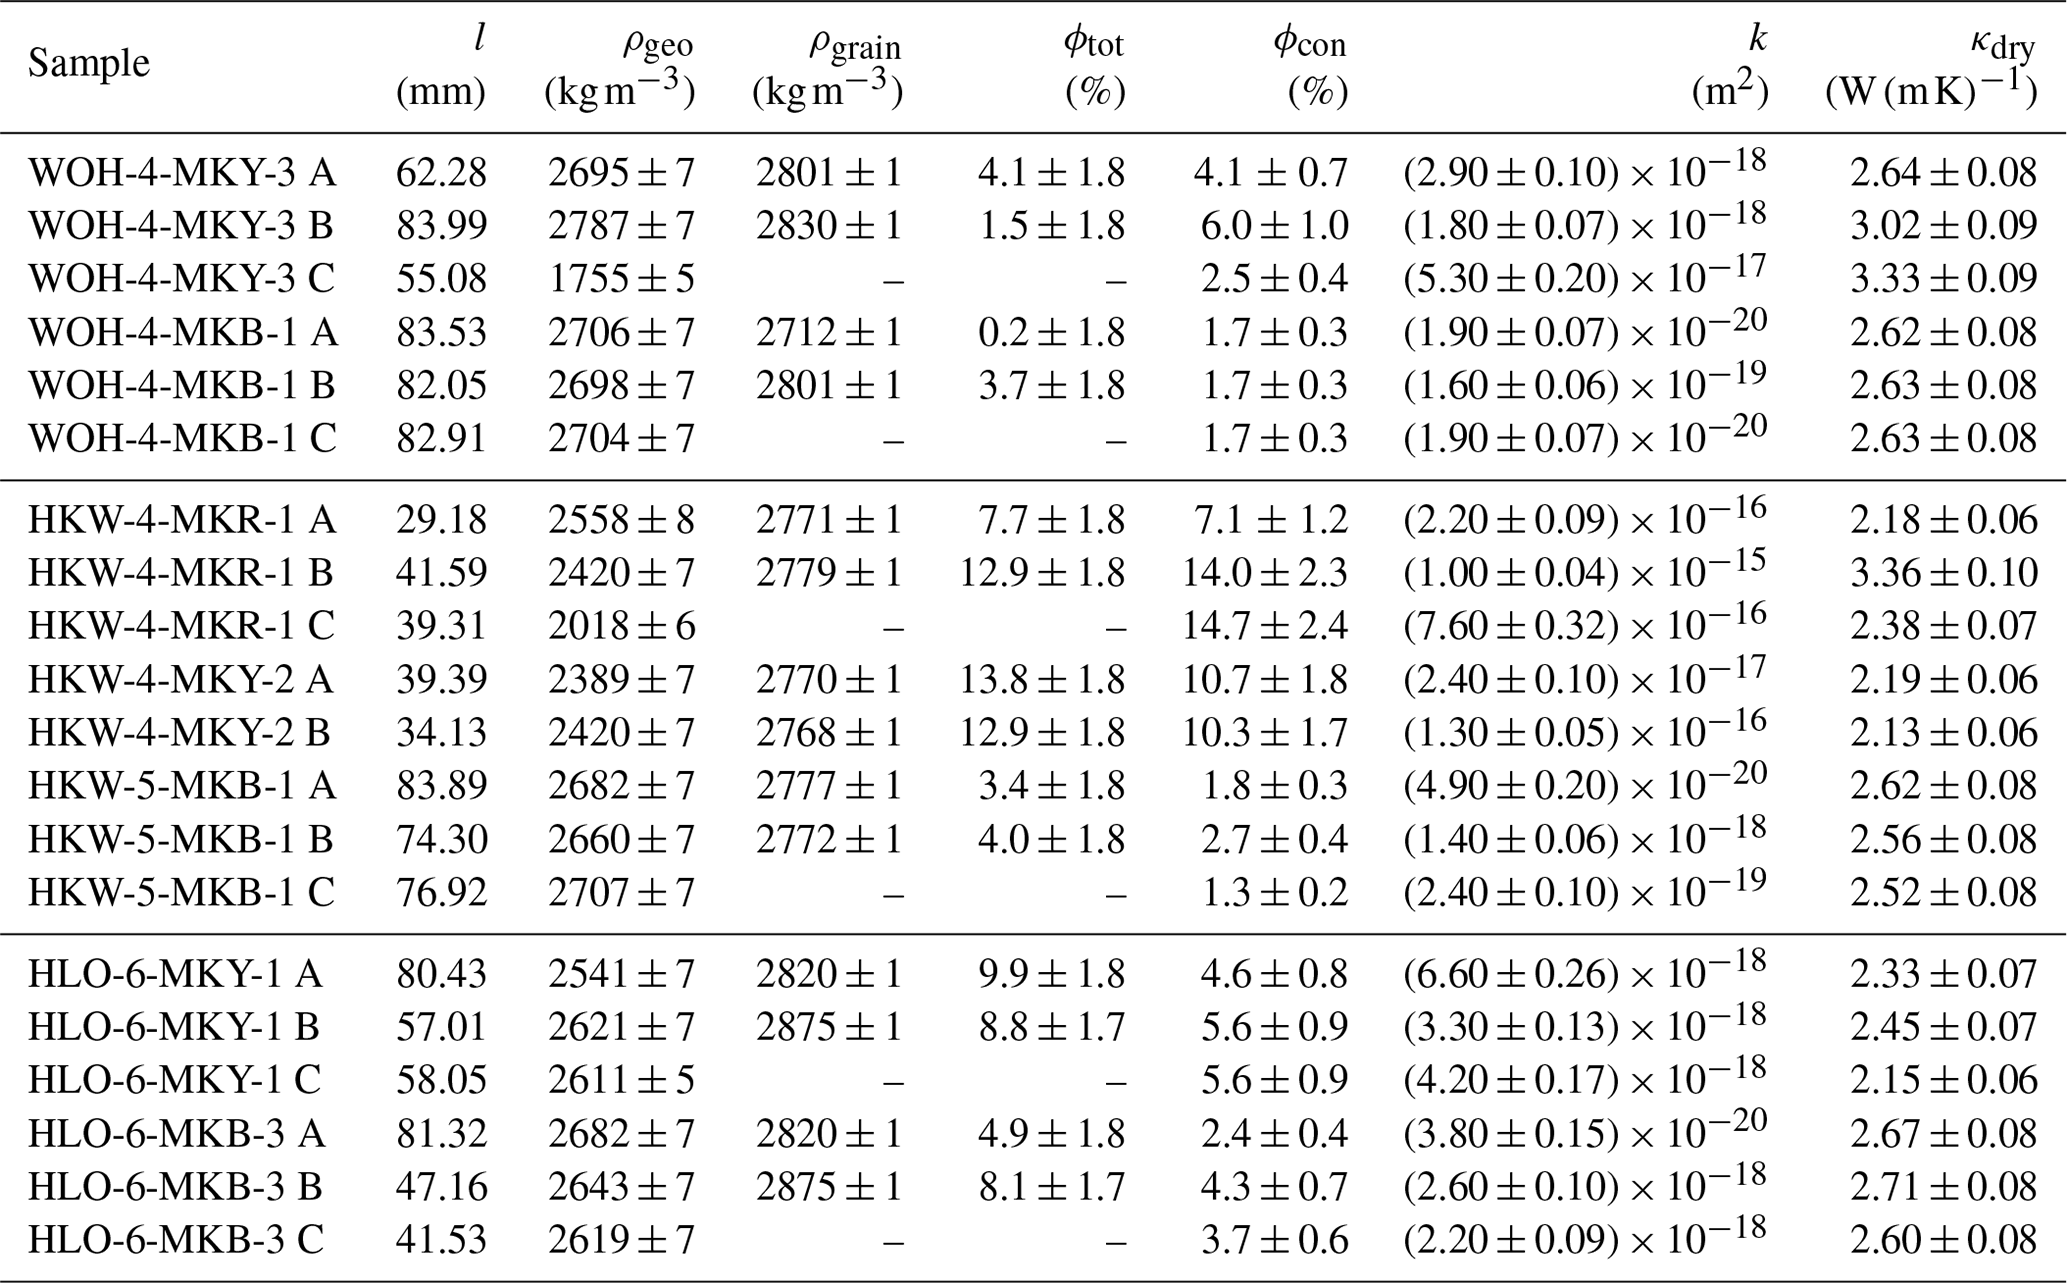
l: sample length; ρgeo: bulk density; ρgrain: grain density; ϕtot: total porosity; ϕcon: connected porosity; k: permeability; κdry: thermal conductivity. Quoted uncertainties reflect accuracy of the measurements.
The mean bulk densities of the samples retrieved from the outcrops in Wuppertal, Hagen-Hohenlimburg, and Hönnetal were 2704 ± 39, 2537 ± 128, and 2620 ± 46 kg m−3, respectively (Table 4). These mean values were determined independently of whether they were limestone rocks or dolomitic carbonates. In Wuppertal and Hagen-Hohenlimburg, one dolomitic carbonate sample was investigated in each case that differed significantly from the other samples and was not included in the calculation of the mean bulk densities. Taking into account the measurement uncertainty and standard deviation, all samples examined showed comparable densities. A similar trend was observed for the mean grain densities, as these values are also very close together. The mean grain densities of the samples from Wuppertal, Hagen-Hohenlimburg, and Hönnetal amounted to 2801 ± 51, 2777 ± 41, and 2848 ± 32 kg m−3, respectively.

Figure 8Correlation between (a) connected and total porosity and between (b) permeability and connected porosity. Filling and colouring of markers indicate sample and outcrop, respectively. Measurement uncertainties are indicated by error bars. Where error bars do not exceed marker size, uncertainties appear to be small. The blue line in panel (b) indicates identity, i.e. connected porosity corresponds exactly to total porosity.
Laboratory measurements to determine the total and connected porosities indicated that the dolomitic carbonates investigated were significantly more porous than the limestones. This trend was evident at all quarries. On average, the volumetric proportion of pores in the dolomitic carbonates was twice as high as in the limestones among almost all samples. Our uncertainty analysis showed no significant volume of isolated pores, and pre-existing cracks could be determined in the investigated samples. Considering the measurement uncertainties, the total and connected porosities overlapped (Fig. 8a).
Ultrasound P- and S-wave velocities of the dry samples ranged between 3000 and 6500 and 1300 and 3500 m s−1, respectively (Table 4). Regardless of the outcrop, it was shown that the dry P-wave velocities of the limestones tended to be 1000 to 1500 m s−1 higher than those of the dolomitic carbonates. The Wuppertal samples have shown that the dolomitic carbonates and limestones cannot be distinguished according to the S-wave velocities (Table 4). Both rock types had comparable S-wave velocities. The samples of the remaining outcrops showed a clear difference in S-wave velocities between dolomitic carbonates and limestone. In Hagen-Hohenlimburg and Hönnetal the S-wave velocities of the limestones were about 500 to 1000 m s−1 higher than those of the dolomitic carbonates. These differences were also apparent in the drained dynamic Young's moduli (Table 4). The mean drained Young's moduli of the limestone and the dolomitic carbonates amounted to about 60 and 70 GPa, respectively. The mean drained Poisson's ratio, that is, the relative relationship between P- and S-wave velocities, is about 0.35 for both rock types. Upon saturation, P-wave velocities of the samples collected in Wuppertal, Hagen-Hohenlimburg, and Hönnetal increased by up to 4 %, 11 %, and 14 % on average. This increase was also apparent in the undrained Poisson's ratios. The undrained Young's moduli hardly differ from the drained ones (Table 4).
The thermal conductivity measurements showed similar results for limestones as for dolomitic carbonates. However, a slight scattering can be observed. The dolomitic carbonate samples from Wuppertal were an exception, as these samples showed relatively high thermal conductivities that exceeded those of the limestones. On average, the highest and lowest conductivities could be determined on the Wuppertal and the Hagen-Hohenlimburg samples, respectively. Measured thermal conductivities of all samples varied between 1.10 and 3.40 W (m K)−1.
The permeabilities measured correlated as expected with the corresponding porosities, i.e. a permeability increase with an increasing proportion of connected pore volume (Fig. 8b; Table 4). The measured permeabilities of the dolomitic carbonates from Hagen-Hohenlimburg are the highest and averaged to about 4.27 × 10⁻¹⁶ m2. The Hagen-Hohenlimburg limestones were, on average, about 3 orders of magnitude less permeable than the limestones. The differences in permeability between dolomitic carbonates and limestone samples amounted to approximately 2 orders of magnitude in Wuppertal. In contrast, dolomitic carbonates and limestones in Hönnetal showed similar permeabilities of the same order of magnitude, that is, permeabilities in the range of 10−18 m2. Only one sample from Hönnetal was low permeable (permeability of about 4 × 10⁻²⁰ m2), but here the associated connected porosity was also significantly smaller than that of the comparative samples.
The discontinuities of deep carbonates in the Rhine-Ruhr area were characterized and described using outcrop scanline surveys. In addition, the results of laboratory investigations of density, porosity, dynamic elastic moduli, thermal conductivity, and permeability of the collected representative rock samples of the Devonian Reef Complex were presented. In the following, we correlate the field and laboratory investigations and address the geothermal potential of these deep carbonates in the Rhine-Ruhr region. We focus our results of the DFN on discontinuity length, density, orientation, and aperture. Characterizing the DFN requires access to the reservoir rock at reservoir-related depth, which is not present. However, we have reasonable cause to expect comparable discontinuity orientations in our geological subsurface model, as in our studied outcrops (Lorenz et al., 1991; Narr, 1991). For example, Narr (1991, 1996) presented how to derive DFN from drill core samples of reservoirs.
4.1 Estimating the geological subsurface model of the carbonate reservoir
The geological setting in the Rhine-Ruhr metropolitan area is highly complex, with details still being debated (e.g. Brix et al., 1988). However, we can name large tectonic events that have influenced local formations to a varying extent:
-
crustal thinning that enhanced the formation of a shelf sea during the Early Devonian (e.g., Dallmeyer et al., 2013).
-
an overall NW movement that reduced clastic sedimentation within the sea and enabled the formation of reef carbonates on the clastic shelf; besides those clastic shelf carbonates, some reef deposits formed on volcanic mounds within the hemipelagic realm (the isolated carbonate complexes on the outer shelf are the geothermal horizon of interest in this study, e.g. Franke et al., 2017; Salamon and Königshof, 2010);
-
the ongoing NW movement that changed the material deposits and thus finally created the Ruhr coal district during the Carboniferous (e.g., Meschede, 2018);
-
at least two different extension sequences during the Early Triassic and Early Cretaceous (Drozdzewski and Wrede, 1994);
-
a NE–SW-directed shortening during the Late Cretaceous (e.g., Brix et al., 1988);
Due to the geological formation's complexity, our underground model has been simplified concerning the most important tectonic features, such as folds and faults. The foundation of our model is an approx. 150 m thick carbonate layer, dipping northwards at a dip angle of about 30 to 40∘ (see Fig. 1b; Jansen et al., 1986; Drozdzewski et al., 2007). We expect this layer to be at depths between 4000 to 6000 m (DEKORP Research Group, 1990). This layer forms the Devonian basement, overlaid by interbedded sequences of sand, clay, silt, and coal layers from the Carboniferous period. These sediments can be mapped to the surface (e.g. Brix et al., 1988). Many folds and thrusts are found within these extremely complex interbedded sequences (for more details, see Brix et al., 1988; Drozdzewski and Wrede, 1994).
All studied outcrops are located in the large-scale Remscheid-Altena anticline formation. However, there is a difference between the three outcrop results, which could be influenced by the regional Remscheid-Altena anticline, different stress conditions, and/or a different time of origin (Table 3). The discontinuity orientations were rotated according to the corresponding bedding layers (Figs. 4a, 5a, 6a) to a horizontal position (Figs. 4b, 5b, 6b). The discontinuity unfolding procedure indicates a similar tectonic origin for fracture sets from Wuppertal and Hagen-Hohenlimburg. Discontinuities striking NE–SW are consistent with folding mechanism and are oriented parallel to fold axes that have been studied within the Rhine-Ruhr area (Drozdzewski, 1985; Brix et al., 1988; DEKORP Research Group, 1990; Drozdzewski and Wrede, 1994). The dominant discontinuity strike directions in Wuppertal and Hagen-Hohenlimburg (NNW–SSE) agree with the structure of the regional Remscheid-Altena anticline (Fig. 1b) and the overall assumed mean horizontal stress direction according to the World Stress Map (Heidbach et al., 2016) and additional available stress data (Rummel and Weber, 1993). In western Germany, or to be more precise in North Rhine-Westphalia, the World Stress Map contains a wide variability of mean horizontal stress directions (Heidbach et al., 2016), which can be explained by shallow stress measurements, local anomalies due to weak coal seams, or regional NE–SW-striking thrusts. The observed strong scattering of the vein strike directions in the dolomitic carbonates exposed in Hagen-Hohenlimburg is most probably due to their hydrothermal veins' formation during the Hercynian orogeny (Gillhaus et al., 2003) but can be also explained by the recent study of Michie (2015). Michie (2015) found a crucial correlation between fracture propagation and petrological properties of carbonate rocks, specifically grain size and sorting, porosity and uniaxial compressive strength. Furthermore, Gillhaus et al. (2003) explain that the existing NNW–SSE-striking discontinuities are of post-Hercynian orogeny origin. This leads to the conclusion that the investigated outcrops in Wuppertal and Hagen-Hohenlimburg have been further deformed by later tectonic events. The cause of the slightly different discontinuity strike directions in Hönnetal cannot be specified according to the current state of scientific knowledge and is therefore unknown. However, the discontinuity formation could be explained by various local and temporal stress anomalies and different formation times.
Brudy et al. (1997) showed no significant stress orientation changes have to be expected in the brittle crust with depth. Consequently, it is reasonable to assume that we can expect quite similar discontinuity directions in our target horizon of the deep Devonian limestone, i.e. the potential geothermal reservoir. However, if the carbonate layers exposed in the investigated opencast mines are extrapolated in dip direction of bedding, the carbonate reservoir of interest is approximately located below the cities of Essen, Bochum, and Dortmund at a depth of 4000 to 6000 m (Fig. 2). This extrapolation of the carbonates in dip direction corresponds in this case approximately to the direction of the main horizontal stress (Heidbach et al., 2016; Rummel and Weber, 1993) with respect to the simplified geological setting (Fig. 1a). This assumption allows us to predict local DFN in the deep Devonian limestone (i.e. naturally fractured carbonate reservoir), whose exact depth and characteristics should be verified by additional geophysical prospecting techniques to further describe the geothermal potential of this reservoir (e.g. Hirschberg et al., 2015).
We carried out laboratory experiments under ambient and elevated pressure conditions to gain insights into the potential reservoir's petrophysical properties. The derived porosities of the limestone samples are in agreement with literature values between 1 % and 6 % (Fig. 8a; Gebrande, 1982). The porosity of carbonate rocks may increase via a wide variety of processes. Next to dissolution, cementation, and recrystallization, the process of dolomitization is the most common. Dolomitization describes the geochemical process of replacing Ca ions by Mg ions, forming dolomite from calcite: . Lucia et al. (2007) pointed out that dolomitization may increase the carbonate's porosity by 13 %. This correlates fairly well with our results (Fig. 8a). Consequently, porosity measurements are in accordance with the field study's outcome: porosity decreases towards the core of the reef formation, in agreement with Homuth et al. (2015b).
The P- and S-wave velocities and the matrix permeabilities and dynamic mechanical properties derived in the laboratory provide statistical information for further numerical simulations of the reservoir. The thermal conductivity results are appropriate for the analysed rock formations (cf. Čermák and Rybach, 1982; Clauser and Huenges, 2013; Jorand et al., 2015). The low connected porosities match with the determined permeabilities. Compacted limestone (Massenkalk), which is characterized by a low connected porosity, showed the lowest permeability, whereas the dolomitic carbonates showed an inverse relation (Fig. 8b). However, the results of the determined matrix permeability seem to be comparable with similar geothermal reservoirs (e.g. Homuth et al., 2015a); we do not expect sufficient reservoir permeability in 4000 and 6000 m depth. Therefore, we have focused on potential DFN within the geothermal reservoir, whose influence on fluid flow in fractured reservoirs has already been discussed in detail (e.g. Guerriero et al., 2013).
4.2 Evaluating a discrete fracture network in the carbonate reservoir: from outcrop and laboratory measurements to implications for fluid flow on a reservoir scale
The uncertainties associated with the description of naturally fractured systems and DFN are strongly dependent on sampling effects such as truncation or censoring (Bonnet et al., 2001; Baecher and Christian, 2005). Truncation effects explain the influence of underestimating small characteristics due to the resolution of the sampling method, i.e. outcrop and survey size. Censoring effects occur when broad characteristics are incompletely observed due to the outcrop size mentioned or when characteristics are selected due to subjective choice (Priest and Hudson, 1981; Lacazette, 1991). While the truncation effects can be reduced by a sophisticated set of data and resolution, the censoring effect can be reduced depending on the method applied, adapted technology, and the amount of data obtained (Santos et al., 2015). In the literature, these uncertainties are typically described as aleatory and epistemic (Der Kiureghian and Ditlevsen, 2009). Various survey methods and their corrections concerning the effects mentioned are described in more detail in Bonnet et al. (2001).
The approach we have chosen to use, the scanline survey method described by Priest and Hudson (1981), is a widely accepted method for the characterization of discontinuity networks (e.g. La Pointe and Hudson, 1985; Lacazette, 1991; Narr, 1996). The advantages of the method are especially the acquisition time and the associated verification as well as the acquisition costs compared to other methods (e.g. lidar outcrop survey; Wilson et al., 2011). The uncertainties due to scanline surveys are generally known and have been critically questioned for decades (e.g. Terzaghi, 1965; Cruden, 1977; La Pointe and Hudson, 1985; Ganoulis, 2008). However, due to the long period of application, the method explained by Priest and Hudson (1981) has been adapted for a variety of geological and outcrop settings, which leads to various error corrections regarding the application case. This allows us to keep the limitations and sources of error as low as possible. We pursued the concerns about epistemic uncertainties and identified the main problems in defining representative areas' locations to evaluate a discrete fracture network in the carbonate reservoir in the Rhine-Ruhr area.
4.2.1 Orientation, roughness, and filling of the discontinuity network
The architecture of each open-pit mine studied is directly related to the directions of the dominant discontinuities, i.e. NNW–SSE and NE–SW (Fig. 3). In addition, the direction NW–SE was documented as another dominant discontinuity direction. These findings fit with the general observations documented in the literature (e.g. Brix et al., 1988; Drozdzewski and Wrede, 1994). Nickelsen and Hough (1967) and Roberts (1974) investigated discontinuity orientations in sedimentary layers with respect to the maximum horizontal stress and their corresponding filling material. The orientations of the respective structures in their area are almost identical to the values we measured. They concluded that the discontinuity directions can be related to residual stresses and stress release during past unloading regimes, which might be transferable to our studied areas (Fig. 7). Besides, our roughness analyses revealed predominating smooth discontinuity surfaces on the field scale (> 10−1 m) and mainly slightly rough discontinuity surfaces on the mesoscopic scale (⩽ 10−1 m) (Table 2). Considering the numerous tectonic events and the repetitive reactivation of pre-existing discontinuities, smooth discontinuities tend to be reasonable in the deep carbonate horizon of interest. Since other studies have already observed that the orientations of regional discontinuities are continuous and consistent over large areas of several thousand square metres (Kelley and Clinton, 1960; Stearns and Friedman, 1972; Hancock and Bevan, 1987), we assume comparable consistency and distribution for the discontinuity sets recorded.
The separate consideration of the three respective discontinuity sets per quarry (Figs. 4b, 5b, 6b; Table 6), as well as the distinction between discontinuities filled with calcite or debris, shows us that the mean orientation of one discontinuity set (set 1; Fig. 7) matches remarkably well with the prevailing orientation of the principal horizontal stress (i.e. NNW–SSE orientation) (Fig. 1; Heidbach et al., 2016; Rummel and Weber, 1993). We could not detect any rotation between the strike direction of calcite- and debris-filled discontinuities (Fig. 7). Hence, the maximum horizontal stress may have changed only slightly, if at all, in the time between the formation of the calcite- and the debris-filled discontinuities. Therefore, we assume that the discontinuity orientation in the reservoir is comparable to the ones observed in the representative outcrops. In addition to the discontinuities' relative orientation to the direction of the main principal stress, the filling is also decisive for whether the discontinuities are potentially open or closed in the subsurface (Laubach et al., 2004). More than half of all our observations showed paleo filling materials such as calcite and, in addition, approximately 17 % showed calcite-enriched slickensides on the discontinuity surface (Fig. 7). Thus, apart from the orientation, no differences in occurrence between calcite- and debris-filled discontinuities can be detected, and we must further consider the orientation of the discontinuities. Even if we cannot predict it with certainty, pre-existing discontinuities oriented parallel to the principal horizontal stress could be observed openly, while discontinuities oriented perpendicular to this stress tend to be closed (Lorenz et al., 1991). Accordingly, the highest discontinuity permeability can be expected in NNW–SSE direction. But there might be open discontinuities that are not necessarily aligned in the principal stress direction and are still open. This is particularly true for discontinuities that are partially filled, for example, with cement (Laubach et al., 2004). In general terms, a large number of veins might be paleo fluid-flow paths striking in NNW–SSE direction, which could be exploited by advanced drilling methods (e.g. hydraulic fracturing; Dahi Taleghani and Olson, 2013) for future geothermal applications.
Before utilization of geothermal energy from the potential deep fractured carbonates in the Rhine-Ruhr Area, the material changes between host rock and vein material might predict discontinuity orientations in depth by further geophysically driven studies (e.g., density changes or reflection coefficients). Further studies have to prove if the material change between the encountered filling materials and the host rock is sufficient for seismic interpretation. Considering the typical seismic resolution concerning the depth of investigation and discontinuity aperture, individual discontinuities will probably not be resolved (Martin et al., 2006). However, the discontinuity density may be sufficient to demonstrate macroscopic anisotropy using seismic methods (Löer et al., 2018).
4.2.2 Connectivity of the discontinuity network
Comparing the discontinuity trace lengths with the true discontinuity spacing of the different discontinuity sets gives a first idea of the connectivity of the discontinuity network. Predominantly discontinuities with short trace lengths occur on the field scale (Figs. 4d, 5d, 6d). This observation was made for all exposed outcrop faces in all three quarries. Almost 70 % of the recorded discontinuities classified as “both ends visible” tended to be between 1 and 2 m long (Table 3). It is conceivable that the observed trace lengths increase with increasing outcrop length and height. The recorded end types suggest that 40 % of all discontinuities investigated exceeded the observed outcrop height (Table 3). In other words, 40 % of all measured trace lengths are probably greatly underestimated by the method. This source of error was attempted to be minimized by the censored semi-trace length analysis (Eq. 2). In contrast, 60 % of all joints counted showed a start and end tip (Table 2). However, a full 3D discontinuity analysis of the entire quarry will likely reflect better trace length results depending on the accuracy. At this point, economic considerations must be made regarding the required survey accuracy and associated costs.
The results of the 2D discontinuity connectivity analysis clearly show that the reservoir in Wuppertal has the highest average 2D discontinuity connectivity, i.e. an average number of discontinuity intersections per discontinuity of 21.42 (Table 6). Both the discontinuity density and the mean discontinuity length of each discontinuity set are significantly higher in Wuppertal than in the other outcrops (Table 6). Accordingly, we can assume that this reservoir probably has considerable geothermal potential due to its discontinuity network. For the Hönnetal reservoir, a discontinuity intersection per discontinuity of 3.71 was determined. One reason for this relatively low value is the reservoir's location on the anticline axis and the associated tectonics (Fig. 1). Although the recorded discontinuities in Hagen-Hohenlimburg exhibit the greatest variety of strike directions (Fig. 5), the estimated 2D discontinuity connectivity is the lowest at this location due to the short discontinuity lengths and the associated low discontinuity densities (Table 6). Based on the observations of many karst formations and altered host rocks by hydrothermal veins in Hagen-Hohenlimburg, we conclude that there might be a higher permeability in the Hagen-Hohenlimburg reservoir and the surrounding areas than in the other studied areas. However, the distribution of this reservoir in the subsurface is still under debate (e.g. Salamon and Königshof, 2010), and its conditions due to karstification still have to be proven.
The densities of the dolomitic carbonates and limestones determined in the laboratory did not show significant differences, which was to be expected (Table 4). However, the comparatively high porosity of the dolomitic carbonates indicated a moderate pore and crack volume. Consequently, a higher density of potentially hydraulically stimulated pores and cracks (or discontinuity network) can be expected in the dolomitic carbonate layers on the field scale. On the other hand, the comparable densities pose a warning regarding the unreflected interpretation of, for example, density measurements in naturally fractured carbonate reservoirs. Such measurements do not appear to be very useful for differentiating between low porous limestone and relatively high porous dolomitic carbonates.
Table 5Ultrasound velocities and dynamic elastic moduli derived by laboratory measurements for limestone and dolomite samples from Wuppertal (WOH), Hagen-Hohenlimburg (HKW), and Hönnetal (HLO). The abbreviations MKY, MKB, and MKR indicate the coloured rock types Massenkalk yellow (dolomite), Massenkalk black (limestone), and Massenkalk red (dolomite), respectively.
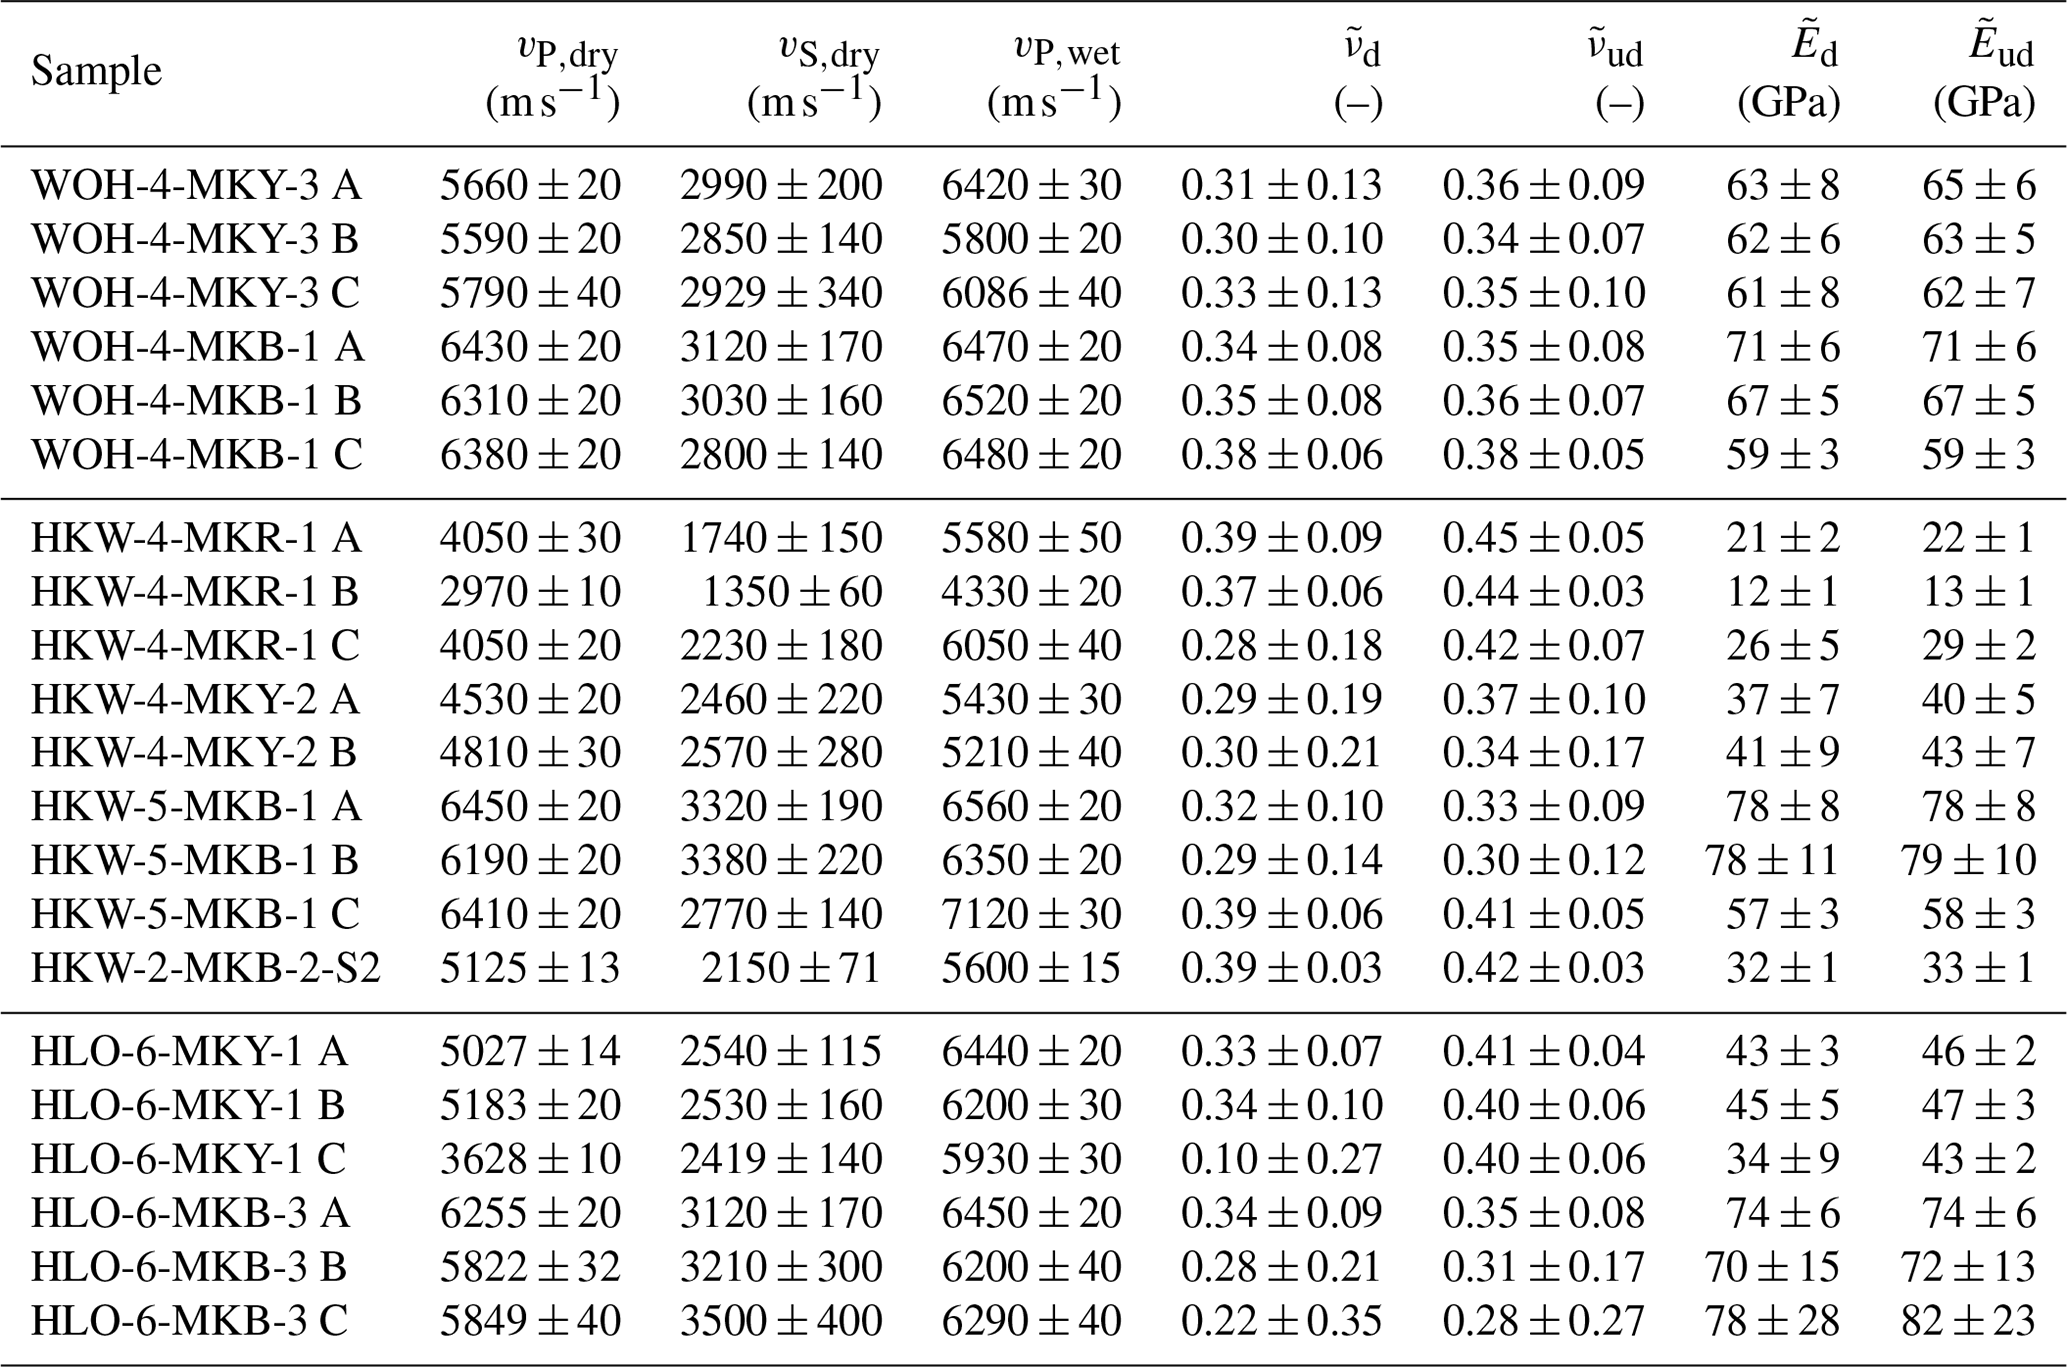
vP,dry, vP,wet: P-wave velocity of dry and wet samples; vS,dry: S-wave velocity of dry samples; : dynamic drained Poisson’s ratio; : dynamic undrained Poisson’s ratio; : dynamic drained Young’s modulus; : dynamic undrained Young’s modulus. Quoted uncertainties reflect accuracy of the measurements.
Table 6Overview of the 2D discontinuity connectivity results.
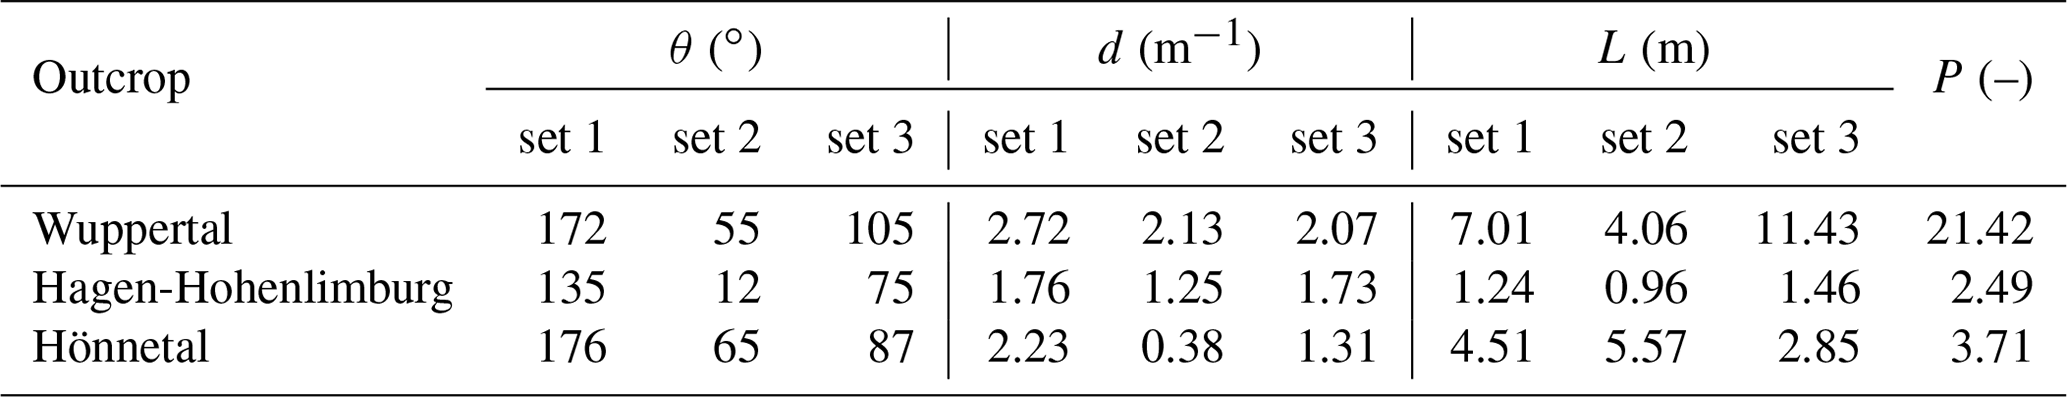
θ: discontinuity strike azimuth; d: discontinuity density; L: mean discontinuity length; P: 2D discontinuity connectivity.
The influence of pore and crack volume in the dolomitic carbonate samples was also reflected in the measured ultrasonic velocities (Table 5). The dolomitic carbonate samples showed the lowest P-wave velocities. The S-wave velocities of dolomitic carbonates and limestones hardly differ, which align with the given densities. Therefore, a warning must be given at this point because it is crucial to observe the temporal and spatial variation of elastic wave velocities during a potential reservoir stimulation of a dolomite and limestone reservoir in order to infer its properties and composition. In the next stage, these findings can be of great importance for interpreting flow rates in the deep carbonate reservoir. Ahrens et al. (2018) demonstrated a uniform correlation between P-wave velocity and the key parameter for transient flow processes experimentally, i.e. hydraulic diffusivity, in the direction of fluid flow during inelastic deformation. Their observation allows the conclusion that monitoring variations in P-wave velocities in field studies can indicate changing fluid flow rates, for example, in developing reservoirs. Consequently, these measurements have the potential to provide insights into the deformation state, connectivity, and hydraulic properties of pore and discontinuity networks in the reservoir.
The low impact of the fluid saturation on the samples' dynamic moduli indicates that heterogeneous pore and crack networks prevail in the investigated samples (Table 5). In the samples' measuring or drilling direction, only a small increase of the P-velocities and thus also of the undrained dynamic moduli occurs. This indicates that the connected pore and crack space tends to be locally distributed (upper Hashin–Shtrikman bound for a simplified two-phase carbonate material; Hashin and Shtrikman, 1963), since ultrasonic velocities only characterize the momentary elastic behaviour along a wave path, which was chosen by the waves due to its above-average rigidity. On the scale of wavelength (1 to 7 mm), the samples are thus probably heterogeneous. Moreover, a velocity anisotropy should also prevail, which is particularly relevant for seismic surveys. However, under the assumption of constant porosity, a possibly existing heterogeneous and local distribution of the pore and crack volume can favour the interconnection of these volumes to large pores or opened cracks more than a homogeneous distribution of many small pores could. In this case heterogeneity possibly favours the fluid flow.
Through hydraulic stimulation, however, the fractures prevailing there and their networks could be reactivated, thus increasing the permeability even though this prediction depends on the discontinuity network's orientation in the stress field and the fluid pressure. However, it is indispensable for geothermal projects to carry out a seismic risk analysis before planning to manipulate the local stress conditions, i.e. the reactivation of fractures.
We investigated the geothermal potential of a carbonate reservoir in the Rhine-Ruhr area, Germany, by combining outcrop scanline surveys of pre-existing discontinuities and laboratory measurements of petrophysical properties on a sample scale. The target horizon of interest is an approximately 150 m thick and widely distributed compacted limestone layer (Massenkalk) from the Late Devonian that dips northwards at 30 to 40∘ and likely occurs at a depth of 4000 to 6000 m. If we extrapolate the course of the exposed Devonian limestone layers, which were investigated at three outcrop analogues, in the direction of the maximum horizontal stress, the carbonate reservoir could hypothetically extend below Essen, Bochum, and Dortmund.
Our petrophysical laboratory measurements on representative outcrop samples showed insufficient matrix porosity, permeability, and thermal conductivity for geothermal energy production. However, outcrop investigation suggests that these units could act as a naturally fractured reservoir at depth. Generally, three discontinuity sets striking in NNW–SSW, NW–SE, and NE–SW directions with dipping angles between 80 and 90∘ were measured. Considering the numerous tectonic events in the Rhine-Ruhr region and the resulting repeated reactivation of pre-existing discontinuities and thus surface wear and/or degradation, the occurrence of slightly smooth discontinuity surfaces in the reservoir is more likely. We suggest that geothermal exploration efforts focus on discontinuities that are approximately NNW–SSE oriented, bearing in mind that this direction is approximately parallel to the main horizontal stress according to the World Stress Map. Although the discontinuities may not be open, more than half of them showed paleo-filling materials such as calcite beside calcite-enriched slicksides, giving them the potential to be reactivated and improve fluid flow in the carbonate reservoir.
Based on the mean discontinuity length, spacing, and orientation observed at the surface and our discontinuity connectivity analysis, the reservoir at depth most likely has a well-connected network of discontinuities. The hypothetical fractured carbonate formation below Essen could most likely have the comparatively best connected discontinuity network, since a high discontinuity connectivity could be determined for the corresponding reference reservoir in Wuppertal. Despite this, we conclude that the permeability is more significant in the Devonian reef regions facies than in the other areas investigated because of the presence of many karst formations and altered host rocks by hydrothermal veins. This assumption was also confirmed by our laboratory measurements, whose results suggest the presence of heterogeneities that may favour fluid flow.
Our study may provide the basis for improved subsurface characterization concerning the structure and characteristics of the naturally fractured Devonian limestone reservoir in the Rhine-Ruhr area. More sophisticated geophysical prospecting techniques and a combination of pressure- and temperature-dependent laboratory measurements have to be elaborated to verify the reservoir depth and orientation, as well as its discontinuity density and connectivity. It must be demonstrated whether the prevailing discontinuity network can be reactivated, thereby improving the fluid flow in the carbonate reservoir. In addition, the local stress field should be further verified in follow-up studies. The understanding of the discontinuity network's structural characteristics and physical properties and their impact on reservoir properties that, in turn, define the geothermal potential will benefit from, for instance, seismic surveys and in situ measurements in a pilot borehole.
The measured values and results recorded within the study are available on reasonable request from the corresponding author.
Four authors have contributed to this paper. MB was the lead author and carried out the field investigations, laboratory measurements, and analytical calculations. BA helped with the laboratory measurements on transport and elastic properties. KL was involved in the field investigations. EHS provided helpful background knowledge. MB and BA were involved in the data interpretation and writing of the manuscript.
The authors declare that they have no conflict of interest.
This article is part of the special issue “Faults, fractures, and fluid flow in the shallow crust”. It is not associated with a conference.
We thank all students and researchers involved in field and laboratory measurements, in particular Mathias Nehler. Martin Balcewicz, Benedikt Ahrens, and Erik H. Saenger acknowledge generous funding by the Federal Ministry of Education and Research and geomecon GmbH for the project 3D-RuhrMarie (“FHprofUnt2016”). Kevin Lippert thanks the “Ministerium für Innovation, Wissenschaft und Forschung des Landes Nordrhein-Westfalen” for funding of the project GREENER (“FH ZEIT für FORSCHUNG”). Martin Balcewicz and Erik H. Saenger would like to thank the “Ministerium für Kultur und Wissenschaft des Landes Nordrhein-Westfalen” for funding the project ComLabGo (“FH Zeit für Forschung”). We especially thank the Geological Survey of North Rhine-Westphalia for providing maps and other information, as well as John Hooker, Sadegh Karimpouli, and Randolph T. Williams for fruitful discussions and helpful comments on an earlier draft of the manuscript.
This research has been supported by the Finanzierung-LDS-SIS:Drittmittel Bund (grant no. 13FH279PX6), the Projektträger Jülich (grant no. 1609fhz039), and the Projektträger Jülich (grant no. 1609fhz037).
This open-access publication was funded by Bochum University of Applied Sciences.
This paper was edited by Randolph Williams and reviewed by Sadegh Karimpouli and John Hooker.
AGFW: Arbeitsgemeinschaft für Wärme und Heizkraftwirtschaft: Technisches Handbuch Fernwärme, Technik und Normung, AGFW-Projektges. für Rationalisierung, Information und Standardisierung, Frankfurt am Main, Germany, 2009. a
Agosta, F., Alessandroni, M., Antonellini, M., Tondi, E., and Giorgioni, M.: From fractures to flow: A field-based quantitative analysis of an outcropping carbonate reservoir, Tectonophysics, 490, 197–213, https://doi.org/10.1016/j.tecto.2010.05.005, 2010. a
Ahrens, B., Duda, M., and Renner, J.: Relations between hydraulic properties and ultrasonic velocities during brittle failure of a low-porosity sandstone in laboratory experiments, Geophys. J. Int., 212, 627–645, https://doi.org/10.1093/gji/ggx419, 2018. a, b
Araújo, K.: The emerging field of energy transitions: progress, challenges, and opportunities, Energy Res. Soc. Sci, 1, 112–121, https://doi.org/10.1016/j.erss.2014.03.002, 2014. a
Attewell, P. B. and Farmer, I. W.: Principles of Engineering Geology, Springer Science and Business Media, London, UK, 1976. a
Baecher, G. B. and Christian, J. T.: Reliability and statistics in geotechnical engineering, John Wiley and Sons, Chichester, UK, 2005. a
Basse, M., Koch, L., and Lemke, U.: Torleyiscutellum herwigorum n. gen., n. sp. (Trilobita) from the Upper Honsel Beds of the north-western Sauerland (Lower Givetian, Rhenohercynian Zone), with a contribution to scutelluid systematic, Neues Jahrb. Geol. Paläontol., 281, 51–93, https://doi.org/10.1127/njgpa/2016/0587, 2016. a
Becker, R., Aboussalam, Z., Stichling, S., and May, A.: The Givetian-Frasnian Hönne Valley Reef Complex (northern Sauerland) – an outline of stratigraphy and facies development, Münster. Forsch. Geol. Paläont., 108, 126–140, 2016. a
Böhm, F., Koch, R., Höferle, R., and Baasch, R.: Der Malm in der Geothermiebohrung Pullach Th2 – Faziesanalyse aus Spülproben (München, S-Deutschland), Geol. Bl. NO-Bayern, 60, 17–49, 2010. a
Bonnet, E., Bour, O., Odling, N. E., Davy, P., Main, I., Cowie, P., and Berkowitz, B.: Scaling of fracture systems in geological media, Rev. Geophys., 39, 347–383, https://doi.org/10.1029/1999RG000074, 2001. a, b, c
Brix, M. R., Drozdzewski, G., Greiling, R. O., Wolf, R., and Wrede, V.: The N Variscan margin of the Ruhr coal district (Western Germany): structural style of a buried thrust front?, Geol. Rundsch., 77, 115–126, https://doi.org/10.1007/BF01848679, 1988. a, b, c, d, e, f, g
Brudy, M., Zoback, M. D., Fuchs, K., Rummel, F., and Baumgärtner, J.: Estimation of the complete stress tensor to 8km depth in the KTB scientific drill holes: Implications for crustal strength, J. Geophys. Res.-Sol. Ea., 102, 18453–18475, https://doi.org/10.1029/96JB02942, 1997. a
Cappa, F., Guglielmi, Y., Fénart, P., Merrien-Soukatchoff, V., and Thoraval, A.: Hydromechanical interactions in a fractured carbonate reservoir inferred from hydraulic and mechanical measurements, Int. J. Rock Mech. Min., 42, 287–306, https://doi.org/10.1016/j.ijrmms.2004.11.006, 2005. a
Čermák, V. and Rybach, L.: Thermal conductivity and specific heat of minerals and rocks, in: Landolt-Börnstein: Numerical Data and Functional Relationships in Science and Technology, New Series, Group V (Geophysics and Space Research), Volume Ia (Physical Properties of Rocks), edited by: Angenheister, G., Springer, Berlin and Heidelberg, Germany, 305–343, 1982. a
Clauser, C. and Huenges, E.: Thermal Conductivity of Rocks and Minerals, in: Rock Physics and Phase Relations, edited by: Ahrens, T. J., American Geophysical Union, Washington, DC, USA, 105–126, https://doi.org/10.1029/RF003p0105, 2013. a
Cruden, D.: Describing the size of discontinuities, Int. J. Rock Mech. Min., 14, 133–137, https://doi.org/10.1016/0148-9062(77)90004-3, 1977. a
Dahi Taleghani, A. and Olson, J. E.: How natural fractures could affect hydraulic-fracture geometry, SPE J., 19, 161–171, https://doi.org/10.2118/167608-PA, 2013. a
Dallmeyer, R. D., Franke, W., and Weber, K.: Pre-Permian geology of central and eastern Europe, Springer Science and Business Media, Berlin and Heidelberg, Germany, 2013. a, b
Darcy, H. P. G.: Les Fontaines publiques de la ville de Dijon. Exposition et application des principes à suivre et des formules à employer dans les questions de distribution d'eau, etc, V. Dalmont, Paris, France, 1856. a
DEKORP Research Group: Results of deep-seismic reflection investigations in the Rhenish Massif, Tectonophysics, 173, 507–515, https://doi.org/10.1016/0040-1951(90)90242-Z, 1990. a, b, c
Der Kiureghian, A. and Ditlevsen, O.: Aleatory or epistemic? Does it matter?, Struct. Saf., 31, 105–112, https://doi.org/10.1016/j.strusafe.2008.06.020, 2009. a
Drozdzewski, G.: Beiträge zur Tiefentektonik westdeutscher Steinkohlenlagerstätten, Geologisches Landesamt Nordrhein-Westfalen, Krefeld, Germany, 1985. a
Drozdzewski, G. and Wrede, V.: Faltung und Bruchtektonik – Analyse der Tektonik im Subvariscikum, Fortschritte in der Geologie von Rheinland und Westfalen, 38, 7–187, 1994. a, b, c, d, e
Drozdzewski, G., Grabert, H., Hartkop-Fröder, C., Jansen, F., Juch, D., Pieper, B., Schlimm, W., Stehn, O., Steuerwald, K., Suchan, K.-H., Thome, K., and Vogler, H.: Erläuterungen zur Geologischen Karte von Nordrhein-Westfalen 1:100 000, Blatt C 4706 Düsseldorf-Essen, Geolog. Landesamt Nordrhein-Westfalen, Krefeld, 2007. a, b, c
Duda, M. and Renner, J.: The weakening effect of water on the brittle failure strength of sandstone, Geophys. J. Int., 192, 1091–1108, https://doi.org/10.1093/gji/ggs090, 2013. a
Engel, W., Franke, W., and Langenstrassen, F.: Palaeozoic sedimentation in the northern branch of the mid-European Variscides – Essay of an interpretation, in: Intracontinental fold belts, edited by: Martin, H. and Eder, F. W., Springer, Berlin, Germany, 9–41, https://doi.org/10.1007/978-3-642-69124-9_2, 1983. a
Evans, J. P., Forster, C. B., and Goddard, J. V.: Permeability of fault-related rocks, and implications for hydraulic structure of fault zones, J. Struct. Geol., 19, 1393–1404, https://doi.org/10.1016/S0191-8141(97)00057-6, 1997. a
Flügel, E. and Hötzl, H.: Palökologische und statistische Untersuchungen in mitteldevonischen Schelf-Kalken (Schwelmer Kalk, Givet; Rheinisches Schiefergebirge), Bayerische Akad. Wiss., München, Germany, 1976. a
Franke, W. and Engel, W.: Variscan sedimentary basins on the Continent, and relations with south-west England, Proc. Ussher., 5, 259–269, 1982. a
Franke, W., Bortfeld, R. K., Brix, M., Drozdzewski, G., Dürbaum, H. J., Giese, P., Janoth, W., Jödicke, H., Reichert, C., Scherp, A., Schmoll, J., Thomas, R., Thünker, M., Weber, K., Wiesner, M. G., and Wong, H. K.: Crustal structure of the Rhenish Massif: results of deep seismic reflection lines Dekorp 2-North and 2-North-Q, Geol. Rundsch., 79, 523–566, https://doi.org/10.1007/BF01879201, 1990. a
Franke, W., Cocks, L. R. M., and Torsvik, T. H.: The Palaeozoic Variscan oceans revisited, Gondwana Res., 48, 257–284, https://doi.org/10.1016/j.gr.2017.03.005, 2017. a, b
Fridleifsson, I. B., Bertani, R., Huenges, E., Lund, J. W., Ragnarsson, A., and Rybach, L.: The possible role and contribution of geothermal energy to the mitigation of climate change, in: IPCC scoping meeting on renewable energy sources, proceedings, 20–25 January 2008, Luebeck, Germany, 59–80, https://doi.org/20.500.11850/13474.3, 2008. a
Fritzer, T., Settles, E., and Dorsch, K.: Bayerischer Geothermieatlas – Hydrothermale Energiegewinnung, Bayerisches Staatsministerium für Wirtschaft, Infrastruktur, Verkehr und Technologie, Munich, Germany, 2010 (in German). a
Ganoulis, J.: Engineering risk analysis of water pollution: probabilities and fuzzy sets, John Wiley and Sons, Weinheim, Germany, 2008. a
Gassmann, F.: Über die Elastizität poröser Medien: Vier. der Natur, Gesellschaft Zürich, 96, 1–23, 1951. a
Gebrande, H.: 3.1.3 Elastic wave velocities and constants of elasticity of rocks at room temperature and pressures < 1 GPa: Datasheet from Landolt-Börnstein – Group V Geophysics Volume 1B, in: Subvolume B, edited by: Angenheister, G., Springer, Berlin and Heidelberg, Germany, 35–38, https://doi.org/10.1007/10201909_7, 1982. a
Gillhaus, A., GÖtte, T., and Richter, D. K.: Polyphase spätdiagenetische Dolomitbildung im mittel-bis oberdevonischen Massenkalk von Hagen-Hohenlimburg (Remscheid-Altenaer Sattel, Rheinisches Schiefergebirge), Mitt. Ges. Geol. Bergbaustud. Österr., 46, 51–66, 2003. a, b
Goldstein, B., Hiriart, G., Tester, J., Bertani, B., Bromley, R., Gutierrez-Negrin, L., Huenges, E., Ragnarsson, A., Mongillo, A., Muraoka, H., and Zui, V. I.: Thirty-Sixth Workshop on Geothermal Reservoir Engineering Stanford University, 31 January–2 February 2011, Stanford, California, USA, SGP-TR-191, 2011. a
Grabert, H.: Abriß der Geologie von Nordrhein-Westfalen, Schweizerbart'sche Verlagsbuchhandlung, Stuttgart, Germany, 1998. a, b
Guerriero, V., Mazzoli, S., Iannace, A., Vitale, S., Carravetta, A., and Strauss, C.: A permeability model for naturally fractured carbonate reservoirs, Mar. Petrol. Geol., 40, 115–134, https://doi.org/10.1016/j.marpetgeo.2012.11.002, 2013. a
Hancock, P. L. and Bevan, T. G.: Brittle modes of foreland extension, Geol. Soc. Spec. Publ., 28, 127–137, https://doi.org/10.1144/GSL.SP.1987.028.01.10, 1987. a
Hashin, Z. and Shtrikman, S.: A variational approach to the theory of the elastic behaviour of multiphase materials, J. Mech. Phys. Solids, 11, 127–140, https://doi.org/10.1016/0022-5096(63)90060-7, 1963. a
Heidbach, O., Rajabi, M., Reiter, K., and Ziegler, M.: World stress map database release 2016, GFZ Data Services, https://doi.org/10.5880/WSM.2016.002, 2016. a, b, c, d, e
Hesemann, J.: Die Ergebnisse der Bohrung Münsterland 1, Springer Fachmedien, Wiesbaden, Germany, 1965. a
Hirschberg, S., Wiemer, S., and Burgherr, P.: Energy from the Earth. Deep Geothermal as Resource for the Future?, vdf Hochschulverlag AG, Zurich, Switzerland, 2015. a
Hoek, E. and Brown, E.: Practical estimates of rock mass strength, Int. J. Rock Mech. Min., 34, 1165–1186, https://doi.org/10.1016/S1365-1609(97)80069-X, 1997. a
Holder, M. T. and Leversidge, B. E.: A model for the tectonic evolution of south Cornwall, J. Geol. Soc. London, 143, 125–134, https://doi.org/10.1144/gsjgs.143.1.0125, 1986. a
Homuth, S.: Aufschlussanalogstudie zur Charakterisierung oberjurassischer geothermischer Karbonatreservoire im Molassebecken, PhD thesis, Technische Universität Darmstadt, Darmstadt, Germany, 314 pp., 2014. a
Homuth, S., Götz, A. E., and Sass, I.: Reservoir characterization of the Upper Jurassic geothermal target formations (Molasse Basin, Germany): role of thermofacies as exploration tool, Geoth. Energ. Sci., 3, 41–49, https://doi.org/10.5194/gtes-3-41-2015, 2015a. a
Homuth, S., Götz, A., and Sass, I.: Physical Properties of the Geothermal Carbonate Reservoirs of the Molasse Basin, Germany – Outcrop Analogue vs. Reservoir Data, in: World geothermal congress 2015, 19–24 April 2015, Melbourne, Australia, 2015b. a
Hudson, J. A.: Engineering Properties of Rocks, 2nd edn., edited by: Zhang, L., Butterworth-Heinemann, Oxford, UK, Cambridge, USA, https://doi.org/10.1016/B978-0-12-802833-9.09994-6, 2005. a
ISRM: International society for rock mechanics commission on standardization of laboratory and field tests: Suggested methods for the quantitative description of discontinuities in rock masses, Int. J. Rock Mech. Min., 15, 319–368, https://doi.org/10.1016/0148-9062(78)91472-9, 1978. a
Jansen, F., von Kamp, H., Kühn-Velten, H., Kunz, E., Müller, H., Paproth, E., Rabitz, A., Thome, K., and Vogler, H.: Erläuterung zur Geologische Karte von Nordrhein-Westfalen 1 : 100 000, Blatt C 4710 Dortmund, Geolog. Landesamt Nordrhein-Westfalen, Krefeld, Germany, 1986. a, b, c
Jorand, R., Clauser, C., Marquart, G., and Pechnig, R.: Statistically reliable petrophysical properties of potential reservoir rocks for geothermal energy use and their relation to lithostratigraphy and rock composition: The NE Rhenish Massif and the Lower Rhine Embayment (Germany), Geothermics, 53, 413–428, https://doi.org/10.1016/j.geothermics.2014.08.008, 2015. a
Jux, U.: Die devonischen Riffe im rheinischen Schiefergebirge, Teile I und II, N. Jb. Geol. Paläont., Abh., 110/2, 186–258, Stuttgart, Germany, 1960. a
Kelley, V. C. and Clinton, N. J.: Fracture systems and tectonic elements of the Colorado Plateau, University of New Mexico Press, Albuquerque, New Mexico, USA, 1960. a
Klaus, T., Vollmer, C., Werner, K., Lehmann, H., and Müschen, K.: Energieziel 2050: 100 % Strom aus erneuerbaren Quellen, Umweltbundesamt, Dessau, Germany, 2010. a
Kley, J.: Saxonische Tektonik im 21. Jahrhundert, Z. Dtsch. Ges. Geowiss., 164, 295–311, https://doi.org/10.1127/1860-1804/2013/0022, 2013. a, b
Kloke, R.: Geologische Kartierung des Steinbruchgebietes Asbeck, Hönnetal (NRW), Diploma thesis, Ruhr-Universität Bochum, Bochum, Germany, 72 pp., 2007. a, b
Knutzen, L. K.: Geothermal and spatial coupled site selection for the connection of deep geothermal plants to existing district heating networks on the example of the Ruhr Metropolitan Region, PhD thesis, Ruhr-Universität Bochum, Bochum, Germany, 205 pp., 2017. a
Koch-Früchtel, U. and Früchtel, M.: Stratigraphie und Faziesanalyse einer mitteldevonischen arbonatabfolge im Remscheid-Altenaer Sattel (Sauerland), Geol. Paläont. Westf., 26, 47–75, 1993. a
Kranz, R. L., Frankel, A. D., Engelder, T., and Scholz, C. H.: The permeability of whole and jointed Barre Granite, Int. J. Rock. Mech. Min., 16, 225–234, https://doi.org/10.1016/0148-9062(79)91197-5, 1979. a
Krebs, W.: Devonian Carbonate Complexes of Central Europe, AAPG Bull., 54, 856–857, https://doi.org/10.1306/5D25CAE9-16C1-11D7-8645000102C1865D, 1970. a, b, c, d, e
Lacazette, A.: A new stereographic technique for the reduction of scanline survey data of geologic fractures, Comput. Geosci., 17, 445–463, https://doi.org/10.1016/0098-3004(91)90051-E, 1991. a, b
La Pointe, P. R. and Hudson, J. A.: Characterization and interpretation of rock mass joint patterns, Geological Society of America, Boulder, CO, USA, 1985. a, b
Laubach, S. E., Olson, J. E., and Gale, J. F. W.: Are open fractures necessarily aligned with maximum horizontal stress?, Earth Planet. Sci. Lett., 222, 191–195, 2004. a, b
Löer, K., Riahi, N., and Saenger, E. H.: Three-component ambient noise beamforming in the Parkfield area, Geophys. J. Int., 213, 1478–1491, https://doi.org/10.1093/gji/ggy058, 2018. a
Lorenz, J. C., Teufel, L. W., and Warpinski, N. R.: Regional Fractures I: A Mechanism for the Formation of Regional Fractures at Depth in Flat-Lying Reservoirs1, AAPG Bull., 75, 1714–1737, https://doi.org/10.1306/0C9B29E3-1710-11D7-8645000102C1865D, 1991. a, b
Lucia, J. F., Charles, K., and James, J.: Carbonate Reservoir Characterization, vol. 2, Springer, Berlin and Heidelberg, Germany, https://doi.org/10.1007/978-3-540-72742-2, 2007. a
Markovaara-Koivisto, M. and Laine, E.: MATLAB script for analyzing and visualizing scanline data, Comput. Geosci., 40, 185–193, https://doi.org/10.1016/j.cageo.2011.07.010, 2012. a, b, c
Martin, G. S., Wiley, R., and Marfurt, K. J.: Marmousi2: An elastic upgrade for Marmousi, Lead. Edge, 25, 156–166, https://doi.org/10.1190/1.2172306, 2006. a
MATLAB: version 9.4.0. (R2018a), The MathWorks Inc., Natick, MA, USA, 2018. a
Mavko, G., Mukerji, T., and Dvorkin, J.: The Rock Physics Handbook, 3 edn., Cambridge University Press, Cambridge, UK, https://doi.org/10.1017/CBO9780511626753, 2020. a
Meschede, M.: Deutschland im späten Paläozoikum, in: Geologie Deutschlands, 2nd edition, Springer, Berlin and Heidelberg, Germany, 61–101, https://doi.org/10.1007/978-3-662-56422-6, 2018. a, b, c, d
Michie, E.: Influence of host lithofacies on fault rock variation in carbonate fault zones: A case study from the Island of Malta, J. Struct. Geol., 76, 61–79, 2015. a, b
Narr, W.: Fracture Density in the Deep Subsurface: Techniques with Application to Point Arguello Oil Field, AAPG Bull., 75, 1300–1323, https://doi.org/10.1306/0C9B2939-1710-11D7-8645000102C1865D, 1991. a, b
Narr, W.: Estimating Average Fracture Spacing in Subsurface Rock, AAPG Bull., 80, 1565–1585, https://doi.org/10.1306/64EDA0B4-1724-11D7-8645000102C1865D, 1996. a, b
Nelson, R.: Geologic analysis of naturally fractured reservoirs, Elsevier, Oxford, UK, 2001. a
Nelson, R. A. and Handin, J.: Experimental study of fracture permeability in porous rock, AAPG Bull., 61, 227–236, https://doi.org/10.1306/C1EA3C2B-16C9-11D7-8645000102C1865D, 1977. a
Nickelsen, R. P. and Hough, V. N. D.: Jointing in the Appalachian Plateau of Pennsylvania, AAPG Bull., 78, 609–630, https://doi.org/10.1130/0016-7606(1967)78[609:JITAPO]2.0.CO;2, 1967. a
Normenausschuss Bauwesen (NABau): DIN 18124: Determination of density of solid particles – Capillary pyknometer, wide mouth pycnometer, gas pycnometer, Beuth, Berlin, Germany, 2011. a
Odling, N. E., Gillespie, P., Bourgine, B., Castaing, C., Chiles, J. P., Christensen, N. P., Fillion, E., Genter, A., Olsen, C., Thrane, L., Trice, R., Aarseth, E., Walsh, J. J., and Watterson, J.: Variations in fracture system geometry and their implications for fluid flow in fractures hydrocarbon reservoirs, Petrol. Geosci., 5, 373–384, https://doi.org/10.1144/petgeo.5.4.373, 1999. a
Oncken, O.: Transformation of a magmatic arc and an orogenic root during oblique collision and it's consequences for the evolution of the European Variscides (Mid-German Crystalline Rise), Geol. Rundsch., 86, 2–20, https://doi.org/10.1007/s005310050118, 1997. a
Ozkaya, S. I.: A Simple Formula To Estimate 2D Fracture Connectivity, SPE Reservoir Evaluation and Engineering, 14, 763–775, 2011. a
Paeckelmann, W.: Erläuterungen zur Geologische Karte von Preußen und benachbarten deutschen Ländern, Blatt Balve, Geolog. Landesamt Nordrhein-Westfalen, Krefeld, Germany, 1938. a
Paeckelmann, W.: Erläuterungen zur Geologischen Karte von Nordrhein-Westfalen 1:25000, Blatt 4708 Wuppertal-Elberfeld, Geolog. Landesamt Nordrhein-Westfalen, Krefeld, Germany, 1979. a, b
Pas, D., Da Silva, A.-C., Cornet, P., Bultynck, P., Königshof, P., and Boulvain, F.: Sedimentary development of a continuous Middle Devonian to Mississippian section from the fore-reef fringe of the Brilon Reef Complex (Rheinisches Schiefergebirge, Germany), Facies, 59, 969–990, https://doi.org/10.1007/s10347-012-0351-z, 2013. a
Popov, Y. A.: Optical scanning technology for nondestructive contactless measurements of thermal conductivity and diffusivity of solid matters, Exp. Heat Transfer, Fluid Mech. Thermodyn., 1, 109–117, 1997. a
Priest, S. D.: Discontinuity Analysis for Rock Engineering, Springer Science and Business Media, London, UK and New York, USA, https://doi.org/10.1007/978-94-011-1498-1, 1995. a
Priest, S. D. and Hudson, J. A.: Discontinuity spacings in rock, Int. J. Rock. Mech. Min., 13, 135–148, https://doi.org/10.1016/0148-9062(76)90818-4, 1976. a
Priest, S. D. and Hudson, J. A.: Estimation of discontinuity spacing and trace length using scanline surveys, Int. J. Rock Mech. Min., 18, 183–197, https://doi.org/10.1016/0148-9062(81)90973-6, 1981. a, b, c, d, e, f, g, h, i, j
Roberts, J. C.: Jointing and minor tectonics of the Vale of Glamorgan between Ogmore-By-Sea and Lavernock Point, South Wales, Geol. J., 9, 97–114, https://doi.org/10.1002/gj.3350090201, 1974. a
Rummel, F. and Weber, U.: Stress field in the coal mines of the Ruhr coal district, in: The 34th US Symposium on Rock Mechanics (USRMS), ARMA, 28–30 June 1993, Madison, Wisconsin, USA, 609–612, 1993. a, b, c
Salamon, M. and Königshof, P.: Middle Devonian olistostromes in the Rheno-Hercynian zone (Rheinisches Schiefergebirge) – An indication of back arc rifting on the southern shelf of Laurussia, Gondwana Res., 17, 281–291, https://doi.org/10.1016/j.gr.2009.10.004, 2010. a, b
Santos, R. F. V. C., Miranda, T. S., Barbosa, J. A., Gomes, I. F., Matos, G. C., Gale, J. F. W., Neumann, V. H. L. M., and Guimarães, L. J. N.: Characterization of natural fracture systems: Analysis of uncertainty effects in linear scanline results, AAPG Bull., 99, 2203–2219, https://doi.org/10.1306/05211514104, 2015. a
Scheer, D., Konrad, W., and Scheel, O.: Public evaluation of electricity technologies and future low-carbon portfolios in Germany and the USA, Energ. Sustain. Soc., 3, 8, https://doi.org/10.1186/2192-0567-3-8, 2013. a
Schellschmidt, R., Sanner, B., Pester, S., and Schulz, R.: Geothermal energy use in Germany, in: Proceedings of the World Geothermal Congress, 25–30 April 2010, Bali, Indonesia, p. 19, 2010. a
Schudack, M.: Karbonatzyklen in Riff- und Lagunenbereichen des devonischen Massenkalkkomplexes von Asbeck (Hönnetal, Rheinisches Schiefergebirge), Geol. Paläont. Westf., 26, 77–106, 1993. a, b
Stearns, D. W. and Friedman, M.: Reservoirs in Fractured Rock, in: Stratigraphic Oil and Gas Fields—Classification, Exploration Methods, and Case Histories, edited by: King R. E., American Association of Petroleum Geologists, Volume 16, University of California, Oakland, USA, available at: https://pubs.geoscienceworld.org/books/book/1472/chapter/107176787/Reservoirs-in-Fractured-Rock?redirectedFrom=PDF (last access: 27 March 2020), 1972. a
Stober, I.: Hydrochemical properties of deep carbonate aquifers in the SW German Molasse basin, Geothermal Energy, 2, 13, https://doi.org/10.1186/s40517-014-0013-1, 2014. a
Terzaghi, R. D.: Sources of Error in Joint Surveys, Geotechnique, 15, 287–304, https://doi.org/10.1680/geot.1965.15.3.287, 1965. a
van Golf-Racht, T. D.: Fundamentals of fractured reservoir engineering, Elsevier, Amsterdam, the Netherlands, 1982. a
von Kamp, H. and Ribbert, K. H.: Erläuterungen zur Geologischen Karte von Nordrhein-Westfalen 1 : 25 000, Blatt 4611 Hagen-Hohenlimburg, Geolog. Landesamt Nordrhein-Westfalen, Krefeld, Germany, 2005. a
Wagner, W.: FLUIDCAL, software for calculation of thermodynamic properties for a great number of substances, F.I.R.S.T. – Gesellschaft für technisch-wissenschaftliche Softwareanwendungen mbH, Wermelskirchen, Germany, 2009. a
Watkins, H., Bond, C. E., Healy, D., and Butler, R. W.: Appraisal of fracture sampling methods and a new workflow to characterise heterogeneous fracture networks at outcrop, J. Struct. Geol., 72, 67–82, 2015. a
Wegener, M., Schwarze, B., Spiekermann, K., Brosch, K., Huber, F., Müller, M., and Reutter, O.: Modelling the great transformation in the Ruhr area, Transp. Res. Proc., 41, 231–239, https://doi.org/10.1016/j.trpro.2019.09.042, 2019. a
Wilson, C. E., Aydin, A., Karimi-Fard, M., Durlofsky, L. J., Amir, S., Brodsky, E. E., Kreylos, O., and Kellogg, L. H.: From outcrop to flow simulation: Constructing discrete fracture models from a LIDAR survey, AAPG Bull., 95, 1883–1905, https://doi.org/10.1306/03241108148, 2011. a