the Creative Commons Attribution 4.0 License.
the Creative Commons Attribution 4.0 License.
 | 10 Mar 2021
The role of edge-driven convection in the generation of volcanism – Part 1: A 2D systematic study
Antonio Manjón-Cabeza Córdoba
Maxim D. Ballmer
The origin of intraplate volcanism is not explained by plate tectonic theory, and several models have been put forward for explanation. One of these models involves edge-driven convection (EDC), in which cold and thick continental lithosphere is juxtaposed with warm and thin oceanic lithosphere to trigger convective instability. To test whether EDC can produce long-lived high-volume magmatism, we run numerical models of EDC for a wide range of mantle properties and edge (i.e., the oceanic–continental transition) geometries. We find that the most important parameters that govern EDC are the rheological parameters mantle viscosity η0 and activation energy Ea. However, even the maximum melting volumes predicted by our most extreme cases are insufficient to account for island-building volcanism on old seafloor, such as at the Canary Islands and Cabo Verde. Also, beneath old seafloor, localized EDC-related melting commonly transitions into widespread melting due to small-scale sublithospheric convection, inconsistent with the distribution of volcanism at these volcano chains. In turn, EDC is a good candidate to sustain the formation of small seamounts on young seafloor, as it is a highly transient phenomenon that occurs in all our models soon after initiation. In a companion paper, we investigate the implications of interaction of EDC with mantle plume activity (Manjón-Cabeza Córdoba and Ballmer, 2021).
- Article
(5004 KB) - Full-text XML
- Companion paper
- BibTeX
- EndNote


Understanding the origin of volcanism improves our understanding of Earth's deep interior processes, structure and composition. In this context, intraplate volcanism deserves particular attention because it is not readily explained by plate tectonics processes. One of the leading theories to explain intraplate magmatism involves mantle plume theory. In this theory, a magmatic hotspot is sustained by a fixed and columnar mantle upwelling, or “plume”, forming a volcano chain on a steadily moving plate (Wilson, 1963; Morgan, 1971).
Plume theory makes specific testable predictions, such as the distribution of volcanism, the age–distance relationship along the volcanic chain, and anomalies in heat flux and topography (hotspot swells). These predictions have been successfully compared to observations at several locations (e.g., Hawaii, Louisville), however, comparisons fail at other locations (see Courtillot et al., 2003). For example, the age–distance relationship measured along the Pukapuka Ridge does not agree with the overriding plate motion (Sandwell et al., 1995; Ballmer et al., 2013), and at Madeira, there is no apparent swell (Anderson, 2005; Ballmer et al., 2013; King and Adam, 2014). Accordingly, alternative or complementary models have been proposed for sustaining intraplate volcanism (Foulger and Anderson, 2005; Hirano, 2011; Ballmer et al., 2015; Green, 2015).
One of these models involves edge-driven convection (EDC; King and Anderson, 1995, 1998). EDC is a variant of small-scale convection (SSC; Richter, 1973; Parsons and McKenzie, 1978; Huang et al., 2003; Dumoulin et al., 2005), i.e., a thermal boundary-layer instability that is largely driven by cooling of the lithosphere and the related density inversion (Ballmer et al., 2009; Ballmer, 2017). EDC is triggered by the presence of lithospheric steps (or lateral heterogeneity): the related lateral density difference promotes the instability (which is ultimately driven by the density inversion), setting up a convection cell (Fig. 1). But apart from this, it has all the characteristics of SSC. According to King and Anderson (1995, 1998), the associated upwelling(s) may be sufficient to sustain mantle melting without the need of a plume. This magmatism is predicted to occur at a distance from the step in lithospheric thickness (e.g., nearby a cratonic margin) of a few hundred kilometers.
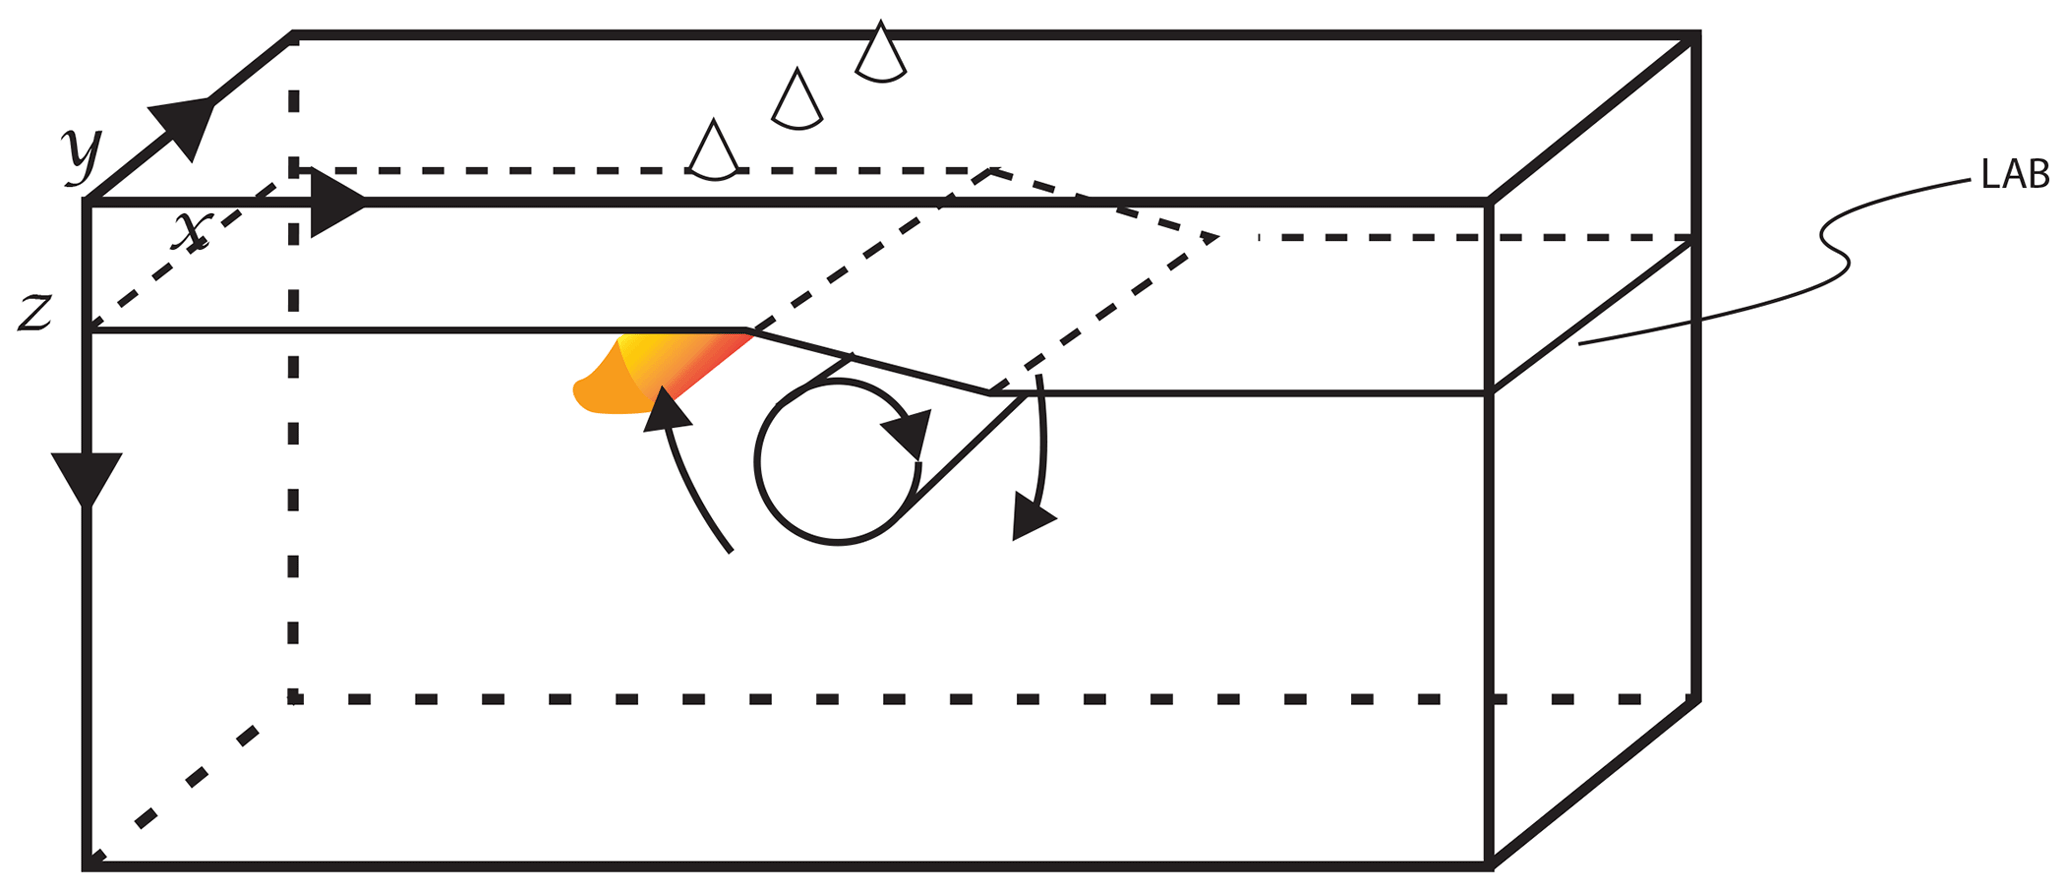
Figure 1Schematic of edge-driven convection. A downwelling is promoted on the thick continental side of the lithospheric edge, triggering a passive upwelling that sustains mantle decompression melting (orange) and related volcanism parallel to the continent–ocean transition (cones). The lithosphere–asthenosphere boundary (LAB) is labeled.
In the Atlantic Ocean basin, several volcanic chains occur near the margin of the continental platform (e.g., the Canary Islands, Cabo Verde or the Cameroon Volcanic Line). For many (or all) of these chains, several predictions of classic plume theory are not fulfilled. For example, the Canary Islands do not display a strictly linear age progression, with coeval volcanism occurring over hundreds of kilometers and sustained volcanism at a single island or seamount for >20 Ma (Abdel-Monem et al., 1971, 1972; Carracedo, 1999; Geldmacher et al., 2005). Given these complexities, several alternative hypotheses have been proposed. For instance, some authors have invoked the extraction of magmas along elongated shear zones of preexisting melt (Araña and Ortiz, 1991; Doblas et al., 2007; Martinez-Arevalo et al., 2013), possibly associated with a thermal anomaly (Anguita and Hernan, 2000). Alternatively, the “passive” upwelling of “mantle blobs” (Hoernle and Schmincke, 1993; Thirlwall et al., 2000) or EDC with or without a contribution from a nearby plume (King and Ritsema, 2000; Geldmacher et al., 2005) may sustain Canary volcanism. EDC has also been proposed as an underlying mechanism for other Atlantic hotspots such as Bermuda or Cabo Verde (Vogt, 1991; King and Ritsema, 2000).
Despite the long-lasting debate on the origin of near-continental intraplate volcanism, there is no published comprehensive geodynamic study of EDC and related magmatism in a continental–oceanic setting. Some authors (King and Ritsema, 2000; Sacek, 2017) have explored the dynamics of this mechanism and applied their results to the eastern Atlantic but have not explicitly and consistently modeled mantle melting. Others have studied EDC in great detail but for a purely continental setting (van Wijk et al., 2008, 2010; Till et al., 2010; Kaislaniemi and Van Hunen, 2014; Ballmer et al., 2015; Currie and van Wijk, 2016).
In this contribution, we study EDC-related flow and melting in the upper mantle using numerical models in order to understand the origin of intraplate volcanism in the eastern Atlantic. EDC can be approximated as a purely two-dimensional (2D) mode of convection, with convection roll(s) infinitely extending along the continental margin (King and Anderson, 1995; Kaislaniemi and Van Hunen, 2014). Therefore, we have chosen to investigate 2D models, which allows us to explore a wide parameter space, and to test the potential of EDC to systematically sustain intraplate volcanism. Finally, we compare model predictions with observations at the Canaries and Cabo Verde and evaluate the limitations of our results in the limit of our model assumptions.
We find that melt generation by EDC alone is too restrictive and transient to be a suitable explanation for the occurrence of large volcano chains such as the Canary Islands or Cabo Verde. Our models predict that EDC sensu stricto generates volcanism only for a small subset of the parameter space, and if it does so, only with small amounts of very enriched volcanism and only below young and thin oceanic lithosphere. EDC remains a suitable explanation for small seamounts in the area (e.g., Van Den Bogaard, 2013). A complementary paper (Manjón-Cabeza Córdoba and Ballmer, 2021, to be submitted) explores the dynamics of plume-EDC interaction, showing that a contribution from at least a weak plume is required to sustain island-building volcanism.
We run 2D numerical models using the mantle convection code CITCOM (Moresi and Solomatov, 1995; Moresi and Gurnis, 1996; Zhong et al., 2000) with the additions described in Ballmer (2009). We use the code to solve the equations of conservation of mass, momentum, and energy according to the “extended Boussinesq approximation” (Christensen and Yuen, 1985), which includes shear heating, latent heat of melt, adiabatic heating, and internal heating due to radioactive nuclides. The code solves these equations in a Cartesian frame of reference. Non-diffusive fields (e.g., composition or melt depletion) are advected by passive tracers. King and Ritsema (2000) demonstrate that EDC is confined to the upper mantle whenever the phase change at 660 km is present, so all our experiments are regional models with a vertical extent of 660 km. We do not include the phase change at 410 km depth, since it is not expected to effect EDC strongly (King and Ritsema, 2000). The Cartesian model box of dimensions 2640 km × 660 km is resolved by 384 × 96 elements without grid refinement. Resolution tests confirm that results converge well at this resolution.
Kinematic boundary conditions involve no slip at the top and bottom boundaries. In some models, a non-zero plate velocity (vplate) is imposed. When vplate is 0, both side boundaries are free slip. Otherwise, we impose a self-consistent (Couette-like) velocity profile in the inflow (left) boundary and open the opposite outflow boundary.
In terms of thermal boundary conditions, we impose temperatures of Tsurf=0 ∘C and Tref=1350 ∘C at the top and bottom, respectively. These temperatures are potential in nature and therefore do not take into account any possible adiabatic gradient. We then approximate the initial adiabatic gradient as a linear temperature increase with depth of 0.3 K km−1. This addition is necessary for the consistent calculations of viscosity and melting. According to this approximation, the bottom temperature corresponds to ∘C. Lateral boundaries are reflective (zero heat flow) except when inflow happens because of finite-plate motion, in which case the thermal boundary condition is fixed at the initial profile. The models also include internal (i.e., radioactive) heating with a reference value of W kg−1, but we also run models with higher values of H. In addition, we discuss models with increased radiogenic heating that occurs only in the continental crust.
The initial thermal profiles of the oceanic (left) and continental (right side of the box) lithosphere are calculated according to the half-space cooling model (e.g., Fig. 2a; Turcotte and Schubert, 2014) plus a small random thermal noise to simulate small-scale heterogeneity and advance the solution of the initial time steps. Both the thermal age of the continental lithosphere and the age of the oceanic lithosphere are free model parameters (τc, τo). The edge (i.e., the transition in lithospheric thickness) is imposed as a linear interpolation between the oceanic and continental lithospheric thermal profiles. We choose this setting because it allows us to freely vary the geometry of the transition between oceanic and continental lithosphere.
The geometry of the edge is an unconstrained parameter, the effects of which on EDC have not yet been studied systematically. The edge is defined by the initial lithospheric thickness on either side, and the width of the linear transition between the two (w). Hence, we systematically explore the parameters age of the oceanic lithosphere (τo) and age of the continental lithosphere (τc). To study how much the dynamics change due to a change in the aspect ratio of the transition between ocean and continent, we also changed the width of the wedge between the two lithospheres (w).
The modeled mantle consists of a fine-scale mixture of peridotite (97 %) and recycled basaltic eclogite (3 %, from now on, pyroxenite; Hirschmann and Stolper, 1996). Peridotite itself consists of a depleted peridotitic component (DC) and an enriched peridotitic component (EC). Mantle depletion of both lithologies increase with increasing degrees of melting, which affects mantle density ρ:
where ρref is the mantle density at Tref, α the thermal expansivity, T the temperature, F the melt depletion extent, ϕ the mantle porosity, and ΔρF and Δρϕ the density differences related to melt depletion and melt retention (Schutt and Lesher, 2006; Ballmer et al., 2009). The depleted lithosphere is, therefore, more buoyant than the underlying mantle. To calculate the initial depletion profile of the oceanic lithosphere for our EDC models, we run 2D simulations of flow and melting of a simplified mid-ocean ridge using the same parameters as in the corresponding EDC models. An example of one of these ridge models, with an extended explanation, can be found in Appendix A.
As for the initial depletion profile at the base of the continental lithosphere, we have chosen to impose the same ridge depletion as in the oceanic side on the continental part, adding a depleted lid (with F=1) on the top (Fig. 2b). This depleted lid mimics the excess buoyancy of continental crust, although it may overestimate the actual density values of the upper crust. The initial thickness of this lid is arbitrarily defined as 40 km for the reference case, but it is adjusted for models with different continental thicknesses to follow the same change in depth as the 0.9 Tref isotherm on the continental side (according to the half-space cooling model). The edge itself consists of a wedge of crustal depletion (F=1) of width w that thins toward the oceanic lithosphere (Fig. 2). Indeed, it has been suggested that the subcontinental lithospheric mantle is harzburgitic in nature (Bodinier and Godard, 2013), but the specific profile remains unconstrained.
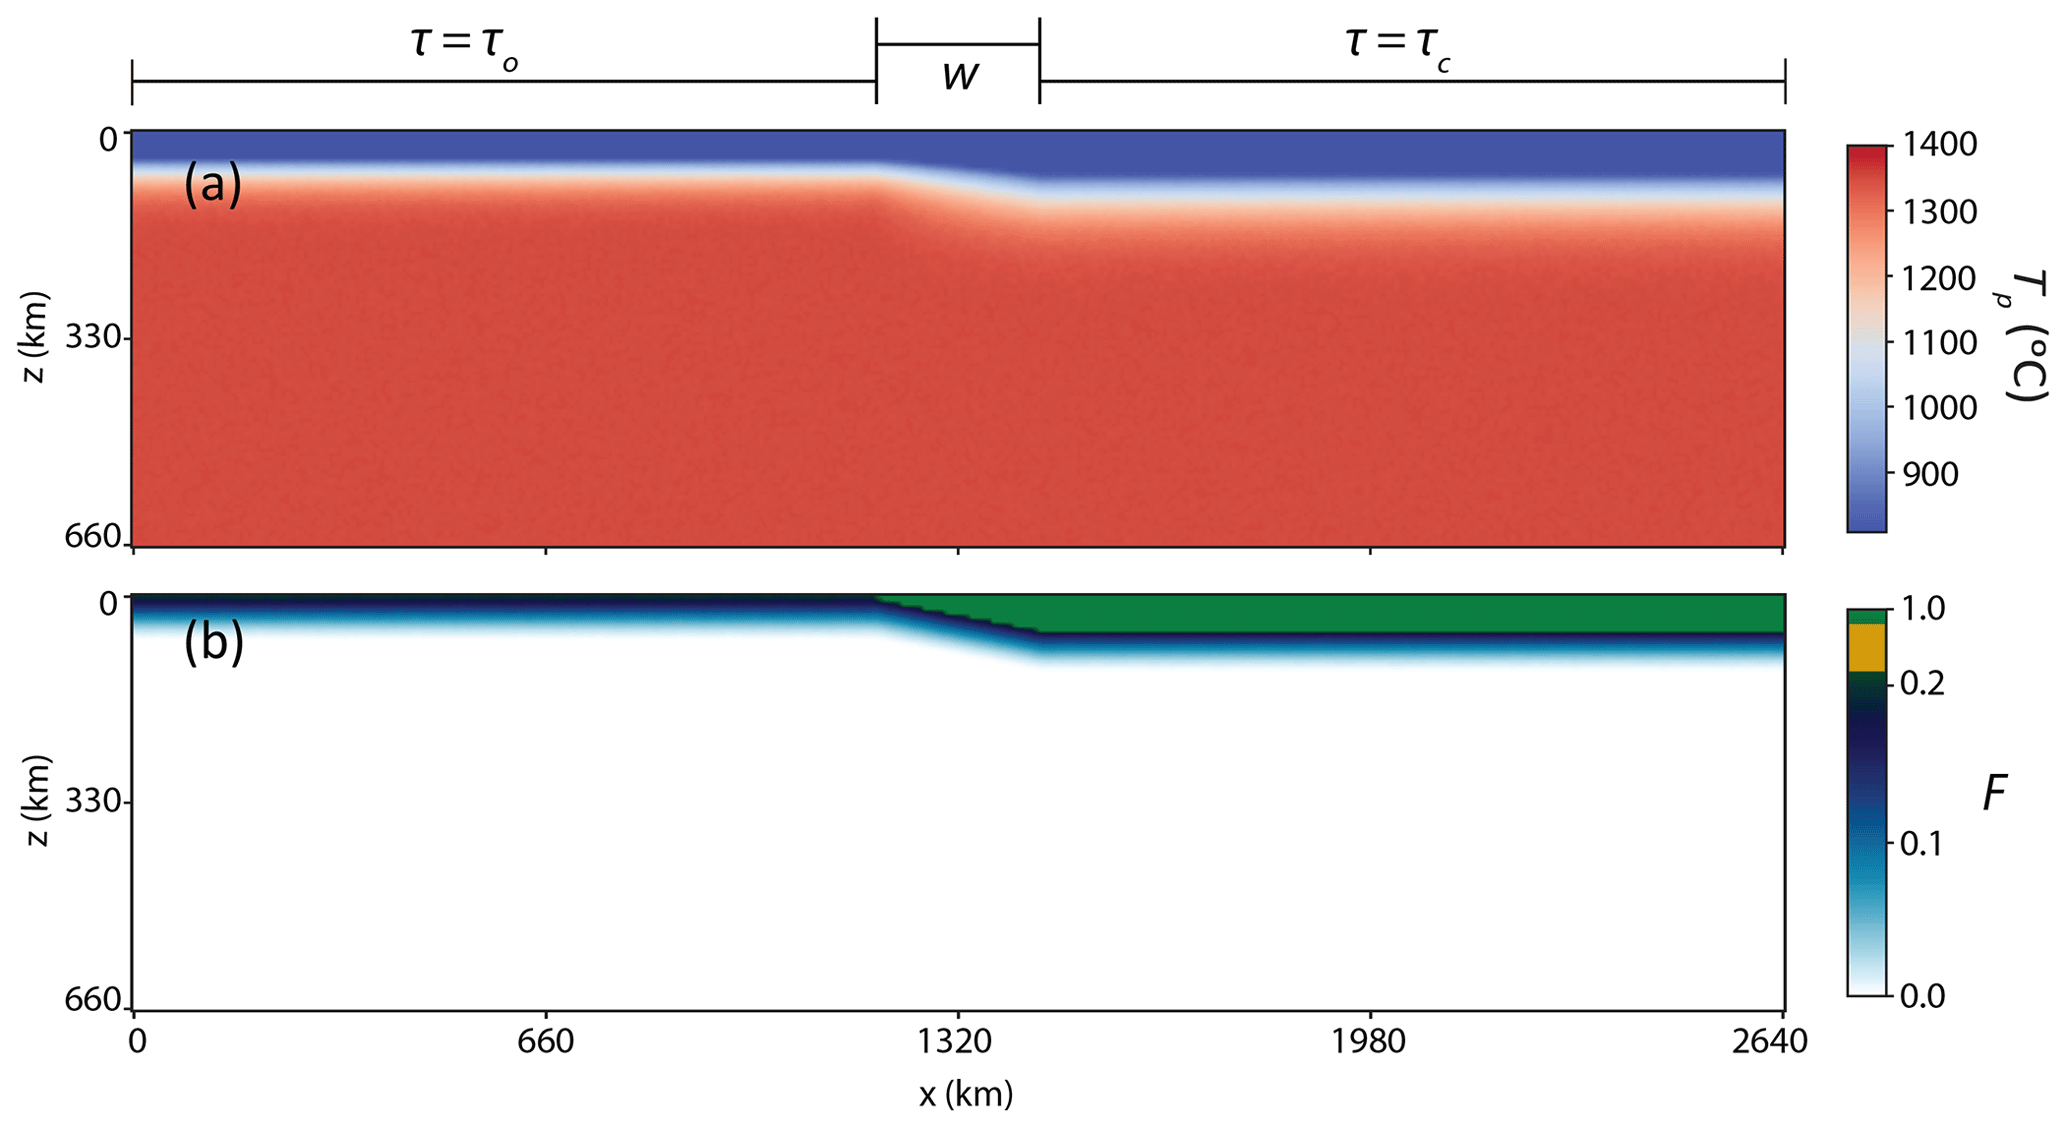
Figure 2Initial conditions for the reference model. (a) Initial field of potential temperature Tp (i.e., with the adiabatic gradient removed). (b) Initial compositional field of depletion (F) for the hydrous peridotite component. The areas where τ=τo and τ=τc, as well as w, are labeled for clarity. A comparison of the fields for different lithologies can be found in Appendix A (Fig. A2).
We consider melting explicitly in our models following Ballmer et al. (2009), assuming (see above) that the lithological assemblage consists of 82 % depleted peridotite (DC), 15 % enriched peridotite (EC, for the aforementioned sum of 97 %), and 3 % pyroxenite. Peridotite melting is calculated using the parameterization of Katz et al. (2003). We assume an H2O content of 100 ppm for the background depleted peridotitic component, and 300 ppm for the enriched peridotitic component (H2O is a placeholder for any kind of enrichment). The pyroxenite (PX) melting law is taken from Pertermann and Hirschmann (2003). Melt flow and extraction occurs on timescales much shorter than convective flow. We therefore assume instantaneous extraction (outside the model box) of any melt fractions that exceed the critical porosity (ϕc).
We use a simplified rheology with a dependence of viscosity on temperature T and pressure P:
where η is the viscosity, Ea and Va the activation energy and volume, respectively, T and P are the temperature and pressure, R the ideal gas constant, and Tref is the reference (potential) temperature. In this formulation, η0 is the reference viscosity defined at T=Tref and zero pressure, and hence it does not represent the viscosity of the asthenosphere. Our reference activation energy is 200 kJ mol−1, i.e., lower than the lower limit constrained by deformation experiments (Karato and Wu, 1993; Hirth and Kohlstedt, 1996). We use such reduced values for Ea to account for the effects of stress-dependent viscosity (e.g., due to dislocation creep) in a simplified Newtonian rheology description (Christensen, 1984; van Hunen et al., 2005). While such a simplified approach cannot model the local effects and potential feedbacks of stress-dependent rheology, it correctly replicates the major features of convection, including the thickness of the thermal boundary layer, which is critical for the vigor of EDC and related melting. We do not systematically explore the effects of compositional (e.g., pyroxenite vs. peridotite, water-dependent) rheology in this work. Nonetheless, we run some test cases with a simplified depletion stiffening rheology (Appendix B). These tests confirm that EDC sensu stricto remains a transient phenomenon even with a stabilized lithosphere, and our results (and the subsequent conclusions) are robust, even though the edge remains more stable with than without depletion stiffening rheology.
Our choice of rheology parameterization causes the depth dependency of viscosity to be due to both, Ea and Va (Eq. 2). This dependency is problematic because, due to the simplified parameterization and our decreased Ea, the effect of the physical parameters on the viscosity along the adiabat is unrealistic. Instead, we chose to keep the viscosity along the adiabat the same between cases and chose to focus on the effect of Ea on the stability of the lithosphere–asthenosphere boundary, which is crucial for any kind of SSC (including EDC). To make sure that the slope of the viscosity profile along the adiabat remains the same in all cases, we slightly adjust Va as parameter Ea is varied. Any variations in Va (see Table 1) are only due to this adjustment. For an example of a viscosity profile with depth, see Appendix B (Fig. B1).
Table 1Relevant reference parameters for the models described in this chapter. Values in parentheses represent the explored parameter space, with the exception of Va (see Sect. 2 for explanation).

3.1 Reference case
To characterize flow and melting of EDC, we first describe a reference case. Figure 3 shows a typical example of EDC as a series of snapshots for the reference case. The convective pattern initially resembles (Fig. 3a) the pattern of the idealized case in Fig. 1, as well as the cases reported by King and Anderson (1998): there is one major convection cell with a dominant downwelling on the continental side of the edge and upwelling return flow on the oceanic side. The downwelling is mainly sustained by lateral inflow of sublithospheric material from the oceanic side due to the asymmetry in viscosity structure, but some material from the continental side is also entrained. As a response to this entrainment, a secondary return-flow upwelling is soon generated on the continental side (Fig. 3b). The flow patterns promptly change to more complex configurations, with several upwellings and downwellings adjacent to the initial convection cell. Soon thereafter (at 35–40 Ma), the oceanic lithosphere as a whole becomes thermally unstable triggering widespread small-scale convection (SSC; Fig. 3d). At this point, EDC becomes almost undistinguishable from SSC (in our 2D models).
From this point, we do not characterize EDC further, as it is not possible to distinguish which properties are due to EDC and which ones are due to SSC. We therefore define this onset of SSC as the maximum of the first time derivative of the second peak of the vz,rms (the first peak corresponds to EDC).
Ultimately, SSC also develops beneath the continental lithosphere (∼45 Ma, not shown).
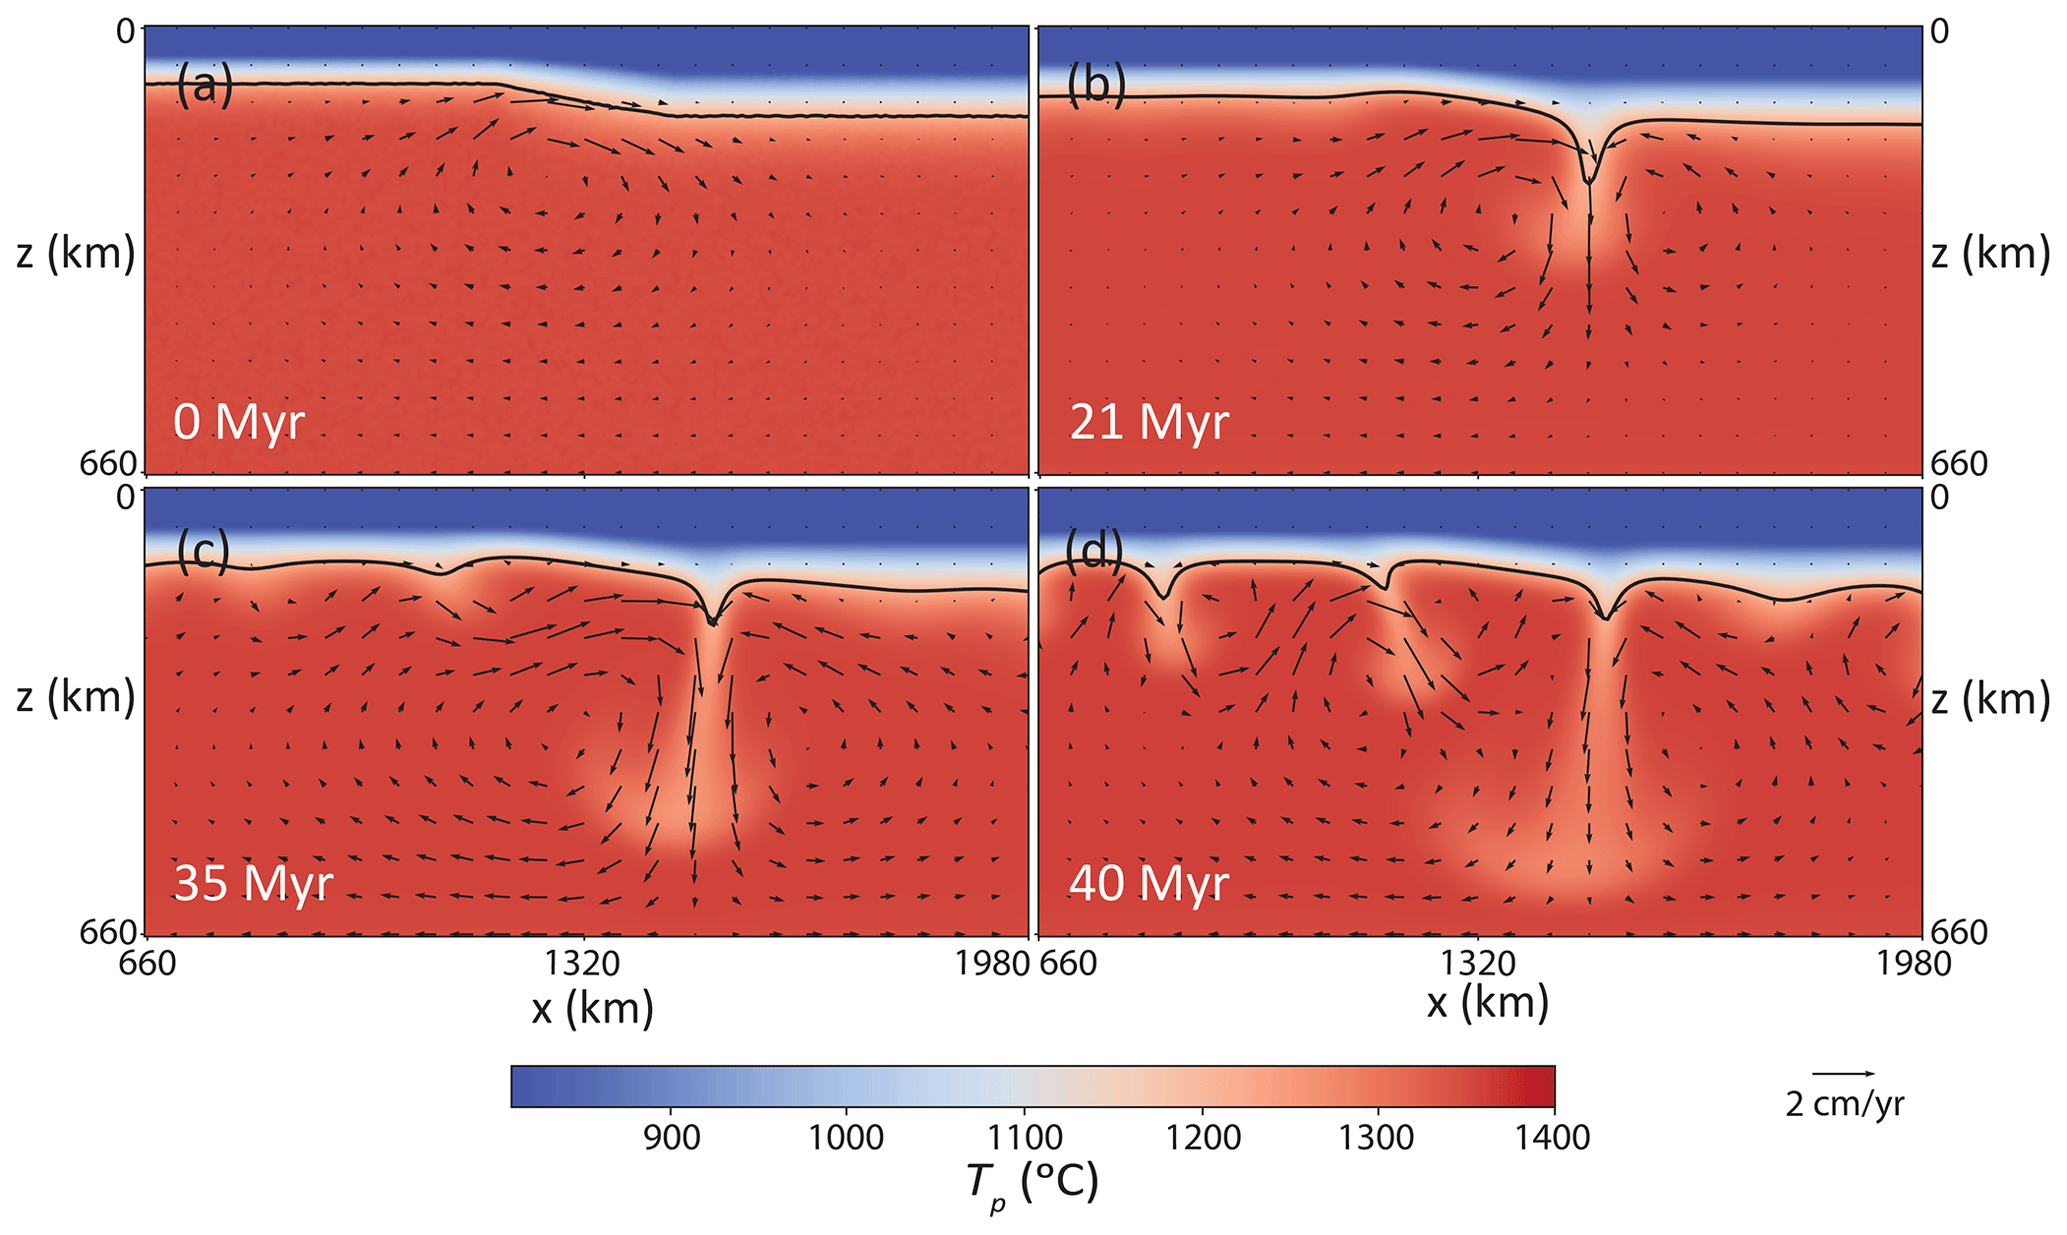
Figure 3Series of snapshots of potential temperature for the reference case (for parameters, see Table 1). In black, the 1215 ∘C isotherm (0.9 Tref) is shown as a proxy for the base of the lithosphere. Arrows reflect the instantaneous velocity field. No melting is predicted by this model at any time step.
An important consequence of EDC (and subsequent SSC) is the erosion of the base of the lithosphere (represented by the black contour in Fig. 3). At 21 Ma (Fig. 3b), a clear “bump” (or small cavity; Conrad et al., 2010) appears at the base of the lithosphere due to the upwelling pushing the material, as well as material entrainment by the major downwelling, hence promoting local extension of the lithosphere. Not only is this thermal erosion partly responsible for triggering secondary downwellings and transmitting SSC toward the oceanic side (Fig. 3c, d) (e.g., Dumoulin et al., 2005), but it is also a requirement for melting. Displacement of at least the base of the depleted lid is necessary for melting because the temperatures are below the melting point of the lithosphere at time step zero. Nonetheless, in this reference model, erosion of the depleted lid remains insufficient to allow mantle melting to occur throughout model evolution.
3.2 Effects of physical properties of the mantle
To understand the optimal conditions for melting generated by edge-driven convection, we systematically explore several physical properties of the models. We focus on the effects of reference viscosity (η0), activation energy (Ea), and initial potential temperature (Tref).
Increasing the reference viscosity (according to Eq. 2) tends to delay the onset of convective instability and hamper melting (Figs. 4a, b; 5a). Thereby, the duration of EDC (which starts immediately at t=0, albeit with a smaller vigor compared to the reference case) vs. SSC is enhanced (we would like to point out at this point that the ages in Fig. 5 are counted starting from time step = 0 and therefore must be added to the age of 40 Ma of the initial oceanic lithosphere age). Figure 4b shows a snapshot of a case with Pa s, which displays a similar pattern of convection as the reference case with Pa s (Fig. 3c) but at a much later model time of 82 Ma. Accordingly, the onset of SSC is much later than estimated for a typical ocean basin on Earth (Stein and Stein, 1994; Doin and Fleitout, 1996), and the lithospheric thickness on the oceanic side of the model is far too thick to potentially allow the asthenosphere to melt. In turn, cases with Pa s (Figs. 4a, 5a) display melting during a limited period of time (i.e., over a few million years) but based on the (late) timing and (widespread) distribution of melting, most of this melting is associated with SSC rather than with EDC.
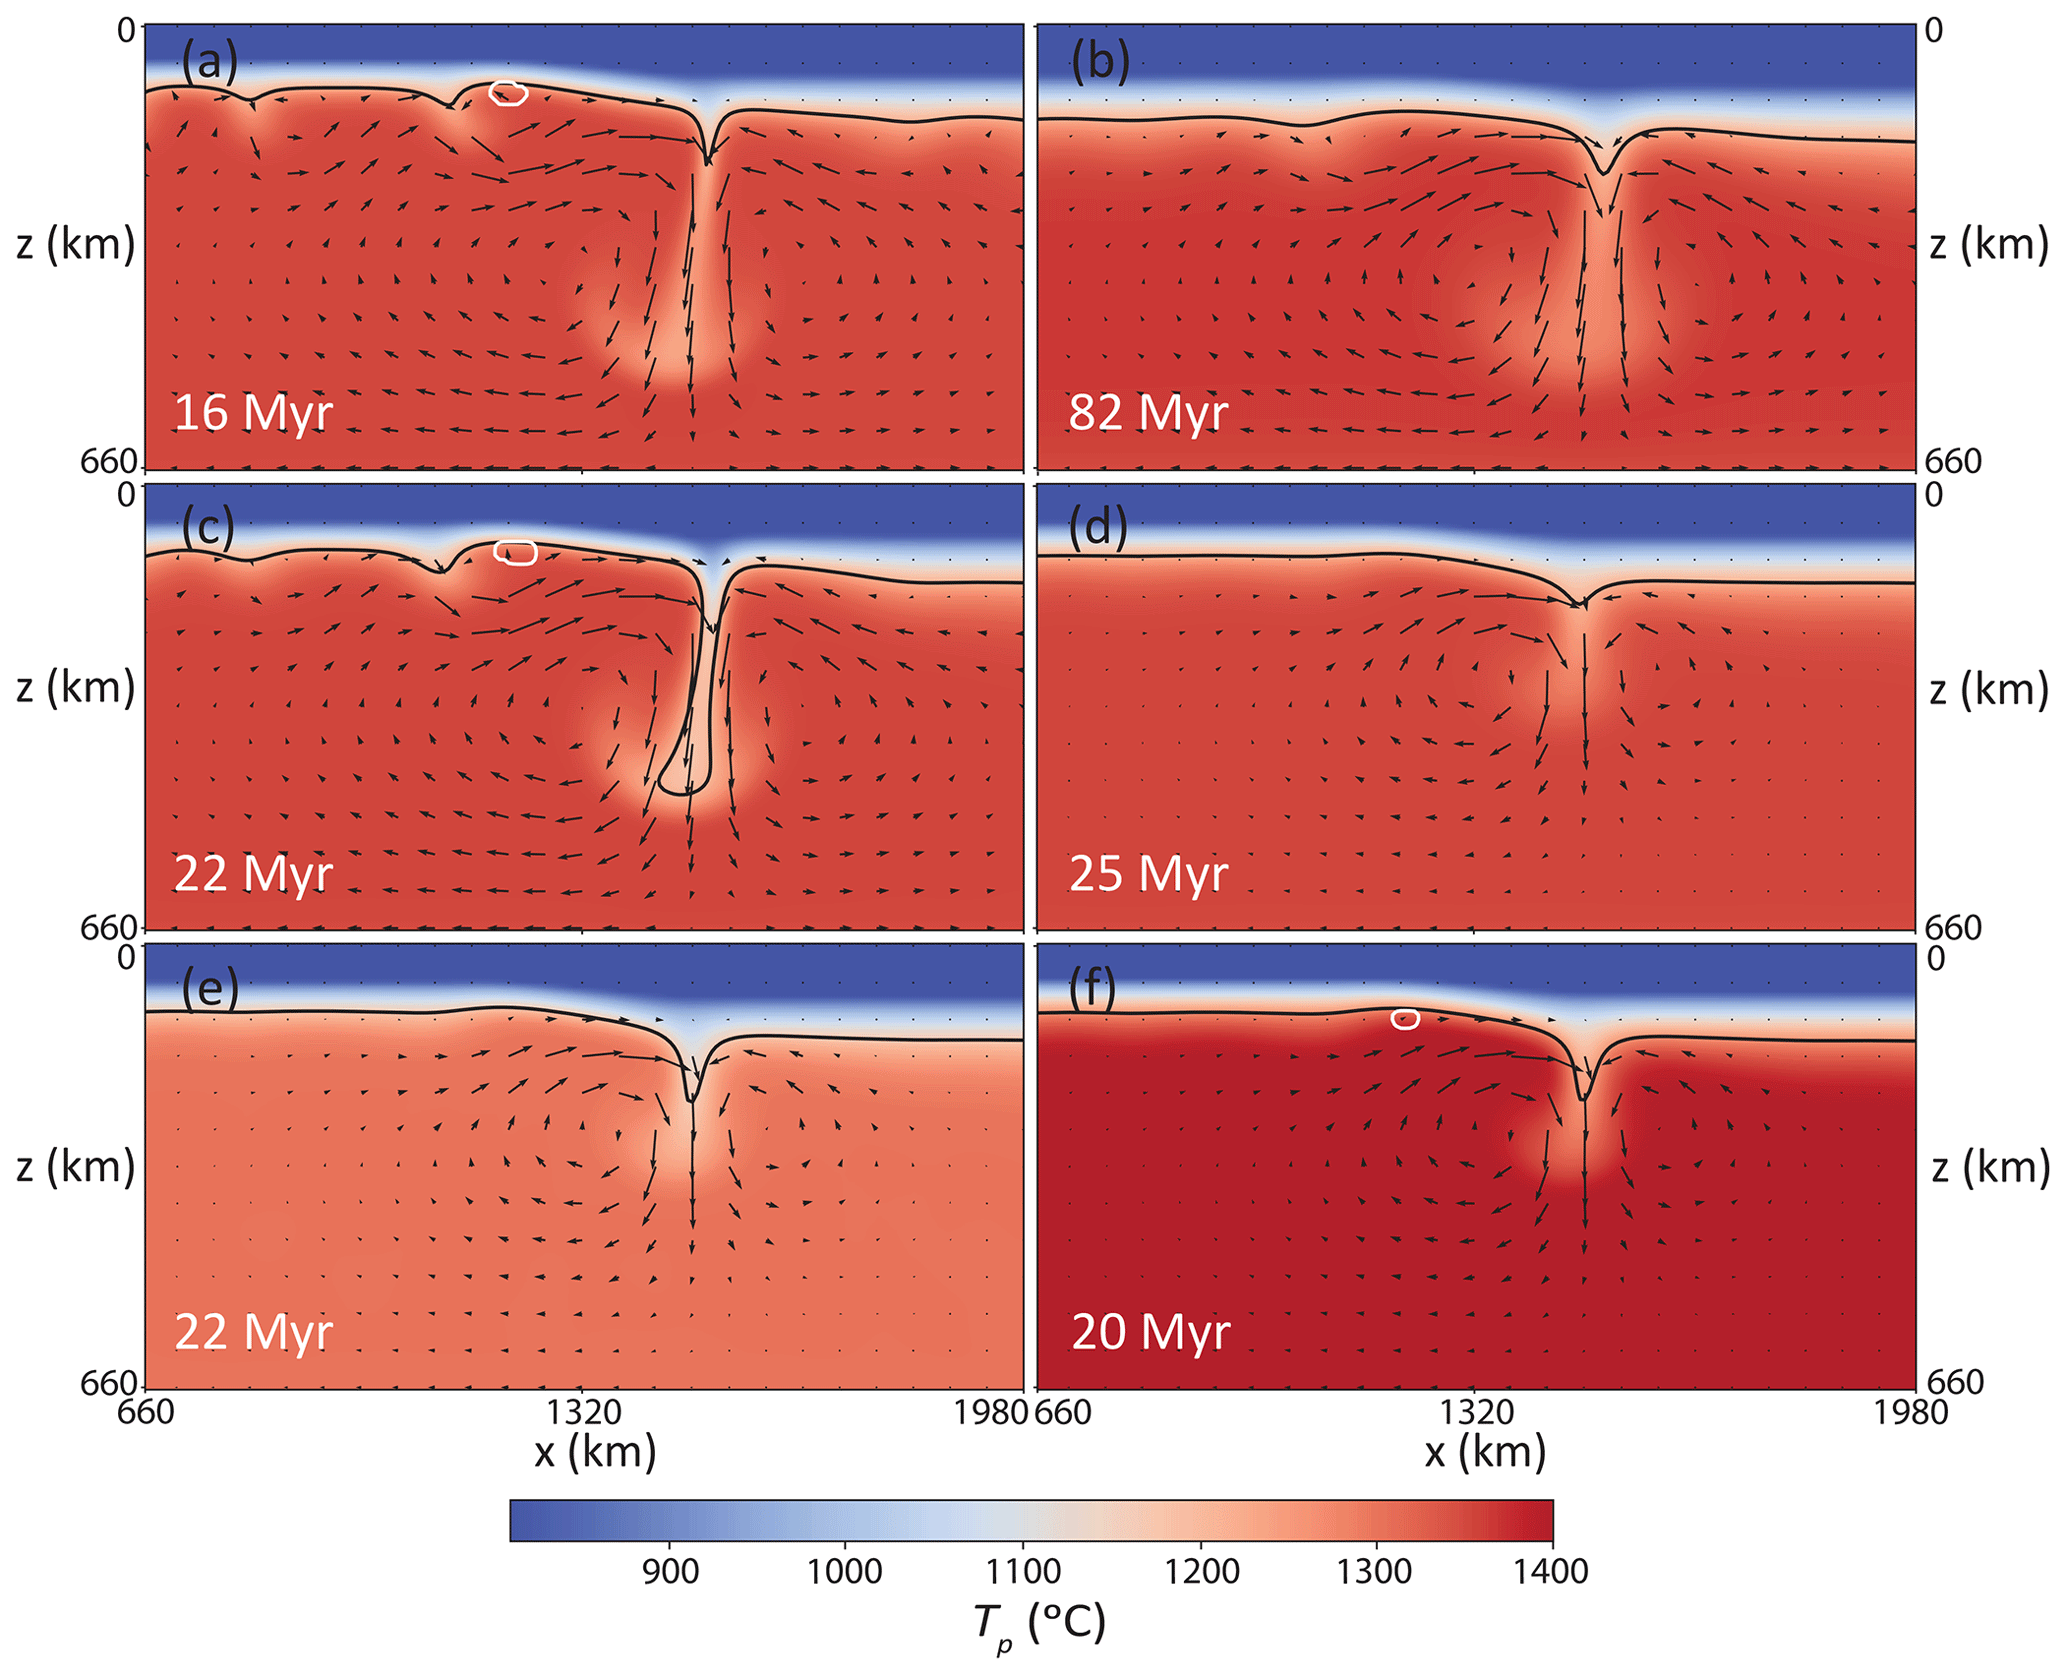
Figure 4Effects of rheological parameters and reference temperature on edge-driven convection, shown by snapshots of potential temperature of various cases. (a) . (b) . (c) Ea=120 kJ mol−1. (d) Ea=300 kJ mol−1. (e) Tref=1300 ∘C. (f) Tref=1400 ∘C. White contours outline areas with active melting. Black contour refers to the isotherm of T=1215 ∘C = 0.9 Tref. Note that snapshots are chosen such that they show a similar stage of model evolution as in Fig. 3b (i.e., mature EDC major downwelling), while model times differ due to the effects of rheological parameters on onset and vigor of EDC or SSC. Also note that the reference case (Fig. 3b, c) corresponds to an intermediate case for the trends shown in any of the rows: ; Ea=200 kJ mol−1; Tref=1350 ∘C.

Figure 5Diagrams showing the sensitivities of vz,rms (root mean square of vertical velocities) and of the onset age of small-scale convection (starting from an oceanic crust of age 40 Ma, which needs to be added to the values in the figure) to selected parameters. (a) Reference viscosity (η0). (b) Activation energy (Ea). (c) Age (or thickness) of the continental lithosphere (τc). (d) Width in the horizontal direction of the edge (w). Note that the vertical axes of (c) and (d) are exaggerated with respect to those of (a) and (b).
Decreasing activation energy (Figs. 4c, 5b) tends to advance and increase the vigor of EDC and SSC. For low Ea, the viscosity of the base of the lithosphere is decreased, and hence the lithosphere becomes more mobile. For Ea≤140 kJ mol−1, the related erosion of the base of the lithosphere is sufficient to permit early and localized EDC-related melting. However, in these cases, more vigorous melting ultimately occurs across the entire oceanic domain due to SSC. Also, the onset of SSC and related seafloor flattening is < 70 Ma, i.e., earlier than is realistic for the Atlantic (Stein and Stein, 1994), although we can compensate for this by choosing a different reference viscosity. In turn, cases with high Ea≥250 kJ mol−1 display a late onset of SSC and a stable lithosphere with ultimate thicknesses greater than are realistic (Figs. 4d, 5b).
Regarding convection patterns, the entrainment of sublithospheric material by the dominant downwelling near the edge tends to be more symmetric for low Ea. This prediction implies that the activation energy will have an important effect on the final geometry of the oceanic–continental transition. Finally, cooling of the mantle is more efficient for low Ea than for high Ea, since the base of the lithosphere is more mobile. This effect also occurs for decreasing η0 but is more pronounced for decreasing Ea (see isotherms in Fig. 4a vs. Fig. 4c).
Increasing Tref tends to advance convective instability and boost magmatism. An increment of potential temperature from 1350 to 1400 ∘C (Fig. 4e) induces minor melting in the area of maximum erosion of the lithosphere during a limited period of time. This effect is smaller than expected because it is largely compensated for by an increase in the thickness of the pre-calculated depleted lithosphere (see Sect. 2) and because the lithosphere still cools via conduction. Increasing the temperature even more may further increase melting but would also lead to unrealistic crustal thicknesses in the corresponding pre-calculated models. Also note that the peridotite melting parameterization used in this study (Katz et al., 2003) is on the lower end in terms of solidus temperatures (e.g., McKenzie and Bickle, 1989; Iwamori et al., 1995; Hirschmann, 2000; Lambart et al., 2016).
Figure 6 presents a summary of the joint effect of η0 and Ea on EDC-related mantle melting. We also label the viscosity at 206 km depth as a representative of the viscosity of the asthenosphere. The melting rate characteristic for EDC (Fig. 6a) is determined at the first local maximum of root mean square vertical velocity vz,rms, which corresponds to the development of the first major downwelling from near the edge. Determining the exact volume of EDC-related melting remains difficult because melting occurs before and/or after this maximum and commonly transitions into persistent SSC-related melting. For example, the model with Ea=140 kJ mol−1 (and with reference values of η0) displays some EDC-related melting just before the onset of SSC, but this melting episode is extremely short-lived and would likely be insufficient to sustain any significant volcanism. Nonetheless, there is a systematic trend between melt volume fluxes that are measured as described above with both parameters. This result suggests that the stability and final thickness of the lithosphere ultimately control melting due to EDC and, probably, due to SSC. This final thickness (i.e., beneath old ocean basins) is constrained by seismic observations and seafloor topography (Stein and Stein, 1994; Doin and Fleitout, 1996; van Hunen et al., 2005).
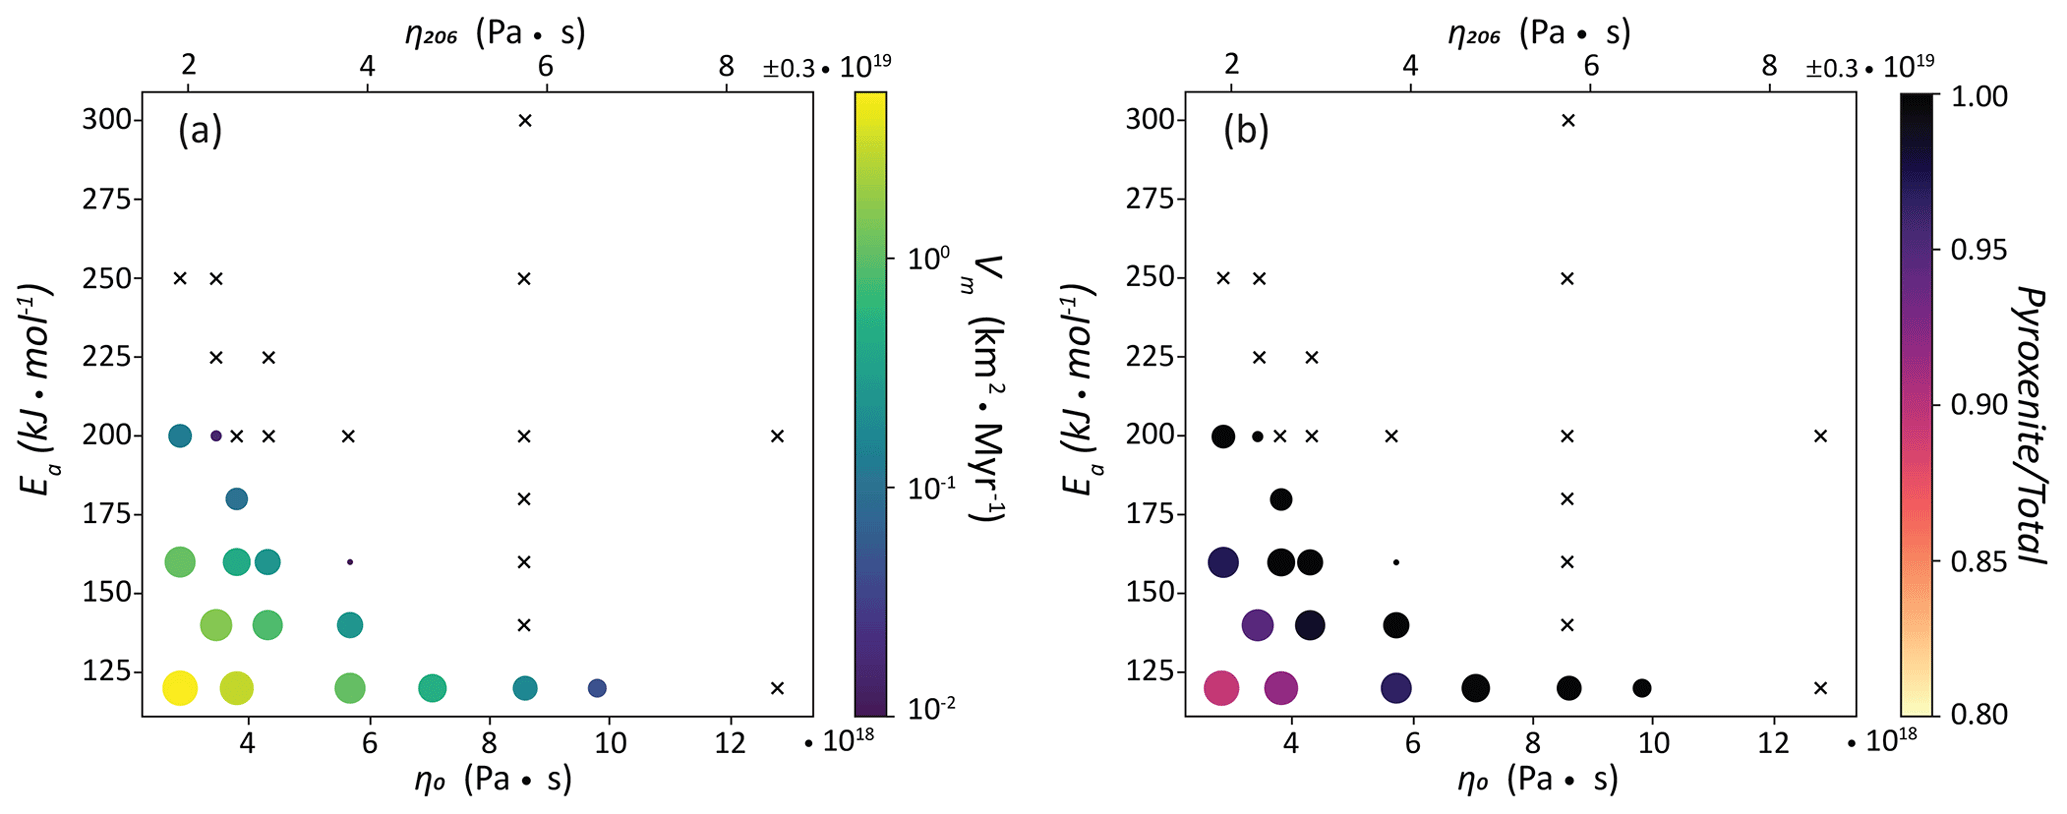
Figure 6Scatterplots showing the melt property variation with respect to the reference viscosity (η0) and activation energy (Ea). The upper axis η206 refers to the viscosity in the asthenosphere measured at z=206 km depth on the oceanic side for all cases with Ea=200 kJ mol−1. For all other cases, this value slightly varies according to (very small) temperature changes related to the half-space cooling model (see Eq. 2) but by less than 5 %. (a) Melt volume flux due to EDC (colored circles), measured at the point of maximum EDC-related vertical velocities (i.e., vz,rms). Crosses mark cases in which no melting is detected. The size of the circles also scale with melt volume fluxes. Melt volume fluxes are reported in km2 Myr−1 due to the 2D character of the model (i.e., corresponding to km3 Myr−1 per km of plate in the out-of-plane direction). (b) Scatterplot showing the origin of the melting products (i.e., proportion of melt derived from pyroxenite vs. total melt; colored circles). Notation of crosses and size of circles as in (a). Note that the color scale is set between 0.8 and 1.
Figure 6b shows the compositional origin of the melts from Fig. 6a. In many of the models, only the pyroxenite component melts, if melting occurs at all. This prediction implies the formation of magmas that are extremely enriched. The enrichment tends to slightly decrease with increasing melt flux. The least enriched case is consistent with the highest volume in Fig. 6a and corresponds to a model with Ea=120 kJ mol−1 and Pa s. Even in this extreme case, the melts are mostly pyroxenite-derived. Although the absolute numbers in Fig. 6b depend on the choices of our melting parameterizations and lithological assemblage (see Sect. 2), the general trends will be similar as shown in Fig. 6b unless the pyroxenite component melts at a higher temperature than peridotite (Yaxley and Green, 1998; Shorttle et al., 2014; Lambart et al., 2016).
3.3 Effects of lithospheric-edge geometry
Modification of τo within the small range explored here controls the convection patterns of EDC. We explore τo only in a small range ( Ma) because any smaller τo yields melting at time t = 0 and any larger τo yields a metastable base of the lithosphere (i.e., due to τo close to or larger than the onset age of SSC for η0 in the reference case). With τo=30 Ma, melting appears during the early stages of EDC but quickly ceases (at t<10 Ma), consistent with the results of the reference case (τo=40 Ma). Reducing or increasing τo changes the convection patterns of EDC: decreasing the age (and hence initial thickness) of the oceanic lithosphere tends to promote more asymmetric downwellings. For η0 as in the reference case, significant EDC-related melting requires τo≤30 Ma. Widespread SSC (and related melting) is largely independent of τo.
Changing the continental thicknesses also modifies the patterns of convection. Figure 7a, b show that thicker continental lithospheres tend to increase the vigor of EDC, therefore augmenting the volume of related melting. However, this increase only occurs up to some point: for τc>150 Ma (Figs. 5c and 7b) the pattern of convection changes such that the maximum vertical velocity occurs at significantly greater depths than in the reference case (Fig. 3). As a result, the characteristic velocities of EDC slow down because the viscosity increases with depth (see Eq. 2). The onset of SSC also decreases for τc>150 Ma. Similar to the effects of decreasing τo, increasing τc enhances the asymmetry of the EDC cell. This asymmetry, in turn, implies that less material from the base of the continental lithosphere and more material from the base of the oceanic lithosphere is entrained by the EDC downwelling for higher τc.
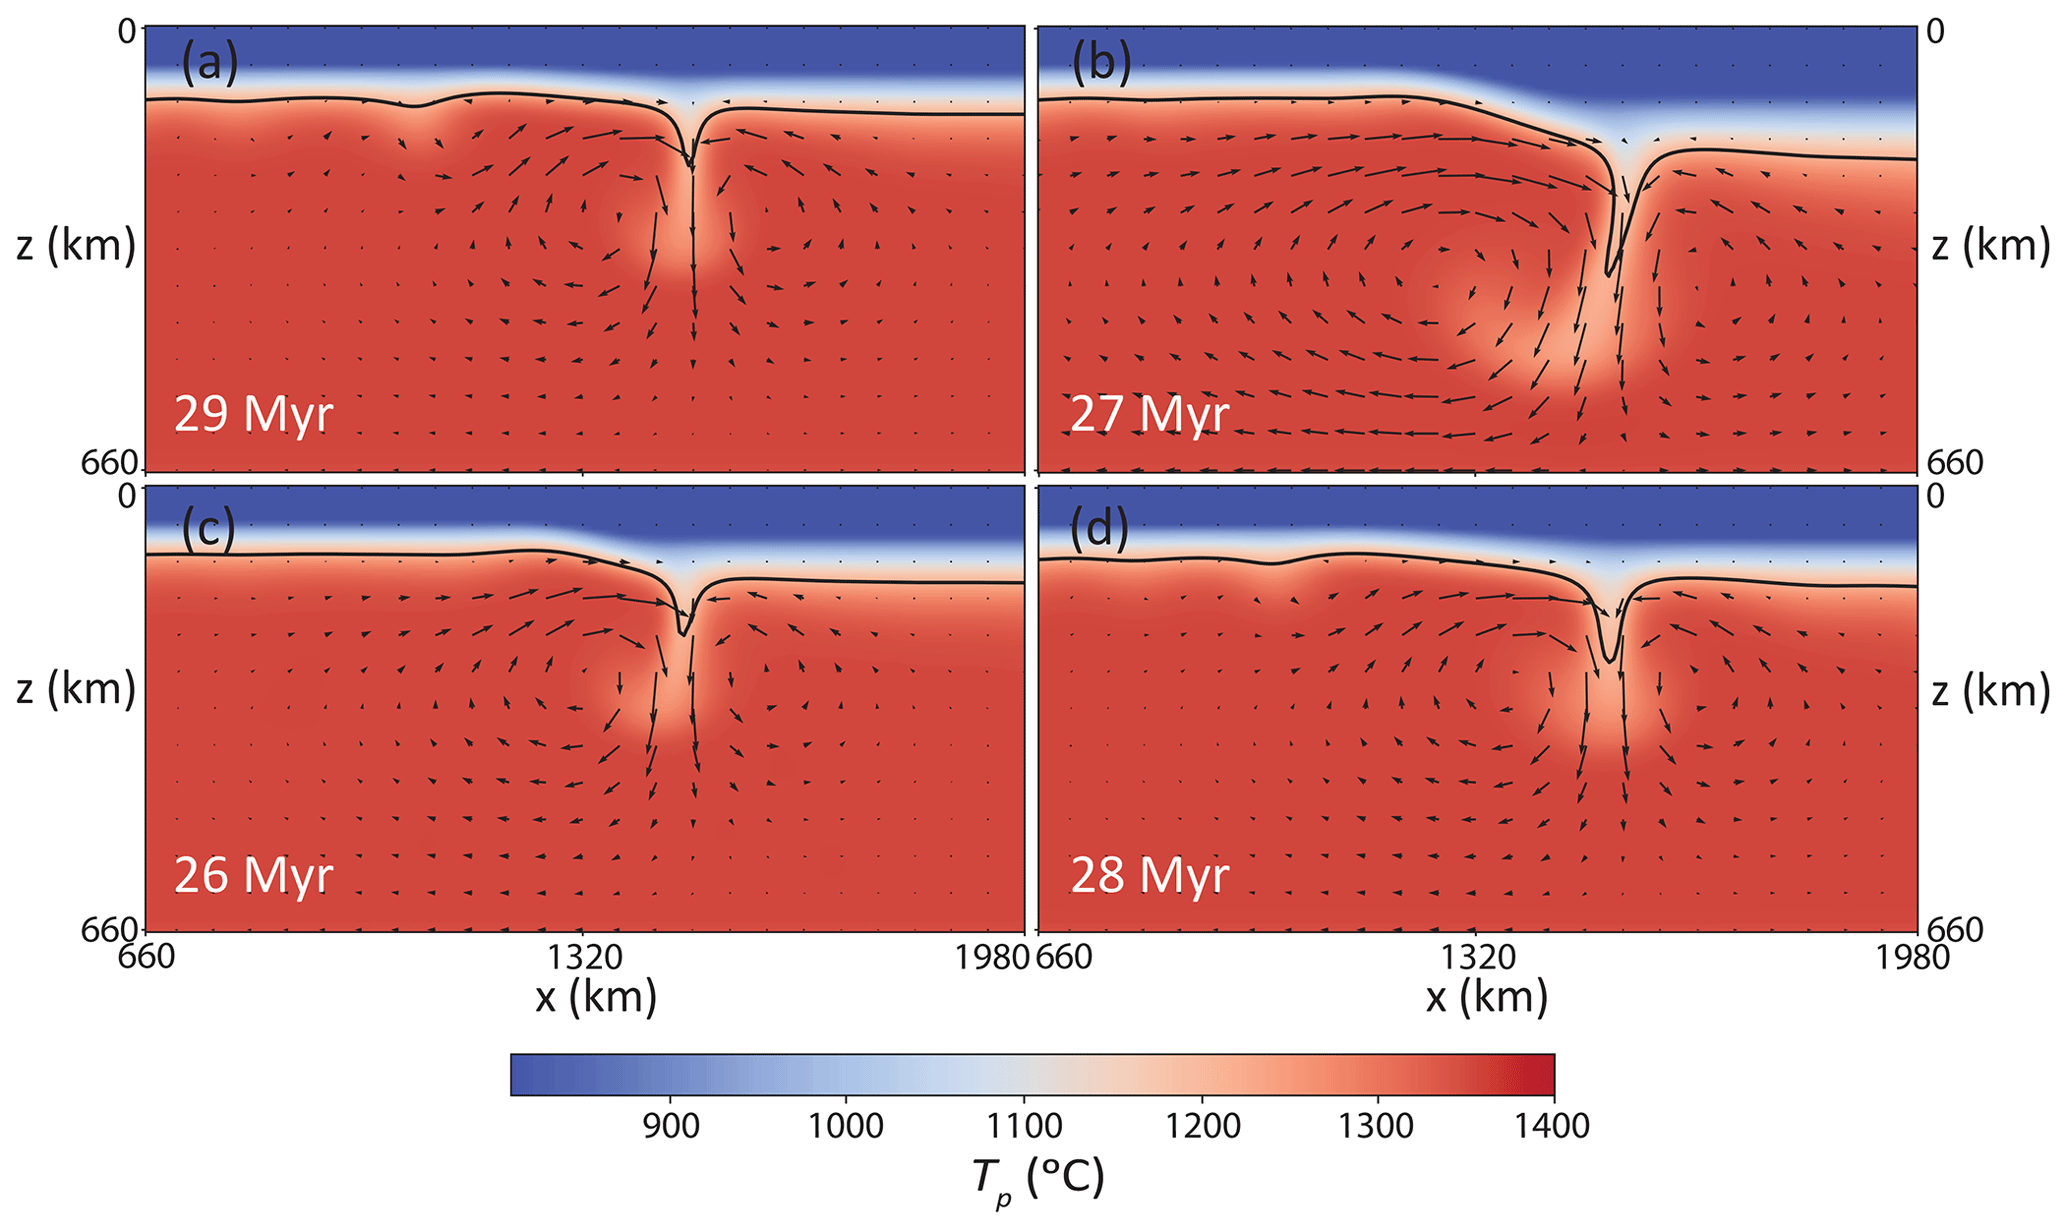
Figure 7Effects of edge geometry on edge-driven convection, shown by snapshots of potential temperature. (a) τc=70 Ma. (b) τc=150 Ma. (c) w=132 km. (d) w=396 km. All other parameters as in the reference case. Note that no melting occurs in any of the models. For clarity, note that the values of the reference case are τc=100 Ma and w=64 km.
Increasing w increases the vz,rms of EDC, probably due to more material from the lithosphere (thermal boundary layer) entrained in the downwelling(s) (Fig. 7d). Contrary to the previous cases, changing w does not noticeably affect the onset of SSC, which remains largely constant (Fig. 5d). These differences between changing τo and τc and changing w suggest that the geometrical effects cannot be simplified to an aspect-ratio-dependent parameter and that all geometrical parameters have a distinct effect.
Finally, we devise a model for the Canary Islands with τo=40 Ma, w=528 km, and a continental thermal age τc=350 Ma (corresponding to a depth of 275 km for the 1215 ∘C isotherm), consistent with the lithospheric thickness maps presented by Jessell et al. (2016, and references therein). The Canary Islands are located on an oceanic crust much older than 40 Ma; however, it is not possible within the limitations of our models to initiate a case with an oceanic crust of 100 to 150 Ma. Thus we decide to keep τo as in the reference case. Results from this model conform with the combined predictions of our cases with a very wide edge and with a very thick continental lithosphere ( m Myr−1, and onset of SSC = 48 Ma), suggesting that extrapolations from the trends in Fig. 5c, d are viable for settings outside the range of parameters systematically explored here. Also note that no melting was detected in this case.
3.4 Effects of internal heating
We also explore the effects of internal heating on model results. In principle, radioactive heating in the mantle should be much lower than that in the crust, but chemical heterogeneity may locally increase internal heating. We explore cases with increased internal heating everywhere and others with increased internal heating just in the continental “crust” (i.e., yellow area in Fig. 2 with F=1; as defined in Sect. 2). We find that tripling the radiogenic heat production compared to the reference case everywhere has little influence on the vigor and geometry of EDC. However, it has an important influence on mantle melting and also advances the onset of SSC which, then, becomes more vigorous than in the reference case (i.e., with increased vz,rms).
Increasing internal heating can induce melting and boost the degrees and rates of melting, by limiting asthenospheric cooling. For example, as the mantle internal heating rate is unrealistically tripled in a model with activation energy Ea=160 kJ mol−1, there is an increase in volcanism equivalent to reducing the Ea from 160 to 140 kJ mol−1 or to reducing η0 from 8.61×10¹⁸ to 5.68×10¹⁸ Pa s.
In nature, heat-producing elements tend to be concentrated in the continental crust due to their incompatible nature with respect to the mantle. We run an additional set of models with increased internal heating only in the continental crust Hc. Increasing the internal heating to does not have any apparent effects on melting nor it does affect the convection patters or vz,rms. For , the average vz,rms is increased but no substantial changes in terms of convection patterns are detected. Only for , significant changes occur compared to the reference case, with progressive lithospheric thinning on the continental side due to the effects of radioactive heating on the viscosity. At , melting occurs in the lower crust (followed by melting in the eroded continental lithosphere). In any case, W kg are unrealistic as an average value for the whole crustal thickness (Turcotte and Schubert, 2014).
3.5 Effects of volatile contents
Fluids released from the transition zone or other volatility-rich heterogeneities entrained by upper-mantle convection may also play an important role for intraplate volcanism because they can greatly decrease melting temperatures. Unfortunately, dealing with amounts of water in a rock greater than the ones presented above remains a challenge for modeling (Green, 2015). We increase the water content in the enriched peridotitic component (EC) to 1000 ppm (0.1 %) in some models. In others, we also increase the abundance of EC (from 15 % to 25 %). However, we emphasize that we are limited by the melting parameterization applied here (Katz et al., 2003) and hence are unable to explicitly model compositions that bear hydrous phases or other volatiles such as CO2. In other words, H2O concentrations in these additional models are a qualitative proxy for bulk volatiles in terms of their effects on melting behavior.
We find that for sufficiently large contents of H2O in EC, EC melting starts to occur for the reference setting. The solidus of hydrous peridotite for 1000 ppm H2O is below that of pyroxenite. In previous cases, pyroxenite was the main source (or even the sole one) of mantle melting. In this case the composition of magmas or melts is different than in previous cases and mostly peridotite-derived. In cases with high water contents in EC, melting is usually widespread, occurring due to EDC and SSC. Nonetheless, the amount of melting is very limited because of the low productivity of melting at low F in hydrous peridotite (Hirschmann et al., 1999; Katz et al., 2003; Asimow et al., 2004); note that this productivity is much lower than that of the pyroxenite used here (Pertermann and Hirschmann, 2003). For example, the peak melt production in a case with 1000 ppm H2O in EC and a content of 25 % EC in the mantle assemblage is 2 orders of magnitude lower than that of the case with activation energy Ea=120 kJ mol−1 and (i.e., the case with maximum melt flux in Fig. 6).
3.6 Effects of plate motion
Another potentially important effect involves upper-mantle shear imposed by plate motion. All models presented above are stationary, i.e., with vplate=0 cm yr−1, but on Earth plates move at finite speeds. Hence, we run additional models with an imposed plate velocity of 2, 4, and 6 cm yr−1 in both directions perpendicular to the edge. Related shearing of the asthenosphere may contribute to melt production near the continent–ocean transition for plate motions in the direction of the continent (and hence opposite directions of mantle shear) due to shear-driven upwelling (King and Anderson, 1995, 1998; Conrad et al., 2010; Till et al., 2010). We find, however, that no melting is generated for plate velocities ≤6 cm yr−1, in models with a setting that otherwise conforms to the reference case.
To explore the potential of EDC in terms of sustaining mantle melting and intraplate oceanic volcanism, we run a series of 2D convection models in a systematic parameter study. One robust result of our models involves the transient nature of EDC, with an evolving flow pattern and vigor. In all cases, EDC is followed by SSC and EDC alone (i.e., before the onset of widespread SSC) is never associated with high degrees or large volumes of mantle melting. In most models, EDC-related melting does not occur at all and, when it does, it is often short-lived and almost invariably followed by widespread melting due to SSC (except for the cases of Tref=1400 ∘C and τo=30 Ma).
In all models in which melting due to EDC occurs, it happens soon after the beginning of the model and for only a short time span. Keep in mind that EDC occurs mostly because the initial conditions of our models are metastable and in reality should have started significantly earlier than time t = 0 Ma in our models, e.g., immediately following rifting (van Wijk et al., 2010). Thus, any significant magmatism due to EDC beneath mature oceanic lithosphere is not realistic. On old lithosphere, if any melting occurs, it should occur in a widespread (due to SSC) and not localized (due to EDC) manner. Pushing mantle properties to values that are more favorable for EDC-related melting invariably advances the onset of SSC (Fig. 5), therefore constraining even more the timing of purely EDC-related melting.
Although overall consistent (compare Fig. 6a with Fig. 6a of Kaislaniemi and Van Hunen, 2014), many of our results may strike one as surprising when compared to previous work. In particular, our main conclusion of little to no melting due to EDC is in contrast to King and Anderson (1995, 1998), Till et al. (2010), and, to a smaller extent, Kaislaniemi and Van Hunen (2014). To our knowledge, no other work has self-consistently calculated the initial oceanic lithosphere depletion profile, and the initial condition has a big influence on melting in these models, mostly due to the very transient nature of EDC. Indeed, a step-like edge can promote at least short-lived vigorous EDC and melting but may not be realistic. This is not necessarily a criticism of previous work – for example, Kaislaniemi and Van Hunen (2014) deal with a tecton–craton transition in a continental setting – but this is rather a cautionary tale for future work regarding melting in the oceanic domain.
Kaislaniemi and Van Hunen (2014) also used higher than realistic values for radiogenic heating to compensate for the potential lack of basal heating due to whole-mantle convection in regional-scale models. This increased heating may maintain otherwise transient EDC-related melting and cause hotter temperatures beneath the continents. Our results suggest that higher-than-realistic internal heating can have a significant effect on melting by elevating mantle temperatures such that they exceed those for which the initial mid-ocean ridge depletion profile was calculated on the oceanic side (but note that in this case, the relevant origin of melting is not EDC anymore). Furthermore, the lack of basal heating is not necessarily unrealistic because, for realistic rheologies, sub-adiabatic lower mantles have been inferred (e.g., Christensen and Yuen, 1985; Ulvrova et al., 2019). Indeed, EDC is a transient process and will be affected by re-heating of the upper mantle, but re-heating is achieved by other processes than those studied here (e.g., mantle wind or mantle plumes).
To stabilize the continental lithosphere, some authors have applied composition-dependent rheology (e.g King and Anderson, 1995; Kaislaniemi and Van Hunen, 2014). Such an approach has the advantage of keeping the edge geometry mostly constant and being more suitable to studying long-term processes. Unfortunately, there is no obvious and self-consistent way to calculate the lithological and rheological profile at the base of the continental lithosphere (see “Methods” section) and any proper analysis would hence require an extended parameter search. The models explored in Appendix B confirm that the results of our models predict upper bounds in terms of amounts of melting. Moreover, the total amount of mantle melting due to EDC is smaller with rheological stabilization than without (for details, see Appendix B).
Another effect that emerges in models with rheological stabilization and radiogenic heating is a blanketing effect that may cause melting by processes other than EDC (see Appendix B). In reality, although a local enrichment of radiogenic elements or a blanketing effect by a continent is possible, Jain et al. (2019) showed recently that there is an inverse relation between increased radiogenic heating and the ability of continents to “heat” the underlying mantle by isolation.
As demonstrated by our high-temperature models, EDC may (temporarily) sustain higher-volume fluxes of melting if hot materials are brought to the oceanic–continental transition for any reason. Such hot materials may be transported to the base of the lithosphere mainly by two processes: flow related to whole-mantle convection (e.g., Behn et al., 2004; Conrad et al., 2011) or mantle plumes (for detailed investigation, see companion paper). Alternatively, the entrainment of hydrous or enriched materials by EDC may sustain moderate volcanism locally. For example, hydrous upwellings from the transition zone may be conveyed by EDC or SSC to the base of the lithosphere (Long et al., 2019). In this case, the underlying origin of mantle melting in the first place are the hydrous upwellings, and not EDC, even though the latter may ultimately control the geographic distribution of volcanism.
In any case, degrees of melting and related volume fluxes predicted by our models are unable to account for the high eruptions rates of the Canary Islands or Cabo Verde (Hoernle and Schmincke, 1993; Carracedo et al., 1998; Plesner et al., 2003), even for a slow moving plate. We consider the case with the greatest melt fluxes in Fig. 6a (Ea=120 kJ mol−1; ): all magma produced in the mantle before the onset of SSC-related melting will result in a 2D edifice of only 2.55 km height, assuming the most favorable conditions (no melt retention in the mantle and complete extrusion to the surface) and an edifice slope of 18∘ (Smith, 1988). This height is insufficient to explain emerged islands in the Canary archipelago, since the seafloor is >3 km below sea level. If we assume that 3D effects will focus melts into conical edifices with a spacing in the third dimension of 50 km (consistent with the separation of the islands La Palma and El Hierro), the height of the edifices would be 4.66 km above the sea floor, compatible with the height of small islands, such as El Hierro, but inadequate to explain the height of islands such as La Palma or Tenerife. These calculations demonstrate that not even this extreme case, with parameters that are marginally realistic for the Earth’s mantle (Ea=120 kJ mol−1; ) and considering favorable assumptions, can reproduce the volumes of major (subaerial) volcano chains such as the Canary Islands (or Cabo Verde).
In addition, the short lifespan of EDC-related melting in models with low τo suggests that any related volcanism should occur on seafloor much younger than that underlying the Canaries or Cabo Verde. Besides, no widespread magmatism such as that due to SSC is observed in the vicinity of any of these archipelagos. Also, strictly speaking, EDC melting is expected to sustain volcanism in an elongated zone that is parallel to the cratonic margin and not localized like a hotspot. On the basis of the results of the models here presented, we draw the conclusion that edge-driven convection alone is insufficient to sustain island-building volcanism near the African margin.
Furthermore, our models predict that EDC-related lavas invariably originate from mantle melting of enriched lithologies such as pyroxenite (Fig. 6b). While volcanic compositions in the shield building stage of the Canaries are slightly more enriched than their Hawaiian counterparts (Abdel-Monem et al., 1971, 1972; Carracedo, 1999), they are not consistent with mostly pyroxenite-derived primary magmas. The models in which hydrous peridotite melts first – i.e., the hydrous models – present even lower productivities and melting volumes. Geochemically speaking, we cannot favor an EDC origin for the main shield building stage of the Canary or Cabo Verde archipelagos either.
Nonetheless, there are some enriched volcanic compositions in the eastern Atlantic, for example, the outcrops of carbonatites in the two archipelagos mentioned above (Allegre et al., 1971; Hoernle et al., 2002; Doucelance et al., 2010). Moreover, data about fluid inclusions in recent work suggest that current eruptions are among the most CO2-rich for ocean islands (Taracsák et al., 2019, Esteban Gazel, Cornell University, personal communication, 2018). Although it has been suggested that a high amount of CO2 in the source is not required to explain the magmatic signatures of these islands (Schmidt and Weidendorfer, 2018), the influence of CO2 on melting should not be ignored. Unfortunately, no parameterization which we could implement with our numerical scheme includes the effects of CO2 on melting in the mantle, which remain poorly constrained. And the high water models of Sect. 3.5 are only a proxy for what could happen.
While an alternative origin (such as a thermal anomaly) is required for the volcanic archipelagos, this does not imply that EDC does not happen near the western African margin. EDC occurs in all of our models and must occur along every continental margin on Earth. Patriat and Labails (2006) found a “bulge” in the basement of the ocean–continent transition between the Canary Islands and Cabo Verde. The location of this topographic anomaly coincides with the position of the main upwelling in our models (i.e., at similar distances from the margin as predicted here). In turn, this “bulge” does not coincide with the inferred position of the Canary or Cabo Verde hotspots.
In addition, Van Den Bogaard (2013) describes the formation of seamounts near the current position of, but significantly preceding, the Canary hotspot (Geldmacher et al., 2005). The timing and location of these seamounts is consistent with EDC-related melting beneath oceanic seafloor younger than 60 Ma, such as predicted by our models (for example, the Bisabuelas seamount erupted 142 Myr ago in a much younger African Plate). Given our model results, the geochemical signatures of these seamounts can be used as a test for their origin. We demonstrate that any EDC-related melting robustly implies strong geochemical enrichment.
One of the main conclusions of this study is the occurrence of EDC in absolutely all models run here, at least for a short duration. This is an intuitive result, as mantle convection is driven by lateral density differences. Even for a lithosphere that is intrinsically buoyant due to chemical anomalies, the thermal boundary layer will grow to the point where EDC starts (Lee et al., 2005). It is very likely that EDC starts as soon as rifting indents the lithosphere, resulting in an increased magmatism and erosion (King and Anderson, 1995; Sleep, 2007). Furthermore, although we have shown that EDC (by itself) is not a suitable mechanism for creating voluminous volcanic archipelagos, it could be responsible for smaller seamount provinces on young oceanic crust, such as the Canary Islands seamount province of Van Den Bogaard (2013).
Gerya et al. (2015) suggested that several processes during the history of the lithosphere may weaken it sufficiently to overcome the resistance to subduction initiation. In this sense, EDC-related low-degree magmatism, although insufficient to generate archipelagos, may help to decrease the strength of the lithosphere in the continental–oceanic transition. This weakening could help to localize subduction zones along continental margins. The stresses related to EDC and SSC may further contribute to breaking plates (Solomatov, 2004; Mulyukova and Bercovici, 2018). We show that EDC can thermally erode and indent the lithosphere locally and that melting will occur just below this indentation. Future work should focus on the role of EDC in subduction initiation.
Concerning limitations, our models are intentionally simplified because we attempt to explore the systematic effects of rheological and geometrical parameters on edge-driven convection and melting. As the depleted and dehydrated lithosphere is expected to be more viscous than modeled here, our predicted velocities of EDC can be understood as upper bounds (see Appendix B). Moreover, we show that erosion of the lithosphere is a prerequisite for EDC-related melting, and considering the effect of depletion stiffening will only reduce the degrees of melting and related volumes discussed in Sect. 3. Lee et al. (2005) showed the importance of composition-dependent rheology for stabilizing cratons, and the influence of these variables on EDC needs to be better constrained. On the other hand, Currie and van Wijk (2016) showed that EDC and craton stability are intimately associated and that the influence of EDC on craton formation and stability is poorly understood.
Finally, 3D models of EDC may present small differences with their 2D counterparts (Kaislaniemi and Van Hunen, 2014). We expect these discrepancies to be small, however, in particular for models with small plate velocities. For large plate velocities, the preferred geometry of SSC (longitudinal rolls; Richter and Parsons, 1975) is different than that prescribed in 2D models, and hence the onset age of SSC may be further advanced. In this sense, again, our model setup is conservative. Test models indeed confirm that key model predictions remain robust in 3D geometry.
In this paper, we study the formation of mantle melting and oceanic intraplate volcanism due to edge-driven convection (EDC). As a complex, transient phenomenon, EDC is strongly affected by mantle rheological properties and the geometry of the base of the lithosphere. The following points summarize the key findings of this paper:
-
Although EDC melting is not very vigorous, mantle flow due to EDC occurs for any combination of physical parameters realistic for the Earth, although it remains a transient phenomenon. We predict that EDC should occur everywhere on Earth where lateral density variations exist in the lithosphere, but if melting occurs, it will soon transition to melting due to widespread SSC.
-
For a wide range of parameters, EDC is insufficient to sustain mantle melting at all. Only for a subset of the parameter space (e.g., for low Ea and/or low η0) can EDC sustain magmatism. However, even for these models, EDC-related magmatism is rather weak and can only sustain the formation of small seamounts with very enriched geochemistry on young oceanic crust (e.g the Cretaceous to Paleogene Canary Islands seamount province).
-
In turn, EDC is by far insufficient to sustain voluminous island-building volcanism, particularly on old seafloor (such as the Canaries or Cabo Verde). On old seafloor, volcanism is predicted by our models to occur in a widespread manner due to SSC and not in a localized way due to EDC (if it occurs at all).
-
Increased mantle temperatures or water contents can modify the vigor of convection and the amount of melting, but future work is needed to quantify the conditions under which such thermal or compositional anomalies can be sustained continuously in order to reproduce the large volumes of volcanism observed at the eastern Atlantic archipelagos.
A comprehensive paper (in preparation) will investigate the interaction between mantle plumes and edge-driven convection.
The following figures complement those presented in Sect. 2. Figure A1 shows a snapshot of a corner flow model simulating flow and melting at a mid-ocean ridge. These models are run to calculate the initial melt depletion profiles for the oceanic (and continental) lithosphere of the EDC models presented in the main text. Boundary conditions are different than those in the main text, with an open bottom and right boundary to simulate a corner flow (with lithosphere cooling) in the top-left corner. Plate velocity (2 cm yr−1) is imposed at the surface. We evaluate the models when a statistical steady state is reached. The depletion profile is extracted from these models at a location sufficiently far away from the ridge axis (i.e., once melting ceases in a determinate column moving away from the ridge axis) at the steady state.
Figure A2 shows the different compositional fields for a snapshot of the reference case. The most important feature of this figure is that the most enriched lithologies (EC and PX) are depleted also at the very base of the lithosphere. Erosion and removal of these enriched lithologies are crucial for melting in any models without significant thermal anomalies in the mantle (including our EDC models) and for which the depletion at the base of the lithosphere is self-consistently calculated.


Figure A2Snapshots of composition and temperature of the same time step of the reference model as shown in Fig. 3b. Panels (a) and (b) show melt depletion of the peridotitic compositions: DC and EC, respectively. Panel (c) shows the same field for the pyroxenitic (PX) component. Panel (d) is identical to Fig. 3b. Note that while the depleted lithospheres of peridotitic components are barely eroded and entrained by EDC (with EC being slightly more affected), this is not true for the depleted part of the PX component, which is more efficiently removed by the mantle flow. Also note that the scale for (c) is different than that of (a) and (b).
To explore the effects of rheological stiffening and stabilization of the continental lithosphere, we run additional models of flow and melting with composition-dependent viscosity. A priori, there is no indication that accounting for compositional rheology should strongly affect our results: a stiffer lithosphere is expected to promote less entrainment and erosion of the base of the lithosphere, which in turn should result in less melting. On the other hand composition-dependent rheology may help to maintain the edge, hence extending EDC-related flow.
We follow the rheological stiffening method of Ballmer et al. (2009), which calculates the increase in viscosity due to water loss in the main lithology (with increasing depletion of DC). We use a depletion stiffening coefficient ξ (for definition of this coefficient, see Eq. 10 of Ballmer et al., 2009) with a value of 274.8, which corresponds to a viscosity contrast of a factor of 100 between a fully hydrated mantle (with water contents in DC and EC as defined in Sect. 2) and a dry mantle. This method relates stiffening to depletion as DC loses water during melting. Since the upper part of the continental lithosphere is simulated as an extremely depleted lid, this method leads to a greatly increased viscosity (i.e., a factor of 100) of the lithosphere on the continental side of the model. Consistently, significant stiffening also happens on the oceanic side, as the oceanic lithosphere is fully dehydrated at the top. For a comparison of viscosity profiles between the reference case of Fig. 3 and an equivalent case with rheological stiffening, see Fig. B1
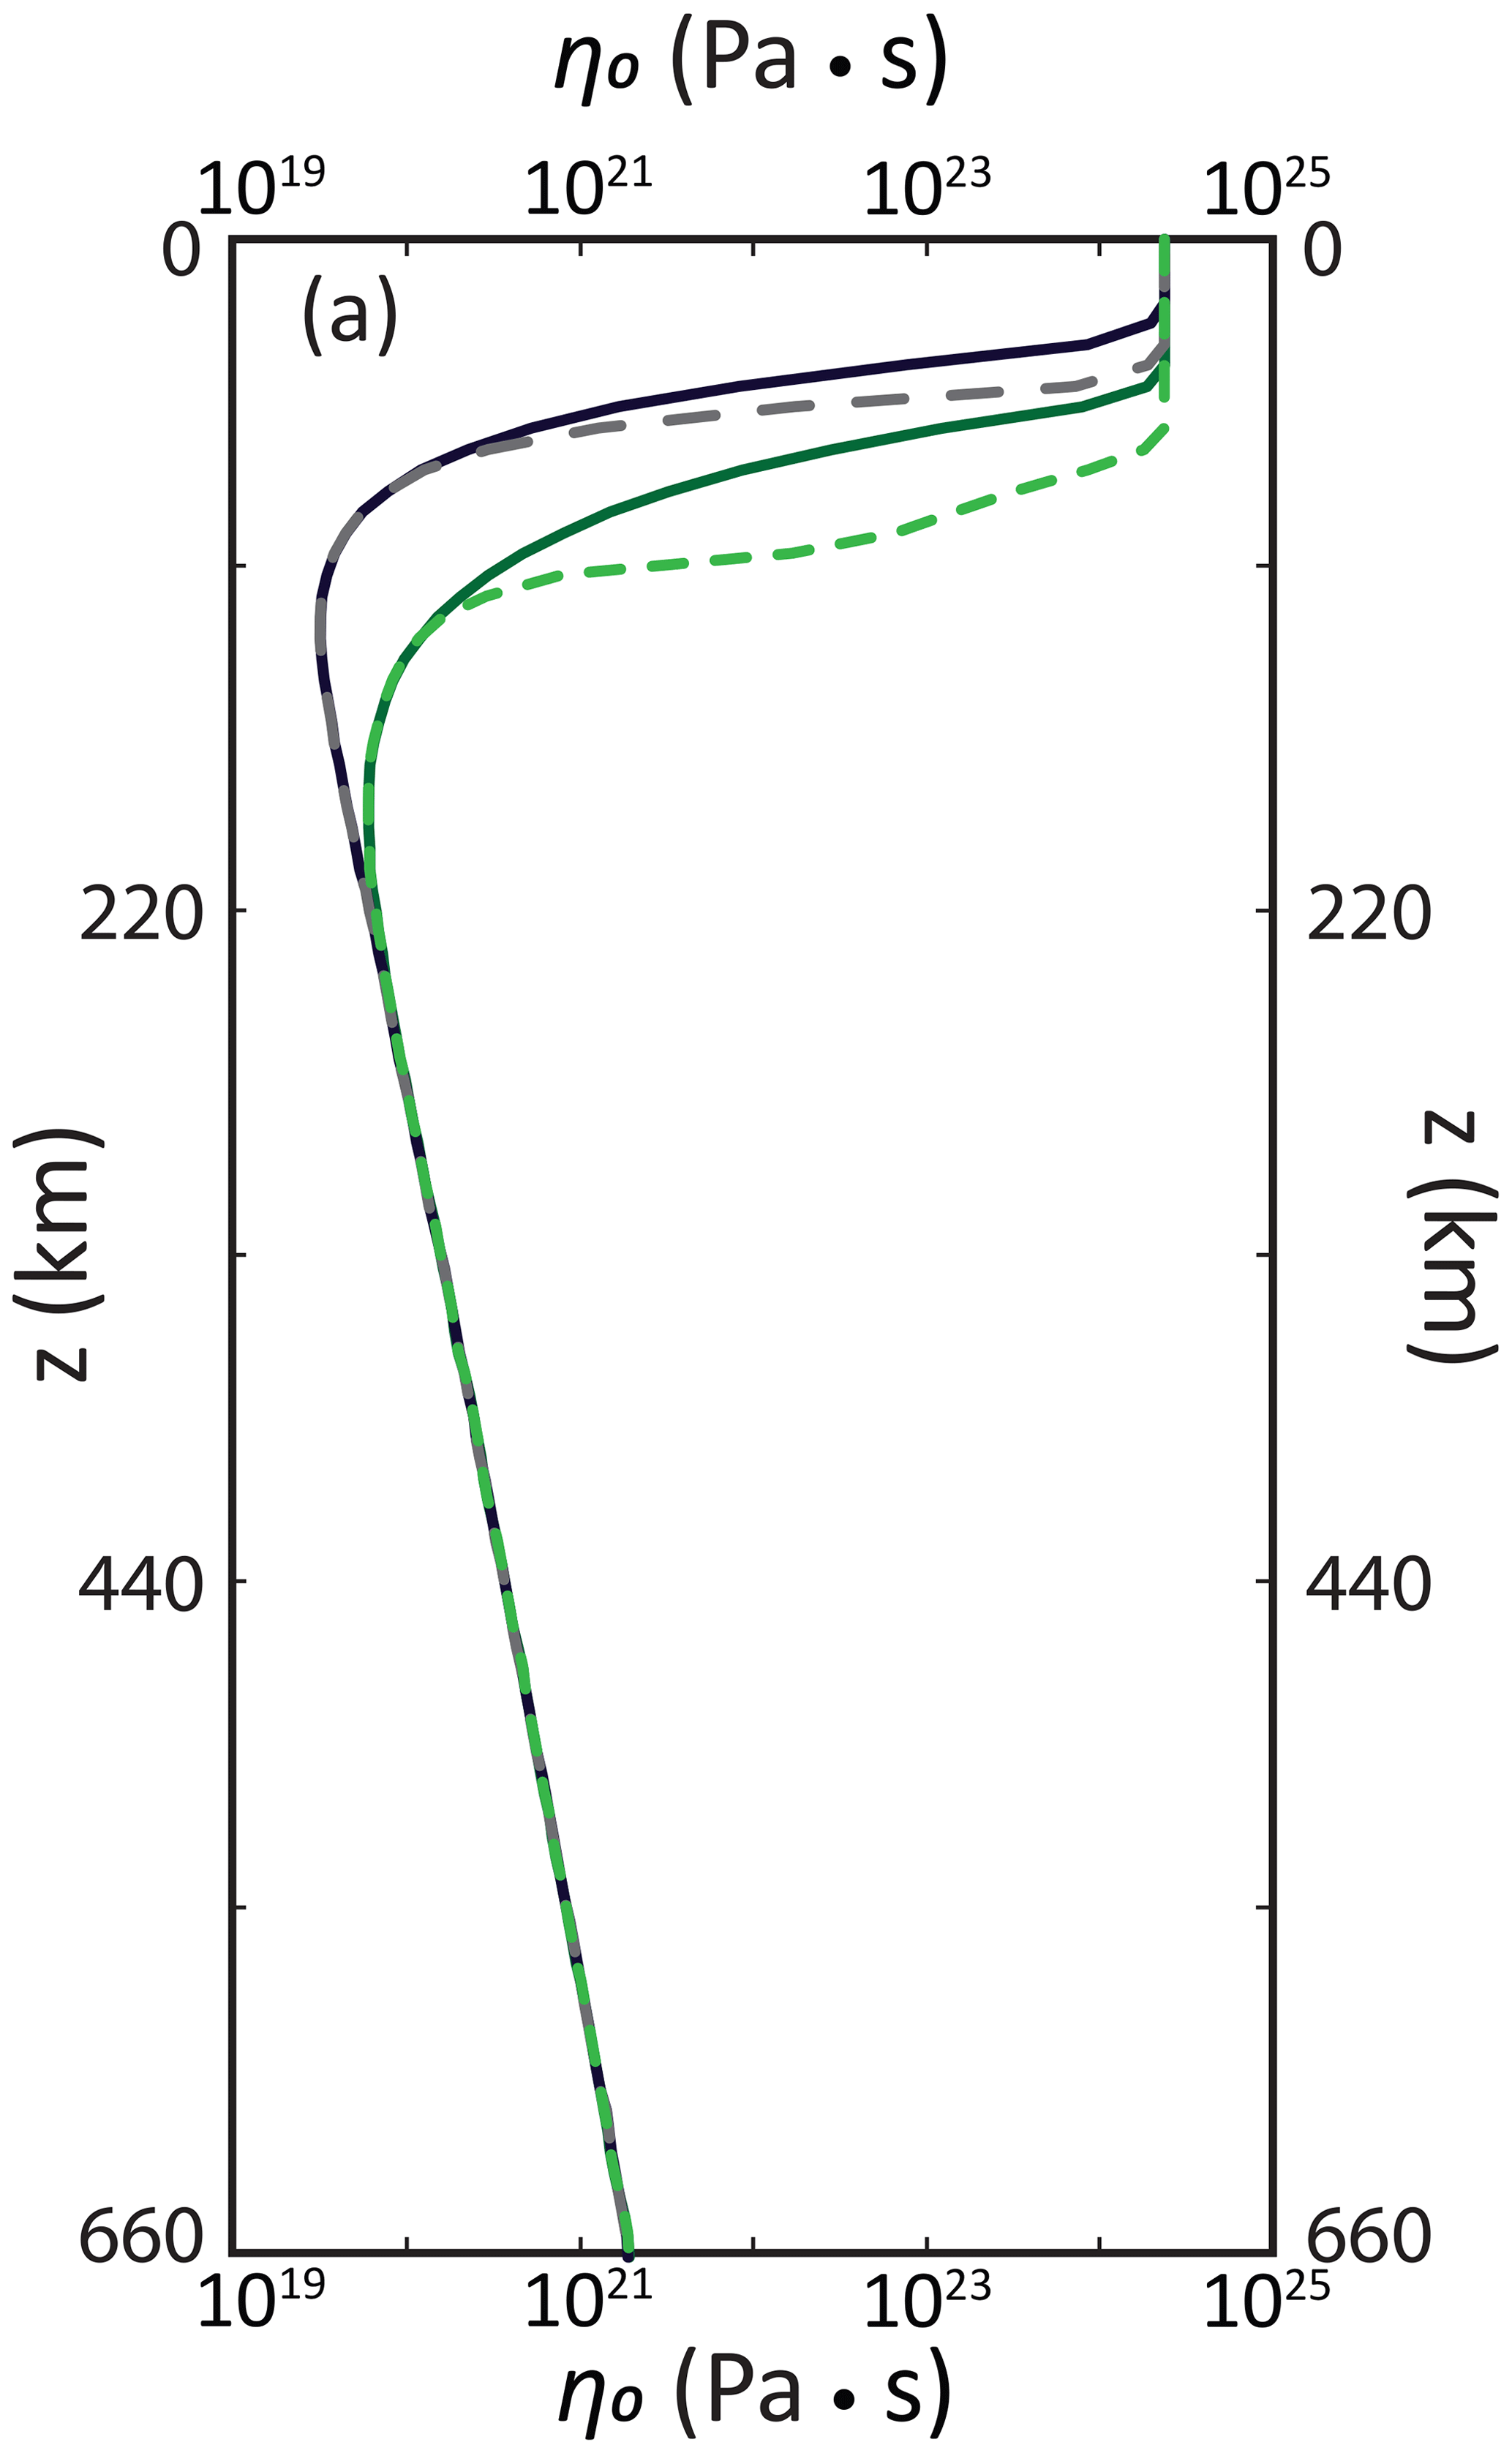
Figure B1Viscosity profiles for cases with and without rheological stiffening. Solid lines correspond to cases without rheological stiffening, while dashed lines correspond to cases which include rheological stiffening. In black and gray, profile at the oceanic side of the model; in dark and light green, profile at the continental side of the model. All the remaining properties as in the reference case.
Figure B2a shows a comparison of a model with rheological stabilization and one without. Indeed, they show similar characteristics, but the case with composition-dependent rheology shows less removal of the base of the lithosphere (Fig. B2b). Due to this less extensive removal, models with lithological stabilization produce lower melting volumes. For example, the models shown in Fig. B2 feature the same η0 and Ea as the case with maximum melting in Fig. 6, but the case with compositional stiffening displays lower volumes of melting than its counterpart without viscosity adjustment (i.e., 2.49 vs. 5.32 km2 Myr−1).
The effect of lithological stiffening also emerges when analyzing the vigor of convection. Figure B3 shows different vz,rms for equivalent cases with and without composition-dependent rheology. As can be seen, the cases with compositional rheology display systematically lower vz,rms than cases without. This result suggests that the melt volumes and vigor of EDC predicted by our models without compositional rheology (as presented in the main text) can be taken as upper bounds, therefore corroborating our conclusions.
Finally, our models do not predict that the duration of EDC and EDC-related melting would be significantly extended for cases with compositional rheology and with stable continent and edge geometries (as suggested by Kaislaniemi and Van Hunen, 2014).
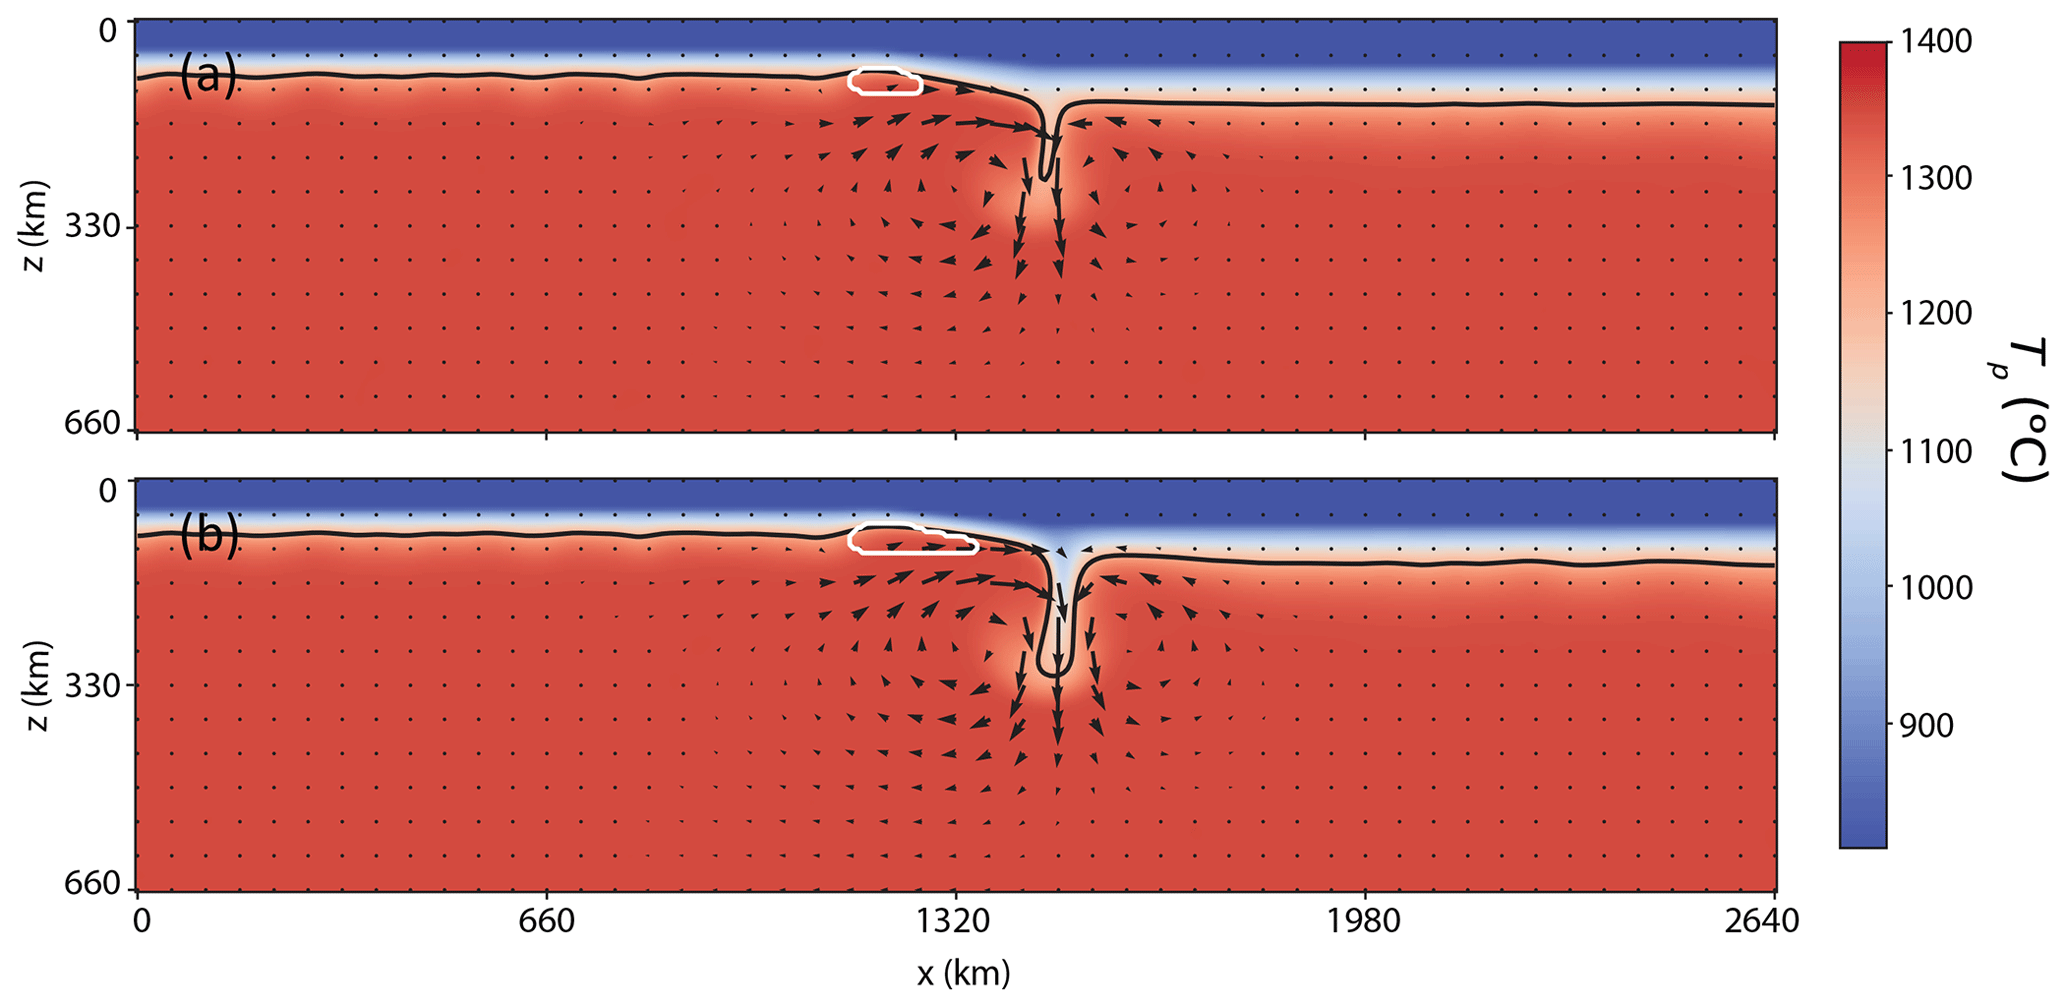
Figure B2Model snapshots of mantle flow and melting for a case with composition-dependent rheology (a) and a case without composition-dependent rheology (b). Physical properties as in the case with maximum melting in Fig. 6 ( Pa s; Ea=120 kJ mol−1). Note that although the velocity fields are very similar, the case with rheological stabilization (a) shows less erosion at the base of the lithosphere than the case without (b), resulting in less vigorous upwellings and downwellings. Consequently, melting rates are also lower for the cases with composition-dependent rheology (compare the white contour of panel of a with that of b).
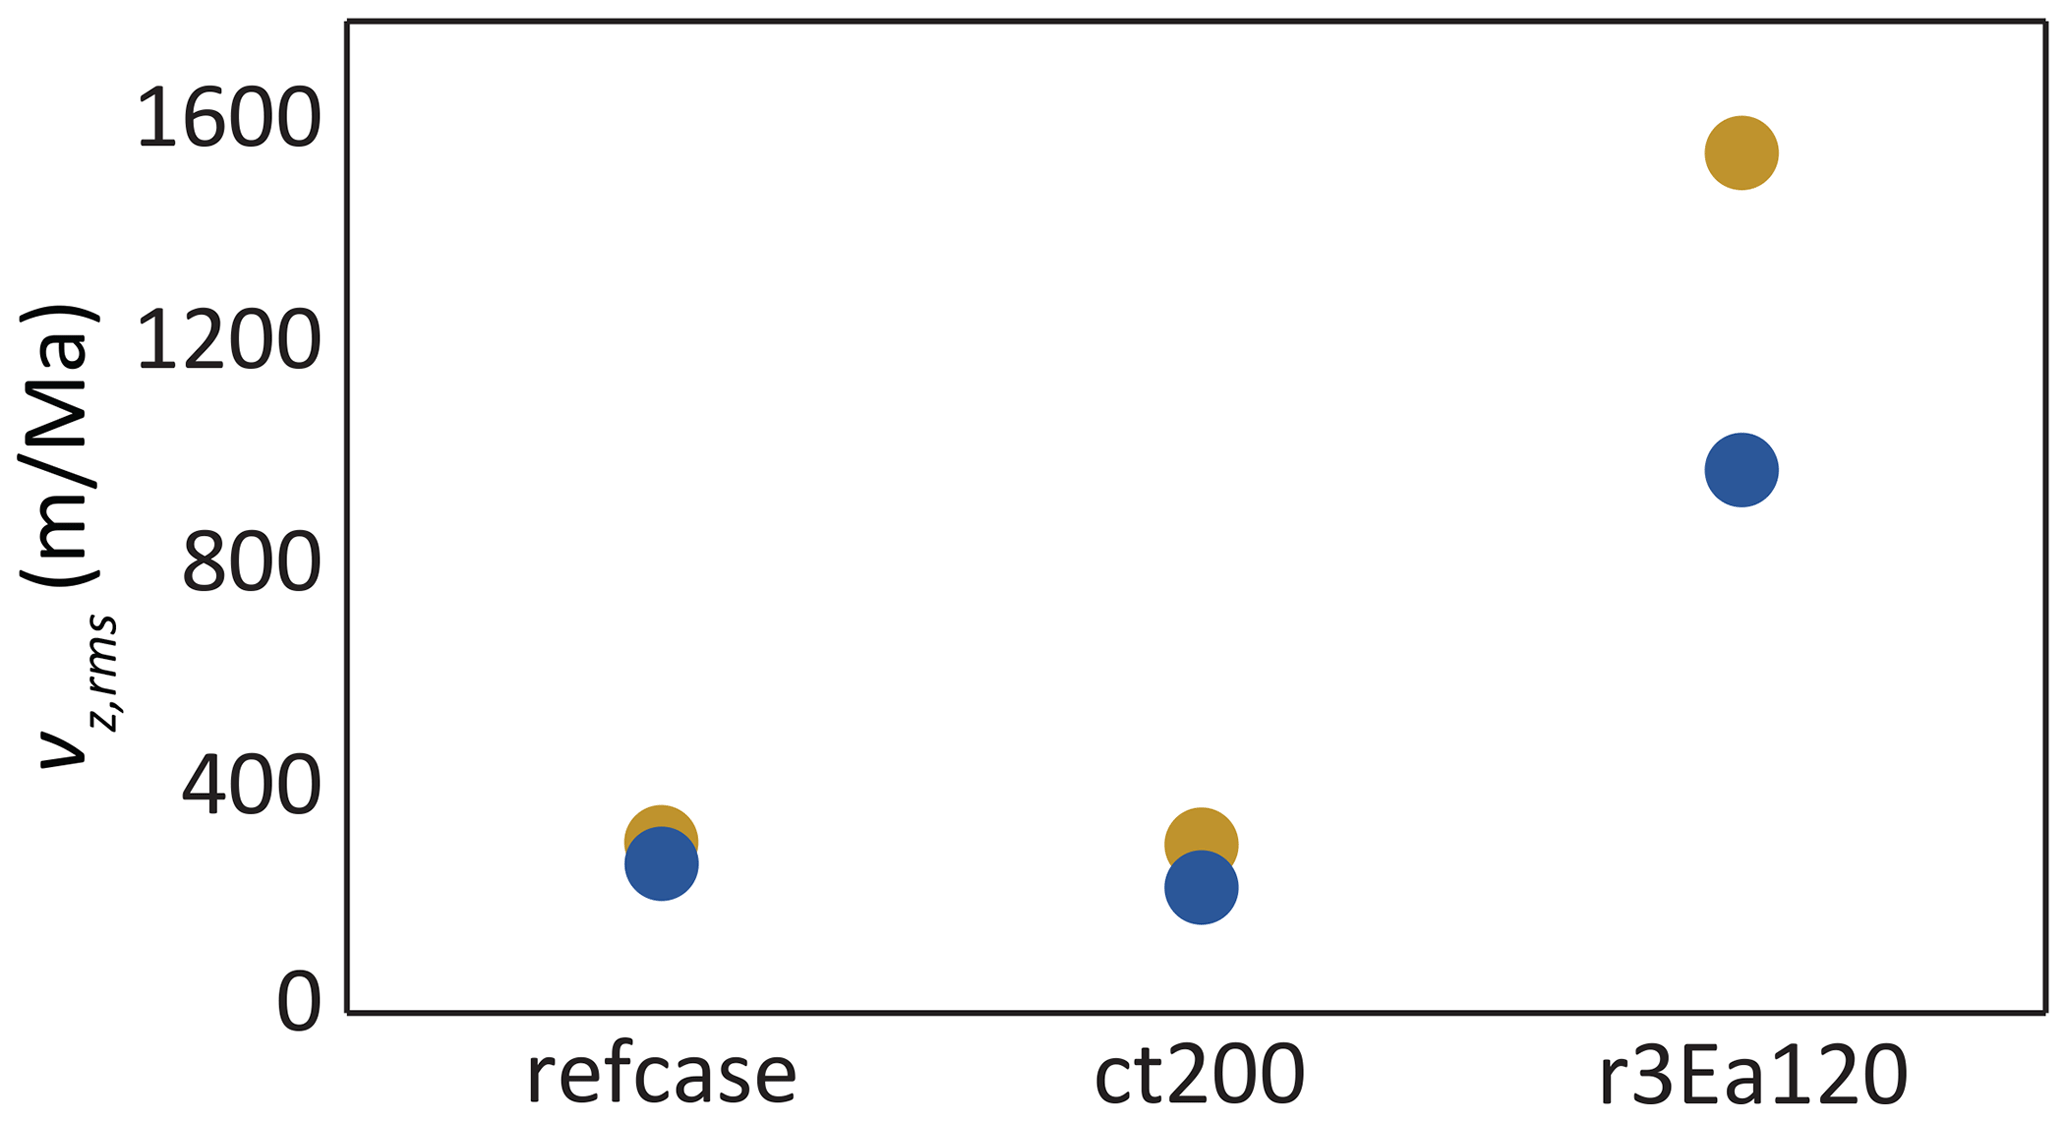
Figure B3Diagram showing vz,rms for equivalent cases with (blue) and without (light brown) composition-dependent rheology. refcase corresponds to the reference case (see Fig. 3); ct200 corresponds to a case with τc=200 Ma; and r3E120 corresponds to a case with Pa s and Ea=120 kJ mol−1 (i.e., the case with maximum melting in Fig. 6). All other parameters as in the reference case (Fig. 3).
The modified version of CITCOM CU (Moresi and Solomatov, 1995; Moresi and Gurnis, 1996; Zhong et al., 2000) with the modifications described in the text is available at https://doi.org/10.5281/zenodo.4293656 (Manjón-Cabeza Córdoba and Ballmer, 2020).
AMCC performed the numerical experiments and post-processed, analyzed, and plotted the data. Both authors devised the study, interpreted the results, and wrote the paper.
The authors declare that they have no conflict of interest.
The authors want to thank Jeroen van Hunen and Lisa Rummel for their thorough reviews: the fruitful discussion that arose from them led to a significant improvement of this work. In addition, we want to thank Taras Gerya, Paul Tackley, Oliver Shorttle, and Esteban Gazel for their insightful feedback on an earlier version of the paper.
This research has been supported by the Schweizerischer Nationalfonds zur Förderung der Wissenschaftlichen Forschung (grant no. 2-77026-16).
This paper was edited by Juliane Dannberg and reviewed by Jeroen van Hunen and Lisa Rummel.
Abdel-Monem, A., Watkins, N. D., and Gast, P. W.: Potassium-Argon Ages, Volcanic Stratigraphy, and Geomagnetic Polarity History of the Canary Islands: Lanzatorte, Fuerteventura, Gran Canaria y La Gomera, Am. J. Sci., 271, 490–521, 1971. a, b
Abdel-Monem, A., Watkins, N. D., and Gast, P. W.: Potassium-Argon Ages, Volcanic Stratigraphy and Geomagnetic Polarity History of the Canary Islands: Tenerife, La Palma, and Hierro, Am. J. Sci., 272, 805–825, 1972. a, b
Allegre, C. J., Pineau, F., Bernat, M., and Javoy, M.: Evidence for the Occurrence of Carbonatites on the Cape Verde and Canary Islands, Nature, 233, 103–104, 1971. a
Anderson, D. L.: Scoring hotspots: The plume and plate paradigms, in: Plates, plumes and paradigms: Geological Society of America Special Paper 388, edited by: Foulger, G. R., Natland, J. H., Presnall, D. C., and Anderson, D. L., Geol. Soc. Am., 388, 31–54, 2005. a
Anguita, F. and Hernan, F.: The Canary Islands origin: a unifying model, J. Volcanol. Geoth. Res., 103, 1–26, 2000. a
Araña, V. and Ortiz, R.: The Canary Islands: Tectonics, Magmatism and Geodynamic Framework, in: Magmatism in Extensional Structural Sttings, edited by: Kampuzu, A. B. and Lubala, R. T., Springer Verlag, 7, 209–249, 1991. a
Asimow, P. D., Dixon, J. E., and Langmuir, C. H.: A hydrous melting and fractionation model for mid-ocean ridge basalts: Application to the Mid-Atlantic Ridge near the Azores, Geochem. Geophy. Geosy., 5, Q01E16, https://doi.org/10.1029/2003GC000568, 2004. a
Ballmer, M. D.: Small-scale sublithospheric convection – an alternative mechanism for oceanic intraplate volcanism, Ph.D. thesis, ETH Zurich, 97 pp., 2009. a
Ballmer, M. D.: Small-Scale Convection in the Earth's Mantle, in: Reference Module in Earth Systems and Environmental Sciences, Elsevier, https://doi.org/10.1016/b978-0-12-409548-9.09494-x, 2017. a
Ballmer, M. D., van Hunen, J., Ito, G., Bianco, T. A., and Tackley, P. J.: Intraplate volcanism with complex age-distance patterns: A case for small-scale sublithospheric convection, Geochem. Geophy. Geosy., 10, Q06015, https://doi.org/10.1029/2009GC002386, 2009. a, b, c, d, e
Ballmer, M. D., Conrad, C. P., Smith, E. I., and Harmon, N.: Non-hotspot volcano chains produced by migration of shear-driven upwelling toward the East Pacific Rise, Geology, 41, 479–482, https://doi.org/10.1130/G33804.1, 2013. a, b
Ballmer, M. D., van Keken, P. E., and Ito, G.: Hotspots, Large Igneous Provinces, and Melting Anomalies, in: Treatise on Geophysics: Second Edition, edited by: Schubert, G., Elsevier, 7, 393–459, https://doi.org/10.1016/B978-0-444-53802-4.00133-0, 2015. a, b
Behn, M. D., Conrad, C. P., and Silver, P. G.: Detection of upper mantle flow associated with the African Superplume, Earth Planet. Sc. Lett., 224, 259–274, https://doi.org/10.1016/j.epsl.2004.05.026, 2004. a
Bodinier, J. L. and Godard, M.: Orogenic, Ophiolitic, and Abyssal Peridotites, in: Treatise on Geochemistry: Second Edition, Elsevier, 3, 103–167, https://doi.org/10.1016/B978-0-08-095975-7.00204-7, 2013. a
Carracedo, J. C.: Growth, structure, instability and collapse of Canarian volcanoes and comparisons with Hawaiian volcanoes, J. Volcanol. Geoth. Res., 94, 1–19, 1999. a, b
Carracedo, J. C., Day, S., Guillou, H., Rodríguez Badiola, E., Canas, J. A., and Pérez Torrado, F. J.: Hotspot volcanism close to a passive continental margin: the Canary Islands, Geol. Mag., 135, 591–604, 1998. a
Christensen, U. R.: Convection with pressure‐ and temperature‐dependent non‐Newtonian rheology, Geophys. J. Int., 77, 343–384, https://doi.org/10.1111/j.1365-246X.1984.tb01939.x, 1984. a
Christensen, U. R. and Yuen, D. A.: Layered convection induced by phase transitions, J. Geophys. Res., 90, 10291, https://doi.org/10.1029/JB090iB12p10291, 1985. a, b
Conrad, C. P., Wu, B., Smith, E. I., Bianco, T. A., and Tibbetts, A.: Shear-driven upwelling induced by lateral viscosity variations and asthenospheric shear: A mechanism for intraplate volcanism, Phys. Earth Planet. In., 178, 162–175, https://doi.org/10.1016/J.PEPI.2009.10.001, 2010. a, b
Conrad, C. P., Bianco, T. A., Smith, E. I., and Wessel, P.: Patterns of intraplate volcanism controlled by asthenospheric shear, Nat. Geosci., 4, 317–321 https://doi.org/10.1038/ngeo1111, 2011. a
Courtillot, V., Davaille, A., Besse, J., and Stock, J.: Three distinct types of hotspots in the Earth's mantle, Earth Planet. Sc. Lett., 205, 295–308, https://doi.org/10.1016/S0012-821X(02)01048-8, 2003. a
Currie, C. A. and van Wijk, J.: How craton margins are preserved: Insights from geodynamic models, J. Geodyn., 100, 144–158, https://doi.org/10.1016/J.JOG.2016.03.015, 2016. a, b
Doblas, M., López-Ruiz, J., and Cebriá, J. M.: Cenozoic evolution of the Alboran Domain: A review of the tectonomagmatic models, Cenozoic Volcanism in the Mediterranean Area (GSA Special Paper), 418, 303–320, https://doi.org/10.1130/2007.2418(15), 2007. a
Doin, M. and Fleitout, L.: Thermal evolution of the oceanic lithosphere: an alternative view, Earth Planet. Sc. Lett., 142, 121–136, https://doi.org/10.1016/0012-821X(96)00082-9, 1996. a, b
Doucelance, R., Hammouda, T., Moreira, M., and Martins, J. C.: Geochemical constraints on depth of origin of oceanic carbonatites: The Cape Verde case, Geochim. Cosmochim. Ac., 74, 7261–7282, https://doi.org/10.1016/j.gca.2010.09.024, 2010. a
Dumoulin, C., Doin, M. P., Arcay, D., and Fleitout, L.: Onset of small-scale instabilities at the base of the lithosphere: Scaling laws and role of pre-existing lithospheric structures, Geophys. J. Int., 160, 345–357, https://doi.org/10.1111/j.1365-246X.2004.02475.x, 2005. a, b
Foulger, G. and Anderson, D. L.: A cool model for the Iceland hotspot, J. Volcanol. Geoth. Res., 141, 1–22, https://doi.org/10.1016/j.jvolgeores.2004.10.007, 2005. a
Geldmacher, J., Hoernle, K. A., Bogaard, D., Duggen, S., and Werner, R.: New 40Ar39Ar age and geochemical data from seamounts in the Canary and Madeira volcanic provinces: Support for the mantle plume hypothesis, Earth Planet. Sc. Lett., 237, 85–101, https://doi.org/10.1016/j.epsl.2005.04.037, 2005. a, b, c
Gerya, T. V., Stern, R. J., Baes, M., Sobolev, S. V., and Whattam, S. A.: Plate tectonics on the Earth triggered by plume-induced subduction initiation, Nature, 527, 221–225, https://doi.org/10.1038/nature15752, 2015. a
Green, D. H.: Experimental petrology of peridotites, including effects of water and carbon on melting in the Earth's upper mantle, Phys. Chem. Miner., 42, 95–122, https://doi.org/10.1007/s00269-014-0729-2, 2015. a, b
Hirano, N.: Petit-spot volcanism: A new type of volcanic zone, Geochem. J., 45, 157–167, https://doi.org/10.2343/geochemj.1.0111, 2011. a
Hirschmann, M. M.: Mantle solidus: Experimental constraints and the effects of peridotite composition, Geochem. Geophy. Geosy., 1, 2000GC000070, https://doi.org/10.1029/2000GC000070, 2000. a
Hirschmann, M. M. and Stolper, E. M.: A possible role for garnet pyroxenite in the origin of the “garnet signature” in MORB, Contributions to Mineral. Petrol., 124, 185–208, https://doi.org/10.1007/s004100050184, 1996. a
Hirschmann, M. M., Asimow, P. D., Ghiorso, M. S., and Stolper, E. M.: Calculation of peridotite partial melting from thermodynamic models of minerals and melts, III. Controls on Isobaric Melt Production and the Effect of Water on Melt Production, J. Petrol., 40, 831–851, 1999. a
Hirth, G. and Kohlstedt, D. L.: Water in the oceanic upper mantle: implications for rheology, melt extraction and the evolution of the lithosphere, Earth Planet. Sc. Lett., 144, 93–108, https://doi.org/10.1016/0012-821X(96)00154-9, 1996. a
Hoernle, K. and Schmincke, H.-U.: The Role of Partial Melting in the 15-Ma Geochemical Evolution of Gran Canada: A Blob Model for the Canary Hotspot, J. Petrol., 34, 599–629, 1993. a, b
Hoernle, K., Tilton, G., Le Bas, M. J., Duggen, S., and Garbe-Schönberg, D.: Geochemistry of oceanic carbonatites compared with continental carbonatites: Mantle recycling of oceanic crustal carbonate, Contrib. Mineral. Petr., 142, 520–542, https://doi.org/10.1007/s004100100308, 2002. a
Huang, J., Zhong, S. J., and van Hunen, J.: Controls on sublithospheric small-scale convection, J. Geophys. Res., 108, 2405, https://doi.org/10.1029/2003jb002456, 2003. a
Iwamori, H., McKenzie, D., and Takahashi, E.: Melt generation by isentropic mantle upwelling, Earth Planet. Sc. Lett., 134, 253–266, https://doi.org/10.1016/0012-821X(95)00122-S, 1995. a
Jain, C., Rozel, A. B., Tackley, P. J., Sanan, P., and Gerya, T. V.: Growing primordial continental crust self-consistently in global mantle convection models, Gondwana Res., 73, 96–122, https://doi.org/10.1016/J.GR.2019.03.015, 2019. a
Jessell, M. W., Begg, G. C., and Miller, M. S.: The geophysical signatures of the West African Craton, Precambrian Res., 274, 3–24, https://doi.org/10.1016/j.precamres.2015.08.010, 2016. a
Kaislaniemi, L. and Van Hunen, J.: Dynamics of lithospheric thinning and mantle melting by edge-driven convection: Application to Moroccan Atlas mountains, Geochem. Geophy. Geosy., 15, 3175–3189, https://doi.org/10.1002/2014GC005414, 2014. a, b, c, d, e, f, g, h, i
Karato, S.-I. and Wu, P.: Rheology of the Upper Mantle: A Synthesis, Science, 260, 771–778, 1993. a
Katz, R. F., Spiegelman, M., and Langmuir, C. H.: A new parameterization of hydrous mantle melting, Geochem. Geophy. Geosy., 4, 1073, https://doi.org/10.1029/2002GC000433, 2003. a, b, c, d
King, S. D. and Adam, C.: Hotspot swells revisited, Phys. Earth Planet. In., 235, 66–83, https://doi.org/10.1016/j.pepi.2014.07.006, 2014. a
King, S. D. and Anderson, D. L.: An alternative mechanism of flood basalt formation, Earth Planet. Sc. Lett., 136, 269–279, https://doi.org/10.1016/0012-821X(95)00205-Q, 1995. a, b, c, d, e, f, g
King, S. D. and Anderson, D. L.: Edge-driven convection, Earth Planet. Sc. Lett., 160, 289–296, https://doi.org/10.1016/S0012-821X(98)00089-2, 1998. a, b, c, d, e
King, S. D. and Ritsema, J.: African Hot Spot Volcanism: Small-Scale Convection in the Upper Mantle Beneath Cratons, Science, 290, 1137–1139, 2000. a, b, c, d, e
Lambart, S., Baker, M. B., and Stolper, E. M.: The role of pyroxenite in basalt genesis: Melt-PX, a melting parameterization for mantle pyroxenites between 0.9 and 5 GPa, J. Geophys. Res. Sol.-Ea., 121, 5708–5735, https://doi.org/10.1002/2015JB012762, 2016. a, b
Lee, C.-T. A., Lenardic, A., Cooper, C. M., Niu, F., and Levander, A.: The role of chemical boundary layers in regulating the thickness of continental and oceanic thermal boundary layers, Earth Planet. Sc. Lett., 230, 379–395, https://doi.org/10.1016/j.epsl.2004.11.019, 2005. a, b
Long, X., Ballmer, M. D., Manjón-Cabeza Córdoba, A., and Li, C. F.: Mantle Melting and Intraplate Volcanism Due to Self-Buoyant Hydrous Upwellings From the Stagnant Slab That Are Conveyed by Small-Scale Convection, Geochem. Geophy. Geosy., 20, 4972–4997, https://doi.org/10.1029/2019GC008591, 2019. a
Manjón-Cabeza Córdoba, A. and Ballmer, M. D.: Source Code and input files for SE-2020-120 (27 November 2020), Zenodo, https://doi.org/10.5281/zenodo.4293656, 2020. a
Manjón-Cabeza Córdoba, A. and Ballmer, M. D.: The role of Edge-Driven Convection in the generation of volcanism II: Interactions between Edge-Driven Convection and thermal plumes, application to the Eastern Atlantic, in preparation, 2021. a, b
Martinez-Arevalo, C., Mancilla, F. D. L., Helffrich, G., and Garcia, A.: Seismic evidence of a regional sublithospheric low velocity layer beneath the Canary Islands, Tectonophysics, 608, 586–599, https://doi.org/10.1016/j.tecto.2013.08.021, 2013. a
McKenzie, D. and Bickle, M. J.: The Volume and Composition of Melt Generated by Extension of the Lithosphere, J. Petrol., 29, 625–679, 1989. a
Moresi, L. N. and Gurnis, M.: Constraints on the lateral strength of slabs from three-dimensional dynamic flow models, Earth Planet. Sc. Lett., 138, 15–28, https://doi.org/10.1016/0012-821X(95)00221-W, 1996. a, b
Moresi, L. N. and Solomatov, V. S.: Numerical investigation of 2D convection with extremely large viscosity variations, Phys. Fluid., 7, 2154–2162, https://doi.org/10.1063/1.868465, 1995. a, b
Morgan, W. J.: Convection Plumes in the Lower Mantle, Nature, 230, 42–43, https://doi.org/10.1038/230042a0, 1971. a
Mulyukova, E. and Bercovici, D.: Collapse of passive margins by lithospheric damage and plunging grain size, Earth Planet. Sc. Lett., 484, 341–352, https://doi.org/10.1016/j.epsl.2017.12.022, 2018. a
Parsons, B. and McKenzie, D.: Mantle convection and the thermal structure of the plates, J. Geophys. Res., 83, 4485, https://doi.org/10.1029/jb083ib09p04485, 1978. a
Patriat, M. and Labails, C.: Linking the Canary and Cape-Verde Hot-Spots, Northwest Africa, Mar. Geophys. Res., 27, 201–215, https://doi.org/10.1007/s11001-006-9000-7, 2006. a
Pertermann, M. and Hirschmann, M. M.: Anhydrous Partial Melting Experiments on MORB-like Eclogite: Phase Relations, Phase Compositions and Mineral-Melt Partitioning of Major Elements at 2–3 GPa, J. Petrol., 44, 2173–2201, https://doi.org/10.1093/petrology/egg074, 2003. a, b
Plesner, S., Holm, P. M., and Wilson, J. R.: 40-39Ar geochronology of Santo Antão, Cape Verde Islands, J. Volcanol. Geoth. Res., 120, 103–121, https://doi.org/10.1016/S0377-0273(02)00367-0, 2003. a
Richter, F. M.: Convection and the large-scale circulation of the mantle, J. Geophys. Res., 78, 8735–8745, https://doi.org/10.1029/jb078i035p08735, 1973. a
Richter, F. M. and Parsons, B.: On the interaction of two scales of convection in the mantle, J. Geophys. Res., 80, 2529–2541, https://doi.org/10.1029/jb080i017p02529, 1975. a
Sacek, V.: Post-rift influence of small-scale convection on the landscape evolution at divergent continental margins, Earth Planet. Sc. Lett., 459, 48–57, https://doi.org/10.1016/j.epsl.2016.11.026, 2017. a
Sandwell, D. T., Winterer, E. L., Mammerickx, J., Duncan, R. A., Lynch, M. A., Levitt, D. A., and Johnson, C. L.: Evidence for diffuse extension of the Pacific Plate from Pukapuka ridges and cross-grain gravity lineations, J. Geophys. Res. Sol.-Ea., 100, 15087–15099, https://doi.org/10.1029/95JB00156, 1995. a
Schmidt, M. W. and Weidendorfer, D.: Carbonatites in oceanic hotspots, Geology, 46, 435–438, https://doi.org/10.1130/G39621.1, 2018. a
Schutt, D. L. and Lesher, C. E.: Effects of melt depletion on the density and seismic velocity of garnet and spinel lherzolite, J. Geophys. Res. Sol.-Ea., 111, B05401, https://doi.org/10.1029/2003JB002950, 2006. a
Shorttle, O., Maclennan, J., and Lambart, S.: Quantifying lithological variability in the mantle, Earth Planet. Sc. Lett., 395, 24–40, https://doi.org/10.1016/j.epsl.2014.03.040, 2014. a
Sleep, N. H.: Edge-modulated stagnant-lid convection and volcanic passive margins, Geochem. Geophy. Geosy., 8, Q12004, https://doi.org/10.1029/2007GC001672, 2007. a
Smith, D. K.: Shape analysis of Pacific seamounts, Earth Planet. Sc. Lett., 90, 457–466, https://doi.org/10.1016/0012-821X(88)90143-4, 1988. a
Solomatov, V. S.: Initiation of subduction by small-scale convection, J. Geophys. Res. Sol.-Ea., 109, B01412, https://doi.org/10.1029/2003jb002628, 2004. a
Stein, C. A. and Stein, S.: Constraints on hydrothermal heat flux through the oceanic lithosphere from global heat flow, J. Geophys. Res. Sol.-Ea., 99, 3081–3095, https://doi.org/10.1029/93JB02222@10.1002/(ISSN)2169-9356.OCRUST1, 1994. a, b, c
Taracsák, Z., Hartley, M., Burgess, R., Edmonds, M., Iddon, F., and Longpré, M.-A.: High fluxes of deep volatiles from ocean island volcanoes: Insights from El Hierro, Canary Islands, Geochim. Cosmochim. Ac., 258, 19–36, https://doi.org/10.1016/J.GCA.2019.05.020, 2019. a
Thirlwall, M. F., Singer, B. S., and Marriner, G. F.: 39Ar 40Ar ages and geochemistry of the basaltic shield stage of Tenerife, Canary Islands, Spain, J. Volcanol. Geoth. Res., 103, 247–297, 2000. a
Till, C. B., Elkins-Tanton, L. T., and Fischer, K. M.: A mechanism for low-extent melts at the lithosphere-asthenosphere boundary, Geochem. Geophy. Geosy., 11, Q10015, https://doi.org/10.1029/2010GC003234, 2010. a, b, c
Turcotte, D. and Schubert, G.: Geodynamics, Cambridge University Press, Cambridge (UK), 3 Edn, 636 pp., 2014. a, b
Ulvrova, M. M., Coltice, N., Williams, S., and Tackley, P. J.: Where does subduction initiate and cease?, A global scale perspective, Earth Planet. Sci. Lett., 528, https://doi.org/10.1016/j.epsl.2019.115836, 2019. a
Van Den Bogaard, P.: The origin of the Canary Island Seamount Province – New ages of old seamounts, Sci. Rep., 3, 2107, https://doi.org/10.1038/srep02107, 2013. a, b, c
van Hunen, J., Zhong, S., Shapiro, N. M., and Ritzwoller, M. H.: New evidence for dislocation creep from 3-D geodynamic modeling of the Pacific upper mantle structure, Earth Planet. Sc. Lett., 238, 146–155, https://doi.org/10.1016/J.EPSL.2005.07.006, 2005. a, b
van Wijk, J. W., van Hunen, J., and Goes, S.: Small-scale convection during continental rifting: Evidence from the Rio Grande rift, Geology, 36, 575–578, https://doi.org/10.1130/G24691A.1, 2008. a
van Wijk, J. W., Baldridge, W. S., van Hunen, J., Goes, S., Aster, R., Coblentz, D. D., Grand, S. P., and Ni, J.: Small-scale convection at the edge of the Colorado Plateau: Implications for topography, magmatism, and evolution of Proterozoic lithosphere, Geology, 38, 611–614, https://doi.org/10.1130/G31031.1, 2010. a, b
Vogt, P. R.: Bermuda and Appalachian-Labrador rises: Common non-hotspot processes?, Geology, 19, 41–44, https://doi.org/10.1130/0091-7613(1991)019<0041:BAALRC>2.3.CO;2, 1991. a
Wilson, J. T.: A Possible Origin of the Hawaiian Islands, Can. J. Phys., 41, 863–870, https://doi.org/10.1139/p63-094, 1963. a
Yaxley, G. M. and Green, D. H.: Reactions between eclogite and peridotite: mantle refertilisation by subduction of oceanic crust, Schweizer Mineralogische und Petrographische Mitteilungen, 78, 243–255, 1998. a
Zhong, S. J., Zuber, M. T., Moresi, L. N., and Gurnis, M.: Role of temperature-dependent viscosity and surface plates in spherical shell models of mantle convection, J. Geophys. Res. Sol.-Ea., 105, 11063–11082, https://doi.org/10.1029/2000JB900003, 2000. a, b
- Abstract
- Introduction
- Methods
- Results
- Discussion
- Conclusions
- Appendix A: Additional figures and explanations for the “Methods” section
- Appendix B: Extended discussion on rheological stabilization of continents and EDC
- Code availability
- Author contributions
- Competing interests
- Acknowledgements
- Financial support
- Review statement
- References