the Creative Commons Attribution 4.0 License.
the Creative Commons Attribution 4.0 License.
 | 16 Mar 2021
Physical and mechanical rock properties of a heterogeneous volcano: the case of Mount Unzen, Japan
Jackie E. Kendrick
Lauren N. Schaefer
Jenny Schauroth
Andrew F. Bell
Oliver D. Lamb
Anthony Lamur
Takahiro Miwa
Rebecca Coats
Yan Lavallée
Ben M. Kennedy
Volcanoes represent one of the most critical geological settings for hazard modelling due to their propensity to both unpredictably erupt and collapse, even in times of quiescence. Volcanoes are heterogeneous at multiple scales, from porosity, which is variably distributed and frequently anisotropic, to strata, which are laterally discontinuous and commonly pierced by fractures and faults. Due to variable and, at times, intense stress and strain conditions during and following emplacement, volcanic rocks span an exceptionally wide range of physical and mechanical properties. Understanding the constituent materials' attributes is key to improving the interpretation of the hazards posed by the diverse array of volcanic complexes. Here, we examine the spectrum of physical and mechanical properties presented by a single dome-forming eruption at a dacitic volcano, Mount Unzen (Japan), by testing a number of isotropic and anisotropic lavas in tension and compression with acoustic emission (AE) monitoring. The lava dome erupted as a series of 13 lobes between 1991 and 1995, and its ongoing instability means that much of the volcano and its surroundings remain within an exclusion zone today. During a field campaign in 2015, we selected four representative blocks as the focus of this study. The core samples from each block span a range in total porosity from 9.14 % to 42.81 % and a range in permeability from to m2 (from 1065 measurements). For a given porosity, sample permeability varies by >2 orders of magnitude and is typically lower for macroscopically anisotropic samples than for isotropic samples of similar porosity. An additional 379 permeability measurements on planar surfaces of both an isotropic and anisotropic sample block showed consistent minimum, maximum, and average permeabilities, and comparable standard deviations to measurements on core and disc samples; this indicated a negligible impact of sample size on recorded permeability across the range of sample sizes and absolute permeabilities tested. Permeability measured under confined conditions showed that the lowest permeability samples, whose porosity largely comprises microfractures, are most sensitive to effective pressure and that anisotropy of permeability is enhanced by confinement. The permeability measurements highlight the importance of the measurement approach, scale, and confinement conditions in the description of permeability. The uniaxial compressive strength (UCS) ranges from 13.48 to 47.80 MPa, and tensile strength (UTS) using the Brazilian disc method ranges from 1.30 to 3.70 MPa, with crack-dominated lavas being weaker than vesicle-dominated materials of equivalent porosity. UCS is lower in saturated conditions, whereas the impact of saturation on UTS is variable. UCS is between 6.8 and 17.3 times higher than UTS, with anisotropic samples forming each endmember. The Young's modulus of dry samples ranges from 4.49 to 21.59 GPa and is systematically reduced in water-saturated tests. The interrelation of porosity, UCS, UTS, and Young's modulus was modelled with good replication of the data, and empirical relationships are provided. Acceleration of monitored acoustic emission (AE) rates during deformation was assessed by fitting Poisson point process models in a Bayesian framework. An exponential acceleration model closely replicated the tensile strength tests, whilst compressive tests tended to have relatively high early rates of AEs, suggesting failure forecast may be more accurate in tensile regimes, though with shorter warning times. The Gutenberg–Richter b value has a negative correlation with connected porosity for both UCS and UTS tests which we attribute to different stress intensities caused by differing pore networks. The b value is higher for UTS than UCS, and it typically decreases (positive Δb) during tests, with the exception of cataclastic samples in compression. Δb correlates positively with connected porosity in compression and correlates negatively in tension. Δb using a fixed sampling length may be a more useful metric for monitoring changes in activity at volcanoes than the b value with an arbitrary starting point. Using coda wave interferometry (CWI), we identify velocity reductions during mechanical testing in compression and tension, the magnitude of which is greater in more porous samples in UTS but independent of porosity in UCS and which scales to both b value and Δb. Yet, saturation obscures velocity changes caused by evolving material properties, which could mask damage accrual or source migration in water-rich seismogenic environments such as volcanoes. The results of this study highlight that heterogeneity and anisotropy within a single system not only add variability but also have a defining role in the channelling of fluid flow and localisation of strain that dictate a volcano's hazards and the geophysical indicators we use to interpret them.
- Article
(6638 KB) - Full-text XML
-
Supplement
(7205 KB) - BibTeX
- EndNote


1.1 Rock failure and volcano stability
Volcanoes are constructed over relatively short geological timescales via the accrual of diverse eruptive products that span a porosity range from 0 % to 97 %, making them inherently unstable structures prone to collapse (Reid et al., 2000; McGuire, 1996; Delaney, 1992). Volcanoes experience deformation due to ongoing magmatic activity (Donnadieu et al., 2001; Voight et al., 1983), pore-fluid pressurisation thanks to active hydrothermal systems and regional tectonics including stress rotation (Reid et al., 2010; Patanè et al., 1994), and alteration due to percolation of fluids (Rosas-Carbajal et al., 2016) and contact with intrusive bodies (Saubin et al., 2019; Weaver et al., 2020). In particular, volcanoes are often located in seismically active regions and may be susceptible to earthquake triggering (Walter et al., 2007; Surono et al., 2012). The presence of thermally liable subvolcanic basement rocks (e.g. Mollo et al., 2011) or the presence of volcaniclastics (Cecchi et al., 2004) may enhance gravitational spreading (Borgia et al., 1992; van Wyk de Vries and Francis, 1997) which also increases instability. Large-scale heterogeneities such as lithological contacts, unconsolidated layers, laterally discontinuous beds, as well as faults, including previous edifice collapse scars, also contribute to the propensity for volcanic edifices to collapse during active periods or quiescence (e.g. Williams et al., 2019; Tibaldi, 2001; Carrasco-Núñez et al., 2006; Schaefer et al., 2019).
Lava domes may be particularly susceptible to collapse events. During emplacement, the development of gas overpressure, gravitational loading, uneven underlying topography, variations in extrusion direction, and intense rainfall can all trigger partial to complete dome collapse (Harnett et al., 2019b; Calder et al., 2002; Elsworth et al., 2004; Voight and Elsworth, 2000). Once activity subsides lava domes are still prone to collapse due to fracturing induced by contraction of cooling magma bodies (Lamur et al., 2018; Fink and Anderson, 2000), fault systems (Walter et al., 2015), redistribution of mass post-emplacement (Elsworth and Voight, 1996), and hydrothermal alteration (Ball et al., 2015; Horwell et al., 2013).
The physical and mechanical properties of the constituent materials are a primary control on volcano and lava dome stability. Volcanic rocks host void space that ranges from vesicles with complex geometries to networks of elongate cracks or fractures (e.g. Schaefer et al., 2015; Shields et al., 2016; Colombier et al., 2017; Herd and Pinkerton, 1997), and dome lavas in particular frequently have anisotropic pore networks (Heap et al., 2014b; Lavallée and Kendrick, 2020). As porosity is the major control on the strength and geophysical characteristics of geomaterials, such diversity of porosity translates to a broad spectrum of mechanical behaviour of dome rocks and lavas (e.g. Harnett et al., 2019a; Heap et al., 2016a; Coats et al., 2018; Lavallée and Kendrick, 2020), and a universal predictor of material strength eludes us. A key parameter in the description of lavas and volcanic rock properties is permeability, which defines materials' ability to build and alleviate pore pressure; this parameter is important during eruptive activity and quiescence alike (Day, 1996; Saar and Manga, 1999; Mueller et al., 2005; Collinson and Neuberg, 2012; Farquharson et al., 2015; Scheu et al., 2006b). Permeability of volcanic rocks has been shown to span some 10 orders of magnitude, including as many as 5 orders of magnitude for materials of a given porosity (e.g. Saar and Manga, 1999; Mueller et al., 2005; Farquharson et al., 2015; Klug and Cashman, 1996). Permeability, controlled by porosity and connectivity of the porosity, acts in competition with material strength to define the fragmentation threshold, which is the limit over which pore pressure exceeds the material's strength and triggers wholesale failure for a spectrum of porous geomaterials (Mueller et al., 2008; Spieler et al., 2004; Kremers et al., 2010; Alatorre-Ibargüengoitia et al., 2010; Scheu et al., 2006b). This interplay influences both pressurised magmas and fluid-saturated volcanic rocks, shifting the stress fields that may trigger failure (e.g. Voight and Elsworth, 2000); this is a consideration that is pertinent to the interpretation of secondary hazards in scenarios of rapid pressurisation during magma ascent (e.g. Mueller et al., 2008), tectonic earthquakes (e.g. Walter et al., 2007), and during decompression induced by unloading during collapse (e.g. Hunt et al., 2018; Maccaferri et al., 2017; Williams et al., 2019; Brantley and Scott, 1993).
Increasingly sophisticated numerical models have been utilised to interpret the conditions leading to partial or extensive collapse of lava domes (e.g. Harnett et al., 2018b; Sato et al., 1992; Voight and Elsworth, 2000), although such simulations necessarily entail estimates for parameters such as internal dome structure, vent geometry, and slope of substrata, and are dependent upon accurate characterisation of physical and mechanical properties. Creating homogeneous zones and assigning fixed values or ranges of parameters for the purpose of isolating the influence of variables during modelling is commonplace and computationally beneficial, yet this remains a great source of uncertainty by failing to account for the spectrum of dome materials' properties. In the last few decades, a surge in laboratory testing means that the characterisation of hot lavas and volcanic rocks has improved significantly, and reliable constraints of rheological, physical, and mechanical properties are being obtained. Rheology of natural lavas including those with suspended vesicles and crystals have been defined across a broad range of temperatures and rates using concentric cylinder and parallel plate methods (Cordonnier et al., 2009; Lavallée et al., 2007; Coats et al., 2018; Webb, 1997; Okumura et al., 2010; Chevrel et al., 2015; Kolzenburg et al., 2016). Volcanic rock strength inversely correlates with porosity and is frequently defined in terms of uniaxial compressive strength (UCS) at room or high temperature (e.g. Heap et al., 2014b; Schaefer et al., 2015; Coats et al., 2018; Bubeck et al., 2017; Pappalardo et al., 2017), direct and indirect tensile strength at room or high temperature (Harnett et al., 2019a; Lamur et al., 2018; Hornby et al., 2019; Lamb et al., 2017; Benson et al., 2012), and triaxial tests at varying pressures, temperatures, and saturation conditions (Heap et al., 2016a; Smith et al., 2011; Farquharson et al., 2016; Shimada, 1986; Kennedy et al., 2009; Mordensky et al., 2019). Strength of volcanic rocks also typically positively correlates with strain rate (Schaefer et al., 2015; Coats et al., 2018), which in combination with variability in pore geometry, crystallinity, and other textural parameters of volcanic rocks ensures that scatter in volcanic rock strength is high (Lavallée and Kendrick, 2020; Heap et al., 2016b). This variability is exacerbated by the effects of pore pressure (Farquharson et al., 2016), in situ temperature (Coats et al., 2018; Lamur et al., 2018), chemical alteration (Pola et al., 2014; Wyering et al., 2014; Farquharson et al., 2019), thermal stressing (Kendrick et al., 2013; Heap et al., 2014b), and time-dependent (Heap et al., 2011) or cyclic (Schaefer et al., 2015; Benson et al., 2012) stressing, whose impact is contrasting in different volcanic rocks, further enhancing the range of mechanical properties of materials that construct volcanic edifices and lava domes.
During laboratory deformation, acoustic emissions (AEs) can be recorded; AEs are produced by the creation, propagation, and coalescence of fractures which accelerate in the approach to failure, forming the basis for various forecasting approaches (e.g. Kilburn, 2003; Bell et al., 2011; Bell, 2018; Voight, 1988). The frequency–amplitude distribution of AEs are commonly observed to follow an exponential distribution (e.g. Pollock, 1973; Scholz, 1968). This distribution is analogous to the Gutenberg–Richter relation observed for the frequency–magnitude distribution of tectonic earthquakes (Gutenberg and Richter, 1949). Accordingly, the “b value” may be calculated for the distribution of AE amplitudes, describing the relative proportions of small and large events. Previous laboratory work on a broad range of lithologies showed that the b value is higher during ductile (compactant) deformation, as cracking events are pervasively distributed, than during brittle (dilatant) deformation, which is often localised (Scholz, 1968). In their study on porous sintered glasses, Vasseur et al. (2015) showed that the b value increases as a function of heterogeneity (∼porosity) due to the number of nucleation sites in heterogenous materials that allow pervasive damage. Complementary work on three-phase magmas (glass, crystals, and pores) showed that the b value depended on the applied stress, with higher stresses resulting in faster deformation, more localised damage zones, and correspondingly lower b values (Lavallée et al., 2008). Similarly, during a single episode of deformation, results on various rocks and glasses have also indicated that the b value decreases as damage accrues and strain becomes localised to a damage zone or failure plane (Vasseur et al., 2015; Lockner, 1993; Meredith et al., 1990; Main et al., 1992), whereas in double-direct shear, smoother, less heterogenous fault surfaces produced lower b values during slip (Sammonds and Ohnaka, 1998).
Elastic moduli also elucidate materials' response to deformation and are measured from mechanical data or from ultrasonic velocity measured in the laboratory (although passive and dynamic values do not necessarily correlate; e.g. Kendrick et al., 2013; Heap et al., 2020); in particular, Young's modulus indicates the stress–strain response to loading and correlates negatively with porosity (Heap et al., 2020, and references therein). Ultrasonic velocity is itself an indicator of material properties (e.g. Vanorio et al., 2002; Harnett et al., 2018a); for volcanic rocks and magmas both P- and S-wave velocity (and their ratio) depend on the mineralogical assemblage (Caricchi et al., 2008; Vanorio et al., 2002), porosity (vesicularity or fracture damage; e.g. Lavallée et al., 2013; Lesage et al., 2018), and temperature (e.g. Scheu et al., 2006a). During deformation in compression, seismic velocity has been shown to first increase and then more substantially decrease as damage accrues (Ayling et al., 1995; Harnett et al., 2018a), which has been linked via AE monitoring to the generation of fractures (Benson et al., 2007; Zhang et al., 2019). Whilst seismic velocity is a valuable characterisation tool, it is sensitive to the degree of saturation (pertinent to wet volcanic systems) and difficult to measure during dynamic testing due to the generation of AEs (Zhang et al., 2019), as well as being both technologically and computationally challenging (Benson et al., 2007). Coda wave interferometry (CWI) has been employed as an alternative, as it is sensitive to small fluctuations in material properties (e.g. Singh et al., 2019; Snieder et al., 2002; Griffiths et al., 2018), including crack damage (Lamb et al., 2017) or the degree of saturation (Grêt et al., 2006). The utilisation of CWI at active volcanic systems has not only tracked migrating seismic sources (e.g. Lamb et al., 2015) but has also indicated velocity reduction prior to eruptions on an equivalent scale to that measured in the laboratory (Erdem and Waite, 2013; Lamb et al., 2017; Haney et al., 2014), validating its implementation in rock physics to track material evolution.
The spectrum of lab-based approaches offers an idealised picture of material characteristics of a given volcanic system, representing intact-rock values of material coherent enough to sample. Utilisation of field-based measurements using the Schmidt hammer (e.g. Harnett et al., 2019a) or in situ porosity and permeability measurements (e.g. Mordensky et al., 2018) have been employed in combination with laboratory testing in an attempt to examine the representativeness of sample selection at volcanoes (e.g. Bernard et al., 2015; Schaefer et al., 2015). Thomas et al. (2004) used the rock-mass rating (RMR) index and the Hoek–Brown criterion to deduce that edifice strengths likely show a 96 % reduction from intact rock strength measured in the laboratory due to rock mass discontinuities and surface conditions. Whilst it is not necessarily the responsibility of those conducting mechanical tests to apply such corrections, it is vital that such considerations are made in the modelling and assessment of hazards posed by partial or complete collapse of volcanic edifices and lava domes.
1.2 Mount Unzen eruption and lavas
In order to understand how physical and mechanical properties of volcanic rocks vary we can first consider the variability from a single lava dome eruption at a volcanic system. The 1990–1995 eruption at Mount Unzen, on the Shimabara Peninsula (Fig. 1a), began on 17 November 1990, and the extrusion of lava at the Jigoku-ato crater commenced on 20 May 1991 (Nakada and Fujii, 1993). A total of 1.2×10⁸ m3 lava was erupted via endogenic and exogenic growth, with approximately half this volume preserved in the Heisei-Shinzan lava dome (Nakada et al., 1999). Endogenic versus exogenic growth has been modelled to be controlled by extrusion rate (Hale and Wadge, 2008): from May 1991 to November 1993 effusion rates were high (Nakada et al., 1995; Nakada and Motomura, 1999), resulting in the formation of 13 lava lobes (Sato et al., 1992; Nakada and Fujii, 1993) by exogenous growth. Effusion rates waned after November 1993, and dome growth was endogenous until mid-October 1994 when a lava spine extruded in the centre of the dome surface (Saito and Shikawa, 2007; Nakada and Motomura, 1999). As the dome grew, new lobes were extruded into older collapse scars, which formed planes of weakness that facilitated further collapses (Nakada et al., 1999). Throughout the eruption numerous collapse events caused block-and-ash flows and rock falls (Sato et al., 1992), as the lava dome was constructed atop the steep substratum (Brantley and Scott, 1993). Tragically, one such collapse on 3 June 1991 led to the death of 43 people. To date, the lava dome remains unstable (Shi et al., 2018); the frontal portion of lobe 11 continues to move SE–ESE at a rate of 2.45–5.77 cm yr−1 (over the last decade), presenting the risk of collapse of a portion of the lava dome up to 107 m3 in size (Hirakawa et al., 2018). As such, the summit and a large proportion of the flanks remain an exclusion zone.
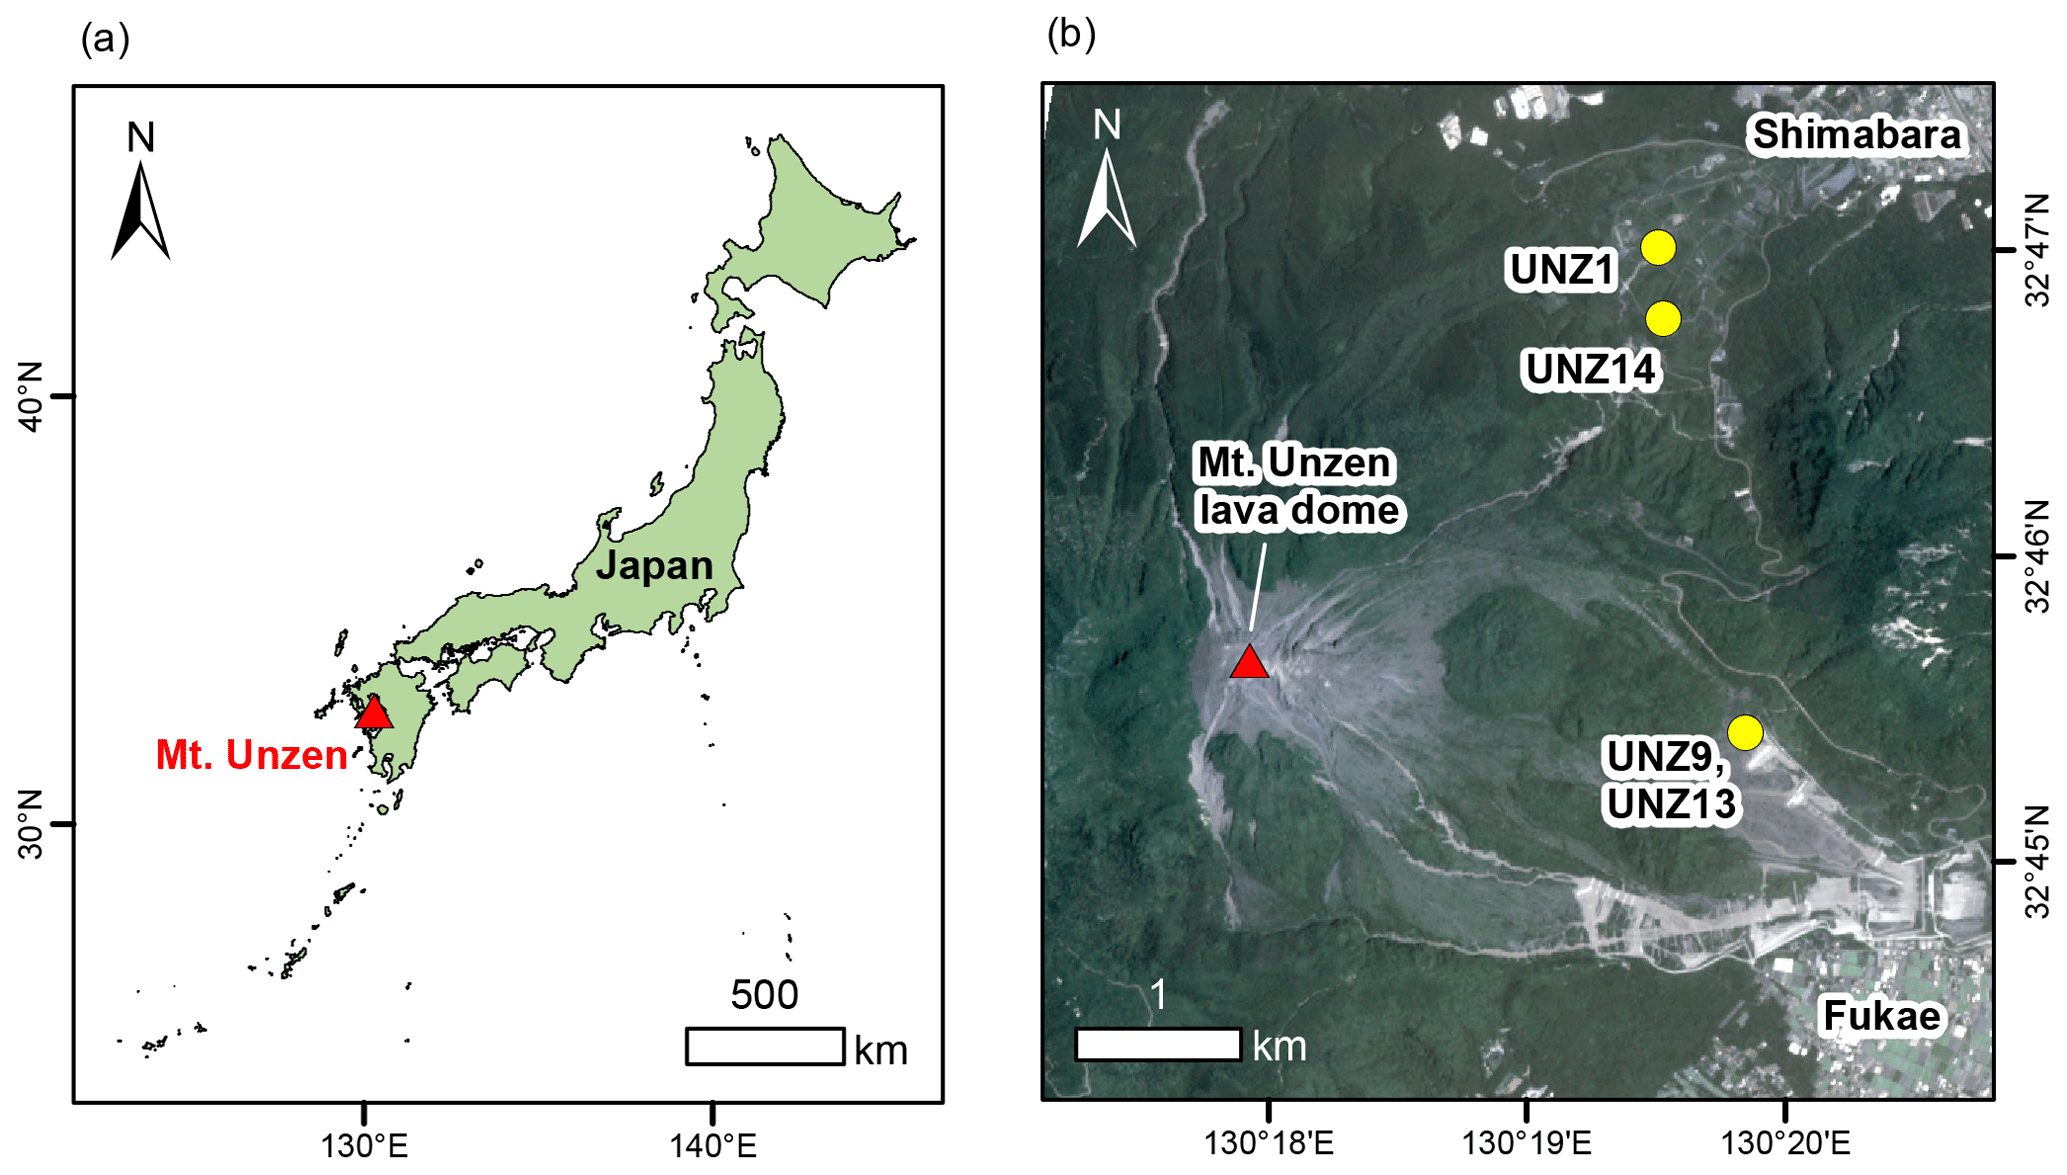
Figure 1(a) Location of Mt. Unzen on the Shimabara Peninsula of Japan (country boundary data provided by the World Resource Institute). (b) Location of samples used in the study shown on top of a multispectral PlanetScope scene with 3 m spatial resolution, from 7 June 2020 (Planet, 2017).
The erupted lavas are porphyritic dacites with abundant, large phenocrysts and significant porosity (typically >10 %), which is distributed heterogeneously (Nakada and Motomura, 1999; Noguchi et al., 2008; Cordonnier et al., 2009; Bernard et al., 2015; Coats et al., 2018; Scheu et al., 2008). Much of the lava exhibits anisotropic textures, and shear zones pierce the lava dome carapace, relics of shallow conduit strain localisation in the hot, viscous magmas (Wallace et al., 2019; Miwa et al., 2013; Hornby et al., 2015). Ongoing fumarole activity and prolonged residence at elevated temperature has resulted in substantial hydrothermal alteration in localised areas of the dome (e.g. Almberg et al., 2008). Numerous experimental investigations have examined the porosity distribution, rheology, strength, seismic velocities, elastic moduli, fragmentation threshold, and frictional coefficients of the 1991–1995 lavas (Scheu et al., 2006a, 2008; Cordonnier et al., 2009; Kremers et al., 2010; Hornby et al., 2015; Bernard et al., 2015; Coats et al., 2018; Lavallée et al., 2007; Kueppers et al., 2005), painting a picture of a highly heterogeneous lava dome. Understanding this heterogeneity in terms of physical and mechanical variability is vital. Coats et al. (2018) showed that these dacitic rocks weaken as they cool from magmatic to ambient temperatures, although the impact of alteration on their strength was limited. As the deformation of rocks is inherently time-dependent (e.g. Dusseault and Fordham, 1993) and the area is particularly prone to regional earthquakes, the hazards at Mount Unzen continue to evolve, especially in light of the potential for renewed volcanic unrest.
Here, by utilising the range of materials produced during a single eruption at Mount Unzen, we demonstrate the importance of material characterisation. Mount Unzen represents an ideal case study, as the eruptive products exhibit mostly invariable chemical and mineralogical attributes, and they have experienced similar eruptive and cooling history; thus, their study allows a robust description of relationships between physical and mechanical characteristics. We assess the contribution of rock porosity and anisotropy on rock strength under dry and water-saturated conditions, and we examine Young's modulus as well as the interrelation of these properties and rock permeability. We assess the temporal evolution of damage during laboratory compressive and tensile deformation using acoustic monitoring of crack damage, examining accelerating rates of energy release and tracking progression of the seismic b value. We also employ coda wave interferometry during deformation to further quantify progression of damage during stressing. Such investigations that consider damage progression and strength as a function of porosity, anisotropy, and saturation under different deformation modes are important in our interpretation of volcano monitoring data, elucidating the processes responsible for observed characteristics and defining their associated hazards.
2.1 Sample selection and characterisation
2.1.1 Sample collection
Unzen lavas are typically porphyritic dacites with ∼63 wt % SiO2 and rhyolitic interstitial glass. Lavas from the collapse deposits of the 1991–1995 lava dome sampled in this study have been described as having variable porosities of approximately 10 %–35 % (Kueppers et al., 2005; Coats et al., 2018; Hornby et al., 2015) and crystallinity (including microlites) of up to ∼75 %, including large (>3 mm) and abundant (> 25 vol %) plagioclase phenocrysts, along with fewer amphibole (∼5 vol %), biotite (∼2 vol %), and quartz (∼2 vol %) phenocrysts and microphenocrysts set in a partially crystalline (30–55 vol %) groundmass of plagioclase, pyroxene, quartz, pargasite, and iron-titanium oxides (Coats et al. 2018; Nakada and Motomura, 1999; Wallace et al., 2019).
During a field campaign in 2015, a suite of blocks, each >15 kg, were collected from block-and-ash flow deposits on the eastern and north-eastern flanks (Fig. 1b). The samples were assessed in the field to ensure representative texture and estimated densities that matched the known range of physical attributes of Unzen lavas (cf. Kueppers et al., 2005). The target was to select four blocks for this study which spanned low (UNZ14), medium (UNZ1), and high (UNZ13) porosity, plus an additional block that displayed an anisotropic cataclastic fabric (UNZ9), as the summit lava dome is pierced by shear zones (see e.g. Wallace et al., 2019). Blocks UNZ1 and UNZ13 were also used for the study by Coats et al. (2018), who examined the role of temperature, alteration, and strain rate on the rheological response to deformation at high temperature and defined a failure criterion for porous dome rocks and lavas.
2.1.2 Sample preparation
Samples were cored using a pillar drill at the University of Liverpool to prepare cylinders of both 20 and 40 mm diameter. In the case of the anisotropic block, cores were prepared both parallel (UNZ9a) and perpendicular (UNZ9b) to the plane of the fabric, producing five sample groups: UNZ1, UNZ9a, UNZ9b, UNZ13, and UNZ14 (Fig. 2). The 20 mm cylinders were cut and ground plane-parallel to a nominal length of 40 mm to prepare samples (herewith termed cores) for porosity determination, unconfined gas permeability estimates, confined water permeability measurements, and both dry and water-saturated uniaxial compressive strength (UCS) tests. The 40 mm cylinders were cut to lengths of 20 mm to prepare samples (termed discs) for porosity and unconfined gas permeability measurements and indirect tensile strength testing (UTS) of dry and saturated samples using the Brazilian disc method (Fig. 2). Depending on material availability, 11 to 13 cores and 7 to 14 discs were produced for each of the five sample groups (114 total). In addition, sample offcuts of each rock were ground to a fine powder for solid density measurements (see below).
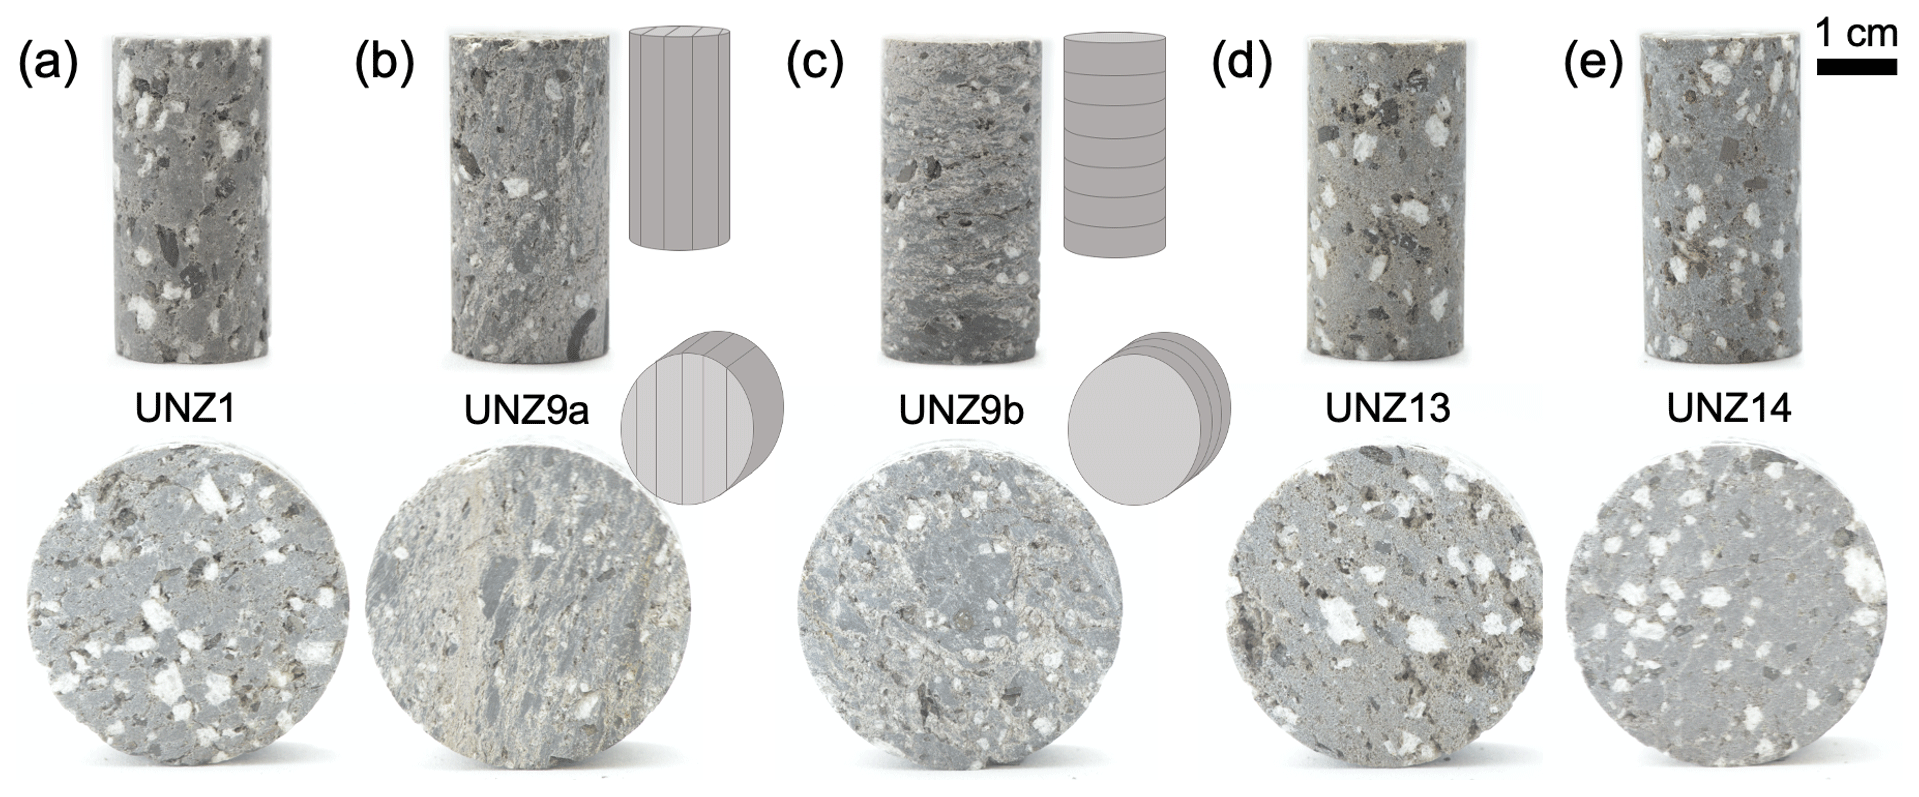
Figure 2Photographs of sample cores used for uniaxial compressive strength (UCS) tests and discs used for indirect tensile strength testing (UTS) using the Brazilian disc method: (a) UNZ1 – an isotropic dacite of medium porosity with large euhedral phenocrysts and pore space comprising vesicles adjacent to phenocrysts as well as microfractures traversing the groundmass; (b) UNZ9a – a cataclastic dacite with clear subparallel cataclastic banding comprised of fractured phenocrysts and porous fault gouge cored parallel to the fabric (see inset schematic), both void spaces and crystals (often fragments) are smaller than in isotropic sample UNZ1; (c) UNZ9b – the same cataclastic sample cored perpendicular to the fabric (see inset schematic); (d) UNZ13 – the lowest density sample with large phenocrysts, large sub-rounded vesicles, and varying degrees of coalescence often positioned in close proximity to crystals; (e) UNZ14 – the densest sample selected for the study also has large euhedral phenocrysts, with typically smaller pores and fine fractures traversing the dense groundmass. For all samples, the direction of the principal applied stress during mechanical testing is vertical.
2.1.3 Microstructural characterisation
Thin sections were prepared with fluorescent dyed epoxy from the offcuts of sample cores in the same orientation as coring direction. Thin sections were imaged using a DM2500P Leica microscope with both reflected light with an ultraviolet (UV) filter to examine microstructures and with plane-polarised transmitted light to assess mineralogy.
2.1.4 Porosity determination
The porosity of all 114 cores and discs was assessed using an AccuPyc 1340 helium pycnometer from Micromeritics using a 35 cm3 cell (to provide volume with an accuracy of ±0.1 %). Sample length (l; in centimetres), radius (r; in centimetres), and mass (m; in grams) were recorded, providing sample density (ρs; in grams per cubic centimetre) via
The solid density of the rocks (ρ0) was determined in the pycnometer by measuring the volume of ∼25 g aliquots of the powders from each sample block, and total porosity (∅T) was calculated as follows:
To constrain the fraction of isolated pores in the rocks, the material volume was measured (Vm; in cubic centimetres) for each core and disc sample in the pycnometer. The connected porosity (∅c) of the samples was then determined via
and the isolated porosity (∅i) was determined via
The connected porosity is the most robustly defined parameter (as total and isolated porosity rely on powder density determined for the bulk sample, not the specific core). As such, connected porosity was further analysed for average, range, standard deviation, and coefficient of variation for each sample group (UNZ1, UNZ9a, UNZ9b, UNZ13, and UNZ14) and was used for presenting all permeability measurements and mechanical results framed in terms of porosity.
2.1.5 Unconfined gas permeability
Permeability of the cores and discs at ambient atmospheric conditions was estimated using a TinyPerm II minipermeameter from New England Research Inc. The apparatus utilises the pulse decay method via an 8 mm circular aperture in contact with the sample surface, thereby sampling a different volume depending on absolute permeability (Filomena et al., 2014). Previous work has demonstrated a theoretical minimum sample size that stipulates a sample radius in excess of 4 times the aperture radius for the attainment of representative permeability values (Goggin et al., 1988), a relationship which we will explore herein. TinyPerm II measurements estimate permeability with an accuracy of ∼0.2 log units at low porosities to 0.5–1 log units at higher porosities on laboratory specimens (Lamur et al., 2017), and they are particularly valuable for rapid comparison across sample suites. For each of the samples, five measurements were made at different positions on each flat face of the rock sample (10 total per sample). In total, 1065 unconfined gas permeability measurements were made on the samples, and the values were used to determine the average, standard deviation, and coefficient of variation for each core or disc and, additionally, to explore the specimen-to-specimen variability within each sample group (UNZ1, UNZ9a, UNZ9b, UNZ13, and UNZ14).
Additionally, for two of the samples, the macroscopically anisotropic UNZ9 and the densest block UNZ14, the blocks were cut to reveal planar surfaces of approximately 8×40 and 8×18 cm2 respectively. The planar surfaces of the dissected blocks were mapped using the TinyPerm II minipermeameter at a grid spacing of 1 cm. An additional 262 measurements were made for sample UNZ9 and 117 for sample UNZ14. The values were used to determine the average, standard deviation, and coefficient of variation for each sample group, and they were further compared to measurements on core and disc samples to examine the impact of sample size on permeability determinations using the TinyPerm II.
2.1.6 Confined water permeability
A subset of three cores from each of the five sample groups (UNZ1, UNZ9a, UNZ9b, UNZ13, and UNZ14) were chosen to determine permeability as a function of confining pressure using a hydrostatic pressure cell developed by Sanchez Technologies. Confining pressure (Pc) was set to increments of 5.5, 9.5, and 13.5 MPa, and the flow rate was varied at each increment until an outlet pressure of between 1.1 and 1.5 MPa was achieved. The pore pressure pumps were then locked to set the pore pressure differential (ΔP), and the permeability was measured once the flow rate (Q) stabilised, to ensure permeability measurements captured steady-state flow. The pore pressure (average of inlet and outlet pressure) was subtracted from the confining pressure to define the effective pressure (Peff) for the measurements. Permeability (k) was determined at each Peff via Darcy's law:
where μ is the water viscosity, l is the sample length, and a is the sample cross-sectional area. Thus, the impact of increasing effective pressure on permeability and the sensitivity to confinement (cf. burial) of each sample was revealed.
2.2 Sample deformation
2.2.1 Uniaxial compressive testing
From each suite of samples, four cores were selected at random for mechanical testing, including one core which had been measured for water permeability (Sect. 2.1.6). Uniaxial compressive strength (UCS) tests were performed on three dry cores and one saturated core from each sample group using a 100 kN Instron 8862 uniaxial press with FastTrack 8800 tower and Instron Dynacell 2527 load cell in the Experimental Volcanology and Geothermal Research Laboratory at the University of Liverpool. Two ceramic piezoelectric transducers (PZTs) were attached on the samples during testing (described in Sect. 2.2.4). A constant compressive strain rate of 10−5 s−1 was used for testing (after ASTM, 2014), with load and axial displacement recorded at a rate of 100 Hz. The Bluehill® 3 software was used to compute compressive stress and strain (ε) during deformation using sample dimensions. The end of each experiment was defined by a stress drop exceeding 20 % of the monitored normal stress. All mechanical data were corrected for the compliance of the set-up at the relevant experimental deformation rate. Following Coats et al. (2018), Young's modulus was calculated from the linear elastic portion of the stress–strain curve picked using an automated script written in MATLAB (Coats, 2018).
2.2.2 Brazilian disc testing
From each suite of samples, four discs were selected at random for mechanical testing. The Brazilian disc method to determine indirect tensile strength (UTS) was performed on three dry discs and one saturated disc from each sample group using the same 100 kN Instron 8862 uniaxial press with FastTrack 8800 tower and Instron Dynacell 2527 load cell. Two ceramic piezoelectric transducers (PZTs) were attached on the samples during testing (described in Sect. 2.2.4). In these tests, the disc-shaped specimens were loaded diametrically on flat loading platens. Methods and standards utilised for Brazilian disc testing vary in terms of deformation and loading rate as well as time to failure (ISRM, 1978; ASTM, 2008; Li and Wong, 2013; Hornby et al., 2019); here, we adopt the approach of Lamb et al. (2017), using an equivalent diametric strain rate of 10−5 s−1, which conforms to the ASTM (2008) recommended time to failure (1–10 min). All mechanical data were corrected for the compliance of the set-up at the relevant experimental deformation rate. The Bluehill® 3 software was used to monitor axial displacement and load (N) at 100 Hz, and the conversion to tensile stress (σt) was made in real time as follows:
where d is diameter, and l is thickness (length) of the disc (ISRM, 1978). The end of each experiment was defined by a stress drop exceeding 20 % of the calculated stress.
2.2.3 Interrelation of mechanical properties
As the compressive and tensile strength and Young's modulus of rocks all show a dependence on porosity (as has been well-documented in the literature; e.g. Lavallée and Kendrick, 2020; Heap et al., 2020, and references therein), we define the interrelation of these parameters to provide useful first-order constraints of material properties as a function of porosity. We do so by employing least squares regressions to ascribe power law relationships to compressive strength, tensile strength, and Young's modulus as a function of porosity of the eruptive products. We then combine these equations to define the interrelation of each parameter and to express their evolving relationships as a function of porosity. We limit our analysis to the porosity range examined here (between the 1st and 99th percentile), and we add the caveat that these relationships are likely to be lithologically dependent due to the textural and microstructural nature of materials (Lavallée and Kendrick, 2020), yet they are likely to be broadly applicable to glassy, porphyritic volcanic rocks.
2.2.4 Acoustic emissions – passive
Two ceramic piezoelectric transducers (PZTs) were attached on the samples during both UCS and UTS tests. In the UCS set-up, PZTs were housed within specially machined spring-loaded platens that allowed direct contact at the ends of the sample cores, whereas in the UTS set-up transducers were placed on diametrically opposing edges of the Brazil discs, perpendicular to the direction of axial loading (see Fig. S1 in the Supplement). The sensors monitored acoustic emissions (AEs) released during deformation at a sampling rate of 1 MHz. These signals were first fed through 20 dB amplifiers before reaching a PAC PCI-2 two-channel recording system with a bandwidth of 0.001–3 MHz, allowing hit-based collection and waveform streaming. For each experiment, the timing and energy of each event were recorded. AEs generated by pulsing were excluded (see Sect. 2.2.5), and the energy of each hit was calculated using the root mean square of the recorded waveform following the method of Lamb et al. (2017).
The acceleration of acoustic emission rate was assessed by fitting Poisson point process models to the first 75 % of the event time series (after this point, the quick succession of events hinders distinction and can lead to artificial reduction of event rate) for each experiment (excluding events below an amplitude of −3.3). The model assumed an exponential acceleration (after Voight, 1989) in the rate of acoustic emissions with time:
where the parameter k relates to the absolute amplitude of the acceleration, and λ is the exponential rate parameter. For this analysis only dry tests were used, as it proved impossible to isolate only passive AE events for saturated samples. Models were fitted using a Bayesian Markov chain Monte Carlo (MCMC) method (Ignatieva et al., 2018; Bell et al., 2018; Bell, 2018), and model parameters (k and λ) were reported as the maximum a posteriori values. The frequency amplitude distribution of the AEs from each test were plotted, and from this the b value for each experiment was calculated using the maximum-likelihood method (after Roberts et al., 2015). In addition, the b value was determined for each third of the test to examine evolution (Δb) during deformation.
2.2.5 Active surveys
In addition to passive monitoring of acoustic emissions, active surveys were conducted, in which one PZT was set to produce “pulses” for the entire experiment duration while the other PZT recorded the pulses after they travelled through the sample. The pulses were released in “bursts” of five events, spaced 0.5 s apart, and triggered every 5 s. Following the method of Lamb et al. (2017), the received bursts were stacked to increase the signal-to-noise ratio, and coda wave interferometry (CWI) was applied to the stacks. This method utilises the degree of correlation between stacked waveforms at different time intervals compared to the reference (here the first stacked pulse) to calculate the variance of the travel time perturbation and, thus, to provide a proxy for relative change in velocity during the experiment (for further details of the method, see Lamb et al., 2017).
3.1 Textures, microstructures, and mineralogy
The dacitic samples were deposited by block-and-ash flows during growth and collapse of the lava dome during the 1990–1995 Heisei eruption of Mount Unzen (e.g. Sato et al., 1992). The lavas are porphyritic and partially glassy, and they show variability in crystallinity, textures, and microstructures (Figs. 2, 3). The porous networks are comprised of connected cracks and vesicles frequently concentrated around phenocrysts (Figs. 2, 3a–e). Despite local heterogeneities, the pore network is relatively isotropic in samples UNZ1, UNZ13, and UNZ14 (Figs. 2 and 3a, b, and e respectively), whereas the sample block selected due to the presence of cataclastic banding (UNZ9) observable in the hand specimen (Fig. 2) shows strongly anisotropic pore structures (Fig. 3c, d). Texturally UNZ1 and UNZ13 are similar (Fig. 3); both samples show pores up to a few millimetres in size either adjacent to or completely bounding crystals, and the groundmass hosts sub-rounded vesicles which are slightly more abundant in UNZ13, leading to the UNZ1 groundmass appearing denser. The UNZ1 groundmass hosts occasional narrow fractures (from zero to tens of micrometres) that traverse the dense areas, extending up to 5 mm and connecting phenocrysts (Fig. 3). Sample UNZ14 has notably fewer vesicles, and again, fine cracks (here finer than in UNZ1, typically <10 µm) that are more abundant and of greater length-scale (occasionally >10 mm) than in UNZ1, which traverse dense areas of groundmass, and pass along crystal margins (Figs. 2, 3). In block UNZ9 the cataclastic fabric was cored in two orientations to produce sample UNZ9a parallel to the fabric and UNZ9b perpendicular to the fabric (Figs. 2, S1). The thin sections represent a core of each cut vertically (UNZ9a in Fig. 3b and g, UNZ9b in Fig. 3c and h) to highlight the fabric with respect to compression direction in later strength tests (note that the Brazil discs are diametrically compressed). The UNZ9 samples comprise variably porous cataclastic bands with fragmental phenocrysts (Figs. 2, 3). Thus, porosity is anisotropically distributed across denser and more porous bands, although still typically focused around crystals, here often crystal fragments, and is similarly distributed to the porosity of UNZ1.
The samples have large (often >3 mm) phenocrysts (Fig. 3f–j) which are easily identifiable in the hand specimen (Fig. 2), the largest and most abundant of which are plagioclase (>25 vol %), followed by amphiboles (∼5 vol %) and frequently fractured biotites (∼5 vol %) with smaller and more infrequent quartz and pyroxenes (each <2 vol %), with the same minerals also forming microphenocrysts (Fig. 3), as has previously been described for Unzen lavas (e.g. Nakada and Motomura, 1999). The glassy groundmass hosts microlites of 10–100 µm of plagioclase, pyroxene, quartz, pargasite, and iron-titanium oxides that make up approximately 30 vol %, in keeping with previous observations of groundmass crystallinity, which slowly increased from ∼30 to ∼50 vol % throughout the eruption (Nakada et al., 1995; Nakada and Motomura, 1999). The cataclastic bands of sample UNZ9 host angular fragments of crystals, some of which are retained in fragmental lenses of single minerals (Fig. 3g, h), the relics of grain size reduction compared with the pristine lavas of UNZ1, UNZ13, and UNZ14 (Figs. 2, 3), as has been noted in other conduit fault zone products at Mount Unzen (e.g. Wallace et al., 2019).

Figure 3Images of thin sections in reflected light with a UV filter (a–e) and plane-polarised light (f–j) showing the range of textures of the tested materials: (a) UNZ1 has pore space concentrated around phenocrysts, occasional sub-rounded vesicles, and a relatively dense groundmass that hosts occasional fractures of 0–20 µm width, up to ∼2 mm in length; (b) UNZ9a hosts pore space concentrated in laterally extensive bands in the orientation of cataclastic fabric observable in the hand specimen (vertical), which are interspersed by denser bands, pores border angular fragmental crystals; (c) UNZ9b shows the same textures as in UNZ9a, here orientated horizontally, and fine fractures are additionally visible within the groundmass and broken phenocrysts (note the large rounded black patch in the centre is a poorly impregnated pore, not a sub-rounded phenocryst); (d) UNZ13 has distinguishing sub-rounded vesicles in the groundmass and concentrated around phenocrysts, phenocrysts occasionally host a number of very fine fractures (note the large rounded black patch at the top right is a poorly impregnated pore); (e) UNZ14 shows smaller pores more distributed but still localised adjacent to phenocryst, occasional thin (<10 µm) fractures of up to ∼10 mm propagate through the groundmass connecting phenocrysts, which themselves are highly fractured (with hairline fractures). Transmitted light images (f–j) allow the identification of plagioclase (Pl, >25 vol %), amphibole (Am, ∼5 vol %), biotite (∼5 vol %), and pyroxene (Px, <2 vol %) phenocrysts and microphenocrysts (quartz is present but not shown), and glassy groundmass with microlites of plagioclase, pyroxene, quartz, amphibole, and iron-titanium oxides of 10–100 µm (∼30 vol %). Plagioclases show occasional zoning (i) and concentric bubble trails (f and j). The cataclastic samples UNZ9a (g) and UNZ9b (h) additionally have broken crystals, most frequently plagioclase that forms trails parallel to elongate porosity-rich bands, and the groundmass shows heterogeneously distributed light and dark zones.
3.2 Porosity and porosity variability
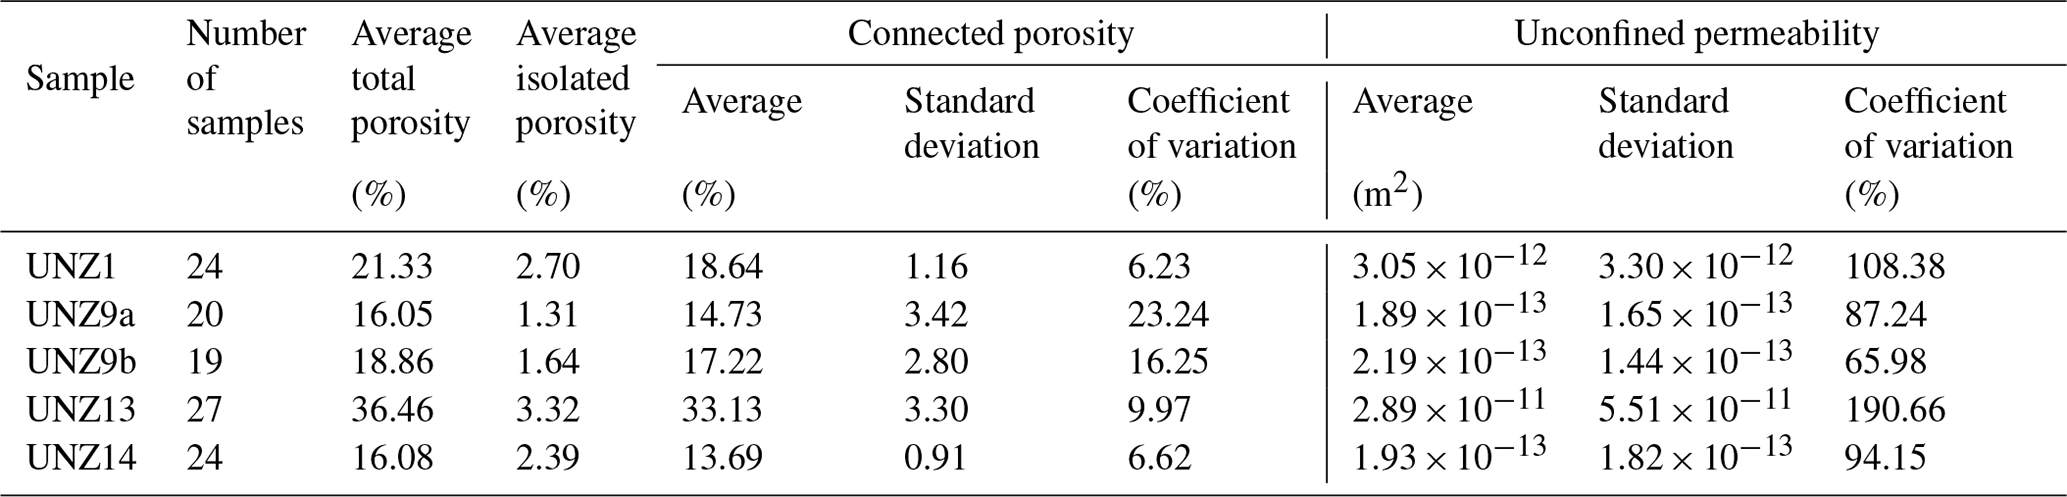
Across the suite of 114 samples, total porosity determined by helium pycnometry ranged from 9.14 % to 42.81 %, with a significant range observed within each sample group (see Tables 1 and S1 in the Supplement). The average total porosity for each sample group spanned a narrower range of 16.05 % to 36.46 %, ranking the samples as follows from least to most porous: UNZ9a, UNZ14, UNZ9b, UNZ1, and UNZ13 (Table 1). Density ranged from 1.54 to 2.40 g cm−3 (Table S1), closely matching previously constrained densities of the eruptive products of 1.6–2.4g cm−3 with bimodal distribution (Kueppers et al., 2005). The solid density of the five sample types spanned a narrow range of 2.64–2.67 g cm−3, representing the similarity in constituent phases of the lavas. The degree of isolated porosity ranged from 0.39 % to 5.37 % and was variable within a single sample group, typically with a minor increase with increasing total porosity (Fig. 4a, Tables 1 and S1), as has been previously observed for the eruptive products at Mount Unzen (Coats et al., 2018). Notably, the anisotropic samples (UNZ9a and UNZ9b) had higher connectivity (lower isolated porosity; Table 1) than isotropic samples with similar porosity (fall closer to the 1:1 line in Fig. 4a). Connected porosity of the 114 samples ranged from 7.47 % to 40.12 %, and averages of each of the five sample groups ranged from 13.69 % to 33.13 %, ranking the samples by connected porosity (note the difference to the ranking in total porosity) as follows from least to most porous: UNZ14, UNZ9a, UNZ9b, UNZ1, and UNZ13 (Table 1). The standard deviation within a single sample group was generally higher for higher porosity. Variability within each sample group can be better evaluated by considering the coefficient of variation; the isotropic samples (from least to most porous; UNZ14, UNZ1, and UNZ13) have lower coefficients of variation (6.62 %, 6.23 %, and 9.97 % respectively), whereas the anisotropic samples (UNZ9a and UNZ9b) have higher coefficients of variation (23.24 % and 16.25 % respectively). Porosity constrained here closely matches (and spans the range of) lavas previously measured for the 1990–1995 dome eruption (e.g. Coats et al., 2018; Cordonnier et al., 2009; Hornby et al., 2015; Kueppers et al., 2005; Wallace et al., 2019).
Table 1Sample (core and disc) porosity and unconfined permeability overview.
3.3 Permeability
3.3.1 Unconfined permeability and permeability variability
A handheld minipermeameter was used to estimate the permeability of cores and discs as well as to assess local variations using up to 10 measurements on different parts of the sample surface. The range of all 1065 measurements spanned to m2 with standard deviations of permeability of up to m2 within a single core or disc, corresponding to a coefficient of variation of up to 259 % (see Table S1; note that where the coefficient of variation was less than 10 % after five measurements, no further measurements were made). Considering the 114 samples, the averaged permeability of cores and discs ranged from to m2 (Fig. 4b shows the 1065 individual measurements made on 114 samples as well as the averages for each core or disc used for further testing). The permeability shows a positive correlation with porosity. The average permeability may span >2 orders of magnitude for a given porosity, yet despite the large scatter of permeability, the distinct grouping of the sample suites (i.e. UNZ1, UNZ9a, UNZ9b, UNZ13, and UNZ14) is clearly observable (Fig. 4b). Notably, permeability is lower for the macroscopically anisotropic sample UNZ9b than for the macroscopically isotropic sample UNZ1 of similar porosity, although no such discrepancy is noticed with macroscopically isotropic UNZ14 which spans overlapping ranges of porosity and permeability (Fig. 4b, Table S1).
We additionally used the permeability of each core and disc to collate the average permeability, standard deviation, and coefficient of variation of each sample group (Table 1). Interestingly, the permeability of the anisotropic samples cut parallel (UNZ9a) and perpendicular (UNZ9b) converge to similar averages despite plotting somewhat distinctly in porosity–permeability space (Fig. 4b). The standard deviation and coefficient of variation of permeability are notably higher for the most porous, permeable sample UNZ13 (Table 1), which also has the largest absolute range in connected porosity of more than 15 % (Fig. 4b, Table S1). The anisotropic samples have the lowest coefficients of variation of permeability, despite having the largest coefficient of variation of porosity (Table 1).
Table 2Planar block surface unconfined permeability estimates for isotropic (UNZ14) and anisotropic (UNZ9) blocks with values compared to those determined on core and disc samples (note that the UNZ9 core and disc measurements encompass those made on UNZ9a and UNZ9b).
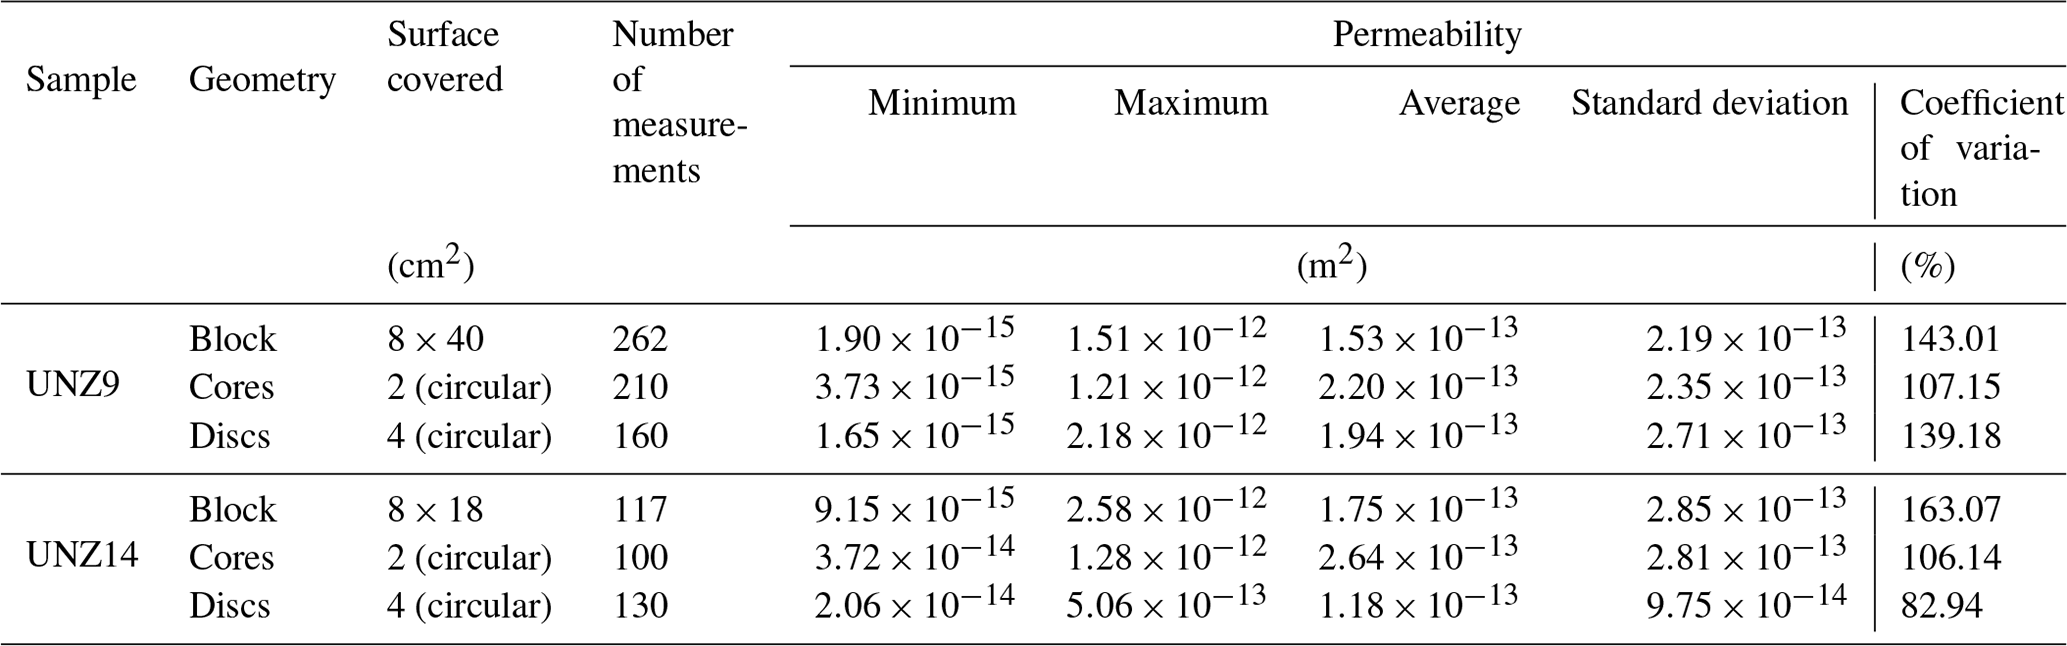
As a final measure of permeability variation within the sample groups and to compare variations across the sample to block scale, we additionally performed 379 permeability measurements across the planar surfaces of the dissected sample blocks UNZ9 and UNZ14. The macroscopically anisotropic block UNZ9 was cut perpendicular to the direction of the cataclastic fabric (and, thus, is geometrically equivalent to the sample group UNZ9a), whereas UNZ14 is macroscopically isotropic. Despite their textural differences, the average porosity and permeability of the two sample groups (Table 1; Fig. 3a, b) described above (determined on cores and discs) are very similar. An additional 262 measurements were made for sample UNZ9 and 117 for sample UNZ14 (Tables 2, S2; Fig. S2). The averages for block surface permeability measurements for UNZ9 and UNZ14 were m2 and m2 respectively. The permeability of UNZ9 spans a slightly broader range, almost 3 orders of magnitude, although the higher number of measurements for UNZ9 ensures a similar standard deviation and coefficient of variation for each suite (Table 2). In exploring the role of sample size on permeability determination using the TinyPerm II minipermeameter, we also note that the measurements made on the block surfaces produce very similar minimum, maximum, and average permeabilities to the measurements made on cores and discs (Table 2). Standard deviations are also comparable across the different sample geometries, with only coefficients of variation showing a minor reduction at the sample as opposed to the block scale.
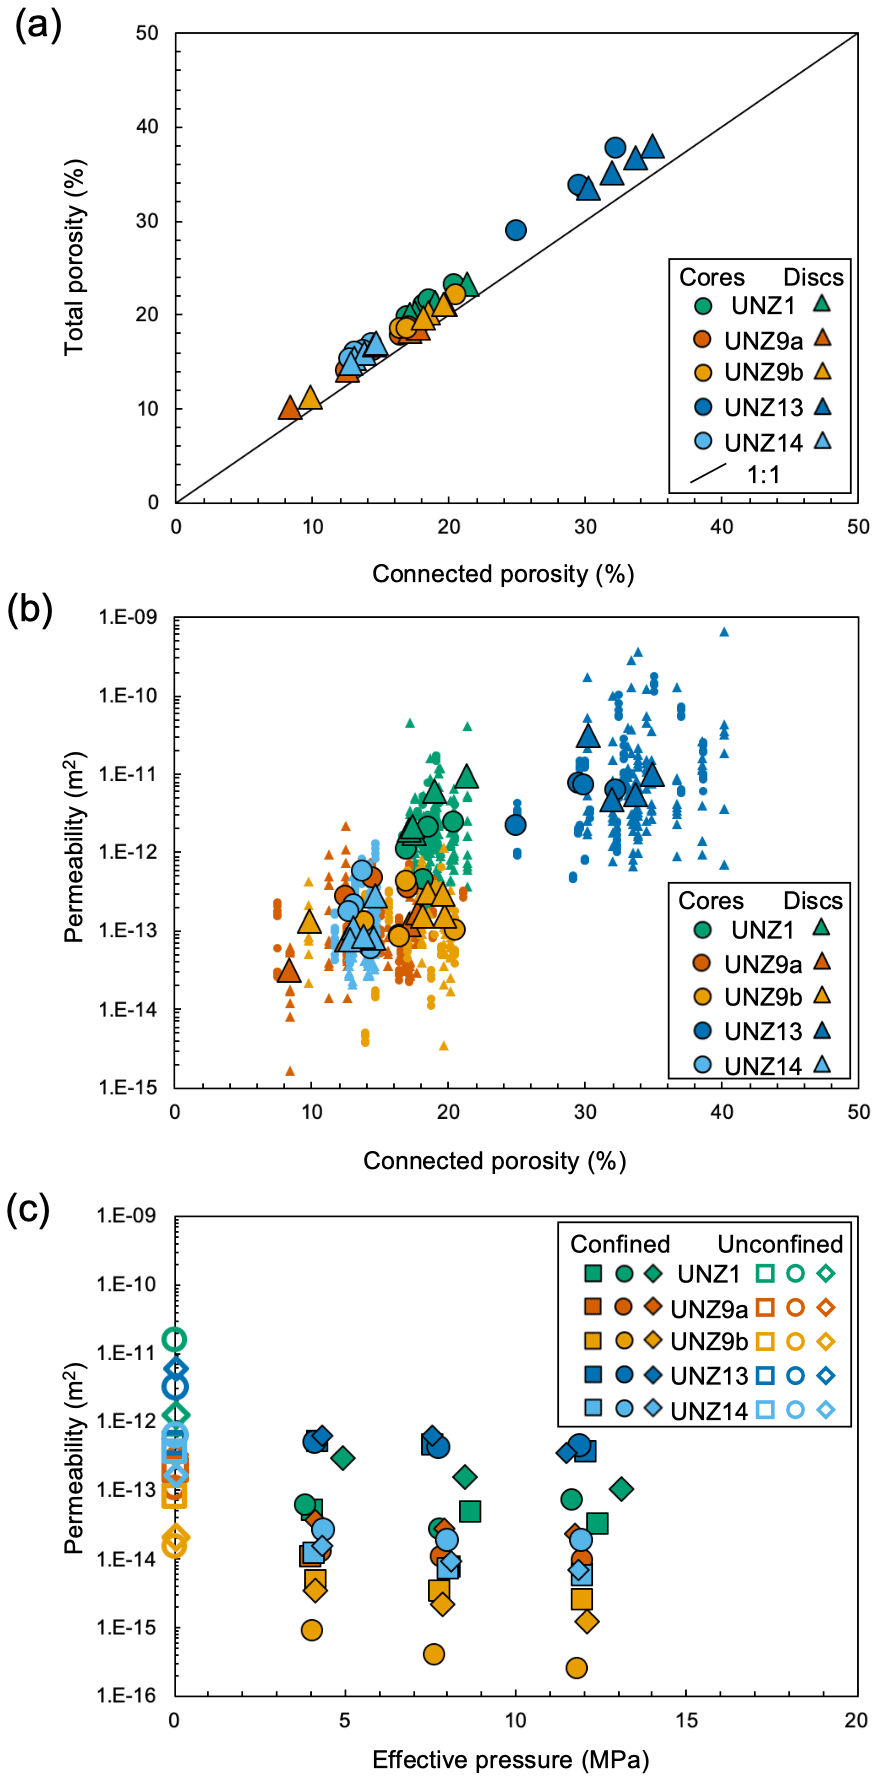
Figure 4Physical attributes of tested dacite samples: (a) total versus connected porosity for the core and disc samples chosen for mechanical testing (complete dataset available in Table S1) with the 1:1 line highlighting the degree of connectivity; (b) unconfined permeability as a function of connected porosity showing 1065 individual measurements of cores and discs (small symbols; see Table S1) measured using a gas minipermeameter overlain by the average permeability of the samples selected for mechanical testing (large symbols); (c) unconfined and confined permeability as a function of effective pressure for three cores of each material, unconfined permeability estimates correspond to those in panel (b) and confined measurements use water as the pore fluid in a pressure vessel (also plotted as a function of porosity in Fig. S3).
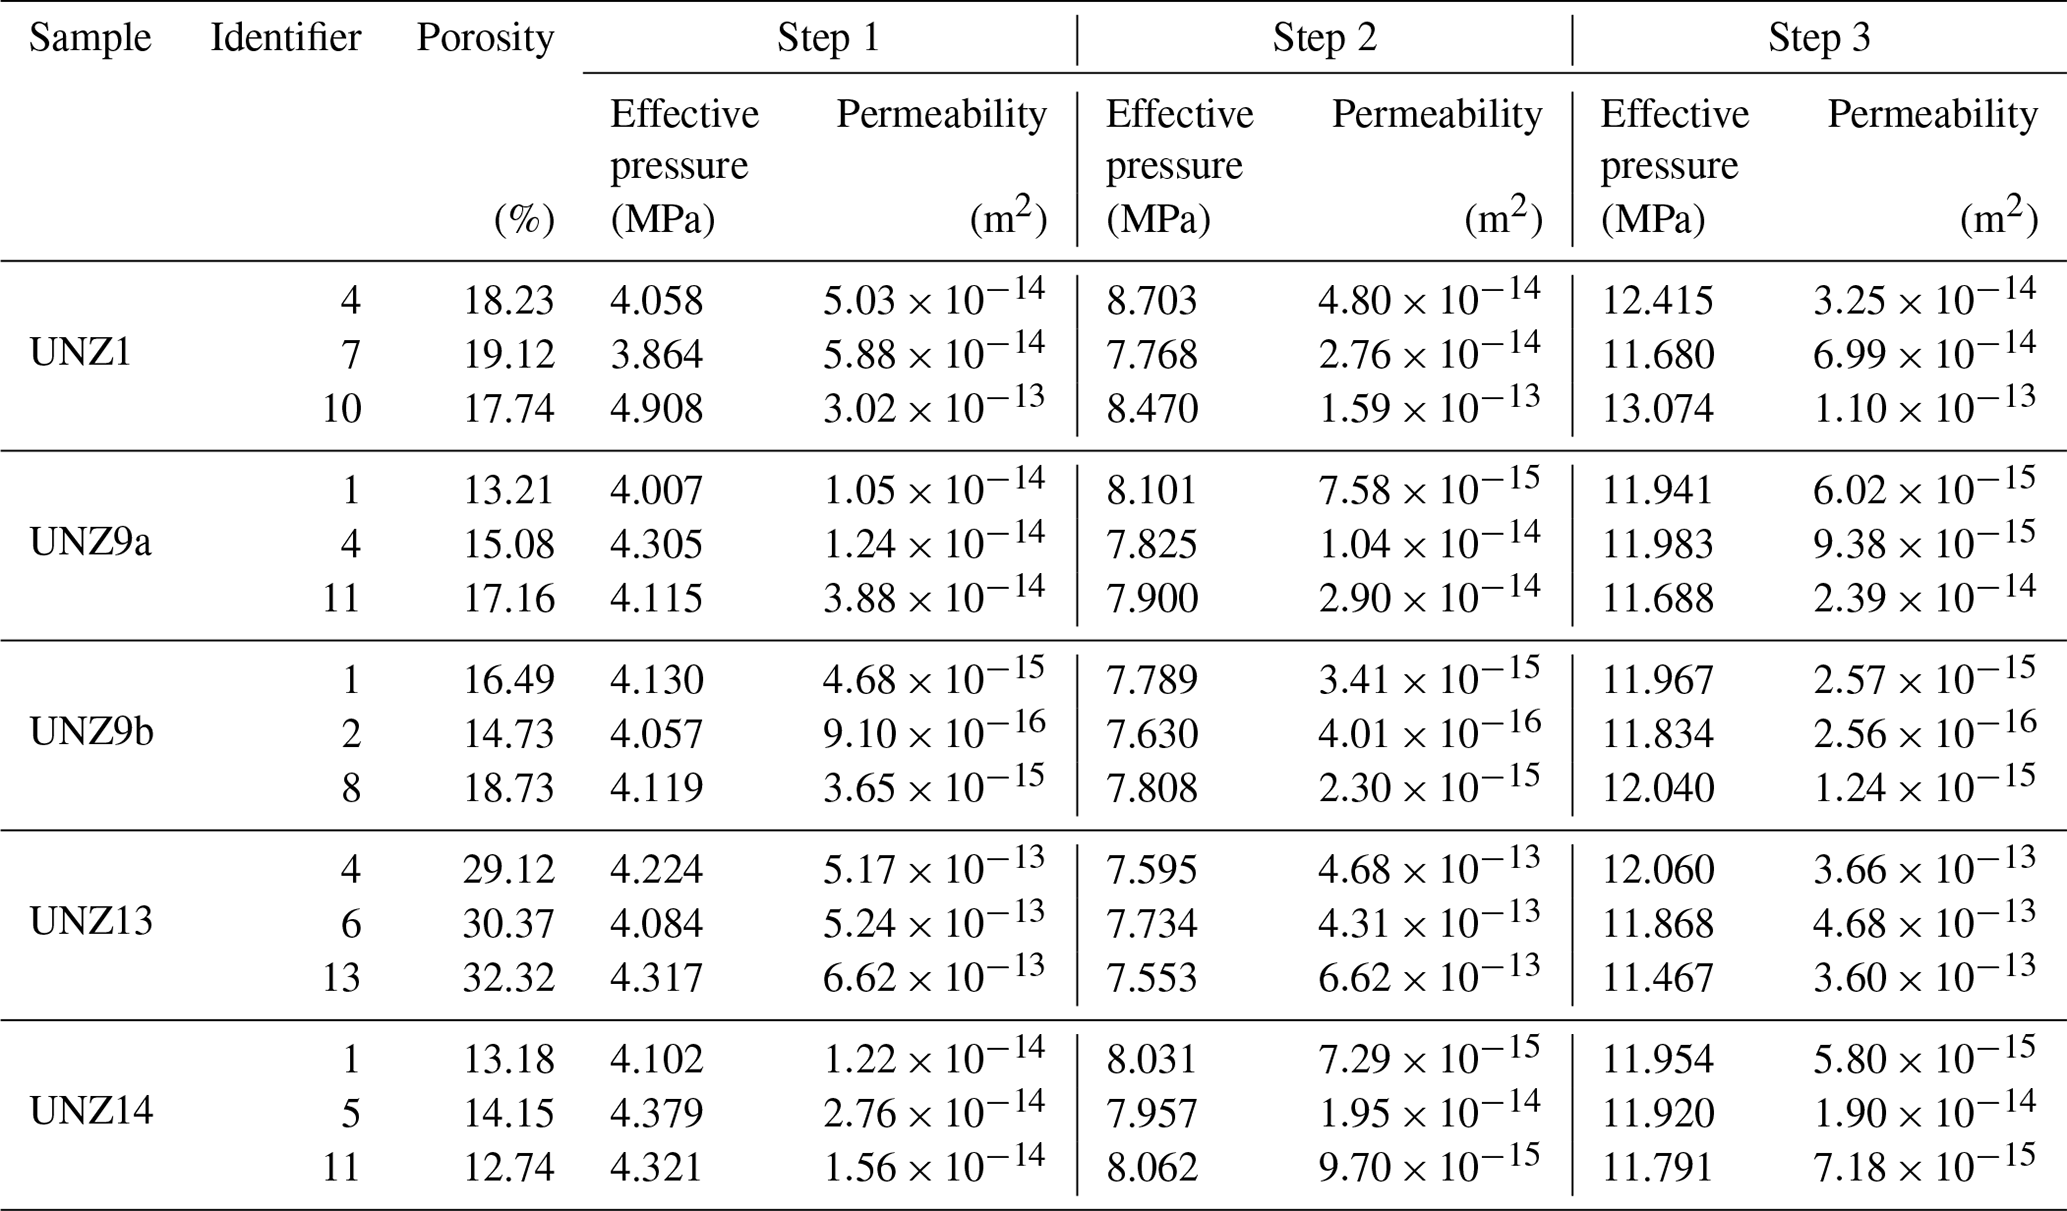
3.3.2 Permeability as a function of effective pressure
Permeability was measured for three samples from each group at three increments of confining pressure and, hence, effective pressure (Fig. 4c; Tables 3, S3). The permeability at the first increment of ∼4 MPa is 1 to 2 orders of magnitude lower than the gas permeability at atmospheric pressure conditions for all samples (Sect. 3.3.1) and further decreases with increasing effective pressure (Fig. 4c, Table 3). Here, the lowest permeability samples, with porosity comprised primarily of microfractures (Fig. 1), are most sensitive to effective pressure, with the largest reductions in permeability seen in samples UNZ1 and UNZ9b (Fig. 4c). Similarly to the unconfined measurements, the most permeable samples at each effective pressure are isotropic UNZ13, followed by isotropic UNZ1, isotropic samples UNZ14 are again very similar to UNZ9a, and the least permeable samples are UNZ9b. Thus, the cores cut parallel to the cataclastic fabric (UNZ9a) are significantly more permeable than those cut perpendicular (UNZ9b), with a difference of more than an order of magnitude which was not noted in the unconfined permeability values (Table 1) due to the nature of pore pressure dissipation during surface measurements with minipermeameters.
3.4 Mechanical data
3.4.1 Strength in dry and water-saturated conditions
Stress–strain curves for all uniaxial compressive strength (UCS) tests and Brazilian disc indirect tensile strength (UTS) data are shown in Fig. 5. The UCS of dry samples ranged from 13.48 to 47.80 MPa and was dominantly controlled by porosity (Fig. 6a), as has been previously observed for Mount Unzen lavas (Coats et al., 2018) and other geomaterials. Using the average of three tests, the highest compressive strength (44.81 MPa) was the least porous sample UNZ14, and the lowest compressive strength (17.69 MPa) was the intermediate porosity sample UNZ1 (Figs. 5a–e, 6a; Table 4). The standard deviation and coefficient of variation of UCS were highest in anisotropic UNZ9b and lowest in the weakest sample, UNZ1 (Table 4).
Table 4Sample mechanical properties under dry and saturated conditions.
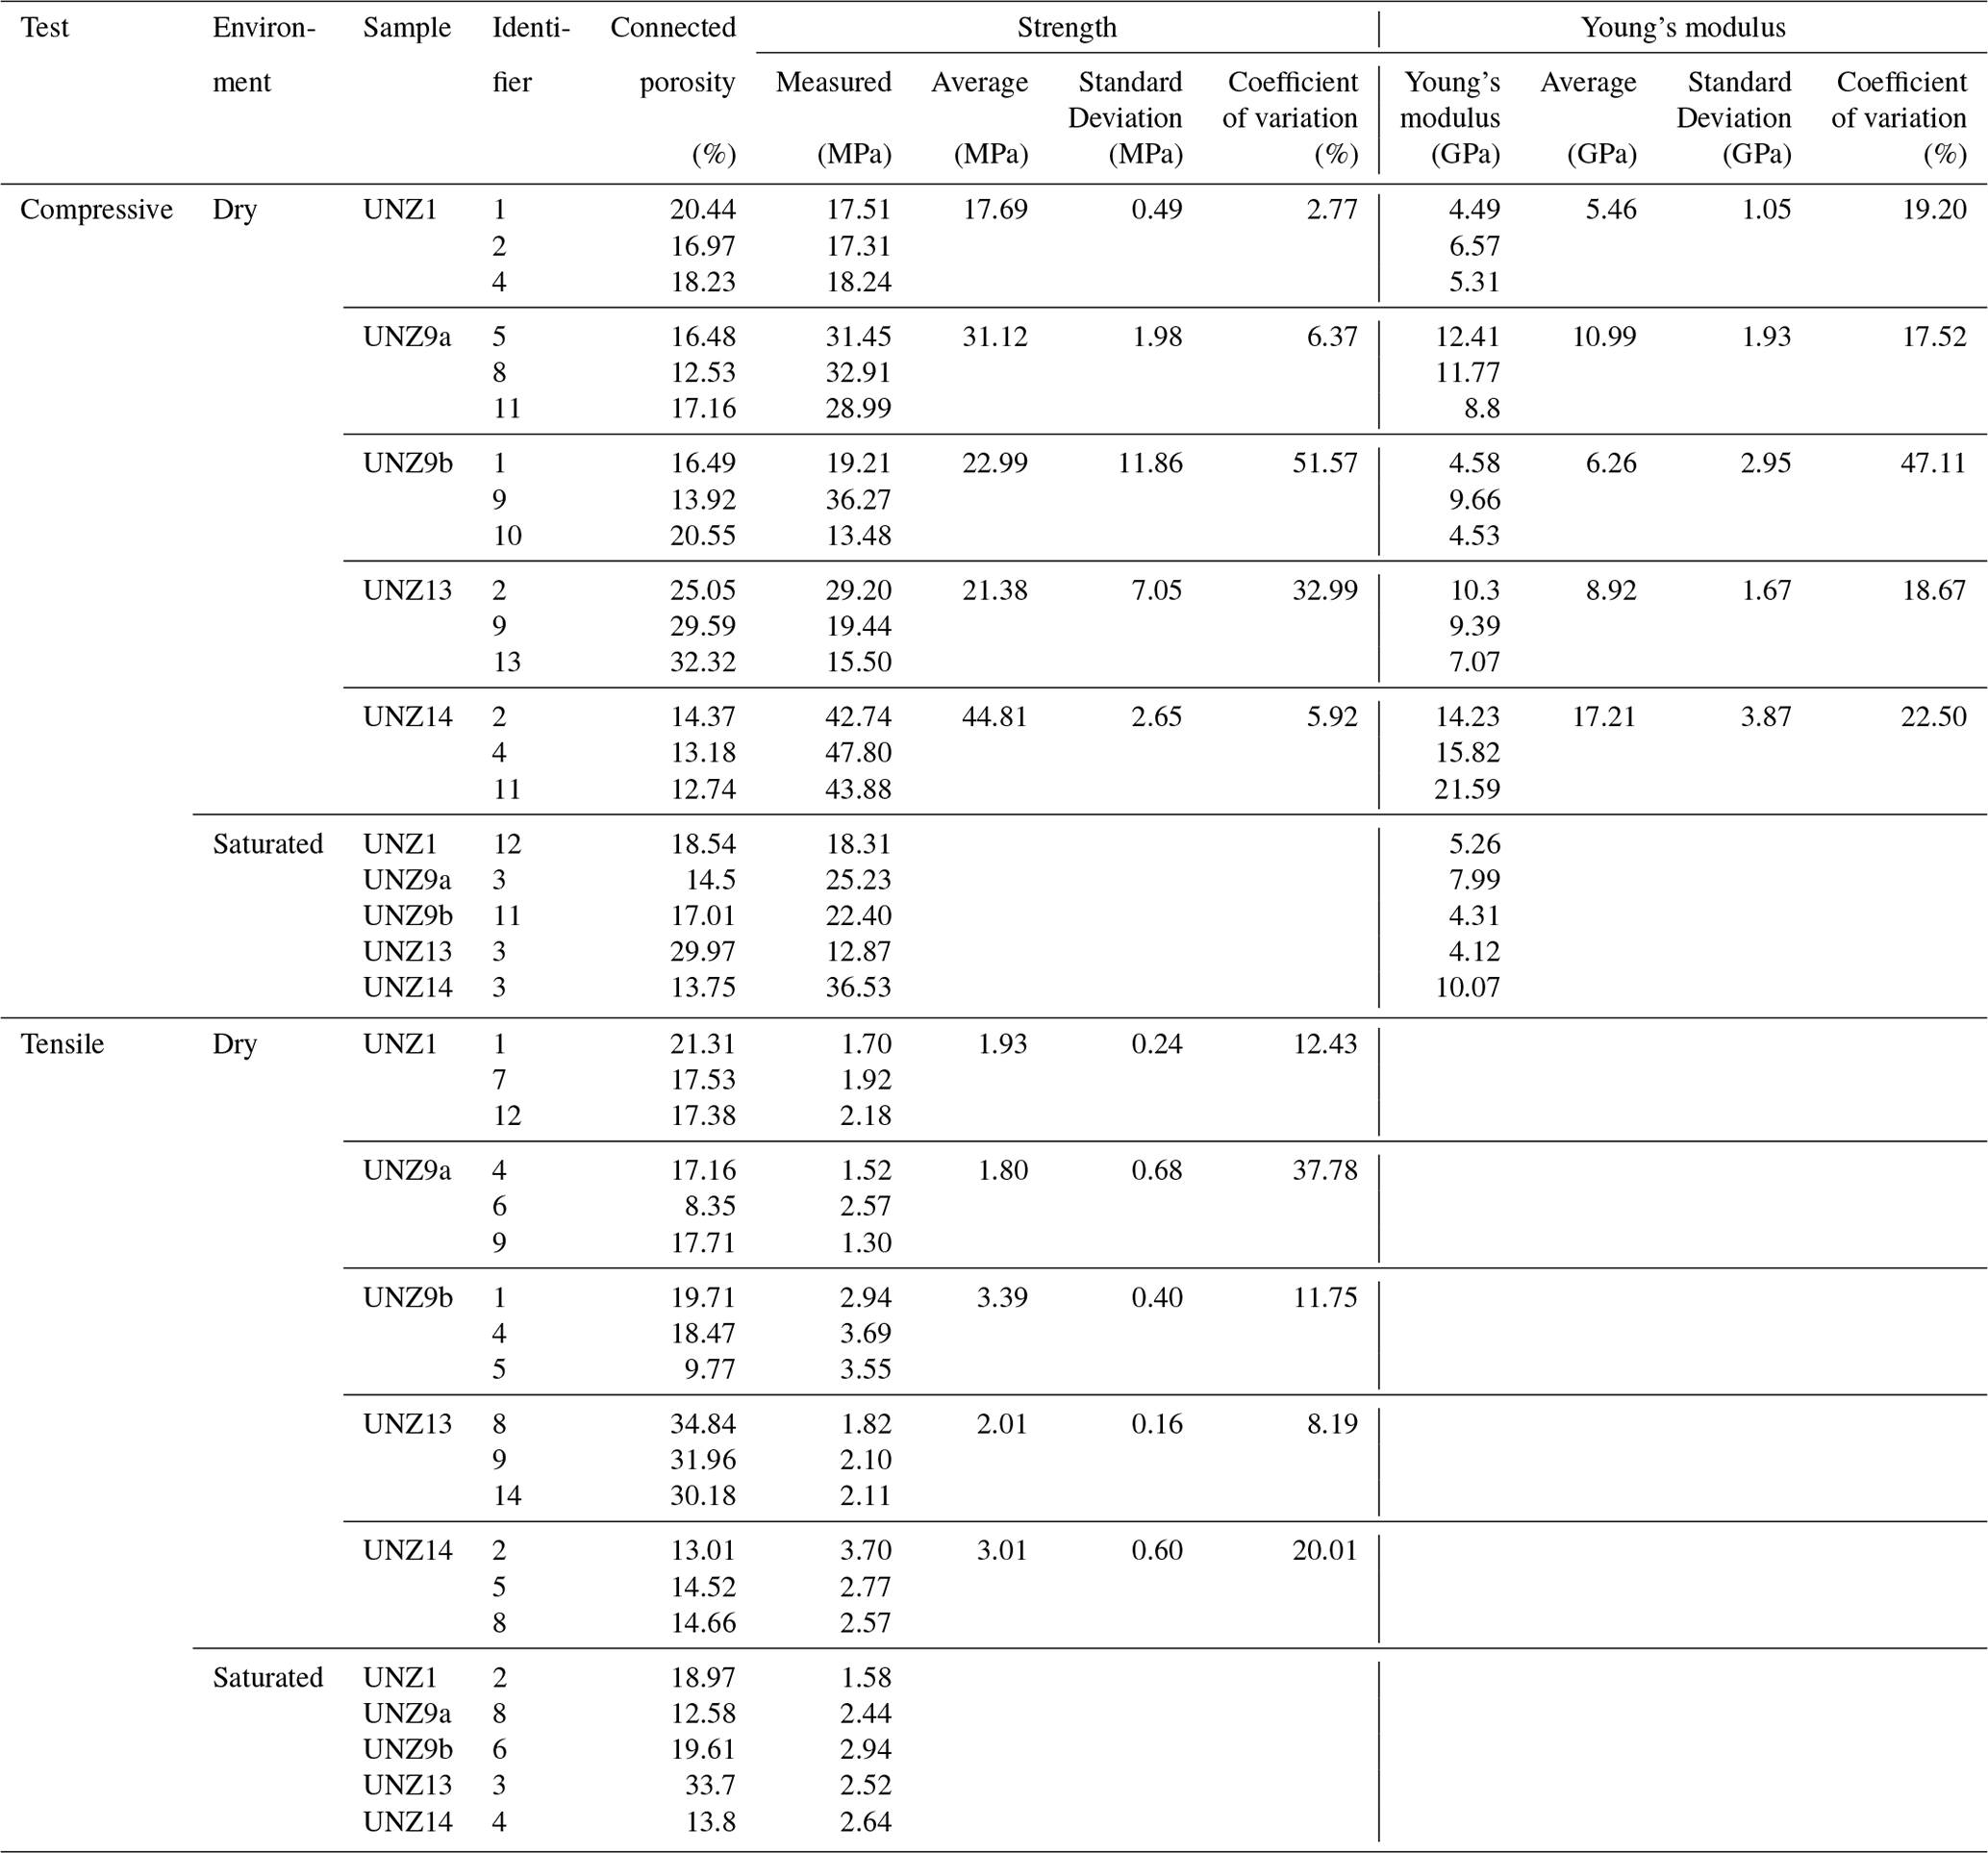
The water-saturated UCS tests showed that four of the five sample groups had lower saturated compressive strength than the average of the dry tests, and three of the five groups were lower than any of the dry tests of their respective sample group (Fig. 5a–e, Table 4), indicating a slight decrease in UCS in saturated conditions (Fig. 6b). We do, however, caution that relatively high variability is observed across the sample suite, and as such, the saturated tests are only indicative of the impact water saturation may have on strength. Sample UNZ14 remained the strongest sample in compression in saturated conditions, but the most porous sample UNZ13 was the weakest of the saturated samples, unlike at dry conditions (Fig. 5a–e).
The UTS of dry samples ranged from 1.30 to 3.70 MPa and had significant variability as a function of porosity (Fig. 6a); using the average of three tests, the highest tensile strength (3.39 MPa) was for UNZ9b, the cataclastic sample cored perpendicular to the cataclastic fabric (note that as the sample is diametrically compressed, compression of the Brazilian disc is parallel to the plane of the fabric and the tensile rupture is also parallel; see Figs. 2 and S1), and the lowest (1.80 MPa) was for UNZ9a, the cataclastic sample cored parallel to the fabric (note that as the sample is diametrically compressed, compression of the Brazilian disc is also parallel to the fabric and the tensile fracture development is, thus, perpendicular; see Figs. 2 and S1), despite their similar porosity (Figs. 5f–j, 6a; Table 4). The standard deviation and coefficient of variation of UTS were highest in the weakest sample, anisotropic UNZ9a, and lowest in isotropic UNZ13 (Table 4).
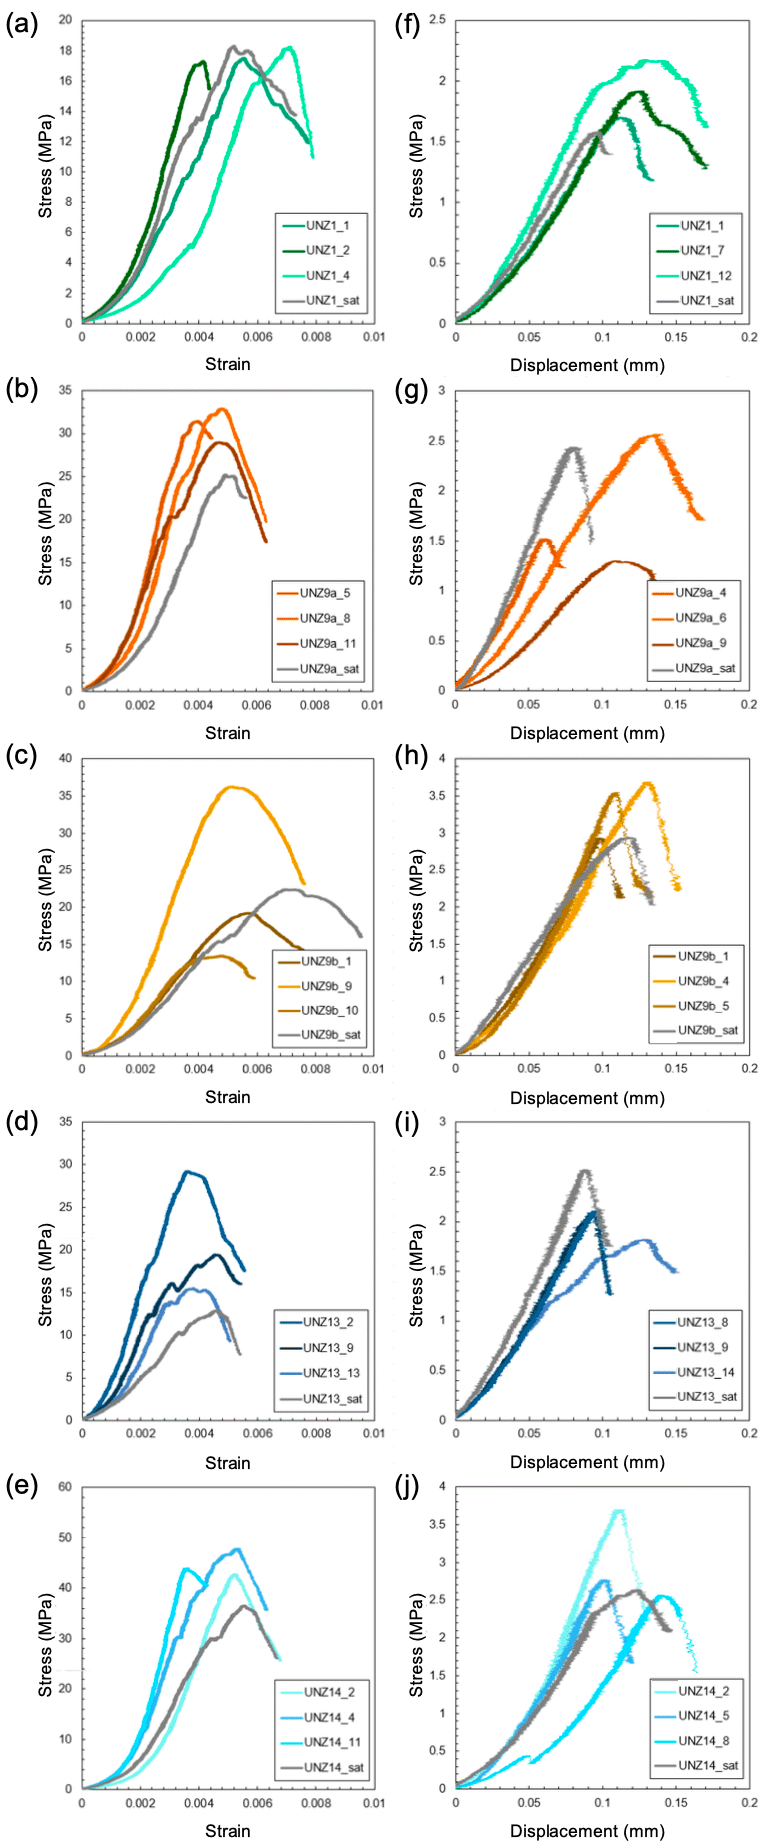
Figure 5Stress–strain curves for uniaxial compressive strength (UCS) tests under dry and saturated conditions on samples (a) UNZ1, (b) UNZ9a, (c) UNZ9b, (d) UNZ13, and (e) UNZ14, and stress–displacement curves for indirect tensile strength testing (UTS) using the Brazilian disc method on samples (f) UNZ1, (g) UNZ9a, (h) UNZ9b, (i) UNZ13, and (j) UNZ14. Note the differing scales. Curves are characterised by initial upwards-concave portions of pore closure, a linear elastic portion and transition to strain hardening, damage accumulation prior to yielding, and failure (stress drop).
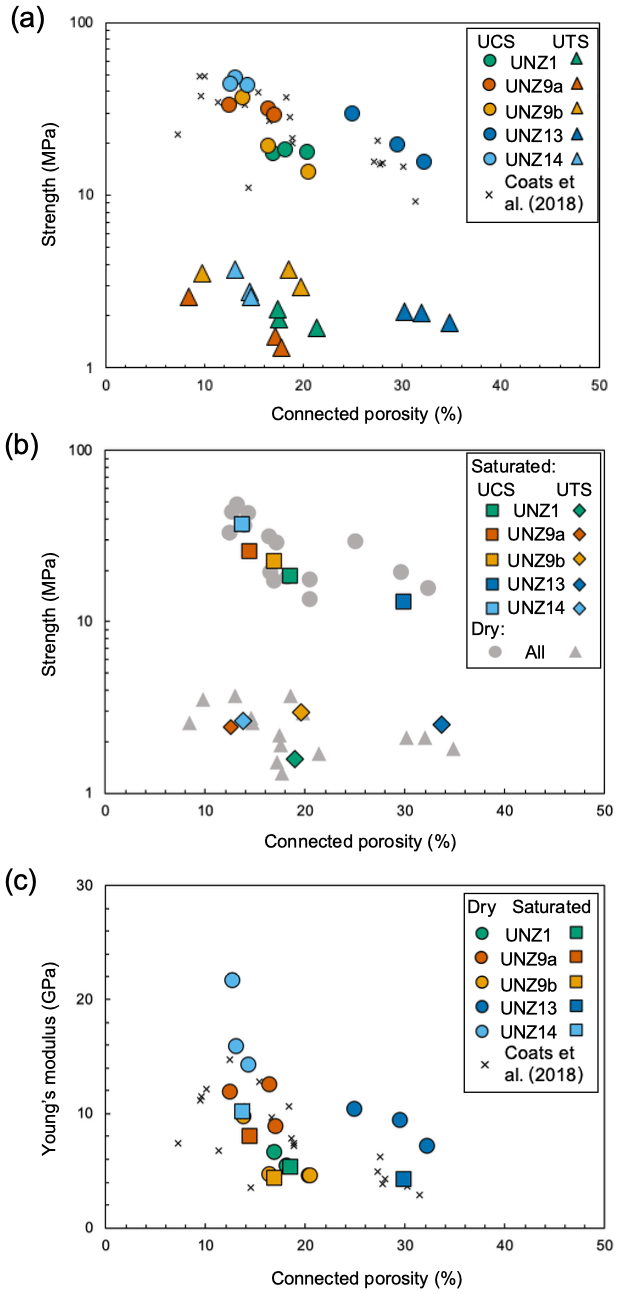
Figure 6Mechanical data for (a) dry compressive (UCS) and tensile (UTS) strength tests, plotted with comparable tests on Unzen dacite from Coats et al. (2018), as a function of connected porosity; (b) saturated tests of compressive (UCS) and tensile (UTS) strength as a function of connected porosity, with dry tests from panel (a) plotted in greyscale for comparison; (c) Young's modulus calculated from UCS data for dry and saturated samples, plotted with comparable measurements from Coats et al. (2018), as a function of connected porosity.
Sample UNZ9b remained the strongest sample in tension in saturated conditions, but the intermediate porosity sample UNZ1 was the weakest of the saturated samples, unlike at dry conditions (Fig. 5f–j). The saturated UTS tests showed that three of the five sample groups had lower saturated tensile strength than the average of the dry tests, but one of the five was higher than any of the dry tests of their respective sample group (Fig. 5f–j; Table 4), indicating no systematic change in UTS under saturated conditions (Fig. 6b), although high sample variability may obscure the impact of water saturation on tensile strength.
3.4.2 Young's modulus in dry and saturated conditions
The Young's modulus of dry samples ranged from 4.49 to 21.59 GPa, and, similarly to UCS, showed a broadly negative correlation with porosity (Fig. 6c) similar to previous tests on Mount Unzen lavas (Coats et al., 2018). Using the average of three tests, the highest Young's modulus (17.21 GPa) was for the least porous, highest UCS sample UNZ14, and the lowest Young's modulus (5.46 GPa) was for the intermediate porosity, weakest sample UNZ1 (Table 3). The standard deviation of Young's modulus was highest in the strongest sample UNZ14 and lowest in weakest sample UNZ1, yet the coefficient of variation of Young's modulus was highest in intermediate strength, anisotropic UNZ9b and very similar in the other samples (Table 3). The Young's modulus was systematically reduced in all saturated compression tests (Fig. 6c, Table 4), although variability within sample groups was high in dry conditions.
3.5 Interrelation of mechanical properties
Compressive and tensile strength and Young's modulus of geomaterials depend largely on porosity; as such, we examine the interrelation of these parameters to provide first-order constraints of one parameter from another.
3.5.1 Porosity, compressive, and tensile strength
Considering each sample group, we find that UCS is between 6.8 and 17.3 times higher than UTS, with the anisotropic samples cored parallel to fabric (UNZ9a) having the highest values, and those cored perpendicular having the lowest values (UNZ9b; see Fig. S1). To compare the trends across the sample suite, we first defined compressive strength (σUCS) and tensile strength (σUTS), in megapascals, as a function of porosity (ϕ), as a percentage (for the connected porosity range 9 %–38 %). We employed least squares regressions to define empirical power law relationships (for graphical representations and appraisal of variance, see Fig. S4) of
and
which demonstrate that UCS reduces more significantly as a function of increasing porosity and enables the estimation of UCS and UTS for a given porosity (or porosity estimation for a given strength). We then combined these equations to define the relationship between UCS and UTS:
showing the non-linearity of their interrelation, which is further defined by the evolving UCS:UTS ratio as a function of porosity.
3.5.2 Porosity, compressive strength, and Young's modulus
We employed the same approach to define Young's modulus (E) in megapascals (note that Young's modulus for rocks is typically given in gigapascals) as a function of porosity (in percent) as
and to define Young's modulus as a function of compressive strength as
showing a strong positive correlation, which can be further described by the UCS:E ratio evolution as a function of porosity:
In combination, these relationships enable the constraint of any of the porosity, compressive strength, tensile strength, and Young's modulus from any single parameter (for graphical representations and appraisal of variance, see Fig. S4); moreover, they provide a reasonable estimate of the range of these parameters for the variety of erupted materials, here spanning the porosity range from 9 % to 38 % (1st to 99th percentile of the eruptive products). The modelled ranges here are UCS from 11.40 to 49.28 MPa, UTS from 1.88 to 2.74 MPa, and Young's modulus from 4.32 to 13.88 GPa. These values can be compared to the measured ranges of UCS from 13.48 to 47.80 MPa, UTS from 1.30 to 3.70 MPa, and Young's modulus from 4.49 to 21.59 GPa.
3.6 Acoustic emission rate
By assuming an exponential acceleration in the AE release rate, we defined the maximum a posteriori (MAP) model parameters; k, which relates to the absolute amplitude of the acceleration, and λ, which is the exponential rate parameter (Eq. 7, Fig. S5; after Bell, 2018). We found that the exponential model more closely replicated the acceleration in the AE rate for the tensile strength tests, whereas compressive tests tended to have relatively high early rates of AEs inconsistent with this model (see Fig. S5).
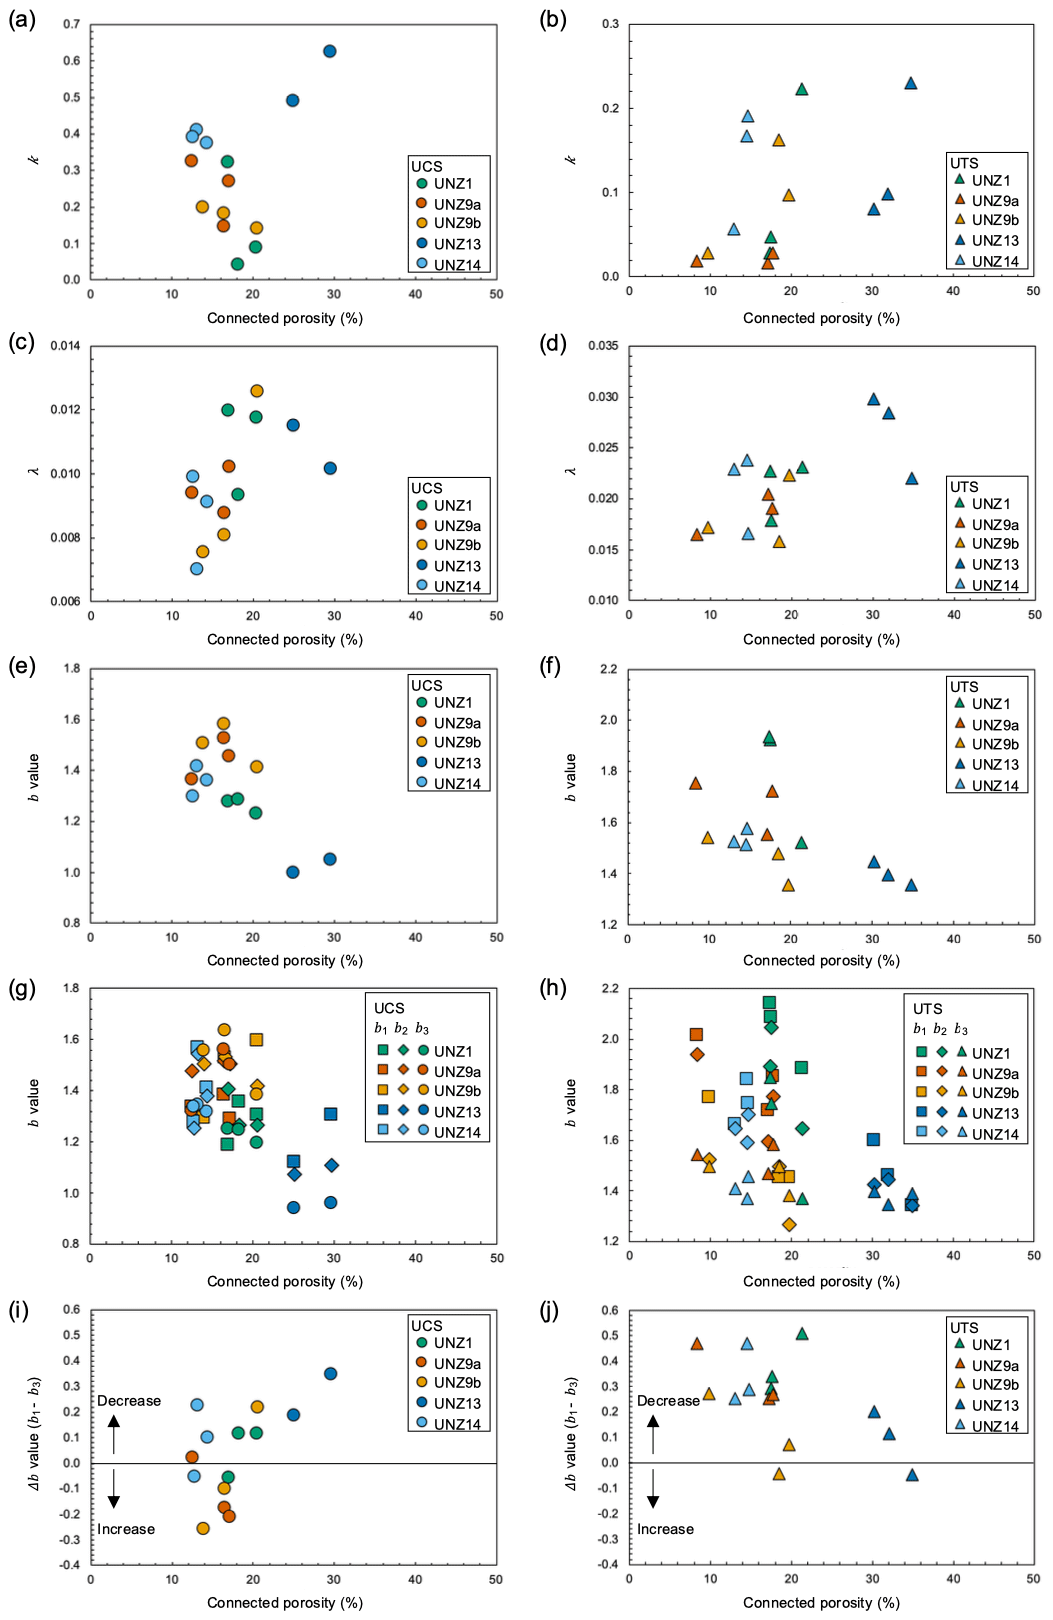
Figure 7Acoustic emission analysis data for all dry tests in compression and tension (see Fig. S5 for the dataset). The parameter k (which relates to the absolute amplitude of acceleration) is shown as function of connected porosity for (a) UCS with no systematic relationship and (b) UTS with a weak positive correlation. The exponential rate parameter λ is plotted as a function of connected porosity for (c) UCS and (d) UTS, both showing a weak positive correlation. A negative correlation is seen between the b value and connected porosity for (e) UCS and (f) UTS. The AE data were split into thirds to examine b value evolution across first (b1), second (b2), and third (b3) segments of deformation as a function of connected porosity, shown for (g) UCS tests and (h) UTS tests. This evolution is quantified by Δb (b1−b3), where positive values indicate reduction in b value throughout a test: (i) in UCS Δb increases as a function of increasing porosity and spans from negative to positive values; (j) in UTS Δb decreases as a function of increasing porosity and is almost always positive.
Differences between compressive and tensile tests and variability between sample groups can most effectively be described by examining the model parameters k and λ. k is shown as a function of connected porosity for UCS and UTS tests in Fig. 7a and b respectively; this shows that k is typically slightly higher and spans a broader range in compression than in tension (Table S4). In compression, k is highest for the most porous sample, UNZ13, and lowest for intermediate porosity sample, UNZ1, whereas the lowest porosity sample, UNZ14, and the anisotropic samples, UNZ9a and UNZ9b, have intermediate values, suggesting no systematic relationship between porosity and the absolute amplitude of the acceleration of AEs. In tension, a positive correlation exists between connected porosity and k, with the most porous samples having the highest absolute amplitude of the acceleration of AE. The scatter of k within the sample groups is relatively high, with coefficients of variation of >100 % for sample UNZ1 in compression and tension, and as low as 4.66 % for sample UNZ14 in compression (Table S4). λ is plotted as a function of connected porosity for UCS and UTS tests in Fig. 7c and d respectively; this shows distinctly higher values in tension than in compression and that the exponential rate parameter is negatively correlated with the absolute amplitude of acceleration (see Fig. S6). In both compression and tension, there is a minor positive correlation of λ with connected porosity, and scatter is lower than for k, with coefficients of variation of <30 % for all sample groups (Table S4).
To further understand the progression of damage during deformation, we also examined the AEs from each test (Fig. S5); using the maximum-likelihood method of Roberts et al. (2015), we calculated the b value for each experiment (above the cut-off amplitude of −3.3). The b value is the negative gradient of the slope of the amplitude–frequency distribution; therefore, a lower b value is an indication of a greater proportion of higher-amplitude events. We found that the b value has a negative correlation with connected porosity for both the UCS and UTS tests (Fig. 7e, f) and that it was higher in tension than compression. Repeatability within sample groups was typically good in both compression and tension, with coefficients of variation <14 % for all groups (Table S4). The b value has a poor positive correlation with λ and a minor negative correlation with k (Fig. S6).
In addition, the b value was determined for each third of every test to examine evolution during deformation (Fig. 7g, h). As with the b values for the whole tests, the b values for each third had a negative correlation with porosity, yet for the tests in compression, the sensitivity of the b value to connected porosity seemed to increase during the tests (slope of b3 is the steepest; Fig. 7g), whereas in tension, the sensitivity of b value to connected porosity seemed to decrease (slope of b3 is the shallowest; Fig. 7h). To examine this further, we defined Δb, the difference between the first and final thirds (b1−b3). This analysis showed that Δb correlates positively with connected porosity in compression, and it transitions from negative (increasing b value during deformation) to positive (decreasing b value during deformation) as a function of porosity. In other words, that b value increased during tests on low-porosity samples (negative Δb) but decreased for more porous samples (positive Δb; Fig. 7i). However, the b value almost always decreased in tension (positive Δb), and this Δb was negatively correlated with connected porosity, such that the b value reduction during deformation was more significant (high Δb) at lower porosity (Fig. 7j).
3.7 Coda wave interferometry
We examined the deformation induced during dry and water-saturated compressive and tensile tests using active pulsing across paired PZTs on opposing edges of the samples (see Fig. S1). Coda wave interferometry (CWI) was applied to waveform stacks following the method of Lamb et al. (2017) to calculate the variance of the travel time perturbation and to determine a relative change in seismic wave velocity during the experiments (velocities are typically higher for denser materials). Velocity evolution for all experiments as a function of test duration, normalised to 100 % at the time of sample failure are plotted in Fig. 8.
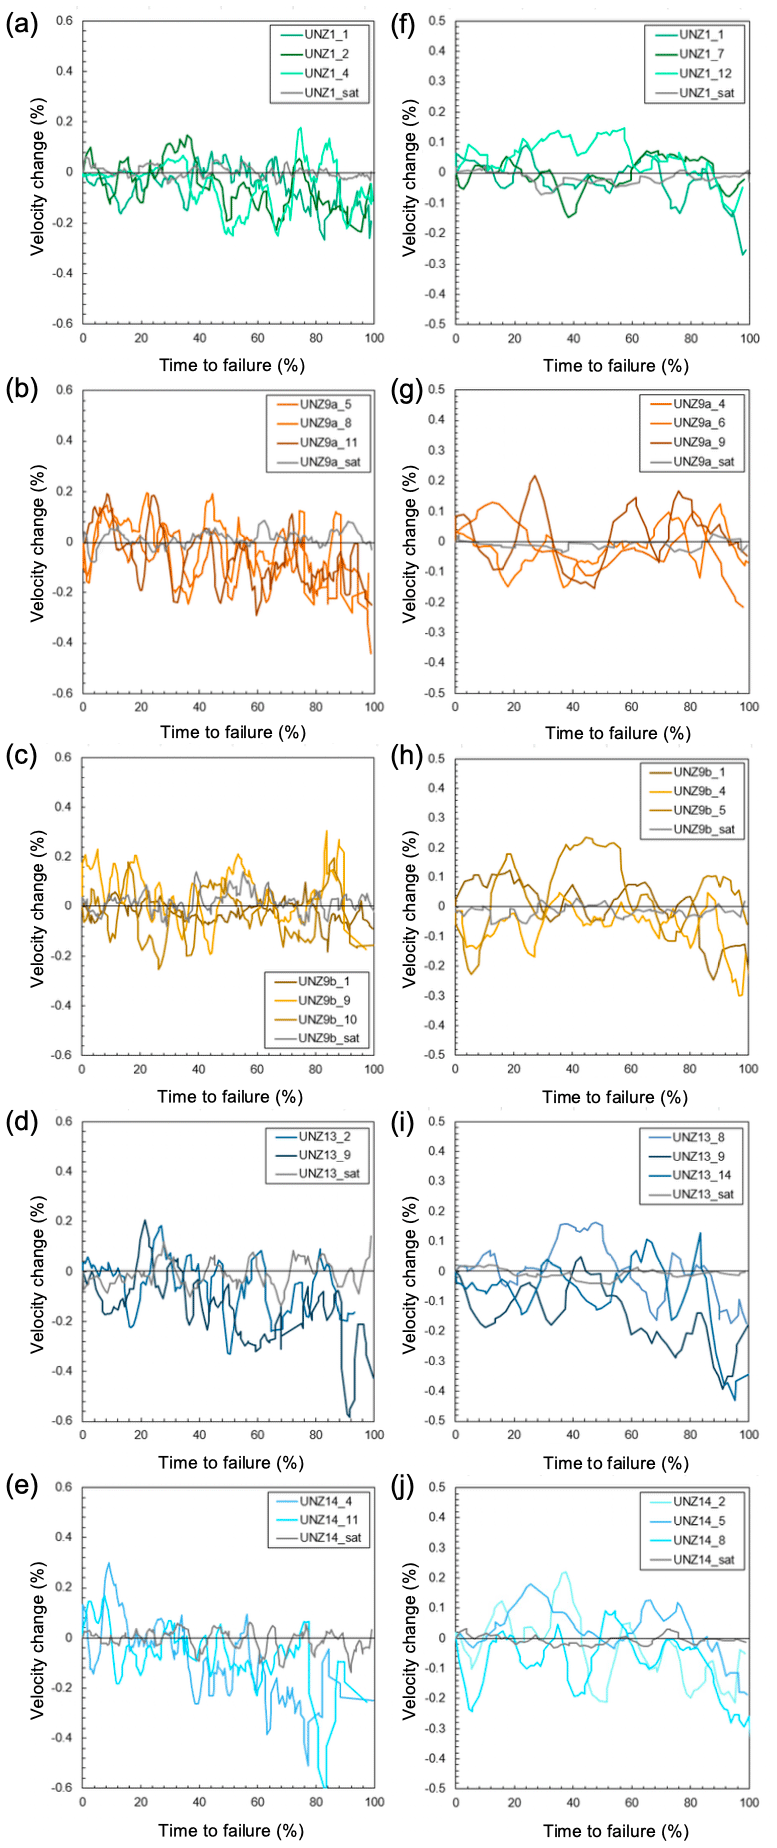
Figure 8Coda wave interferometry data presented as velocity change as a function of time to failure (normalised to test length) for dry and saturated (sat) conditions: UCS tests on samples (a) UNZ1, (b) UNZ9a, (c) UNZ9b, (d) UNZ13, and (d) UNZ14; and UTS tests on samples (f) UNZ1, (g) UNZ9a, (h) UNZ9b, (i) UNZ13, and (j) UNZ14. For UCS tests (a–e), velocity reduces after ∼50 % time to failure for dry tests but continues to fluctuate about zero (no velocity change) throughout saturated tests. For UTS tests (f–j), velocity reduces after 60 %–70 % time to failure for dry tests and also continues to fluctuate about zero for the saturated tests.
Under compression (Fig. 8a–e), the dry samples show velocity change that fluctuates about zero for at least the first 50 % of time to failure in the tests, after which velocity reduction is more pronounced for some tests than for others; the least porous sample, UNZ14, appears to have the strongest evolution. The saturated samples in compression, however, fluctuate about zero for the entire duration, showing no velocity change induced by damage evolution during testing. During tensile tests (Fig. 8f–j) a similar behaviour is observed for the dry samples, except velocity reduction appears to onset later, around 60 %–70 % of time to failure, and the most porous sample, UNZ13, appears to be most influenced. In tension, the saturated samples again fluctuate about zero for the entire duration of the tests and show no velocity change induced by damage evolution.
To enable systematic comparison between tests, we devised an approach whereby a linear fit with forced intercept (at 0–0) was applied to the velocity change data using a least squares approach, and the intercept of the line with the end of the test (time to failure =100 %) was defined as the magnitude of the velocity change. (We acknowledge that the outcome may lead to underestimation of velocity change, for some tests even resulting in a false positive velocity change as the porosity reduction typically occurs only in the latter stages of the tests and, thus, may be outweighed by fluctuations. We also acknowledge that this approach may not capture the subtleties, for example, the timing, of material damage accumulation but felt it a more robust approach than selecting the maximum velocity change which may represent a data spike.) Due to the high scatter of the data generated by CWI, we posit that such an approach is required for comparisons to be made (values are provided in Table S5, yet we suggest that their utilisation is for the purpose of exploring trends rather than quantitative assessment). We plot the velocity change defined as such against porosity for compressive and tensile tests in Fig. 9a and b. For the dry compression tests, we see no systematic variation in velocity change as a function of porosity, and for the saturated tests, as observed in the velocity change traces through time (Fig. 8), we see almost no variability (Fig. 9a). For the dry tensile tests, we see a minor negative correlation between connected porosity and velocity change or, in other words, a greater velocity reduction in more porous samples, and again for saturated samples, we see almost no variation (Fig. 9b).
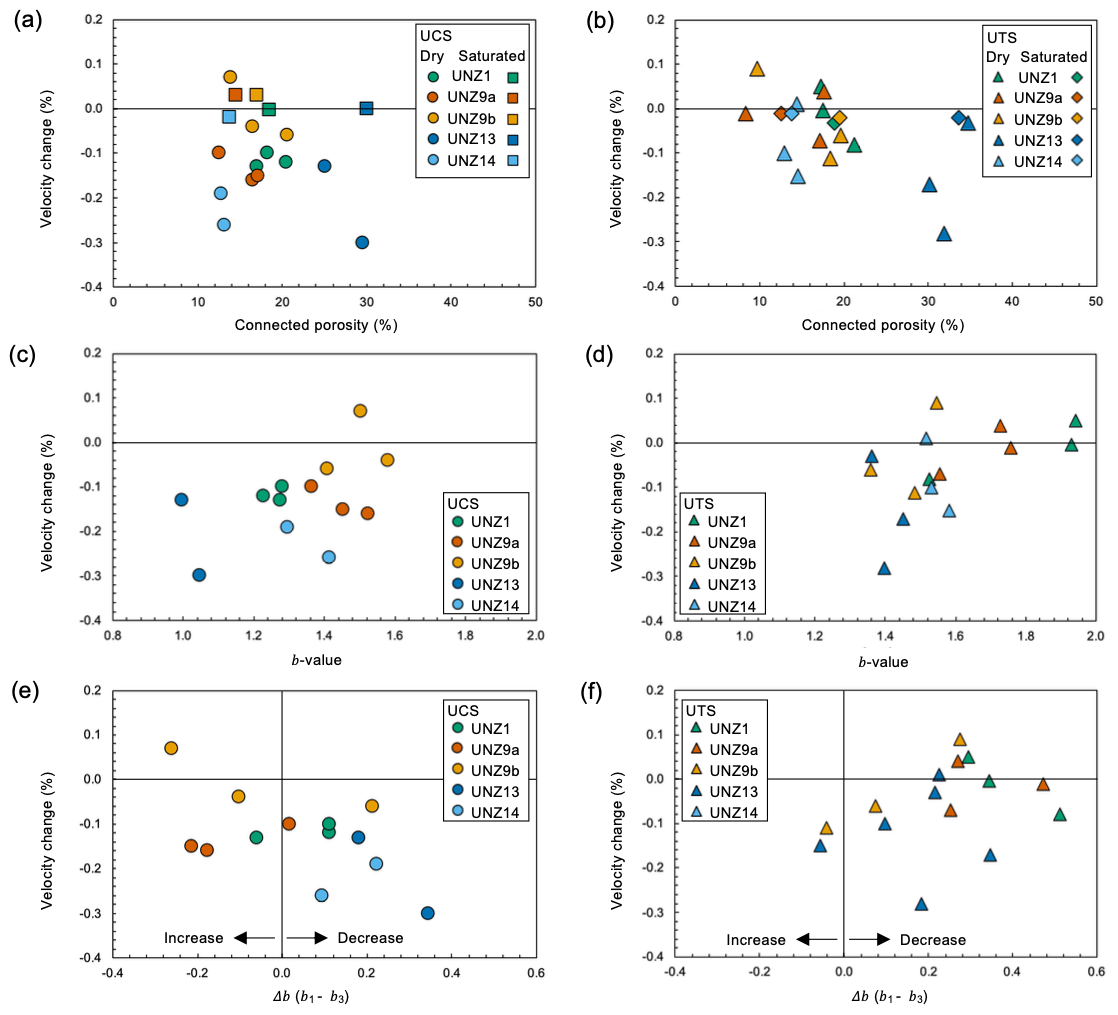
Figure 9Magnitude of velocity change during mechanical testing compared to connected porosity for dry and saturated (a) UCS and (b) UTS tests, showing no correlation for dry UCS tests, a minor negative correlation for dry UTS tests, and no change for saturated tests. Magnitude of velocity change compared to the b value calculated from acoustic emission monitoring, showing a weak positive correlation for dry (c) UCS and (d) UTS tests. Magnitude of velocity change compared to the Δb value (b1−b3) during dry (e) UCS and (f) UTS tests, showing a disparate correlation in compression and tension.
We additionally compared velocity change to the b value, finding a relatively good correlation, whereby a lower b value accompanied larger velocity reductions in compression (Fig. 9c) and, to a lesser but still observable extent, in tension (Fig. 9d). To further explore the relationship between velocity change and acoustic emissions, we compared velocity change to Δb (the difference between the b value of the first and final thirds of the tests). For compression tests, larger reductions in the b value (higher Δb) corresponded to larger reductions in velocity (Fig. 9e). For tension tests, the relationship was less clear and perhaps showed a poor counter-correlation, whereby larger reductions in the b value (higher b) corresponded to less significant velocity changes (Fig. 9f).
4.1 Relationships between physical and mechanical attributes
The density and the connected, isolated, and total porosities for the Mount Unzen lavas studied here match previously constrained values for the 1990–1995 dome eruption (Coats et al., 2018; Cordonnier et al., 2008; Hornby et al., 2015; Kueppers et al., 2005; Wallace et al., 2019). Averages of the five sample groups showed a density range from 1.54 to 2.40 g cm−3, a total porosity range from 16.05 % to 36.46 %, an isolated porosity range from 0.39 % to 5.37 %, and a connected porosity range from 13.69 % to 33.13 %, ranking the samples as follows (from least to most porous): UNZ14, UNZ9a, UNZ9b, UNZ1, and UNZ13 (Fig. 4a, Table 1). The anisotropic samples (UNZ9a and UNZ9b) have both a higher degree of connectivity and a higher degree of variability of porosity than the isotropic samples, which is indicative of a tortuous stress–strain history during their genesis.
The range of all 1065 permeability measurements on cores and discs spanned from to m2 with coefficients of variation of between 2 % and 259 % within a single sample (Table S1), suggesting a range from low to high rock heterogeneity on the sample scale. Permeability is largely dictated by porosity (Fig. 4b), but for a given porosity (considering the average for each core or disc), the permeability can span >2 orders of magnitude, which is indicative of the variability in the porous network geometry; for example, at the scale tapped here, permeability is higher for the macroscopically isotropic samples UNZ1 than the macroscopically anisotropic samples UNZ9 of similar porosity (Fig. 4b). This suggests that the area sampled by the measurements (conducted via pulse decay through an 8 mm circular aperture) is sensitive to pore geometry and pore connectivity (Table 1, Fig. 4a; UNZ9 have low isolated porosities). The orientation of larger-scale heterogeneities and anisotropy, such as the cataclastic banding observed in sample UNZ9, cannot be resolved with this method, which is supported by the observation that permeability measurements do not distinguish between samples cored parallel or perpendicular to fabric (Table 1, Fig. 4b; note that the slight clustering of samples in porosity–permeability space results from minor differences in porosity) unlike conventional permeability measurements which measure fluid flow in a single direction (Fig. 4c, Fig. S3).
We conducted a further 379 unconfined permeability measurements on cut, planar block surfaces of macroscopically anisotropic UNZ9 and dense, relatively isotropic UNZ14 in order to further explore variability within sample groups as well as to explore the role of sample size and geometry on the accuracy of permeability estimates using the TinyPerm II minipermeameter. Previous work has suggested that sample radius should be at least 4 times the permeameter nozzle radius (Goggin et al., 1988), and if smaller samples are used, a correction for permeability estimates may be necessary (e.g. Filomena et al., 2014). Our samples span this theoretical limit, with cores falling below (sample radius 2.5 times nozzle radius), discs just above (5 times), and block surfaces significantly larger (>10 times) than the minimum recommended size for accurate permeability determination. In comparing across these three sample geometries for both anisotropic (UNZ9) and relatively isotropic (UNZ14) rocks, we found comparable minimum, maximum, and average permeabilities as well as standard deviations for cores, discs, and block surfaces (Table 2). This suggests that there is no impact of sample geometry on the accuracy of the permeability estimates from the TinyPerm II across the range of sample sizes (and at the absolute permeabilities) measured here. Farquharson et al. (2015) similarly found no discrepancy between measurements on blocks and cores (of the same size as tested herein) in a range of sedimentary rocks using the same brand of minipermeameter. As others have noted the impact of sample size on permeability estimates using similar devices, we suggest that, if possible with the sample materials available, this effect should be checked for by adopting the approach herein, whereby rock surfaces (ideally freshly cut) and experimental samples are measured and compared so that appropriate corrections may be made (e.g. Filomena et al., 2014).
Confined permeability measurements revealed permeability reduction as a function of effective pressure, highlighting the greatest sensitivity in the lowest permeability samples (Fig. 4c), potentially due to the relative ease of closing high-aspect-ratio fractures compared with more equant pores (e.g. Lamur et al., 2017; Zimmerman, 1991; Kennedy et al., 2020; Gueguen and Dienes, 1989; Griffiths et al., 2017). Similar porosity–permeability relationships to those in unconfined measurements were noted for the five sample groups, including the higher permeability of isotropic samples compared with anisotropic samples with similar porosities. In addition, it was noted that the cores cut parallel to the cataclastic fabric (UNZ9a) were more than an order of magnitude more permeable than those cut perpendicular (UNZ9b), which was not observed in the unconfined permeability measurements performed on the cores, discs, and planar block surfaces due to the radial sampling of pore space through a central aperture. The confined measurements (which also have larger sampling volume) capture the impact of the cataclastic banding visible in the specimens (Fig. 2) using fluid flow in a single orientation in order to highlight the permeability anisotropy (Fig. 4c). In addition, preferential closure of the microfractures observed in the dense layers in thin section (Fig. 3) upon confinement heightens the permeability anisotropy in already anisotropic samples; in particular, the denser layers in perpendicularly cut UNZ9b serve to block fluid flow (fluid may not circumnavigate the dense layers), whereas the same dense layers running parallel to fluid flow have negligible influence on fluid transmission, which is primarily hosted in the porous layers. This suggests that the impact of anisotropy on fluid flow in volcanic systems may be more significant at depth than in shallow (i.e. unconfined) settings. It also highlights the need to use measurements made at comparable effective pressures to compare samples' permeabilities. Furthermore, the two types of permeability measurements utilised here (unconfined on small to large samples, versus confined with unidirectional flow) highlight the importance of the approach used and the scale of examination when defining the physical attributes of materials. Unconfined minipermeameter measurements are able to distinguish porosity distribution and geometry (e.g. crack versus vesicle dominated in the anisotropic and isotropic samples respectively) but are unable to discriminate the orientation of anisotropic fabrics, seen, for example, to dominate the UNZ9 samples' permeability when considering confined measurements; thus, in the description of permeability, the sample scale, method, and conditions should always be detailed.
The uniaxial compressive strength (UCS) of the samples reduces with increasing porosity (Figs. 5, 6; Table 4) as described by Eq. (8) and as has been noted for Unzen lavas (Coats et al., 2018), similar volcanic rocks (Harnett et al., 2019a; Heap et al., 2014a; Schaefer et al., 2015), and a broad range of geomaterials (e.g. Paterson and Wong, 2005). Under dry UCS conditions, the lowest porosity UNZ14 was the strongest sample group (44.81 MPa), and the intermediate porosity sample UNZ1 was weakest (17.69 MPa). Weak UNZ1 is notably more fracture dominated than the most porous, vesicle-dominated UNZ13, which is stronger (21.38 MPa), suggesting that, as well as absolute porosity, the geometry of pore space is influential on rock strength (e.g. Bubeck et al., 2017; Griffiths et al., 2017). As the pore geometries of volcanic rocks are highly variable due to their complex formation histories, it is important to understand the microstructural characteristics in order to estimate strength. Furthermore, the results show that UCS is dependent on sample-scale anisotropy, with rocks compressed parallel to the cataclastic fabric (of denser and more porous bands) being stronger than those perpendicular (UNZ9a compared with UNZ9b). The influence of anisotropic fabrics on the UCS of volcanic rocks has been noted previously (e.g. Bubeck et al., 2017), with maximum strength typically considered to be when anisotropy aligns at ∼30∘ from application of the principal stress, although the specific properties of fabrics means this may not always be the case. The standard deviation and coefficient of variation of UCS were also highest in the anisotropic sample (UNZ9b), suggesting that anisotropy further fuels variability in strength of lava domes and volcanic edifices.
Similarly, the Brazilian disc method showed that UTS is primarily controlled by porosity (Figs. 5, 6; Table 4), reducing non-linearly with porosity as described by Eq. (9), as has been noted for other volcanic rocks: cold (e.g. Harnett et al., 2019a), hot (Hornby et al., 2019), and fragmented by pore overpressure (Spieler et al., 2004). The average UTS of each group of dry samples revealed that the strongest was UNZ9b (3.39 MPa), the cataclastic sample cored perpendicular to the cataclastic fabric (and fractured in tension parallel to fabric), and weakest was UNZ9a (1.80 MPa), the cataclastic sample cored parallel to the fabric (and, thus, fractured in tension perpendicular) despite having equivalent porosities. Thus, tensile strength is potentially more sensitive to anisotropy than compressive strength, as it is controlled by the weakest element that traverses the material perpendicular to the applied tensile stress (e.g. Lydzba et al., 2003). The weak anisotropic samples (UNZ9a) also had the highest standard deviation and coefficient of variation of UTS, whereas lower values were seen in the stronger and isotropic samples. Similarly to the results of UCS testing, this suggests that anisotropic samples further add to the strength variability of volcanic materials that can promote structural instability.
Saturated samples had lower strength than the dry average for four out of five sample groups in UCS and for three out of five groups in UTS, although one group was also more strongly saturated in UTS; as such, the effect of saturation may slightly differ in compression and tension, although the high sample variability of the dry samples suggests more measurements would be needed to verify the observation (Figs. 5, 6; Table 4). Previous work has shown that pore fluid impacts material poro-mechanically and chemically, including stress corrosion by capillary action at the fracture tip, reduction of the friction angle (due to the lubricating influence of water), and, depending on the ability of the fluid to escape, the saturated pores may develop pressure (called the crack splitting tensile stress) as the sample is compressed; as such, the presence of water is typically considered to enhance the growth of fracture networks, distribute strain, and weaken geomaterials (e.g. Grgic and Giraud, 2014; Althaus et al., 1994; Baud et al., 2000). In tension, fracture propagation in saturated rocks has been seen to be significantly slower than in dry conditions (Wong and Jong, 2014), which could be a result of the reduced efficiency of capillary action in dilating pores filled with a finite water volume (as noted in other materials; e.g. Smith, 1972). The results here are inconclusive as to whether water saturation reduces the tensile strength of porous volcanic rocks, and further study would be required to draw a conclusion. However, it is pertinent to note that the impact of the pore fluid in any deformation regime is likely a result of interplay between the deformation rate and hydraulic properties (e.g. Duda and Renner, 2012) as well as the fact that strain rates can span >10 orders of magnitude in volcanoes; thus, a full description of the role of saturation on strength would also require the characterisation of its rate dependence and the definition of a critical strain rate that allows drainage during deformation.
Young's modulus of the materials tested mimicked patterns observed for strength, showing a non-linear negative correlation with porosity which is described by Eq. (12). This relationship shows a slightly lower dependence of Young's modulus on porosity than previously described exponential and power law relationships developed for volcanic rocks (Heap et al., 2020), which we attribute to the following: (1) the lower span of porosity used to define our relationship (9 % to 38 % compared with 3 % to 50 %), in particular the lack of low-porosity samples, for which Young's modulus rises increasingly non-linearly; (2) the relatively high prevalence of fractures in our samples, whereas Heap et al. (2020) defined their relationship from a range of volcanic materials (some with more equant vesicles); and (3) the inclusion of anisotropic cataclastic samples with porous and dense bands which result in high strength variability for a given porosity. The highest Young's modulus was seen for the least porous, strongest sample, UNZ14 (17.21 GPa), and the lowest Young's modulus was seen for the weakest sample, UNZ1 (5.46 GPa; Fig. 6c, Table 4). Young's modulus was systematically reduced by saturation, as has been noted in certain lithologies in previous studies (e.g. Makhnenko and Labuz, 2016; Heap et al., 2020). As compressive and tensile strength and Young's modulus scale primarily with porosity, we provide relationships to estimate each parameter from one another (Eqs. 8–14, Fig. S4). Whilst this approach lacks the precision of more nuanced micromechanical solutions (e.g. Paterson and Wong, 2005, and references therein), it has the benefit of being broadly applicable to the range of materials against which it is calibrated, i.e. here porphyritic dacites in the porosity range from 9 % to 38 %, without relying upon microstructural characterisation of dominant pore size and/or crack length. For example, previous work (Heap et al., 2014b; Coats et al., 2018) has shown that the evolution of pore geometry in volcanic rocks in this porosity range renders endmember solutions, such as the pore-emanated crack model (Sammis and Ashby, 1986) and wing-crack model (Ashby and Sammis, 1990), ineffective without a weighted solution that incorporates both. UCS is often approximated at 10 times higher than UTS. Here, we found that UCS is between 6.8 and 17.3 times higher than UTS, with the modelled results highlighting that the ratio typically decreases with increasing porosity (as UTS is less sensitive to increasing porosity), as shown in Eqs. (10) and (11), although for the samples tested, the anisotropic rocks account for the maximum (cored parallel to fabric, UNZ9a) and minimum (cored perpendicular, UNZ9b) UCS:UTS ratio. This suggests that pore geometry and connectivity have a significant control on the UCS:UTS ratio, complementing the results of Harnett et al. (2019a) who found higher UCS:UTS ratios for stronger, less permeable materials and cautioned against using a constant ratio in numerical models of lava domes.
Young's modulus increases non-linearly with UCS and is between 275 and 375 times higher than UCS, increasing with increasing porosity, suggesting that Young's modulus is slightly less sensitive to increasing porosity than compressive strength, as shown in Eqs. (13) and (14). The modelled relationships are able to capture the range of material characteristics reasonably well, giving, for the porosity range from 9 % to 38 %, a range of UCS of 11.40–49.28 MPa (compared to a measured range of 13.48–47.80 MPa), a range of UTS of 1.88–2.74 MPa (compared to measured range of 1.30 to 3.70 MPa), and a Young's modulus of 4.32–13.88 GPa (compared to measured range of 4.49 to 21.59 GPa). The modelled relationships fail to capture endmembers of measured results (for which the value ranges are larger), heightened by the inclusion of anisotropic samples here (e.g. anisotropic samples have the highest and lowest UTS measurements despite having equivalent porosity). This highlights that even using relationships defined directly from laboratory measurements leads to an underestimation of the range of mechanical heterogeneity. If modelling a lava dome or volcanic edifice, previous studies have reported that upscaling of mechanical properties may see intact rock strength values further weakened by as much as 80 %–97 % (Thomas et al., 2004; Walter et al., 2019) and Young's modulus reduced by up to a factor of 4 depending on the geological strength index of the rock mass (see Heap et al., 2020, and references therein). This is due to large-scale heterogeneities and other phenomena that may act locally, such as alteration (weakening or strengthening), temperature and temperature gradients (weakening or strengthening), unconsolidated ash and/or tephra layers (weakening), confining pressure (strengthening), and saturation (weakening). Yet the utilisation of such laboratory-constrained physical and mechanical property ranges rather than fixed and/or estimated values is necessary to model the complexity of structures in volcanic complexes (e.g. Husain et al., 2014), and intact rock strength (i.e. UCS) is still necessary for common stability and deformation modelling of rock outcrops such as the Hoek–Brown failure criterion (Hoek et al., 2002).
A change in the stress state of a material, even without failure, can impact the stability of volcanic edifices or lava domes. For example, dilation can result in enhanced permeability (and permeability anisotropy) which may allow pressurised fluid or gas to infiltrate or escape (enhancing or reducing instability risk). Deeper in volcanic systems (under confinement), dynamic closure of fractures (e.g. Watanabe et al., 2008) or compaction of weak or unconsolidated material can reduce permeability (e.g. Kennedy et al., 2020) that can drive the development of overpressure or shift the stress field in overlying rocks that can also affect stability. Understanding the progression of microstructures during deformation, both in the laboratory and at volcanoes, can be enhanced by geophysical monitoring.
4.2 Signals of heterogeneous material deformation
Passive acoustic emission monitoring and active surveys were employed to track the evolution of materials during deformation. The acceleration of the AE rate in the tensile strength tests was well-described by the exponential model, whereas compression tests had elevated AE rates during the early phase of deformation. The range of the absolute amplitude of the acceleration (k) and exponential rate parameter (λ) are distinct for compressive and tensile tests: k is higher in compression, whereas λ is higher in tension (Fig. 7). These results suggest that failure forecasting may be more accurate in tensile regimes (due to the faster rates of acceleration during tensile deformation), although forecasting windows may be shorter (due to the relatively later onset of critical cracking events). The translation of this observation to deformation at a crustal scale may not be straightforward, yet the observation offers potential for the separate treatment of classified seismic events when considering rates of acceleration in the approach to critical geologic phenomena such as earthquakes and volcanic eruptions (e.g. Bell et al., 2014, 2018). We also find that λ increases with increasing porosity in both compression and tension, suggesting that more porous materials may facilitate more effective coalescence of fractures, whereas k varies less systematically (Fig. 7).
The physical evolution during deformation can be further explored via the b value; a lower b value indicates a higher proportion of higher-amplitude events. Scholz (1968) found that for a wide range of rock types, the b value was higher during pervasive, ductile (compactant) deformation than for localised brittle (dilatant) deformation; comparably, Lavallée et al. (2008) showed that the b value decreases with increasing applied stress or strain rate, which enhanced localisation (resulting in more, larger events) in vesicular, crystalline lavas. Tests on variably porous sintered aphyric suspensions showed the b value increasing as a function of heterogeneity (pores, in their study; Vasseur et al., 2015). To our knowledge no such study has previously been performed on a series of variably porous natural volcanic rocks or in tension. We demonstrate that the b value has a negative correlation with connected porosity for both UCS and UTS tests (i.e. the failure of more porous rocks results in a lower b value than for dense rocks; Fig. 7). At first, this observation appears at odds with previous studies (e.g. Vasseur et al., 2015; Scholz, 1968), but the examination of microstructures reveals the cause. Previous work has shown that pore size, geometry, and distribution all impact stress intensity (e.g. Meredith and Atkinson, 1983), with larger, more closely clustered pores leading to higher stress intensities, which, in turn, has a strong negative correlation with the b value (e.g. Ribeiro, 2012). Our samples also contain three phases (glass, crystals, and pores); as such, the presence of crystals in the glass phase adds to the sample heterogeneity, and crystals serve as additional nucleation sites for the initiation of fracture damage (Kendrick et al., 2017; Lavallée et al., 2008). In UCS the highest b values are in cataclastic banded samples UNZ9a and UNZ9b; despite the overall low porosity of these samples, large areas are covered by granular bands that facilitate numerous fracture nucleation sites and low stress intensities. This is followed by samples UNZ14 and then UNZ1, both of which have low to intermediate porosity, including elongate narrow fractures that enable a substantial number of small AE events by shear displacement during deformation. Finally, the lowest b value is in the most porous sample UNZ13, but this sample has a notable absence of microfractures and is instead dominated by large and tightly clustered rounded to sub-rounded pores which serve to increase stress intensity and, hence, reduce the b value. In tension (UTS), a similar progression is seen to compression, except that the UNZ1 and UNZ14 samples which have long, fine microfractures shift to yet higher b values, suggesting that such pre-existing fracture networks dominate the deformation response in tension. The cataclastic samples UNZ9a and UNZ9b maintain high b values in tension, which show larger differences between those cored parallel and perpendicular to banding than in compression, as would be anticipated from their contrasting strengths in tension (Fig. 6). Finally, the UNZ13 sample also has the lowest b value in tension. Thus, across the porosity range tested here (13.69 % to 33.13 %), pore size, geometry, and distribution seem to have a more dominant control on the b value than absolute porosity, verifying previous observations that stress intensity has the primary control on the b value (e.g. Ribeiro, 2012, and references therein).
We also show that b values differ between deformation in compression and tension, specifically the b value is up to 0.5 higher for UTS than for UCS for a given material. Although during UTS the number of AEs is lower at all amplitudes, we note in particular a lower prevalence of high-amplitude events in tension (Figs. 7e, f, S5). Similarly, previous work on regional seismicity has shown that the b value is higher in extensional than in compressive regimes (Schorlemmer et al., 2005); in their view, the b value reflects both the focal mechanism and spatial distributions of fracturing events such that the b value scales inversely with differential stress and is elevated at low stress intensities. The typically higher b value for our tensile tests can potentially be explained by the relatively low stress required to generate fracture damage in tension (compared with compression). A number of studies have indicated that the b value decreases during deformation (in compression) on the approach to failure as damage localises (Vasseur et al., 2015; Lockner, 1993; Meredith et al., 1990; Main et al., 1992). We tracked the evolution of the b value by splitting each test into thirds (b1 to b3) of equal time intervals. In compression, Δb (b1−b3) correlates positively with connected porosity and transitions from negative Δb (increasing b value during deformation) at low porosity to positive Δb (decreasing b value during deformation) with increasing porosity. The unusual observation that the b value increases during deformation is largely observed for the anisotropic samples, which could be due to increasing levels of compaction in the cataclastic bands as stress accrues. In tension, the b value almost always decreased (positive Δb) throughout deformation as in previous studies (e.g. Lockner, 1993; Main et al., 1992), and the magnitude of Δb correlated negatively with connected porosity (lower porosity samples had the biggest reduction in the b value, i.e. the highest Δb). Whereas the acceleration of AE events can present difficulties in the precursory detection of failure in materials in nature due to the necessity to establish a reference point (or baseline) for each unique material in each part of a system under stress, monitoring dynamic changes in the b value (for example, using set time windows) may be one of the most robust indicators of precursory activity.
In addition to monitoring passive AEs, we also used active surveys and applied coda wave interferometry to stacked pulses (CWI). In a scenario where AEs are also being produced by deformation during the experiments, this method offers an alternative, potentially more robust approach, to the direct measurement of pulse arrival times to measure velocity change. The coda of a wave is the section after the directly arriving phases, and, in laboratory-scale rock samples comprises surface waves and waves that have repeatedly scattered (reflected within) the medium (Grêt et al., 2006; Singh et al., 2019). Where conventional approaches to measuring first arrivals are highly sensitive to local heterogeneities and, thus, may not accurately represent bulk material properties, CWI effectively samples the whole material multiple times, a process which provides a robust constraint of bulk properties and amplifies even very minor temporal changes compared with direct arrivals (Singh et al., 2019; Snieder et al., 2002; Hadziioannou et al., 2009; Griffiths et al., 2018). We identified velocity reductions during mechanical testing in both compression and tension (Fig. 9). In tension, velocity reduction began later during the tests (at 60 %–70 % time to failure) compared with in compression (at ∼50 % time to failure), which is an observation that mirrors the AE release rates that are exponential for tests in tension but below exponential in compression. Notably the least porous sample exhibits the biggest velocity reduction in compression, whereas it is the most porous sample which is most significantly impacted in tension. This distinction is likely due to the contrasting stress fields generated in the compression and Brazilian disc set-ups as well as the distribution of damage in different porosity materials. For example, previous studies using velocity measurements along different paths transecting a damage zone during deformation have shown that variably porous volcanic rocks show different spatial distributions of velocity change during deformation (Harnett et al., 2018a); thus, by extrapolation, this finding would translate to the CWI results on rocks of variable porosity under different deformation regimes, which would represent different areas of a system.
The velocity reductions identified by CWI scale to both the b value and Δb (Fig. 9). In both compression and tension, lower b values were accompanied by larger velocity reductions, which both indicate the development of pervasive fractures. For compression tests, larger reductions in the b value (higher Δb) corresponded to larger reductions in velocity. Tension tests showed a poor counter-correlation (higher Δb corresponded to smaller velocity reductions), which may be due to a number of factors controlling velocity during Brazilian disc tests, such as the late occurrence of coalescing or pervasive fractures or the distribution of dilation in some areas countered by compaction in others.
CWI has been used to monitor and detect subtle changes in the degree of water saturation of rocks (Grêt et al., 2006), yet here we show that in a material that is deforming, saturation may in fact obscure damage accumulation; in our experiments, the degree of saturation remained constantly high throughout deformation, and no velocity change was detected even during the visible creation of fractures. Such results are important for potentially saturated volcanic systems, where damage accumulation (e.g. Snieder et al., 2006; Griffiths et al., 2018) or source migration (Lamb et al., 2015) that could otherwise be monitored by CWI might be obscured by constant saturation. Alternatively, enhancement of the permeable porous network by fracturing that would allow fluid to drain or infiltrate new areas may also overprint structural or source evolution due to the sensitivity of CWI to the saturation level (Grêt et al., 2006). Thus, it is vital that all such variables (i.e. evolving material properties, source migration, source mechanism, degree of saturation) be considered in the interpretation of CWI results, and laboratory experiments can elucidate their relative impact across a suite of controlled conditions.
Mount Unzen is a primarily dacitic volcano located on the Shimabara Peninsula, Japan. The Heisei-Shinzan lava dome that forms the current summit continues to pose a collapse hazard. During a field campaign in 2015, we selected a number of porphyritic lava samples with a range of porosities and fabrics (isotropic and anisotropic) from block-and-ash deposits to measure and compare the physical and mechanical properties. The samples tested span a porosity of 9.14 % to 42.81 % and a permeability range of to m2 (from 1065 measurements on rock cores and discs). For a given porosity, the permeability varies by >2 orders of magnitude. Macroscopically anisotropic samples typically have lower permeability than isotropic samples of similar porosity, reflecting pore geometry and connectivity rather than the impact of the fabric orientation, which cannot be distinguished with this method. Comparing permeability estimates across cores, discs, and planar block surfaces for both anisotropic (UNZ9) and relatively isotropic (UNZ14) rocks, we found comparable minimum, maximum, and average permeabilities as well as standard deviations. This suggests that there is no impact of sample size and geometry on the accuracy of the permeability estimates from the TinyPerm II across the range of samples sizes and absolute permeabilities measured here, although this may differ for other materials; as such, validation of minipermeameter measurements using similar verification procedures are encouraged. Permeability measurements made under confinement revealed that the lowest permeability samples were most sensitive to effective pressure, which is interpreted to result from preferential closure of crack-like pores compared with more equant vesicles. Permeability anisotropy could be identified by this method (using unidirectional flow), with higher permeability in cataclastic fabrics cored parallel to fabric than perpendicular. Increasing effective pressure also enhanced permeability anisotropy. Our permeability measurements highlight the importance of detailing the scale (sample volume) of measurements, apparatus, the fluid medium used, and the effective pressure conditions in the description of permeability values.
The uniaxial compressive strength (UCS) of the five sample groups ranges from 13.48 to 47.80 MPa, and tensile strength (UTS) using the Brazilian disc method ranges from 1.30 to 3.70 MPa. Although porosity has a primary control on strength, we found that at similar porosities, crack-dominated lavas are weaker than vesicle-dominated ones. The impact of saturation on strength is inconclusive due to high sample variability, although it appears to decrease UCS and have an unsystematic impact on UTS. UCS is between 6.8 and 17.3 times higher than UTS, with anisotropic, cataclastically banded samples cored parallel and perpendicular to fabric presenting as each endmember. The orientation of the banded samples had a more significant impact on tensile strength than compressive strength considering a principal applied stress parallel and perpendicular to fabric. This was interpreted to be due to the wholesale failure being caused by a through-going fracture that could be hosted solely within the weaker cataclastic layers, whereas the shear failure of the samples under UCS traversed strong and weak layers to fail (as such, the weakest orientation for banded samples in compression is likely to be inclined). Young's modulus of dry samples ranged from 4.49 to 21.59 GPa and was systematically reduced by saturation. The interrelation of porosity, UCS, UTS, and Young's modulus were defined by a series of empirical relationships that facilitate the estimation of the range of each physical or mechanical parameter from another. Whilst this approach lacks a micromechanical basis, it is a useful tool to generalise the attributes of a particular material and may prove to be particularly beneficial as input parameters for the modelling of volcanic systems.
Acoustic emissions were monitored during deformation, and acceleration was assessed by fitting Bayesian Poisson point process models to define the maximum a posteriori (MAP) model parameters, k (which relates to the absolute amplitude of the acceleration) and λ (the exponential rate parameter). The exponential model had a good fit to tensile strength tests, but compressive tests tended to have relatively high early rates of AEs: k was typically higher in compression and spanned a broader range, but it did not vary systematically with porosity, whereas in tension k increased with increasing porosity; λ was higher for tension tests, negatively correlated with k and increased with increasing porosity in both compression and tension. The frequency–amplitude distribution of the AEs from each test defined the b value. We found that the b value has a negative correlation with connected porosity for both UCS and UTS tests. We interpret the difference in this result compared with previous work in which the b value increased as a function of heterogeneity (c.f. porosity; Vasseur et al., 2015) as resulting from the complex and contrasting porous networks in our samples that control the stress intensity (e.g. Meredith and Atkinson, 1983). Large, closely clustered pores, such as in our most porous samples, cause higher stress intensities (compared with micro-cracks), which, in turn, results in lower b values (e.g. Ribeiro, 2012). Moreover, the presence of three phases (glass, crystals, and pores) in Unzen lavas prevents the simplification of porosity to heterogeneity, as phase contacts serve as nucleation sites for the initiation of fractures (e.g. Lavallée et al., 2008; Kendrick et al., 2017).
We found that the b value is higher in tension than compression tests, resulting from a higher proportion of higher-amplitude events in compression. This observation matches work on regional seismicity that showed higher b values in extensional rather than compressive regimes, in which the b value reflects both the spatial distribution and focal mechanism of fracturing events, with high b values resulting from low stress intensities (e.g. Schorlemmer et al., 2005). In our experiments, the highest measured b values in compression were in cataclastic banded samples, whose granular layers facilitated low stress intensities and ample fracture nucleation sites. In tension, samples with long, fine microfractures that promoted distributed deformation had high b values. We attribute the different ranges in the b value in tension and compression to contrasting stress (lower in tension) required to generate fractures in the two regimes.
The b value evolution during deformation tests has previously been used as a proxy for damage state, with the b value typically decreasing during deformation as damage becomes increasingly localised prior to material rupture (e.g. Main et al., 1992). To examine this, we defined Δb and found that the majority of samples had positive Δb values, i.e. the b value decreased between the first and final thirds of each test as strain localised in the approach to failure. A few samples, specifically the cataclastically banded samples in compression, showed an increasing b value during deformation, which likely resulted from pervasive ductile damage in the porous cataclastic bands (also indicated by the high absolute b values). We also found that Δb increased with increasing porosity, i.e. higher-porosity samples suffered greater reductions in the b value, during compression tests. In tension, the opposite was true, i.e. lower-porosity samples suffered greater reductions in the b value; however, an evolution of the b value was indicative of approaching failure in all tests. These results indicate that knowledge of the material characteristics and source processes of AE or seismic events may better help us interpret both initial and evolving b values during deformation. Unlike tracking the acceleration of AE events which relies on the establishment of a baseline or reference point, tracking dynamic changes in the b value using migrating fixed time or event number windows (e.g. Kato et al., 2015; Chiba and Shimizu, 2018) may be one of the most robust indicators of changing activity in volcano monitoring situations.
Using coda wave interferometry of active acoustic emission pulsing, we identified velocity reductions during mechanical testing in compression and tension, the magnitude of which is greater in more porous samples in UTS but appears independent of porosity in UCS. Typically, the largest velocity reductions in both compression and tension were associated with the lowest b values (indicative of relatively large, localised fractures). In compression tests, the comparison of velocity change to Δb also revealed that the largest reductions of velocity corresponded to the biggest drops in the b value, indicating high susceptibility to localised damage. In tension, there is a poor opposite correlation, which we posit relates to the complex geometry of Brazilian disc tests, whereby certain areas are compacted whilst others dilate, and the relative susceptibility of crack-dominated versus vesicle-dominated materials to the distribution of stresses. We propose that CWI is a more robust measure of bulk material velocity change than traditional methods utilising first arrivals, as the method samples the whole material and, thus, is more representative than the measure of a single ray path. However, we caution that care should be taken in the interpretation of coda in the case of multiple simultaneous dynamic changes, as we found that water saturation in our tests obscured the observation of velocity reduction by accrual of damage. In naturally wet volcanic environments, damage accumulation, fluid circulation, and migrating or evolving seismic sources may all overprint one another; thus, laboratory experiments may be valuable in elucidating the competing controls of these variables on monitored seismic signals.
The extensive physical and mechanical results presented here demonstrate the complexity of volcanic materials, even when derived from a single eruption. The work highlights that heterogeneity and anisotropy on a sample scale not only enhance variability in physical and mechanical properties at volcanic systems, but they also have a defining role in the channelling of fluid flow and the localisation of strain that dictate a volcano's hazards and the geophysical indicators we use to interpret unrest at persistently active volcanic complexes such as Mount Unzen.
Supplementary data are available in Figs. S1–S6 and Tables S1–S5 in the Supplement. The script for the Young's modulus calculation is freely available on GitHub (Coats, 2018, https://doi.org/10.5281/zenodo.1287237). Further data, scripts, and information can be obtained upon request from the corresponding author. Sample queries should also be directed to the corresponding author.
The supplement related to this article is available online at: https://doi.org/10.5194/se-12-633-2021-supplement.
JEK designed the experiments, prepared the tables and figures, and wrote the paper. JEK and LNS carried out the mechanical experiments and processed the data. JS prepared the samples and conducted physical measurements with AL, JEK, and LNS. AFB, ODL, JEK, and LNS processed the acoustic emission data. JEK, RC, TM, and YL collected the samples. All authors contributed to the preparation of the article.
The authors declare that they have no conflict of interest.
The authors would like to thank Takeshi Matsushima and Hiroshi Shimizu for their support and guidance. We also thank Michael Heap and Philip Benson for their constructive reviews. Jackie E. Kendrick was funded by an Early Career Fellowship of the Leverhulme Trust. Lauren N. Schaefer and Ben M. Kennedy were supported by the Royal Society Te Apārangi Marsden project “Shaking magma to trigger volcanic eruptions”. Yan Lavallée, Jenny Schauroth, Anthony Lamur, Oliver D. Lamb, and Rebecca Coats acknowledge funding from the European Research Council (ERC) Starting Grant on “Strain Localisation in Magma”. Fieldwork was funded by the DAIWA Anglo-Japanese Foundation.
This research has been supported by the European Research Council, FP7 Ideas: European Research Council (SLIM; grant no. 306488); the Leverhulme Trust (grant no. ECF-2016-325); the Marsden Fund (grant no. 15-UOC-049); and the Daiwa Anglo-Japanese Foundation (grant no. 11000/11740).
This paper was edited by Federico Rossetti and reviewed by Philip Benson and Michael Heap.
Alatorre-Ibargüengoitia, M. A., Scheu, B., Dingwell, D. B., Delgado-Granados, H., and Taddeucci, J.: Energy consumption by magmatic fragmentation and pyroclast ejection during Vulcanian eruptions, Earth Planet. Sci. Lett., 291, 60–69, https://doi.org/10.1016/j.epsl.2009.12.051, 2010.
Almberg, L. D., Larsen, J. F., Eichelberger, J. C., Vogel, T. A., and Patino, L. C.: Comparison of eruptive and intrusive samples from Unzen Volcano, Japan: Effects of contrasting pressure–temperature–time paths, J. Volcanol. Geoth. Res., 175, 60–70, https://doi.org/10.1016/j.jvolgeores.2008.03.020, 2008.
Althaus, E., Friz-Töpfer, A., Lempp, C., and Natau, O.: Effects of water on strength and failure mode of coarse-grained granites at 300 ∘C, Rock Mech. Rock Eng., 27, 1–21, https://doi.org/10.1007/BF01025953, 1994.
Ashby, M. F. and Sammis, C. G.: The damage mechanics of brittle solids in compression, Pure Appl. Geophys., 133, 489–521, https://doi.org/10.1007/BF00878002, 1990.
ASTM: D3967-08, Standard test method for splitting tensile strength of intact rock core specimens., ASTM International, West Conshohocken, USA, https://doi.org/10.1520/D3967-08, 2008.
ASTM: D7012-14e1, Standard Test Methods for Compressive Strength and Elastic Moduli of Intact Rock Core Specimens under Varying States of Stress and Temperatures, ASTM International, West Conshohocken, USA, https://doi.org/10.1520/D7012-14E01, 2014.
Ayling, M. R., Meredith, P. G., and Murrell, S. A. F.: Microcracking during triaxial deformation of porous rocks monitored by changes in rock physical properties, I. Elastic-wave propagation measurements on dry rocks, Tectonophysics, 245, 205–221, https://doi.org/10.1016/0040-1951(94)00235-2, 1995.
Ball, J. L., Stauffer, P. H., Calder, E. S., and Valentine, G. A.: The hydrothermal alteration of cooling lava domes, Bull. Volcanol., 77, 102, https://doi.org/10.1007/s00445-015-0986-z, 2015.
Baud, P., Zhu, W., and Wong, T.-F.: Failure mode and weakening effect of water on sandstone, J. Geophys. Res. Solid Earth, 105, 16371–16389, https://doi.org/10.1029/2000JB900087, 2000.
Bell, A. F.: Predictability of Landslide Timing From Quasi-Periodic Precursory Earthquakes, Geophys. Res. Lett., 45, 1860–1869, https://doi.org/10.1002/2017GL076730, 2018.
Bell, A. F., Naylor, M., Heap, M. J., and Main, I. G.: Forecasting volcanic eruptions and other material failure phenomena: An evaluation of the failure forecast method, Geophys. Res. Lett., 38, L15304, https://doi.org/10.1029/2011gl048155, 2011.
Bell, A. F., Kilburn, C. R. J., and Main, I. G.: Volcanic Eruptions, Real-Time Forecasting of, in: Encyclopedia of Earthquake Engineering, edited by: Beer, M., Kougioumtzoglou, I. A., Patelli, E., and Au, I. S.-K., Springer, Berlin, Heidelberg, 1–16, 2014.
Bell, A. F., Naylor, M., Hernandez, S., Main, I. G., Gaunt, H. E., Mothes, P., and Ruiz, M.: Volcanic Eruption Forecasts From Accelerating Rates of Drumbeat Long-Period Earthquakes, Geophys. Res. Lett., 45, 1339–1348, https://doi.org/10.1002/2017gl076429, 2018.
Benson, P. M., Thompson, B. D., Meredith, P. G., Vinciguerra, S., and Young, R. P.: Imaging slow failure in triaxially deformed Etna basalt using 3D acoustic-emission location and X-ray computed tomography, Geophys. Res. Lett., 34, L03303, https://doi.org/10.1029/2006GL028721, 2007.
Benson, P. M., Heap, M. J., Lavallée, Y., Flaws, A., Hess, K. U., Selvadurai, A. P. S., Dingwell, D. B., and Schillinger, B.: Laboratory simulations of tensile fracture development in a volcanic conduit via cyclic magma pressurisation, Earth Planet. Sci. Lett., 349–350, 231–239, https://doi.org/10.1016/j.epsl.2012.07.003, 2012.
Bernard, B., Kueppers, U., and Ortiz, H.: Revisiting the statistical analysis of pyroclast density and porosity data, Solid Earth, 6, 869–879, https://doi.org/10.5194/se-6-869-2015, 2015.
Borgia, A., Ferrari, L., and Pasquarè, G.: Importance of gravitational spreading in the tectonic and volcanic evolution of Mount Etna, Nature, 357, 231–235, https://doi.org/10.1038/357231a0, 1992.
Brantley, S. R. and Scott, W. E.: The danger of collapsing lava domes; lessons for Mount Hood, Oregon, Earthquakes Volcanoes (USGS), 24, 244–269, 1993.
Bubeck, A., Walker, R. J., Healy, D., Dobbs, M., and Holwell, D. A.: Pore geometry as a control on rock strength, Earth Planet. Sci. Lett., 457, 38–48, https://doi.org/10.1016/j.epsl.2016.09.050, 2017.
Calder, E. S., Luckett, R., Sparks, R. S. J., and Voight, B.: Mechanisms of lava dome instability and generation of rockfalls and pyroclastic flows at Soufrière Hills Volcano, Montserrat, Geol. Soc. Lond. Mem., 21, 173, https://doi.org/10.1144/GSL.MEM.2002.021.01.08, 2002.
Caricchi, L., Burlini, L., and Ulmer, P.: Propagation of P and S-waves in magmas with different crystal contents: Insights into the crystallinity of magmatic reservoirs, J. Volcanol. Geoth. Res., 178, 740–750, https://doi.org/10.1016/j.jvolgeores.2008.09.006, 2008.
Carrasco-Núñez, G., Díaz-Castellón, R., Siebert, L., Hubbard, B., Sheridan, M. F., and Rodríguez, S. R.: Multiple edifice-collapse events in the Eastern Mexican Volcanic Belt: The role of sloping substrate and implications for hazard assessment, J. Volcanol. Geoth. Res., 158, 151–176, https://doi.org/10.1016/j.jvolgeores.2006.04.025, 2006.
Cecchi, E., van Wyk de Vries, B., and Lavest, J.-M.: Flank spreading and collapse of weak-cored volcanoes, Bull. Volcanol., 67, 72–91, https://doi.org/10.1007/s00445-004-0369-3, 2004.
Chevrel, M. O., Cimarelli, C., deBiasi, L., Hanson, J. B., Lavallée, Y., Arzilli, F., and Dingwell, D. B.: Viscosity measurements of crystallizing andesite from Tungurahua volcano (Ecuador), Geochem. Geophy. Geosy., 16, 870–889, https://doi.org/10.1002/2014GC005661, 2015.
Chiba, K. and Shimizu, H.: Spatial and temporal distributions of b-value in and around Shinmoe-dake, Kirishima volcano, Japan, Earth Planets Space, 70, 122, https://doi.org/10.1186/s40623-018-0892-7, 2018.
Coats, R.: Young's Modulus for UCS, Zenodo, https://doi.org/10.5281/zenodo.1287237, 2018.
Coats, R., Kendrick, J. E., Wallace, P. A., Miwa, T., Hornby, A. J., Ashworth, J. D., Matsushima, T., and Lavallée, Y.: Failure criteria for porous dome rocks and lavas: a study of Mt. Unzen, Japan, Solid Earth, 9, 1299–1328, https://doi.org/10.5194/se-9-1299-2018, 2018.
Collinson, A. S. D. and Neuberg, J. W.: Gas storage, transport and pressure changes in an evolving permeable volcanic edifice, J. Volcanol. Geoth. Res., 243–244, 1–13, https://doi.org/10.1016/j.jvolgeores.2012.06.027, 2012.
Colombier, M., Wadsworth, F. B., Gurioli, L., Scheu, B., Kueppers, U., Di Muro, A., and Dingwell, D. B.: The evolution of pore connectivity in volcanic rocks, Earth Planet. Sci. Lett., 462, 99–109, https://doi.org/10.1016/j.epsl.2017.01.011, 2017.
Cordonnier, B., Hess, K.-U., Lavallée, Y., and Dingwell, D. B.: Rheological properties of dome lavas: Case study of Unzen volcano, Earth Planet. Sci. Lett., 279, 263–272, 2009.
Day, S. J.: Hydrothermal pore fluid pressure and the stability of porous, permeable volcanoes, Geol. Soc. Spec. Publ., 110, 77–93, https://doi.org/10.1144/gsl.sp.1996.110.01.06, 1996.
Delaney, P. T.: You can pile it only so high, Nature, 357, 194–196, https://doi.org/10.1038/357194a0, 1992.
Donnadieu, F., Merle, O., and Besson, J.-C.: Volcanic edifice stability during cryptodome intrusion, Bull. Volcanol., 63, 61–72, https://doi.org/10.1007/s004450000122, 2001.
Duda, M. and Renner, J.: The weakening effect of water on the brittle failure strength of sandstone, Geophys. J. Int., 192, 1091–1108, https://doi.org/10.1093/gji/ggs090, 2012.
Dusseault, M. B. and Fordham, C. J.: 6 – Time-dependent Behavior of Rocks, in: Rock Testing and Site Characterization, edited by: Hudson, J. A., Pergamon, Oxford, 119–149, 1993.
Elsworth, D. and Voight, B.: Evaluation of volcano flank instability triggered by dyke intrusion, Geol. Soc. Spec. Publ., 110, 45, https://doi.org/10.1144/GSL.SP.1996.110.01.03, 1996.
Elsworth, D., Voight, B., Thompson, G., and Young, S. R.: Thermal-hydrologic mechanism for rainfall-triggered collapse of lava domes, Geology, 32, 969–972, https://doi.org/10.1130/G20730.1, 2004.
Erdem, J. E. and Waite, G. P.: Temporal changes in eruptive behavior identified with coda wave interferometry and seismo-acoustic observations at Fuego Volcano, Guatemala, in: Understanding Open-Vent Volcanism and Related Hazards, edited by: Rose, W. I., Palma, J. L., Granados, H. D., and Varley, N., Geological Society of America, 2013.
Farquharson, J., Heap, M. J., Varley, N. R., Baud, P., and Reuschlé, T.: Permeability and porosity relationships of edifice-forming andesites: A combined field and laboratory study, J. Volcanol. Geoth. Res., 297, 52–68, https://doi.org/10.1016/j.jvolgeores.2015.03.016, 2015.
Farquharson, J., Heap, M. J., Baud, P., Reuschlé, T., and Varley, N. R.: Pore pressure embrittlement in a volcanic edifice, Bull. Volcanol., 78, 6, https://doi.org/10.1007/s00445-015-0997-9, 2016.
Farquharson, J. I., Wild, B., Kushnir, A. R. L., Heap, M. J., Baud, P., and Kennedy, B.: Acid-Induced Dissolution of Andesite: Evolution of Permeability and Strength, J. Geophys. Res.-Sol. Ea., 124, 257–273, https://doi.org/10.1029/2018jb016130, 2019.
Filomena, C. M., Hornung, J., and Stollhofen, H.: Assessing accuracy of gas-driven permeability measurements: a comparative study of diverse Hassler-cell and probe permeameter devices, Solid Earth, 5, 1–11, https://doi.org/10.5194/se-5-1-2014, 2014.
Fink, J. H. and Anderson, S. W.: Lava Domes and Coulees, in: Encyclopedia of Volcanoes, edited by: Sigurdsson, H., Houghton, B., McNutt, S. R., Rymer, H., and Stix, J., Academic Press, ISBN 978-0-0805-4798-5 , 307–320, 2000.
Goggin, D., Thrasher, R., and Lake, L.: A theoretical and experimental analysis of minipermeameter response including gas slippage and high velocity flow effects, In Situ, 12, 79–116, 1988.
Grêt, A., Snieder, R., and Scales, J.: Time-lapse monitoring of rock properties with coda wave interferometry, J. Geophys. Res. Solid Earth, 111, B03305, https://doi.org/10.1029/2004jb003354, 2006.
Grgic, D. and Giraud, A.: The influence of different fluids on the static fatigue of a porous rock: Poro-mechanical coupling versus chemical effects, Mech. Mater., 71, 34–51, https://doi.org/10.1016/j.mechmat.2013.06.011, 2014.
Griffiths, L., Heap, M. J., Xu, T., Chen, C.-f., and Baud, P.: The influence of pore geometry and orientation on the strength and stiffness of porous rock, J. Struct. Geol., 96, 149–160, https://doi.org/10.1016/j.jsg.2017.02.006, 2017.
Griffiths, L., Lengliné, O., Heap, M. J., Baud, P., and Schmittbuhl, J.: Thermal Cracking in Westerly Granite Monitored Using Direct Wave Velocity, Coda Wave Interferometry, and Acoustic Emissions, J. Geophys. Res.-Sol. Ea., 123, 2246–2261, https://doi.org/10.1002/2017jb015191, 2018.
Gueguen, Y. and Dienes, J.: Transport properties of rocks from statistics and percolation, Math. Geol., 21, 1–13, https://doi.org/10.1007/BF00897237, 1989.
Gutenberg, B. and Richter, C. F.: Seismicity of the Earth and associated phenomena, Princeton University Press, New Jersey, USA, 273, 1949.
Hadziioannou, C., Larose, E., Coutant, O., Roux, P., and Campillo, M.: Stability of monitoring weak changes in multiply scattering media with ambient noise correlation: Laboratory experiments, J. Acoust. Soc. Am., 125, 3688–3695, https://doi.org/10.1121/1.3125345, 2009.
Hale, A. J. and Wadge, G.: The transition from endogenous to exogenous growth of lava domes with the development of shear bands, J. Volcanol. Geoth. Res., 171, 237–257, https://doi.org/10.1016/j.jvolgeores.2007.12.016, 2008.
Haney, M. M., Hotovec-Ellis, A. J., Bennington, N. L., De Angelis, S., and Thurber, C.: Tracking Changes in Volcanic Systems with Seismic Interferometry, in: Encyclopedia of Earthquake Engineering, edited by: Beer, M., Kougioumtzoglou, I. A., Patelli, E., and Au, I. S.-K., Springer, Berlin, Heidelberg, 1–23, 2014.
Harnett, C. E., Benson, P. M., Rowley, P., and Fazio, M.: Fracture and damage localization in volcanic edifice rocks from El Hierro, Stromboli and Tenerife, Sci. Rep., 8, 1942, https://doi.org/10.1038/s41598-018-20442-w, 2018a.
Harnett, C. E., Thomas, M. E., Purvance, M. D., and Neuberg, J.: Using a discrete element approach to model lava dome emplacement and collapse, J. Volcanol. Geoth. Res., 359, 68–77, https://doi.org/10.1016/j.jvolgeores.2018.06.017, 2018b.
Harnett, C. E., Kendrick, J. E., Lamur, A., Thomas, M. E., Stinton, A., Wallace, P. A., Utley, J. E. P., Murphy, W., Neuberg, J., and Lavallée, Y.: Evolution of Mechanical Properties of Lava Dome Rocks Across the 1995–2010 Eruption of Soufrière Hills Volcano, Montserrat, Front. Earth Sci., 7, 7, https://doi.org/10.3389/feart.2019.00007, 2019a.
Harnett, C. E., Thomas, M. E., Calder, E. S., Ebmeier, S. K., Telford, A., Murphy, W., and Neuberg, J.: Presentation and analysis of a worldwide database for lava dome collapse events: the Global Archive of Dome Instabilities (GLADIS), Bull. Volcanol., 81, 16, https://doi.org/10.1007/s00445-019-1276-y, 2019b.
Heap, M., Xu, T., and Chen, C.-F.: The influence of porosity and vesicle size on the brittle strength of volcanic rocks and magma, Bull. Volcanol., 76, 1–15, https://doi.org/10.1007/s00445-014-0856-0, 2014a.
Heap, M. J., Baud, P., Meredith, P. G., Vinciguerra, S., Bell, A. F., and Main, I. G.: Brittle creep in basalt and its application to time-dependent volcano deformation, Earth Planet. Sci. Lett., 307, 71–82, https://doi.org/10.1016/j.epsl.2011.04.035, 2011.
Heap, M. J., Lavallée, Y., Petrakova, L., Baud, P., Reuschlé, T., Varley, N. R., and Dingwell, D. B.: Microstructural controls on the physical and mechanical properties of edifice-forming andesites at Volcán de Colima, Mexico, J. Geophys. Res.-Sol. Ea., 2013JB010521, https://doi.org/10.1002/2013jb010521, 2014b.
Heap, M. J., Russell, J. K., and Kennedy, L. A.: Mechanical behaviour of dacite from Mount St. Helens (USA): A link between porosity and lava dome extrusion mechanism (dome or spine)?, J. Volcanol. Geoth. Res., 328, 159–177, https://doi.org/10.1016/j.jvolgeores.2016.10.015, 2016a.
Heap, M. J., Wadsworth, F. B., Xu, T., Chen, C.-f., and Tang, C. a.: The strength of heterogeneous volcanic rocks: A 2D approximation, J. Volcanol. Geoth. Res., 319, 1–11, https://doi.org/10.1016/j.jvolgeores.2016.03.013, 2016b.
Heap, M. J., Villeneuve, M., Albino, F., Farquharson, J. I., Brothelande, E., Amelung, F., Got, J.-L., and Baud, P.: Towards more realistic values of elastic moduli for volcano modelling, J. Volcanol. Geoth. Res., 390, 106684, https://doi.org/10.1016/j.jvolgeores.2019.106684, 2020.
Herd, R. A. and Pinkerton, H.: Bubble coalescence in basaltic lava: Its impact on the evolution of bubble populations, J. Volcanol. Geoth. Res., 75, 137–157, https://doi.org/10.1016/S0377-0273(96)00039-X, 1997.
Hirakawa, Y., Usuki, N., Fujita, K., Tanaka, T., Kaneko, M., Ueno, T., Eguchi, H., and Shimokubo, K.: Monitoring System of a Large Rockslide in Heisei-Shinzan Lava Dome, Mt. Unzen, Japan INTERPRAEVENT 2018 in the Pacific Rim, 1–4 October 2018, Japan, 2018.
Hoek, E., Corkum, B., and Carranza-Torres, C.: Hoek-Brown criterion – 2002 edition, in: Mining and tunnelling innovation and opportunity, edited by: Hammah, R., Bawden, W., Curran, J., and Telesnicki, M., proceedings of the 5th North American rock mechanics symposium and 17th tunnelling association of Canada conference, University of Toronto, Toronto, Canada, 267–273, 2002.
Hornby, A. J., Kendrick, J. E., Lamb, O. D., Hirose, T., De Angelis, S., von Aulock, F. W., Umakoshi, K., Miwa, T., Henton De Angelis, S., Wadsworth, F. B., Hess, K.-U., Dingwell, D. B., and Lavallée, Y.: Spine growth and seismogenic faulting at Mt. Unzen, Japan, J. Geophys. Res.-Sol. Ea., 2014JB011660, https://doi.org/10.1002/2014JB011660, 2015.
Hornby, A. J., Lavallée, Y., Kendrick, J. E., De Angelis, S., Lamur, A., Lamb, O. D., Rietbrock, A., and Chigna, G.: Brittle-Ductile Deformation and Tensile Rupture of Dome Lava During Inflation at Santiaguito, Guatemala, J. Geophys. Res.-Sol. Ea., 124, 10107–10131, https://doi.org/10.1029/2018JB017253, 2019.
Horwell, C., Williamson, B., Llewellin, E., Damby, D., and Blond, J.: The nature and formation of cristobalite at the Soufrière Hills volcano, Montserrat: implications for the petrology and stability of silicic lava domes, Bull. Volcanol., 75, 1–19, https://doi.org/10.1007/s00445-013-0696-3, 2013.
Hunt, J. E., Cassidy, M., and Talling, P. J.: Multi-stage volcanic island flank collapses with coeval explosive caldera-forming eruptions, Sci. Rep., 8, 1146, https://doi.org/10.1038/s41598-018-19285-2, 2018.
Husain, T., Elsworth, D., Voight, B., Mattioli, G., and Jansma, P.: Influence of extrusion rate and magma rheology on the growth of lava domes: Insights from particle-dynamics modeling, J. Volcanol. Geoth. Res., 285, 100–117, https://doi.org/10.1016/j.jvolgeores.2014.08.013, 2014.
Ignatieva, A., Bell, A. F., and Worton, B.: Point Process Models for Quasi-Periodic Volcanic Earthquakes, Stat. Volcanol., 4, 1–27, 2018.
ISRM: Suggested methods for determining tensile strength of rock materials, Int. J. Rock Mech. Min. Sci. Geomech. Abstr., 15, 99–103, https://doi.org/10.1016/0148-9062(78)90003-7, 1978.
Kato, A., Terakawa, T., Yamanaka, Y., Maeda, Y., Horikawa, S., Matsuhiro, K., and Okuda, T.: Preparatory and precursory processes leading up to the 2014 phreatic eruption of Mount Ontake, Japan, Earth Planets Space, 67, 111, https://doi.org/10.1186/s40623-015-0288-x, 2015.
Kendrick, J., Smith, R., Sammonds, P., Meredith, P., Dainty, M., and Pallister, J.: The influence of thermal and cyclic stressing on the strength of rocks from Mount St. Helens, Washington, Bull. Volcanol., 75, 1–12, https://doi.org/10.1007/s00445-013-0728-z, 2013.
Kendrick, J. E., Lavallée, Y., Mariani, E., Dingwell, D. B., Wheeler, J., and Varley, N. R.: Crystal plasticity as an indicator of the viscous-brittle transition in magmas, Nat. Commun., 8, 1926, https://doi.org/10.1038/s41467-017-01931-4, 2017.
Kennedy, B., Farquhar, A., Hilderman, R. X., Villeneuve, M., Heap, M. J., Mordensky, S., Kilgour, G. N., Jolly, A. D., Christenson, B., and Reuschlè, T.: Pressure Controlled Permeability in a Conduit Filled with Fractured Hydrothermal Breccia Reconstructed from Ballistics from Whakaari (White Island), New Zealand, Geosciences, 10, 138, https://doi.org/10.3390/geosciences10040138, 2020.
Kennedy, L. A., Russell, J. K., and Nelles, E.: Origins of Mount St. Helens cataclasites: Experimental insights, Am. Mineral., 94, 995–1004, https://doi.org/10.2138/am.2009.3129, 2009.
Kilburn, C. R. J.: Multiscale fracturing as a key to forecasting volcanic eruptions, J. Volcanol. Geoth. Res., 125, 271–289, 2003.
Klug, C. and Cashman, K. V.: Permeability development in vesiculating magmas: implications for fragmentation, Bull. Volcanol., 58, 87–100, https://doi.org/10.1007/s004450050128, 1996.
Kolzenburg, S., Giordano, D., Cimarelli, C., and Dingwell, D. B.: In situ thermal characterization of cooling/crystallizing lavas during rheology measurements and implications for lava flow emplacement, Geochim. Cosmochim. Ac, 195, 244–258, https://doi.org/10.1016/j.gca.2016.09.022, 2016.
Kremers, S., Scheu, B., Cordonnier, B., Spieler, O., and Dingwell, D. B.: Influence of decompression rate on fragmentation processes: An experimental study, J. Volcanol. Geoth. Res., 193, 182–188, https://doi.org/10.1016/j.jvolgeores.2010.01.015, 2010.
Kueppers, U., Scheu, B., Spieler, O., and Dingwell, D. B.: Field-based density measurements as tool to identify preeruption dome structure: set-up and first results from Unzen volcano, Japan, J. Volcanol. Geoth. Res., 141, 65–75, https://doi.org/10.1016/j.jvolgeores.2004.09.005, 2005.
Lamb, O. D., De Angelis, S., Umakoshi, K., Hornby, A. J., Kendrick, J. E., and Lavallée, Y.: Repetitive fracturing during spine extrusion at Unzen volcano, Japan, Solid Earth, 6, 1277–1293, https://doi.org/10.5194/se-6-1277-2015, 2015.
Lamb, O. D., De Angelis, S., Wall, R. J., Lamur, A., Varley, N. R., Reyes-Dávila, G., Arámbula-Mendoza, R., Hornby, A. J., Kendrick, J. E., and Lavallée, Y.: Seismic and experimental insights into eruption precursors at Volcán de Colima, Geophys. Res. Lett., 44, 6092–6100, https://doi.org/10.1002/2017GL073350, 2017.
Lamur, A., Kendrick, J. E., Eggertsson, G. H., Wall, R. J., Ashworth, J. D., and Lavallée, Y.: The permeability of fractured rocks in pressurised volcanic and geothermal systems, Sci. Rep., 7, 6173, https://doi.org/10.1038/s41598-017-05460-4, 2017.
Lamur, A., Lavallée, Y., Iddon, F. E., Hornby, A. J., Kendrick, J. E., von Aulock, F. W., and Wadsworth, F. B.: Disclosing the temperature of columnar jointing in lavas, Nat. Commun., 9, 1432, https://doi.org/10.1038/s41467-018-03842-4, 2018.
Lavallée, Y., Hess, K. U., Cordonnier, B., and Dingwell, D. B.: Non-Newtonian rheological law for highly crystalline dome lavas, Geology, 35, 843–846, 2007.
Lavallée, Y., Meredith, P. G., Dingwell, D. B., Hess, K. U., Wassermann, J., Cordonnier, B., Gerik, A., and Kruhl, J. H.: Seismogenic lavas and explosive eruption forecasting, Nature, 453, 507–510, 2008.
Lavallée, Y., Benson, P., Hess, K.-U., Flaws, A., Schillinger, B., Meredith, P. G., and Dingwell, D. B.: Reconstructing magma failure and the permeable degassing network, Geology, 41, 515–518, 2013.
Lavallée, Y. and Kendrick, J. E.: A review of the physical and mechanical properties of volcanic rocks and magmas in the brittle and ductile fields, in: Forecasting and planning for volcanic hazards, risks, and disasters, edited by: Papale, P., Elsevier, 2020.
Lesage, P., Heap, M. J., and Kushnir, A.: A generic model for the shallow velocity structure of volcanoes, J. Volcanol. Geoth. Res., 356, 114–126, https://doi.org/10.1016/j.jvolgeores.2018.03.003, 2018.
Li, D. and Wong, L. N. Y.: The Brazilian Disc Test for Rock Mechanics Applications: Review and New Insights, Rock Mech. Rock Eng., 46, 269–287, https://doi.org/10.1007/s00603-012-0257-7, 2013.
Lockner, D. A.: The role of acoustic emission in the study of rock, Int. J. Rock Mech. Min. Sci. Geomech. Abstr., 30, 883–899, 1993.
Lydzba, D., Pietruszczak, S., and Shao, J. F.: On anisotropy of stratified rocks: homogenization and fabric tensor approach, Comput. Geotech., 30, 289–302, https://doi.org/10.1016/S0266-352X(03)00004-1, 2003.
Maccaferri, F., Richter, N., and Walter, T. R.: The effect of giant lateral collapses on magma pathways and the location of volcanism, Nat. Commun., 8, 1097, https://doi.org/10.1038/s41467-017-01256-2, 2017.
Main, I. G., Meredith, P. G., and Sammonds, P. R.: Temporal variations in seismic event rate and b-values from stress corrosion constitutive laws, Tectonophysics, 211, 233–246, 1992.
Makhnenko, R. Y. and Labuz, J. F.: Elastic and inelastic deformation of fluid-saturated rock, Philos. Trans. Royal Soc. A, 374, 20150422, https://doi.org/10.1098/rsta.2015.0422, 2016.
McGuire, W. J.: Volcano instability: a review of contemporary themes, Geol. Soc. Spec. Publ., 110, 1, https://doi.org/10.1144/GSL.SP.1996.110.01.01, 1996.
Meredith, P. G. and Atkinson, B. K.: Stress corrosion and acoustic emission during tensile crack propagation in Whin Sill dolerite and other basic rocks, Geophys. J. Int., 75, 1–21, 1983.
Meredith, P. G., Main, I. G., and Jones, C.: Temporal Variations in Seismicity During Quasi-Static and Dynamic Rock Failure, Tectonophysics, 175, 249–268, 1990.
Miwa, T., Okumura, S., Matsushima, T., and Shimizu, H.: Asymmetric deformation structure of lava spine in Unzen Volcano Japan, American Geophysical Union, Fall Meeting San Francisco, CA, 9–13 December 2013, abstract no. 2013AGUFM.V14A..03M, 2013.
Mollo, S., Vinciguerra, S., Iezzi, G., Iarocci, A., Scarlato, P., Heap, M. J., and Dingwell, D. B.: Volcanic edifice weakening via devolatilization reactions, Geophys. J. Int., 186, 1073–1077, https://doi.org/10.1111/j.1365-246X.2011.05097.x, 2011.
Mordensky, S. P., Villeneuve, M. C., Farquharson, J. I., Kennedy, B. M., Heap, M. J., and Gravley, D. M.: Rock mass properties and edifice strength data from Pinnacle Ridge, Mt. Ruapehu, New Zealand, J. Volcanol. Geoth. Res., 367, 46–62, https://doi.org/10.1016/j.jvolgeores.2018.09.012, 2018.
Mordensky, S. P., Heap, M. J., Kennedy, B. M., Gilg, H. A., Villeneuve, M. C., Farquharson, J. I., and Gravley, D. M.: Influence of alteration on the mechanical behaviour and failure mode of andesite: implications for shallow seismicity and volcano monitoring, Bull. Volcanol., 81, 44, https://doi.org/10.1007/s00445-019-1306-9, 2019.
Mueller, S., Melnik, O., Spieler, O., Scheu, B., and Dingwell, D. B.: Permeability and degassing of dome lavas undergoing rapid decompression: An experimental determination, Bull. Volcanol., 67, 526–538, https://doi.org/10.1007/s00445-004-0392-4, 2005.
Mueller, S., Scheu, B., Spieler, O., and Dingwell, D. B.: Permeability control on magma fragmentation, Geology, 36, 399–402, 2008.
Nakada, S. and Fujii, T.: Preliminary report on the activity at Unzen Volcano (Japan), November 1990–November 1991: Dacite lava domes and pyroclastic flows, J. Volcanol. Geoth. Res., 54, 319–333, https://doi.org/10.1016/0377-0273(93)90070-8, 1993.
Nakada, S. and Motomura, Y.: Petrology of the 1991-1995 eruption at Unzen: effusion pulsation and groundmass crystallization, J. Volcanol. Geoth. Res., 89, 173–196, https://doi.org/10.1016/s0377-0273(98)00131-0, 1999.
Nakada, S., Miyake, Y., Sato, H., Oshima, O., and Fujinawa, A.: Endogenous growth of dacite dome at Unzen volcano (Japan), 1993–1994, Geology, 23, 157–160, https://doi.org/10.1130/0091-7613(1995)023<0157:egodda>2.3.co;2, 1995.
Nakada, S., Shimizu, H., and Ohta, K.: Overview of the 1990-1995 eruption at Unzen Volcano, J. Volcanol. Geoth. Res., 89, 1–22, https://doi.org/10.1016/s0377-0273(98)00118-8, 1999.
Noguchi, S., Toramaru, A., and Nakada, S.: Relation between microlite textures and discharge rate during the 1991-1995 eruptions at Unzen, Japan, J. Volcanol. Geoth. Res., 175, 141–155, https://doi.org/10.1016/j.jvolgeores.2008.03.025, 2008.
Okumura, S., Nakamura, M., Nakano, T., Uesugi, K., and Tsuchiyama, A.: Shear deformation experiments on vesicular rhyolite: Implications for brittle fracturing, degassing, and compaction of magmas in volcanic conduits, J. Geophys. Res.-Sol. Ea., 115, B06201, https://doi.org/10.1029/2009JB006904, 2010.
Pappalardo, G., Punturo, R., Mineo, S., and Contrafatto, L.: The role of porosity on the engineering geological properties of 1669 lavas from Mount Etna, Eng. Geol., 221, 16–28, https://doi.org/10.1016/j.enggeo.2017.02.020, 2017.
Patanè, G., Montalto, A., Imposa, S., and Menza, S.: The role of regional tectonics, magma pressure and gravitational spreading in earthquakes of the eastern sector of Mt. Etna volcano (Italy), J. Volcanol. Geoth. Res., 61, 253–266, https://doi.org/10.1016/0377-0273(94)90007-8, 1994.
Paterson, M. S. and Wong, T.: Experimental Rock Deformation – The Brittle Field, Springer, Berlin, Heidelberg, 2005.
Planet: Planet Application Program Interface: In Space for Life on Earth, available at: https://api.planet.com (last access: 7 June 2020), San Francisco, CA, 2017.
Pola, A., Crosta, G. B., Fusi, N., and Castellanza, R.: General characterization of the mechanical behaviour of different volcanic rocks with respect to alteration, Eng. Geol., 169, 1–13, https://doi.org/10.1016/j.enggeo.2013.11.011, 2014.
Pollock, A. A.: Acoustic emission – 2: Acoustic emission amplitudes, Non-Destruct. Test., 6, 264–269, https://doi.org/10.1016/0029-1021(73)90074-1, 1973.
Reid, M. E., Keith, T. E. C., Kayen, R. E., Iverson, N. R., Iverson, R. M., and Brien, D. L.: Volcano collapse promoted by progressive strength reduction: new data from Mount St. Helens, Bull. Volcanol., 72, 761–766, https://doi.org/10.1007/s00445-010-0377-4, 2010.
Reid, M. E., Christian, S. B., and Brien, D. L.: Gravitational stability of three-dimensional stratovolcano edifices, J. Geophys. Res.-Sol. Ea., 105, 6043–6056, https://doi.org/10.1029/1999JB900310, 2000.
Ribeiro, A.: Soft plate and impact tectonics, Springer, Berlin, Heidelberg, ISBN 978-3-540-67963-9, 2012.
Roberts, N. S., Bell, A. F., and Main, I. G.: Are volcanic seismic b-values high, and if so when?, J. Volcanol. Geoth. Res., 308, 127–141, https://doi.org/10.1016/j.jvolgeores.2015.10.021, 2015.
Rosas-Carbajal, M., Komorowski, J.-C., Nicollin, F., and Gibert, D.: Volcano electrical tomography unveils edifice collapse hazard linked to hydrothermal system structure and dynamics, Sci. Rep., 6, 29899, https://doi.org/10.1038/srep29899, 2016.
Saar, M. O. and Manga, M.: Permeability-porosity relationship in vesicular basalts, Geophys. Res. Lett., 26, 111–114, https://doi.org/10.1029/1998gl900256, 1999.
Saito, T. and Shikawa, N.: Magnetic petrology and its implication for magma mixing of the 1991-1995 dacite at Unzen volcano, Japan, Earth Planets Space, 59, 863–870, 2007.
Sammis, C. G. and Ashby, M. F.: The failure of brittle porous solids under compressive stress states, Acta Metall. Mater., 34, 511–526, https://doi.org/10.1016/0001-6160(86)90087-8, 1986.
Sammonds, P. R. and Ohnaka, M.: Evolution of microseismicity during frictional sliding, Geophys. Res. Lett., 25, 699–702, 1998.
Sato, H., Fujii, T., and Nakada, S.: Crumbling of dacite dome lava and generation of pyroclastic flows at Unzen volcano, Nature, 360, 664–666, https://doi.org/10.1038/360664a0, 1992.
Saubin, E., Kennedy, B., Tuffen, H., Villeneuve, M., Davidson, J., and Burchardt, S.: Comparative field study of shallow rhyolite intrusions in Iceland: Emplacement mechanisms and impact on country rocks, J. Volcanol. Geoth. Res., 388, 106691, https://doi.org/10.1016/j.jvolgeores.2019.106691, 2019.
Schaefer, L. N., Kendrick, J. E., Lavallée, Y., Oommen, T., and Chigna, G.: Geomechanical rock properties of a basaltic volcano, Front. Earth Sci., 3, 29, https://doi.org/10.3389/feart.2015.00029, 2015.
Schaefer, L. N., Di Traglia, F., Chaussard, E., Lu, Z., Nolesini, T., and Casagli, N.: Monitoring volcano slope instability with Synthetic Aperture Radar: A review and new data from Pacaya (Guatemala) and Stromboli (Italy) volcanoes, Earth-Sci. Rev., 192, 236–257, https://doi.org/10.1016/j.earscirev.2019.03.009, 2019.
Scheu, B., Kern, H., Spieler, O., and Dingwell, D. B.: Temperature dependence of elastic P- and S-wave velocities in porous Mt. Unzen dacite, J. Volcanol. Geoth. Res., 153, 136–147, https://doi.org/10.1016/j.jvolgeores.2005.08.007, 2006a.
Scheu, B., Spieler, O., and Dingwell, D. B.: Dynamics of explosive volcanism at Unzen volcano: an experimental contribution, Bull. Volcanol., 69, 175–187, 2006b.
Scheu, B., Kueppers, U., Mueller, S., Spieler, O., and Dingwell, D. B.: Experimental volcanology on eruptive products of Unzen volcano, J. Volcanol. Geoth. Res., 175, 110–119, https://doi.org/10.1016/j.jvolgeores.2008.03.023, 2008.
Scholz, C. H.: The frequency-magnitude relation of microfracturing in rock and its relation to earthquakes, B. Seismol. Soc. Am., 58, 399–415, 1968.
Schorlemmer, D., Wiemer, S., and Wyss, M.: Variations in earthquake-size distribution across different stress regimes, Nature, 437, 539–542, https://doi.org/10.1038/nature04094, 2005.
Shi, X., Jiang, Y., and Hirakawa, Y.: Growth and potential collapse of the lava dome in Unzen volcano and the estimation on block-and-ash flows, Geosci. J., 22, 273–286, https://doi.org/10.1007/s12303-017-0051-3, 2018.
Shields, J. K., Mader, H. M., Caricchi, L., Tuffen, H., Mueller, S., Pistone, M., and Baumgartner, L.: Unravelling textural heterogeneity in obsidian: Shear-induced outgassing in the Rocche Rosse flow, J. Volcanol. Geoth. Res., 310, 137–158, https://doi.org/10.1016/j.jvolgeores.2015.12.003, 2016.
Shimada, M.: Mechanism of deformation in a dry porous basalt at high pressures, Tectonophysics, 121, 153–173, https://doi.org/10.1016/0040-1951(86)90041-7, 1986.
Singh, J., Curtis, A., Zhao, Y., Cartwright-Taylor, A., and Main, I.: Coda Wave Interferometry for Accurate Simultaneous Monitoring of Velocity and Acoustic Source Locations in Experimental Rock Physics, J. Geophys. Res.-Sol. Ea., 124, 5629–5655, https://doi.org/10.1029/2019JB017577, 2019.
Smith, R., Sammonds, P. R., Tuffen, H., and Meredith, P. G.: Evolution of the mechanics of the 2004-2008 Mt. St. Helens lava dome with time and temperature, Earth Planet. Sci. Lett., 307, 191–200, https://doi.org/10.1016/j.epsl.2011.04.044, 2011.
Smith, T.: A capillary model for stress-corrosion cracking of metals in fluid media, Corros. Sci., 12, 45–56, https://doi.org/10.1016/S0010-938X(72)90539-2, 1972.
Snieder, R., Grêt, A., Douma, H., and Scales, J.: Coda Wave Interferometry for Estimating Nonlinear Behavior in Seismic Velocity, Science, 295, 2253–2255, https://doi.org/10.1126/science.1070015, 2002.
Snieder, R., Prejean, S., and Johnson, J. B.: Spatial variation in Mount St. Helens clones from coda wave analysis, Center for Wave Phenomena Consortium Preject, CPW-543, 2006.
Spieler, O., Kennedy, B., Kueppers, U., Dingwell, D. B., Scheu, B., and Taddeucci, J.: The fragmentation threshold of pyroclastic rocks, Earth Planet. Sci. Lett., 226, 139–148, 2004.
Surono, Jousset, P., Pallister, J., Boichu, M., Buongiorno, M. F., Budisantoso, A., Costa, F., Andreastuti, S., Prata, F., Schneider, D., Clarisse, L., Humaida, H., Sumarti, S., Bignami, C., Griswold, J., Carn, S., Oppenheimer, C., and Lavigne, F.: The 2010 explosive eruption of Java's Merapi volcano – A “100 year” event, J. Volcanol. Geoth. Res., 241–242, 121–135, https://doi.org/10.1016/j.jvolgeores.2012.06.018, 2012.
Thomas, M. E., Petford, N., and Bromhead, E. N.: Volcanic rock-mass properties from Snowdonia and Tenerife: implications for volcano edifice strength, J. Geol. Soc., 161, 939–946, https://doi.org/10.1144/0016-764903-166, 2004.
Tibaldi, A.: Multiple sector collapses at stromboli volcano, Italy: how they work, Bull. Volcanol., 63, 112–125, https://doi.org/10.1007/s004450100129, 2001.
van Wyk de Vries, B. and Francis, P. W.: Catastrophic collapse at stratovolcanoes induced by gradual volcano spreading, Nature, 387, 387–390, https://doi.org/10.1038/387387a0, 1997.
Vanorio, T., Prasad, M., Patella, D., and Nur, A.: Ultrasonic velocity measurements in volcanic rocks: correlation with microtexture, Geophys. J. Int., 149, 22–36, https://doi.org/10.1046/j.0956-540x.2001.01580.x, 2002.
Vasseur, J., Wadsworth, F. B., Lavallee, Y., Bell, A. F., Main, I. G., and Dingwell, D. B.: Heterogeneity: The key to failure forecasting, Sci. Rep., 5, 13259, https://doi.org/10.1038/srep13259, 2015.
Voight, B., Janda, R. J., Glicken, H., and Douglass, P. M.: Nature and mechanics of the Mount St Helens rockslide-avalanche of 18 May 1980, Géotechnique, 33, 243–273, https://doi.org/10.1680/geot.1983.33.3.243, 1983.
Voight, B.: A Method for prediction of volcanic eruptions, Nature, 332, 125–130, 1988.
Voight, B.: A relation to describe rate-dependent material failure, Science, 243, 200–203, 1989.
Voight, B. and Elsworth, D.: Instability and collapse of hazardous gas-pressurized lava domes, Geophys. Res. Lett., 27, 1–4, 2000.
Wallace, P. A., Kendrick, J. E., Miwa, T., Ashworth, J. D., Coats, R., Utley, J. E. P., Henton De Angelis, S., Mariani, E., Biggin, A., Kendrick, R., Nakada, S., Matsushima, T., and Lavallée, Y.: Petrological Architecture of a Magmatic Shear Zone: A Multidisciplinary Investigation of Strain Localisation During Magma Ascent at Unzen Volcano, Japan, J. Petrol., 60, 791–826, https://doi.org/10.1093/petrology/egz016, 2019.
Walter, T. R., Wang, R., Zimmer, M., Grosser, H., Lühr, B., and Ratdomopurbo, A.: Volcanic activity influenced by tectonic earthquakes: Static and dynamic stress triggering at Mt. Merapi, Geophys. Res. Lett., 34, L05304, https://doi.org/10.1029/2006GL028710, 2007.
Walter, T. R., Subandriyo, J., Kirbani, S., Bathke, H., Suryanto, W., Aisyah, N., Darmawan, H., Jousset, P., Luehr, B. G., and Dahm, T.: Volcano-tectonic control of Merapi's lava dome splitting: The November 2013 fracture observed from high resolution TerraSAR-X data, Tectonophysics, 639, 23–33, https://doi.org/10.1016/j.tecto.2014.11.007, 2015.
Walter, T. R., Harnett, C. E., Varley, N., Bracamontes, D. V., Salzer, J., Zorn, E. U., Bretón, M., Arámbula, R., and Thomas, M. E.: Imaging the 2013 explosive crater excavation and new dome formation at Volcán de Colima with TerraSAR-X, time-lapse cameras and modelling, J. Volcanol. Geoth. Res., 369, 224–237, https://doi.org/10.1016/j.jvolgeores.2018.11.016, 2019.
Watanabe, T., Shimizu, Y., Noguchi, S., and Nakada, S.: Permeability measurements on rock samples from Unzen Scientific Drilling Project Drill Hole 4 (USDP-4), J. Volcanol. Geoth. Res., 175, 82–90, https://doi.org/10.1016/j.jvolgeores.2008.03.021, 2008.
Weaver, J., Eggertsson, G. H., Utley, J. E. P., Wallace, P. A., Lamur, A., Kendrick, J. E., Tuffen, H., Markússon, S. H., and Lavallée, Y.: Thermal Liability of Hyaloclastite in the Krafla Geothermal Reservoir, Iceland: The Impact of Phyllosilicates on Permeability and Rock Strength, Geofluids, 2020, 9057193, https://doi.org/10.1155/2020/9057193, 2020.
Webb, S.: Silicate melts: Relaxation, rheology, and the glass transition, Rev. Geophys., 35, 191–218, https://doi.org/10.1029/96RG03263, 1997.
Williams, R., Rowley, P., and Garthwaite, M. C.: Reconstructing the Anak Krakatau flank collapse that caused the December 2018 Indonesian tsunami, Geology, 47, 973–976, https://doi.org/10.1130/G46517.1, 2019.
Wong, L. N. Y. and Jong, M. C.: Water Saturation Effects on the Brazilian Tensile Strength of Gypsum and Assessment of Cracking Processes Using High-Speed Video, Rock Mech. Rock Eng., 47, 1103–1115, https://doi.org/10.1007/s00603-013-0436-1, 2014.
Wyering, L. D., Villeneuve, M. C., Wallis, I. C., Siratovich, P. A., Kennedy, B. M., Gravley, D. M., and Cant, J. L.: Mechanical and physical properties of hydrothermally altered rocks, Taupo Volcanic Zone, New Zealand, J. Volcanol. Geoth. Res., 288, 76–93, https://doi.org/10.1016/j.jvolgeores.2014.10.008, 2014.
Zhang, G., Li, H., Wang, M., Li, X., Wang, Z., and Deng, S.: Crack-induced acoustic emission and anisotropy variation of brittle rocks containing natural fractures, J. Geophys. Eng., 16, 599–610, https://doi.org/10.1093/jge/gxz031, 2019.
Zimmerman, R. W.: Compressibility of Sandstones, Developments in Petroleum Science, edited by: Zimmerman, R. W., Elsevier, 1991.