the Creative Commons Attribution 4.0 License.
the Creative Commons Attribution 4.0 License.
 | 12 Jan 2022
Forearc density structure of the overriding plate in the northern area of the giant 1960 Valdivia earthquake
Andrei Maksymowicz
Daniela Montecinos-Cuadros
Daniel Díaz
María José Segovia
Tomás Reyes
The objective of this work is to analyse the density structure of the continental forearc in the northern segment of the 1960 Mw 9.6 Valdivia earthquake. Regional 2D and local 3D density models have been obtained from available gravity data in the area, complemented by new gravimetric stations. Models are constrained by independent geophysical and geological information and new TEM and MT soundings. The results show a segmentation of the continental wedge along and perpendicular to the margin, highlighting a high-density anomaly, below the onshore forearc basin, that limits the late Paleozoic–early Mesozoic metamorphic basement in the region where Chaitenia terrane has been proposed. A progressive landward shift of this anomaly correlates with the high slip patch of the giant 1960 Mw 9.6 Valdivia earthquake. Based on these results, we propose that the horizontal extension of the less rigid basement units conforming the marine wedge and Coastal Cordillera domain could modify the process of stress loading during the interseismic periods, and also that changes in position and extension of the late Paleozoic–early Mesozoic accretionary complex could be linked with the frictional properties of the interplate boundary. This analysis provides new evidence of the role of the overriding plate structure in the seismotectonic process in subduction zones.
- Article
(14188 KB) - Full-text XML
-
Supplement
(10762 KB) - BibTeX
- EndNote


The physical structure of the oceanic and continental plates have had an important role in the long- and short-term deformation process of the subduction margins. On the other hand, the tectonic activity has modified the internal structure and geometry of the tectonic plates (i.e. Bilek et al., 2003; Hackney et al., 2006; Hicks et al., 2014; Contreras-Reyes and Carrizo, 2011; Bassett and Watts, 2015; Poli et al., 2017). This geodynamical feedback is evinced by spatial correlations between the physical segmentation of the continental wedge, and ruptures of large megathrust earthquakes (i.e. Contreras-Reyes et al., 2010; Li and Liu, 2017; Martínez-Loriente et al., 2019; Molina et al., 2021). Examples of this are the spatial correlation between gravity (density) anomalies in the continental wedge and the location of high slip patches in large earthquakes (> 7.5–8 Mw, Song and Simons, 2003; Wells et al., 2003; Álvarez et al., 2014; Bassett and Watts, 2015; Bassett et al., 2016; Schurr et al., 2020), which suggests that changes in normal stresses on the seismogenic zone have a role on the seismic rate and slip propagation during large earthquakes (Tassara, 2010; Maksymowicz et al., 2015, 2018; Molina et al., 2021). On the other hand, changes of the continental wedge geometry have been associated with variations of the interplate boundary friction at the maximum slip patches of the large 2011 Mw 9.0 Tohoku-Oki, 2010 Mw 8.8 Maule and 1960 Mw 9.6 Valdivia earthquakes (Cubas et al., 2013a, b; Maksymowicz, 2015; Contreras-Reyes et al., 2017; Molina et al., 2021).
Diverse works have highlighted the importance of the transition between accretionary prisms (or highly fractured frontal units) and the more rigid rocks of the continental basement as a tectonic limit, controlling, at least partially, the upward propagation of coseismic slip, foreshocks and aftershocks during large megathrust earthquakes (Scholz, 1998; Contreras-Reyes et al., 2010; Moscoso et al., 2011; Kodaira et al., 2012; León-Ríos et al., 2016; Maksymowicz et al., 2017, 2018; Tsuji et al., 2017). At the same time, the downdip limit of the megathrust earthquakes has been related (among other factors) to physical properties of the mantle wedge and deep interplate boundary (Peacock and Hyndman, 1999; Seno, 2005; Wang et al., 2020), which are modified by fluid subduction, slab dehydration and the presence of basal accretionary complexes (Moreno et al., 2018; Menant et al., 2019). Nevertheless, less attention has been paid to the internal physical structure (and lithology) of the continental crust above the downward limit of the megathrust, even considering that all forearc units above the fragile–ductile limit should work as a part of the same mechanically coupled system (van Dinther et al., 2012; Comte et al., 2019).
In this context, we have explored the continental forearc density structure of the Nazca–South America subduction zone in a segment where the high slip patch of the giant 1960 Mw 9.6 Valdivia earthquake ruptured (Fig. 1). As mentioned before, this slip patch correlates not only with a low gravity anomaly above the marine forearc (Wells et al., 2003) and low continental slope angles (Maksymowicz, 2015), but also, with a landward extension of Paleozoic metamorphic outcrops on the shore (Fig. 1a). Furthermore, ages and petrological data of continental basement rocks (metamorphic and plutonic rocks) suggest a complex ancient history of accreted terranes (Ramos et al., 1986; Rapalini, 2005) that constitutes the present continental crust in the area (Fig. 1b). Particularly, the recent proposal of an oceanic terrane accreted against the Gondwana margin during Devonian times (Chaitenia, Hervé et al., 2016, 2018, Ct in Fig. 1b) could determine changes in the internal structure of the continental forearc, southward of ∼ 40∘ S. However, the exact limits of this basement configuration remain poorly constrained. In order to reveal the crustal structure of this active portion of the Chilean margin, this work presents the results and interpretation obtained from regional 2D density models, extended from Nazca plate to the Andes Cordillera (Fig. 3), and a local 3D density inversion of the continental forearc (red rectangle in Figs. 2 and 3). The models include magnetotellurics (MT) and transient electromagnetic (TEM) measurements, as well as available independent geophysical and geological data to constrain forward modelling and 3D inversion.
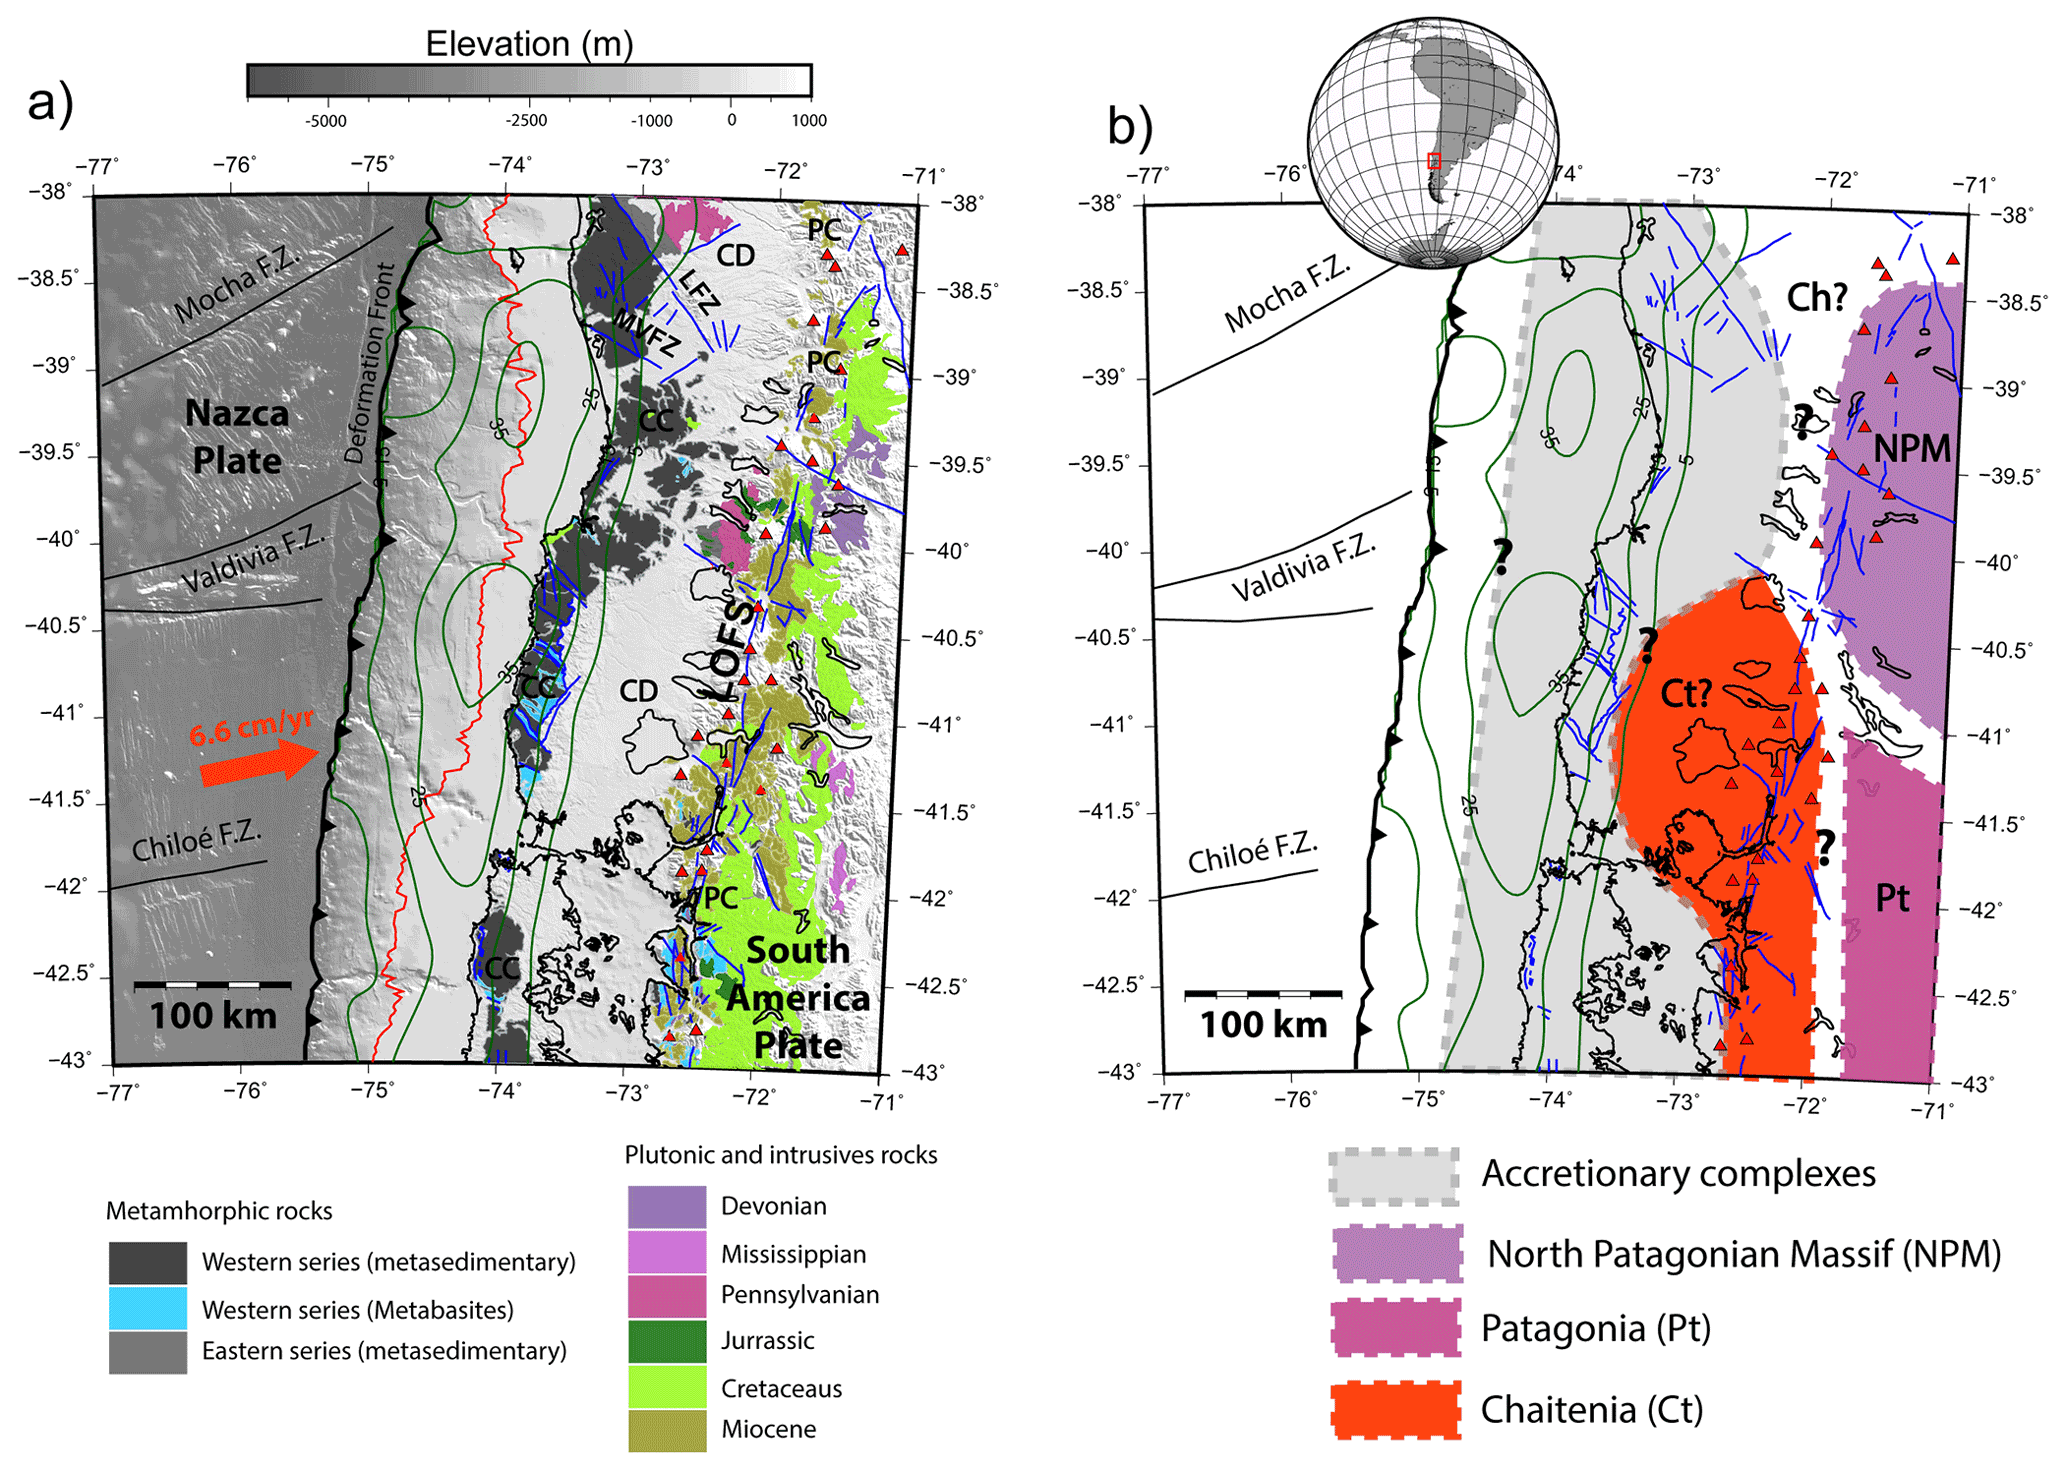
Figure 1Geotectonic settings of the studied zone. (a) Tectonic and morphostructural features above the coloured bathymetric/topographic elevation grid. Metamorphic and plutonic/intrusives outcrops are shown. Oceanic fracture zones (Mocha, Valdivia and Chiloé) are indicated in black. The deformation front (continental wedge toe) at the Nazca–South America trench is indicated by a bold black line. The blue lines correspond to continental structures identified at the surface (SERNAGEOMIN, 2003; Melnick and Echtler, 2006), including the Liquiñe–Ofqui fault system (LOFS), Mocha–Villarrica fault zone (MVFZ) and Lanalhue fault zone (LFZ). The red triangles illustrate active volcanoes. The red arrow indicates the direction of Nazca–South America convergence, and the green lines represent the iso-slip contours of the Valdivia earthquake according to Moreno et al. (2009). (b) Schematic map of basement units after Hervé et al. (2018) and other elements as in (a).
The study zone, located between 38.5 and 42.5∘ S (Fig. 1), is part of the south-central Chilean margin, where the oceanic Nazca plate subducts beneath the continental South American plate. The current rapid convergence rate (∼ 6.6 cm yr−1, Kendrick et al., 2003; Vigny et al., 2009) determines high seismotectonic activity, including the occurrence of mega-earthquakes such as the giant 1960 Mw 9.6 Valdivia earthquake (the largest instrumentally registered worldwide). In the long term, this subduction process has been continuously active since Jurassic times (Charrier et al., 2007), being superimposed to ancient tectonic processes of Gondwana structuration (Ramos et al., 1986), and generating the current configuration of the continental South American plate western border. Marine seismic studies, to the north and south of the study area, indicate that the structure of the continental wedge shows physical and tectonic segmentation from the trench to the coast, characterized by active accretionary prisms along the lower slope regions, compressional geometries, and the development of confined slope basins inside the middle and upper slope, while the shelf region exhibits forearc basins with a complex deformation style structured by normal and inverted faults (Bangs and Cande, 1997; Geersen et al., 2011; Becerra et al., 2013; Bangs et al., 2020). Consistently, Vp models derived from wide-angle seismic refraction, at 38∘ S (Contreras-Reyes et al., 2008) and south of 43∘ S (Contreras-Reyes et al., 2010), present changes in the deep structure of the continental wedge that can be interpreted as transitions between the accretionary prism, paleo-accretionary rocks and continental basement. Regarding the geometry of the marine forearc, the continental wedge shows a narrow continental slope (defined between the deformation front and shelf break; see Fig. 1) to the south of ∼ 41∘ S. This morphological change corresponds to a decrease in the slope angle at the northern region of the Valdivia earthquake rupture (38.5–41∘ S), which in turn can be interpreted as a decrease in the effective friction coefficient () at the interplate boundary (Dahlen, 1984; Cubas et al., 2013b; Maksymowicz, 2015).
Onshore, three major trench-parallel morphostructural units from west to east can be observed (Fig. 1a): (1) the Coastal Cordillera (CC), where old rocks of a paired metamorphic belt are exposed (Hervé, 1988); (2) the Central Depression (CD) characterized by the presence of unconsolidated Quaternary sediments overlaying Cenozoic deposits (Jordan et al., 2001); and (3) the Principal Cordillera (PC), where the active volcanic arc is currently located. In a close spatial relation with the volcanic arc, the prominent Liquiñe–Ofqui Fault System (LOFS, Fig. 1) stretches along more than 1000 km between 37 and 46∘ S (Cembrano et al., 1996). This continental structure has been interpreted as right-lateral strike-slip system that currently concentrates most of the crustal intraplate seismic activity in response to oblique Nazca–South America convergence (Lange et al., 2008; Orts et al., 2012) and exhumation at these latitudes (Adriasola et al., 2005; Glodny et al., 2008). Moreover, numerous tectonic lineaments and fault zones have been described (SERNAGEOMIN, 2003; Melnick and Echtler, 2006), generally showing north-west and north-east orientations. According to Melnick et al. (2009), the kinematics of LOFS generates intense deformation in its northern limit, explaining the deformation associated with large north-west strike continental faults (as LFZ) and the eastward bending of the CC.
Accretionary metamorphic complexes, associated with late Paleozoic–early Mesozoic subduction, are exhumed along the study zone (Hervé, 1988; Duhart et al., 2001; Willner et al., 2004; Hervé et al., 2013). These units correspond to a paired metamorphic belt, which includes the Western and Eastern Series (WS/ES) formed under high and low conditions, respectively. WS has been interpreted as a basal accretionary complex while ES is interpreted as a frontal accretionary prism and/or as the shallow sedimentary units deformed by the basal underplating of WS units (Glodny et al., 2005; Willner et al., 2005). This paired metamorphic belt is observed continuously at the CC, but the width of their outcrops varies along the margin (see Fig. 1a). Between ∼ 38 and 40∘ S, and southward of ∼ 41.5∘ S, outcrops of WS are observed eastward, near the western limit of PC. Thus, between ∼ 40 and ∼ 41.5∘ S, the eastern limit of these units is not defined due to the presence of the CD deposits and could form most of the forearc basement, or it could be confined near the coast. Westward of accretionary metamorphic complexes and north of 38∘ S, the Coastal Batholith (late Paleozoic intrusive rocks) is observed along CC, but southward (in the study zone) the outcrops of this ancient volcanic arc bends to the southeast and becomes part of the PC. Younger Plutonic and intrusive rocks, related to magmatic arcs from Mesozoic to Cenozoic times (Andean tectonic cycle), are observed along the PC near the position of the active volcanic arc and the LOFS, forming the North Patagonian Batholith (Charrier et al., 2007; Hervé et al., 2018; SERNAGEOMIN, 2003; SEGMAR, 1997; see Fig. 1a).
The continental crust of the western border of South America was configured, during Paleozoic times, by collisions of allochthonous terranes against Gondwana (Rapalini, 2005). To the north of the study zone, Chilenia terrane (Ch in Fig. 1b) collided during Devonian times (Ramos et al., 1986; Hyppolito et al., 2014, and references therein), but its southern extension is roughly defined and could be present in the northern area of the study zone. Southward, the geodynamic evolution of the margin during Devonian to Triassic times has been explained with a double subduction system (Hervé et al., 2016). These authors proposed the development of an island arc (named as Chaitenia, Ct in Fig. 1b) parallel to the margin colliding with Gondwana during Carboniferous times (Hervé et al., 2016, 2018; Rapela et al., 2021, Ct in Fig. 1b). If this hypothesis is correct, the continental crust of the current forearc corresponds to Chaitenia, south of ∼ 40∘ S. However, it is important to point out that the limits between all these terranes are poorly constrained in the study zone owing to the scarcity of basement outcrops.
3.1 Gravimetric database and processing
We compile a gravimetric database (see Fig. 2), including public databases and new measurements in the studied area. The resulting merged database includes (1) onshore gravimetric data acquired by Chilean and European institutions in the Central Andes from 1982 to 2006, originally compiled by Schmidt and Götze (2006); (2) 167 new gravimetric stations acquired by our group in 2019; (3) marine gravimetric profiles available in the GEODAS database data (NOAA); and (4) a satellite gravimetric grid from Sandwell and Smith (https://topex.ucsd.edu/cgi-bin/get_data.cgi, last access: 20 December 2021, Sandwell and Smith, 2009; Sandwell et al., 2014) to cover marine gaps and regions to the south of 42∘ S. Bathymetric and topographic databases merge an onshore elevation grid (SRTM elevation grid, Jarvis et al., 2008) and swath bathymetry data of the studied zone (Flueh and Grevemeyer, 2005), complemented by Global Topography V18.1 (Smith and Sandwell, 1997).
The new gravimetric data were distributed to fill in some observed gaps in onshore studies, and to complement and validate gravity and topographic information from old stations. The gravity acquisition was made using a Lacoste & Romberg G-411 gravimeter with a digital upgrade (http://www.gravitymeter-repair.com, last access: 20 December 2021) funded by ANID-FONDECYT project no. 11170047. Elevation was obtained by differential GPS using Topcon HiperV instruments of the University of Chile (DGF). GPS data were processed with the permanent GPS bases of the Chilean national seismological network (Centro Sismólogico Nacional, http://www.csn.uchile.cl/red-sismologica-nacional/red-gps/, last access: 20 December 2021), and the new gravity measurements were tied to the absolute gravity stations available in the study zone (International Gravimetric Bureau (BGI), https://bgi.obs-mip.fr/, last access: 20 December 2021). Estimated precision of new gravity measurements is under ±0.01 mGal (10−5 m s−2) and obtained elevation errors of differential GPS data are under ±0.5 m. The data were corrected to obtain the complete Bouguer anomaly (CBA) using standard correction processes (Blakely, 1995; Lowrie, 2007): tide correction, instrumental drift correction using daily repetitions at base stations, normal gravity correction, free-air, Bouguer, and terrain corrections. These processes were conducted considering a 2.67 g cm−3 reduction density. Earth tide correction was removed from the new data according to the Longman (1959) algorithm. Normal gravity correction of new data considered the subtraction of the theoretical gravity of the WGS-84 ellipsoid. Free-air correction of all onshore data was calculated as 0.3086h (mGal), where h is ellipsoidal height in metres (Lowrie, 2007). Due to the inhomogeneities in the elevation measurement techniques used in old onshore data acquisition (registered between 1982 and 2002, Schmidt and Götze, 2006), we prefer to use SRTM elevation data to perform the free-air and Bouguer corrections of these old gravity data. The terrain correction of all data was calculated following a combination of the algorithms proposed by Kane (1962) and Nagy (1966) and with a high-resolution SRTM elevation grid. The terrain correction includes topographic data located up to ∼ 300 km around each station. GPS data processing, gravity data processing and all figures presented here consider geographic coordinates in the datum WGS84 and WGS84-18S for UTM coordinates.
The spatial coverages of different gravity databases (satellite, marine and onshore) present areas of interception (Fig. 2) where they can be compared to determine the average gravity differences (constant average shifts). These shifts were used to generate a merged database levelling all data to the values observed in the new acquired data. The free-air values of the onshore stations were used to move the free-air anomaly of Sandwell and Smith (satellite data) to the same level (adding a shift of −17.3 mGal to Sandwell and Smith data), and finally GEODAS free-air data (marine lines) were levelled and merged with the other data (adding a shift of −24.78 mGal to GEODAS data) to calculate the CBA (Fig. 3).
3.2 Density modelling
3.2.1 2D regional forward gravity models
In order to study the regional structure of the continental wedge and subduction zone, we modelled five profiles (P1_Toltén, P2_Unión, P3_Osorno, P4_Llanquihue and P5_Chepu; see Fig.2), which run perpendicular to the trench at latitudes of 39.25, 40.2, 40.5, 41 and 42∘ S, respectively. These profiles were extracted from the regional complete Bouguer anomaly grid obtained from the merged gravity database (Fig. 3). 2D forward modelling was performed by using the GravGrad modelling scheme (Maksymowicz et al., 2015), allowing the calculation of the gravimetric response of a stack of layers with arbitrary shape. The densities inside each layer can be varied along the vertical and horizontal directions. As the gravity anomalies are not exclusively dependent on the density structure below each data (i.e. it should be modelled considering masses around the profile), the elevation (bathymetry and topography) in 2D modelling is an averaged elevation profile which includes data inside a ∼ 40 km wide band around the profile (i.e. averaging the elevation to 20 km on each side of the gravity profile). A 40 km wide band is a reasonable assumption considering that the wavelengths of the CBA gravity anomalies along the profiles are mostly larger than ∼ 40–50 km. On the other hand, this parameter is not critical for the obtained 2D model. In fact, a completely different value (e.g. 10 km wide) can be considered with minor modification in the resulting density model (see more details in the Supplement).
As a forward modelling procedure, GravGrad allows the user to iteratively modify the geometry and densities of all layers in the model to fit the observed gravity anomalies (CBA in this case). Section 3.3 and Fig. 2 describe the independent information used to constrain the slab geometry, continental Moho depths and sedimentary thickness at the CD basin. The general density structures of the slab, continental plate and mantle were based on seismic and seismological Vp models available at the zone, converted to density by the empirical Nafe–Drake transformation curve (Brocher, 2005).
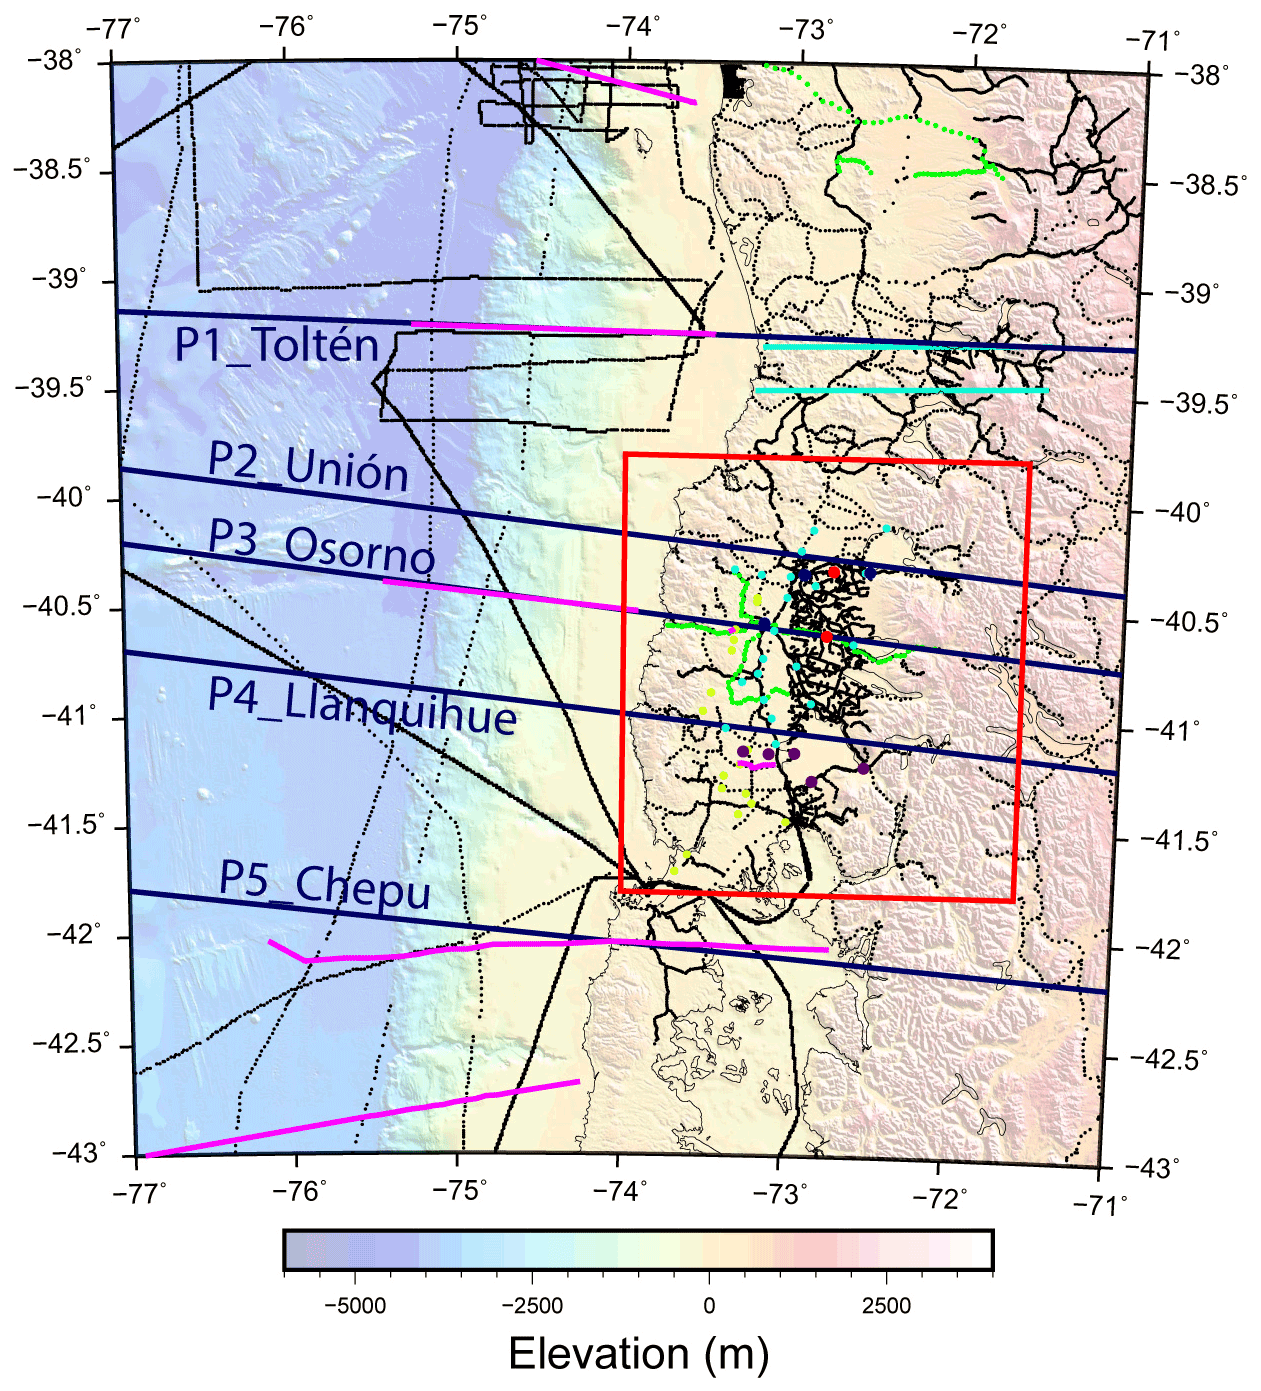
Figure 2Geophysical database in the study zone and the location of 2D and 3D models. The blue lines indicate the location of five 2D regional density model, and the red rectangle is the zone in which local 3D inversion was obtained. The black dots designate gravity stations compiled by Schmidt and Götze (2006), onshore, and in GEODAS database (NOAA) offshore. The green dots illustrate the complementary gravity stations acquired by our group under the ANID-FONDECYT project no. 11170047. The blue and red dots correspond to TEM soundings and MT stations acquired under the aforementioned FONDECYT project. Magenta dots indicate the MT stations presented by Segovia et al. (2021) and cyan dots correspond to TEM soundings published by DGA (2012). Receiver function profiles obtained by Dzierma et al. (2012a) are shown with cyan lines. The location of seismic Vp–depth models (Contreras-Reyes et al., 2008, 2010; Bangs et al., 2020; Maksymowicz et al., 2021) and the seismic reflection lines presented by Jordan et al. (2001) and González et al. (1989) are indicated with magenta lines. The yellow dots correspond to the location of boreholes (McDonough et al., 1997).
3.2.2 3D gravity inversion
Regarding a more detailed analysis of the continental density structure onshore, a 3D inversion was performed in a central patch of the study zone, where a large gravity maximum is observed parallel to the Coastal Range (red polygon in Fig. 3). This onshore 3D density model was obtained using the UBC-GIF GRAV3D v3.0 software (Li and Oldenburg, 1998). The algorithm inverts the residual Bouguer anomaly (RBA) to derive a 3D density anomaly model of the crust. The residual Bouguer anomaly was generated by subtracting a first-order polynomial trend from complete Bouguer anomaly data (see Supplement). The 3D mesh has blocks (in X, Y, Z directions, respectively). The horizontal mesh size is 3000 m × 3000 m. Due to the progressive sensitivity decrease in the gravity inversion to sources at depth, UBC-GIF developers recommend using smaller cells near the surface and increase the cell thickness with the model depth (https://www.eoas.ubc.ca/ubcgif/iag/index.htm, last access: 20 December 2021). Accordingly, the cell size gradually grows from 100 to 1500 m in our model, reaching 70 km in depth.
A total of 3514 onshore gravity data points were used for the 3D inversion, generating a regular spaced grid (with a grid size of 3000 m × 3000 m). After numerous preliminary experiments, we set the length scale parameters of the UBC-GIF algorithm (Li and Oldenburg, 1998) as 6000, 6000 and 3000 m in X, Y and Z directions, respectively. These length scale parameters define the horizontal and vertical smoothness of the solution, and preferred values are the double of the horizontal and vertical cell size used to discretize the media. This criterion is one of those recommended in the software manual (https://www.eoas.ubc.ca/ubcgif/iag/index.htm, last access: 20 December 2021), but also it is important to highlight that sensitivity tests show that under a strong variation of these parameters the obtained solution of density structure shows similar features (see details in the Supplement). The 3D inversion was constrained by information from the geological map of 1:1 000 000 scale (SERNAGEOMIN, 2003), MT stations, TEM stations and onshore seismic lines (Fig. 2). Accordingly, we performed the inversion with the following definitions for surface sediments and the basement: a minimum homogeneous thickness of 500 m was assigned to the entire area of the model where Quaternary sediments are exposed. These cells can take densities between 1.9 and 2.1 g cm−3. The next 500 m (five cells) in depth correspond to a transition zone, where the blocks could be sediments or rock and can vary between 1.9 and 2.7 g cm−3. The next 300 m (three cells) in depth corresponds to a second transitory zone, where the blocks could be fractured rock or consolidated rock and can vary between 2.4 and 3 g cm−3. Below, the blocks corresponding to the basement can take values between 2.5 and 3 g cm−3. Finally, below 7500 m depth we constrained the model to have greater densities than the background (2.67 g cm−3). Then, those deep cells can take values between 2.67 and 3 g cm−3 in order to ensure more realistic vertical gradients in the lower constrained deep portion of the model.
To include the presence of the main lakes in the zone, the model is forced to be water in the blocks that correspond to lake, assigning them a density of 1 g cm−3. The bathymetry of the two first lakes was obtained from Chilean National Oceanographic Service (http://www.shoa.cl/php/inicio, last access: 20 December 2021), and in the case of Llanqihue Lake, a mean of 200 m of depth was considered. Similarly, to consider the gravimetric effect of the sea, the model was forced to be water in the blocks above bathymetry.
3.3 Geophysical constraints
3.3.1 Available geophysical information
Independent geophysical data were used to constrain the 2D density models and onshore 3D inversion (Fig. 2). This information includes (1) the available 2D velocity–depth models at different latitudes (Contreras-Reyes et al., 2008, 2010; Bangs et al., 2020; Maksymowicz et al., 2021), used as a reference for the general structure of the oceanic plate and marine continental wedge after Vp-to-density conversion according to the empirical Nafe–Drake transformation curve (Brocher, 2005); (2) interpretation of reflection seismic profile (in depth) at ∼ 42∘ S (González et al., 1989); (3) the Quaternary sedimentary thickness and the top of the Paleozoic basement observed in the onshore ENAP seismic lines Z5B-010A and ZDO-001 (McDonough et al., 1997; Jordan et al., 2001) and ENAP boreholes (McDonough et al., 1997; Honores et al., 2015); (4) the SLAB 2.0 model (Hayes et al., 2018) to constrain the deep slab geometry; (5) Moho depth along the profiles presented by Dzierma et al. (2012a); and (6) 1D electrical resistivity models using magnetotelluric measurements obtained by Segovia et al. (2021), 1D electrical resistivity models from TEM measurements presented by DGA (2012), and 1D electrical resistivity models from new MT and TEM measurements. These resistivity models were used to constrain the thickness of young sedimentary fill at CD. At the MT/TEM stations where 1D resistivity models do not reach the base of the young sedimentary fill (by cultural electromagnetic noise or limited penetration in thick sedimentary fill areas), we define values of minimum sedimentary thickness, aiming to decrease uncertainties in the density modelling.
3.3.2 Electromagnetic methods to constrain gravity measurements
The new magnetotelluric data (red dots in Fig. 2) were collected using Metronix ADU-08 data loggers and MFS-07 induction coil magnetometers along with Pb-PbCl electrodes. Time series data were recorded between 12 and 24 h. All sites were processed using the robust method based on Egbert and Booker (1989). The 1D resistivity models of new and previously measured data (from Segovia et al., 2021) were obtained using occam (Constable et al., 1987 and Bostick, 1977) algorithms implemented in WinGLink (Schlumberger, version 2.21). See data and models in the Supplement.
The transient electromagnetics measurements (blue dots in Fig. 2) were carried out utilizing the ABEM WalkTEM (ABEM, 2016). In general, a central loop set-up was used with a transmitter loop size of 100 m × 100 m or 40 m × 40 m. TEM stations were modelled by using Interpex-IX1D TEM software, generating 1D resistivity depth models using the ridge regression algorithm (see data and models in the Supplement).
4.1 Complete Bouguer gravity anomaly (CBA)
It is necessary to describe the main characteristics observed in the CBA at the study zone (Fig. 3) before analysing density models. The general aspect of the CBA is a sequence of bands with high and low gravity, roughly parallel to the margin. Offshore, we observe the low CBA associated with the deep trench seafloor and its sedimentary fill. It is important to notice that this low CBA extends several kilometres landward from the deformation front (toe of the continental wedge), which implies the presence of low-density units at the lower slope of the continental wedge. The main feature observed in the slope and shelf area is the low CBA zone (L1 in Fig. 3a) extended from ∼ 38.5 to ∼ 41∘ S, correlating with a decrease in general slope angles at the same latitudes (Fig. 1). This morphologic and gravimetric anomaly is also correlated with the maximum slip patch of the giant Valdivia earthquake, as highlighted by several authors (Wells et al., 2003; Maksymowicz, 2015; Contreras-Reyes et al., 2017; see Fig. 3b).
Onshore, the regional aspect of CBA is an eastward trend of gravity decreases from the coast to PC, mostly related to the presence of continental roots below the Andes (Tassara et al., 2006; Tašárová, 2007). Therefore, high CBA anomalies are observed along the coast (Fig. 3a), but their amplitude decreases between ∼ 38.7 and ∼ 40∘ S, where a relatively low CBA anomaly is observed (L2 in Fig. 3a). It is necessary to consider that L2 is spatially correlated with a zone of landward extension of the CC and metamorphic complex outcrops (WS/ES).
To the east, a sequence of gravity lows, with sparse gravity maximums, is correlated with the eastern part of the CD basin, the current volcanic arc and LOFS, suggesting a complex density structure at the PC zone. Between ∼ 40 and ∼ 41.5∘ S (and probably southward) a prominent positive anomaly can be seen above the western portion of the CD basin (H1 in Fig. 3a), indicating the presence of a high-density body elongated to the north-east and covered by sedimentary fill of CD. This interesting forearc gravity maximum was observed by Hackney et al. (2006) based on the same onshore data, and has been confirmed by our new complementary stations.
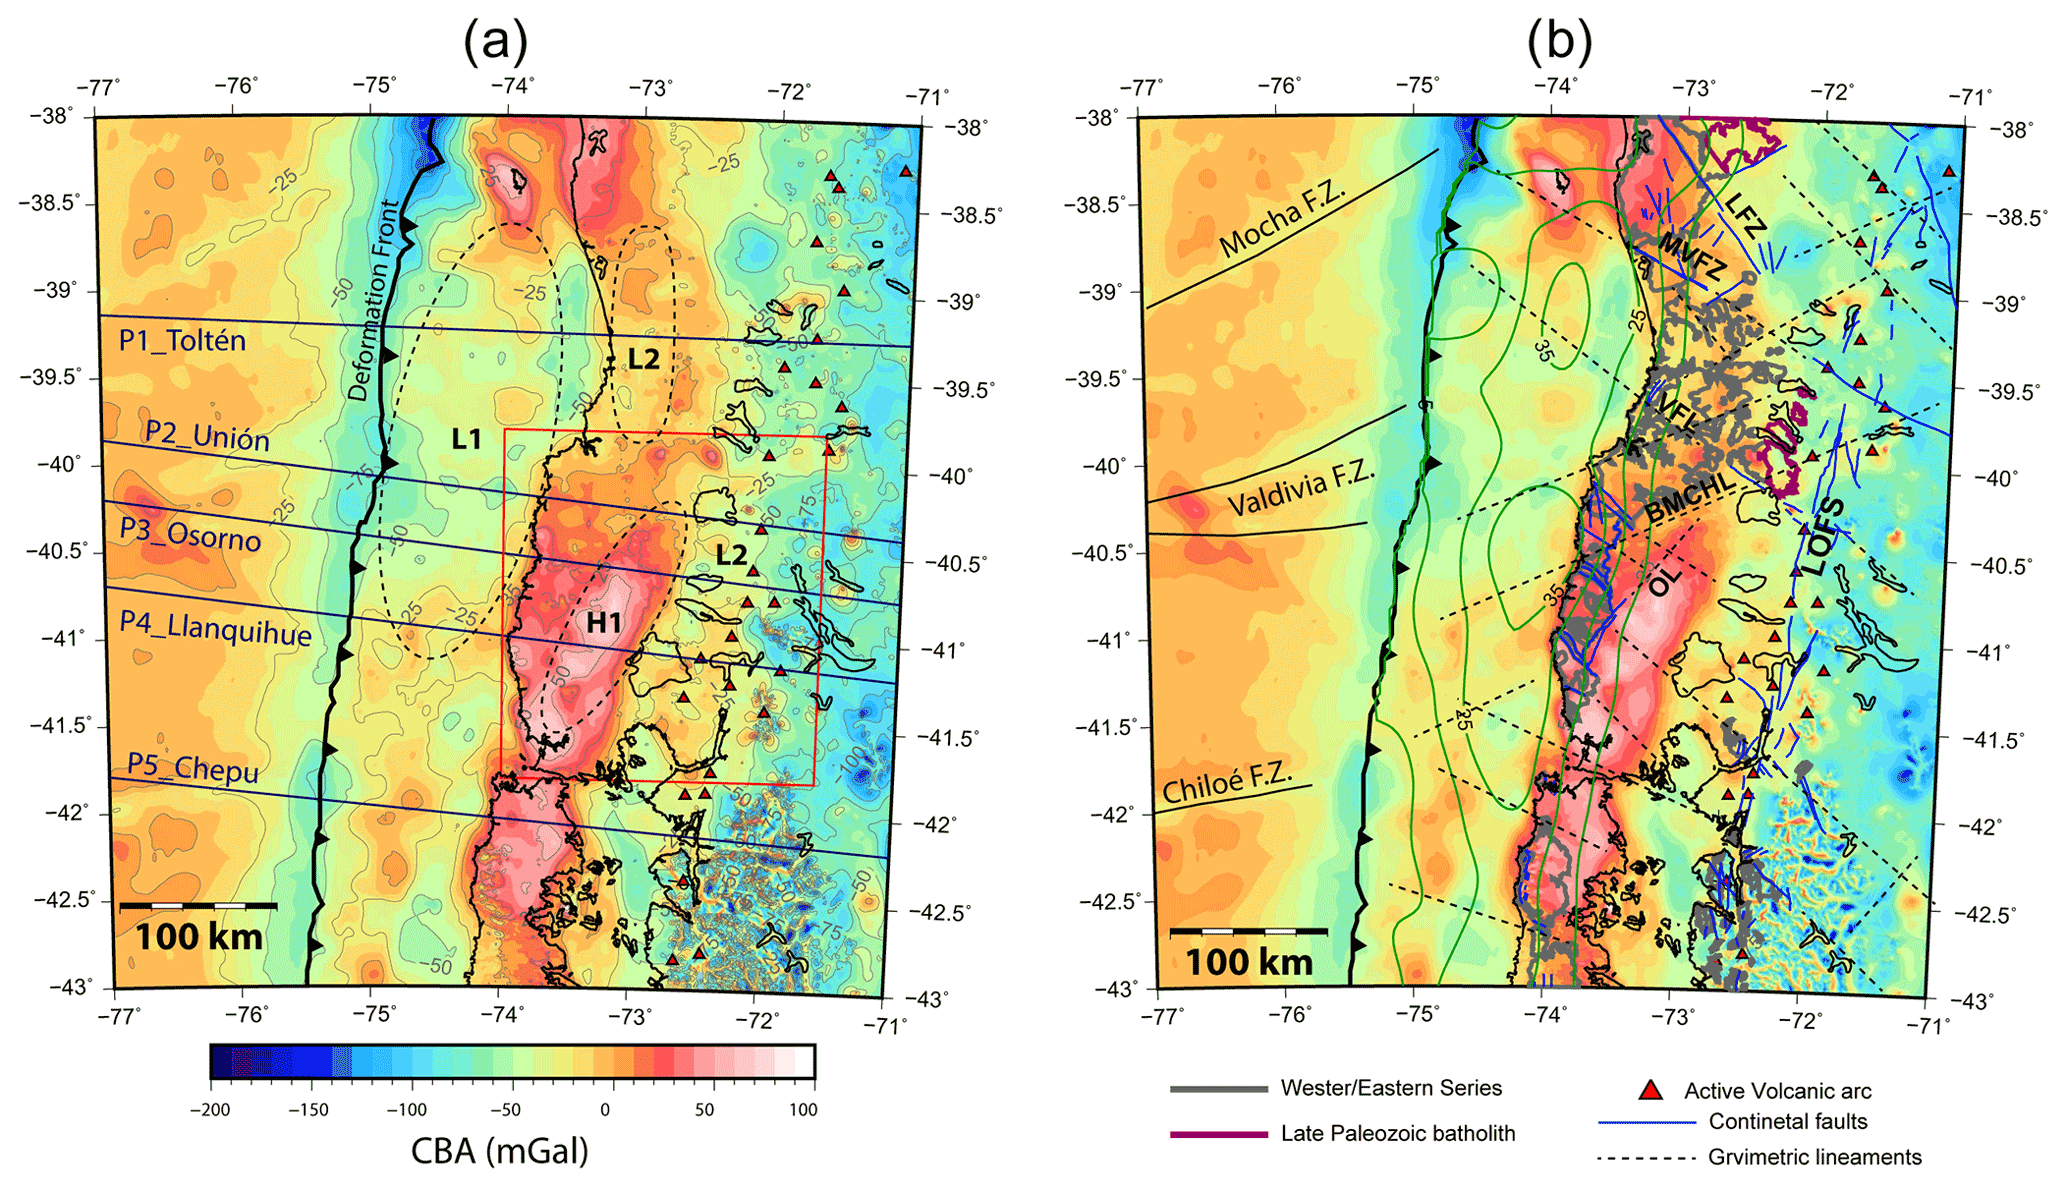
Figure 3Complete Bouguer anomaly (CBA) at the study zone. (a) The main gravimetric forearc features observed in the area (see main text for details). The blue lines illustrate the tracks of 2D forward density models, and the red rectangle indicates the zone where 3D density inversion was carried out. Dotted black ellipses show the approximated extension of anomalies L1, L2 and H1 along with other elements seen in Fig. 1a. (b) Crustal tectonic structures and CBA. The figure includes the contours of the metamorphic Western and Eastern Series and late Paleozoic batholith outcrops. Dotted black lines are interpreted gravimetric lineaments, e.g. Valdivia–Futrono lineament (VFL), Bahía Mansa–Choshuenco lineament (BMCHL) and Osorno lineament (OL). The other elements are as in Fig. 1a.
By a visual inspection of the CBA map, we interpret a set of gravity lineaments (Fig. 3b) with north-west and north-east directions. Derivative filters (directional derivatives, slope gradient and analytical signal) applied to CBA helped to identify these regional trends (see Supplement). This qualitative interpretation confirms the location of fault zones previously identified at the surface (SERNAGEOMIN, 2003; Melnick and Echtler, 2006), suggesting their continuity through the forearc and, in some cases, their seaward extension (e.g. Valdivia–Futrono lineament, VFL in Fig. 3b). Additionally, new gravimetric lineaments are identified in CBA, suggesting the presence of large structures affecting the basement units (e.g. Bahía Mansa–Choshuenco lineament, BMCHL in Fig. 3b). The H1 anomaly is limited to the north-west by the Osorno lineament (OL in Fig. 3b), which presents continuity with an identified west-dipping reverse fault in the south-west (SERNAGEOMIN, 2003; Melnick and Echtler, 2006; Hackney et al., 2006; Encinas et al., 2021), indicating that the geometry of H1 has a structural and tectonic control.
4.2 2D density profiles
Figure 4 shows the results of the 2D forward gravity models obtained through the five studied profiles. As observed in Fig. 4a, the modelling process allowed a good fit to be attained between observed and calculated gravity data, associated with low RMS values (≤4.0 mGal) in comparison with the total amplitude of the gravity anomaly. According to these results, the marine structure of the overriding plate can be described as a general landward increase in density between the deformation front (DF at the trench) and the coastal area, where it is possible to define at least two internal units (Fig. 4b to f). The first one corresponds to a frontal low-density unit ( g cm−3) of about 25–35 km width, with a rapid landward horizontal density gradient. This frontal unit is roughly correlated with the lower slope of the continental wedge. The second unit is characterized by a lower landward horizontal density gradient and shows densities between ∼ 2.5 and ∼ 2.8–2.9 g cm−3. This middle wedge unit is extended from the lower slope to the coast by ∼ 70 km at profiles P2 to P5 and is slightly wider (∼ 90 km) at the northernmost profile P1_Toltén. Immediately below the seafloor, all profiles present marine forearc basins with variable thicknesses (< 5 km) and densities lower than ∼ 2.3 g cm−3. A few kilometres westward from the coast, a continental wedge shows a transition to higher densities landward (higher than ∼ 2.9–3.0 g cm−3 in the deep portion of the crust). This transition can be described as a landward limit of the middle wedge unit and seems to have a west-dipping geometry.
Onshore, the upper portion of the continental forearc (the upper ∼ 10–15 km) displays a sequence of low- and high-density zones. Below CC (and metamorphic complex outcrops), the shallow densities are generally higher than 2.5 g cm−3 and downward. However, this region is not particularly dense. In fact, below the sedimentary fill of the CD basin we observe a high-density maximum in the five 2D profiles (H1 in Fig. 4b to f). Then, the results confirm the presence of a high-density zone associated with the high CBA anomaly already described (D1 in Fig. 3a), suggesting its prolongation to the north-east and south-west. Comparing the 2D profiles, we notice that D1 is progressively closer to the coast, southward from profile P2_Unión (∼ 40∘ S); i.e. D1 presents a north-east trend, as suggested before in the CBA description. It is important to note that the presence of D1 is clear in all profiles except for P2_Unión, in which this density anomaly is slightly raised from a more homogenous model of the upper continental crust.
To the east of D1, all profiles show another high-density zone (D2 in Fig. 4b to f). It is important to consider that the large LOFS approximately correlates with the western limit of D2 in profile P1_Toltén, with the eastern limit of D1 in profile P2_Unión and with the eastern border of D2 at profiles P4_LLanquihue and P5_Chepu, which suggests a structural relation between the deep geometry of the high-density anomalies (D1 and D2) and LOFS.

Figure 42D regional forward models (a) complete Bouguer anomaly (CBA) curves along five modelled profiles. Coloured curves are the modelled gravity signals, and the corresponding observed data are presented in grey. (b) Density–depth model along the profile P1_Toltén, morphological limits of the continental wedge (as lower slope, LS) are indicated. Dotted black lines illustrate the approximate limits of frontal low-density unit and the middle wedge/shelf unit of the marine continental wedge. The thin vertical line indicates the limit between CC and CD. Red triangles correspond to the active volcanoes located near the profile. Pink dots correspond to slab geometry according to the SLAB2.0 model (Hayes et al., 2018). Green dots depict the continental Moho depths obtained by receiver function analysis (Dzierma et al., 2012a). Black dots indicate the base of the poorly compacted shallow sedimentary layer according to MT and TEM soundings, and cyan dots correspond to the minimum thickness of this sedimentary layer according to MT and TEM soundings. White lines limit a zone of high Vp and low obtained by Dzierma et al. (2012b). Thin dotted yellow and cyan lines limit electrically conductive and resistive zones (C and R) according to Kapinos et al. (2016). (c) Density–depth model along the profile P2_Unión. (d) Density–depth model along the profile P3_Osorno. Grey dots show the base of the poorly compacted shallow sedimentary layer according to onshore seismic profiles and ENAP boreholes (McDonough et al., 1997; Jordan et al., 2001; Honores et al., 2015). Other elements as in (a). (e) Density–depth model along the profile P4_Llanquigue. Thin dotted yellow and cyan lines limit electrically conductive and resistive zones (C and R) according to Segovia et al. (2021). Other elements as in (d). (f) Density–depth model along the profile P5_Chepu. Grey dots represent the base of shallow sedimentary layers according to seismic reflection data (González, 1989) and other elements as in (a). Individual figures of each profile are presented in the Supplement.
4.3 3D local density model
As explained before, a large latitudinal change of onshore forearc continental structure is observed in the central profiles (P2_Unión, P3_Osorno and P4_Lannquihue), where D1 seems to have a north-east trend and where D2 is observed near the LOFS and the arc. This motivates the development of a local 3D density inversion in the forearc area, to derive the detailed structure of upper continental crust with an independent model strategy.
The 3D inversion modelled the input residual Bouguer anomaly (Fig. 5a) with high precision, as is observed in Fig. 5b, where differences between modelled and observed data are in general lower than ±1 mGal. The results show density contrast anomalies to about 20 km depth (Figs. 6, 7 and in the Supplement), which means that deeper anomalies are mostly contributing to a regional linear trend of the CBA at the scale of 3D local inversion.
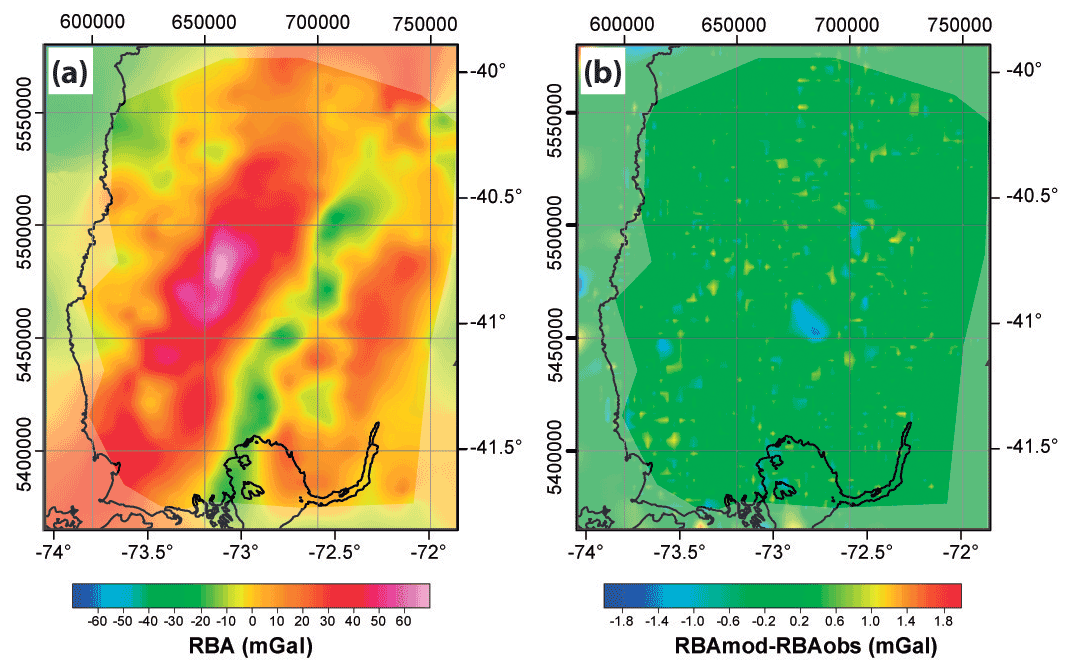
Figure 5(a) Residual Bouguer anomaly (RBA) used as input for 3D inversion. (b) Difference between final modelled and input RBA data.
Four constant depth slices through the final 3D model are shown in Fig. 6. In the slice at 49 m b.s.l. (Fig. 6a) it is possible to observe the geometry of the CD basin as yellow zones that correspond to density contrasts between −0.77 and −0.57 g cm−3. Also, it is possible to observe the areas that correspond to seawater as blue zones with density contrasts of −1.67 g cm−3 and sedimentary areas below the lakes with density contrasts of about −0.73 g cm−3. Similar density structures are observed in Fig. 6b (at 1049 m b.s.l.).
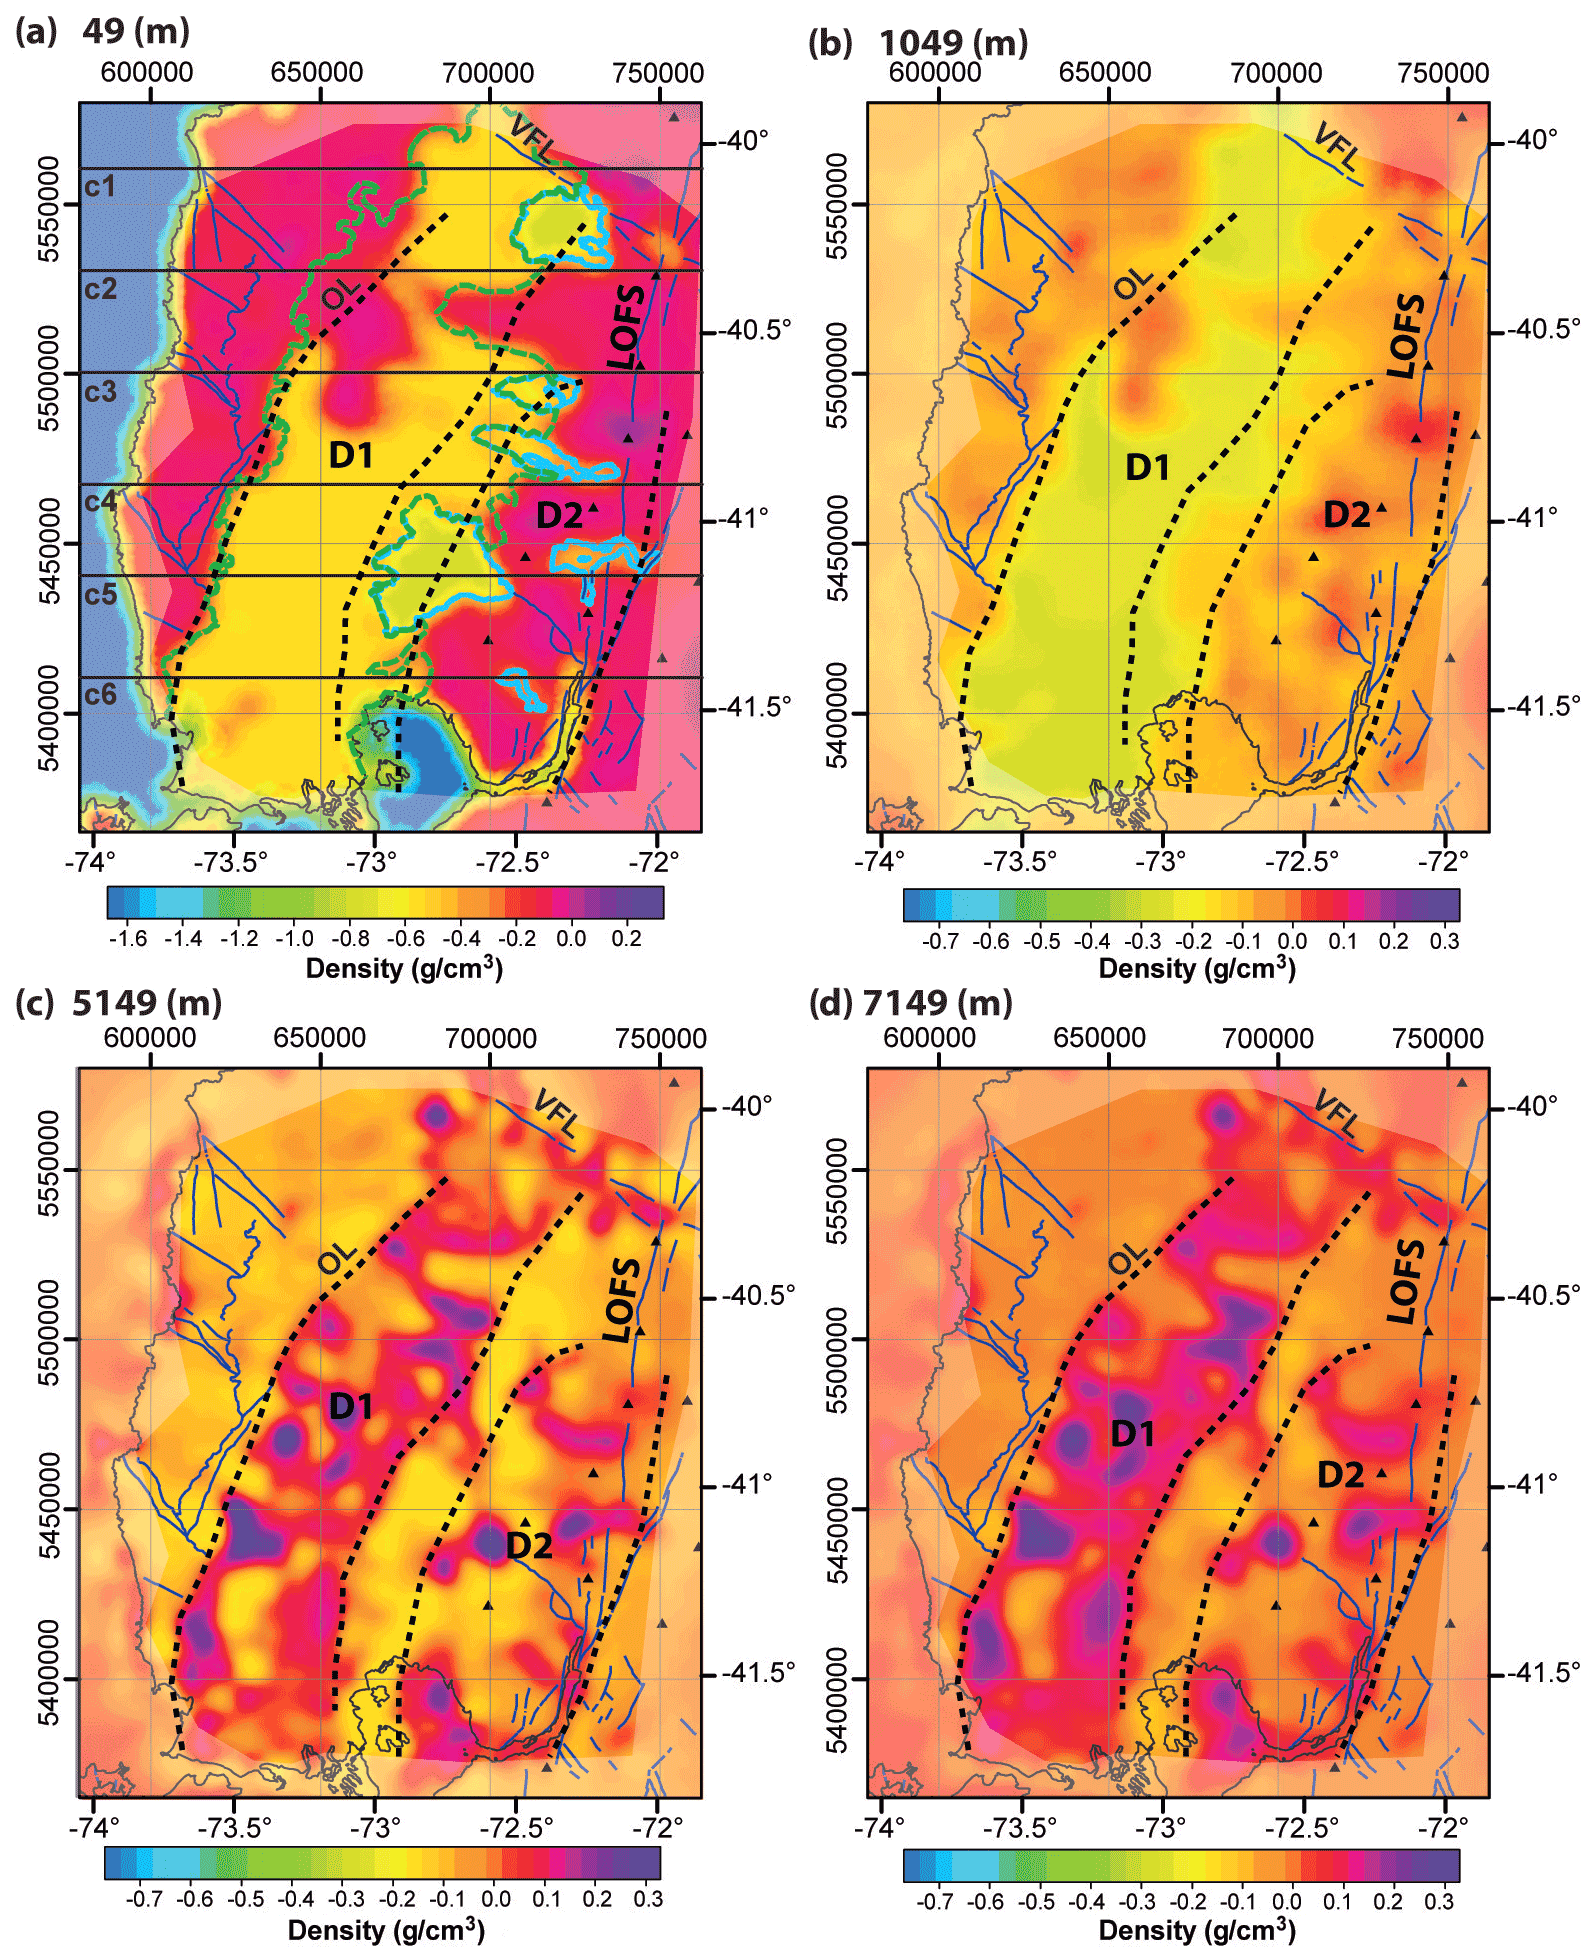
Figure 6Density slices from the 3D density model at different depths. (a) Slice at 49 m b.s.l. Blue lines correspond to continental structures identified at the surface (SERNAGEOMIN, 2003; Melnick and Echtler, 2006); VFL highlights the Valdivia–Futrono lineament, and OL corresponds to Osorno lineament (see Fig. 3b). Segmented green line illustrates the border of CD, and the external limits of the lakes are highlighted with a cyan line. Active volcanoes are marked by black triangles. Segmented black lines indicate the approximate borders of H1 and H2 density anomalies (see main text for details) defined at the deeper slice shown in (d). Partially hidden zones are outside of onshore data considered for 3D inversion. (b) Slice at 1049 m b.s.l. Note the change of colour scale in relation to (a). Other elements as in (a). (c) Slice at 5149 m b.s.l. Other elements as in (b). (d) Slice at 7149 m b.s.l. and other elements as in (b) .
Figure 6c and d show slices at 5149 and 7149 m b.s.l., respectively. In this figure it is feasible to observe the prominent high-density zone D1 under the CD, being consistent with the observed one in CBA and 2D models (Figs. 3 and 4). In the 3D model, D1 covers ∼ 230 km along the strike and ∼ 80 km in the horizontal direction, being oriented ∼ 25∘ E in the same direction as the western border of CC. The density contrast of this structure is higher than 0 g cm−3 in most of the areas, reaching 0.3 g cm−3 at denser zones. South of ∼ 40.75∘ S, D1 is limited with WS outcrops to the west, while to the north-west it is bordered by the OL lineament (see Fig. 3b). The northern limit of D1 correlates with the presence of an VFL lineament. To the east, a low-density lineament in the same D1 direction, with density contrasts from −0.17 to 0 g cm−3, can be seen. This low-density band is about 10 to 15 km wide and is limited to the east with the high-density zone D2. The 3D density model shows variations inside D1 and D2, which are formed by high-density zones (density contrast ≥ 0.3 g cm−3) merged with lower-density areas.
To analyse the density variation with depth, Fig. 7 presents six W–E vertical cross sections of the 3D model at different latitudes (c1 to c6 in Fig. 6a). All cross sections show that D1 is below the CD and correlated to the eastern limit of the CC and WS outcrops, confirming the results obtained by 2D regional modelling. The top of the D1 anomaly is obtained around 5 km b.s.l., displaying a trend of deepening to the north (also suggested by 2D modelling). At a lower scale, the geometry of D1 is characterized by two lobes, and its western and eastern borders seem to be tilted to the east and west, respectively (segmented black lines in Fig. 7). Eastward, D2 is modelled in the southern region at profiles c4, c5 and c6 (Fig. 7d to f), and it is also characterized by two lobes. The western limit of this anomaly suggests an inclination to the east.

Figure 7Density–depth profiles extracted from the 3D inversion model (see location in Fig. 6a). (a) Profile c1 at UTM-North = 5 560 500 m (WGS84-18S). Thin vertical lines indicate the limits of CC, CD. Black dots mark the base of shallow sedimentary unit, according to TEM/MT measurements, and cyan dots correspond to the minimum sedimentary fill according to the TEM/MT soundings that do not reach the basement. Grey and blue dots show respectively the base of Quaternary sediment and the top of the Paleozoic basement according to onshore seismic profiles and ENAP boreholes (McDonough et al., 1997; Jordan et al., 2001; Honores et al., 2015). The interpretation of the approximate borders of the D1 anomaly is highlighted with dotted black lines. The partially hidden zones are outside of onshore data considered for 3D inversion. (b) Profile c2 at UTM-North = 5 530 500 m (WGS84-18S). (c) Profile c3 at UTM-North = 5 500 500 m (WGS84-18S). Grey and blue lines show the shallow sedimentary unit and the top of the metamorphic basement, according to seismic reflection profile ZDO-001 (see main text for details) and other elements as in (b). (d) Profile c4 at UTM-North = 5 467 500 m (WGS84-18S). The approximate borders of the high-density anomalies D1 and D2 are highlighted with dotted black lines. (e) Profile c5 at UTM-North = 5 440 500 m (WGS84-18S). Grey and blues lines show the shallow sedimentary unit and top of the metamorphic basement, according to seismic reflection profile Z5B-010A (see main text for details) and other elements as in (d). (e) Profile c5 at UTM-North = 5 410 500 m (WGS84-18S).
These obtained results exhibit a landward segmentation of the continental wedge density structure observed from trench to arc (see an interpretative schema at Fig. 8a). Offshore, the frontal portion of the continental wedge (to ∼ 25–35 km landward from the deformation front) presents low densities with a rapid horizontal increment of densities, interpreted as a compaction process in the active accretionary prism along the south-central Chilean margin (Maksymowicz et al., 2015). It is also evidenced by seismic studies in the region (Moscoso et al., 2011; Tréhu et al., 2019; Contreras-Reyes et al., 2008, 2010; Bangs and Cande, 1997; Bangs et al., 2020). To the east, below the sedimentary fill of slope and shelf basins, the continental wedge is characterized by a second unit of higher density and lower horizontal density gradient (middle wedge unit, MWU). This unit can be associated with fractured basement rocks and/or more compacted units of a paleo-accretionary prism. In this sense, Contreras-Reyes et al. (2008) at ∼ 38∘ S and Contreras-Reyes et al. (2010) at ∼ 43∘ S interpret this unit (in Vp-depth profiles) as a paleo-accretionary prisms of an undetermined age between Mesozoic and Tertiary. On the other hand, at ∼ 39 and ∼ 40.5∘ S, Bangs et al. (2020) suggest that the Paleozoic–early Mesozoic accretionary complex (WS/ES) can extend further seaward to the eastern limit of the active accretionary prism (seismic backstop), in accordance with the interpretation of marine seismic data (and boreholes) of González (1989) at ∼ 42∘ S. However, the exploration boreholes presented by González (1989) were drilled in the shelf basin area and therefore do not provide direct information about the age of the continental basement in the western portion of MWU.
Landward from MWU, the next segment correlates on the surface with the morphostructural domain of CC and shows a density increase with respect to the marine wedge, but lower densities compared to continental crust below the CD and PC. Therefore, this CC domain is clearly related to the Paleozoic–early Mesozoic accretionary complexes (WS/ES) and their continuity to depth. Gravity modelling techniques do not define a downward limit of WS/ES (without independent deep constraints). Nevertheless, interpretations of seismic reflection data at ∼ 38.25∘ S (Krawczyk et al., 2006; Ramos et al., 2018) showed the downward prolongation of WS/ES reaching deep levels near the continental Moho interface (∼ 30 km depth). As previously mentioned, the seaward limit of WS/ES is not defined by direct lithological observations; their presence beneath the shelf basin is confirmed by exploration boreholes (González, 1989). Thereafter, the relative rapid change in velocity associated with the transition between MWU and CC domain (dotted grey line in Fig. 8) is interpreted as a structural limit (rather than a lithological change of the basement). This structural limit is probably associated with the development of the shelf basin and a general seaward increase in fracturing within the continental wedge. This structural interpretation seems to be confirmed by Contreras-Reyes et al. (2008) at ∼ 38.25∘ S, where continental intraplate seismicity (located by Haberland et al., 2006) is aligned with this limit, as well as the intraplate seismicity located at 39.5∘ S by Dzierma et al. (2012c).
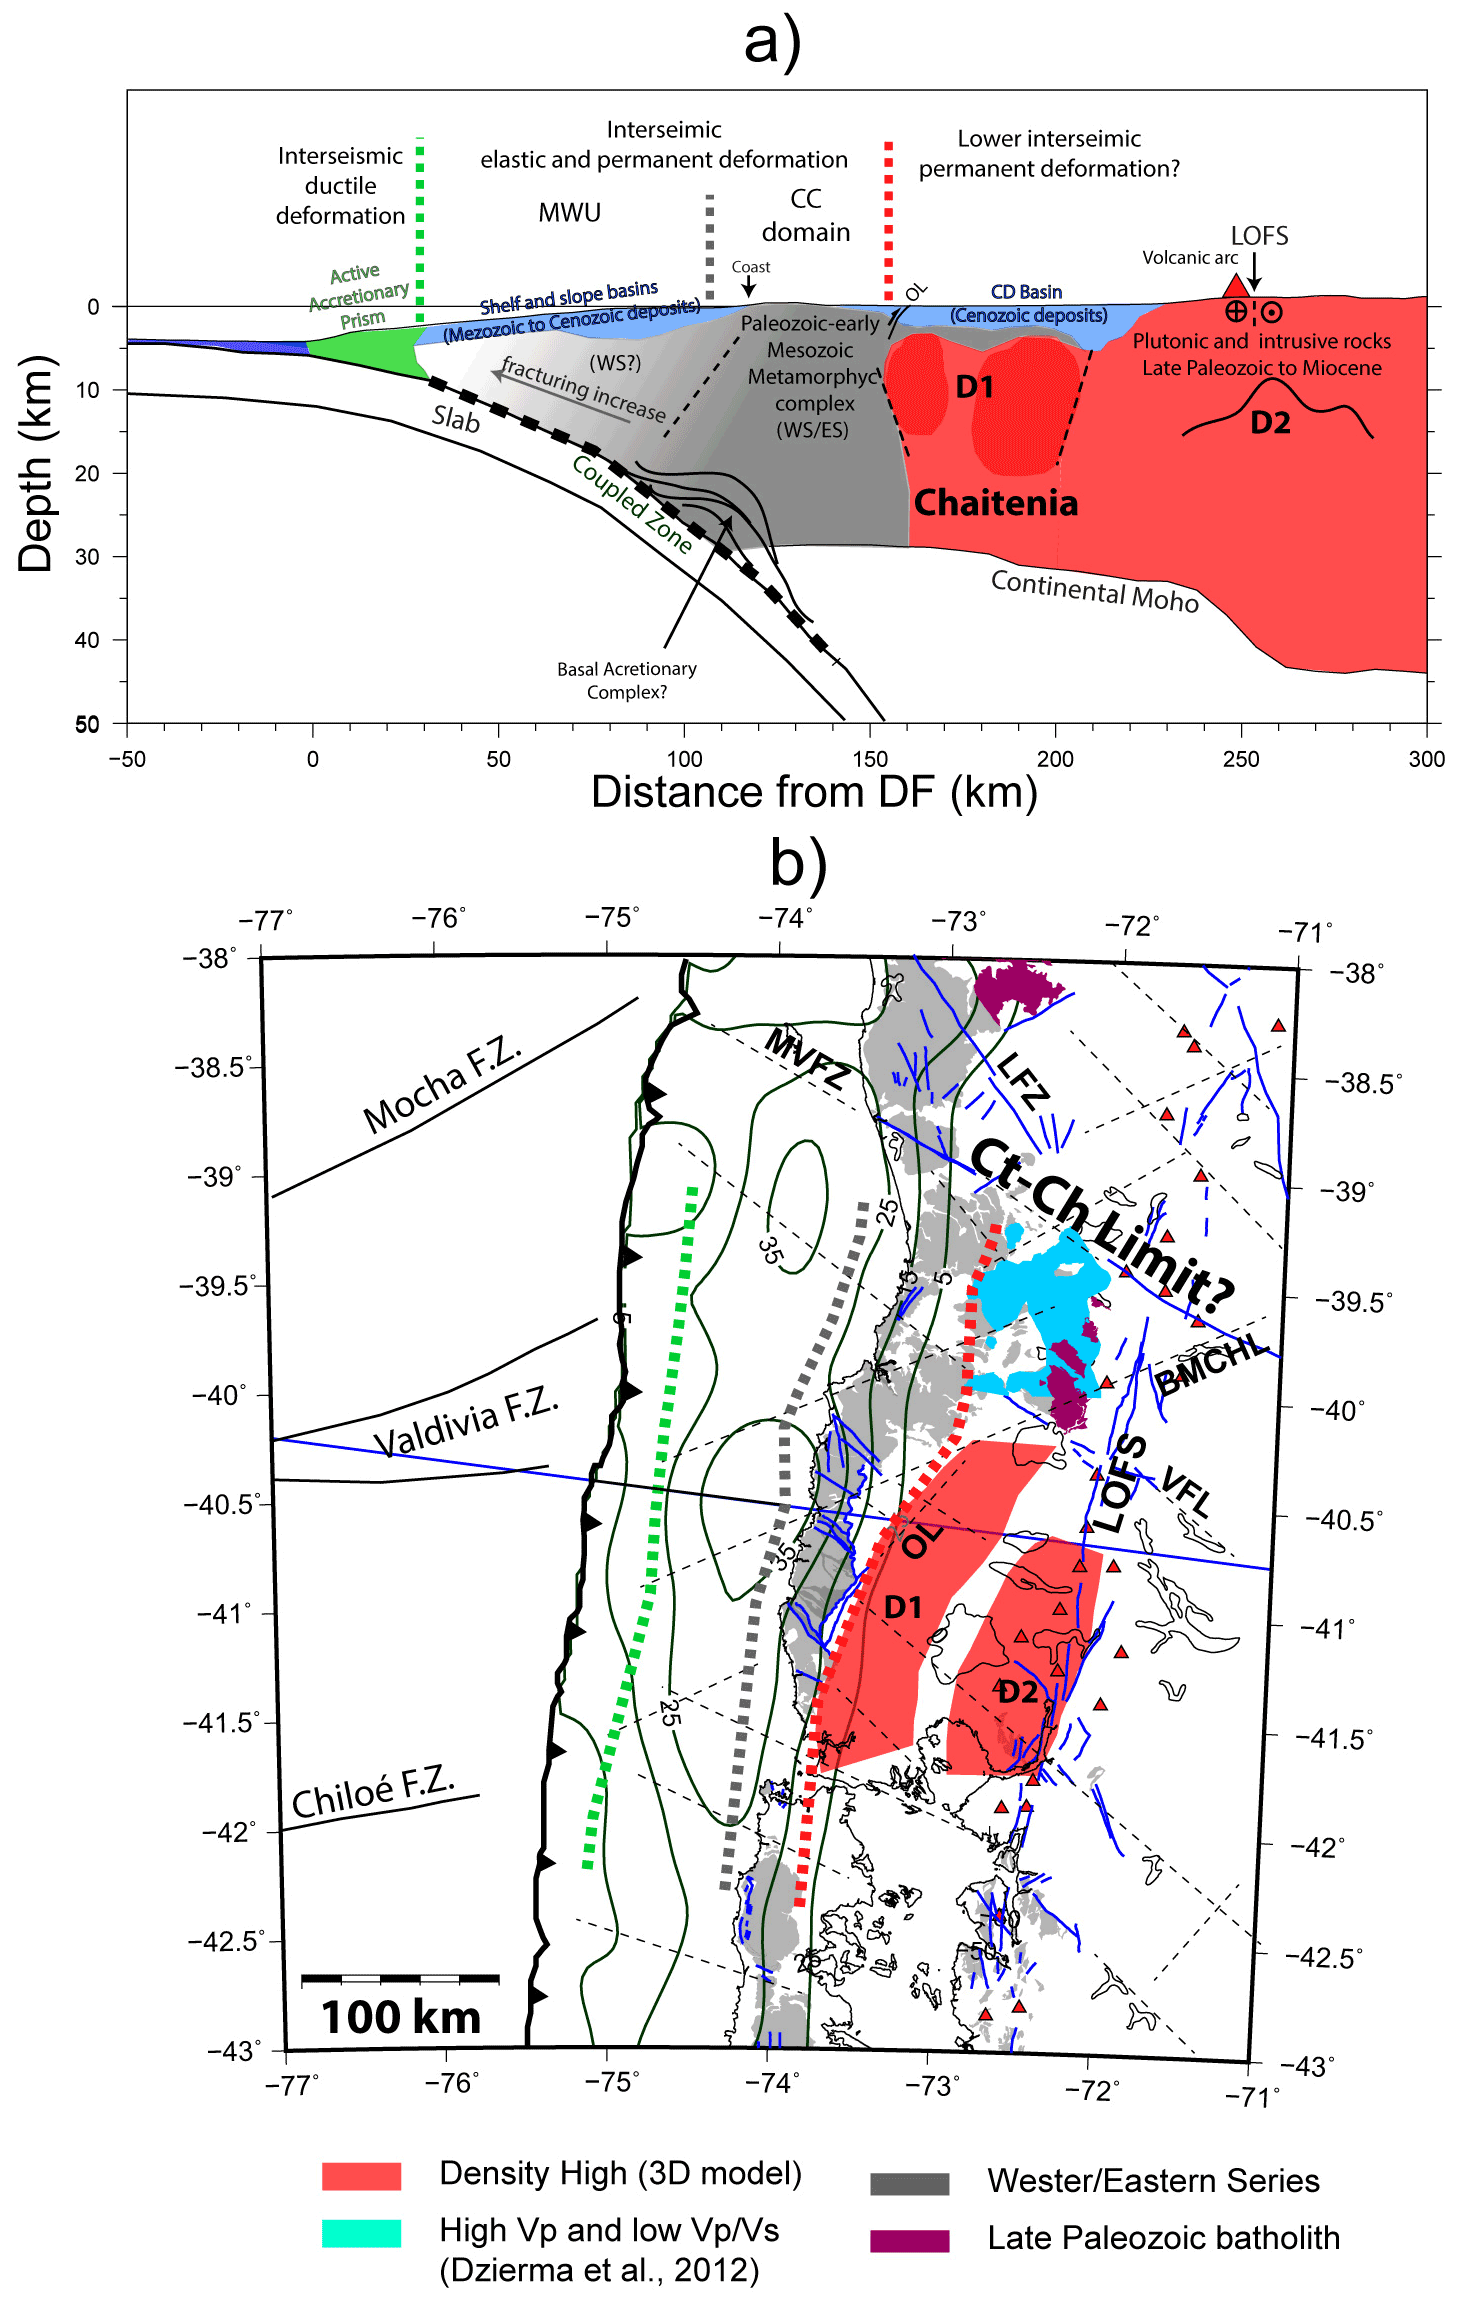
Figure 8Schematic interpretation of continental forearc structure at regional scale. (a) Interpreted profile based on the 2D density model along P3_Osorno line. The main geological/physical units are hatched with different colours: light green for active accretionary prims, grey for Paleozoic–early Mesozoic metamorphic accretionary complex (WS/ES) and light red for high-density continental crust interpreted as evidence of Chaitenia terrane in the forearc region. Dark red areas correspond to anomalies with high-density contrast (≥ 0.1 g cm−3) according to the 3D model along the P3_Osorno line. Light blue indicates Mesozoic to Cenozoic deposits of slope and shelf basins and Cenozoic deposits in the CD basin. Segmented green, grey and red lines indicate the landward limits of the active accretionary prism, middle wedge unit and CC domain (see main text for details). (b) Interpretation map of continental forearc structure. Light red areas highlight the high-density zones (H1 and H2) defined at ∼ 7 km depth in the 3D density model (Fig. 6), and cyan areas correspond to high Vp–low zones identified at 10 km depth by Dzierma et al. (2012b). As in (a) segmented green, grey and red lines indicate the landward limits of the active accretionary prism, middle wedge unit and CC domain and other elements as in Figs. 1a and 3b.
The CC domain extends landward to the contact with the D1 anomaly (dotted red line in Fig. 8). The eastern border of CC range at the surface correlates almost exactly with the western border of D1 in the 3D model (Figs. 6 and 7), which is also observed in 2D regional profiles (Fig. 4). Accordingly, we understand that the continental crust of the CC domain is deformed against a denser (and probably more rigid) block of the continental crust observed here as the D1 anomaly. As mentioned before, the lineament OL (Figs. 1b, 6 and 8) is continued to the south by a west-dipping reverse fault that limits CC and CD (SERNAGEOMIN, 2003; Melnick and Echtler, 2006; Hackney et al., 2006; Encinas et al., 2021). This is an example of the contractional deformation styles that could be generated in the eastern border of CC by the depth contact between the CC domain and D1. It is interesting to note that the onshore refraction seismic profile ZDO-001, located to the west of D1 (in the CC along the profile P3_Osorno; see location in Fig. 2), shows the inversion of an Oligo-Miocene normal fault, while the seismic profile Z5B-010A (located to the south of P4_Llanquihue profile) presents a minor contractional deformation in the CD sequences, above the D1 (Jordan et al., 2001). Deep below the CC, Maksymowicz et al. (2021) shows seismic reflectors at deep crustal levels with east-dipping angles, which is consistent with the geometry of the western border of D1 (Fig. 7) and supports a structural relation between the metamorphic complexes (WS/ES) and D1. However, the resolution of the density model is not enough to calculate the precise inclination of the western border of D1, and this structural relation is only suggested by the results.
In the northern profile P1_Toltén, D1 correlates with the high Vp and low anomalies obtained by Dzierma et al. (2012b). Inside the region highlighted by white contours in Fig. 4b, these authors show values lower than 1.74, contrasting with values higher than 1.78, eastward and westward. In same region Vp and Vs models reach values ∼ 4 % and ∼ 8 % higher than surrounding regions, respectively. Then, at least at the profile P1_Toltén, the correlation between D1 anomaly and the change in elastic properties is clearly observed. Considering this Vs velocity anomaly and an increase in density of about 0.05 g cm−3 (associated with the D1 anomaly, Figs. 4a and 7), we estimated an increase in shear modulus of the order of 20 % in comparison to the surrounding regions (at the same depth). To the south, this seismic velocity anomaly shows a clear continuity with the D1 geometry noticed in the 3D density model (Fig. 8b). This continuity indicates that D1 is a primary characteristic of the continental crust, southward from ∼ 39∘ S, and this supports the interpretation of D1 as a dense–rigid zone. The latitudinal analysis of these independent geophysical models establishes that those basement units associated with D1 are progressively shifted to the east (and taken away from the trench), northward from 41.5∘ S (Fig. 8b). In other words, the portion of the continental wedge formed by the MWU and CC domain is ∼ 50 km wider at 39.5∘ S compared to that observed at 42∘ S.
Outcrops of the late Paleozoic batholith near ∼ 40∘ S are observed in the western border of WS/ES and D1 anomaly, possible implying that D1 is the southward continuation of the late Paleozoic batholith. However, outcrops of this Batholith are described at ∼ 40.3∘ S (Deckart et al., 2014) and ∼ 42.5∘ S (SERNAGEOMIN, 2003) near to a volcanic arc, indicating a possible association of this unit with the D2 anomaly. In this case, south of 39∘ S, D1 should be a high-density basement unit located westward from the late Paleozoic (Pennsylvanian) batholith. An interesting candidate to fit these conditions is Chaitenia terrane (Ct in Fig. 1b), which is described as an island arc, accreted to the Gondwana margin during late Devonian times (Hervé et al., 2016, 2018). The northward limit of D1 (high Vp and Low anomaly, Dzierma et al., 2012b) can be roughly defined by the MVFZ. This structure could be interpreted as a limit between Chaitenia and Chilenia terrane to the north (Fig. 8b). This interpretation raises an interesting question about the role of the Chaitenia–Chilenia limit in the observed westward shift of the late Paleozoic batholith southward of 38∘ S and its relationship with the continental deformation generated by the kinematics of LOFS (Cembrano et al., 1996; Melnick et al., 2009; Geersen et al., 2011). On the other hand, Plissard et al. (2019) observed that outcrops of mafic and ultramafic (serpentinites) rocks associated with WS (south of 39∘ S) show P–T patterns (and structural characteristics) that allow these units to be interpreted as rock located below an incipient back-arc basin during Devonian times (380–370 Ma), which were incorporated into the subduction channel, reaching depths of about 60 km downward in the interpolate boundary (during Carboniferous time), to be finally exhumed in the eastern border of an accretionary wedge during Permian times. Under this interpretation the eastern border of the Devonian island arc (associated with Chaitenia terrane by Hervé et al., 2016, 2018) corresponds to an incipient back-arc, rather than a subduction zone, but the process finally ends in the accretion of the Devonian island arc to the Gondwana margin. Again, these accreted units could be related to the D1 anomaly in the region.
Beyond the lithology and age of D1 and D2 anomalies it is necessary to highlight the spatial association between the active volcanism and the main lineaments of the LOFS (Lara and Folguera, 2006; Sánchez et al., 2013; Díaz et al., 2020). Figure 6 shows that most of the quaternary volcanoes are located above the local regions of relatively low-density contrast (in general < 0.0 g cm−3 below 5 km depth) inside D2. This local 3D pattern of density anomalies is not easy to interpret in 2D regional models, because they are averaging the density structure around the profiles, and shows that the 3D local inversion is a relevant methodology (complementary to 2D regional analysis) to observe medium-depth and shallow-density structures in the upper crust. These local regions of relatively low-density contrast could respond to more fractured regions of the upper crust as a response of deep structures associated with branches of LOFS and other continental structures presents below the CC and CD. In fact, relatively low-density zones may be related to active volcanic processes observed along this fault system in the Araucanía, Los Ríos and Los Lagos districts. As shown by Díaz et al. (2020), relatively low electric resistivity is found at depths between 7 and 15 km below the local trace of the LOFS, east of Osorno volcano, associated in this case with a zone of partial melt related to a deeper ascent of basaltic magmas enhanced by the LOFS, and therefore a lower density compared to its surroundings.
The upward migration of magmas should generate local weakening zones in the overriding plate, and consequently, the continental crust in the active volcanic zone should present pervasive fracturing, fluid migration and lower density. Hence, the basement extended to the east of D1 could correspond to a similar lithology but be affected by the pervasive fracturing and fluid migration processes associated with an active volcanic arc and LOFS. This interpretation is supported by the increase in values to the east of D1 (Dzierma et al., 2012b), at least at the profile P1_Toltén (Fig. 4a). On the other hand, Kapinos et al. (2016) and Segovia el al. (2021) describe electrically conductive anomalies eastward from LOFS and high resistivity values beneath the CD basin (Fig. 4b and e). To the west of D1, these authors also establish conductive anomalies associated with the CC domain, reinforcing the interpretation of a transition from a highly deformed and fractured basement (related to deep units of WS/ES) to a denser/rigid basement below CD.
It is already known that the rupture propagation during large earthquakes, the interseismic deformation (including aftershocks and foreshocks), and the interplate locking are complex processes that depend primary on the frictional properties at the interplate boundary (subduction channel) and the stress field evolution (Scholz, 1998; Perfettini and Avouac, 2004; Tassara, 2010; Moreno et al., 2018; Im et al., 2020). As mentioned before, the segment of the continental wedge that includes MWU and CC domains, i.e. fractured and/or metamorphic basement units, is progressively wider to the north of 42∘ S. This structural change correlates with the patch of high coseismic slip of the 1960 Mw 9.6 Valdivia earthquake (Fig. 8b), which added to the correlation with gravity anomaly L1 (Fig. 3a) and with changes in slope morphology, suggesting a link between the megathrust seismotectonics and physical properties of the overriding plate. In this regard, we propose that the MWU and CC domains correspond to a portion of the continental plate displaying a higher elastic and permanent deformation compared to the rigid basement landward (Chaitenia/Chilenia). Consequently, the change in the horizontal extension of this unit should modify the process of stress loading during the interseismic periods.
Due to the relatively scarce seismological data in the area and the long recurrence time for large events, it is difficult to conceptualize the complete seismotectonic story of the study zone. Nevertheless, some observations seem to support our hypothesis. Firstly, the rupture zone and aftershocks (including continental intraplate events) of the Mw 7.6 earthquake occurred in 2016 at 43.5∘ S. This event was the largest since 1960 in the rupture area of the Valdivia earthquake (Moreno et al., 2018; Lange et al., 2018) was located at the base and within the CC domain, in the western border of a high Vp-low anomaly (Lange, 2008). This velocity anomaly is a clear continuation of D1 to the south of the studied area. On the other hand, historical (not instrumentally recorded) megathrusts events activated this segment of the margin in 1737 (Mw∼7.5) and 1837 (Mw∼8). They have been associated with ruptures extended to the south of ∼ 39∘ S (Kelleher, 1974; Lomnitz, 2004), indicating that the northern portion of 1960 Valdivia earthquake could have different mechanical properties.
Lithology and internal deformation style inside and at the base of MWU and CC domains can play a different but complementary physical role in the seismotectonic segmentation of the margin. The high slip patch of Valdivia earthquake also correlates with the segment where the geometry of the marine continental wedge (seaward from shelf break) is consistent with a decrease in the effective friction coefficient () at the interplate boundary (Maksymowicz et al., 2015). This suggests oversaturated fluid conditions in the subduction channel, at least in the western portion MWU at the study zone. At the same time, according to Menant et al. (2019), the deformation style of basal accretionary complexes (typically an antiformal stack of duplexes) favoured upward fluid fluxes from the interplate boundary, generating dewatering and the increase in in some adjacent regions of the subduction channel (mainly downward from basal accretionary complex). Several authors have suggested the presence of this deformation style in the deep zone of WS units (Krawczyk et al., 2006; Ramos et al., 2018; Moreno et al., 2018; Maksymowicz et al., 2021). Under this interpretation, the widening of MWU and CC domains to the north of ∼ 42∘ S could favour high friction in the deep region of the interplate boundary (below CC domain) and a relatively low friction in the seaward portion of MWU. Therefore, the position and horizontal extension of the WS could be linked to changes in the frictional properties along the megathrust. However, more studies should be done to explore the seaward limit of WS/ES and the internal structure of MWU and CC domain.
2D and 3D density models of the forearc show a landward and latitudinal segmentation of the continental wedge in the studied zone. Offshore, the active accretionary prism limit, with a more competent basement below the middle wedge and shelf, exhibits a landward increase in density, probably associated with a progressive decrease in fracturing. To the east, the Coastal Cordillera domain presents an increase in the upper crust densities but reaches lower values than those observed in the high-density anomaly below the Central Depression. Northward from ∼ 42∘ S, this high-density anomaly is seen progressively further from the trench, determining a northward widening of the middle wedge and Coastal Cordillera. This feature correlates with the high slip patch of the giant 1960 Mw 9.6 Valdivia earthquake.
Based on geological information, we associate the middle wedge unit (at least its eastern portion) and Coastal Cordillera domain with the late Paleozoic–early Mesozoic accretionary complex, and the high-density anomaly below the Central Depression as geophysical evidence of Chaitenia terrane. The deformation style at the eastern border of the Coastal Cordillera and seismological studies support the hypothesis of a more rigid behaviour of the continental crust below the Central Depression. Accordingly, we propose that changes in the horizontal extension of the middle wedge unit and Coastal Cordillera domain should have modified the process of stress loading during the interseismic periods, and that changes in position and extension of the late Paleozoic–early Mesozoic accretionary complex could be linked to the frictional properties of the interplate boundary.
Our results highlight the role of the overriding plate structure in the seismotectonics process in subduction zones, but more studies are necessary to understand the changes in physical properties (elasticity, temperature, among others) associated with the geological story of the margin. This work motivates similar analysis of the continental basement in other subduction margins, as in the 2010 Mw 8.8 Maule earthquake and Mw 9.0 Tohoku-Oki rupture zones.
Models and GravGrad routines are available at https://osf.io/y9aph/ (last access: 20 December 2021, Maksymowicz, 2021): https://doi.org/10.17605/OSF.IO/Y9APH.
Data are available at https://osf.io/y9aph/ (last access: 20 December 2021, Maksymowicz, 2021). https://doi.org/10.17605/OSF.IO/Y9APH.
The supplement related to this article is available online at: https://doi.org/10.5194/se-13-117-2022-supplement.
AM designed the gravity experiment and DD designed MT and TEM experiments. Data acquisition was performed by AM, DMC and DD. AM and DMC developed the gravity data processing and 2D and 3D models. MJS and DMC performed MT and TEM data processing and modelling. The interpretation and discussion were developed by AM, DMC, DD and TR. AM prepared the paper with contributions from all co-authors.
The contact author has declared that neither they nor their co-authors have any competing interests.
Publisher’s note: Copernicus Publications remains neutral with regard to jurisdictional claims in published maps and institutional affiliations.
This work was funded by CONICYT/ANID under the Chilean Fondo Nacional de Desarrollo Científico y Tecnológico (FONDECYT), grant 11170047. We also thank the support of FONDECYT 1211257 and CONICYT/ANID- PIA/Anillo de Investigación en Ciencia y Tecnología ACT172002 project “The interplay between subduction processes and natural disasters in Chile”.
This research has been supported by the Fondo Nacional de Desarrollo Científico y Tecnológico (grant no. 11170047).
This paper was edited by CharLotte Krawczyk and reviewed by Carla Braitenberg, Andres Tassara, and one anonymous referee.
Adriasola, A. C., Thomson, S. N., and Brix, M. R.: Postmagmatic cooling and late Cenozoic denudation of the North Patagonian Batholith in the Los Lagos region of Chile, 41∘-42∘15′S, Int. J. Earth. Sci. (Geol Rundsch), 95, 504–528, https://doi.org/10.1007/s00531-005-0027-9, 2005.
Álvarez, O., Nacif, S., Gimenesz, M., Folguera, A., and Braitenberg, C.: Goce derived vertical gravity gradient delineates great earthquake rupture zones along the chilean margin, Tectonophysics, 622, 198–215, https://doi.org/10.1016/j.tecto.2014.03.011, 2014.
Bangs, N. and Cande, S.: Episodic development of a convergent margin inferred from structures and processes along the southern Chile margin, Tectonics, 16, 489–503, 1997.
Bangs, N., Morgan, J. K., Tréhu, A. M., Contreras-Reyes, E., Arnul, A., Han, S., Olsen, K. M., and Zhang, E.: Basal accretion along the south-central Chilean margin and its relationship to great earthquakes, J. Geophys. Res., 125, 1–21, https://doi.org/10.1029/2020JB019861, 2020.
Bassett, D. and Watts, A. B.: Gravity anomalies, crustal structure, and seismicity at subduction zones: 2. Interrelationships between fore-arc structure and seismogenic behavior, Geochem. Geophy. Geosy., 16, 1541–1576, https://doi.org/10.1002/2014GC005685, 2015.
Bassett, D., Sandwell, D. T., Fialko, Y., and Watts, A. B.: Upper–plate controls on co-seismic slip in the 2011 magnitude 9.0 Tohoku-oki earthquake, Nature, 531, 92–96, 2016.
Becerra, J., Contreras-Reyes, E., and Arriagada, C.: Seismic structure and tectonics of the southern Arauco Basin, south-central Chile (∼38∘S), Tectonophysics, 592, 53–66, 2013.
Bilek, S. L., Schwartz, S. Y., and Deshon, H. R.: Control of seafloor roughness on earthquake rupture behavior, Geology, 31, 455–458, https://doi.org/10.1130/0091-7613(2003)031<0455:COSROE>2.0.CO;2, 2003.
Blakely, R. J.: Potential Theory in Gravity & Magnetic Applications, Cambridge University Press, Cambridge, https://doi.org/10.1017/CBO9780511549816, 1995.
Bostick, F. X.: A simple almost exact method of MT analysis, Workshop on electrical methods in geothermal exploration, US Geol. Surv., Contract No. 14080001-8, 359, 174–183, 1977.
Brocher, T. M.: Empirical Relations between Elastic Wavespeeds and Density in the Earth's Crust, B. Seismol. Soc. Am., 95, 2081–2092, https://doi.org/10.1785/0120050077, 2005.
Cembrano, J., Herve, F., and Lavenu, A.: The Liquiñe-Ofqui fault zone: a long-lived intra-arc fault system in southern Chile, Tectonophysics, 259, 55–66, 1996.
Charrier, R., Pinto, L., and Rodríguez, M. P.: Tectonostratigraphic evolution of the Andean Orogen in Chile, edited by: Moreno, T. and Gibbons, W., The Geology of Chile, Geol. Soc. Lond., 21–114, 2007.
Comte, D., Farías, M., Roecker, S., and Russo, R. M.: The Nature of the subduction wedge in an erosive margin: Insights from the analysis of aftershocks of the 2015 Mw 8.3 Illapel earthquake beneath the Chilean Coastal Range, Earth Planet. Sc. Lett., 520, 50–62, 2019.
Constable, S. C., Parker, R. L., and Constable, C. G.: Occam's inversion: A practical algorithm for generating smooth models from electromagnetic sounding data, Geophysics, 52, 289–300, 1987.
Contreras-Reyes, E., Grevemeyer, I., Flueh, E. R., and Reichert, C.: Upper lithospheric structure of the subduction zone offshore of southern Arauco peninsula, Chile at ∼38∘ S, J. Geophys. Res., 113, B07303, https://doi.org/10.1029/2007JB005569, 2008.
Contreras-Reyes, E., Flueh, E., and Grevemeyer, I.: Tectonic control on sediment accretion and subduction off south central Chile: implications for co-seismic rupture processes of the 1960 and 2010 megathrust earthquakes, Tectonics, 29, 1–27, https://doi.org/10.1029/2010TC002734, 2010.
Contreras-Reyes, E. and Carrizo, D.: Control of high oceanic features and subduction channel on earthquake ruptures along the Chile–Peru subduction zone, Phys. Earth Planet. Int., 186, 49–58, https://doi.org/10.1016/j.pepi.2011.03.002, 2011.
Contreras-Reyes, E., Maksymowicz, A., Lange, D., Grevemeyer, I., Muñoz-Linford, P., and Moscoso, E.: On the relationship between structure, morphology and large co-seismic slip: A case study of the Mw 8.8 Maule, Chile 2010 earthquake, Earth Planet. Sc. Lett., 478, 27–39, https://doi.org/10.1016/j.epsl.2017.08.028, 2017.
Cubas, N., Avouac, J. P., Leroy, Y. M., and Pons, A.: Low friction along the high slip patch of the 2011 Mw 9.0 Tohoku-Oki earthquake required from the wedge structure and extensional splay faults, Geophys. Res. Lett., 40, 4231–4237, https://doi.org/10.1002/grl.50682, 2013a.
Cubas, N., Avouac, J. P., Souloumiac, P., and Leroy, Y. M.: Megathrust friction determined from mechanical analysis of the forearc in the Maule earthquake area, Earth Planet. Sc. Lett., 381, 92–103, https://doi.org/10.1016/j.epsl.2013.07.037, 2013b.
Dahlen, F. A.: Noncohesive critical Coulomb wedges: an exact solution, J. Geophys. Res., 89, 125–133, 1984.
Deckart, D., Hervé, F., Fanning, C. M., Ramírez, V., Calderón, M., and Godoy, E.: U-Pb geochronology and Hf-O isotopes of zircons from the Pennsylvanian Coastal Batholith, South-Central Chile, Andean Geol., 41, 49–82, 2014.
DGA: Estudio cuencas principales Región de los Ríos / Ministerio de Obras Públicas, Dirección General de Aguas, División de Estudios y Planificación, S.I.T. No 293, 1–291, 2012.
Díaz, D., Zúñiga, F., and Castruccio, A.: The interaction between active crustal faults and volcanism: A case study of the Liquiñe-Ofqui Fault Zone and Osorno volcano, southern Andes, using magnetotellurics, J. Volcanol. Geoth. Res., 393, 106806, https://doi.org/10.1016/j.jvolgeores.2020.106806, 2020.
Duhart, P., McDonough, M., Muñoz, J., Martin, M., and Villeneuve, M.: El Complejo Metamórfico Bahía Mansa en la Cordillera de la Costa del centro-sur de Chile (39∘30′-42∘00′S): geocronología K-Ar, Ar/Ar y U-Pb e implicancias en la evolución del margen sur-occidental de Gondwana, Revista Geológica de Chile, 28, 179–208, 2001.
Dzierma, Y., Thorwart, M., and Rabbel, W.: Moho topography and subducting oceanic slab of the Chilean continental margin in the maximum slip segment of the 1960 Mw 9.5 Valdivia (Chile) earthquake from P-receiver functions, Tectonophysics, 530, 180–192, 2012a.
Dzierma, Y., Rabbel, W., Thorwart, M., Koulakov, I., Wehrmann, H., Hoernle, K., and Comte, D.: Seismic velocity structure of the slab and continental plate in the region of the 1960 Valdivia (Chile) slip maximum – Insights into fluid release and plate coupling, Earth Planet. Sc. Lett., 331, 164–176, 2012b.
Dzierma, Y., Thorwart, M., Rabbel, W., Siegmund, C., Comte, D., Bataille, K., Iglesia, P., and Prezzi, C.: Seismicity near the slip maximum of the 1960Mw 9.5 Valdivia earthquake (Chile): Plate interface lock and reactivation of the subducted Valdivia Fracture Zone, J. Geophys. Res., 117, B06312, https://doi.org/10.1029/2011JB008914, 2012c.
Egbert, G. and Booker, J.: Robust estimation of geomagnetic transfer functions, Geophysics, 87, 173–194, 1989.
Encinas, A., Sagripanti, L., Rodríguez, M.P., Orts, D., Anavalón, A., Giroux, P., Otero, J., Echaurren, A., Zambrano, P. and Valencia, V.: Tectonosedimentary evolution of the Coastal Cordillera and Central Depression of south-Central Chile (36∘30′-42∘S), Earth-Sci. Rev., 213, 103465, https://doi.org/10.1016/j.earscirev.2020.103465, 2021.
Flueh, E. and Grevemeyer, I.: FS SONNE Cruise Report SO 181 Tipteq – from the incoming plate to megathrust earthquakes, Berichte aus dem Leibniz-Institut für Meereswissenschaften an der Christian-Albrechts-Universität zu Kiel, 42, 1–539, https://doi.org/10.3289/IFM-GEOMAR_REP_42_2011, 2005.
Geersen, J., Behrmann, J. H., Völker, D., Krastel, S., Ranero, C. R., Diaz-Naveas, J., and Weinrebe, W.: Active tectonics of the South Chilean marine fore arc (35∘S–40∘S), Tectonics, 30, TC3006, https://doi.org/10.1029/2010TC002777, 2011.
Glodny, J., Lohrmann, J., Echtler, H., Grafe, k., Seifert, W., Collao, S., and Figueroa, O.: Internal dynamics of a paleoaccretionary wedge: Insights from combined isotope tectonochronology and sandbox modelling of the south-central Chilean forearc, Earth Planet. Sc. Lett., 231, 23–39, 2005.
Glodny, J., Gräfe, K., Echtler, H., and Rosenau, M.: Mesozoic to Quaternary continental margin dynamics in south-central Chile (36–42∘ S): The apatite and zircon fission track perspective, Int. J. Earth Sci., 97, 1271–1291, https://doi.org/10.1007/s00531-007-0203-1, 2008.
González, E.: Hydrocarbon resources in the coastal zone of Chile, in: Geology of the Andes and Its Relation to Hydrocarbon and Mineral Resources, edited by: Ericksen, G. E., Cañas, M., and Reinemund, J. A., Cricum-Pac. Counc. for Energy and Miner. Resour., Houston, Tex., 383–404, 1989.
Haberland, C., Rietbrock, A., Lange, D., Bataille, K., and Hofmann, S.: Interaction between forearc and oceanic plate at the south-central Chilean margin as seen in local seismic data, Geophys. Res. Lett., 33, L23302, https://doi.org/10.1029/2006GL028189, 2006.
Hackney, R., Echtler, H., Franz, G., Götze, H. J., Lucassen, F., Marchenko, D., Melnick, D., Meyer, U., Schmidt, S., Tašárová, Z., Tassara, A., and Wienecke, S.: The Segmented Overriding Plate and Coupling at the South-Central Chilean Margin (36-42∘S), in: The Andes-Active Subduction Orogeny, edited by: Oncken, O., Chong, G., Franz, G., Giese, P., Götze, H. J., Ramos, V. A., Strecker, M. R., and Wigger, P., Springer-Verlag, Berlin, Heidelberg, New York, 355–374, 2006.
Hayes, G.: Slab2 – A Comprehensive Subduction Zone Geometry Model: U.S. Geological Survey data release, https://doi.org/10.5066/F7PV6JNV, 2018.
Hervé, F.: Late Paleozoic subduction and accretion in Southern Chile, Episodes, 11, 183–188, 1988.
Hervé, F., Calderón, M., Fanning, C. M., Pankhurst, R. J., and Godoy, E.: Provenance variations in the Late Paleozoic accretionary complex of Central Chile as indicated by detrital zircons, Gondwana Res., 23, 1122–1135, 2013.
Hervé, F., Calderón, M., Fanning, C.M., Pankhurst, R.J., Fuentes, F., Rapela, C. W., Correa, J., Quezada, P., and Marambio, C.: Devonian magmatism in the accretionary complex of southern Chile, J. Geol. Soc. Lond., 173, 587–602, https://doi.org/10.1144/jgs2015-163, 2016.
Hervé, F., Calderon, M., Fanning, C. M., Pankhurst, R. J., Rapela, C. W., and Quezada, P.: The country rocks of Devonian magmatism in the north Patagonian massif and Chaitenia, Andean Geol., 45, 301–317, https://doi.org/10.5027/andgeoV45n3-3117, 2018.
Hicks, S. P., Rietbrock, A., Ryder, I. M. A., Chao-Shing, L., and Miller, M.: Anatomy of a megathrust: The 2010 M8.8 Maule, Chile earthquake rupture zone imaged using seismic tomography, Earth Planet. Sc. Lett., 405, 142–155, 2014.
Honores, C., Pérez, Y., Lemus, M., and Aguilera, F.: Caracterización termal de las cuencas terciarias en la Depresión Central de la Región de Los Lagos mediante información geofísica, Congreso Geológico Chileno, 14, La Serena, Chile, 4–8 Octubre 2015, 503–506, 2015.
Hyppolito, T., Juliani, C., García-Casco, A., Meira, V. T., Bustamante, A., and Hervé, F.: The nature of the Palaeozoic oceanic basin at the southwestern margin of Gondwana and implications for the origin of the Chilenia terrane (Pichilemu region, central Chile), Int. Geol. Rev., 56, 1097–1121, https://doi.org/10.1080/00206814.2014.919612, 2014.
Im, K., Saffer, D., Marone, C., and Avouac, J.-P.: Slip-rate-dependent friction as a universal mechanism for slow slip events, Nat. Geosci., 13, 705–710, https://doi.org/10.1038/s41561-020-0627-9, 2020.
Jarvis, A., Reuter, H. I., Nelson, A., and Guevara, E.: Holelled SRTM for the globe Version 4, available from the CGIAR-CSI SRTM 90 m Database, available at: http://srtm.csi.cgiar.org (last access: 20 December 2021), 2008.
Jordan, T. E., Burns, W. M., Veiga, R., Pángaro, F., Copeland, P., Kelley, S., and Mpodozis, C.: Extension and basin formation in the southern Andes caused by increased convergence rate: A mid-Cenozoic trigger for the Andes, Tectonics, 20, 308–324, 2001.
Kapinos, G., Montahaei, M., Meqbel, N., and Brasse, H.: Three-dimensional electrical resistivity image of the South-Central Chilean subduction zone, Tectonophysics, 666, 76–89, 2016.
Kelleher, J. A.: Rupture zones of large South American earthquakes and some predictions, J. Geophys. Res., 77, 2087–2103, https://doi.org/10.1029/JB077i011p02087, 1972.
Kendrick, E., Bevis, M., Smalley, R., Brooks, B., Vargas, R. B., Laura, E., and Fortes, L. P. S.: The Nazca South America Euler vector and its rate of change, J. S. Am. Earth Sci., 16, 125–131, 2003.
Kane, M. F.: A comprehensive system of terrain corrections using a digital computer, Geophysics, 455–462, 1962.
Kodaira, S., No, T., Nakamura, Y., Fujiwara, T., Kaiho, Y., Miura, S., Takahashi, N., Kaneda, Y., and Taira, A.: Coseismic fault rupture at the trench axis during the 2011 Tohoku-oki earthquake, Nat. Geosci., 5, 646–650, https://doi.org/10.1038/ngeo1547, 2012.
Krawczyk, C. M., Mechie, J., Lüth, S., Tašárová, Z., Wigger, P., Stiller, M., Brasse, H., Echtler, H. P., Araneda, M., and Bataille, K.: Geophysical signatures and active tectonics at the south-central Chilean margin, edited by: Oncken, O., Chong, G., Franz, G., Giese, P., Götze, H. J., Ramos, V. A., Strecker, M. R., and Wigger, P., The Andes-Active Subduction Orogeny, Frontiers in Earth Sciences, Springer-Verlag, Berlin, Heidelberg, New York, 171–192, 2006.
Lange, D.: The South Chilean subduction zone between 41∘S and 43.5∘S: seismicity, structure and state of stress, PhD thesis, University of Potsdam, available at: https://publishup.uni-potsdam.de/opus4-ubp/frontdoor/index/index/docId/1738 (last access: 20 December 2021), 2008.
Lange, D., Cembrano, J., Rietbrock, A., Haberland, C., Dahm, T., and Bataille, K.: First seismic record for intra-arc strike-slip tectonics along the Liquiñe-Ofqui fault zone at the obliquely convergent plate margin of the southern Andes, Tectonophysics, 455, 14–24, 2008.
Lange, D., Ruiz, J., Carrasco, S., and Manríquez, M.: The Chiloé Mw 7.6 earthquake of 2016 December 25 in Southern Chile and its relation to the Mw 9.5 1960 Valdivia earthquake, Geophys. J. Int., 213, 210–221, https://doi.org/10.1093/gji/ggx514, 2018.
Lara, L. E. and Folguera, A.: The Pliocene to Quaternary narrowing of the Southern Andean volcanic arc between 37∘ and 41∘ S latitude, in: Evolution of an Andean margin: A tectonic and magmatic view from the Andes to the Neuquén Basin (35∘–39∘S lat, edited by: Kay, S. M. and Ramos, V. A., Geol. S. Am. S., 407, 299–315, https://doi.org/10.1130/2006.2407(14), 2006.
León-Ríos, S., Ruiz, S., Maksymowicz, A., Leyton, F., Fuenzalizada, A., and Madariaga, R.: Diversity of the Iquique's foreshocks and aftershocks: a clue about complex rupture process of a Mw 8.1 earthquake, J. Seismol, 20, 1059–1073, https://doi.org/10.1007/s10950-016-9568-6, 2016.
Li, D. and Liu, Y.: Modeling slow-slip segmentation in cascadia subduction zone constrained by tremor locations and gravity anomalies, J. Geophys. Res., 122, 3138–3157, 2017.
Li, Y. and Oldenburg, D. W.: 3-D inversion of gravity data, Geophysics, 63, 109–119, 1998.
Lomnitz, C.: Major Earthquakes of Chile: A Historical Survey, 1535-1960, Seismol. Res. Lett., 75, 368–378, https://doi.org/10.1785/gssrl.75.3.368, 2004.
Longman, I. M.: Formulas for computing the tidal acceleration due to the Moon and Sun, J. Geophys. Res., 64, 2351–2355. 1959
Lowrie, W.: Fundamentals of Geophysics, 2nd edition, Cambridge University Press, Cambridge, 381 pp., 2007.
Maksymowicz, A.: The geometry of the Chilean continental wedge: tectonic segmentation of subduction processes off Chile, Tectonophysics, 659, 183–196, 2015.
Maksymowicz, A.: Forearc density structure of the overriding plate in the northern area of the giant 1960 Valdivia earthquake, [code] https://doi.org/10.17605/OSF.IO/Y9APH, 2021.
Maksymowicz, A., Tréhu, A. M., Contreras-Reyes, E., and Ruiz, S.: Density-depth model of the continental wedge at the maximum slip segment of the Maule Mw 8.8 megathrust earthquake, Earth Planet. Sc. Lett., 409, 265–277, 2015.
Maksymowicz, A., Chadwell, C. D., Ruiz, J., Tréhu, A. M., Contreras-Reyes, E., Weinrebe, W., Díaz-Naveas, J., Gibson, J. C., Lonsdale, P., and Tryon, M. D.: Coseismic seafloor deformation in the trench region during the Mw 8.8 Maule megathrust earthquake, Sci. Rep., 7, 45918, https://doi.org/10.1038/srep45918, 2017.
Maksymowicz, A., Ruiz, J., Vera, E., Contreras-Reyes, E., Ruiz, S., Arriagada, C., Bonvalot, S., and Bascuñan, S.: Heterogeneous structure of the Northern Chile marine forearc and its implications for megathrust earthquakes, Geophys. J. Int., 215, 1080–1097, https://doi.org/10.1093/gji/ggy325, 2018.
Maksymowicz, A., Contreras-Reyes, E., Díaz, D., Comte, D., Bangs, N., Tréhu, A. M., Vera, E., Hervé, F., Rietbrock, A.: Deep structure of the continental plate in the south-central Chilean margin: Metamorphic wedge and implications for megathrust earthquakes, J. Geophys. Res.-Sol. Ea., 126, e2021JB021879, https://doi.org/10.1029/2021JB021879, 2021.
Martínez-Loriente, S., Sallarès, V., Ranero, R. C., Ruh, B., Barckhausen, J., Grevemeyer, U. I., and Bangs, N.: Influence of incoming plate relief on overriding plate deformation and earthquake nucleation: Cocos Ridge subduction (Costa Rica), Tectonics, 38, 4360–4377, https://doi.org/10.1029/2019TC005586, 2019.
McDonough, M., Duhart, P., and Crignola, P.: Naturaleza del alzamiento del basamento costero y la apertura de la cuenca Osorno-Llanquihue, Xa Región: nuevos antecedentes sísmicos y observaciones de terreno, in: Congreso Geológico Chileno, No. 8, Actas, 1, 164–168, 1997.
Melnick, D. and Echtler, H. P.: Morphotectonic and geologic digital map compilations of the south-central Andes (36–42∘ S), in: The Andes – Active Subduction Orogeny, edited by: Oncken, O., Chong, G., Franz, G., Giese, P., Götze, H.-J., Ramos, V. A., Strecker, M., Wigger, P., Springer-Verlag, Berlin, Heidelberg, New York, 565–568, 2006.
Melnick, D., Bookhagen, B., Strecker, M. R., and Echtler, H. P.: Segmentation of megathrust rupture zones from fore-arc deformation patterns over hundreds to millions of years, Arauco peninsula, Chile., J. Geophys. Res., 114, B01407, https://doi.org/10.1029/2008JB005788, 2009.
Menant, A., Angiboust, S., and Gerya, T.: Stress-driven fluid flow controls long-term megathrust strength and deep accretionary dynamics, Sci. Rep., 9, 9714, https://doi.org/10.1038/s41598-019-46191-y, 2019.
Molina, D., Tassara, A., Abarca, R., Melnick, D., and Madella, A.:. Frictional segmentation of the Chilean megathrust from a multivariate analysis of geophysical, geological, and geodetic data, J. Geophys. Res.-Sol. Ea., 126, e2020JB020647, https://doi.org/10.1029/2020JB020647, 2021.
Moreno, M. S., Bolte, J., Klotz, J., and Melnick, D.: Impact of megathrust geometry on inversion of coseismic slip from geodetic data: Application to the 1960 Chile earthquake, Geophys. Res. Lett., 36, L16310, https://doi.org/10.1038/s41561-018-0089-5, 2009.
Moreno, M., Li, S., Melnick, D., Bedford, J. R., Baez, J. C., Motagh, M., Metzger, S., Vajedian, S., Sippl, C., Gutknecht, B. D., Contreras-Reyes, E., Deng, Z., Tassara, A., and Oncken, O.: Chilean megathrust earthquake recurrence linked to frictional contrast at depth, Nat. Geosci., 11, 11, 285–290, https://doi.org/10.1038/s41561-018-0089-5, 2018.
Moscoso, E., Grevemeyer, I., Contreras-Reyes, E., Flueh, E.R., Dzierma, Y., Rabbel, W., and Thorwart, M.: Revealing the deep structure and rupture plane of the 2010 Maule, Chile earthquake (Mw=8.8) using wide angle seismic data, Earth Planet. Sc. Lett., 307, 147–155, https://doi.org/10.1016/j.epsl.2011.04.025, 2011.
Nagy, D.: The prism method for terrain corrections using digital computers, Pure Appl. Geophys., 63, 31–39, https://doi.org/10.1007/BF00875156, 1966.
Orts, D. L., Folguera, A., Encinas, A., Ramos, M., Tobal, J., and Ramos, V. A.: Tectonic development of the North Patagonian Andes and their related Miocene foreland basin (41∘30′-43∘S), Tectonics, 31, https://doi.org/10.1029/2011TC003084, 2012.
Peacock, S. M. and Hyndman, R. D.: Hydrous minerals in the mantle wedge and the maximum depth of subduction thrust earthquakes, Geophys. Res. Lett., 26, 2517–2520, 1999.
Perfettini, H. and Avouac, J.-P.: Stress transfer and strain rate variations during the seismic cycle, J. Geophys. Res., 109, B06402, https://doi.org/10.1029/2003JB002917, 2004.
Plissart, G., González-Jiménez, J. M., Garrido, L. N. F., Colás, V., Berger, J., Monnier, C., Diot, H., and Padrón-Navarta, J. A.: Tectono-metamorphic evolution of subduction channel serpentinites from South-Central Chile, Lithos, 336, 221–241, https://doi.org/10.1016/j.lithos.2019.03.023, 2019.
Poli, P., Maksymowicz, A., and Ruiz, S.: The Mw 8.3 Illapel earthquake (Chile): Preseismic and postseismic activity associated with hydrated slab structures, Geology, 45, 247–250, https://doi.org/10.1130/G38522.1, 2017.
Ramos, V. A., Jordan, T. E., Allmendinger, R. W., Mpodozis, C., Kay, S. M., Cortés, J. M., and Palma, M.: Paleozoic terranes of the central Argentine-Chilean Andes, Tectonics, 5, 855–880, https://doi.org/10.1029/TC005i006p00855, 1986.
Ramos, C., Mechie, J., and Stiller, M.: Reflection seismic images and amplitude ratio modelling of the Chilean subduction zone at 38.25∘ S, Tectonophysics, 747, 115–127, 2018.
Rapalini, A. E.: The accretionary history of southern South America from the latest Proterozoic to the Late Paleozoic: some paleomagnetic constraints, edited by: Vaughan, A. P. M., Leat, P. T., Pankhurst, R. J., Terrane Processes at the Margins of Gondwana, J. Geol. Soc. London, 243, 305–328, 2005.
Sánchez, P., Pérez-Flores, P., Arancibia, G., Cembrano, J., and Reich, M.: Crustal deformation effects on the chemical evolution of geothermal systems: the intra-arc Liquiñe–Ofqui fault system, Southern Andes. International Geology Review, 55, 1384–1400, https://doi.org/10.1080/00206814.2013.775731, 2013.
Sandwell, D. T. and Smith, W. H. F.: Global marine gravity from retracked Geosat and ERS-1 altimetry: ridge segmentation versus spreading rate, J. Geophys. Res., 114, B01411, https://doi.org/10.1029/2008JB006008, 2009.
Sandwell, D. T., Müller, R. D., Smith, W. H. F., Garcia, E., and Francis, R.: New global marine gravity model from CryoSat-2 and Jason-1 reveals buried tectonic structure, Science, 346, 65–67, https://doi.org/10.1126/science.1258213, 2014.
Scholz, C. H.: Earthquakes and friction laws, Nature, 391, 37–42, 1998.
Schurr, B., Moreno, M., Tréhu, A. M., Bedford, J., Kummerow, J., Li, S., and Oncken, O.: Forming a Mogi doughnut in the years prior to and immediately before the 2014 M8.1 Iquique, northern Chile earthquake, Geophys. Res. Lett., 47, e2020GL088351, https://doi.org/10.1029/2020GL088351, 2020.
SEGMAR: Mapa Geologico de la Republica Argentina, Escala 1:2.500.000, Servicio Geologico y Minero, Buenos Aires, Argentina, 1–2, 1997.
Segovia, M. J., Diaz, D., Slezak, K., and Zuñiga, F.: Magnetotelluric study in the Los Lagos Region (Chile) to investigate volcano-tectonic processes in the Southern Andes, Earth Planets Space, 73, 1–14, https://doi.org/10.1186/s40623-020-01332-w, 2021.
Seno, T.: Variation of downdip limit of the seismogenic zone near the Japanese islands: Implications for the serpentinization mechanism of the forearc mantle wedge, Earth Planet. Sc. Lett., 231, 249–262, https://doi.org/10.1016/j.epsl.2004.12.027, 2005.
SERNAGEOMIN: Geologic map of Chile, digital version, scale 1:1000000, 1–25, 2003.
Schmidt, S. and Götze, H.-J.: Bouger and isostatic maps of the Central Andes, in: The Andes-active subduction orogeny, edited by: Oncken, O., Chong, G., Franz, G., Giese, P., Götze, H.-J., Ramos, V. A., Strecker, M., and Wigger, P., Springer-Verlag, Heidelberg, 1, 559–563, 2006.
Smith, W. H. F. and Sandwell, D. T.: Global seafloor topography from satellite altimetry and ship depth soundings, Science, 277, 1957–1962, 1997.
Song, T. A. and Simons, M.: Large trench-parallel gravity variations predict seismogenic behavior in subduction zones, Science, 301, 630–633, 2003.
Tašárová, Z. A.: Towards understanding the lithospheric structure of the southern Chilean subduction zone (36∘ S–42∘ S) and its role in the gravity field, Geophys. J. Int., 170, 995–1014, https://doi.org/10.1111/j.1365-246X.2007.03466.x, 2007.
Tassara, A.: Control of forearc density structure on megathrust shear strength along the Chilean subduction zone, Tectonophysics, 495, 34–47, 2010.
Tassara, A., Götze, H.-J., Schmidt, S., and Hackney, R.: Three-dimensional density model of the Nazca plate and the Andean continental margin, J. Geophys. Res., 111, B09404, https://doi.org/10.1029/2005JB003976, 2006.
Tréhu, A. M., Hass, B., de Moor, A., Maksymowicz, A., Contreras-Reyes, E., Vera, E., and Tryon, M. D.: Geologic controls on up-dip and along-strike propagation of slip during subduction zone earthquakes from a high-resolution seismic reflection survey across the northern limit of slip during the 2010 Mw 8.8 Maule earthquake, offshore Chile, Geosphere, 15, 1751–1773, https://doi.org/10.1130/GES02099.1, 2019.
Tsuji, T., Minato, S., Kamei, R., Tsuru, T., and Kimura, G.: 3D geometry of a plate boundary fault related to the 2016 Off-Mie earthquake in the Nankai subduction zone, Japan, Earth. Planet. Sc. Lett., 478, 234–244, https://doi.org/10.1016/j.epsl.2017.08.041, 2017.
van Dinther, Y., Morra, G., Funiciello, F., Rossetti, F., and Faccenna, C.: Exhumation and subduction erosion in orogenic wedges: insights from numerical models, Geochem. Geophys. Geosyst., 13, Q06003, https://doi.org/10.1029/2011GC004011, 2012.
Vigny, C., Rudloff, A., Ruegg, J.-C., Madariaga, R., Campos, J., and Alvarez, M.: Upper plate deformation measured by GPS in the Coquimbo Gap, Chile, Phys. Earth Planet. Int., 175, 86–95, https://doi.org/10.1016/j.pepi.2008.02.013, 2009.
Wang, K., Huang, T., Tilmann, F., Peacock, S. M., and Lange, D.: Role of Serpentinized mantle wedge in affecting Megathrust Seismogenic behavior in the area of the 2010 M=8.8 Maule earthquake, Geophys. Res. Lett., 47, e2020GL090482, https://doi.org/10.1029/2020GL090482, 2020.
Wells, R. E., Blakely, R. J., Sugiyama, Y., Scholl, D. W., and Dinterman, P. A.: Basin-centred asperities in great subduction zone earthquakes: A link between slip, subsidence, and subduction erosion, J. Geophys. Res., 108, 2507–2537, 2003.
Willner, A. P., Glodny, J., Gerya, T. V., Godoy, E., and Massonne, A.: A counterclockwise PTt-path of high pressure-low temperature rocks from the coastal Cordillera accretionary complex of South Central Chile: constraints for the earliest stage of subduction mass flow, Lithos, 75, 283–310, 2004.
Willner, A. P.: Pressure–Temperature Evolution of a Late Palaeozoic Paired Metamorphic Belt in North–Central Chile (34∘–35∘30′S), J. Petrol., 46, 1805–1833, https://doi.org/10.1093/petrology/egi035, 2005.