the Creative Commons Attribution 4.0 License.
the Creative Commons Attribution 4.0 License.
 | 23 Sep 2022
The effect of low-viscosity sediments on the dynamics and accretionary style of subduction margins
Adina E. Pusok
Dave R. Stegman
Madeleine Kerr
Observations of sediments at subduction margins appear to divide them into two classes: accretionary and erosive. Accretionary margins are dominated by accretion of thick piles of sediments (>1 km) from the subducting plate, while tectonic erosion is favored in regions with little or no sedimentary cover (<1 km). The consequences of the two styles of margins for subduction dynamics remain poorly resolved. In this study, we used 2-D numerical simulations of subduction to investigate how low-viscosity sediments influence subduction dynamics and margin type through plate coupling. We vary the thickness and viscosity of the sediment layer entering subduction, the thickness of the upper plate, and the driving velocity of the subducting plate (i.e., kinematic boundary conditions). Diagnostic parameters are extracted automatically from numerical simulations to analyze the dynamics and differentiate between modes of subduction margin. We identify three margin types based on the extent of viscous coupling in the sediment layer at the subduction interface: (a) tectonic coupling margin, (b) low-angle accretionary wedge margin, and (c) high-angle accretionary wedge margin. In the tectonic coupling case – analogous to an erosive margin – high-viscosity or thin-layer sediments increase coupling at the interface. On the other hand, when the viscous coupling is reduced, sediments are scrapped off the subducting slab to form an accretionary wedge. Models that develop tectonic coupling margins show small radii of curvature, slow convergence rates, and thin subduction interfaces, while models with accretionary margins show large radii of curvature, faster convergence rates, and dynamic accretionary wedges. These diagnostic parameters are then linked with observations of present-day subduction zones.
- Article
(4291 KB) - Full-text XML
-
Supplement
(34974 KB) - BibTeX
- EndNote


Sediment subduction at convergent plate boundaries has long been recognized to play an important role in the dynamics of our planet as it can provide direct feedbacks between plate tectonics, climate, and life. Quantifying the sediments mass flux through subduction zones is important for understanding (i) generation of arc magmas and the problem of petrogenesis of continental crust (e.g., Plank and Langmuir, 1998; Kelemen and Manning, 2015), (ii) whether large volumes of existing continental crust are ever recycled back into the mantle over long periods of geologic time, and (iii) cycling of volatiles from Earth's crust and atmosphere to its deep interior (e.g., Hawkesworth et al., 1997; Plank and Langmuir, 1998; Dasgupta and Hirschmann, 2010). Regarding the latter, carbon and water global cycles in particular depend greatly on the amount of subducted sediment (e.g., Plank and Manning, 2019; Dutkiewicz et al., 2018; Merdith et al., 2019), which in turn have important implications for climate stability (Kasting, 1989), biogeochemical cycles (Husson and Peters, 2017), and the rheology of the mantle (Hirth and Kohlstedt, 1996).
Sediments are also fundamental to the dynamics of subduction zones and plate tectonics. The lubricating effect of sediments at the plate interface (referred to here as the domain between the subducting and upper plates, as defined in Agard et al., 2018) was recognized more than 30 years ago (e.g., Shreve and Cloos, 1986) and is critical for the mechanism of plate tectonics (e.g., Tackley, 2000; Bercovici, 2003; Bercovici and Ricard, 2014; Sobolev and Brown, 2019). On a regional scale, sediments influence patterns of deformation by controlling the morphologies of subduction interfaces, accretionary prisms, and forearc basins (Clift and Vannucchi, 2004; von Huene and Scholl, 1991b; Melnick and Echtler, 2006; Simpson, 2010). Moreover, sediments occupying the shallow seismogenic subduction interface, for example, appear to influence seismic coupling and the frequency of megathrust earthquakes (e.g., Moore and Saffer, 2001; van Rijsingen et al., 2018; Heuret et al., 2012; Brizzi et al., 2020; Bangs et al., 2020).
However, the relative role of sediments in subduction dynamics and evolution remains unclear. The force balance during subduction includes the potential energy change of the negative buoyancy of the subducting slab, viscous dissipation in the mantle, bending of the lithosphere, and slab–upper plate interface (e.g., Conrad and Hager, 1999). Considerable effort in subduction dynamics studies focused on quantifying dissipation due to slab bending (e.g., Conrad and Hager, 1999; Becker et al., 1999; Capitanio and Morra, 2012; Garel et al., 2014a). That is because slabs were assumed to be strong (3000–5000 times stiffer than the mantle) and sediments weak, implying a low coupling degree (low shear stresses) at the interface (Conrad and Hager, 1999; Duarte et al., 2015; Billen and Hirth, 2007). Laboratory and numerical models instead suggest that slabs may be weaker (only 150–500 times stiffer than the mantle) (Funiciello et al., 2008; Moresi and Gurnis, 1996; Zhong and Davies, 1999), implying a more prominent role for plate interface dissipation than previously thought. Recent simplified energy balance calculations by Behr and Becker (2018) also suggest that sediment subduction may modulate plate speeds, with sediment-lubricated plates subducting faster than slabs with metabasaltic (i.e., exposed mantle rocks) interfaces.
The lubricating effect of sediments has largely been considered an implicit assumption in previous large-scale subduction dynamics studies. The subduction interface in numerical models is typically implemented by imposing either a fixed interface layer (i.e., subduction channel or weak fault) or a layer at the top of the subducting plate (i.e., weak crust) that is advected with the flow and continuously entrained into the decoupling region. In this way, the weakening effect of sediments or any other deformation-localizing processes such as damage, grain size reduction, and fabric development, is parameterized by setting a low viscosity or low friction coefficient of the interface material (Gerya et al., 2002). This is a necessary model component for stable asymmetric subduction (Petersen et al., 2017; Crameri and Tackley, 2015; Gerya, 2009; Sandiford and Moresi, 2019) and has become an increasingly common strategy in the last decade (Babeyko and Sobolev, 2008; Capitanio et al., 2010; Magni et al., 2012; Chertova et al., 2012; Cizkova and Bina, 2013; Garel et al., 2014b; Pusok and Kaus, 2015; Agrusta et al., 2017; Pusok and Stegman, 2019).
Indirect observations suggest that subduction interfaces are not discrete isosurfaces separating two plates but are rather exemplified by melange zones (Shreve and Cloos, 1986; Vannucchi et al., 2008; Agard et al., 2018) that incorporate material from the subducting plate, the accretionary prism, and the upper plate (Menant et al., 2020; Angiboust et al., 2021). Moreover, when sediments are considered at the trench, convergent margins appear to fall into one of two classes: accretionary and erosive (i.e., Clift and Vannucchi, 2004, Supplement, Fig. S1). Accretionary margins develop from an accumulation of material from the subducting plate being transferred onto the overriding plate, either by frontal off-scraping at the trench axis or by underplating of the forearc wedge above the decollément at greater depths (Angiboust et al., 2021). Erosive margins develop from a strong coupling between overriding and subducting plates that results in erosion of the underside of the upper plate, as indicated by margin truncation and forearc subsidence (von Huene and Scholl, 1991a; Clift and Vannucchi, 2004; Straub et al., 2020). Accretionary margins are dominated by accretion of thick piles of sediments (>1 km), while tectonic erosion is favored when the sedimentary cover is <1 km at the trench.
Both accretionary and tectonic erosion margins are widely distributed. Clift and Vannucchi (2004) classified the global subduction zones in the two categories based on their dominant mode in the last 10 Myr and found that 43 % of global subduction margin is accretionary and 57 % is tectonic erosion. The implications of this equally distributed duality in margin type to the global subduction system has not been investigated. Convergence rates for the two types of margins seem to correlate well with sediment thickness, the taper angle, and radius of curvature (i.e., Supplement Fig. S1, replotted data from Clift and Vannucchi, 2004, and Wu et al., 2008). De Franco et al. (2008) also observe a correlation between the margin type and upper plate strain (i.e., proxy for back-arc extension). Lamb and Davis (2003) went further to suggest that the type of margin can affect mountain building, with tectonic erosion producing a higher degree of coupling between the subducting and upper plate. They argue that changes from a sediment-rich to sediment-starved subduction regime during Cenozoic climatic cooling may have been responsible for the rise of the Andean mountain belt.
It is clear that the consequences of the two styles of margins for large-scale subduction dynamics remain poorly resolved and have not been explored extensively with numerical models. Accretionary margins have been investigated in more detail, following the theory for critical Coulomb wedges by Dahlen (1984) and Dahlen et al. (1984) (i.e., in analogue models – Lallemand et al., 1994; Gutscher et al., 1998, and numerical models – Beaumont et al., 1999; Selzer et al., 2008; Ruh, 2017; Menant et al., 2020). However, accretionary margins have generally not been studied in the same framework as erosive-style margins. Thus, we identify a number of outstanding questions regarding the influx of sediments to trenches and the style of margin that could be addressed with numerical models. Why do some margins accrete sediments while others do not? What is the feedback between sediment fluxes and subduction dynamics? How much sediment material gets subducted into the mantle?
In this study, we run systematic 2-D numerical simulations of ocean–ocean subduction to investigate how low-viscosity sediments influence subduction dynamics and the plate coupling. We aim to understand what causes convergent margins to either accrete material delivered by the subducting plate or, alternatively, to subduct the trench sediment pile and even erode the basement of the overriding plate. The purpose of the present work is not to model the dynamics of accretionary or erosive margins in detail but rather, by carrying out numerical experiments on the effect of sediments in geometrically simple configurations of subduction, to further understand the occurrence and evolution of each style of margin.
We begin our investigation with a discussion of the numerical setup and diagnostics. We then extract automatic diagnostics from numerical results to evaluate end-member regimes and compare to available observations in natural subduction zones. In particular, we considered a range of dependent and independent variables from statistical analyses of present-day subduction zones (Sect. 2; Clift and Vannucchi, 2004; Lallemand et al., 2005; Wu et al., 2008; De Franco et al., 2008; Heuret et al., 2012) to constrain and validate the results of numerical models. This study intends to consolidate insights from numerical models of subduction with an integrated set of global observations.
Numerical models presented below are purely mechanical. The lithosphere and mantle are assumed to behave as a slow-creeping fluid deforming over a timescale of millions of years (Turcotte and Schubert, 2014). Conservation of mass and conservation of momentum for the fluid motion, assuming incompressibility and neglecting thermal diffusion, are given by
where τ is deviatoric stress tensor, P is pressure, ρ density, g is the gravity vector, and v is velocity. We use a variable viscosity constitutive relationship , where η is the Newtonian viscosity that is constant for each material phase, is the deviatoric strain rate tensor, and i and j represent spatial directions following the Einstein summation convention.
The above equations are solved using the parallel 3-D finite-difference code LaMEM (Lithosphere and Mantle Evolution Model) (Pusok and Kaus, 2015; Kaus et al., 2016). We use a pseudo 2-D Cartesian domain in an approach similar to Pusok and Stegman (2019, 2020), meaning we consider infinite extension in the y direction. A Lagrangian marker-in-cell method (Harlow and Welch, 1965; Gerya, 2009) is used for accurately tracking distinct material domains (Pusok et al., 2017) as they undergo extensive deformation due to creeping flow. We also employ an internal free surface using the “sticky air” approach (Schmeling et al., 2008; Crameri et al., 2012), with a free surface stabilization algorithm (Kaus et al., 2010) that allows for the development of topography.
2.1 Model setup
We performed 2-D numerical simulations of ocean–ocean subduction (Table 1, Fig. 1) to investigate the role of sediments in slab dynamics and topography. The model domain is 6000 km wide and 1500 km deep. The computational domain has a variable grid spacing, with higher resolution in the upper mantle asthenosphere and close to the subduction trench (minimum and maximum grid spacings: km, km). Free-slip boundary conditions are imposed on all boundaries and a 60 km layer of “sticky air” on top of the plates. Previous studies have shown that using a free surface (i.e., sticky-air method in this case) instead of a free-slip top boundary dramatically changes subduction style (Kaus et al., 2010; Crameri and Tackley, 2015). Here, the rock–sticky air interface represents an internal free surface formulation, from which topography is calculated.
The initial model setup and material parameters are similar to the ones used in Pusok and Stegman (2019, 2020). These models were used to investigate the dynamics of same-dip double subduction systems and to explain dynamical processes leading to the fast convergence history between India and Eurasia in the Cretaceous. Here, we model a single subduction setting (Fig. 1). The model consists of an oceanic plate subducting beneath another oceanic upper plate (i.e., ocean–ocean subduction). The length of both plates is 2500 km and they are not attached to the side walls, mimicking mid-ocean ridges at the trailing edge of the plate away from the trench. Additional experiments with a fixed upper plate to the wall are presented in the Supplement (Fig. S8).
The subducting plate lithosphere has a thickness of 80 km with a 20 km thick core and 15 km combined weak crust and sediments. Behr and Becker (2018) estimate that metasediments and serpentinites can be more than 2 orders magnitude weaker than the reference asthenospheric mantle viscosity, while metabasalts are predicted to be of the same order of magnitude viscosity at temperatures 600–800 ∘C. In our model, we assume that the weak crust is formed by a layer of highly fractured metabasalts (dark green lithology in Fig. 1a, b) overlain by a layer of metasediments (light green lithology in Fig. 1a, b). Thus, the viscosity structure for the combined weak crust and sediments represents a parameterization of the strength weakening with depth due to hydration and weak sediment cover. The combined initial thickness of sediments and crust remains the same in all simulations.
Material parameters are the ones used in Enns et al. (2005) and Pusok and Stegman (2019); the upper mantle asthenosphere has a reference density (ρ0=3300 kg m−3) and viscosity ( Pa s), and the plates are 85 kg m−3 denser and have a variable viscosity structure (lithospheric mantle: 500×η0, strong core: 5000×η0 and weak crust: η0). The transition to the lower mantle is marked by a viscosity jump of 50 in the reference models, consistent with previous estimates of the viscosity jump in the Earth's mantle (Quinteros et al., 2010; Rudolph et al., 2015). For initial conditions, we impose a slab radius of curvature of 150 km and a subduction depth of 200 km, which is enough to initiate subduction.
2.2 Input and diagnostic parameters
Previous studies investigated the role of upper plate and subduction plate parameters, such as thickness and strength (i.e., Holt et al., 2015; Brizzi et al., 2020). Here, we focus on factors acting directly on the subduction interface. In particular, we use a result from Currie et al. (2007) and Cizkova and Bina (2019), which found that the effects of sediment buoyancy and viscous entrainment by the subducting plate are the main factors controlling the behavior of slab and subducted sediments. Thus, we vary the properties of the sediment layer (viscosity, thickness) and thickness of the upper plate as explained below and in Table 1. All other parameters are kept the same among simulations. By not changing the density of the sediments or the slab geometry, the magnitude of initial slab-pull force is the same among simulations. We also extract automatic diagnostics from our numerical models that can be compared to parameters available for the natural subduction systems. Parameters discussed in this section are listed in Table 2.
Input parameters. For the Newtonian rheology used, the input parameters for each phase (viscosity, thickness, density) are categorized into three groups: (1) subducting plate (slab) parameters, (2) interface (sediments) parameters, and (3) upper plate parameters (Table 2). The following parameters were varied: thickness and viscosity of sediments ( km, Pa s) and thickness of the upper plate (hUP = [50, 80, 100, 150] km). The sediment viscosity is consistent with estimates from Behr and Becker (2018), and the variation in upper plate thickness mimics variable plate ages.
Global compilation studies show that sediment thickness goes from 0–12 km (Laske et al., 2012; Dutkiewicz et al., 2015; Straume et al., 2019). Sediment thickness variation in our model setup is thus on the upper limit. When the sediment viscosity is equal to the weak crust viscosity (ηsed=η0), it is analogous to a no-sediment case. The thickness and viscosity of sediments will control the subduction interface shear stresses, while the upper plate thickness will control the interface length.
Diagnostic parameters. The diagnostics or system response parameters, calculated from each simulation, are also categorized into three groups: (1) subduction (slab) diagnostics (including convergence rate, radius of curvature, and trench velocity), (2) interface (sediments) diagnostics (including wedge angle and width of the accretionary wedge), and (3) upper plate diagnostics (including trench depth as well as maximum and mean topographic amplitudes in the upper plate). These variables are compatible with parameters derived from statistical analyses of present-day subduction zones (i.e., Clift and Vannucchi, 2004; Lallemand et al., 2005; Wu et al., 2008; De Franco et al., 2008; Heuret et al., 2012), which will be used to constrain and validate the results of numerical models. Diagnostic parameters are calculated at every time step. Their evolution (steady-state or transient) will constitute the basis of our parameter analysis in Sect. 3.3.
A schematic of how slab parameters, such as plate convergence (u0), trench retreat (uT), and radius of curvature (RC), are calculated is shown in Fig. 1b. The convergence velocity is calculated as the horizontal motion between the subducting plate and upper plate (i.e., motion between Marker 1 and Marker 2 in Fig. 1a). The trench retreat is calculated as , where xT is the trench position and t is time, starting from an initial trench position xT=0. In all simulations, the trench is retreating, which is common to ocean–ocean subduction in nature (Schellart et al., 2007).
The radius of curvature is one of the parameters that requires more careful inspection. The radius of curvature is generally calculated from a circular fit to the available earthquake data, which for natural subduction systems can be noisy, incomplete, or subjective (Buffett and Heuret, 2011; Lallemand et al., 2005; Wu et al., 2008). For example, some analyses fit earthquake data for the first 100 km or less because the plate interface is clearly marked at high resolution. However, there are limits on the length of the arc of a circle that can reasonably fit a unique circle (i.e., see discussion in Val and Willenbring, 2020). For this reason, slab dip angle is often used as a metric for slab orientation. However, radius of curvature is more appropriate to describe slab deformation with depth, while slab dip represents only the tangent to curvature close to the surface.
We calculated the radius of curvature after Petersen et al. (2017) (Fig. 1c) in the following way: extract the upper surface of the core of the slab (black) and fit a circle to an arc defined by the inflection point where the plate starts bending (red point below A) and the point on the surface corresponding to 150 km depth (red point next to C). The slab core is the most appropriate feature for the fitting algorithm to calculate the radius of curvature of the slab, as its strength controls the bending of the slab. The upper layers (weak crust and sediments) may deform strongly during subduction and introduce noise into the circle-fitting algorithm. This algorithm remains robust throughout the evolution of a simulation (see movies in the data repository). Therefore, our calculations of the radius of curvature are approximately 30 km less than the total radius of curvature, which includes the crust and sediments.
Sediments reaching the trench may either subduct into the mantle or accumulate into an accretionary wedge. We quantify this behavior using two diagnostics for the accretionary wedge: the angle (αwedge) and the width (Wwedge) (Fig. 1c). These parameters are not equivalent to the ones calculated in the taper-wedge theory (Dahlen, 1984; Dahlen et al., 1984) because surface topography variations in the wedge are not resolved for the current numerical resolution.
The algorithm to calculate both the wedge angle and width is the following: (1) isolate the sediment markers (grey material in Fig. 1c) and (2) determine wedge points (A, B, C): point A is the inflection point of the slab at the surface, point B is the end point to the right of the surface of sediments, and point C is at the base of the upper plate. We then connect ABC into a triangle and calculate and . The Supplement and movies in the data repository show examples of the algorithm. It is important to note that the wedge angle is nonzero in all simulations, as there is a finite thickness of the sediments (i.e., points A and B will not overlap).
The effect of sediments on topography is also investigated. Lamb and Davis (2003) suggested that sediment-starved subduction may have been responsible for high topography in the Andes. They argue that tectonic erosion favors more coupling with the upper plate, while accretionary wedges favor decoupling and thus lower topographic amplitude. We investigate these hypotheses by extracting three diagnostics related to topography: trench depth (htrench), maximum topographic amplitude in the upper plate (hmax), and mean topographic amplitude in the upper plate (hmean). The choice of last two is motivated by the study of Pusok and Kaus (2015), which showed that the two parameters can describe a number of topographic expressions for convergent margins.
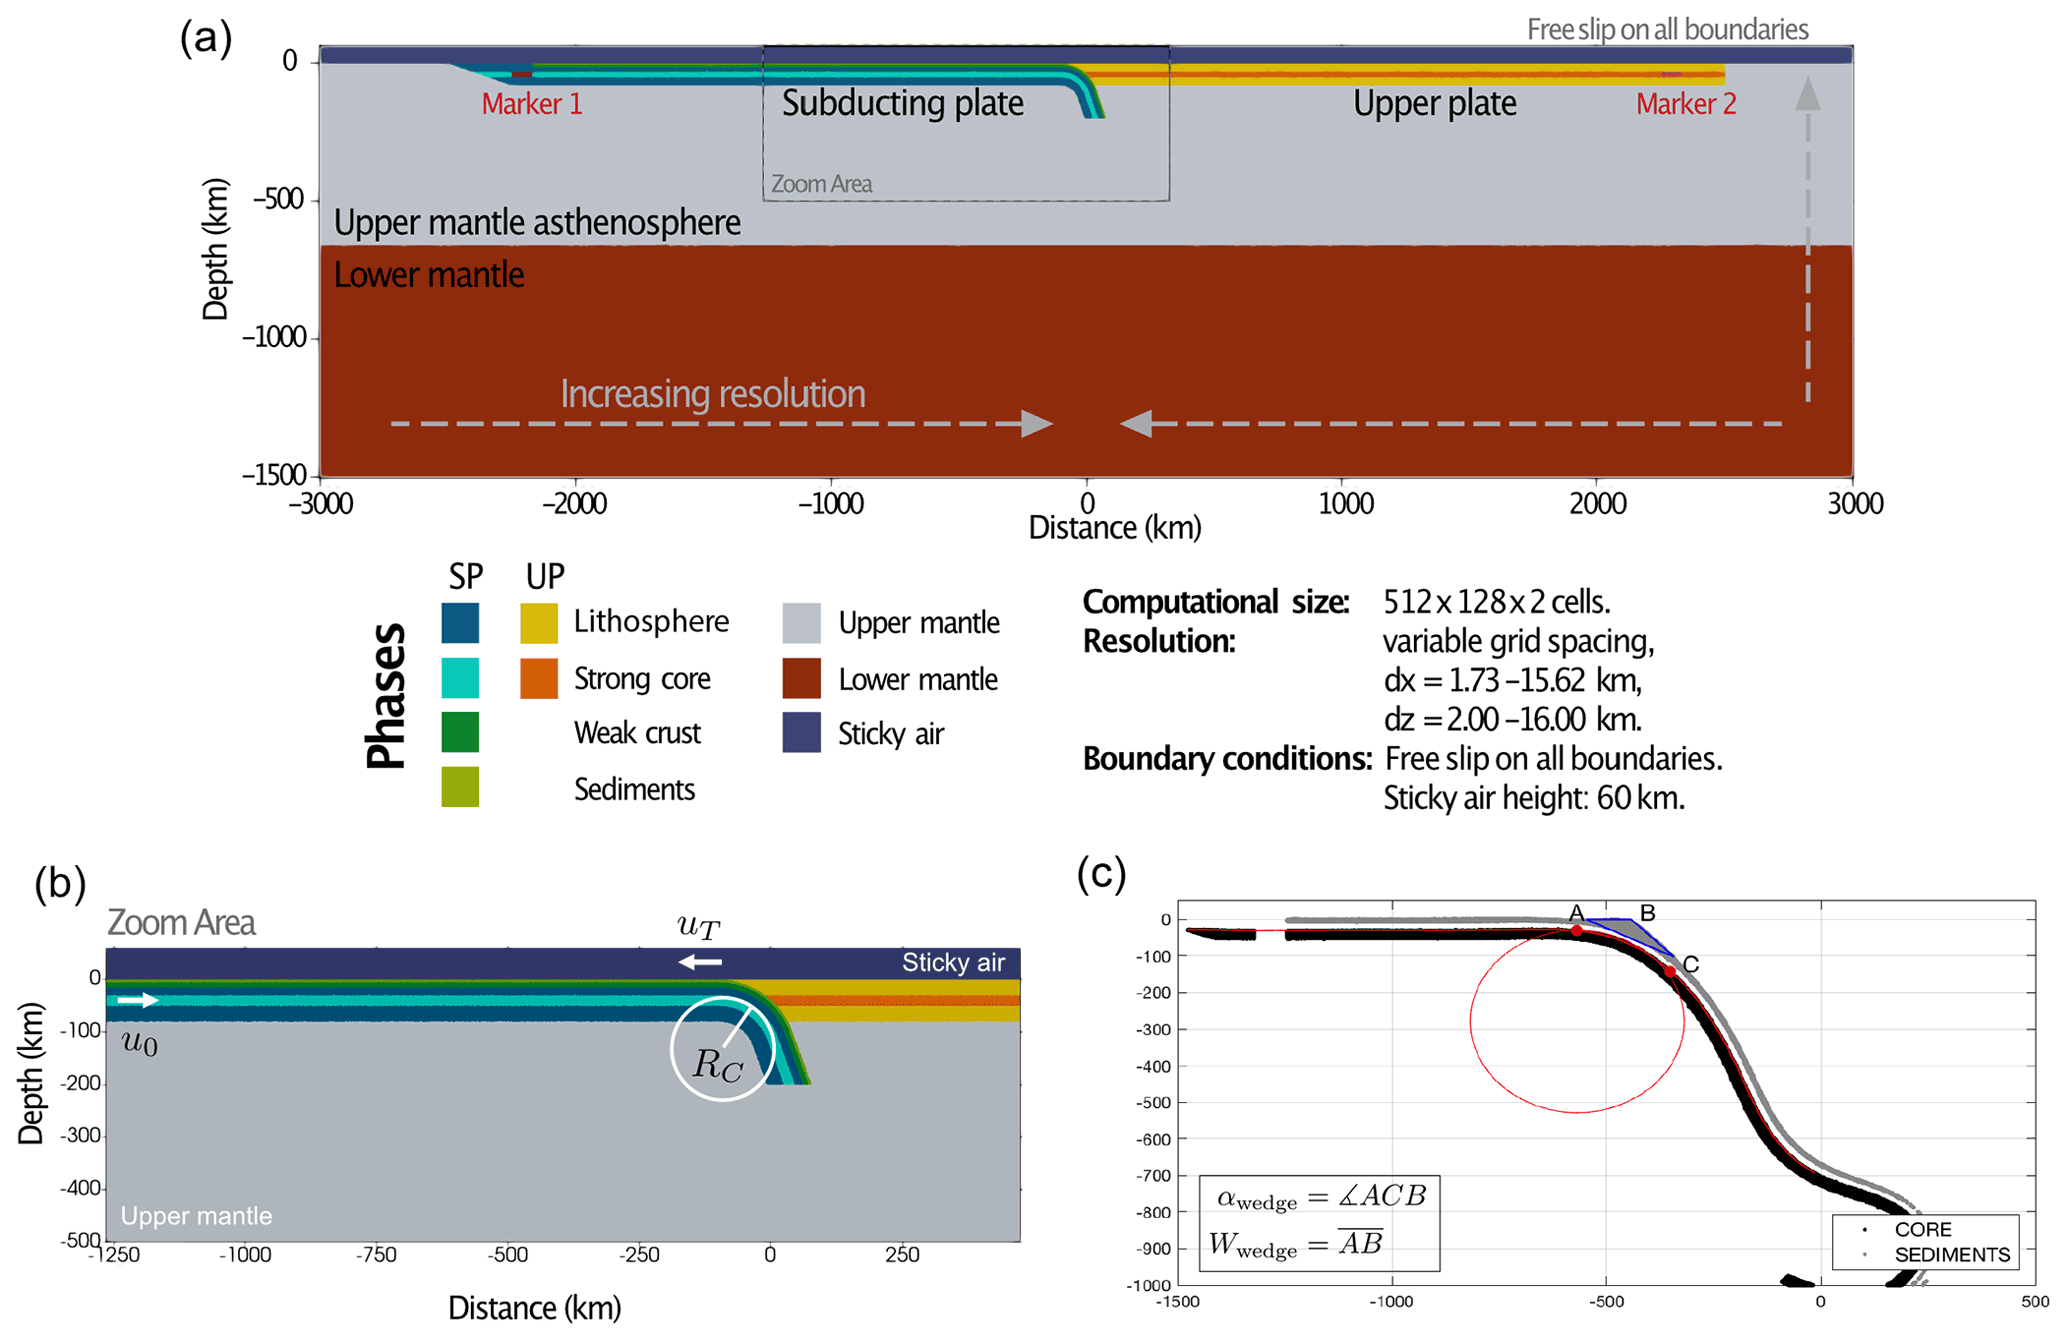
Figure 1Model setup. (a) The model consists of an oceanic plate (SP) subducting beneath another oceanic upper plate (UP). Both plates are 2500 km long and have an upper mantle lithosphere component with a 20 km strong core. The subducting plate contains a weak crust and sediments (combined 15 km; weak crust – dark green, sediments – light green). Parameter values are listed in Table 1 and are relative to the reference density (ρ0=3300 kg m−3) and viscosity ( Pa s) of the mantle asthenosphere. The red markers (Marker 1 and Marker 2) are located in the strong cores of the subducting and upper plate to track the convergence of the plates. The domain has free-slip boundary conditions on all sides and a 60 km “sticky air” layer on top of the plates. Subduction is initiated by prescribing an initial slab depth of 200 km and an initial radius of curvature of 150 km. The dynamics are entirely controlled by the negative buoyancy (slab pull) of the subducting slab. (b) Zoom area on the subduction interface illustrating the convergence rate (u0), trench rate (uT), and the radius of curvature (RC). (c) Phase markers used to calculate the radius of curvature (core markers – black) and wedge properties such as angle and width (sediment markers – grey).
Table 1Simulations performed in this study. Margin type: TC – tectonic coupling, low-AW – low-angle accretionary margin, high-AW – high-angle accretionary margin, u-AW – unstable accretionary margin. Reference viscosity is Pa s (upper mantle viscosity). Diagnostics (mean values): u0 – convergence rate, RC – radius of curvature, uT – trench retreat, αwedge – wedge angle, Wwedge – wedge width, htrench – trench depth, hmax – maximum topographic amplitude in the upper plate, hmean – mean topographic amplitude in the upper plate. The evolution of each diagnostic parameter is shown in the Supplement.
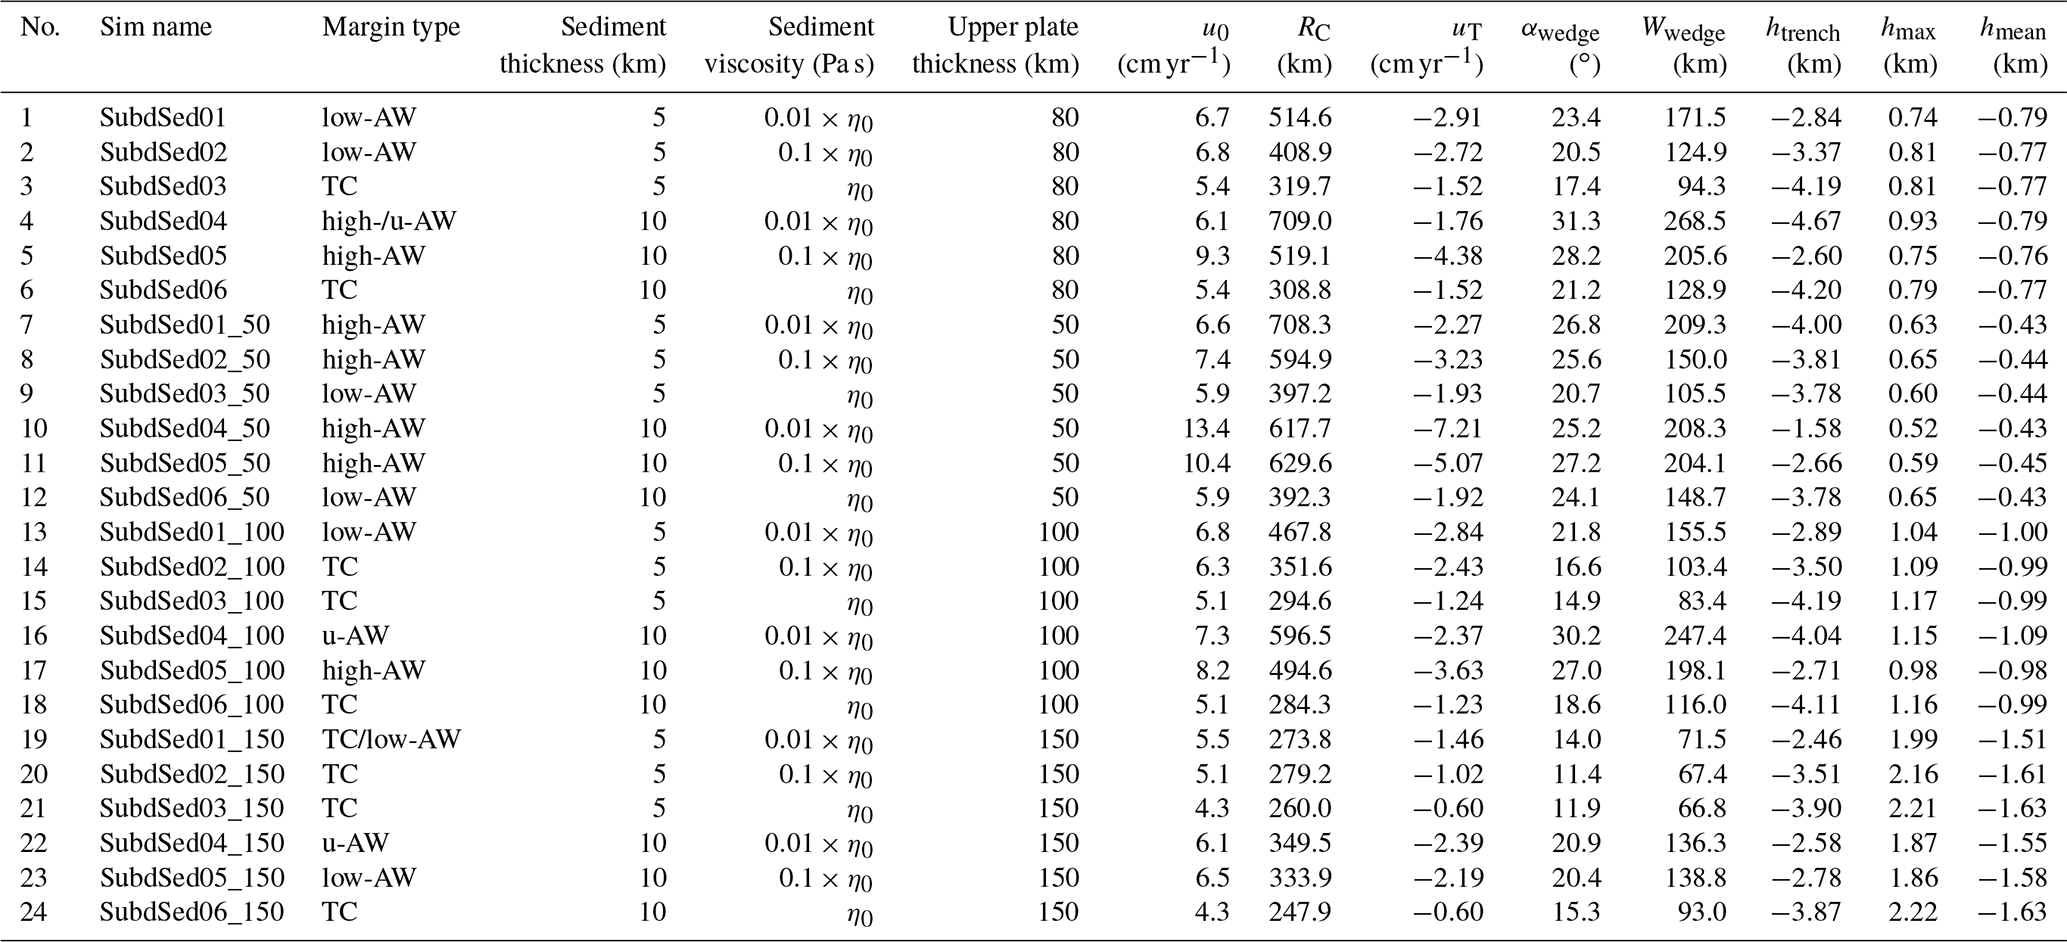
Table 2Input and diagnostic parameters. Input parameters are prescribed at the beginning of each simulation and remain the same throughout the evolution, while diagnostics are system-response parameters and are calculated during model evolution. Subscripts represent the following: SP – subducting plate, sed – sediments, UP – upper plate. Input parameters: ρ – density, η – viscosity, h – thickness. Diagnostics: u0 – convergence velocity between subducting plate and upper plate, uT – trench motion, RC – radius of curvature, αwedge – angle of accretionary wedge, Wwedge – width of accretionary wedge, htrench – trench depth, hmax – maximum topography in the upper plate, hmean – mean topography in the upper plate.

The 2-D numerical experiments below aim to understand what causes convergent margins to either accrete material delivered by the subducting plate or, alternatively, to subduct the trench sediment pile and even erode the basement of the overriding plate. In the first part of the results, we describe end-member models of margin styles (accretionary and tectonic coupling) and the corresponding reference model results. In the second part, we analyze results from a large suite of numerical models and investigate parameter correlations using the diagnostics presented above.
3.1 Margin styles and reference models
The outcome of each simulation is classified into three regimes: tectonic coupling (TC), low-angle accretionary wedge (low-AW), and high-angle accretionary wedge (high-AW) (Fig. 2, Table 1). The end-member division was done both qualitatively (i.e., formation of the accretionary wedge as seen in Fig. 2, left column) and quantitatively using the evolution of diagnostic parameters, which is shown in Fig. 3. We explain the individual classification below. Details of subduction dynamics for each model evolution are included in the Supplement, as they have been extensively investigated and described in previous studies (i.e., adjustment of the model to initial conditions and development of slab curvature, formation of accretionary wedge, interaction of slab with the lower mantle).
We focus here on characterizing overall model outcomes from incipient subduction to slab consumption. The time taken for subduction to consume the slab varies for each model because the characteristic velocity (i.e., convergence rate) is controlled by interface processes (see dependence of average time step size on convergence rate in the Supplement, Fig. S7). For this reason, we use a characteristic time () to highlight the entire model evolution in several figures (i.e., Fig. 3). Initial model time corresponds to tchar=0, while final time tfinal, corresponding to ∼2500 km slab consumption, becomes tchar=1. Every model simulation has an initial adjustment period of tchar∼0.1 in which the subduction system acquires a natural curvature and a final stage tchar∼0.9 in which the slab is consumed (grey intervals in Fig. 3). These initial and final condition stages are excluded in our calculation of diagnostic parameters.
For the rest of the study, we adopt a color code for each regime: purple for tectonic coupling, yellow for low-angle accretionary wedge, and orange for high-angle accretionary wedge.
Tectonic coupling margin (TC). Figure 2a–c shows a typical simulation outcome of a tectonic coupling margin (model SubdSed03, with thin cover hsed=5 km and high viscosity of sediments ηsed=η0). Evolution of diagnostic parameters is shown in Fig. 3, and additional model evolution snapshots are shown in the Supplement in Fig. S3. We classified simulations as TC when the evolution of the radius of curvature, convergence rate, wedge angle and width, and trench rate remain constant (steady-state) throughout the simulation (purple lines, Fig. 3 and Supplement Figs. S13–S15). The means during the entire evolution of the model (dotted purple lines) closely follow the diagnostics.
The low convergence velocity and trench retreat rate maintained throughout the simulation (Fig. 3b, e) suggest a high degree of coupling between the subducting slab and upper plate. Figure 2b shows that the motion between the subducting and upper plate in the TC margin is accommodated in the middle of the sediment layer, a region of high strain rates. Instead, very low strain rates just below the slab suggest a rigid-body rotation of the slab in order to maintain a constant radius of curvature. The radius of curvature remains small as seen in Fig. 2c, with a steeply dipping slab.
Entrainment of sediments within upper plate material at the interface (Fig. 2a) is indicative of some erosion of the upper plate. All simulations with high-viscosity sediments show this behavior (Supplement, Figs. S13–S15, cases with ηsed=η0), which could be regarded as having a stronger interface (i.e., a more mafic cover and/or lack of weak unconsolidated sediments).
Topographic signals in TC models (trench depth, maximum and minimum topography in the upper plate) show more variability in Fig. 3, which is discussed later.
Accretionary wedge margin (AW). When the viscous coupling is reduced, sediments are scrapped off the subducting slab to form an accretionary wedge (Fig. 2d–i). We identify two types of accretionary margins: low- and high-angle accretionary wedges, primarily controlled by the thickness of sediments in cases of low-viscosity sediments. Evolution of diagnostic parameters is shown in Fig. 3 (yellow and orange lines), and additional model evolution snapshots are shown in the Supplement in Figs. S4–S5.
The distinction between the two cases comes from the behavior of the slab; low-angle AW margins have increasing radii of curvature and wedge properties but a roughly constant convergence rate (Fig. 3b), while high-angle AW margins result in flat subduction with large radii of curvature and irregular behavior of the convergence rate. In high-angle AW simulations, in a first stage of evolution, accumulation of sediments lubricates the interface and promotes fast convergence rates, but once the wedge reaches a critical size and slab curvature is too large (i.e., subduction needs to accommodate horizontal slab motion), the subduction rate is inhibited. When this stage is reached, plate convergence may happen at slower rates than in TC simulations.
Accretionary margins models are favored by lower sediment viscosities (). By increasing the thickness of the sediments, more sediment is available to create a thicker wedge (high angle and width). The larger the wedge angle, the larger the radius of curvature, suggesting that wedge geometry has a control on slab bending (Fig. 3a–d).
The interface dynamics are also different with increasing availability of weak sediments. The velocity field at the subduction interface suggests internal counterclockwise flow inside accretionary wedges, detached from both corner flows in the mantle (Fig. 2e, h). Plate motion is also accommodated at the base of the sediment wedge, indicated by high strain rates. Despite the unrealistically large geometry of the wedge, Fig. 2h shows that the accretionary wedge can impede motion within the upper plate. However, we are not concerned here with further details of internal wedge dynamics compared to numerous previous studies because we lack the numerical resolution required (i.e., Ruh, 2017; Menant et al., 2020).
A highly unstable accretionary wedge margin is shown in the Supplement (e.g., results of SubdSed04_100 in Figs. S6, S13–S15). In these cases, the accretionary wedge reaches a critical angle, and instead of moving laterally, material is being expelled down the subduction channel. The wedge will continue to deform and grow again until it reaches a new critical angle. This unstable mode occurs in simulations with a thick upper plate, which acts as a deformable backstop, in combination with accumulating weak sediments. This margin style is a consequence of the density model chosen here, in which sediments have the same density as the rest of the lithosphere. Clearly, this is an overestimated effect.

Figure 2Margin style end-member results. (a–c) Tectonic coupling margin (TC, reference model SubdSed03), (d–f) low-angle accretionary margin (low-AW, reference model SubdSed01), and (g–i) high-angle accretionary margin (high-AW, reference model SubdSed04). The left column shows model snapshots at 27 Ma. The middle column shows the second invariant of the strain rate, , and velocity field as arrows in an enlarged area of the subduction interface. The right column shows core and sediment markers with calculated radii of curvature, wedge angles, and widths. The TC margin shows low-angle wedges and a small radius of curvature. When an accretionary wedge forms in cases of low-viscosity sediments, the wedge angle and width increase over time, together with the radius of curvature. In high-angle AW margins (g–i), episodes of flat subduction with strong plate bending may occur. The time evolution of diagnostic parameters for the reference cases is shown in Fig. 3.
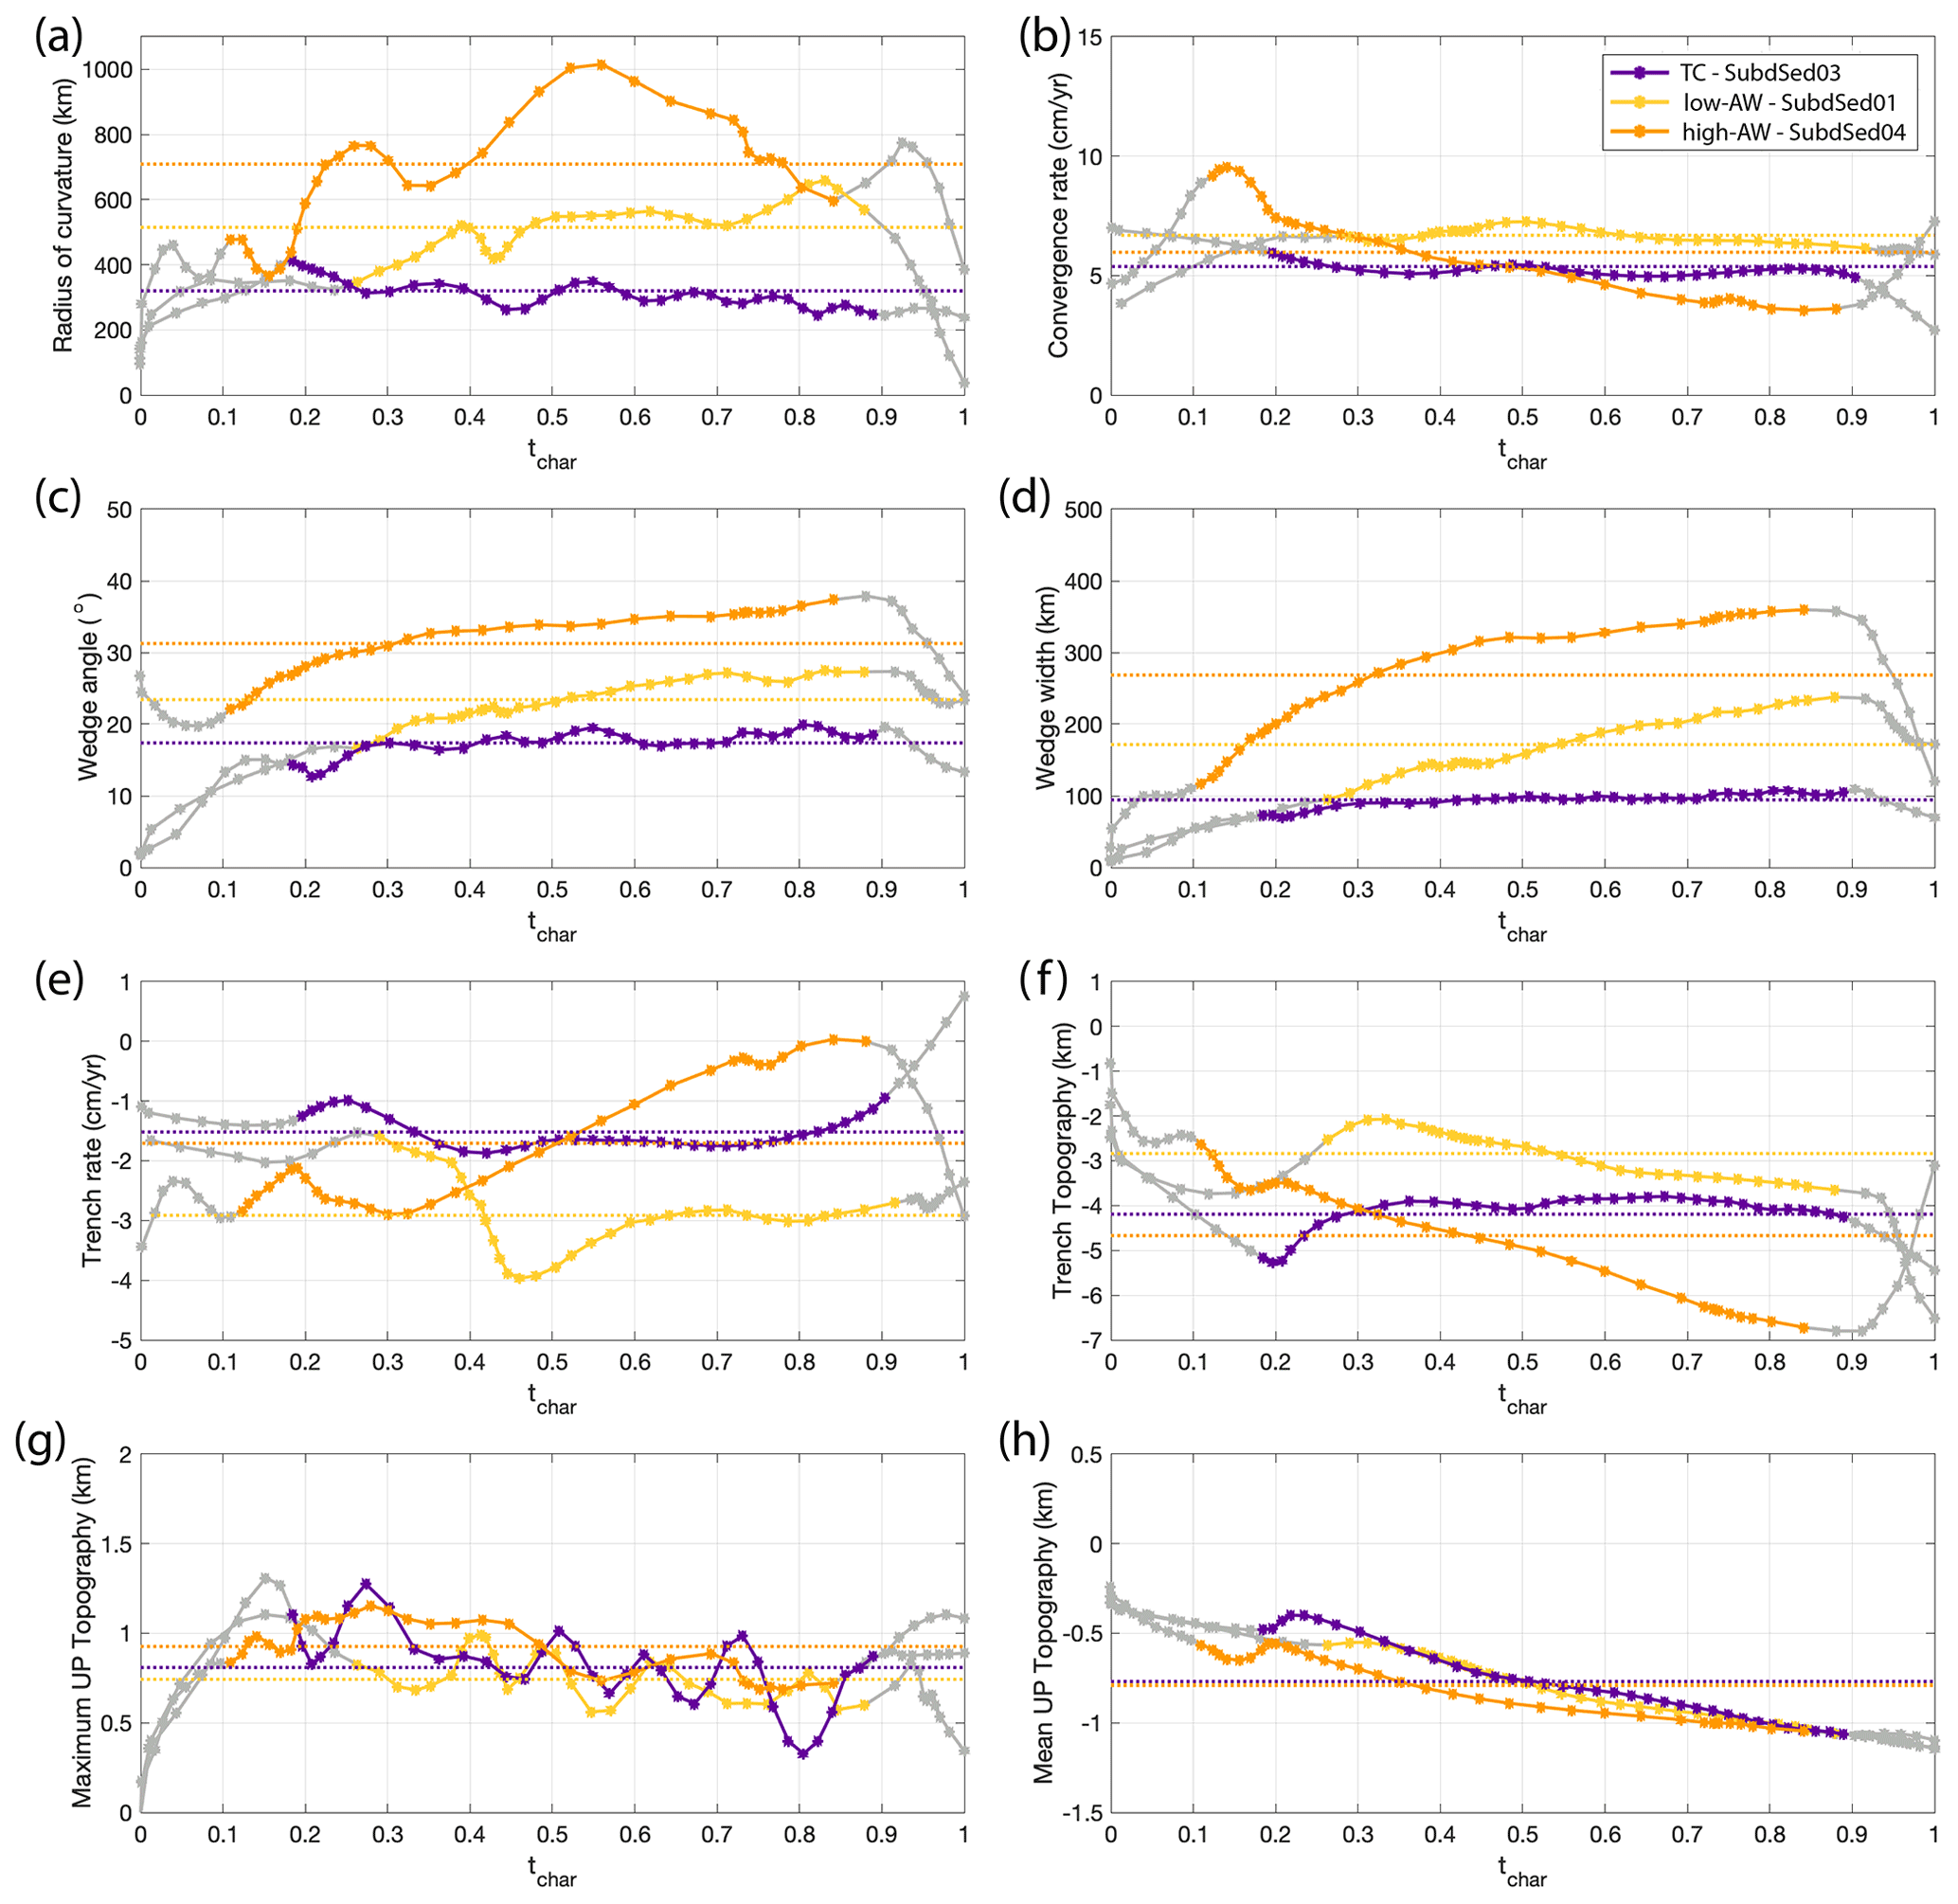
Figure 3Evolution of diagnostic parameters for end-member reference models: tectonic coupling – SubdSed03 (purple), low-angle accretionary margin – SubdSed01 (yellow), high-angle accretionary margin – SubdSed04 (orange). (a) Radius of curvature, (b) convergence rate, (c) wedge angle, (d) wedge width, (e) trench rate, with positive values indicating trench advance and negative values indicating trench retreat, (f) trench depth, (g) maximum topographic amplitude in the upper plate (hmax), and (h) mean topographic amplitude in the upper plate (hmean). Continuous lines represent model data, while dotted lines represent the mean over the entire simulation time. Characteristic time tchar is defined in the main text. Grey portions represent initial and final conditions, corresponding to the system forming its natural slab curvature and to the last stage of slab consumption. The two stages are excluded from calculating the means.
3.2 Major impacts on subduction dynamics
Although material within the weak layer at the plate interface (i.e., between the subducting and upper plates) is a volumetrically insignificant component of the larger plate–mantle coupled system, we observe that this small feature can exert a profound influence on the emergent regional-scale subduction dynamics. Figures S10 and S11 show that models with the strongest sediment layers (ηsed=η0) have sub-vertical slab morphologies, smaller values of RC, and slower trench retreat rates than similar models with weaker sediment layers (). Stronger sediment layers also stabilize the subduction system as seen in Fig. S12, in which much larger variations in RC occur for models in column A than column C, where values remain approximately constant. The steady-state values of RC can vary by more than a factor of 2 due to the viscosity of the sediments, with model SubdSed06_50 having 400 km, while models SubdSed04_50 and SubdSed05_50 both evolve such that RC exceeds 800 km. For these models, a similar increase of more than a factor of 2 can also be observed in convergence rate (Fig. S14) and trench motion (Fig. S15).
It is not just the low strength of the sediment layer that influences the system, but also the thickness of the upper plate. The dynamics of the plate interface depend on the total length of contact area between the two plates as well as the thickness and strength of the material between them (Beall et al., 2021). Comparisons of models that are otherwise identical except for having different upper plate thicknesses (Fig. S11, column A) exhibit more shallow-angled and variable slab morphologies for those models with thinner upper plates.
3.3 Parameter analysis
In this section, we investigate correlations between the means of the diagnostic parameters for all simulations (Figs. 4 and 5). The diagnostic parameters can then be compared to similar parameters observed in the global subduction system.
Figure 3 shows that the evolution means characterize the margin style of each simulation. For each diagnostic parameter, we calculate the mean value (Fig. 3, dotted lines) and the variability during evolution (minimum and maximum values). The means in TC models remain close to the evolution curves (i.e., steady state with the mean close to the min/max values). In AW models, the means differ significantly from the evolution curves. Therefore, the min/max values during time evolution reflect this larger variability (grey bars in Figs. 4 and 5). Diagnostic means are given in Table 1, and evolution curves are shown in the Supplement (Figs. S13–S18).
Figure 4 shows correlations between subduction and sediment diagnostic parameters, while Fig. 5 shows correlations between sediment and topography diagnostic parameters. In both figures, each colored point represents the mean value in a simulation, and the grey bars represent variability intervals (min/max values). The color scale represents the margin type, identified as in the previous section. TC simulations (purple) have smaller variability bars, emphasizing steady state. On the other hand, AW models have larger variability bars (largest for high-angle AW), suggesting transient evolution for that diagnostic.
We find strong correlations between sediment parameters and subduction parameters in 2-D numerical models (Fig. 4). Convergence rate correlates well with radius of curvature, wedge angle, and width (panels a–c). TC models have low convergence rates and radii of curvature, but also small accretionary wedge properties (angle and width). As seen in previous section, with increasing sediment availability (thickness) and/or decreasing sediment viscosity, wedges form more readily. Figure 4 shows that AW models register higher convergence rates, higher radii of curvature, and larger wedge properties. This indicates that sediments lubricate the subduction interface, promoting faster convergence rates. The rate of trench motion is also influenced by the dynamics of subducting sediments, with sediment-rich AW trenches retreating faster (panel d).
Figure 5 suggests weaker correlations between sediment and topography parameters. In panels (b)–(j), TC models tend to produce higher maximum topography and deeper trench depths (i.e., extreme amplitudes), while AW models produce lower extreme signals but higher mean values. The weaker correlation of sediments diagnostics with topographic signals is likely due to the nature of the upper plate (i.e., oceanic or continental, free or attached plate to side walls). In our set of simulations with ocean–ocean subduction and an unattached upper plate, stresses accumulated at the plate interface are accommodated in trench motion instead of upper plate deformation. Topographic signals for simulations with a fixed upper plate are shown in Fig. S9, which are higher and more distinct for end-member models, as subduction is now accommodated more in deformation of the upper plate and less in trench motion. Topography also builds faster in continental lithosphere compared to oceanic lithosphere due to less resistance against gravity (Pusok and Kaus, 2015). Investigation of the effect of sediments on topography signals with a continental upper plate is reserved for a future study.
To summarize, TC models suggest a stronger coupling at the plate interface, yielding lower radii of curvature, slower convergence rates, and higher topographic signatures. TC margins also retreat slower compared to AW margins. These correlations and simulation snapshots suggest that dynamics of the wedge control the bending of the slab and the radius of the curvature.
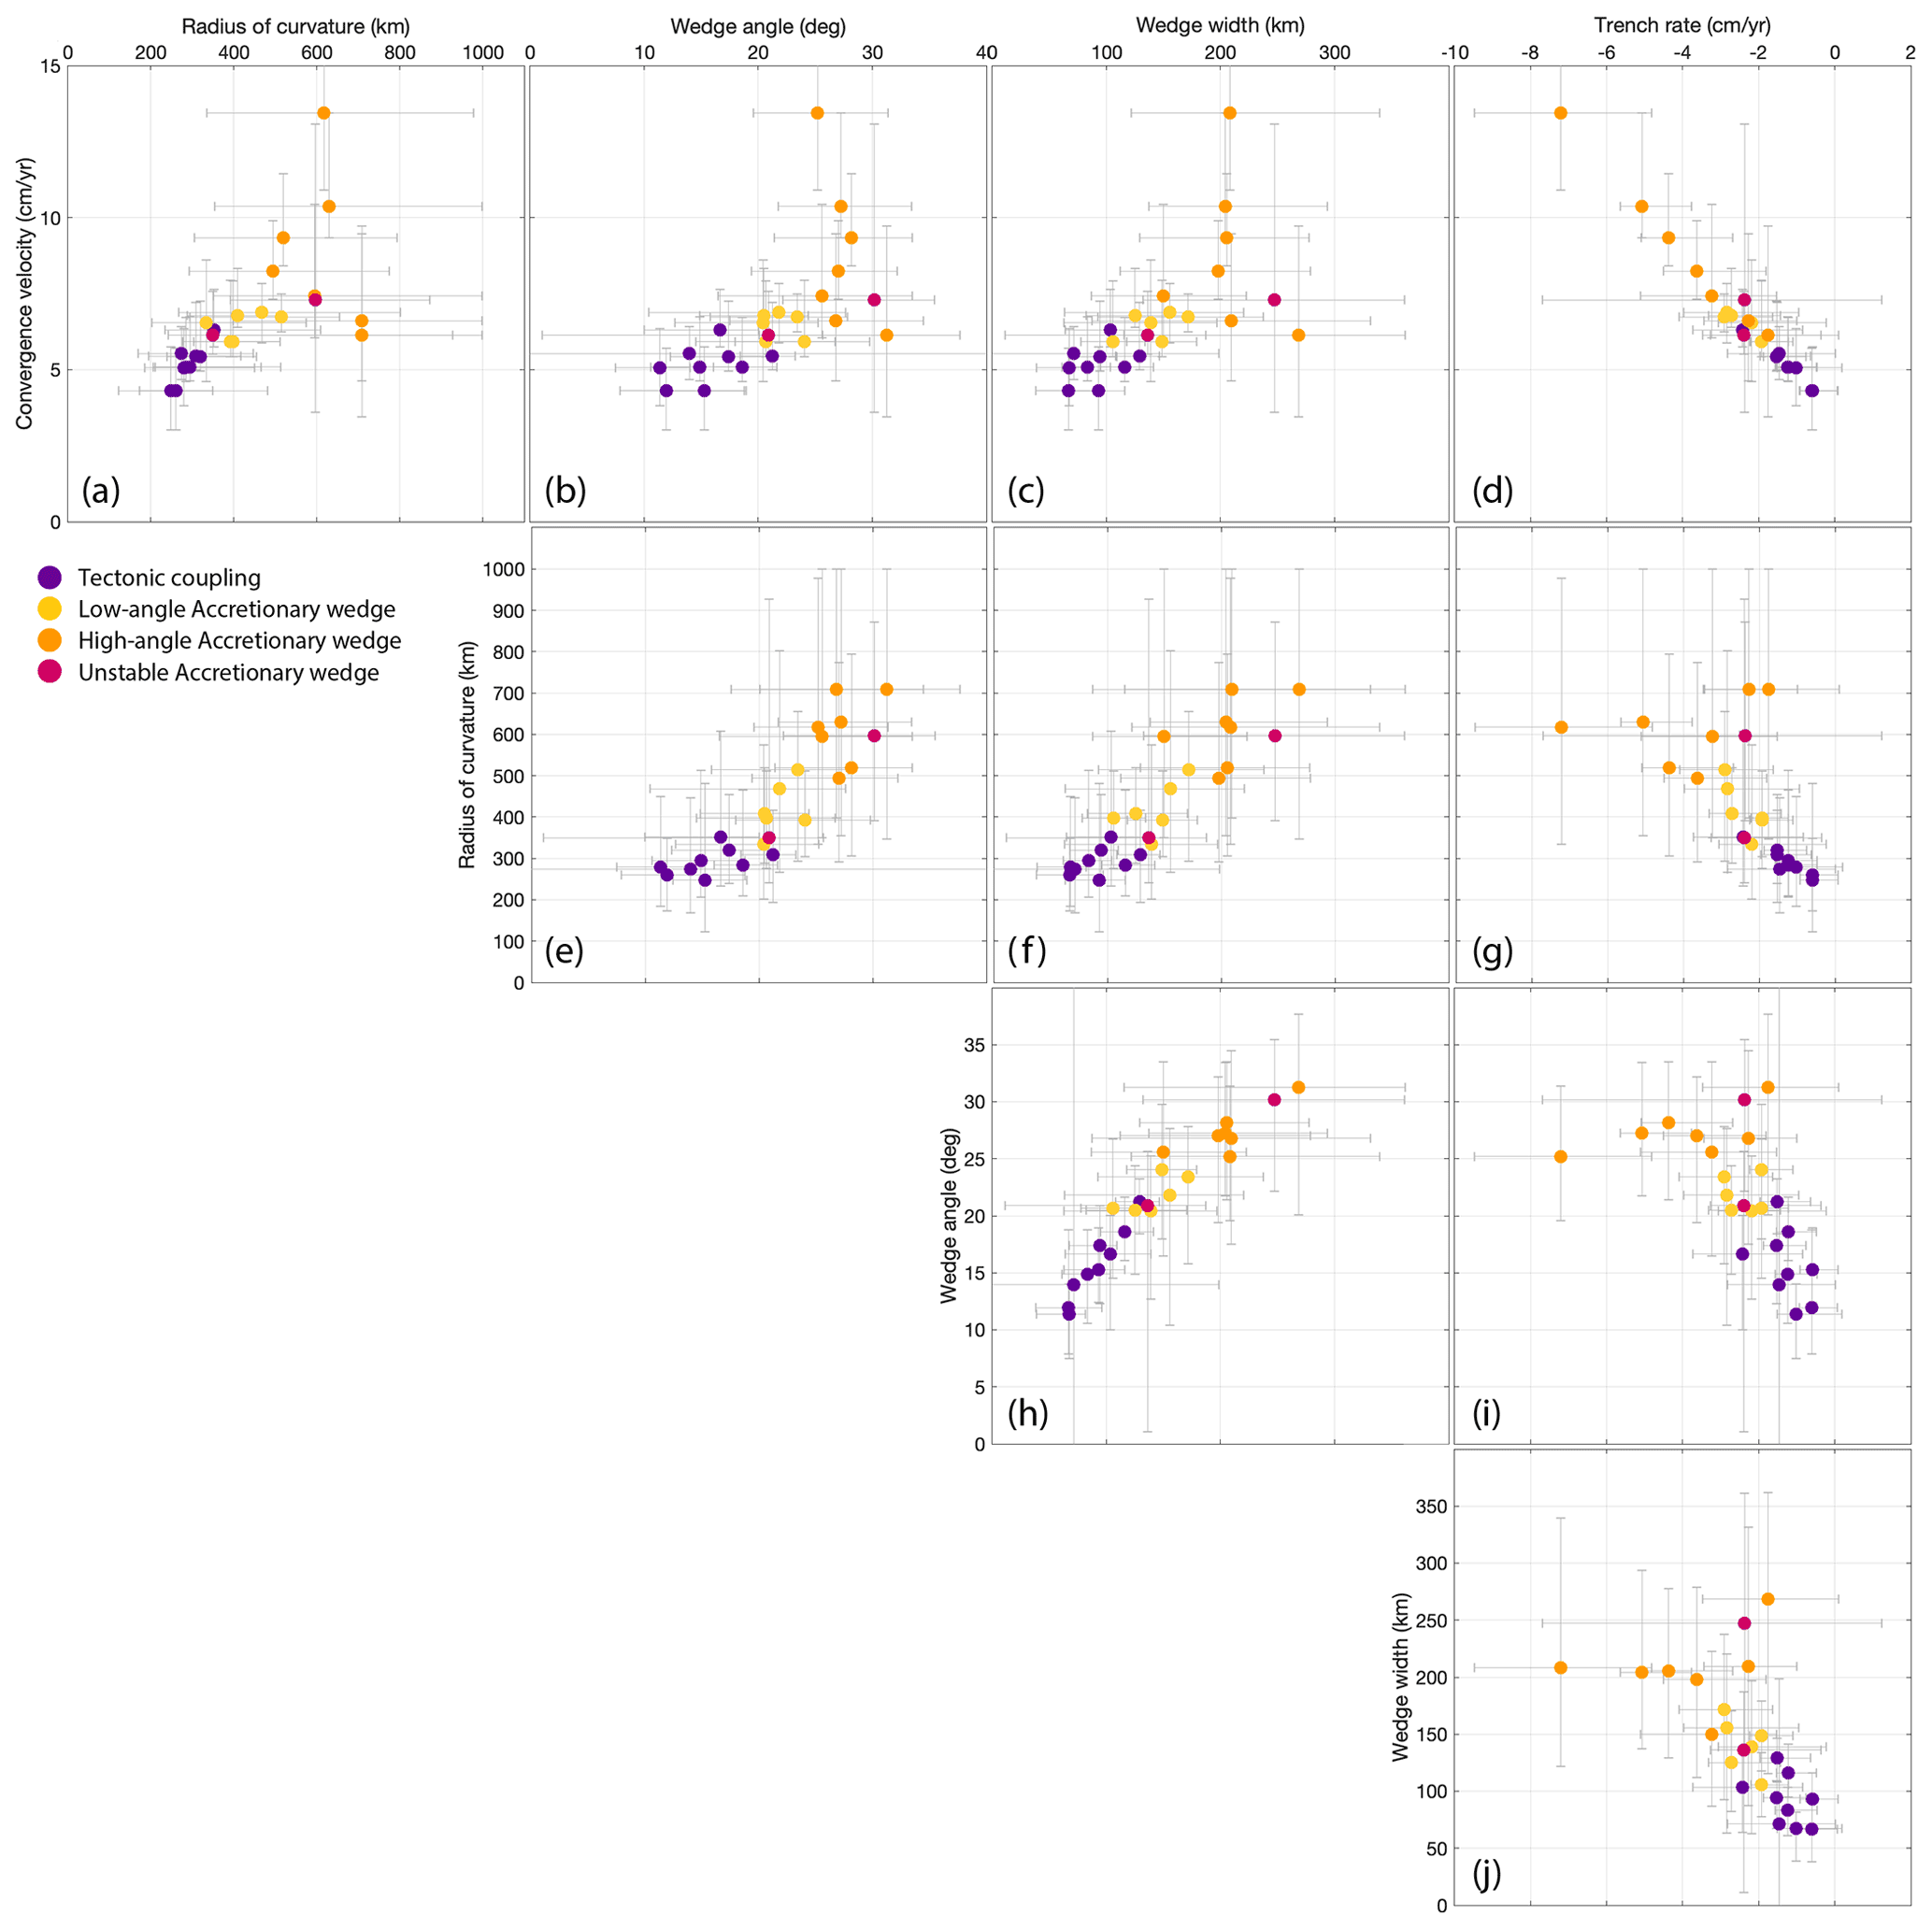
Figure 4Subduction versus sediment diagnostic parameters. Each point represents the evolution mean of the given parameter in a simulation, and the grey bars represent the variability intervals (see Fig. 3 for how the mean is calculated). Initial and final stages of the evolution are removed from calculations. TC models (purple) have lower variability in diagnostics than AW models (yellow and orange). TC margins have low convergence velocities, small radii of curvature, and wedge properties. AW models have higher radii of curvature, faster convergence velocities, and larger wedge properties.
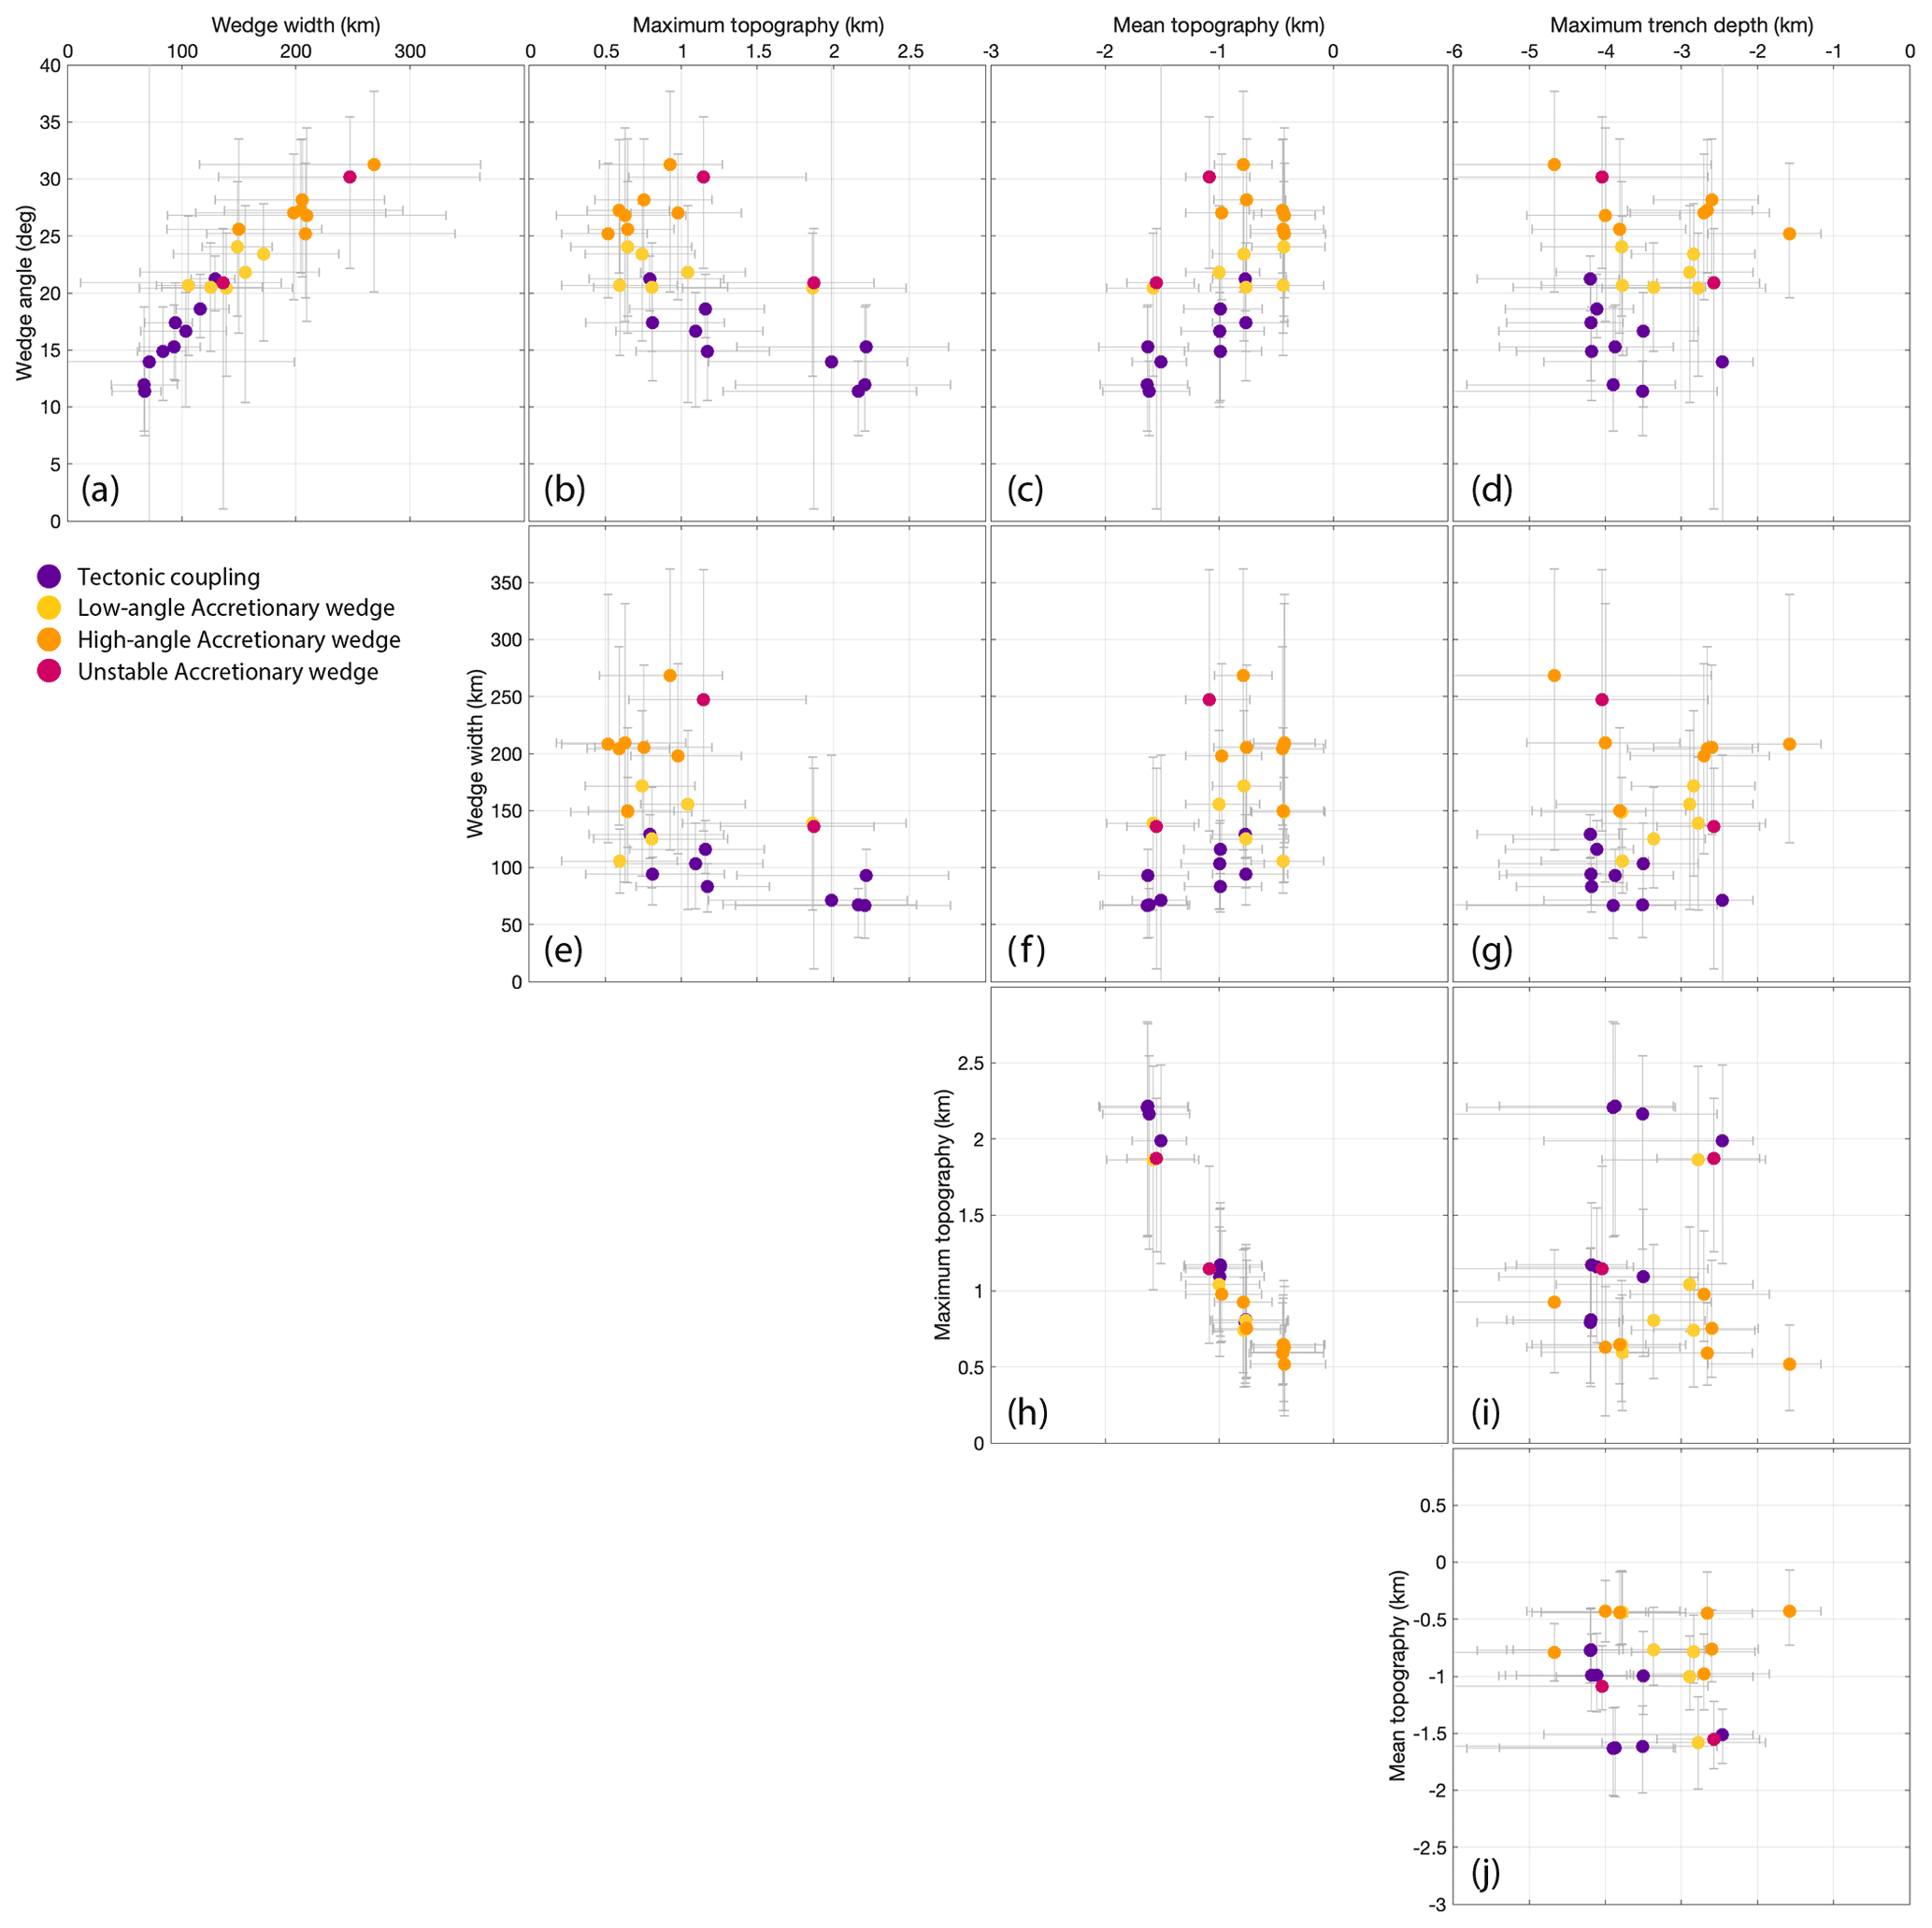
Figure 5Sediment versus topography diagnostic parameters. Each point represents the evolution mean of the given parameter in a simulation, and the grey bars represent the variability intervals (see Figs. 3 and 4). TC models yield smaller trench depths and mean topography, as well as higher maximum topography in the upper plate. The weaker correlations are due to the nature of the upper plate, which is considered oceanic and unattached to the right boundary; any topographic signal is smaller than it would be for continental upper plate lithosphere. Topographic signals for simulations with a fixed upper plate are shown in Fig. S9, which are higher and more distinct for end-member models.
Our results show three modes of subduction interface: tectonic coupling margin, low-angle accretionary wedge margin, and high-angle accretionary wedge margin. We obtain a diverse response in subduction geometry to just a few varied input parameters: sediment viscosity and thickness, as well as upper plate thickness. The focus of our analysis is solely on the effect of low-viscosity sediments on large-scale subduction dynamics. Other parameters have also been shown to be important (i.e., density of sediments, thermal structure of plates) that will be discussed below.
The viscosity of sediments represents the critical parameter, and thickness is a secondary parameter in our simulations. High-viscosity sediments lead to TC margin, while low-viscosity sediments lead to AW margins (Table 1). Sediment thickness controls the availability of sediments to be accumulated in accretionary wedges. A detailed analysis of Figs. S10–S18 shows that the thickness of the upper plate plays an important role in determining the subduction interface length and the depth at which sediments can be locked into an accretionary wedge. For the same thickness of sediments, when the upper plate is thinner, the accretionary wedge is volumetrically smaller but wider and with a higher angle, while for a thick upper plate, sediments are distributed across the entire interface into a thinner layer indicative of tectonic coupling (i.e., compare results of SubdSed02_50 for a 50 km thick upper plate and SubdSed02_150 for a 150 km thick upper plate in Fig. S11).
4.1 Parameter correlation and observations
A common approach to constrain the effect of different parameters that control subduction dynamics has been done considering the statistical analysis of present-day subduction zones (Supplement, Fig. S2) (Clift and Vannucchi, 2004; Lallemand et al., 2005; Wu et al., 2008; De Franco et al., 2008; Heuret et al., 2012). Our diagnostic parameter analysis in Sect. 3.3 builds a bridge between these studies and numerical models, as diagnostics from numerical models are often not comparable with those from statistical analyses. A number of fundamental differences remain between our results and these studies. Present-day subduction parameter correlations represent only current snapshots and do not always account for the evolution stage of a given subduction system. Our analysis considers the entire evolution of a subduction system. Moreover, natural subduction zones have variable sediment influxes, changing boundary conditions, and multiphase physics. On the other hand, the numerical model setup is ideal and simplified, which is further discussed below.
Despite these differences, we succeed in obtaining subduction margins that accumulate sediments in accretionary wedges, as well as ones that do not and instead conserve the subduction interface geometry. The low accretion margin obtained in numerical results for tectonic coupling (TC) is assumed to be analogous to the tectonic erosion observed in nature. The limitations of this assumption are discussed in the next section. Our results then agree with findings in Clift and Vannucchi (2004). Accretionary margins form in simulations with thicker and weaker sediment cover entering the trench, while tectonic coupling margins form in simulations with less sediment cover (high-viscosity sediments are representative of a stronger crust and mantle component at the slab surface). Replotted data from Wu et al. (2008) and using the margin classification from Clift and Vannucchi (2004) (Supplement, Fig. S2) show that accretionary margins also tend to have larger radii of curvature, which is consistent with our numerical results. A recent study obtained similar correlations between margin style and radii of curvature (Brizzi et al., 2021).
Our findings using slab curvature are consistent with observations on slab dip. Diversity of subduction zones is generally investigated through the perspective of slab orientation (i.e., Beall et al., 2021; Riel et al., 2018). Many analogue and numerical studies used slab dip as the preferred diagnostic for slab orientation instead of slab curvature (i.e., Heuret et al., 2007, Sect. 2.2). They suggest that slab dip depends on properties of the subducting plate, mantle, overriding plate, and the coupling between the subducting and overriding plate (e.g., Bellahsen et al., 2005; Heuret et al., 2007; Billen and Hirth, 2007; Schellart et al., 2007; Funiciello et al., 2008; Babeyko and Sobolev, 2008; Duarte et al., 2013; Riel et al., 2018). We find that coupling at the plate interface due to sediment influxes can strongly influence bending of the slab, exemplified by the radius of curvature. TC models have small RC (large dip), while AW models have large RC (small dip). The nature of the upper plate (oceanic or continental), however, will further influence these correlations by changing the load on the subduction interface, which should be investigated further.
Topographic signals have been incorporated less in both statistical and numerical studies of subduction zones, despite the fact that topography is a direct and easily acquirable observable (i.e., Pusok and Kaus, 2015; Riel et al., 2018). In higher-resolution models, Menant et al. (2020) found that deep accretion processes influence forearc topography over time but did not compare the effect in both accretionary and erosion margins. In our ocean–ocean subduction, we see a lesser control of sediments on topographic diagnostics, with TC margins yielding deeper trenches. However, the effect increases when the upper plate is attached to the domain wall (Supplement, Fig. S9). This is because the subduction interface stresses are transferred in the upper plate (i.e., topography build-up) rather than accommodated in trench retreat.
4.2 Convergence rate and margin type
Results from numerical models suggest strong correlations between margin type and convergence rate (Fig. 4). Convergence rates in AW models are faster than in TC models, as sediments help lubricate the interface and reduce coupling between the subducting and upper plate. An exception is the high-angle AW model results (Fig. 3b), wherein the convergence rate is faster in the growing stage of the accretionary wedge, but once it reaches a critical value, the convergence rate becomes slower than in the case of tectonic coupling. Behr and Becker (2018) obtain similar predictions, in which weaker (lower viscosity) sediments promote faster convergence rates. However, observations of the global subduction system suggest an inverse correlation between convergence rate and margin type (Supplement, Fig. S2), with tectonic erosion margins subducting faster than accretionary wedge margins. Brizzi et al. (2021) obtained lower convergence rates for accretionary margins but analyzed numerical results only at a time instance in model evolution. The inverse correlation between convergence rate and margin type in the global subduction system may also suggest that we do not capture all complex processes happening at the subduction interface (von Huene et al., 2004).
The dominant mechanisms governing accretionary and tectonic erosion margins are different. The style of deformation within accretionary wedges is thin-skinned; that is, associated thrusts and folds are uncoupled from the underlying oceanic crust by a basal decollément with a large amount of displacement (Weiss et al., 2018; Angiboust et al., 2021). The dynamics of accretionary wedges are more complex if one considers multiple types of sediments, fluid pressure, and deformation mechanisms (Ruh, 2017; Menant et al., 2020). In accretionary margins, ocean sediments are available to lubricate the interface, while little sediment enters tectonic erosion margins. However, in tectonic erosion margins, the subducting plate may erode the basement of the upper plate and create further debris along the plate interface (von Huene et al., 2004). In any given system, both processes may be occurring simultaneously, either in time and space or at the same time in different parts of the subduction zone (Clarke et al., 2018; Comte et al., 2019; Ducea and Chapman, 2018; Straub et al., 2020). At the physics level, these interface processes are governed by hydraulic fracturing, melting, and deformation of multiphase media, which are not accounted for in our numerical models.
Moreover, it is unclear whether sediment influxes affect convergence rate, convergence rate affects sediment accumulation at the trench, or both. Accretion is generally favored by slow convergence (<7.6 cm yr−1) (Silver et al., 1985; von Huene and Scholl, 1991a; Clift and Vannucchi, 2004; Syracuse et al., 2010), while fast convergence favors larger volumes of sediment being dragged down at the interface, thus lubricating the interface. Erosive margins tend to occur in regions where the convergence rate exceeds 6 cm yr−1 and where the sedimentary cover is thin (Straub et al., 2020). Testing this hypothesis requires different experimental setups: one in which convergence rate evolves dynamically in response to sediment input and a second in which the convergence rate is prescribed and sediments deform accordingly. Here, we tested the first scenario, in which the convergence rate is the dynamic response of the system due to incoming sediments at the trench. We briefly tested the second scenario in Supplement Figs. S8–S9 with kinematic boundary conditions. Imposed convergence with a fixed upper plate reduces the amount of trench retreat, and the variation of diagnostic parameters is smaller among end-member cases, but the correlations remain valid. Menant et al. (2020) investigated the dynamics of accretionary margins as a function of convergence rate to find that more sediment and crustal material are subducted at higher convergence rates.
4.3 Sediment fluxes to trench and to depth
Sediment fluxes to depths below the lithosphere influence the quantity of volatiles recycled into the mantle (Plank and Langmuir, 1998; van Keken et al., 2011; Plank and Manning, 2019). The type of margin may also affect how much sediment gets subducted into the mantle. It has been proposed that tectonic erosion margins can subduct higher percentages of sediment influx; however, large volumes of continental crust are subducted at both erosive and accretionary margins (von Huene and Scholl, 1991a; Clift and Vannucchi, 2004). Clift and Vannucchi (2004) calculated that accretion is a relatively inefficient process for cleaning sediment off the oceanic basement and that 70 % of the sediment column is likely subducted to great depths below the forearc.
Here, we calculate the volume fraction of sediments accreted and subducted in the mantle below the lithosphere in our reference models (Fig. 6). We find that TC margins subduct a higher percentage of influx sediments than AW margins. The total percentage of sediments subducted right before the slab was consumed in TC margins was 60 %, while in AW margins the percentage remains at ∼10 %. However, considering that TC margins have a smaller sediment cover (and influx), accretionary margins may in total subduct a larger volume of sediments. For example, 50 % of a 1 km column of influx sediments is equivalent to 10 % of a 5 km column of influx sediments, which gives a 500 m column of subducted sediments. We suggest that both tectonic erosion margins and accretionary wedges can subduct a large volume of sediments, but at different rates relative to influx material.
This is, however, a simplistic view of sediment subduction to depth. As sediments approach the trench, they can be accreted in the trench, subducted into the mantle, accreted structurally to the bottom of the upper plate, or returned to the upper plate via magmatism, diapirism, or some other form of partially molten upward transport (Gerya and Yuen, 2003; Currie et al., 2007; Tian et al., 2019). Modeling all these processes requires future development of multi-physics models that is beyond the scope of this study.
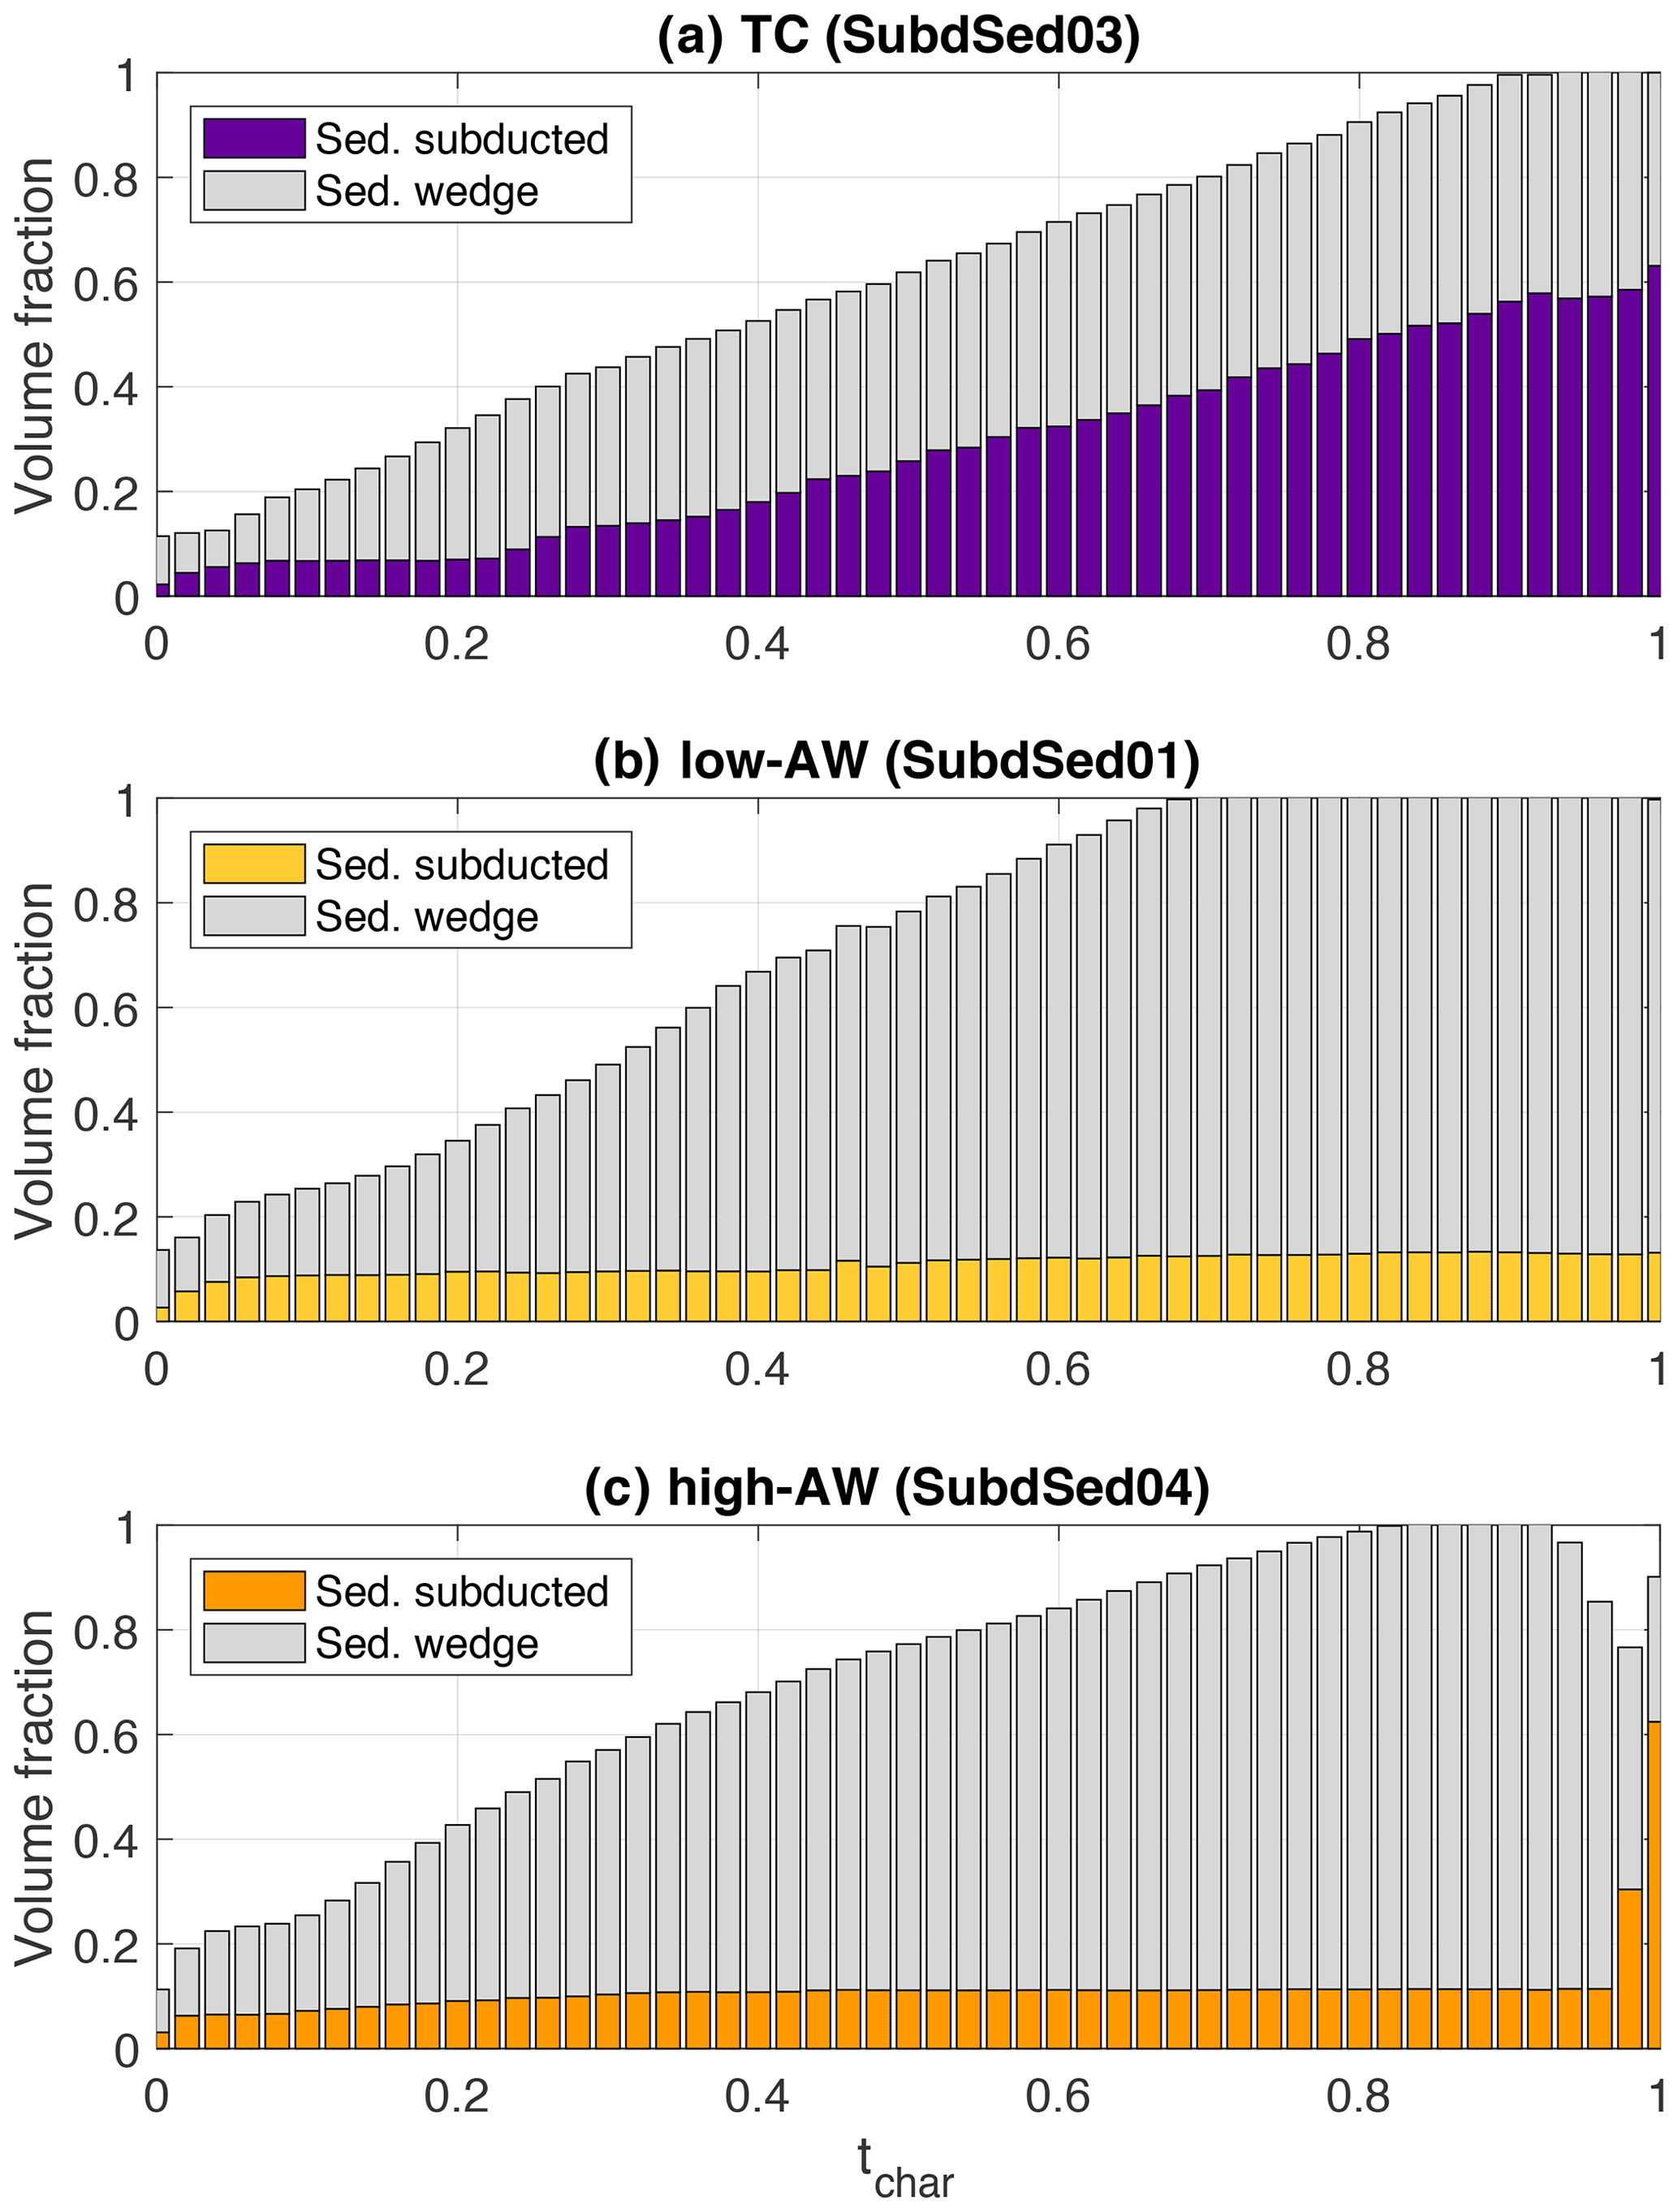
Figure 6Evolution of the total volume fraction of sediments accumulated in the accretionary wedge and subducted to depth in the mantle for the three reference cases: (a) tectonic coupling (SubdSed03), (b) low-angle accretionary wedge (SubdSed01), (c) high-angle accretionary wedge (SubdSed04).
We also considered a constant sediment flux to the trench. Sediment subduction is neither a steady-state nor a globally averaged process (Plank and Manning, 2019) and can have major implications for subduction dynamics. Modern oceanic sediments cover 70 % of the planet’s surface, but sediment distribution and lithology occur in drastically different proportions globally (Dutkiewicz et al., 2015, 2018). Moreover, the oceanic lithosphere is covered by various sediment types depending on the depth, proximity to continental margins, and interactions with the oceanic currents and biosphere. For example, an abundant carbonate cover is subducted at the Central American margin, while little sedimentary carbonate is subducted along the Tonga, central Aleutian, and Kuriles–Kamchatka trenches (Plank and Langmuir, 1998; Plank and Manning, 2019). The global sedimentary cover also varies in both space and geological time, with the greatest volume being geologically recent and decreasing exponentially with increasing age (Peters and Husson, 2017).
We expect the abundance and lithology of sediments at trenches to influence the mode of occurrence of margin styles in space and geologic time. The subduction interface structure and properties are sensitive to the composition of the material that is being subducted (Behr and Becker, 2018). Our results broadly cover the end-member scenarios. The degree to which variability in these influxes impacts long-term subduction dynamics remains debated (Cloos and Shreve, 1988; Duarte et al., 2015; Behr and Becker, 2018) and should be studied with further numerical modeling.
4.4 Model limitations
In order to be able to address the points above, a number of model improvements are needed. The models shown here provide an initial experiment on the viscosity of sediments, wherein we considered constant sediment fluxes at the trench. Future work should explore the effect of other sediment properties (density, lithology) and active surface processes such as erosion and sedimentation for potential delivery of continental sediments to the trench. The effect of sediments is overestimated in some of our model outcomes, especially in models with unrealistically large wedges. Thinner and lighter sediment cover requires higher resolutions at the trench, which could also help connect results with those from high-resolution accretionary wedge models (Menant et al., 2020).
Despite our simplified model, mechanical coupling between plates should not be investigated only in variations in subduction velocity or dynamics, but also in the type of margin: accretionary or erosion. We propose that the definition of subduction interface in numerical models could be relaxed. A recent methodological analysis (Sandiford and Moresi, 2019) investigated the emergence of significant spatial and temporal thickness variations within the interface zone, with the sole focus of maintaining a constant thickness through time. Instead, Beall et al. (2021) and Riel et al. (2018) also investigated variations in interface thickness as a potential factor controlling the dynamics. All these studies, in fact, highlight the tendency for the subduction interface to develop spontaneous thickness variation as the models evolve. The interface widens near the trench, building a prism-like complex, and thins at depths beyond the brittle–ductile transition. This pattern was also noted in the boundary element models of Gerardi et al. (2019), who attributed a down-dip thickness variation to lubrication layer dynamics. However, natural observations suggest that variable sediment fluxes enter the subduction trench, questioning this approach of a constant-thickness interface layer.
Systematic 2-D numerical simulations of ocean–ocean subduction are run to investigate how low-viscosity sediments influence subduction dynamics and plate coupling. The aim is to understand what causes convergent margins to either accrete material delivered by the subducting plate or, alternatively, to subduct the trench sediment pile and even erode the basement of the overriding plate. We obtain end-member cases that are governed primarily by sediment viscosity and thickness: accretionary and tectonic coupling margins. Results from a large suite of numerical simulations represent a continuum between these end-member models. We find that the properties of the sediment layer modulate the extent of viscous coupling at the interface between the subducting and upper plate. When the viscous coupling is increased, a tectonic coupling style of margin is favored. On the other hand, when the viscous coupling is reduced, sediments are scrapped off the subducting slab to form an accretionary wedge. The geometry of the wedge controls the bending of the slab and the radius of the curvature. We perform an automated analysis of diagnostic parameters to differentiate between the two end-member modes of margin type and to better understand fundamental differences between them. Strong correlations between sediment, subduction diagnostics, and margin type are observed. Tectonic coupling margins have smaller radii of curvature, wedge parameters, and slower convergence rates, while accretionary margins are dominated by larger sediment wedges that can strongly influence subduction dynamics. With some limitations, tectonic coupling margins obtained here are analogous to tectonic erosion margins observed in nature.
A more careful examination of sediment properties and other complex processes happening at the subduction interface in both accretionary and erosive margins is necessary. The margin type is intimately linked to earthquakes. The amount of sediment filling the trench was proposed to facilitate seismic rupture (Heuret et al., 2012; van Rijsingen et al., 2018; Brizzi et al., 2020). Subduction zones with large amounts of trench sediment positively correlate with the occurrence of great interplate earthquakes.
The Bitbucket version of the numerical code (LaMEM) used can be found here: https://bitbucket.org/bkaus/lamem (Kaus et al., 2016). The repository containing the input parameter files to reproduce the data can be found here: https://bitbucket.org/adina/rep-msubdsed.git (last access: 11 October 2021). The full simulation data (>100 Gb) presented in this study can be provided on request from Adina E. Pusok.
The supplement related to this article is available online at: https://doi.org/10.5194/se-13-1455-2022-supplement.
AEP and DRS designed the study, AEP built the numerical model and performed the analysis, and MK helped run and analyze some of the simulations during an REU internship. AEP wrote first draft of paper, and all authors contributed equally to the revision of this paper.
The contact author has declared that none of the authors has any competing interests.
Publisher's note: Copernicus Publications remains neutral with regard to jurisdictional claims in published maps and institutional affiliations.
Adina E. Pusok is grateful for postdoctoral research funding from the Cecil H. and Ida M. Green Foundation, UCSD. In addition, all authors are grateful for support from the National Science Foundation under grant no. EAR-1255040. The numerical simulations were performed on Comet (San Diego Supercomputing Center) within the Extreme Science and Engineering Discovery Environment (XSEDE), which is supported by the National Science Foundation under grant number ACI-1053575. We thank three anonymous reviewers and the editor Susanne Buiter for their instructive comments that helped improve the paper.
This research has been supported by the United States Science Support Program (grant no. NSF EAR-1255040).
This paper was edited by Susanne Buiter and reviewed by three anonymous referees.
Agard, P., Plunder, A., Angiboust, S., Bonnet, G., and Ruh, J.: The subduction plate interface: rock record and mechanical coupling (from long to short timescales), Lithos, 320/321, 537–566, https://doi.org/10.1016/j.lithos.2018.09.029, 2018. a, b
Agrusta, R., Goes, S., and van Hunen, J.: Subducting-slab transition-zone interaction: Stagnation, penetration and mode switches, Earth Planet. Sc. Lett., 464, 10–23, https://doi.org/10.1016/j.epsl.2017.02.005, 2017. a
Angiboust, S., Menant, A., Gerya, T., and Oncken, O.: The rise and demise of deep accretionary wedges: A long-term field and numerical modeling perspective, Geosphere, 17, 1–35, https://doi.org/10.1130/GES02392.1, 2021. a, b, c
Babeyko, A. and Sobolev, S.: High-resolution numerical modeling of stress distribution in visco-elasto-plastic subducting slabs, Lithos, 103, 205–216, https://doi.org/10.1016/j.lithos.2007.09.015, 2008. a, b
Bangs, N. L., Morgan, J. K., Tréhu, A. M., Contreras-Reyes, E., Arnulf, A. F., Han, S., Olsen, K., and Zhang, E.: Basal accretion along the south central Chilean margin and its relationship to great earthquakes, J. Geophys. Res.-Sol. Ea., 125, 1–21, https://doi.org/10.1029/2020JB019861, 2020. a
Beall, A., Fagereng, A., Davies, J. H., Garel, F., and Davies, D. R.: Influence of subduction zone dynamics on interface shear stress and potential relationship with seismogenic behavior, Geochem. Geophy. Geosy., 22, 1–20, https://doi.org/10.1029/2020GC009267, 2021. a, b, c
Beaumont, C., Ellis, S., and Pfiffner, A.: Dynamics of sediment subduction-accretion at convergent margins: Short-term modes, long-term deformation, and tectonic implications, J. Geophys. Res., 104, 17573–17601, https://doi.org/10.1029/1999JB900136, 1999. a
Becker, T., Faccenna, C., O'Connell, R., and Giardini, D.: The development of slabs in the upper mantle: Insights from numerical and laboratory experiments, J. Geophys. Res.-Sol. Ea., 104, 15207–15226, https://doi.org/10.1029/1999jb900140, 1999. a
Behr, W. M. and Becker, T. W.: Sediment control on subduction plate speeds, Earth Planet. Sc. Lett., 502, 166–173, https://doi.org/10.1016/j.epsl.2018.08.057, 2018. a, b, c, d, e, f
Bellahsen, N., Faccenna, C., and Funiciello, F.: Dynamics of subduction and plate motion in laboratory experiments: Insights into the “plate tectonics” behavior of the Earth, J. Geophys. Res., 110, 1–15, https://doi.org/10.1029/2004JB002999, 2005. a
Bercovici, D.: The generation of plate tectonics from mantle convection, Earth Planet. Sc. Lett., 205, 107–121, https://doi.org/10.1016/S0012-821X(02)01009-9, 2003. a
Bercovici, D. and Ricard, Y.: Plate tectonics damage and inheritance, Nature, 508, 513–516, https://doi.org/10.1038/nature13072, 2014. a
Billen, M. and Hirth, G.: Rheologic controls on slab dynamics, Geochem. Geophy. Geosy., 8, 1–24, https://doi.org/10.1029/2007GC001597, 2007. a, b
Brizzi, S., van Zelst, I., Funiciello, F., Corbi, F., and van Dinther, Y.: How sediment thickness influences subduction dynamics and seismicity, J. Geophys. Res.-Sol. Ea., 125, 1–19, https://doi.org/10.1029/2019JB018964, 2020. a, b, c
Brizzi, S., Becker, T. W., Faccenna, C., Behr, W., van Zelst, I., Dal Zilio, L., and van Dinther, Y.: The role of sediment accretion and buoyancy on subduction dynamics and geometry, Geophys. Res. Lett., 48, 1–12, https://doi.org/10.1029/2021GL096266, 2021. a, b
Buffett, B. A. and Heuret, A.: Curvature of subducted lithosphere from earthquake locations in the Wadati-Benioff zone, Geochem. Geophy. Geosy., 12, 1–13, https://doi.org/10.1029/2011GC003570, 2011. a
Capitanio, F. and Morra, G.: The bending mechanics in a dynamic subduction system: Constraints from numerical modelling and global compilation analysis, Tectonophysics, 522–523, 224–234, https://doi.org/10.1016/j.tecto.2011.12.003, 2012. a
Capitanio, F., Stegman, D., Moresi, L., and Sharples, W.: Upper plate controls on deep subduction, trench migrations and deformations at convergent margins, Tectonophysics, 483, 80–92, https://doi.org/10.1016/j.tecto.2009.08.020, 2010. a
Chertova, M. V., Geenen, T., van den Berg, A., and Spakman, W.: Using open sidewalls for modelling self-consistent lithosphere subduction dynamics, Solid Earth, 3, 313–326, https://doi.org/10.5194/se-3-313-2012, 2012. a
Cizkova, H. and Bina, C.: Effects of mantle and subduction-interface rheologies on slab stagnation and trench rollback, Earth Planet. Sc. Lett., 379, 95–103, https://doi.org/10.1016/j.epsl.2013.08.011, 2013. a
Cizkova, H. and Bina, C.: Linked influences on slab stagnation: Interplay between lower mantle viscosity structure, phase transitions, and plate coupling, Earth Planet. Sc. Lett., 509, 88–99, https://doi.org/10.1016/j.epsl.2018.12.027, 2019. a
Clarke, A., Vannucchi, P., and Morgan, J.: Seamount chain–subduction zone interactions: Implications for accretionary and erosive subduction zone behavior, Geology, 46, 367–370, https://doi.org/10.1130/G40063.1, 2018. a
Clift, P. and Vannucchi, P.: Controls on tectonic accretion versus erosion in subduction zones: Implications for the origin and recycling of the continental crust, Rev. Geophys., 42, 1–31, https://doi.org/10.1029/2003RG000127, 2004. a, b, c, d, e, f, g, h, i, j, k, l, m
Cloos, M. and Shreve, R.: Subduction-channel model of prism accretion, melange formation, sediment subduction, and subduction erosion at convergent plate margins: 1. Background and description, PAGEOPH, 128, 455–500, https://doi.org/10.1007/BF00874548, 1988. a
Comte, D., Farias, M., Roecker, S., and Russo, R.: The nature of the subduction wedge in an erosive margin: Insights from the analysis of aftershocks of the 2015 Mw 8.3 Illapel earthquake beneath the Chilean Coastal Range, Earth Planet. Sc. Lett., 520, 50–62, https://doi.org/10.1016/j.epsl.2019.05.033, 2019. a
Conrad, C. and Hager, B.: Effects of plate bending and fault strength at subduction zones on plate dynamics, J. Geophys. Res.-Sol. Ea., 104, 17551–17571, https://doi.org/10.1029/1999jb900149, 1999. a, b, c
Crameri, F. and Tackley, P.: Parameters controlling dynamically self-consistent plate tectonics and single-sided subduction in global models of mantle convection, J. Geophys. Res.-Sol. Ea., 120, 3680–3706, https://doi.org/10.1002/2014JB011664, 2015. a, b
Crameri, F., Schmeling, H., Golabek, G. J., Duretz, T., Orendt, R., Buiter, S. J. H., May, D. A., Kaus, B. J., Gerya, T. V., and Tackley, P. J.: A comparison of numerical surface topography calculations in geodynamic modelling: an evaluation of the “sticky air” method, Geophys. J. Int., 189, 38–54, https://doi.org/10.1111/j.1365-246X.2012.05388.x, 2012. a
Currie, C., Beaumont, C., and Huismans, R.: The fate of subducted sediments: A case for backarc intrusion and underplating, Geology, 35, 1111–1114, https://doi.org/10.1130/G24098A.1, 2007. a, b
Dahlen, F.: Noncohesive critical coulomb wedges: An exact solution, J. Geophys. Res.-Sol. Ea., 89, 10125–10133, https://doi.org/10.1029/JB089iB12p10125, 1984. a, b
Dahlen, F., Suppe, J., and Davis, D.: Mechanics of fold-and-thrust belts and accretionary wedges: Cohesive coulomb theory, J. Geophys. Res.-Sol. Ea., 89, 10087–10101, https://doi.org/10.1029/JB089iB12p10087, 1984. a, b
Dasgupta, R. and Hirschmann, M. M.: The deep carbon cycle and melting in Earth's interior, Earth Planet. Sc. Lett., 298, 1–13, https://doi.org/10.1016/j.epsl.2010.06.039, 2010. a
De Franco, R., Govers, R., and Wortel, R.: Nature of the plate contact and subduction zones diversity, Earth Planet. Sc. Lett., 271, 245–253, https://doi.org/10.1016/j.epsl.2008.04.019, 2008. a, b, c, d
Duarte, J., Schellart, W., and Cruden, A.: Three-dimensional dynamic laboratory models of subduction with an overriding plate and variable interplate rheology, Geophys. J. Int., 195, 47–66, https://doi.org/10.1093/gji/ggt257, 2013. a
Duarte, J. C., Schellart, W. P., and Cruden, A. R.: How weak is the subduction zone interface?, Geophys. Res. Lett., 42, 2664–2673, https://doi.org/10.1002/2014GL062876, 2015. a, b
Ducea, M. N. and Chapman, A. D.: Sub-magmatic arc underplating by trench and forearc materials in shallow subduction systems; A geologic perspective and implications, Earth-Sci. Rev., 185, 763–779, https://doi.org/10.1016/j.earscirev.2018.08.001, 2018. a
Dutkiewicz, A., Müller, R., O'Callaghan, S., and Jónasson, H.: Census of seafloor sediments in the world's ocean, Geology, 43, 795–798, https://doi.org/10.1130/G36883.1, 2015. a, b
Dutkiewicz, A., D.R, M., Cannon, J., Vaughan, S., and Zahirovic, S.: Sequestration and subduction of deep-sea carbonate in the global ocean since the Early Cretaceou, Geology, 47, 91–94, https://doi.org/10.1130/G45424.1, 2018. a, b
Enns, A., Becker, T., and Schmeling, H.: The dynamics of subduction and trench migration for viscosity stratification, Geophys. J. Int., 160, 761–775, 2005. a
Funiciello, F., Faccenna, C., Heuret, A., Lallemand, S., Di Giuseppe, E., and Becker, T.: Trench migration, net rotation and slab-mantle coupling, Earth Planet. Sc. Lett., 271, 233–240, https://doi.org/10.1016/j.epsl.2008.04.006, 2008. a, b
Garel, F., Goes, S., Davies, D., Davies, J., Kramer, S., and Wilson, C.: Interaction of subducted slabs with the mantle transition-zone: A regime diagram from 2-D thermo-mechanical models with a mobile trench and an overriding plate, Geochem. Geophy. Geosy., 15, 1739–1765, https://doi.org/10.1002/2014GC005257, 2014a. a
Garel, F., Goes, S., Davies, D. R., Davies, J. H., Kramer, S. C., and Wilson, C. R.: Interaction of subducted slabs with the mantle transition-zone: A regime diagram from 2-D thermo-mechanical models with a mobile trench and an overriding plate, Geochem. Geophy. Geosy., 15, 1739–1765, https://doi.org/10.1002/2014gc005257, 2014b. a
Gerardi, G., Ribe, N. M., and Tackley, P. J.: Plate bending, energetics of subduction and modeling of mantle convection: A boundary element approach, Earth Planet. Sc. Lett., 515, 47–57, https://doi.org/10.1016/j.epsl.2019.03.010, 2019. a
Gerya, T.: Introduction to Numerical Geodynamic Modelling, Cambridge University Press, 1st edn., 2009. a, b
Gerya, T. and Yuen, D.: Rayleigh-Taylor instabilities from hydration and melting propel “cold plumes” at subduction zones, Earth Planet. Sc. Lett., 212, 47–67, https://doi.org/10.1016/S0012-821X(03)00265-6, 2003. a
Gerya, T. V., Stöckhert, B., and Perchuk, A. L.: Exhumation of high-pressure metamorphic rocks in a subduction channel: A numerical simulation, Tectonics, 21, 1–19, https://doi.org/10.1029/2002TC001406, 2002. a
Gutscher, M.-A., Kukowski, N., Malavieille, J., and Lallemand, S.: Material transfer in accretionary wedges from analysis of a systematic series of analog experiments, J. Struct. Geol., 20, 407–416, https://doi.org/10.1016/S0191-8141(97)00096-5, 1998. a
Harlow, F. and Welch, J.: Numerical Calculation of Time-Dependent Viscous Incompressible Flow of Fluid with Free Surface, Phys. Fluids, 8, 1–8, https://doi.org/10.1063/1.1761178, 1965. a
Hawkesworth, C., Turner, S., McDermott, F., Peate, D., and Van Calsteren, P.: U–Th isotopes in arc magmas: implications for element transfer from the subducted crust, Science, 276, 551–555, https://doi.org/10.1126/science.276.5312.551, 1997. a
Heuret, A., Funiciello, F., Faccenna, C., and Lallemand, S.: Plate kinematics, slab shape and back-arc stress: A comparison between laboratory models and current subduction zones, Earth Planet. Sc. Lett., 256, 473–483, https://doi.org/10.1016/j.epsl.2007.02.004, 2007. a, b
Heuret, A., Conrad, C. P., Funiciello, F., Lallemand, S., and Sandri, L.: Relation between subduction megathrust earthquakes, trench sediment thickness and upper plate strain, Geophys. Res. Lett., 39, 1–6, https://doi.org/10.1029/2011GL050712, 2012. a, b, c, d, e
Hirth, G. and Kohlstedt, D. L.: Water in the oceanic upper mantle: implications for rheology, melt extraction and the evolution of the lithosphere, Earth Planet. Sc. Lett., 144, 93–108, 1996. a
Holt, A., Becker, T., and Buffett, B.: Trench migration and overriding plate stress in dynamic subduction models, Geophys. J. Int., 201, 172–192, https://doi.org/10.1093/gji/ggv011, 2015. a
Husson, J. and Peters, S.: Atmospheric oxygenation driven by unsteady growth of the continental sedimentary reservoir, Earth Planet. Sc. Lett., 460, 68–75, https://doi.org/10.1016/j.epsl.2016.12.012, 2017. a
Kasting, J.: Long-term stability of the Earth’s climate, Glob. Planet. Change, 75, 83–95, https://doi.org/10.1016/0031-0182(89)90185-5, 1989. a
Kaus, B., Mühlhaus, H., and May, D.: A Stabilization Algorithm for Geodynamic Numerical Simulations with a Free Surface, Phys. Earth Planet. Int., 181, 12–20, https://doi.org/10.1016/j.pepi.2010.04.007, 2010. a, b
Kaus, B., Popov, A., Baumann, T., Pusok, A., Bauville, A., Fernandez, N., and Collignon, M.: Forward and inverse modeling of lithospheric deformation on geological timescales, NIC Proceed., 48, 299–307, 2016 (code available at: https://bitbucket.org/bkaus/lamem, last access: 17 September 2022). a, b
Kelemen, P. B. and Manning, C. E.: Reevaluating carbon fluxes in subduction zones, what goes down, mostly comes up, P. Natl. Acad. Sci. USA, 112, E3997–E4006, https://doi.org/10.1073/pnas.1507889112, 2015. a
Lallemand, S., Heuret, A., and Boutelier, D.: On the relationships between slab dip, back-arc stress, upper plate absolute motion, and crustal nature in subduction zones, Geochem. Geophy. Geosy., 6, 1–18, https://doi.org/10.1029/2005GC000917, 2005. a, b, c, d
Lallemand, S. E., Schnürle, P., and Malavieille, J.: Coulomb theory applied to accretionary and nonaccretionary wedges: Possible causes for tectonic erosion and/or frontal accretion, J. Geophys. Res., 99, 12033–12055, https://doi.org/10.1029/94JB00124, 1994. a
Lamb, S. and Davis, P.: Cenozoic climate change as a possible cause for the rise of the Andes, Nature, 425, 792–797, https://doi.org/10.1038/nature02049, 2003. a, b
Laske, G., Masters., G., Ma, Z., and Pasyanos, M.: Update on CRUST1.0 – A 1-degree Global Model of Earth's Crust, Geophys. Res. Abstr., EGU2012-3743-1, EGU General Assembly 2012, Vienna, Austria, 2012. a
Magni, V., van Hunen, J., Funiciello, F., and Faccenna, C.: Numerical models of slab migration in continental collision zones, Solid Earth, 3, 293–306, https://doi.org/10.5194/se-3-293-2012, 2012. a
Melnick, D. and Echtler, H.: Inversion of forearc basins in south-central Chile caused by rapid glacial age trench fill, Geology, 34, 709–712, https://doi.org/10.1130/G22440.1, 2006. a
Menant, A., Angiboust, S., Gerya, T., Lacassin, R., Simoes, M., and Grandin, R.: Transient stripping of subducting slabs controls periodic forearc uplift, Nat. Commun., 11, 1–10, https://doi.org/10.1038/s41467-020-15580-7, 2020. a, b, c, d, e, f, g
Merdith, A., Atkins, S., and Tetley, M.: Tectonic Controls on Carbon and Serpentinite Storage in Subducted Upper Oceanic Lithosphere for the Past 320 Ma, Front. Earth Sci., 7, 1–23, https://doi.org/10.3389/feart.2019.00332, 2019. a
Moore, J. and Saffer, D.: Updip limit of the seismogenic zone beneath the accretionary prism of southwest Japan: An effect of diagenetic to low-grade metamorphic processes and increasing effective stress, Geology, 29, 183–186, https://doi.org/10.1130/0091-7613(2001)029<0183:ULOTSZ>2.0.CO;2, 2001. a
Moresi, L. and Gurnis, M.: Constraints on the lateral strength of slabs from three-dimensional dynamic flow models, Earth Planet. Sc. Lett., 138, 15–28, https://doi.org/10.1016/0012-821X(95)00221-W, 1996. a
Peters, S. and Husson, J.: Sediment cycling on continental and oceanic crust, Geology, 45, 323–326, https://doi.org/10.1130/G38861.1, 2017. a
Petersen, R., Stegman, D., and Tackley, P.: The subduction dichotomy of strong plates and weak slabs, Solid Earth, 8, 339–350, https://doi.org/10.5194/se-8-339-2017, 2017. a, b
Plank, T. and Langmuir, C.: The chemical composition of subducting sediment and its consequences for the crust and mantle, Chem. Geol., 145, 325–394, https://doi.org/10.1016/S0009-2541(97)00150-2, 1998. a, b, c, d
Plank, T. and Manning, C.: Subducting carbon, Nature, 574, 343–352, https://doi.org/10.1038/s41586-019-1643-z, 2019. a, b, c, d
Pusok, A. and Kaus, B.: Development of topography in 3-D continental-collision models, Geochem. Geophy. Geosy., 16, 1378–1400, https://doi.org/10.1002/2015GC005732, 2015. a, b, c, d, e
Pusok, A. and Stegman, D.: Formation and stability of same-dip double subduction systems, J. Geophys. Res.-Sol. Ea., 124, 7387–7412, https://doi.org/10.1029/2018JB017027, 2019. a, b, c, d
Pusok, A. and Stegman, D.: The convergence history of India-Eurasia records multiple subduction dynamics processes, Sci. Adv., 6, 1–8, https://doi.org/10.1126/sciadv.aaz8681, 2020. a, b
Pusok, A., Kaus, B., and Popov, A.: On the quality of velocity interpolation schemes for marker-in-cell method and 3-D staggered grids, Pure Appl. Geophys., 174, 1071–1089, https://doi.org/10.1007/s00024-016-1431-8, 2017. a
Quinteros, J., Sobolev, S., and Popov, A.: Viscosity in transition zone and lower mantle: Implications for slab penetration, Geophys. Res. Lett., 37, 1–5, https://doi.org/10.1029/2010GL043140, 2010. a
Riel, N., Capitanio, F. A., and Velic, M.: Numerical modeling of stress and topography coupling during subduction: Inferences on global vs. regional observables interpretation, Tectonophysics, 746, 239–250, https://doi.org/10.1016/j.tecto.2017.07.023, 2018. a, b, c, d
Rudolph, M., Lekić, V., and Lithgow-Bertelloni, C.: Viscosity jump in Earth's mid-mantle, Science, 350, 1349–1352, https://doi.org/10.1126/science.aad1929, 2015. a
Ruh, J.: Effect of fluid pressure distribution on the structural evolution of accretionary wedges, Terra Nova, 29, 202–210, https://doi.org/10.1111/ter.12263, 2017. a, b, c
Sandiford, D. and Moresi, L.: Improving subduction interface implementation in dynamic numerical models, Solid Earth, 10, 969–985, https://doi.org/10.5194/se-10-969-2019, 2019. a, b
Schellart, W., Freeman, J., Stegman, D., Moresi, L., and May, D.: Evolution and diversity of subduction zones controlled by slab width, Nature, 446, 308–311, https://doi.org/10.1038/nature05615, 2007. a, b
Schmeling, H., Babeyko, A. Y., Enns, A., Faccenna, C., Funiciello, F., Gerya, T., Golabek, G. J., Grigull, S., Kaus, B. J. P., Morra, G., Schmalholz, S. M., and van Hunen, J.: A benchmark comparison of spontaneous subduction models: Towards a free surface, Phys. Earth Planet. Int., 171, 198–223, https://doi.org/10.1016/j.pepi.2008.06.028, 2008. a
Selzer, C., Buiter, S. J. H., and Pfiffner, O. A.: Numerical modeling of frontal and basal accretion at collisional margins, Tectonics, 27, 1–26, https://doi.org/10.1029/2007TC002169, 2008. a
Shreve, R. and Cloos, M.: Dynamics of sediment subduction, melange formation, and prism accretion, J. Geophys. Res.-Sol. Ea., 91, 10229–10245, https://doi.org/10.1029/JB091iB10p10229, 1986. a, b
Silver, E., Ellis, M., Breen, N., and Shipley, T.: Comments on the growth of accretionary wedges, Geology, 13, 6–9, https://doi.org/10.1130/0091-7613(1985)13<6:COTGOA>2.0.CO;2, 1985. a
Simpson, G.: Formation of accretionary prisms influenced by sediment subduction and supplied by sediments from adjacent continents, Geology, 38, 131–134, https://doi.org/10.1130/G30461.1, 2010. a
Sobolev, S. and Brown, M.: Surface erosion events controlled the evolution of plate tectonics on Earth, Nature, 570, 52–57, https://doi.org/10.1038/s41586-019-1258-4, 2019. a
Straub, S., Gómez-Tuena, A., and Vannucchi, P.: Subduction erosion and arc volcanism, Nat. Rev. Earth Environ., 1, 574–589, https://doi.org/10.1038/s43017-020-0095-1, 2020. a, b, c
Straume, E. O., Gaina, C., Medvedev, S., Hochmuth, K., Gohl, K., Whittaker, J. M., Fattah, R. A., Doornenbal, J. C., and Hopper, J. R.: GlobSed: Updated total sediment thickness in the world's oceans, Geochem. Geophy. Geosy., 20, 1756–1772, https://doi.org/10.1029/2018GC008115, 2019. a
Syracuse, E., van Keken, P., and Abers, G.: The global range of subduction zone thermal models, Phys. Earth Planet. Int., 183, 73–90, https://doi.org/10.1016/j.pepi.2010.02.004, 2010. a
Tackley, P.: Self-consistent generation of tectonic plates in time-dependent, three-dimensional mantle convection simulations, Geochem. Geophys. Geos., 1, 1–45, https://doi.org/10.1029/2000GC000036, 2000. a
Tian, M., Katz, R. F., Rees Jones, D. W., and May, D. A.: Devolatilization of Subducting Slabs, Part II: Volatile Fluxes and Storage, Geochem. Geophy. Geosy., 20, 6199–6222, https://doi.org/10.1029/2019GC008489, 2019. a
Turcotte, D. and Schubert, G.: Geodynamics, Cambridge University Press, 3rd Edn., ISBN 9780521186230, 2014. a
Val, P. and Willenbring, J.: Across-strike asymmetry of the Andes orogen linked to the age and geometry of the Nazca plate, Earth ArXiv, (preprint), https://doi.org/10.31223/osf.io/awug4, 2020. a
van Keken, P. E., Hacker, B. R., Syracuse, E. M., and Abers, G. A.: Subduction factory: 4. Depth-dependent flux of H2O from subducting slabs worldwide, J. Geophys. Res., 116, 1–15, https://doi.org/10.1029/2010JB007922, 2011. a
van Rijsingen, E., Lallemand, S., Peyret, M., Arcay, D., Heuret, A., Funiciello, F., and Corbi, F.: How subduction interface roughness influences the occurrence of large interplate earthquakes, Geochem. Geophy. Geosy., 19, 2342–2370, https://doi.org/10.1029/2018GC007618, 2018. a, b
Vannucchi, P., Remitti, F., and Bettelli, G.: Geological record of fluid flow and seismogenesis along an erosive subducting plate boundary, Nature, 451, 699–703, https://doi.org/10.1038/nature06486, 2008. a
von Huene, R. and Scholl, D.: Observations at convergent margins concerning sediment subduction, subduction erosion, and the growth of continental crust, Rev. Geophys., 29, 279–316, https://doi.org/10.1029/91RG00969, 1991a. a, b, c
von Huene, R. and Scholl, D. W.: Observations at convergent margins concerning sediment subduction, subduction erosion, and the growth of continental crust, Rev. Geophys., 29, 279–316, https://doi.org/10.1029/91RG00969, 1991b. a
von Huene, R., C.R., R., and Vannucchi, P.: Generic model of subduction erosion, Geology, 32, 913–916, https://doi.org/10.1130/G20563.1, 2004. a, b
Weiss, J. R., Ito, G., Brooks, B. A., Olive, J.-A., Moore, G. F., and Foster, J. H.: Formation of the frontal thrust zone of accretionary wedges, Earth Planet. Sc. Lett., 495, 87–100, https://doi.org/10.1016/j.epsl.2018.05.010, 2018. a
Wu, B., Conrad, C., Heuret, A., Lithgow-Bertelloni, C., and Lallemand, S.: Reconciling strong slab pull and weak plate bending: The plate motion constraint on the strength of mantle slabs, Earth Planet. Sc. Lett., 272, 412–421, https://doi.org/10.1016/j.epsl.2008.05.009, 2008. a, b, c, d, e, f
Zhong, S. and Davies, G.: Effects of plate and slab viscosities on the geoid, Earth Planet. Sc. Lett., 170, 487–496, https://doi.org/10.1016/S0012-821X(99)00124-7, 1999. a