the Creative Commons Attribution 4.0 License.
the Creative Commons Attribution 4.0 License.
 | 14 Nov 2022
The Luangwa Rift Active Fault Database and fault reactivation along the southwestern branch of the East African Rift
Luke N. J. Wedmore
Tess Turner
Juliet Biggs
Jack N. Williams
Henry M. Sichingabula
Christine Kabumbu
Kawawa Banda
Seismic hazard assessment in slow straining regions is challenging because earthquake catalogues only record events from approximately the last 100 years, whereas earthquake recurrence times on individual faults can exceed 1000 years. Systematic mapping of active faults allows fault sources to be used within probabilistic seismic hazard assessment, which overcomes the problems of short-term earthquake records. We use Shuttle Radar Topography Mission (SRTM) data to analyse surface deformation in the Luangwa Rift in Zambia and develop the Luangwa Rift Active Fault Database (LRAFD). The LRAFD is an open-source geospatial database containing active fault traces and their attributes and is freely available at https://doi.org/10.5281/zenodo.6513691. We identified 18 faults that display evidence for Quaternary activity, and empirical relationships suggest that these faults could cause earthquakes up to Mw 8.1, which would exceed the magnitude of historically recorded events in southern Africa. On the four most prominent faults, the median height of Quaternary fault scarps varies between 12.9 ± 0.4 and 19.2 ± 0.9 m, which suggests they were formed by multiple earthquakes. Deformation is focused on the edges of the Luangwa Rift: the most prominent Quaternary fault scarps occur along the 207 km long Chipola and 142 km long Molaza faults, which are the rift border faults and the longest faults in the region. We associate the scarp on the Molaza Fault with possible surface ruptures from two 20th century earthquakes. Thus, the LRAFD reveals new insights into active faulting in southern Africa and presents a framework for evaluating future seismic hazard.
- Article
(9715 KB) - Full-text XML
-
Supplement
(584 KB) - BibTeX
- EndNote


Earthquakes occur on active faults, and thus the systematic mapping of active faults is a major aim of seismic hazard research (Christophersen et al., 2015; Morell et al., 2020; Styron and Pagani, 2020; Williams et al., 2021, 2022). Within continental rifts, earthquakes on normal faults typically lead to high levels of shaking in their hanging wall basins, which are geomorphically suitable for human habitation and settlement (Bailey et al., 2000; Abrahamson et al., 2008). Consequently, normal faults inherently create conditions that lead to high seismic risk. Despite the seismic hazards associated with active continental rifting, many active extensional regions around the world still lack systematic maps of active faults. This is particularly a problem along many segments of the East African Rift, where there is a history of infrequent large-magnitude earthquakes (Ambraseys and Adams, 1991; Meghraoui, 2016), but the location and activity rates of active faults are poorly known (Skobelev et al., 2004), and population growth over the past 20 years has been rapid (Gerland et al., 2014).
The creation of an active fault database involves defining a criteria to distinguish active faults, systematically mapping all known faults that fit this criteria, and then collating their geomorphic attributes into a geospatial database (Styron and Pagani, 2020; Styron et al., 2020; Faure Walker et al., 2021; Williams et al., 2021, 2022). The use of active fault databases for fault-source seismic hazard is important in regions such as southern and eastern Africa, where the instrumental and historical records of earthquakes are short compared to the long recurrence times between earthquakes on individual faults (Hodge et al., 2015; Williams et al., 2021). In recent years, the first active fault databases along the East African Rift System have been developed, using the Malawi Rift as a case study (Williams et al., 2021, 2022), but this has not yet been extended to other rift segments. In this paper, we map the active faults in one poorly studied rift segment, the Luangwa Rift in Zambia. Although it had been thought that the Luangwa Rift is inactive (Banks et al., 1995; Matende et al., 2021; Sun et al., 2021), recent plate modelling (Wedmore et al., 2021) and the evidence of Quaternary activity on the Chipola Fault (Daly et al., 2020) confirm this is an active rift system (Fig. 1). However, until now there has been no systematic map of active faults in the region.
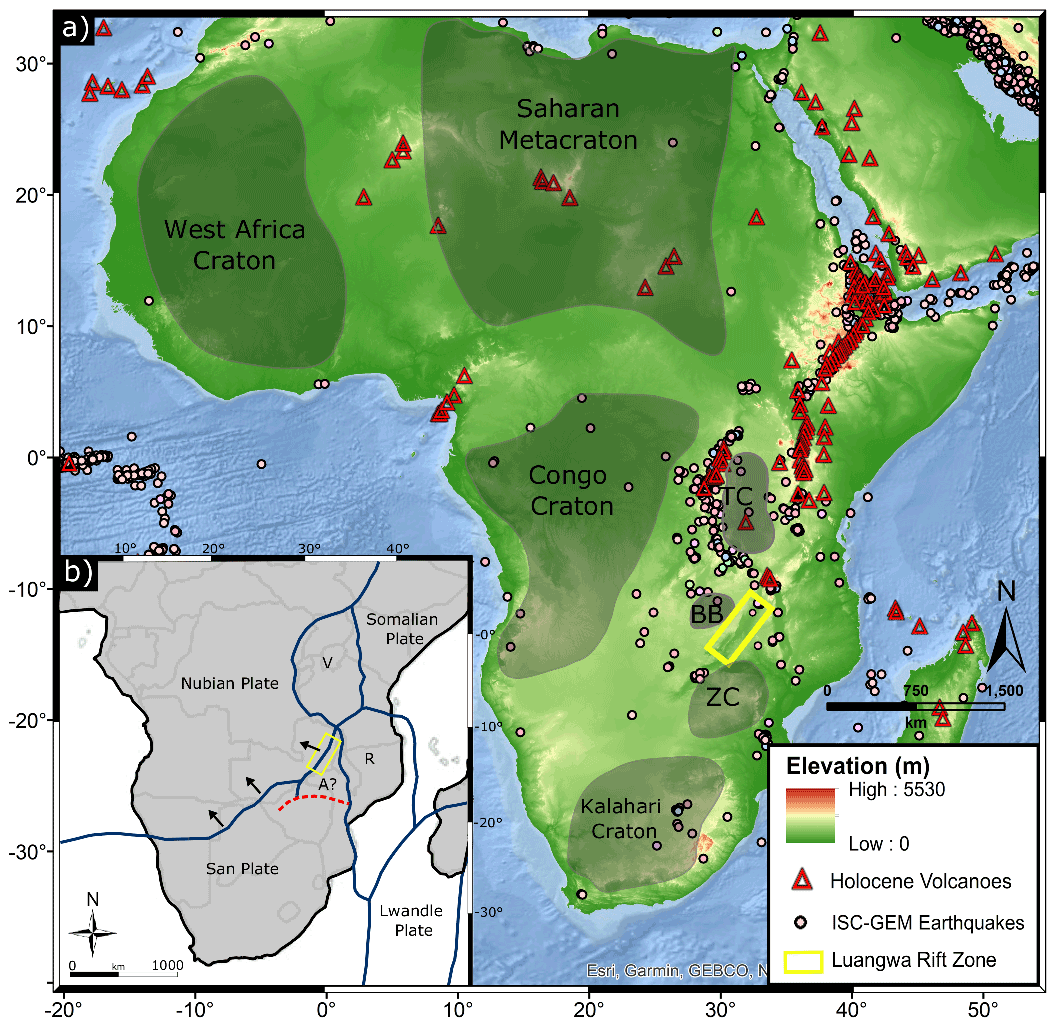
Figure 1The seismicity, volcanism, and plate boundaries of the EARS. (a) Seismotectonic map that highlights the topography of the African continent, the locations of Archean cratons (adapted from Gubanov and Mooney, 2009), and the prevalence of earthquakes in the Proterozoic belts surrounding the cratons. TC – Tanzania Craton, ZC – Zimbabwe Craton, BB – Bangweulu Block. Holocene active volcanoes are represented by red triangles and earthquake epicentres by circles from the ISC-GEM catalogue. The Luangwa Rift is highlighted in yellow. (b) Plate configuration of southern Africa including the Victoria (V), Rovuma (R), Lwandle, and San microplates (Calais et al., 2006; Stamps et al., 2008; Wedmore et al., 2021) and the model proposed by Daly et al. (2020) where the Angoni microplate (A) is separate from San. The black arrows are vectors of the Nubian plate with respect to San, which are fault- and earthquake-defined (Daly et al., 2020).
Identifying active faults in a region can reveal new insights into the seismotectonics of a region of active deformation. In southern Africa, this is important as there is debate over (1) the potential magnitude of future earthquake events given that faults may rupture completely or in segments (Jackson and Blenkinsop, 1997; Hodge et al., 2018) and (2) why the continent is rifting given that tectonic forces are not thought to be sufficient to overcome the strength of the lithosphere (Kendall and Lithgow-Bertelloni, 2016; Rajaonarison et al., 2021). Mapping faults, and the way in which they are segmented, is vital to addressing these debates. Firstly, the distribution of faults at the surface of the Earth can reveal the strength of the underlying lithosphere (Buck, 1991; Brun, 1999), and secondly fault segment boundaries may act as barriers to earthquake rupture (Aki, 1984; DuRoss et al., 2016). Thus, we develop the Luangwa Rift Active Fault Database (LRAFD), following the framework of the Global Active Fault Database (Styron and Pagani, 2020) and the Malawi Active Fault Database (Williams et al., 2022). We use the Shuttle Radar Topography Mission (SRTM; Farr et al., 2007) digital elevation model (DEM) alongside geological maps and previously published analyses to study the tectonic geomorphology of the Luangwa Rift. Based on the discovery of steep fault scarps that offset Quaternary fluvial and alluvial sediments, as well as incised river valleys, we identify 18 active faults. We then estimate the seismic source properties of these faults using empirical scaling laws (Leonard, 2010). We use the high-resolution geomorphology of the fault scarps to identify evidence for fault segmentation and/or multiple earthquakes (Hodge et al., 2019, 2020). The LRAFD is fully open source and thus available for researchers and practitioners to implement within future regional fault databases and probabilistic seismic hazard analyses (PSHAs). By using remote sensing to identify active faults, the outcomes of this research provide targets for future ground-based studies of active tectonics in the Luangwa Rift.
The southwestern branch of the East African Rift System (EARS) bifurcates from the western branch of the EARS in Tanzania and runs through Zambia, Botswana, and into Namibia (Fig. 1; Fairhead and Girdler, 1969; Reeves, 1972; Scholz et al., 1976; Fairhead and Henderson, 1977; Daly et al., 2020; Wedmore et al., 2021). The Luangwa Rift is situated in northeastern Zambia at the northern end of the southwestern branch of the EARS (Figs. 1 and 2) and forms the eastern margin of the Central African Plateau (Daly et al., 2020). It remains unclear whether the onset of rifting along the southwestern branch of the EARS is contemporaneous with the Oligocene initiation of rifting along the western branch of the EARS (∼ 25 Ma; Roberts et al., 2012). Apatite fission track thermochronometry data from the southwestern branch suggest a period of regional cooling between 38–22 Ma (Daly et al., 2020). However, Daly et al. (2020) suggest that rifting along the southwestern branch initiated in the Pliocene (5–3 Ma) at the same time as a period of regional uplift that formed the Central African Plateau.

Figure 2The Luangwa Rift and the intersection between southwestern and western branches of the EARS showing major faults. (a) The faults in the LRAFD are shown with red lines, the Malawi Active Fault Database (MAFD) active fault traces are shown with blue lines (Williams et al., 2022), and other active border faults are outlined in black (Chorowicz, 2005). (b) Seismicity (Mw>5.2 from the ISC-GEM catalogue), crustal thickness (from receiver function measurements; Sun et al., 2021), and the location of major lithospheric-scale shear zones beneath the Luangwa Rift (adapted from Daly et al., 1989; Johnson et al., 2006; Alessio et al., 2019).
The Luangwa Rift was active during the Permian–Jurassic breakup of Gondwana (Daly et al., 1989; Banks et al., 1995; Matende et al., 2021) and during the Cretaceous (Daly et al., 2020). Up to 8000 m of Permian–Triassic (i.e. Karoo period in southern Africa) mainly clastic sediments are unconformably capped by finer-grained post-Karoo deposits (Banks et al., 1995). Although now an amagmatic rift, the Karoo phase of rifting was concomitant with the emplacement of diamond-bearing lamproites, suggesting that this was possibly a rare example of rifting of thick (180–200 km), cold (≤ 42 mW m−2) cratonic lithosphere (Ngwenya and Tappe, 2021). The basin also experienced folding during the Late Jurassic–Early Cretaceous (Banks et al., 1995). The post-Karoo deposits are up to 500 m thick at the northern end of the Rift, and in the southern part of the Rift, the upper- and post-Karoo sediments are indistinguishable in seismic reflection data (Banks et al., 1995). Negative shear wave velocity (Vs) anomalies observed in the top few kilometres beneath the southern Luangwa Rift are suggestive of loose sediments (Wang et al., 2019) and are similar to the low Vs anomalies observed beneath the Malawi Rift, which has up to 5.5 km of syn-rift sediments from the current post-Miocene phase of rifting in East Africa (Wang et al., 2019; Scholz et al., 2020).
The Luangwa Rift is 130 km wide and 500 km long, with two main escarpments that are greater than 1 km high (Fig. 2). The orientation of the rift follows the surface trace of the Mwembeshi shear zone (also referred to as the Mwembeshi dislocation zone; de Swardt et al., 1965), a lithospheric-scale structure that may have reactivated along a suture between the Irumide and southern Irumide orogenic belts and which accommodated ENE–WSW dextral displacement during the late Proterozoic (Daly et al., 1989; Sarafian et al., 2018; Alessio et al., 2019). Little is known about the lithology of the Mwembeshi shear zone as it is largely obscured by the sediments in the Luangwa Rift, other than that it displays a NE-trending magnetic fabric and contains eclogite (i.e. mafic) intrusives (Vrána et al., 1975; Sarafian et al., 2018). The Nyamadzi shear zone is a splay of the Mwembeshi shear zone and is comprised of planar, vertically dipping fabrics within a wide variety of lithologies including ultramylonitic granites, highly deformed quartzites, and mafic igneous gabbros and amphibolites (Johnson et al., 2006).
Daly et al. (2020) found evidence that shows that the Luangwa Rift has been active during the Quaternary, whereas others suggest that rifting ceased in the Mesozoic (Banks et al., 1995; Matende et al., 2021; Sun et al., 2021). The rift is hosted in 150–160 km thick lithosphere (Priestley et al., 2018), with a crustal thickness of 41–45 km (Sun et al., 2021), and seismicity occurs down to 29 km (Craig et al., 2011; Craig and Jackson, 2021). Tectonic plate modelling of southern Africa suggests that the Luangwa Rift accommodates 0.7 ± 0.3 mm yr−1 of extension between the San and Nubian plates along an azimuth of 108∘ (Wedmore et al., 2021), and historical earthquake data show Mw 6.7 and Mw 6.5 earthquake events occurring in 1919 and 1940 (International Seismological Centre, 2021, NEIC National Earthquake Information Center; USGS, 2017). However, there has been no prior systematic attempt to document the active faults within the Luangwa Rift and characterise their geomorphic attributes.
3.1 Compiling the Luangwa Rift Active Fault Database (LRAFD)
3.1.1 Mapping faults
We use a 30 m (1 arcsec) Shuttle Radar Topography Mission (SRTM; Farr et al., 2007) digital elevation model (DEM) to map the active faults in the Luangwa Rift, which has an absolute height error (90 %) of 5.6 m in Africa (Rodriguez et al., 2005). SRTM data have been successfully used for remote investigation and mapping of active faults in southern Africa (Kinabo et al., 2007; McCarthy, 2013; Laõ-Dávila et al., 2015) and are available for free with global coverage. We georeferenced a 1:1 000 000 scale geological map of Zambia (Priday and Camps, 1960) and used this alongside previous academic publications and the topographic data to identify active faults. We combined these resources with Google Earth imagery to correlate each fault in a range of different datasets.
Active faults in the LRAFD are defined as having a high likelihood of producing significant seismicity under the current tectonic regime (Styron and Pagani, 2020). We make this assessment based on whether the faults display evidence of offsetting Quaternary sediments in the Luangwa basin as it is not clear how long the current tectonic regime along the southwestern branch of the EARS has been active (see discussion above). Although Quaternary sedimentation in the Luangwa Rift is minimal compared to Karoo sediments (Dixey, 1937; Utting, 1988; Bishop et al., 2016), exploratory petroleum cores and cosmogenic dates from archaeological surveys identified 40 m of sediment that has been age to the Quaternary (Barham et al., 2011), which is of comparable thickness to the juvenile southern Malawi Rift (Wedmore et al., 2020b). We identified steep scarps that offset these Quaternary sediments, which demonstrates evidence of recent fault activity. Although Daly et al. (2020) suggest that these steep scarps are <10 kyr in age, this is not based on any definitive geochronology, so we prefer the term “Quaternary” for the age of these scarps.
We use the following criteria as indicators of active Quaternary faulting: (i) prominent, steep (20–30∘) linear scarps at the base of the footwall escarpments offsetting Quaternary sediments; (ii) evidence of footwall uplift in river channels such as river gradient steepening, channel narrowing, or knickpoints in the footwall of mapped faults; and (iii) other linearly aligned, vertically offset geomorphological sedimentary features such as alluvial fans or landslide deposits. These criteria were linked to active faulting in southern Africa by Jackson and Blenkinsop (1997) and have since been used in recent studies in southern Malawi (Hodge et al., 2018; Wedmore et al., 2020a, b; Williams et al., 2021, 2022). The criteria were assessed by looking at the DEM and geologic maps and by calculating derived products including slope and hillshade maps from the SRTM data. Care was taken to ensure that linear features that represent less erodible metamorphic bands within the foliated basement rock, which are often seen in southern Africa, were not incorrectly identified as active faults. By looking for similar topographic gradients either side of the fault, slope maps were particularly useful to ensure that on offset sedimentary landforms, the same geomorphic units were present on either side of the fault.
3.1.2 Active fault database attributes
The structure and approach of the LRAFD follows the Global Earthquake Model (GEM) Global Active Faults Database (GEM-GAFD; Styron and Pagani, 2020). The GEM-GAFD aims to compile attributes relevant to a fault’s potential to create an earthquake in a simple structure that contains all information necessary for probabilistic seismic hazard analysis (Christophersen et al., 2015; Styron and Pagani, 2020). Each fault trace is represented by a single feature with a suite of associated attributes within a geographic information system (GIS). Attributes for the LRAFD were selected from the GEM-GAFD (Styron and Pagani, 2020, their Table 1) with the purpose of describing a fault's topographic expression and activity confidence (e.g. Styron and Pagani, 2020; Williams et al., 2021, 2022). We do not use all attributes listed in the GEM-GAFD as some are not relevant in this study (e.g. shortening rate), and others (e.g. slip rate, recurrence interval) require analysis (e.g. palaeoseismology), which cannot be acquired remotely.
Table 1The Luangwa Rift Active Fault Database attributes. The attributes are adapted from the Global Earthquake Model Global Active Faults Database (Styron and Pagani, 2020).
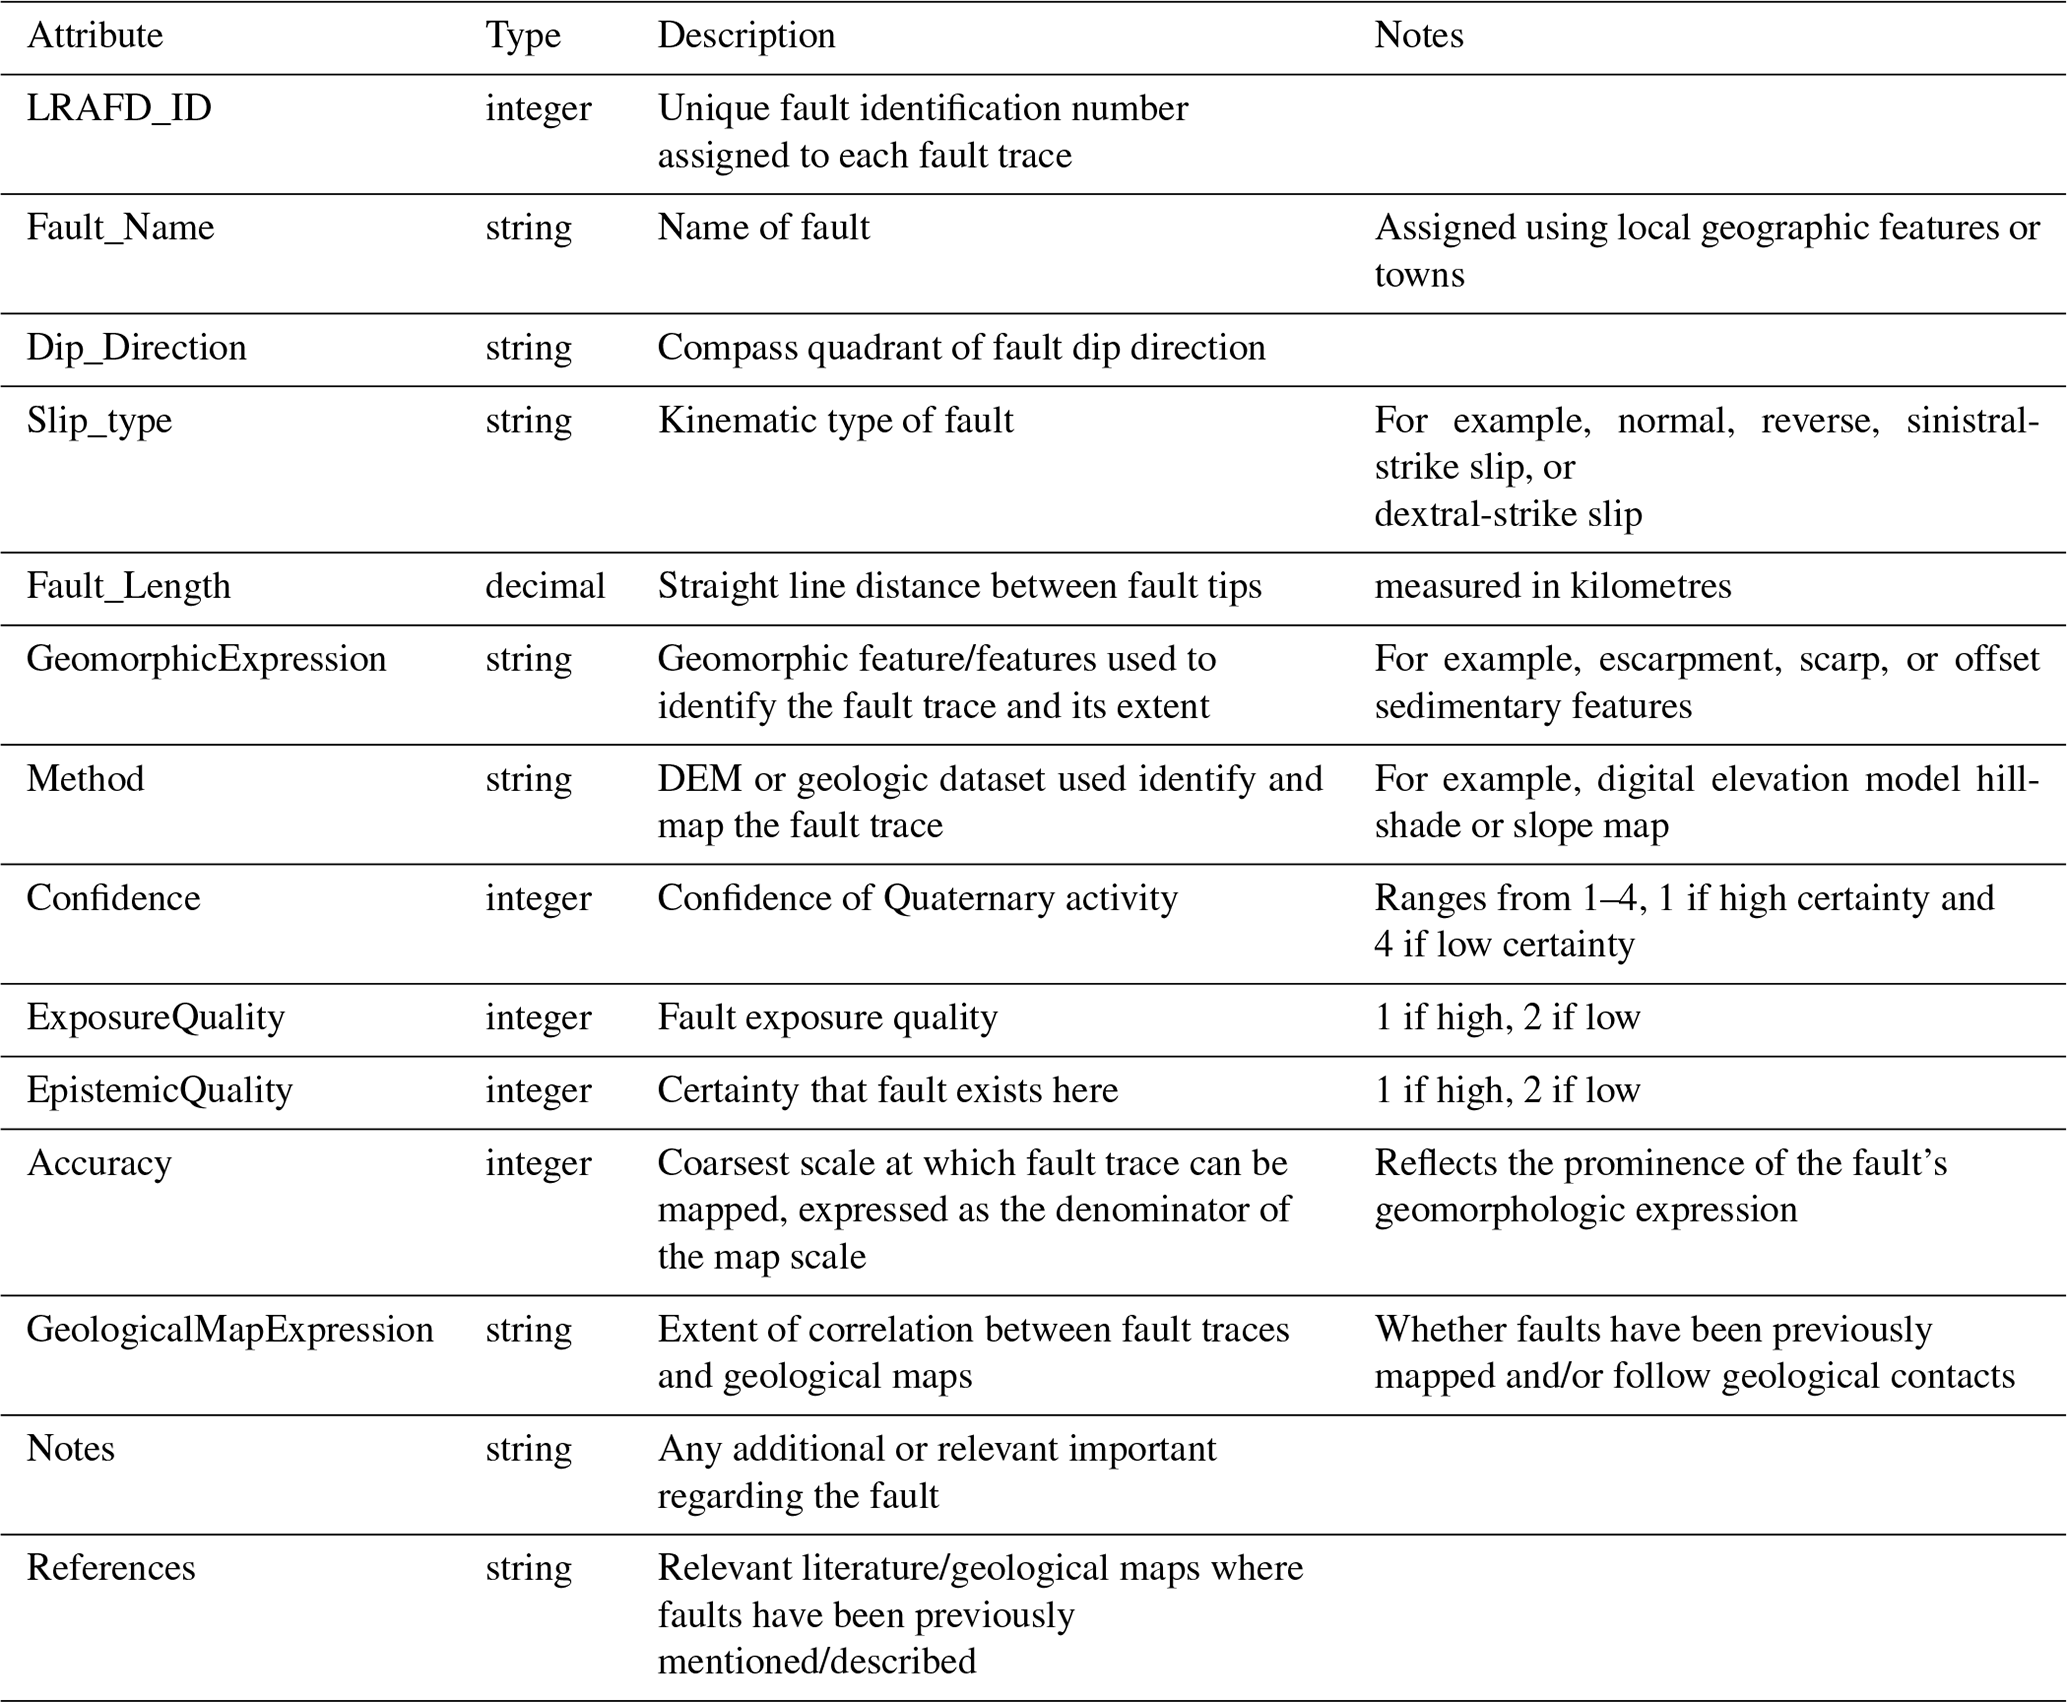
Table 1 lists the attributes of the LRAFD, information about the type of data each attribute represents, and how these attributes are determined. A fault trace represents where a fault is interpreted to have ruptured the ground surface, with each fault represented by a unique numerical ID. “Geomorphic expression” describes the fault trace morphology and the main piece of evidence used to map the fault (Christophersen et al., 2015), and “method” distinguishes the dataset used to map each trace. Fault traces more than 5 km apart are mapped as separate features, as these earthquakes are less likely to be able to breach a gap this big (Wesnousky, 2006, 2008). Although some faults may be one continuous structure at depth, we only joined these structures where evidence of linkage is visible at the surface. Consequently, the database includes both discrete faults and sets of features that may be one fault at depth but which we have recognised as separate traces based on their surface expression. Exposure and epistemic quality variables are represented by numeric rankings of 1–2. Lower values (1) indicate a high quality of exposure and confidence of faulting. A value of 2 represents a lack of strong fault exposure and reduced certainty that a fault exists. There might be strong evidence for an exposed feature on the landscape but little confidence that it is a fault (exposure quality = 1, epistemic quality = 2). Conversely, a fault may have a high confidence of activity but little exposure or representation on the topography (epistemic quality = 1, exposure quality = 2). Activity confidence is assigned numerically from 1–4: 1 for high confidence and likelihood of recent activity, 4 suggesting the fault shows only weak evidence of activity. Although multiple variables are used to deduce activity confidence, including exposure quality, epistemic quality, and the number of indicators of active faulting, the assigned value remains subjective.
Some mapped faults show limited evidence of recent surface activity, but we include these faults in our database if they strike between NNE–SSW and ENE–WSW, which means they would be favourably oriented for reactivation given the SE–NW extension direction inferred from focal mechanisms (Delvaux and Barth, 2010) and geodetic models of the motion between the San and Nubian plates (Wedmore et al., 2021), assuming a moderate fault dip (following Williams et al., 2022). Some major topographical structures may represent inactive faults, and therefore, some inactive faults may be included in the LRAFD. As with any active fault database, bias towards inclusiveness reduces the likelihood that potentially active faults are missed (Styron et al., 2020), but complete mapping of all existing active faults is unlikely, and large earthquake events may occur on unmapped faults.
3.1.3 LRAFD availability and data format
The LRAFD is a freely available open-source geospatial database containing a collection of active fault traces and associated attributes in a GIS vector format issued under a Creative Commons (CC-BY-4.0) license. Version 1.0 of the database has been released on the GitHub and the Zenodo data archive: https://doi.org/10.5281/zenodo.6513691. Following the principles outlined in the GEM-GAFD, it is intended that this database will be updated in the future as and when new data become available to update the attributes associated with the LRAFD and the number of faults in the database. Changes will be made through the GitHub page (https://github.com/LukeWedmore/luangwa_rift_active_fault_database), and future versions of the database will be released simultaneously on GitHub and Zenodo when substantial updates to the database are made. The fault database was constructed within ArcGIS; however, we have saved the database in several different file formats to aid compatibility with different software and seismic hazard codes. The version of record is the GeoJSON format, which is a plain-text version that can be subject to Git version control and is directly compatible with the GEM-GAFD. It is intended that any updates to the LRAFD should be submitted as changes to the GeoJSON file. Other versions of the database are also included on Zenodo and GitHub in ESRI shapefile, GeoPackage, KML, and GMT formats, as well as the conversion script.
3.2 Seismogenic sources in the Luangwa Rift
3.2.1 Earthquake fault scaling relationships
Estimates of potential earthquake magnitudes are useful for comparing with historical events and for converting mapped faults into sources for seismic hazard assessment (DISS Working Group, 2021; Williams et al., 2021, 2022). However, these estimates are often subjective and more liable to change than the objective observational data stored in an active fault database. Therefore, we store these subjective estimates separately from the LRAFD, following other similar studies (Faure Walker et al., 2021; Williams et al., 2021). We use empirical scaling relationships based on fault length (L) to estimate earthquake magnitude (Mw), average surface displacement (Dav), and fault rupture width (W), based on the equations for dip-slip faulting in Leonard (2010). We also calculate the rupture depth extent (RDE), which we define as the maximum depth to which the rupture can extend downwards, measured from the top of the rupture (i.e. it can occur anywhere in the crust). These parameters are calculated using the following equations:
where δ is fault dip, and a and b are empirically derived constants from Leonard (2010). We propagate uncertainties in b (no uncertainties are provided for a values) and a range of δ (45, 53, and 65∘) through our calculations. We do not consider multi-fault or segmented ruptures, and hence this modelling assumes that seismicity along faults in the Luangwa Rift resembles the characteristic earthquake model (Schwartz and Coppersmith, 1984).
3.2.2 Earthquake recurrence intervals and fault scarps
We use the “systems-based” approach outlined in Williams et al. (2021) to derive the recurrence interval and slip rates of the two main border faults in the Luangwa Rift because no palaeoseismic or slip rate studies have been conducted in the region. We only apply the systems-based method to the two broader faults as these faults do not have any other faults across-strike for most of their length. Therefore, it is reasonable to assume, as a first-order estimate, that they take up all of the geodetically measured extension rate in this region. In addition, as the other faults in the LRAFD have a more complex across-strike distribution, we do not attempt to determine a first-order estimate of their slip rates or earthquake recurrence intervals. Recurrence interval (R) is calculated using the following equation:
where Dav is the average displacement (calculated using Eq. 2), and S is the slip rate, which is calculated using the following equation:
where θ is the fault slip azimuth, δ is the fault dip, and V and ϕ are the horizontal rift extension rate and azimuth. The uncertainties associated with v, δ, and Dav are propagated through a logic tree (Fig. 3) to calculate lower, intermediate, and upper estimates of R. We assume all horizontal extension is accommodated as pure dip-slip motion oriented parallel to the regional extension direction and thus do not apply uncertainties to θ and ϕ. Although Eq. (6) raises an apparent inconsistency between faults that are both accommodating dip-slip and oblique to the regional extension direction, this can be explained by local strain reorientations around faults rooted in deeper-seated weaknesses (Philippon et al., 2015; Williams et al., 2019) and which may be applicable to the Luangwa Rift given that it follows the Mwembeshi shear zone (Sect. 2). We also assume that these border faults accommodate all of the regional extension rate, and thus unlike Williams et al. (2021), we do not weight V or divide it between different faults. This is explored in more detail in the discussion.
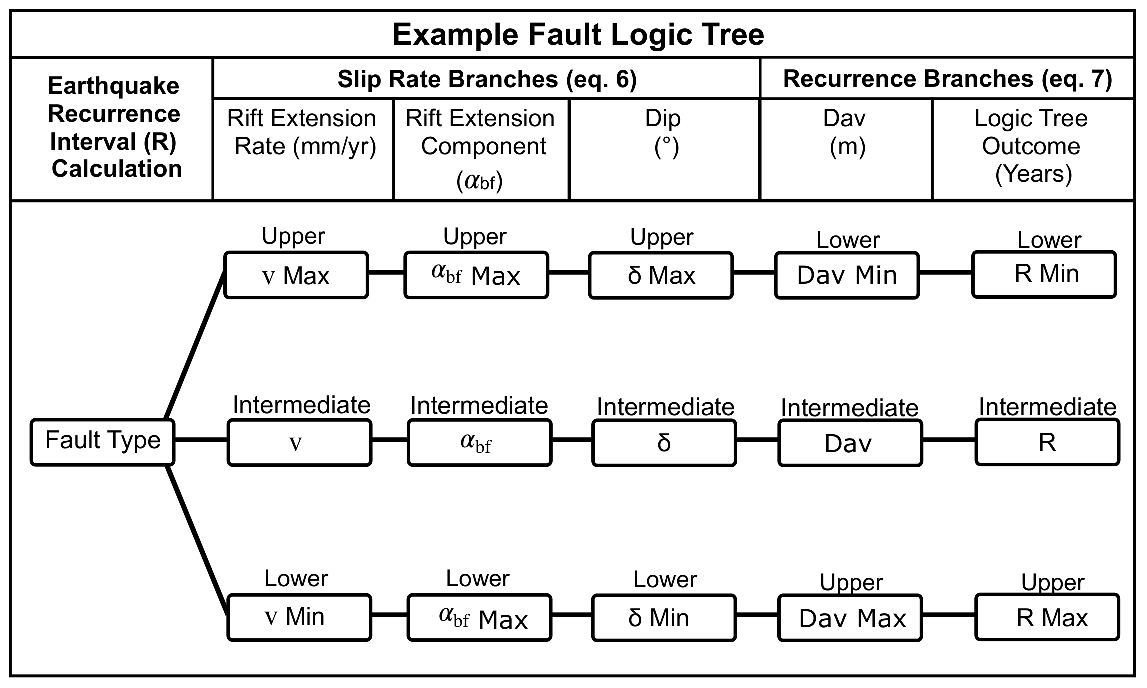
Figure 3Logic tree used to calculate recurrence intervals for the Chipola and Molaza faults (adapted from Williams et al., 2021). Lower, intermediate, and upper estimates of fault dip, displacement, and horizontal rift extension rate are used, but we do not apply weightings to the component of rift extension rate taken up by the rift border fault (αbf=1) as there are insufficient constraints on the strain accommodation of border and intra-rift faults in the Luangwa Rift.
3.2.3 Fault segmentation
In the East African Rift, where faults reactivate pre-existing structures, local minima in displacement profiles have been shown be a useful indicator of fault segment boundaries as faults have been suggested to rupture through bends that are often considered geometrical criteria of segmentation (Hodge et al., 2018; Wedmore et al., 2020a). We measured the height of the Quaternary fault scarp for the four faults in the Luangwa Rift with the highest activity confidence (Chipola, Molaza, Kabungo, and Chitembo) to identify minima in the along-strike displacement profile that indicate fault segment boundaries. Selecting sites for measuring displacement caused by earthquakes across faults is best performed by careful assessment of local geomorphology in the field (e.g. Delvaux et al., 2012; Bubeck et al., 2015). This was not possible in this study as the Covid19 pandemic restricted travel. Instead, we used SRTM data to measure the displacement across the faults, which enabled us to take multiple measurements across a large geographic area in a national park that is not always accessible for fieldwork. We extracted topographic profiles every 30 m oriented perpendicular to the local strike of the fault. As local fault morphology can influence the calculated scarp height (Delvaux et al., 2012), we stacked the profiles at 120 m intervals along strike to filter short-wavelength topographic features such as vegetation or human structures that are unrelated to active faulting. Profiles were then visually inspected, for a clear scarp, with footwall and hanging wall slopes above and below the scarp of approximately the same angle. The scarp heights of profiles that passed our visual inspection were measured following the approach of Wedmore et al. (2020b), which includes inbuilt Monte Carlo sampling of random subsets of the footwall and hanging wall slopes to prevent small-scale local morphological disturbances affecting the calculated scarp height. Verification with detailed field measurements was not possible during this study because of travel restrictions during the Covid19 pandemic, but these methods have previously been used and verified in southern Malawi, which has a similar tectonic setting and terrain (Wedmore et al., 2020a, b). We also investigated whether individual topographic profiles showed evidence of multiple earthquakes such as composite scarps and slope breaks (Zhang et al., 1991; Hodge et al., 2020). Furthermore, we assessed histograms of scarp height measurements and looked for bi-modal and multimodal distributions that may suggest the presence of multiple events preserved in the landscape.
4.1 Active faults and the Luangwa Rift Active Fault Database
The Luangwa Rift Active Fault Database (LRAFD) contains 18 active faults (Table 2; Fig. 4). In Fig. 5 we use the Chipola Fault to illustrate how we compiled evidence of activity in the LRAFD. The 207 km long Chipola Fault is the longest fault in the Luangwa Rift and forms the western border fault of the rift basin. The Chipola escarpment and fault scarp are clear even at coarse (1:400 000) scale using the DEM, slope, and hillshade maps (Fig. 5a–c). The northern end of the fault follows the Karoo–Basement contact (Fig. 4c), and a scarp that offsets Quaternary sediments correlates with the mapped faults in the geological maps. The steep scarp (26∘) occurs at the base of an abrupt elevation change (Fig. 5d) and has displaced Quaternary alluvial fan sediments (Fig. 5f). Incised rivers in the faults footwall also suggest recent uplift (Fig. 5e). Given this evidence, the Chipola Fault was assigned 1 for activity confidence, epistemic quality, and exposure quality.
Table 2Abridged version of the Luangwa Rift Active Fault Database (LRAFD). The full version of the database can be accessed at https://doi.org/10.5281/zenodo.6513691 (Wedmore et al., 2022). See Table 1 for a description of the attributes.

The criteria and indicators listed in Table 1 and described for the Chipola Fault above were applied throughout the Luangwa Rift to create the LRAFD. Faults with a similar strength of evidence to that of the Chipola Fault are also mapped with the highest confidence (e.g. the Molaza and Kabungo faults; Figs. 6 and 7). Scarps and escarpments are prominent on the DEM and Google Earth (e.g. Figs. 5a and 7c), and slope maps highlight steep (>20∘) fault scarps that have formed at the base of many of the escarpments (Figs. 5b, f, 6, 7b, and d). Figures 5–7 show slope maps of the Chipola, Mkumpa, and Molaza faults, highlighting the steep scarps, with the most prominent (steepest) scarp observed along the Molaza Fault (Fig. 6b). Within the Luangwa Rift, these faults show the clearest evidence of offset Quaternary sediments and sedimentary features such as alluvial fans (e.g. Fig. 7d–e), indicating recent fault activity and rupture events. We also observed river incision and channel steepening in the footwall of the Mukopa, Chitumbi, Kapampa, Chipola, and Molaza faults (e.g. Fig. 6c).
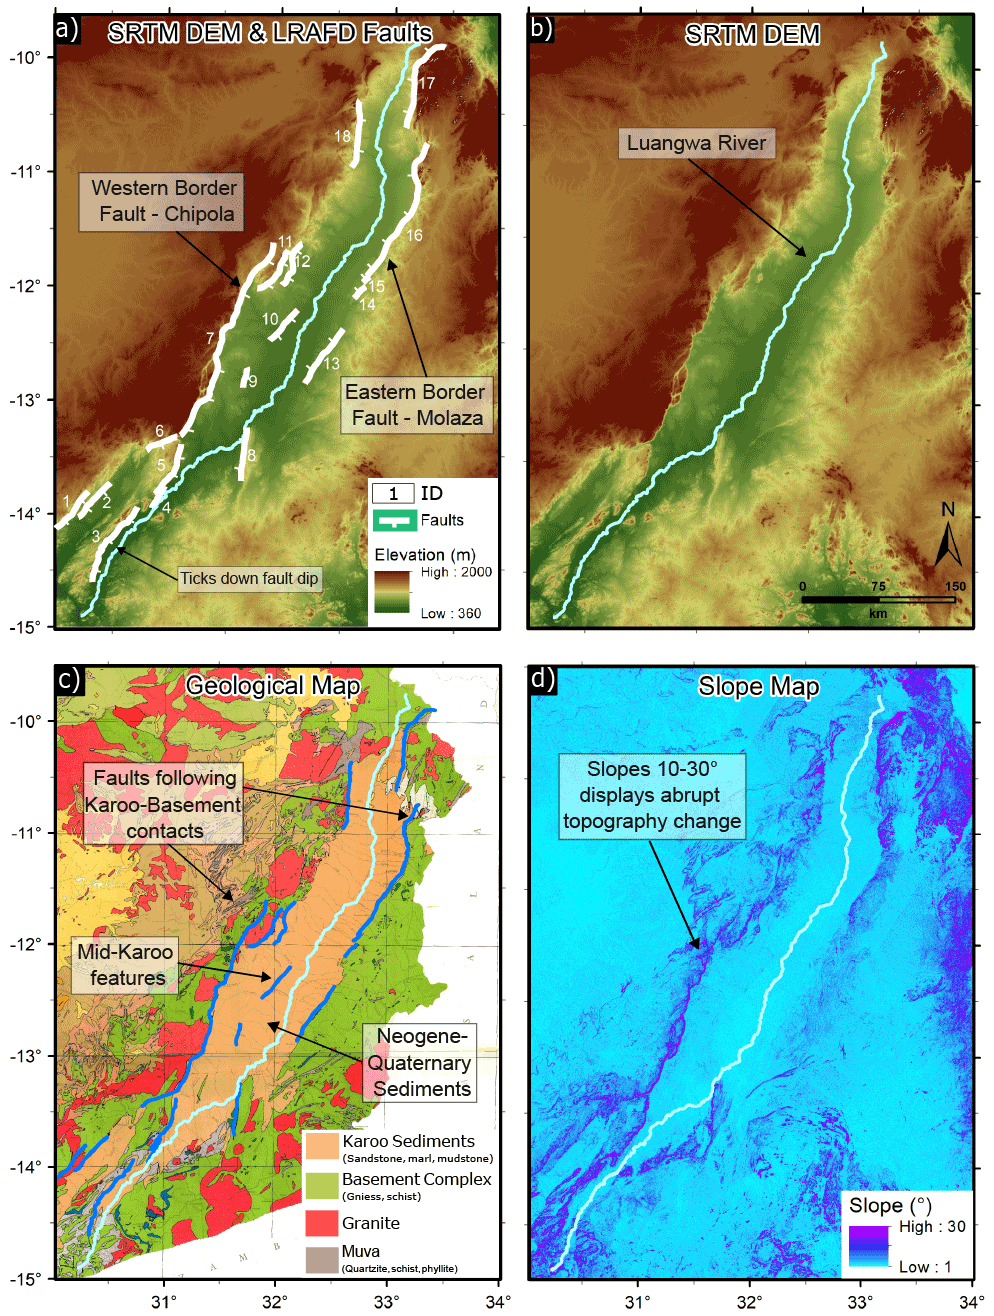
Figure 4Topography and geology of the Luangwa Rift. Each figure represents a different technique used to map fault traces, denoted in the methods attribute of the LRAFD. (a) SRTM DEM of the rift with the 18 fault traces shown in red; the dip direction of each fault is indicated with the dash direction. (b) SRTM DEM without the fault traces. (c) Georeferenced geological map of the Luangwa Rift (adapted from Priday and Camps, 1960) overlain with fault traces in blue. Karoo sediments are overlain by Neogene–Quaternary sediments, not represented on the map (Utting, 1988; Banks et al., 1995; Bishop et al., 2016). Faults predominantly follow contacts between Karoo sediments and Basement complex, representing zones of weakness. (d) Slope map of the rift where increased slope values correspond to the steep fault scarps which were used to map traces.
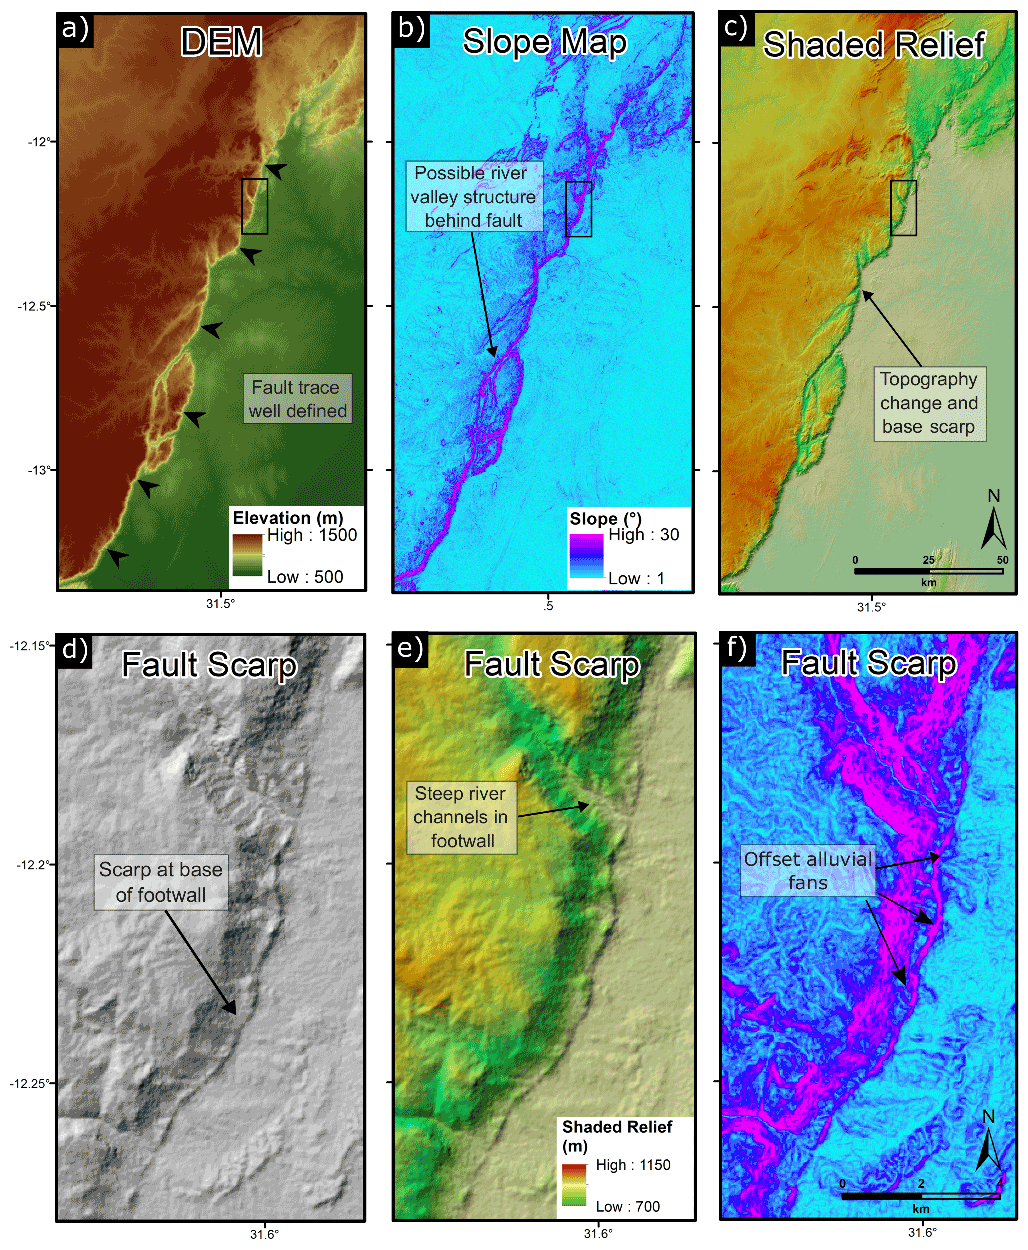
Figure 5The Chipola Fault. (a–c) Overview of the Chipola Fault shown in the DEM; slope and shaded relief maps adapted from SRTM data (Farr et al., 2007). The fault is notable for the steep (25–30∘) fault scarp at the base of the ∼ 1000 m high escarpment. (d–f) Hillshade, shaded relief, and slope maps showing a zoomed-in section of the Chipola Fault indicating the Quaternary fault scarp that has formed at the base of the escarpment and that has offset alluvial fan deposits.
Overall, 10 faults had exposure quality scores of 1, indicating they are well exposed, whereas 8 faults scored 2, meaning they lacked a strong exposure. Epistemic quality presented 13 traces as high certainty of activity and 5 as low. Activity confidence was assigned after taking a holistic view of each trace and its likelihood of recent activity. There are six faults with the strongest confidence value (1; Chitumbi, Chipola south, Chipola, Chitembo, Kabungo, and Molaza), and three faults are assigned 4 (Chipola west, Luwi, and Mwanya), thought to have a low likelihood of activity.
We found active faults along the length of the 600 km rift, with fault lengths varying between 9 and 207 km. The faults generally trend NE–SW, with some minor faults trending N–S (Fig. 4). Within the rift, the two longest faults, the Chipola Fault (207 km; Fig. 5) and the Molaza Fault (142 km; Fig. 6), both display evidence of well-preserved fault scarps and have the highest activity confidence (1) and exposure quality (1; Table 2). These faults are located at the edge of the rift and represent the western SE-dipping (Chipola Fault) and eastern NW-dipping (Molaza Fault) border faults of the rift (Fig. 4). These faults form sub-basins with the Luangwa Rift that differ in their properties. In the northern sub-basin, the Molaza Fault (Fig. 6) has only one other active fault within its hanging wall. At the southern end of the Molaza Fault there are two short (9 and 16 km long) faults in a stepover geometry (LRAFD_ID: 14 and 15; Fig. 4a), but the rest of the fault displays a relatively simple geometry with no evidence of splays. In the southern sub-basin, where the Chipola Fault is the border fault, there are up to three faults across strike (LRAFD_ID: 8–13; Fig. 4a) including two intra-rift faults in the centre of the rift (LRAFD_ID 9 and 10; Fig. 4a). In the hanging wall of the northern end of the Chipola Fault, there are two faults (LRAFD_ID: 11 and 12; Fig. 4a) in a stepover geometry that are directly across strike from the stepover faults at the southern end of the Molaza Fault. This zone of distributed faulting between the northern and southern sub-basins of the Luangwa Rift is a common observation in other rift transfer sections in the EARS (Scholz et al., 2020; Kolawole et al., 2021).
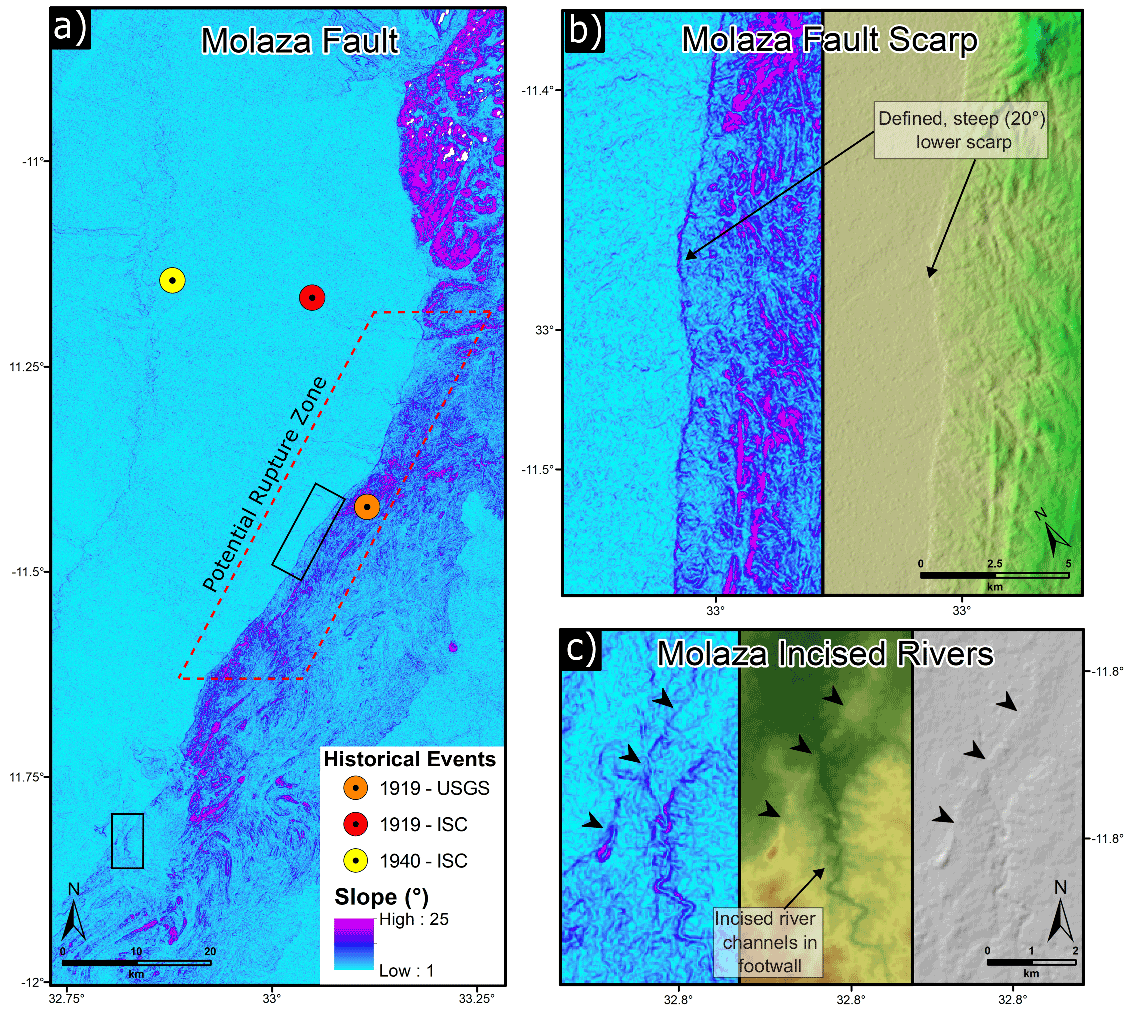
Figure 6Evidence of Quaternary activity along the Molaza Fault. (a) Slope map of the Molaza Fault overlaid with different estimates of the epicentre of two major 20th century earthquakes that occurred within the rift on 1 May 1919 (M 6.7) and 1940 (Mw 6.3). The source depth for both events is essentially unknown (quoted as 15 km depth in both catalogues). Both epicentres coincide with a portion of the fault where the Quaternary scarp is consistently preserved (b). Further evidence of activity is provided by steeply incised rivers in the footwall of the fault (c).
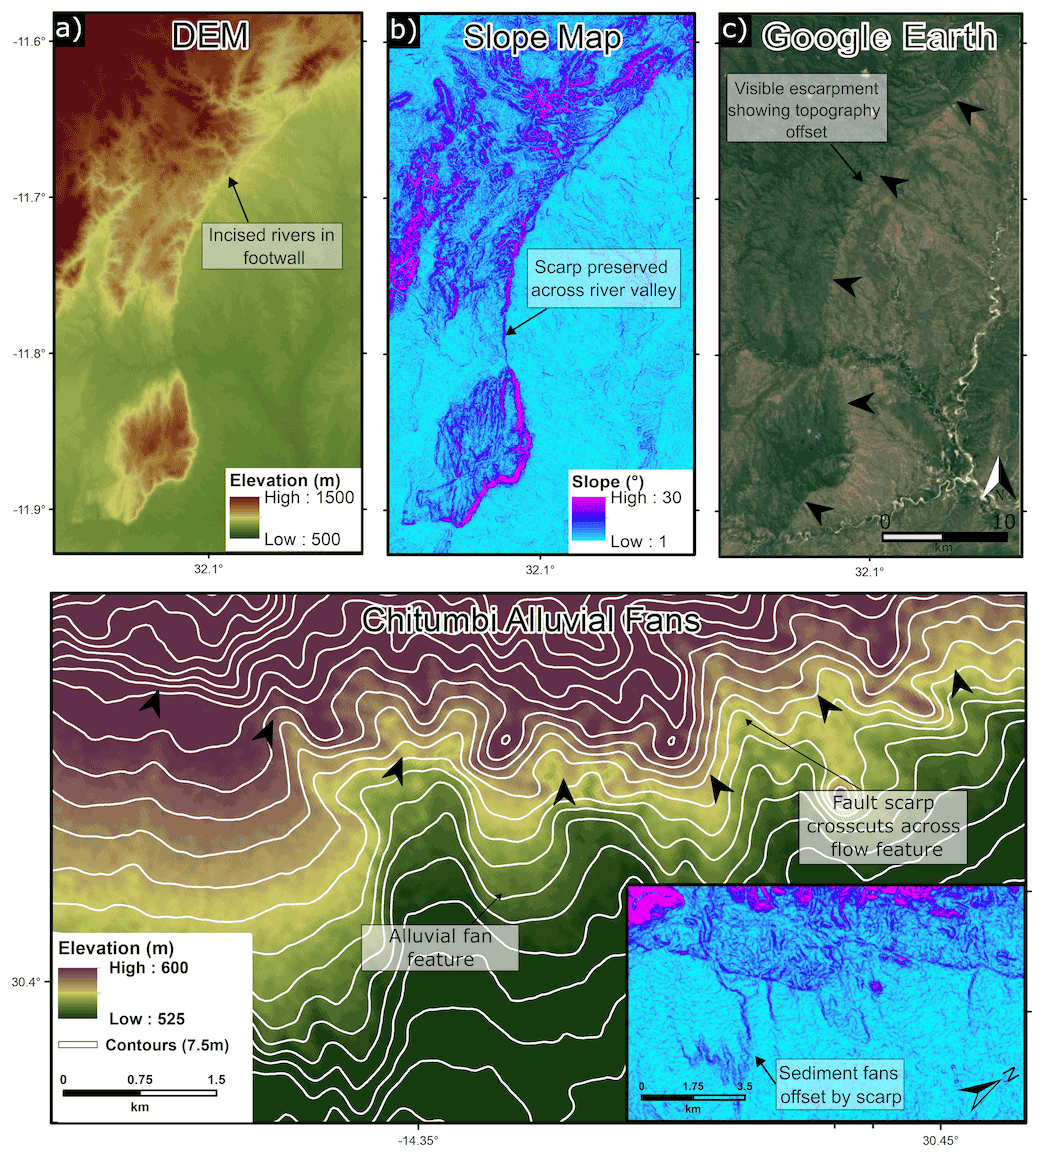
Figure 7Example of active fault indicators on the Kabungo Fault. (a–c) Slope, DEM, and Google earth maps (© Google Earth) show the pronounced Kabungo fault escarpment, with a steep (30∘) scarp. The scarp is preserved across the river channel, indicating a recent offset such that the channel has not had time to fully respond after uplift. (d) Contour map of alluvial fans offset by the Chitumbi Fault (slope map of the same area is inset).
4.2 Seismic source properties
Using the fault scaling laws set out in Leonard (2010), we derived earthquake source parameters including average fault displacement (Dav), down-dip fault rupture width (W), fault rupture depth extent (RDE), and moment magnitude (Mw; Table 3). Dav varies between m on the Molaza-2 Fault and m on the Chipola Fault. Predicted W values range from to km with RDEs of to km (Table 3). With these calculations, which assume a reasonable fault dip of 53∘, only the Chipola Fault produces a rupture depth extent that would exceed the crustal thickness of the region (∼45 km; Sun et al., 2021), and only the Chipola and Molaza faults produce a rupture depth that exceeds the maximum depth of seismicity recorded in the region (∼ 30 km; Craig et al., 2011; Craig and Jackson, 2021). Potential earthquake magnitudes for whole-fault ruptures average Mw 7.0 but vary between Mw 5.8 and 8.1 (Table 3; Fig. 8).
Table 3Seismogenic source properties for faults in the LRAFD, calculated using the fault scaling laws set out in Leonard (2010); https://doi.org/10.5281/zenodo.6513778 (Turner et al., 2022b). The length (L) of each fault is measured in a straight line between the two tips, estimated earthquake magnitude (Mw) from applying Eq. (1), displacement (Dav, m) using Eq. (2), width (W) calculated using Eq. (3), and rupture depth extent (RDE) using Eq. (4) and the intermediate dip value of 53∘. The uncertainties for each parameter are calculated by propagating the empirical uncertainties from Leonard (2010).

4.3 Recurrence intervals
Using Eqs. (5) and (6) with a logic tree approach (Fig. 3; adapted from Williams et al., 2021), we calculated lower, intermediate, and upper earthquake recurrence intervals (R) for the Chipola and Molaza faults (individual logic trees are shown in Supplement Figs. S1 and S2). We applied the rift extension rate (V) and azimuth (ϕ) values of 0.7 ± 0.2 mm yr−1 and 108∘ from Wedmore et al. (2021). Slip rates for the Chipola and Molaza faults are estimated at 0.4–1.7 and 0.4–1.6 mm yr−1, respectively. For whole fault ruptures along the Chipola Fault, our intermediate estimate for earthquake recurrence interval is 5000 years, with a lower estimate of 1500 years and upper estimate of 36 000 years. For the Molaza Fault the intermediate recurrence interval is estimated at 4000 years, with a lower bound of 700 years and upper bound of 28 500 years. The large uncertainties associated with these estimates represent the large epistemic uncertainties inherent when propagating uncertainties from empirical scaling relationships to fault recurrence estimates in the systems-based approach (Williams et al., 2021).
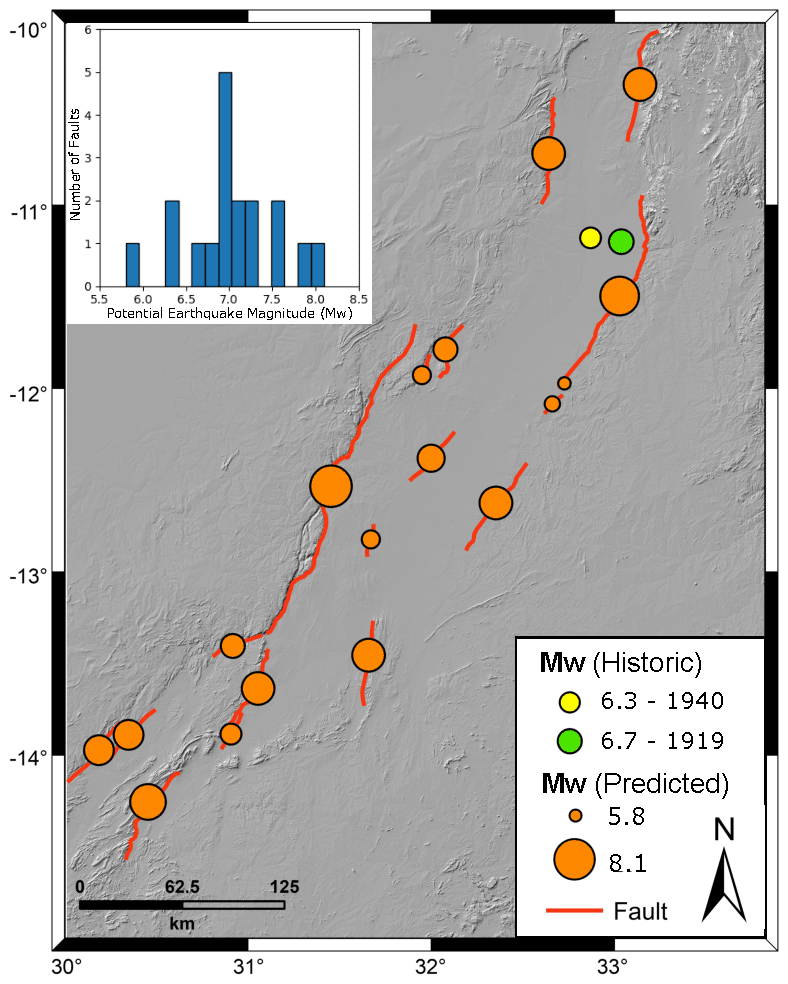
Figure 8Hillshade map of the Luangwa Rift showing estimated maximum earthquake magnitudes for each fault (orange circles) alongside previous recorded seismicity. Inset shows a histogram of maximum potential magnitudes (estimated using empirical relationships between fault length and earthquake magnitude), which range from Mw 5.8–8.1.
4.4 Fault segmentation and scarp heights
Example topographic profiles for the four faults with the highest confidence of activity (Chipola, Chitembo, Kabungo, and Molaza) are shown in Fig. 9, with the corresponding along-strike scarp height profiles in Fig. 10. The median scarp height of each fault ranged between 12.9 ± 0.4 (Molaza Fault) and 19.2 ± 0.9 m (Kabungo Fault; Figs. 7 and 10c). The minimum resolvable scarp heights that we are able to measure using the SRTM data are 2–3 m. However, the lower-resolution of SRTM (compared with TanDEM-X; see Wedmore et al., 2020b) meant that we were unable to identify clear fault segment boundaries. In the statistics quoted below, we have removed outliers from the data, which are values >2σ from the median scarp height.
The SE-dipping Chipola Fault borders the western side of the rift, with a 220 km long fault trace. The median height of the fault scarp is calculated to be 13.0 ± 0.4 m. The highest scarps are found towards the southwestern end of the fault, where the maximum scarp height was observed (28.4 ± 0.4 m). The histogram shows that most of the scarp height measurements are between 5 and 20 m (Fig. 10a), with the largest peak in the histogram occurring between 14 and 16 m. Smaller peaks are also present at 19 and 10 m.
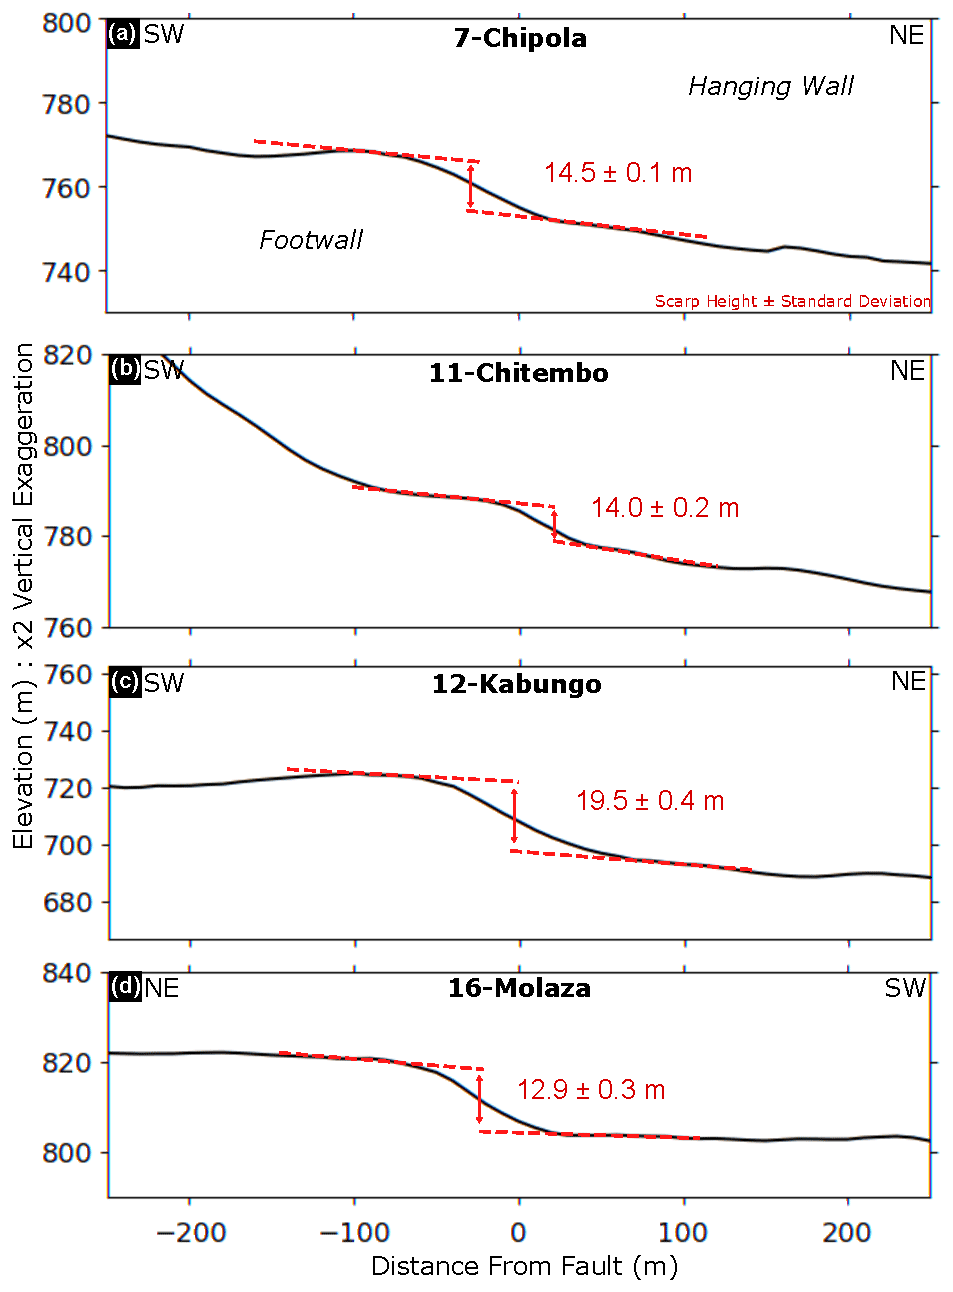
Figure 9Example topographic profiles measured across faults in the Luangwa Rift showing the Chipola (a), Chitembo (b), Kabungo (c), and Molaza (d) faults.
The Chitembo Fault trace is 48 km long and dips SE, and it is located 20 km east of Chipola's northern tip. The median scarp height is 14.0 ± 1.0 m, with a maximum height of 39.6 ± 0.2 m (Fig. 10b). The histogram of scarp heights peaks between 8–10 m, although there is a long tail to the distribution, with other minor peaks observed at 18–20 and 28–30 m.
The SE-dipping 45 km long Kabungo Fault, which is 15 km east of the Chitembo Fault has the highest median scarp height of the faults that we measured: 19.2 ± 0.9 m. The maximum scarp height is found to be 36.3 ± 0.1 m. The locations where high (>30 m) scarps were observed coincided with where slopes of were observed on the fault scarps, and where a clear change in topography was evident on Google Earth and in the DEM (Fig. 7). The histogram of scarp height measurements shows two distinct peaks at 8–10 and 20–22 m (Fig. 10c).
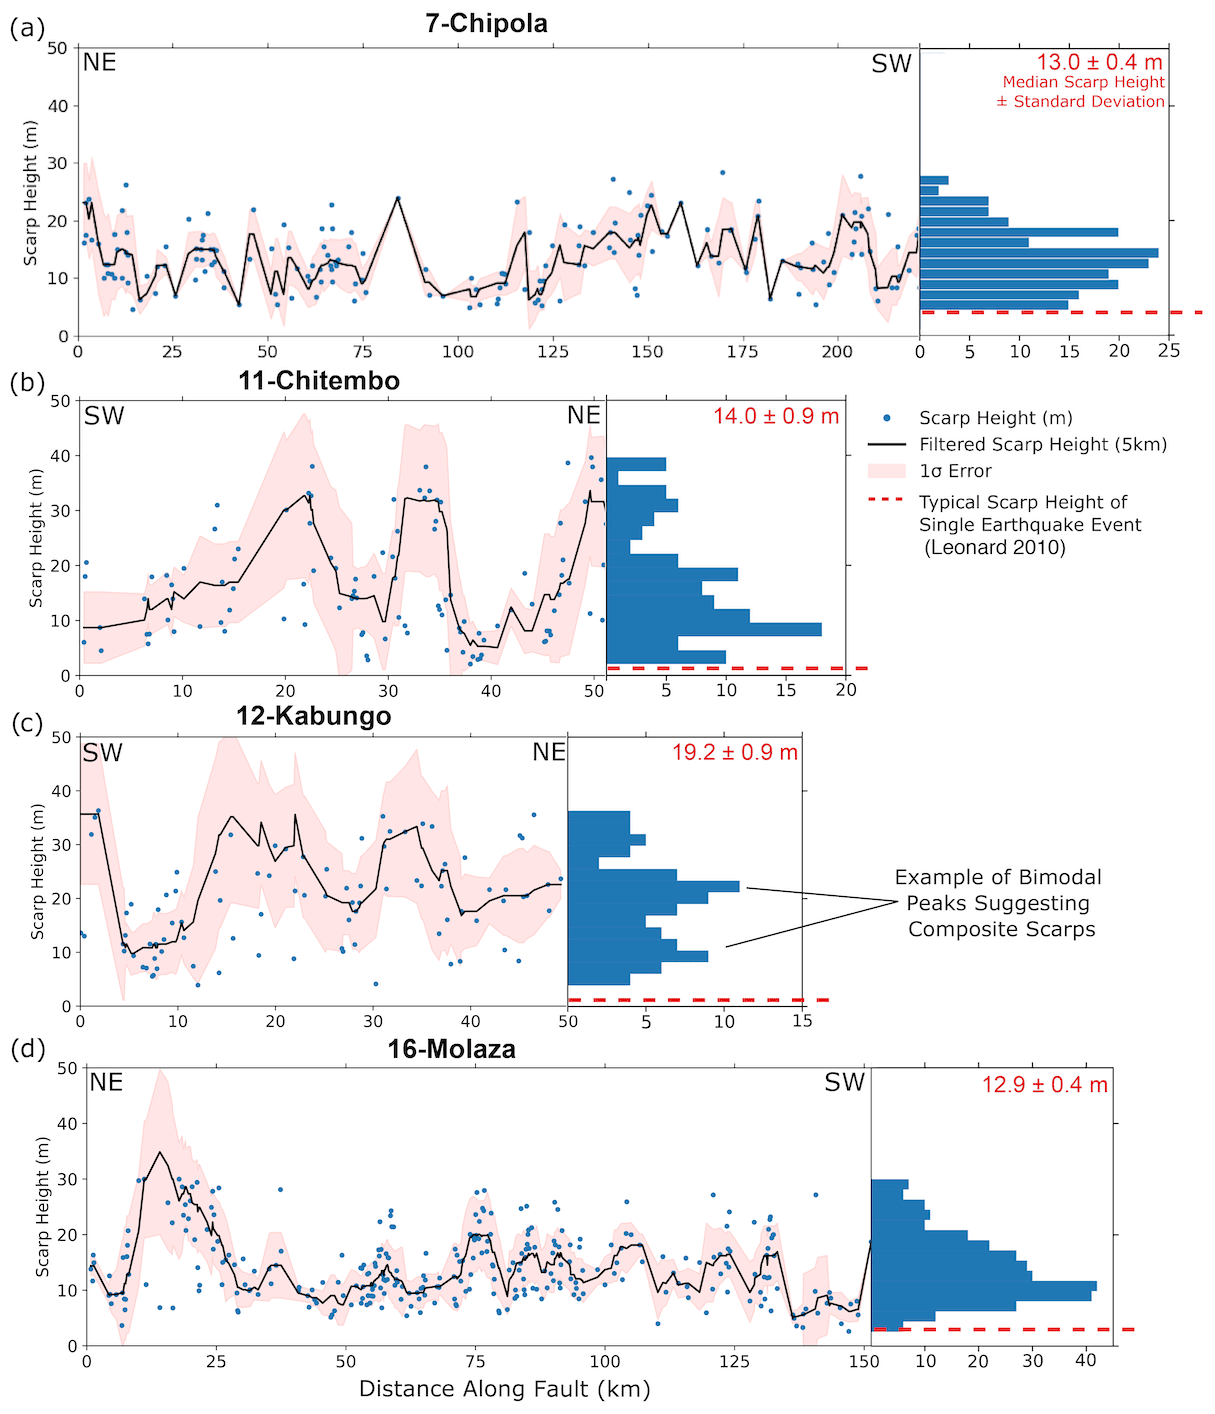
Figure 10Along-strike fault scarp height profiles for four faults in the Luangwa Rift. Horizontal axis is not to scale but represents relative variations in fault length. Circles represent individual scarp height measurements, black lines show the 3 km filtered moving median offset, and pink shading shows the 1σ error. Histograms represent the frequency of scarp heights in the profile. Median scarp heights are shown in red with the uncertainty being the standard error. The dashed red lines represent the average single event displacement (Dav) values for each fault derived from empirical relationships (Leonard, 2010). Scarp heights exceeding this, along with bi-modal histogram peaks, suggest the potential for multiple earthquake events and composite scarps. These data have been archived and are available at the following location: https://doi.org/10.5281/zenodo.6513545 (Turner et al., 2022a).
The NW-dipping 142 km long Molaza Fault is the eastern border fault in the northern basin of the Luangwa Rift. The median scarp height is 12.9 ± 0.4 m, with a maximum of 30.0 ± 0.2 m found at the northern tip, where the slope map shows the most prominent scarp (Figs. 6 and 10d). Between 25 and 75 km along strike, there is a consistently preserved scarp averaging ∼ 10 m (e.g. Fig. 9d) that coincides with steep slope values of 19∘. The histogram of scarp height measurements displays a clear peak at ∼ 10 m with very few exceeding 25 m (Fig. 10d).
5.1 Characteristics of the LRAFD
We found evidence for Quaternary activity on 18 faults in the Luangwa Rift Zone and developed an active fault database to systematically compile the geomorphic attributes of these faults. This builds on the previous discovery of active faulting along the Chipola South Fault (LRAFD_ID: 5) by Daly et al. (2020). Within the 18 active faults in the Luangwa Rift Active Fault Database (LRAFD), 6 faults have a very high confidence of recent activity (Table 2). We measured the height of the prominent scarps at the base of the footwall base of two border faults, as well as two intra-basin faults (Fig. 9). Median scarp heights are between 12 and 19 m (Fig. 10). Fault scaling relationships suggest that the 207 km long Chipola Fault is capable of hosting earthquakes up to Mw 8.1 with an intermediate recurrence interval estimate of 5055 years and a slip rate of 0.9 mm yr−1. The estimated potential earthquake magnitudes exceed previous recorded events in the EARS but are consistent with hazard assessments from other active fault and seismic source databases in southern and eastern Africa (Yang and Chen, 2010; Goda et al., 2016; Poggi et al., 2017; Williams et al., 2021). The LRAFD demonstrates that the framework for the future probabilistic seismic hazard analysis in southern Africa outlined by Williams et al. (2021) can be successfully applied to other regions using freely available, open-access data such as SRTM. In addition, the mapped active faults provide an opportunity to analyse the seismotectonics of the Luangwa Rift and compare it to other amagmatic rifts in along the EARS, and this is the focus of this discussion.
The two main border faults in the Luangwa Rift, the Chipola and Molaza faults, both follow Karoo–Basement contacts, but our analysis shows that these faults have also offset Quaternary sedimentary deposits (Figs. 5 and 6). These relationships suggest that these are Karoo age structures that have been reactivated during the current phase of rifting. The Quaternary fault activity adds support to the notion that the southwestern branch of the East African Rift is active and separates the Nubian plate from smaller microplates (the San, Rovuma, and possibly Angoni microplates) in southern and eastern Africa, as recently demonstrated by geodetic data (Wedmore et al., 2021).
Plate-scale modelling suggests that the extension direction across the San–Nubia plate boundary in the Luangwa Rift is 108 ± 8∘ (relative to stable Nubia; Wedmore et al., 2021). Focal mechanism inversion shows that the σ3, minimum compressive stress direction is 123∘ (Delvaux and Barth, 2010). These extension directions are sub-perpendicular to the fault orientation found here (mean strike: 045 ± 45∘), which follows at the kilometre scale the orientation of the Mwembeshi shear zone (Fig. 2). Both geodetic and seismological data suggest a NW–SE extension direction that is orientated sub-perpendicular to the orientation of the faults in the Luangwa Rift. However, the fault orientations are still consistent with a divergent boundary as we find no geomorphic evidence of horizontal offsets, and it is not uncommon for normal faults in the EARS to reactivate at slightly oblique angles to the regional extension direction (Williams et al., 2019). Furthermore, the only available focal mechanism from the Luangwa Rift, from a Mb 5.7 earthquake in 1976, shows a normal faulting mechanism (Nyblade and Langston, 1995). Consequently, we consider that all faults in the LRAFD have pure normal kinematics but note that further work is needed to constrain the stress orientation in this region as the focal mechanism inversion of Delvaux and Barth (2010) is only based on six events, and the geodetic solution of Wedmore et al. (2021) is based on a continental-scale Global Navigation Satellite System (GNSS) network with very few stations in the vicinity of the Luangwa Rift. Thus, the LRAFD demonstrates that the Luangwa Rift is an active rift system that forms the extensional boundary between the Nubia and San plates in southern Africa, with faults that have reactivated Karoo-age structures aligned with the pre-existing lithospheric-scale Mwembeshi shear zone.
5.2 Fault activity in the Luangwa Rift and comparison with other EARS basins
Active and inactive faults are typically distinguished by the age of the most recent earthquakes (Christophersen et al., 2015). However, large-magnitude earthquakes do not always result in surface rupture, especially in regions in southern Africa where the crust can be seismogenic down to 40 km (Jackson and Blenkinsop, 1993; Nyblade and Langston, 1995; Kolawole et al., 2017; Craig and Jackson, 2021; Stevens et al., 2021). Furthermore, we are only aware of two palaeoseismic trenches along the whole of the East African Rift (Kervyn et al., 2006; Zielke and Strecker, 2009; Cohen et al., 2013) that could potentially extend the record of fault ruptures beyond the small number of historically recorded tectonic earthquake surface ruptures (1910 M 7.4 Rukwa, Tanzania – Vittori et al., 1997; 1928 Ms 6.9 Subukia, Kenya – Ambraseys, 1991b; 1966 Mw 6.8 Toro, Uganda/DRC – Loupekine et al., 1966; 2007 Mw 7.0 Mozambique – Fenton and Bommer, 2006; Copley et al., 2012; 2009 Karonga sequence, Malawi – Biggs et al., 2010; Macheyeki et al., 2015). Consequently, it is hard to definitively conclude that a fault is “inactive” based on the absence of direct evidence of surface rupture alone. Thus, faults that do not fulfil all active criteria are still included in the database as we applied a broad definition of active faulting to reduce the risk of excluding faults that appear to be inactive but which could rupture in a future earthquake despite displaying limited evidence of activity. In published maps of the region, no attempt was made to distinguish active and inactive faults in the Luangwa Rift (Banks et al., 1995; Daly et al., 2020). Here we classify 18 faults into varying degrees of activity confidence in a systematic active fault database.
The faults determined to have the highest confidence of activity (Chipola, Molaza, Chitumbi, Kabungo) all have prominent scarps, offset alluvial fans, and steeply incised rivers in the footwall (Figs. 5–7). We measured the height of the prominently exposed fault scarps on each of these faults (Figs. 9 and 10), with the median scarp height between 13–19 m (Fig. 10). The Chipola Fault has a scarp height of 13.0 ± 0.4 m (Figs. 9a and 10). It has been suggested that a ∼ 12–14 m high scarp previously detected along the Chipola South Fault formed in the last 10 kyr (although no evidence was provided for this time period; Daly et al., 2020), but the authors were unable to distinguish whether this resulted from a single, large-magnitude earthquake or a series of smaller events. Our measurements of scarp height exceed the average single event displacement values from the Leonard (2010) scaling relationships. Thus, our results suggest that these scarps have formed from multiple earthquakes. Along the Bilila-Mtakataka fault in Malawi, Hodge et al. (2020) demonstrated that a 20 m high fault scarp was generated by at least two earthquakes with single event displacements possibly as high as 10–12 m, which also exceeds empirically derived single event displacement estimates. Evidence from the Hebron Fault in Namibia (Salomon et al., 2021) also suggests that normal faults that rupture thick crust may have higher single event displacement-length ratios than the dataset compiled by Leonard (2010). Alternatively, the scarps may have formed in a single multi-fault event (e.g. Hamling et al., 2017), whose magnitude (and hence single event displacement) would be higher than indicated in the LRAFD. However, composite scarps observed on the Molaza Fault (Fig. 9d) and bi-modal peaks in the histograms of scarp height along the Chipola, Kabungo, and Chitembo faults (Fig. 10a–c) support the inference that these scarps have formed in multiple Quaternary earthquakes.
The border faults for the northern (Molaza Fault) and southern (Chipola Fault) basins of the Luangwa Rift have the highest possible values for activity confidence, exposure quality, and epistemic quality. Both faults are well exposed along their entire length (Figs. 5 and 6), with steep fault scarps (25–30∘), and have few gaps where it was not possible to measure the scarp height (Fig. 10). In contrast, there are few mapped intra-rift faults. The Luwi and Kapampa faults (LRAFD_ID: 9 and 10) are the most prominent intra-rift faults and have clear fault scarps, but they have activity confidence values of 4 and 3, respectively, and the lowest values for exposure and epistemic quality. Furthermore, these intra-rift faults are short (Luwi – 20 km; Kapampa – 40 km) compared with the two major border faults (Chipola – 207 km; Molaza – 142 km). The lack of intra-rift faulting is unlikely to be because of the inability to detect smaller scarps with SRTM data as we measured scarps as small as ∼ 3 m high, which are smaller than intra-rift faults observed in the southern Malawi Rift (Wedmore et al., 2020b). Thus, deformation in the Luangwa Rift appears to be primarily accommodated across two major border faults at the edge of the rift. This differs from the Malawi Rift where deformation is equally distributed on both border and intra-rift faults (Wedmore et al., 2020b; Shillington et al., 2020), despite both rifts being magma poor and having similar extension rates (∼ 0.7 mm yr−1; Wedmore et al., 2021), as well as similar crustal (∼ 40–45 km; Sun et al., 2021) and lithospheric thicknesses (∼ 150 km; Priestley et al., 2018). The spatial pattern of deformation in the Luangwa Rift is more similar to the Lake Tanganyika Rift, where up to 90 % of extension is accommodated on the border faults (Muirhead et al., 2019).
The localised deformation across border faults justifies our approach of using the geodetically derived regional extension rate to estimate the slip rate and earthquake recurrence interval of the border faults (Sect. 3.2.2). However, these should be treated as upper bounds on the slip rate and lower bounds on the recurrence interval. Numerical models indicate that rifts with localised deformation across border faults form in strong lithosphere, where the strength is dominated by the crust (Huismans and Beaumont, 2011). Low ratios and high horizontal shear wave velocities suggest the absence of partial melt, magmatic intrusions, or significant levels of fluid and instead imply that the crust is strong beneath the Luangwa Rift (Wang et al., 2019; Sun et al., 2021). Furthermore, although faults in the rift follow the orientation of the foliated mylonitic gneiss and eclogites within Mwembeshi shear zone (or a splay of the shear zone; Daly et al., 1989), experiments on similar mafic samples from the Malawi Rift suggest these rocks are unlikely to be frictionally weak (Hellebrekers et al., 2019). Although the high-grade metamorphic shear zones such as the Mwembeshi shear zone are more likely to be viscously weak because of grain-scale heterogeneities, it is notable that Quaternary reactivation of Karoo-age faults in southern Africa has been observed across the Lower Zambezi escarpment in Zimbabwe and in the Lower Shire Rift in Malawi (Mackintosh et al., 2019; Wedmore et al., 2020a), both being regions that are not underlain by lithospheric-scale shear zones. Thus, although the faults in the Luangwa Rift and other Karoo-age basins have been reactivated during the current Miocene phase of rifting in East Africa, the nature of weaknesses in the lithosphere in this region remains unclear.
5.3 Seismic source attributes and seismic hazard implications
The largest historical event in the Luangwa Rift was a Mw 6.7 event on 1 May 1919 (Fig. 8; International Seismological Centre, 2021, NEIC earthquake catalogue; USGS, 2017). The ISC-GEM catalogue indicates that another Mw 6.3 event occurred in the same region in 1940 (Fig. 6). The epicentres of both the 1919 and 1940 events are located close to a ∼ 50 km long section of the Molaza Fault that is exceptionally prominent, with a well-preserved, steep (20–25∘), linear fault scarp that is continuous across small stream channels (Fig. 6). Empirical fault scaling laws imply that a Mw 6.7 event would cause a 30 km long rupture with an average displacement of 0.9 m, and a Mw 6.3 event would cause a 17 km long rupture (Leonard, 2010). Thus, we suggest that the ∼ 50 km long exceptionally well-preserved fault scarp along the Molaza Fault was formed, in part, by the two 20th century earthquakes in the Luangwa Rift. However, earthquake location accuracy in Africa at the time of these events is low, shown by the disparity between NEIC and ISC-GEM locations (Fig. 6). The 1919 earthquake recorded by ISC-GEM occurs on the same day as a Ms 6.2 event recorded on 1 May 1919, which macroseismic damage reports initially suggest was located 250 km to the north (Ambraseys and Adams, 1991). It is unclear if these events are linked, and thus field investigations of the Molaza Fault should be a priority to establish whether this represents a rare example of a 20th century earthquake surface rupture in Africa. Nevertheless, previous seismic hazard assessment in the region by definition considers the maximum possible earthquake magnitude to be 0.5 greater than the largest recorded historical earthquake (Poggi et al., 2017). However, this seismic hazard assessment states that the maximum-magnitude earthquake in this region is M 6.9 (Poggi et al., 2017). Our new finding of a Mw 6.7 event on the Molaza Fault should therefore prompt a revision of the seismic hazard in the region.
Despite evidence for the activity on the Molaza Fault in the 20th century, there remains large portions of the 140 km long fault that have not ruptured recently. We estimate that the Molaza Fault is a seismic source capable of hosting an earthquake with a maximum magnitude of Mw 7.8 and a displacement of 3.1 m, which is an order of magnitude greater than earthquakes recorded in the Luangwa region and more than any event in the whole of southern/eastern Africa. The largest regional event was the 13 December 1910 Ms 7.4 Rukwa earthquake in Tanzania (Ambraseys, 1991a), and there have only been five other M≥7.0 events along the East African Rift: the 1919 Mw 7.2 Matai, Tanzania, earthquake; the 1928 Mw 7.0 Baringo, Kenya, earthquake; the two Juba, Sudan, earthquakes in 1990 (Mw 7.1 and 7.2; Girdler and McConnell, 1994); and the 2006 Mw 7.0 Mozambique earthquake (Copley et al., 2012). The LRAFD contains eight faults that exceed 50 km in length, with two faults greater than 100 km. Seismic source attributes calculated from the LRAFD indicate that there are 12 faults that have the potential to rupture in Mw≥7.0 earthquakes (Fig. 8), with the 207 km long Chipola Fault capable of hosting up to a Mw 8.1 earthquake. Global compilations of continental normal faulting earthquakes suggest that they rarely exceed rupture lengths of 50 km and low Mw 7 (Neely and Stein, 2021), and there is only one event with a surface rupture length >100 km (Valentini et al., 2020). Thus, although Mw 7+ events are likely rare, they should be considered possible in the Luangwa Rift due to the long faults that are hosted in 45 km thick crust (Sun et al., 2021), which has recorded seismicity to ∼ 30 km depth (Craig et al., 2011; Craig and Jackson, 2021). Nonetheless, these large-magnitude events likely occur infrequently as >100 km long normal faults in southern Africa are often segmented (Mortimer et al., 2016; Hodge et al., 2018; Wedmore et al., 2020a, b), and the regional b value is ∼ 1 (Poggi et al., 2017), implying that smaller segmented ruptures are more likely than earthquakes that rupture an entire fault.
To estimate the magnitude of smaller segmented ruptures, we attempted to identify fault segments for the four best exposed faults in the Luangwa Rift by systematically measuring along-strike fault scarp heights (Fig. 10). This approach has been successful in other East African rift basins using 12.5 m resolution TanDEM-X data (Hodge et al., 2018; Wedmore et al., 2020a, b). Using the 30 m resolution SRTM data, we were unable to identify clear segment boundaries in either the scarp height measurements or in notable changes in fault geometry (e.g. 90∘ bends), making it challenging to assess the limits on rupture length on individual faults. The low slip rates that we calculated for these faults (0.4–1.7 mm yr−1) indicate that if large (M>7.0) events do occur, they are rare, with intermediate earthquake recurrence intervals of 5.1 kyr on the Chipola Fault and 3.4 kyr on the Molaza Fault. Thus, although we do not directly observe evidence for fault segmentation in the Luangwa Rift, the data provided here can be used to incorporate small ruptures along these faults into seismic hazard assessments by combining the provided slip rate, fault area, and magnitude estimates with a regional b value (Poggi et al., 2017) and the methodology developed by Youngs and Coppersmith (1985) to develop continuous recurrence models for these sources (see Williams et al., 2021). However, it is also possible that multi-fault rupture may occur, which would increase the potential magnitude of future events. For example, multi-fault rupture of the 142 km long Molaza (LRAFD_ID: 16), 9 km long Molaza 2 (LRAFD_ID: 15), and 16 km long Molaza 3 (LRAFD_ID: 14) faults would increase the potential magnitude of the earthquake from Mw 7.8 to 8.0 compared to if the Molaza Fault ruptured on its own.
The low frequency of large earthquakes in the Luangwa Rift and the few recent destructive earthquakes means that awareness of seismic hazard and mitigation strategies in Zambia may be low. The Luangwa Valley and National Park are tourist destinations with a significant number of communities, tourists, wildlife, and economic assets exposed to seismic hazard. Kasama (200 km west) and Chipata (150 km east) are the largest nearby cities, both with populations of ∼ 90 000 (Zambia Statistics Agency, 2022). There are a combined 2.4 million people living in the Muchinga and eastern regions of Zambia, with a population growth rate of 4.3 % and 2.8 %, respectively (Zambia Statistics Agency, 2022). This means nearby populations that may be affected by seismic hazard will increase with time. Furthermore, the region has high levels of vulnerability. Recent moderate-magnitude earthquakes in Malawi led to high levels of damage and large economic losses (World Bank, 2019), and research in Malawi indicates that building vulnerability in this region is higher than currently predicted by global models (e.g. the USGS WHE-PAGER model; Novelli et al., 2021; Giordano et al., 2021). We suggest that active fault mapping, such as has been carried out here in the LRAFD and in other active fault databases in southern Africa (Williams et al., 2021, 2022), provides a framework for accurate probabilistic seismic hazard assessment and thus for increasing resilience to seismic hazard throughout southern and eastern Africa.
Using SRTM data, we have systematically mapped and compiled the attributes of 18 active faults in the Luangwa Rift, Zambia, to produce the Luangwa Rift Active Fault Database (LRAFD). The LRAFD is a freely available open-source dataset that is aimed for use in future probabilistic seismic hazard assessment, as well as to provide a resource for the further scientific study of the Luangwa Rift. Empirical scaling relationships between fault length and earthquake magnitude suggest that the faults in the Luangwa Rift can host earthquakes greater than Mw 7, up to Mw 8.1, although we consider that these scenarios are unlikely or extremely rare.
We find evidence that all 18 faults mapped have been active during the Quaternary, with the four most prominent faults displaying well-preserved linear fault scarps up to ∼ 20–30 m high. Systematic measurements of the height of the scarps on these four faults suggest that they were formed by multiple earthquakes, but using 30 m resolution SRTM data, we were unable to use along-strike scarp height profiles to identify fault segment boundaries. Within the Luangwa Rift, the two border faults (Chipola and Molaza), which have opposing polarity and have reactivated structures that were previously active during a Karoo phase of rifting, appear to accommodate most of the surface deformation. This suggests that the 45 km thick crust is strong and does not contain any weaker mid- or lower-crustal layers, which is confirmed by other geophysical proxies. Although the orientation of the faults in the rift follows that of the underlying Mwembeshi shear zone, it remains unclear why this shear zone is weaker than the surrounding rocks. Nevertheless, we conclusively demonstrate that faults in the Luangwa Rift are active and provide a pathway for the inclusion of active faults in the region into future probabilistic seismic hazard assessment.
All data generated in this paper are freely available and archived in online repositories. Version 1 of the Luangwa Rift Active Fault Database (LRAFD) is available at https://doi.org/10.5281/zenodo.6513691 (Wedmore et al., 2022). The LRAFD is also available on GitHub (https://github.com/LukeWedmore/luangwa_rift_active_fault_database), and we encourage authors to suggest future changes and additions to the database through the GitHub repository. The seismogenic source parameters are available at https://doi.org/10.5281/zenodo.6513778 (Turner et al., 2022b). The measurements of scarp height are available at https://doi.org/10.5281/zenodo.6513545 (Turner et al., 2022a).
The supplement related to this article is available online at: https://doi.org/10.5194/se-13-1731-2022-supplement.
This project was devised by LNJW and JB as part of TT's master of science project. TT, LNJW, and JNW carried out the fault mapping, and TT calculated the seismogenic source properties and measured the scarp heights using codes developed by LNJW. LNJW developed and archived the active fault database in collaboration with all co-authors. LNJW wrote the manuscript with assistance from all co-authors.
The contact author has declared that none of the authors has any competing interests.
Publisher’s note: Copernicus Publications remains neutral with regard to jurisdictional claims in published maps and institutional affiliations.
This article is part of the special issue “(D)rifting into the future: the relevance of rifts and divergent margins in the 21st century”. It is not associated with a conference.
This manuscript originated as a University of Bristol master of science project by Tess Turner. The overall project was funded by several grants under EPSRC Global Challenges Research Fund (GCRF): PREPARE (EP/P028233/1); SAFER PREPARED (part of the “Innovative data services for aquaculture, seismic resilience and drought adaptation in East Africa” grant no. EP/T015462/1); and a GCRF EPSRC Institutional Sponsorship Award. This work greatly benefited from discussions with Åke Fagereng throughout the course of the PREPARE project.
This research has been supported by the Engineering and Physical Sciences Research Council (grant nos. EP/P028233/1 and EP/T015462/1).
This paper was edited by Yang Chu and reviewed by Tuo Wang, Junjie Ren, and Damien Delvaux.
Abrahamson, N., Atkinson, G., Boore, D., Bozorgnia, Y., Campbell, K., Chiou, B., Idriss, I. M., Silva, W., and Youngs, R.: Comparisons of the NGA Ground-Motion Relations, Earthq. Spectra, 24, 45–66, https://doi.org/10.1193/1.2924363, 2008. a
Aki, K.: Asperities, barriers, characteristic earthquakes and strong motion prediction (Japan), J. Geophys. Res., 89, 5867–5872, https://doi.org/10.1029/JB089iB07p05867, 1984. a
Alessio, B. L., Collins, A. S., Siegfried, P., Glorie, S., De Waele, B., Payne, J., and Archibald, D. B.: Neoproterozoic tectonic geography of the south-east Congo Craton in Zambia as deduced from the age and composition of detrital zircons, Geosci. Front., 10, 2045–2061, https://doi.org/10.1016/j.gsf.2018.07.005, 2019. a, b
Ambraseys, N. N.: The Rukwa earthquake of 13 December 1910 in East Africa, Terra Nova, 3, 202–211, https://doi.org/10.1111/j.1365-3121.1991.tb00873.x, 1991a. a
Ambraseys, N. N.: Earthquake hazard in the Kenya Rift: the Subukia earthquake 1928, Geophys. J. Int., 105, 253–269, https://doi.org/10.1111/j.1365-246X.1991.tb03460.x, 1991b. a
Ambraseys, N. N. and Adams, R. D.: Reappraisal of major African earthquakes, south of 20∘ N, 1900–1930, Nat. Hazards, 4, 389–419, https://doi.org/10.1007/BF00126646, 1991. a, b
Bailey, G., King, G., and Manighetti, I.: Tectonics, volcanism, landscape structure and human evolution in the African Rift, in: Human Ecodynamics: Proceedings of the Association for Environmental Archaeology Conference 1998 held at the University of Newcastle upon Tyne, edited by: Bailey, G. N., Charles, R., and Winder, N., 31–46, Symposia of the Association for Environmental Archaeology, Oxbow Books, ISBN: 1842170015, 2000. a
Banks, N. L., Bardwell, K. A., and Musiwa, S.: Karoo Rift basins of the Luangwa Valley, Zambia, Geol. Soc. Lond. Sp. Publ., 80, 285–295, https://doi.org/10.1144/GSL.SP.1995.080.01.13, 1995. a, b, c, d, e, f, g, h
Barham, L., Phillips, W. M., Maher, B. A., Karloukovski, V., Duller, G. A., Jain, M., and Wintle, A. G.: The dating and interpretation of a Mode 1 site in the Luangwa Valley, Zambia, J. Hum. Evol., 60, 549–570, https://doi.org/10.1016/j.jhevol.2010.12.003, 2011. a
Biggs, J., Nissen, E., Craig, T., Jackson, J., and Robinson, D. P.: Breaking up the hanging wall of a rift-border fault: The 2009 Karonga earthquakes, Malawi, Geophys. Res. Lett., 37, 1–5, https://doi.org/10.1029/2010GL043179, 2010. a
Bishop, L. C., Barham, L., Ditchfield, P. W., Elton, S., Harcourt‐Smith, W. E. H., and Dawkins, P.: Quaternary fossil fauna from the Luangwa Valley, Zambia, J. Quaternary Sci., 31, 178–190, https://doi.org/10.1002/jqs.2855, 2016. a, b
Brun, J.: Narrow rifts versus wide rifts: inferences for the mechanics of rifting from laboratory experiments, Philos. T. R. Soc. Lond. Ser. A, 357, 695–712, https://doi.org/10.1098/rsta.1999.0349, 1999. a
Bubeck, A., Wilkinson, M., Roberts, G., Cowie, P., McCaffrey, K., Phillips, R., and Sammonds, P.: The tectonic geomorphology of bedrock scarps on active normal faults in the Italian Apennines mapped using combined ground penetrating radar and terrestrial laser scanning, Geomorphology, 237, 38–51, 2015. a
Buck, W. R.: Modes of continental lithospheric extension, J. Geophys. Res.-Sol. Ea., 96, 20161–20178, https://doi.org/10.1029/91JB01485, 1991. a
Chorowicz, J.: The East African rift system, J. Afr. Earth Sci., 43, 379–410, https://doi.org/10.1016/j.jafrearsci.2005.07.019, 2005. a
Christophersen, A., Litchfield, N., Berryman, K., Thomas, R., Basili, R., Wallace, L., Ries, W., Hayes, G. P., Haller, K. M., Yoshioka, T., Koehler, R. D., Clark, D., Wolfson-Schwehr, M., Boettcher, M. S., Villamor, P., Horspool, N., Ornthammarath, T., Zuñiga, R., Langridge, R. M., Stirling, M. W., Goded, T., Costa, C., and Yeats, R.: Development of the Global Earthquake Model's neotectonic fault database, Nat. Hazards, 79, 111–135, https://doi.org/10.1007/s11069-015-1831-6, 2015. a, b, c, d
Cohen, A. S., Van Bocxlaer, B., Todd, J. A., McGlue, M., Michel, E., Nkotagu, H. H., Grove, A., and Delvaux, D.: Quaternary ostracodes and molluscs from the Rukwa Basin (Tanzania) and their evolutionary and paleobiogeographic implications, Palaeogeogr. Palaeocl., 392, 79–97, https://doi.org/10.1016/j.palaeo.2013.09.007, 2013. a
Copley, A., Hollingsworth, J., and Bergman, E.: Constraints on fault and lithosphere rheology from the coseismic slip and postseismic afterslip of the 2006 Mw 7.0 Mozambique earthquake, J. Geophys. Res.-Sol. Ea., 117, 1–16, https://doi.org/10.1029/2011JB008580, 2012. a, b
Craig, T. and Jackson, J.: Variations in the seismogenic thickness of East Africa, J. Geophys. Res.-Sol. Ea., 126, e2020JB020754, https://doi.org/10.1029/2020JB020754, 2021. a, b, c, d
Craig, T. J., Jackson, J. A., Priestley, K., and Mckenzie, D.: Earthquake distribution patterns in Africa: Their relationship to variations in lithospheric and geological structure, and their rheological implications, Geophys. J. Int., 185, 403–434, https://doi.org/10.1111/j.1365-246X.2011.04950.x, 2011. a, b, c
Daly, M. C., Chorowicz, J., and Fairhead, J. D.: Rift basin evolution in Africa: The influence of reactivated steep basement shear zones, Geol. Soc. Sp. Publ., 44, 309–334, https://doi.org/10.1144/GSL.SP.1989.044.01.17, 1989. a, b, c, d
Daly, M. C., Green, P., Watts, A. B., Davies, O., Chibesakunda, F., and Walker, R.: Tectonics and Landscape of the Central African Plateau and their Implications for a Propagating Southwestern Rift in Africa, Geochem. Geophy. Geosy., 21, e2019GC008746, https://doi.org/10.1029/2019GC008746, 2020. a, b, c, d, e, f, g, h, i, j, k
Delvaux, D. and Barth, A.: African stress pattern from formal inversion of focal mechanism data, Tectonophysics, 482, 105–128, https://doi.org/10.1016/j.tecto.2009.05.009, 2010. a, b, c
Delvaux, D., Kervyn, F., Macheyeki, A., and Temu, E.: Geodynamic significance of the TRM segment in the East African Rift (W-Tanzania): Active tectonics and paleostress in the Ufipa plateau and Rukwa basin, J. Struct. Geol., 37, 161–180, https://doi.org/10.1016/j.jsg.2012.01.008, 2012. a, b
de Swardt, A. M. J., Garrard, P., and Simpson, J. C.: Major Zones of Transcurrent Dislocation and Superposition of Orogenic Belts in Part of Central Africa, GSA Bull., 76, 89–102, https://doi.org/10.1130/0016-7606(1965)76[89:MZOTDA]2.0.CO;2, 1965. a
DISS Working Group: Database of Individual Seismogenic Sources (DISS), Version 3.3.0: A compilation of potential sources for earthquakes larger than M 5.5 in Italy and surrounding areas., Istituto Nazional di Geofisica e Vulcanologia (INGV), https://doi.org/10.13127/diss3.3.0, 2021. a
Dixey, F.: The Geology of Part of the Upper Luangwa Valley, North-Eastern Rhodesia, Q. J. Geol. Soc., 93, 52–76, https://doi.org/10.1144/GSL.JGS.1937.093.01-04.05, 1937. a
DuRoss, C. B., Personius, S. F., Crone, A. J., Olig, S. S., Hylland, M. D., Lund, W. R., and Schwartz, D. P.: Fault segmentation: New concepts from the Wasatch Fault Zone, Utah, USA, J. Geophys. Res.-Sol. Ea., 121, 1131–1157, https://doi.org/10.1002/2015JB012519, 2016. a
Fairhead, J. D. and Girdler, R. W.: How far does the rift system extend through Africa?, Nature, 221, 1018–1020, https://doi.org/10.1038/2211018a0, 1969. a
Fairhead, J. D. and Henderson, N. B.: The seismicity of southern Africa and incipient rifting, Tectonophysics, 41, 19–26, https://doi.org/10.1016/0040-1951(77)90133-0, 1977. a
Farr, T. G., Rosen, P. A., Caro, E., Crippen, R., Duren, R., Hensley, S., Kobrick, M., Paller, M., Rodriguez, E., Roth, L., Seal, D., Shaffer, S., Shimada, J., Umland, J., Werner, M., Oskin, M., Burbank, D., and Alsdorf, D.: The Shuttle Radar Topography Mission, Rev. Geophys., 45, RG2004, https://doi.org/10.1029/2005RG000183, 2007. a, b, c
Faure Walker, J., Boncio, P., Pace, B., Roberts, G., Benedetti, L., Scotti, O., Visini, F., and Peruzza, L.: Fault2SHA Central Apennines database and structuring active fault data for seismic hazard assessment, Sci. Data, 8, 87, https://doi.org/10.1038/s41597-021-00868-0, 2021. a, b
Fenton, C. H. and Bommer, J. J.: The Mw 7 Machaze, Mozambique, Earthquake of 23 February 2006, Seismol. Res. Lett., 77, 426–439, https://doi.org/10.1785/gssrl.77.4.426, 2006. a
Gerland, P., Raftery, A. E., Ševčíková, H., Li, N., Gu, D., Spoorenberg, T., Alkema, L., Fosdick, B. K., Chunn, J., Lalic, N., Bay, G., Buettner, T., Heilig, G. K., and Wilmoth, J.: World population stabilization unlikely this century, Science, 346, 234–237, https://doi.org/10.1126/science.1257469, 2014. a
Giordano, N., De Risi, R., Voyagaki, E., Kloukinas, P., Novelli, V., Kafodya, I., Ngoma, I., Goda, K., and Macdonald, J.: Seismic fragility models for typical non-engineered URM residential buildings in Malawi, Structures, 32, 2266–2278, https://doi.org/10.1016/j.istruc.2021.03.118, 2021. a
Girdler, R. W. and McConnell, D. A.: The 1990 to 1991 Sudan Earthquake Sequence and the Extent of the East African Rift System, Science, 264, 67–70, https://doi.org/10.1126/science.264.5155.67, 1994. a
Goda, K., Gibson, E. D., Smith, H. R., Biggs, J., and Hodge, M.: Seismic risk assessment of urban and rural settlements around lake malawi, Front. Built Environ., 2, 16, https://doi.org/10.3389/fbuil.2016.00030, 2016. a
Hamling, I. J., Hreinsdóttir, S., Clark, K., Elliott, J., Liang, C., Fielding, E., Litchfield, N., Villamor, P., Wallace, L., Wright, T. J., D'Anastasio, E., Bannister, S., Burbidge, D., Denys, P., Gentle, P., Howarth, J., Mueller, C., Palmer, N., Pearson, C., Power, W., Barnes, P., Barrell, D. J., Van Dissen, R., Langridge, R., Little, T., Nicol, A., Pettinga, J., Rowland, J., and Stirling, M.: Complex multifault rupture during the 2016 Mw 7.8 Kaikōura earthquake, New Zealand, Science, 356, eaam7194, https://doi.org/10.1126/science.aam7194, 2017. a
Hellebrekers, N., Niemeijer, A. R., Fagereng, Å., Manda, B., and Mvula, R. L.: Lower crustal earthquakes in the East African Rift System: Insights from frictional properties of rock samples from the Malawi rift, Tectonophysics, 767, 228167, https://doi.org/10.1016/j.tecto.2019.228167, 2019. a
Hodge, M., Biggs, J., Goda, K., and Aspinall, W.: Assessing infrequent large earthquakes using geomorphology and geodesy: the Malawi Rift, Nat. Hazards, 76, 1781–1806, https://doi.org/10.1007/s11069-014-1572-y, 2015. a
Hodge, M., Fagereng, Biggs, J., and Mdala, H.: Controls on Early-Rift Geometry: New Perspectives From the Bilila-Mtakataka Fault, Malawi, Geophys. Res. Lett., 45, 3896–3905, https://doi.org/10.1029/2018GL077343, 2018. a, b, c, d, e
Hodge, M., Biggs, J., Fagereng, Å., Elliott, A., Mdala, H., and Mphepo, F.: A semi-automated algorithm to quantify scarp morphology (SPARTA): Application to normal faults in southern Malawi, Solid Earth, 10, 27–57, https://doi.org/10.5194/se-10-27-2019, 2019. a
Hodge, M., Biggs, J., Fagereng, Mdala, H., Wedmore, L. N. J., Williams, J. N., Fagereng, Å., Mdala, H., Wedmore, L. N. J., and Williams, J. N.: Evidence From High‐Resolution Topography for Multiple Earthquakes on High Slip‐to‐Length Fault Scarps: The Bilila‐Mtakataka Fault, Malawi, Tectonics, 39, 1–24, https://doi.org/10.1029/2019TC005933, 2020. a, b, c
Huismans, R. and Beaumont, C.: Depth-dependent extension, two-stage breakup and cratonic underplating at rifted margins, Nature, 473, 74–78, https://doi.org/10.1038/nature09988, 2011. a
International Seismological Centre, ISC-GEM Earthquake Catalogue, https://doi.org/10.31905/d808b825, 2021. a, b
Jackson, J. and Blenkinsop, T.: THE Malaŵi Earthquake of March 10, 1989: DEep faulting within the East African Rift System, Tectonics, 12, 1131–1139, https://doi.org/10.1029/93TC01064, 1993. a
Jackson, J. and Blenkinsop, T.: The Bilila-Mtakataka fault in Malaŵi: An active, 100-km long, normal fault segment in thick seismogenic crust, Tectonics, 16, 137–150, https://doi.org/10.1029/96TC02494, 1997. a, b
Johnson, S. P., De Waele, B., and Liyungu, K. A.: U-Pb sensitive high-resolution ion microprobe (SHRIMP) zircon geochronology of granitoid rocks in eastern Zambia: Terrane subdivision of the Mesoproterozoic Southern Irumide Belt, Tectonics, 25, TC6004, https://doi.org/10.1029/2006TC001977, 2006. a, b
Kendall, J.-M. and Lithgow-Bertelloni, C.: Why is Africa rifting?, Geol. Soc. Lond. Sp. Publ., 420, 11–30, https://doi.org/10.1144/SP420.17, 2016. a
Kervyn, F., Ayub, S., Kajara, R., Kanza, E., and Temu, B.: Evidence of recent faulting in the Rukwa rift (West Tanzania) based on radar interferometric DEMs, J. Afr. Earth Sci., 44, 151–168, https://doi.org/10.1016/j.jafrearsci.2005.10.008, 2006. a
Kinabo, B. D., Atekwana, E. A., Hogan, J. P., Modisi, M. P., Wheaton, D. D., and Kampunzu, A. B.: Early structural development of the Okavango rift zone, NW Botswana, J. Afr. Earth Sci., 48, 125–136, https://doi.org/10.1016/j.jafrearsci.2007.02.005, 2007. a
Kolawole, F., Atekwana, E. A., Malloy, S., Stamps, D. S., Grandin, R., Abdelsalam, M. G., Leseane, K., and Shemang, E. M.: Aeromagnetic, gravity, and Differential Interferometric Synthetic Aperture Radar analyses reveal the causative fault of the 3 April 2017 Mw 6.5 Moiyabana, Botswana, earthquake, Geophys. Res. Lett., 44, 8837–8846, https://doi.org/10.1002/2017GL074620, 2017. a
Kolawole, F., Phillips, T. B., Atekwana, E. A., and Jackson, C. A.-L.: Structural Inheritance Controls Strain Distribution During Early Continental Rifting, Rukwa Rift, Front. Earth Sci., 9, 707869, https://doi.org/10.3389/feart.2021.707869, 2021. a
Laõ-Dávila, D. A., Al-Salmi, H. S., Abdelsalam, M. G., and Atekwana, E. A.: Hierarchical segmentation of the Malawi Rift: The influence of inherited lithospheric heterogeneity and kinematics in the evolution of continental rifts, Tectonics, 34, 2399–2417, https://doi.org/10.1002/2015TC003953, 2015. a
Leonard, M.: Earthquake fault scaling: Self-consistent relating of rupture length, width, average displacement, and moment release, Bull. Seismol. Soc. Am., 100, 1971–1988, https://doi.org/10.1785/0120090189, 2010. a, b, c, d, e, f, g, h, i, j
Loupekine, I. S., Wohlenberg, J., and Janssen, T.: The Toro earthquake of 20 March 1966 and preliminary interpretation of seismograms: Uganda – (mission) 5–19 April 1966, Tech. Rep., UNESCO, https://unesdoc.unesco.org/ark:/48223/pf0000007799_eng (last access: April 2022), 1966. a
Macheyeki, A. S., Mdala, H., Chapola, L. S., Manhiça, V. J., Chisambi, J., Feitio, P., Ayele, A., Barongo, J., Ferdinand, R. W., Ogubazghi, G., Goitom, B., Hlatywayo, J. D., Kianji, G. K., Marobhe, I., Mulowezi, A., Mutamina, D., Mwano, J. M., Shumba, B., and Tumwikirize, I.: Active fault mapping in Karonga-Malawi after the December 19, 2009 Ms 6.2 seismic event, J. Afr. Earth Sci., 102, 233–246, https://doi.org/10.1016/j.jafrearsci.2014.10.010, 2015. a
Mackintosh, V., Kohn, B., Gleadow, A., and Gallagher, K.: Long-term reactivation and morphotectonic history of the Zambezi Belt, northern Zimbabwe, revealed by multi-method thermochronometry, Tectonophysics, 750, 117–136, https://doi.org/10.1016/j.tecto.2018.11.009, 2019. a
Matende, K. N., Atekwana, E., Mickus, K., Abdelsalam, M. G., Atekwana, E. A., Evans, R., Nyalugwe, V. N., and Emishaw, L.: Crustal and thermal structure of the Permian – Jurassic Luangwa – Lukusashi – Luano Rift, Zambia: Implications for strain localization in magma – Poor continental rifts, J. Afr. Earth Sci., 175, 104090, https://doi.org/10.1016/j.jafrearsci.2020.104090, 2021. a, b, c
McCarthy, T. S.: The Okavango Delta and its place in the Geomorphological Evolution of Southern Africa, South Afr. J. Geol., 116, 1–54, https://doi.org/10.2113/gssajg.116.1.1, 2013. a
Meghraoui, M.: The Seismotectonic Map of Africa, Episodes, 39, 9–18, https://doi.org/10.18814/epiiugs/2016/v39i1/89232, 2016. a
Morell, K. D., Styron, R., Stirling, M., Griffin, J., Archuleta, R., and Onur, T.: Seismic Hazard Analyses From Geologic and Geomorphic Data: Current and Future Challenges, Tectonics, 39, TC005365, https://doi.org/10.1029/2018TC005365, 2020. a
Mortimer, E., Kirstein, L. A., Stuart, F. M., and Strecker, M. R.: Spatio-temporal trends in normal-fault segmentation recorded by low-temperature thermochronology: Livingstone fault scarp, Malawi Rift, East African Rift System, Earth Planet. Sc. Lett., 455, 62–72, https://doi.org/10.1016/j.epsl.2016.08.040, 2016. a
Muirhead, J. D., Wright, L. J., and Scholz, C. A.: Rift evolution in regions of low magma input in East Africa, Earth Planet. Sc. Lett., 506, 332–346, https://doi.org/10.1016/j.epsl.2018.11.004, 2019. a
Neely, J. S. and Stein, S.: Why do continental normal fault earthquakes have smaller maximum magnitudes?, Tectonophysics, 809, 228854, https://doi.org/10.1016/j.tecto.2021.228854, 2021. a
Ngwenya, N. S. and Tappe, S.: Diamondiferous lamproites of the Luangwa Rift in central Africa and links to remobilized cratonic lithosphere, Chem. Geol., 568, 120019, https://doi.org/10.1016/j.chemgeo.2020.120019, 2021. a
Novelli, V. I., De Risi, R., Ngoma, I., Kafodya, I., Kloukinas, P., Macdonald, J., and Goda, K.: Fragility curves for non-engineered masonry buildings in developing countries derived from real data based on structural surveys and laboratory tests, Soft Comput., 25, 6113–6138, https://doi.org/10.1007/s00500-021-05603-w, 2021. a
Nyblade, A. A. and Langston, C. A.: East African earthquakes below 20 km depth and their implications for crustal structure, Geophys. J. Int., 121, 49–62, https://doi.org/10.1111/j.1365-246X.1995.tb03510.x, 1995. a, b
Philippon, M., Willingshofer, E., Sokoutis, D., Corti, G., Sani, F., Bonini, M., and Cloetingh, S.: Slip re-orientation in oblique rifts, Geology, 43, 147–150, https://doi.org/10.1130/G36208.1, 2015. a
Poggi, V., Durrheim, R., Tuluka, G. M., Weatherill, G., Gee, R., Pagani, M., Nyblade, A., and Delvaux, D.: Assessing seismic hazard of the East African Rift: a pilot study from GEM and AfricaArray, B. Earthq. Eng., 15, 4499–4529, https://doi.org/10.1007/s10518-017-0152-4, 2017. a, b, c, d, e
Priday, E. and Camps, G.: Geological Map of North Rhodesia, Tech. Rep., Geological Survey Department, Lusaka, Northern Rhodesia, University of Bristol, 1960. a, b
Priestley, K., McKenzie, D., and Ho, T.: A Lithosphere–Asthenosphere Boundary – a Global Model Derived from Multimode Surface‐Wave Tomography and Petrology, in: Lithospheric Discontinuities, edited by: Yuan, H. and Romanowicz, B., American Geophysical Union Geophysical monograph series, 111–123, https://doi.org/10.1002/9781119249740.ch6, 2018. a, b
Rajaonarison, T. A., Stamps, D. S., and Naliboff, J.: Role of Lithospheric Buoyancy Forces in Driving Deformation in East Africa From 3D Geodynamic Modeling, Geophys. Res. Lett., 48, 1–10, https://doi.org/10.1029/2020GL090483, 2021. a
Reeves, C. V.: Rifting in the Kalahari?, Nature, 237, 95–96, https://doi.org/10.1038/237095a0, 1972. a
Rodriguez, E., Morris, C. S., Belz, J. E., Chapin, E. C., Martin, J. M., Daffer, W., and Hensley, S.: An assessment of the SRTM topographic products, Tech. Rep., Jet Propulsion Laboratory, Jet Propulsion Laboratory, https://www2.jpl.nasa.gov/srtm/SRTM_D31639.pdf (last access: April 2022), 2005. a
Roberts, E. M., Stevens, N. J., O'Connor, P. M., Dirks, P. H., Gottfried, M. D., Clyde, W. C., Armstrong, R. A., Kemp, A. I., and Hemming, S.: Initiation of the western branch of the East African Rift coeval with the eastern branch, Nat. Geosci., 5, 289–294, https://doi.org/10.1038/ngeo1432, 2012. a
Salomon, G. W., New, T., Muir, R. A., Whitehead, B., Scheiber-Enslin, S., Smit, J., Stevens, V., Kahle, B., Kahle, R., Eckardt, F. D., and Alastair Sloan, R.: Geomorphological and geophysical analyses of the Hebron Fault, SW Namibia: implications for stable continental region seismic hazard, Geophys. J. Int., 229, 235–254, https://doi.org/10.1093/gji/ggab466, 2021. a
Sarafian, E., Evans, R. L., Abdelsalam, M. G., Atekwana, E., Elsenbeck, J., Jones, A. G., and Chikambwe, E.: Imaging Precambrian lithospheric structure in Zambia using electromagnetic methods, Gondwana Res., 54, 38–49, https://doi.org/10.1016/j.gr.2017.09.007, 2018. a, b
Scholz, C. A., Shillington, D. J., Wright, L. J., Accardo, N., Gaherty, J. B., and Chindandali, P.: Intrarift fault fabric, segmentation, and basin evolution of the Lake Malawi (Nyasa) Rift, East Africa, Geosphere, 16, 1293–1311, https://doi.org/10.1130/GES02228.1, 2020. a, b
Scholz, C. H., Koczynski, T. A., and Hutchins, D. G.: Evidence for Incipient Rifting in Southern Africa, Geophys. J. Roy. Astron.l Soc., 44, 135–144, https://doi.org/10.1111/j.1365-246X.1976.tb00278.x, 1976. a
Schwartz, D. P. and Coppersmith, K. J.: Fault behavior and characteristic earthquakes: examples from the Wasatch and San Andreas fault zones (USA), J. Geophys. Res., 89, 5681–5698, https://doi.org/10.1029/JB089iB07p05681, 1984. a
Shillington, D. J., Scholz, C. A., Chindandali, P. R. N., Gaherty, J. B., Accardo, N. J., Onyango, E., Ebinger, C. J., and Nyblade, A. A.: Controls on Rift Faulting in the North Basin of the Malawi (Nyasa) Rift, East Africa, Tectonics, 39, 1–3, https://doi.org/10.1029/2019TC005633, 2020. a
Skobelev, S., Hanon, M., Klerkx, J., Govorova, N., Lukina, N., and Kazmin, V.: Active faults in Africa: a review, Tectonophysics, 380, 131–137, https://doi.org/10.1016/j.tecto.2003.10.016, 2004. a
Stevens, V. L., Sloan, R. A., Chindandali, P. R., Wedmore, L. N. J., Salomon, G. W., and Muir, R. A.: The Entire Crust can be Seismogenic: Evidence from Southern Malawi, Tectonics, 40, TC006654, https://doi.org/10.1029/2020TC006654, 2021. a
Styron, R. and Pagani, M.: The GEM Global Active Faults Database, Earthq. Spectra, 36, 160–180, https://doi.org/10.1177/8755293020944182, 2020. a, b, c, d, e, f, g, h, i
Styron, R., García-Pelaez, J., and Pagani, M.: CCAF-DB: the Caribbean and Central American active fault database, Nat. Hazards Earth Syst. Sci., 20, 831–857, https://doi.org/10.5194/nhess-20-831-2020, 2020. a, b
Sun, M., Gao, S. S., Liu, K. H., Mickus, K., Fu, X., and Yu, Y.: Receiver function investigation of crustal structure in the Malawi and Luangwa rift zones and adjacent areas, Gondwana Res., 89, 168–176, https://doi.org/10.1016/j.gr.2020.08.015, 2021. a, b, c, d, e, f, g, h
Turner, T., Wedmore, L., and Biggs, J.: Luangwa Rift Fault Scarp Measurements (v1.0), Zenodo [data set], https://doi.org/10.5281/zenodo.6513545, 2022a. a, b
Turner, T., Wedmore, L., Biggs, J., Williams, J., Sichingabula, H., Kabumbu, C., and Banda, K.: Luangwa Rift Seismogenic Source Properties (v1.0), Zenodo [data set], https://doi.org/10.5281/zenodo.6513778, 2022b. a, b
USGS: U.S. Geological Survey, Earthquake Hazards Program, Advanced National Seismic System (ANSS) Comprehensive Catalog of Earthquake Events and Products: Various, https://doi.org/10.5066/F7MS3QZH, 2017. a, b
Utting, J.: An introduction to the geological history of the South Luangwa National Park, Zambia, Tech. Rep., Geological Survey Department Zambia, Special Publication, 1988. a, b
Valentini, A., DuRoss, C. B., Field, E. H., Gold, R. D., Briggs, R. W., Visini, F., and Pace, B.: Relaxing Segmentation on the Wasatch Fault Zone: Impact on Seismic Hazard, Bull. Seismol. Soc. Am., 110, 83–109, https://doi.org/10.1785/0120190088, 2020. a
Vittori, E., Delvaux, D., and Kervyn, F.: Kanda fault: A major seismogenic element west of the Rukwa Rift (Tanzania, East Africa), J. Geodyn., 24, 139–153, 1997. a
Vrána, S., Prasad, R., and Fediuková, E.: Metamorphic kyanite eclogites in the lufilian arc of Zambia, Contrib. Mineral. Petr., 51, 139–160, https://doi.org/10.1007/BF00403755, 1975. a
Wang, T., Feng, J., Liu, K. H., and Gao, S. S.: Crustal structure beneath the Malawi and Luangwa Rift Zones and adjacent areas from ambient noise tomography, Gondwana Res., 67, 187–198, https://doi.org/10.1016/j.gr.2018.10.018, 2019. a, b, c
Wedmore, L., Turner, T., Biggs, J., Williams, J., Sichingabula, H., Kabumbu, C., and Banda, K.: Luangwa Rift Active Fault Database v1.0 (v1.0), Zenodo [data set], https://doi.org/10.5281/zenodo.6513691, 2022. a, b
Wedmore, L. N., Williams, J. N., Biggs, J., Fagereng, Å., Mphepo, F., Dulanya, Z., Willoughby, J., Mdala, H., and Adams, B.: Structural inheritance and border fault reactivation during active early-stage rifting along the Thyolo fault, Malawi, J. Struct. Geol., 139, 104097, https://doi.org/10.1016/j.jsg.2020.104097, 2020a. a, b, c, d, e, f
Wedmore, L. N. J., Biggs, J., Williams, J. N., Fagereng, Å., Dulanya, Z., Mphepo, F., and Mdala, H.: Active Fault Scarps in Southern Malawi and Their Implications for the Distribution of Strain in Incipient Continental Rifts, Tectonics, 39, TC005834, https://doi.org/10.1029/2019TC005834, 2020b. a, b, c, d, e, f, g, h, i
Wedmore, L. N. J., Biggs, J., Floyd, M., Fagereng, Å., Mdala, H., Chindandali, P., Williams, J. N., and Mphepo, F.: Geodetic Constraints on Cratonic Microplates and Broad Strain During Rifting of Thick Southern African Lithosphere, Geophys. Res. Lett., 48, GL093785, https://doi.org/10.1029/2021GL093785, 2021. a, b, c, d, e, f, g, h, i
Wesnousky, S. G.: Predicting the endpoints of earthquake ruptures, Nature, 444, 358–360, https://doi.org/10.1038/nature05275, 2006. a
Wesnousky, S. G.: Displacement and geometrical characteristics of earthquake surface ruptures: Issues and implications for seismic-hazard analysis and the process of earthquake rupture, Bull. Seismol. Soc. Am., 98, 1609–1632, https://doi.org/10.1785/0120070111, 2008. a
Williams, J. N., Wedmore, L. N. J., Fagereng, Å., Werner, M. J., Mdala, H., Shillington, D. J., Scholz, C. A., Kolawole, F., Wright, L. J. M., Biggs, J., Dulanya, Z., Mphepo, F., and Chindandali, P.: Geologic and geodetic constraints on the seismic hazard of Malawi’s active faults: The Malawi Seismogenic Source Database (MSSD), Nat. Hazards Earth Syst. Sci. Discuss. [preprint], https://doi.org/10.5194/nhess-2021-306, in review, 2021.
Williams, J. N., Fagereng, Å., Wedmore, L. N. J., Biggs, J., Mphepo, F., Dulanya, Z., Mdala, H., and Blenkinsop, T.: How Do Variably Striking Faults Reactivate During Rifting? Insights From Southern Malawi, Geochem. Geophy. Geosy., 20, 3588–3607, https://doi.org/10.1029/2019gc008219, 2019. a, b
Williams, J. N., Mdala, H., Fagereng, Å., Wedmore, L. N. J., Biggs, J., Dulanya, Z., Chindandali, P., and Mphepo, F.: A systems-based approach to parameterise seismic hazard in regions with little historical or instrumental seismicity: active fault and seismogenic source databases for southern Malawi, Solid Earth, 12, 187–217, https://doi.org/10.5194/se-12-187-2021, 2021. a, b, c, d, e, f, g, h, i, j, k, l, m, n, o, p, q
Williams, J. N., Wedmore, L. N. J., Scholz, C. A., Kolawole, F., Wright, L. J. M., Shillington, D. J., Fagereng, Å., Biggs, J., Mdala, H., Dulanya, Z., Mphepo, F., Chindandali, P., and Werner, M. J.: The Malawi Active Fault Database: an onshore‐offshore database for regional assessment of seismic hazard and tectonic evolution, Geochem. Geophy. Geosy., 23, GC010425, https://doi.org/10.1029/2022GC010425, 2022. a, b, c, d, e, f, g, h, i, j
World Bank: Tectonic Shift Rift2018 Report, Tech. Rep., Washington DC, World Bank, https://www.gfdrr.org/en/publication/tectonic-shift-rift2018-report (last access: April 2022), 2019. a
Yang, Z. and Chen, W. P.: Earthquakes along the East African Rift System: A multiscale, system-wide perspective, J. Geophys. Res.-Sol. Ea., 115, 1–31, https://doi.org/10.1029/2009JB006779, 2010. a
Youngs, R. R. and Coppersmith, K. J.: Implications of fault slip rates and earthquake recurrence models to probabilistic seismic hazard estimates, Bull. Seismol. Soc. Am., 75, 939–964, 1985. a
Zambia Statistics Agency: Zambia Data Portal Central Statistical Office, Government of Zambia, https://zambia.opendataforafrica.org/xmsofg/total-population (last access: April 2022), 2022. a, b
Zhang, P., Slemmons, D. B., and Mao, F.: Geometric pattern, rupture termination and fault segmentation of the Dixie Valley-Pleasant Valley active normal fault system, Nevada, USA, J. Struct. Geol., 13, 165–176, https://doi.org/10.1016/0191-8141(91)90064-P, 1991. a
Zielke, O. and Strecker, M. R.: Recurrence of large earthquakes in magmatic continental rifts: Insights from a paleoseismic study along the Laikipia-Marmanet fault, Subukia Valley, Kenya rift, Bull. Seismol. Soc. Am., 99, 61–70, https://doi.org/10.1785/0120080015, 2009. a