the Creative Commons Attribution 4.0 License.
the Creative Commons Attribution 4.0 License.
 | 05 Dec 2022
Insights into the interaction of a shale with CO2
Eleni Stavropoulou
Lyesse Laloui
Caprock formations, such as shales, play a key role in safe underground CO2 storage since they serve as a hydromechanical barrier that prevents migration of the injected CO2 to the surface. While their hydromechanical response is important to ensure their sealing capacity, interaction with the injected CO2 involves additional thermo–hydro–chemo–mechanical (THCM) phenomena that may threaten the long-term integrity of the caprock. The low-transport properties of shales make them a suitable caprock material, but at the same time challenging to study due to the very long timescales (months/years) that are required for the various THCM processes to manifest. In this work, the long-term multiphysical interaction of the Opalinus Clay shale with liquid and supercritical CO2 is studied in 3D with live X-ray tomography. Three-dimensional analysis reveals the localised response of the coupled THCM processes that is often indistinguishable with conventional lab testing protocols. To improve spatial and temporal resolution while applying field-representative pressure and temperature conditions, small-sized samples are studied. Long-term injection of liquid CO2 resulted in significant fissuring of calcite-rich zones that were for the first time visualised and quantified from the X-ray images. Additionally, a re-arrangement of the pre-existing micro-fissures in the clay matrix was observed. The volumetric response during direct exposure of an Opalinus Clay sample to supercritical CO2 revealed an initial swelling at pre-fissured zones and initiation of new micro-fissures at areas of direct contact with the anhydrous CO2 due to pore water evaporation. Advanced 3D image analysis showed an increasing CO2 uptake in the caprock material with time, suggesting potential CO2 trapping in the material.
- Article
(12973 KB) - Full-text XML
- BibTeX
- EndNote


Geological CO2 storage (GCS) is an efficient way to permanently store large volumes of captured CO2, by subsurface injection at pressures higher than its critical pressure ( MPa), where it changes from a gaseous to liquid state and above a certain temperature level ( ∘C) to supercritical. This high pressure level strongly encourages the selection of deep reservoirs (min. 700–800 m depth), where the in situ water/brine pressure equilibrates the injected CO2 pressure. According to the most recent IPCC report (IPCC, 2022), carbon capture and storage (CCS) is key to reaching net-zero emissions by mid-century and mitigating climate change. Additionally, the need to implement CCS in a range of sectors including energy production, manufacturing and industry is underlined in the same report.
The feasibility of the technology relies on successful long-term subsurface storage, which depends – at least during the first few decades – on the performance of nearly impermeable geological formations (seal/caprock) that will prevent CO2 migration to the surface. Caprock formations, typically shales or other tight mudrocks, are highly heterogeneous in mineralogy with low-mass-transfer properties and high sealing capacity. However, their response to thermo–hydro–chemo–mechanical (THCM) loads remains a complex subject that deserves further inquiry.
Shales have been studied for decades by the oil and gas industry, more recently for their use as geological barriers for radioactive waste storage, but full understanding of their suitability for geological CO2 storage is still somewhat limited, since CO2 injection further complicates an already difficult engineering problem: (i) unlike water or brine, CO2 diffusion results in acidification of the in situ brine that can lead to chemical interactions in the caprock and alteration of its mechanical and transport properties (Yang et al., 2022); (ii) CO2 injection introduces stress state changes in both the reservoir and the overlaying caprock that can cause reactivation of pre-existing faults or creation of new fracture systems (Vilarrasa et al., 2019).
Significant progress on experimental data collection has been achieved on various scales (Armitage et al., 2010; Houben et al., 2013), related to both geomechanical response (Rutqvist, 2012; Wang and Tokunaga, 2015; Kivi et al., 2022) and chemical interactions (Wollenweber et al., 2010; Hadian and Rezaee, 2020) during exposure to CO2-rich fluids. Shales are anisotropic in their THCM response and highly heterogeneous in mineralogy at different scales (micro to macro). In particular, the strong geomechanical and geochemical couplings of shales often challenge our ability to distinguish the different occurring phenomena and estimate their timescale during CO2 exposure.
In recent years, the Opalinus Clay shale has been studied as a potential caprock in the context of geological CO2 storage (Amann-Hildenbrand et al., 2013; Favero et al., 2016b; Makhnenko et al., 2017; Sciandra et al., 2021) because of its favourable properties, such as low porosity (< 20 %), low permeability (on the order of 10−20 m2), high clay content (40 %–80 %), swelling properties and high sealing capacity (Marschall et al., 2005; Crisci et al., 2019; Delage and Belmokhtar, 2022). These favourable properties of Opalinus Clay (and shales more generally) make it a challenging material to study due to the slow flow processes at resolutions that may fall within the measurement error (Minardi et al., 2021).
Representative testing of shales remains a big issue. Testing conditions do not involve only the applied level of pressure or temperature but also the spatial and temporal scale of the measurement. Whereas large-scale experiments are generally considered to be more realistic, they can be challenging to properly monitor and analyse since they involve the combination of multiple phenomena that occur under different scales, in particular in heterogeneous materials such as shales. A real-scale experimental campaign has been recently completed at the Underground Research Laboratory (URL) in Mont Terri, where CO2-rich brine has been injected in an existing fault in Opalinus Clay (Zappone et al., 2021). The results have not been conclusive, mainly due to the low applied pressure, the small volume of injected CO2 and the long time duration that is required for transport phenomena to manifest on that scale. In parallel, recent lab-scale experimental results from CO2 injection tests in Opalinus Clay samples do not show evidence of significant influence on the fundamental properties of the material for the given test duration: grain density, dominant entrance pore size and void ratio, as well as hydraulic conductivity, do not vary in a considerable way after exposure to CO2 over a timescale of a few weeks (Minardi et al., 2021; Favero and Laloui, 2018). The short duration of these tests together with the sample size could be among the reasons for the absence of measurable evolution.
Representative testing conditions and duration are even more challenging when processes of geochemical nature are investigated. While shales contain minerals reactive to CO2, current lab measurements are not sufficient in identifying chemical interactions directly, since they rely either on post mortem analysis of fluid composition or mineralogy (Armitage et al., 2013; Elkady and Kovscek, 2020). The indirect interpretation of permeability results before and after CO2 exposure can be ambiguous in terms of chemical alterations. This is because they may involve self-compensating mechanisms such as carbonate dissolution, mechanical crushing and inelastic compaction, as shown by various authors who studied fractured caprock samples (Yasuhara et al., 2011; Hashemi and Zoback, 2021). It is thus difficult to build solid conclusions on the impact of chemical interactions on the structural properties of the material, and consequently on its transport and mechanical response.
Taking all the above into account, there is a series of issues when testing shales in the context of CO2 storage: (i) flow is extremely slow, resulting in long testing durations; (ii) measured permeability variations are close to the measurement error; (iii) reproduction of real site conditions is crucial since injection pressure, and therefore effective stress, has an important impact on properties of the material that drive flow and breakthrough, i.e. connected porosity; (iv) chemical interactions are limited by the slow transport properties of the material; (v) the testing duration is usually not enough to allow investigation in that direction.
In this work, the different coupled processes and phenomena that occur when CO2 interacts with a shaly caprock material – the Opalinus Clay – are explored based on a series of measurements and observations from real-time X-ray tomography. Taking full advantage of this non-destructive tool, new aspects and results are targeted aiming at improving our understanding of the caprock response under field-realistic testing conditions. The originality of the presented research relies mainly on two aspects: first, the study of smaller-sized samples, where the observation period is expected to be shorter, and second, on the direct measurement of strain fields and structural alteration from the 3D analysis of the tomographic images. In the following, the proposed methodology, tools and conventions of analysis are presented in detail. The results of two experimental campaigns where Opalinus Clay is exposed to either liquid or supercritical CO2 are presented and discussed. These experiments target different coupled mechanisms that, combined, aim to contribute to a more profound understanding of the overall THCM response of shales with CO2.
Shales are highly heterogeneous and anisotropic materials, sensitive to THCM variations, with strong multiphysical couplings and very slow transport properties (Mohajerani et al., 2014; Favero et al., 2016a; Menaceur et al., 2016; Li and Laloui, 2017). Inevitably, representative testing of shales requires the employment of methods and tools that can embrace these particularities. These should include controlled applied conditions and full-field measurement, i.e. a field record of a quantity (e.g. deformation, density, temperature, etc.) as opposed to pointwise data (Viggiani and Hall, 2008).
Taking into account all the above, the development of a new approach in testing shales with in situ X-ray tomography is motivated. In this study, the full field of micro-structural variations and kinematics of the Opalinus Clay shale when exposed to CO2 under different boundary conditions is targeted with 3D image analysis of real-time X-ray tomographies. Long-duration exposure of Opalinus Clay to injected liquid CO2 (8 MPa) under confined conditions (10 MPa) aims to reveal potential chemo–mechanical processes. Direct exposure of unjacketed Opalinus Clay to supercritical CO2 targets the better understanding of localised THCM interactions that are otherwise difficult to detect with conventional lab testing techniques.
Despite the classic testing approaches on centimetric-sized shale samples in the literature, in this work micro-samples (5 mm) are studied in order to first improve the temporal resolution (partly inspired by small-scale permeability testing equipment; Birmpilis et al., 2019; Birmpilis and Dijkstra, 2021) but also to optimise the quality of X-ray imaging (improved spatial resolution). This approach is challenging for the given material and the given subject. The pore size of shales is on the order of nanometres and thus impossible to visualise with X-ray micro-tomography (micrometric scale). Nonetheless, observation and quantification of microstructural modifications due to interaction with CO2 can be explored with high scanning resolutions (5–8 µm px−1) and fast tomographies thanks to the small size of the sample.
2.1 In situ X-ray micro-tomography and experimental protocol
A few authors have investigated the mineralogical heterogeneity and THCM anisotropic behaviour of shales, pointing out the role of the microstructure with the employment of different imaging techniques (Wang et al., 2013; Desbois et al., 2017; Delage and Tessier, 2021). In the case of experimental geomechanics, X-ray tomography is the most widely used technique, with a large range of results stated in the literature (Viggiani et al., 2015; Bedford et al., 2017; Vego et al., 2022; Birmpilis et al., 2022). The great advantage of X-ray tomography compared to other techniques for soil characterisation (e.g. scanning electron microscopy – SEM) is the possibility of identifying the mineralogical heterogeneity of the specimen in 3D and following its evolution in time (in situ testing). X-ray tomography is a very powerful tool that allows a better interpretation of test results, such as measured permeability, fissuring, localised deformation or structural modifications (Voltolini and Ajo-Franklin, 2020; Stavropoulou et al., 2020).
For this study, the dual X-ray source in the PIXE platform for X-ray micro-tomography (École Polytechnique Fédérale de Lausanne, EPFL, Switzerland) is used. Reconstructions are performed with the XAct software provided by RX Solutions (Annecy, France), with appropriate beam-hardening corrections applied. A cylindrical cell made out of PEEK (polyether ether ketone) is used for the application of the various boundary conditions that are explained in detail in the following sections. The so-called PEEKcell is fixed on the rotating table, as close as possible to the X-ray source, for a maximal use of the X-ray conical beam. All scans are performed in a temperature-controlled environment at 21 ∘C. The PEEKcell is designed to host 5 mm × 5 mm cylindrical samples and can sustain a maximal pressure and temperature of 20 MPa and 80 ∘C, respectively (Stavropoulou and Laloui, 2022a). An entry on each side of the cell (top and bottom) allows the application of confining pressure (top) and pore pressure (bottom) on the sample. The cell is disconnected from the pressure controllers and transported under the pressure state in the tomograph. To monitor the pressure level during the scans, a pressure transducer is placed on both ends (see Fig. 1).

Figure 1Left: PEEKcell set-up in the X-ray tomograph. Right: horizontal slice of a reconstructed X-ray image and the corresponding histogram of grey values.
The samples are cut to a cylindrical shape of d = h = 5 mm by cutting rectangular pieces with a saw, which were then reduced to the desired size manually using fine sand paper (P240). This technique has been preferred (to a mechanical lathe for example) in order to avoid overheating the sample during preparation. The resaturation of the samples has been achieved progressively under free swelling conditions by exposing the samples in a relative humidity (RH)-controlled environment with the use of an appropriate saline solution (Romero, 2001): first to RH = 75 % (NaCl) and then RH = 98 % (K2SO4) until mass stabilisation. Before testing, samples have achieved a close-to-full saturation state, corresponding to a measured water content wresat = 6.1 %–6.8 %, i.e. within the range of full saturation (Bossart and Thury, 2011).
In this work, first the micro-structural modifications due to long-duration CO2 exposure are investigated with post mortem measurements and analysis, i.e. after removing the applied pressures. Then, the occurring kinematics on Opalinus Clay that is exposed and in direct contact (no sealing membrane) with supercritical CO2 are examined with in situ measurements, i.e. while under pressure in the cell. According to the volumetric response of the sample and the corresponding grey values (GVs) of the X-ray images, the CO2 uptake is investigated and visualised.
When supercritical CO2 is injected, a thermal jacket is used around the cell, and the applied temperature is monitored with a thermal sensor that is placed between the jacket and the PEEKcell. For achieving a maximal resolution and X-ray penetration, the thermal jacket is removed during the scans. Inevitably, this leads to a CO2 phase change from supercritical (lower density) to liquid (higher density) and consequently to a pressure drop under constant volume conditions, i.e. conditions during scanning. The cell is exposed to the temperature of the scanner (21 ∘C) 2 h in advance while maintaining the pressure at the desired level (pressure pump connected), in order to avoid pressure loss due to phase change during the scan. The possible implications of this CO2 phase transition before the scans are discussed in the corresponding section of direct exposure to supercritical CO2.
2.2 Image analysis
The result of an X-ray tomography is a 3D X-ray attenuation map of the scanned sample that is associated with the 3D density map of the material. For instance dense phases in the material (non-clay mineral inclusions) attenuate more X-rays than lower-density phases (e.g. cracks, pores). The different density (attenuation) levels are reflected in the grey level values of the reconstructed 3D X-ray image. Higher GV corresponds to denser phases and lower GV to less dense phases, as indicated in Fig. 1 (right). Changes in the GV of a sample image in time or due to application of a different load allow the observation and quantification of localised micro-structural modifications (e.g. crack opening/closing, swelling/shrinking), which can subsequently be translated to 3D strain fields with digital volume correlation (DVC). In this work, the open-source SPAM software (Stamati et al., 2020) is used for the DVC analysis.
In DVC, two images are required, an initial (reference image) and a deformed one. In the case of local DVC (which is used for the image analysis in this work), a grid with a given node spacing is defined, and at each grid point a centred window is extracted. For each of these subvolumes a linear deformation function Φ is calculated so that imagedeformed (Φ⋅x) = imagereference(x). The function Φ accounts for translation, rotation and stretching, and its calculation is optimised by solving an iterative problem that minimises error based on the classic sum of squared difference (SSQD). Whereas DVC can calculate a strain field that can then be applied on an image, it does not take into account by definition the variations in GV due to the corresponding strain. Deformation-based GV correction as per Stavropoulou et al. (2020) is applied in this work, aiming to investigate phase changes due to chemical reactions between the material and the in-contact CO2.
For each type of test, all scans are performed under the same conditions and with the same scanning parameters. Nevertheless, noise, artefacts or other external changes may be present between the different scans. To improve the accuracy of image analysis and minimise the GV variations due to measurement conditions rather than real changes in the material, all images from the same testing campaign are normalised based on GV of materials, the density of which is not supposed to vary between the different scans (here PEEK and aluminium). GV normalisation results in scaling the given images so that the voxels that correspond to void are set to GV = 0, and those of PEEK correspond to GV = 1. The followed procedure is explained in detail in the Appendix.
Finally, the occasional rigid-body transformation of the sample (translation and rotation) is calculated based on a single Φ function for the entire image (so-called registration) and removed. DVC is then performed between the reference image and the deformed ones, from which rigid body motion has been corrected. The displacement field is then calculated and converted to strain assuming small transformations (see details in Stamati et al., 2020). The above principles and conventions are applied for the analysis of the different series of X-ray scans that are presented in the following.
In this section, the long-term chemo–mechanical interactions that can occur between CO2 and a shaly caprock are explored. First, a mineralogical analysis of different Opalinus Clay samples is performed with X-ray diffraction (XRD) measurements, in order to evaluate the mineralogical variability given the small size of the samples (5 mm × 5 mm). Then the mineralogical map of an Opalinus Clay sample is studied with SEM–EDX (scanning electron microscopy and energy-dispersive X-ray) measurements, and the identified mineral locations are directly compared and identified in the corresponding slices from the X-ray tomography image of the same sample. The goal of this combined analysis is twofold. On one hand, it aims at locating and showing the presence of elements in the sample that may favour chemical interactions in the long-term presence of CO2 (e.g. Ca, C, Si, S, O etc.). On the other hand, this analysis aims at evaluating the response of the identified mineral phases based on the occurring micro-structural modifications that are identified from X-ray tomography (fissuring, swelling, self-sealing etc.).
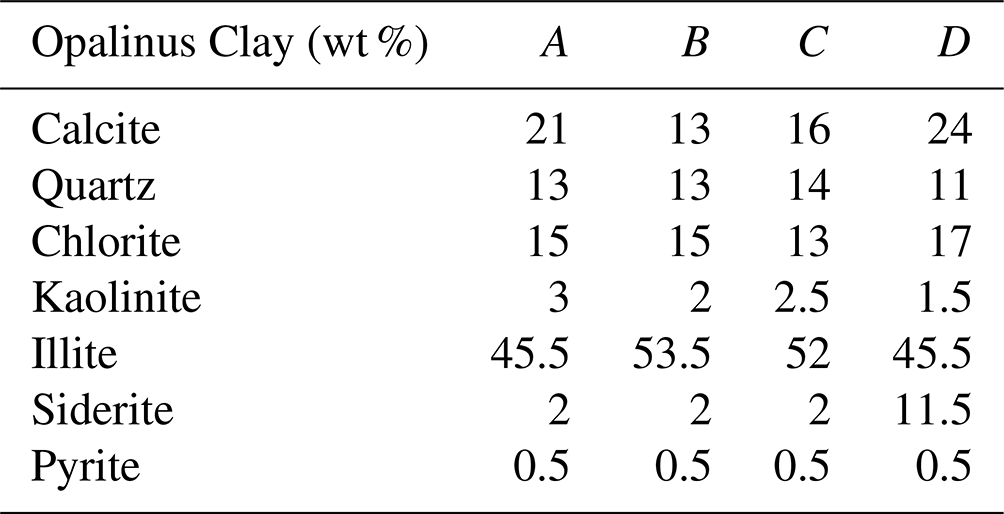
Table 1 shows the mineralogical composition of four sister Opalinus Clay samples (shaly facies) from XRD measurements. The fit was optimised on one sample, and to increase comparability, the next fits were done by keeping all refined parameters and replacing the data file on the current model. A similar quartz and clay content is measured for all samples except for illite that presents variations up to 8 %. In the lower illite-rich samples a higher calcite content is measured with values that vary among the different samples from 13 % to 24 %. The different content values that are presented for sample A (in bold) are measured after long-term exposure to CO2. It presents a high calcite content that is unclear if it is affected in any way by its previous interaction with CO2 since its overall mineral content falls within the variability in the other three untreated samples. Nevertheless, even after long-term CO2 exposure, the mineralogical composition of sample A does not vary in a significant way compared to the other three untreated samples. Sample A is used to compare the results from all different imaging tools that are employed for this study.
Table 1Mineralogical composition of four sister Opalinus Clay samples based on X-ray diffraction.
The mineralogical nature of the non-clay inclusion phases of the X-ray tomography images are identified with SEM–EDX measurements. The height of the sample is carefully reduced to the height of the horizontal slice of Fig. 2a using sandpaper (the traces of which are apparent in the SEM images). Figure 2 presents the combined information obtained from both X-ray tomography and SEM–EDX at the same horizontal slice. In Fig. 2a, the different GV levels of the X-ray slice highlight the distribution of the different inclusions in the clay matrix, the mineralogy of which is identified from the EDX analysis. There are two sets of inclusions as revealed from the GV histogram plotted in Fig. 2b. This becomes more significant by taking into account that a second peak representing the lower-GV inclusions is visible after the applications of a bilateral filter.
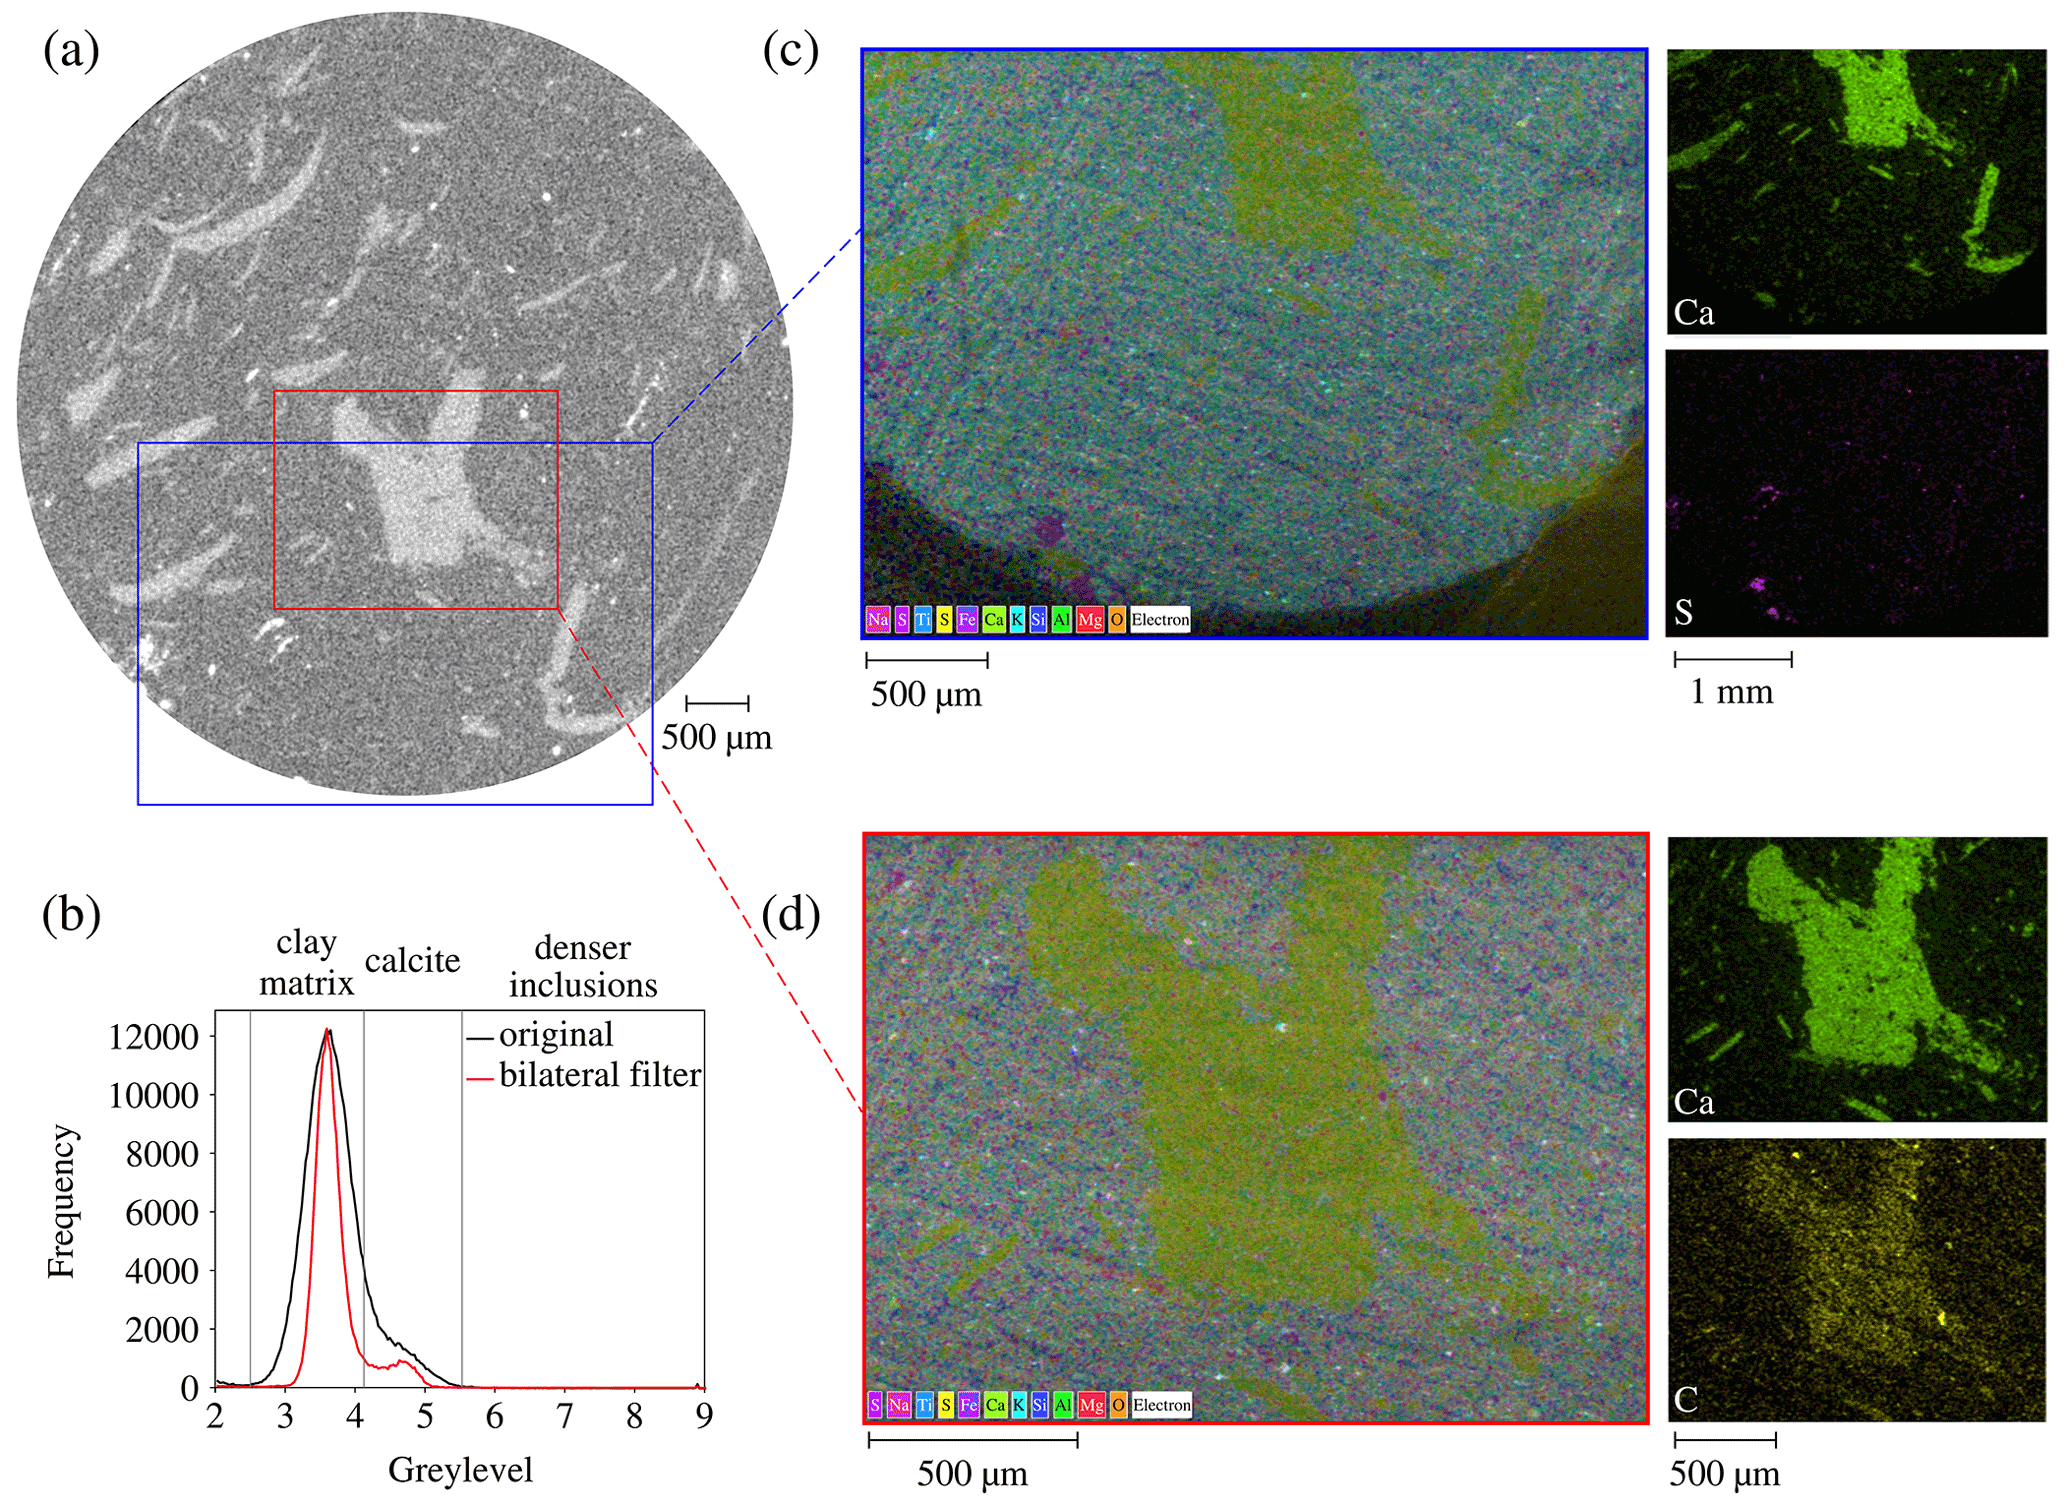
Figure 2Identification of the inclusions' mineralogy combining X-ray tomography and SEM–EDX: (a) horizontal X-ray tomography slice, (b) histogram of GVs of the top horizontal slice, (c) SEM–EDX map corresponding to the blue window of the X-ray slice highlighting all identified elements and the areas rich in Ca and S, (d) SEM–EDX map corresponding to the red window of the X-ray slice highlighting all identified elements and the areas rich in Ca and C.
These lower-GV-level inclusions are rich in calcium (Ca) and carbon (C), i.e. calcite (CaCO3), as revealed from the EDX images (Fig. 2a and d). These carbonate inclusions are therefore prone to react (dissolve) in the presence of CO2. The denser inclusions (brighter inclusions in Fig. 2a at the bottom left of the sample) seem to be rich in sulfur (S) (see Fig. 2c), a main element of pyrite (FeS2), the density of which is very high.
Sample A is the same sample that has been used in Stavropoulou and Laloui (2022a). It was first scanned in the X-ray tomograph under unconfined conditions, then after application of confinement (10 MPa) CO2 was injected up to a pressure of 8 MPa (pixel size 7.8 µm). After CO2 breakthrough, it was held under constant volume conditions in the PEEKcell for 9 months and scanned again in the X-ray tomograph after pressure release (same pixel size and scanning parameters). It is important to mention that there was pressure loss during these 9 months that was not properly monitored: during the last 5 months the confining pressure was reduced to half and the CO2 pressure to 1 MPa. Nevertheless, the results generate great interest, and the possible impact of this pressure loss is discussed in Sect. 5.

Figure 3Horizontal and vertical slices of X-ray tomography on the same Opalinus Clay sample with highlighted fissures (in black) under unconfined conditions at its initial state (left) and after 9 months of CO2 exposure (right). The horizontal slices (top) highlight the fissuring of the carbonate phase due to dissolution and the self-sealing of the pre-existing fissures in the clay matrix under long-term confinement; the vertical slices (bottom) highlight the fissure rearrangement and change in orientation that took place in time.
Figure 3 shows a horizontal and vertical slice of two X-ray scans of sample A, initially and after 9 months of CO2 exposure, both in unconfined conditions. In its initial state, the sample contains a series of pre-existing fissures in the clay matrix of vertical orientation, i.e. similar to the bedding orientation. After 9 months of CO2 exposure there are two important observations to be pointed out. First, clear fissures in the carbonate phases have been formed, suggesting calcite dissolution for the first time from X-ray images under realistic pressure and temperature conditions. In addition to the fissuring of the carbonate inclusions, a disappearance of the initially pre-existing fissures in the clay matrix is observed.
For a better understanding of the micro-structural modification of the sample after long-term CO2 exposure, the orientation of the minimum eigenvectors of the moment of inertia is calculated for each identified inclusion and micro-fissure. This corresponds to the longest axis of each labelled inclusion or micro-fissure. The 3D orientations together with their projection in the 2D plane are plotted in Fig. 4. Both types of orientation plots are presented for a better demonstration of the result of each studied phase. The 3D histogram is more comprehensible for the orientation of the cracks and the 2D projection for the inclusions. For this analysis, a bilateral filter has been applied on the two images to reduce noise and to smoothen the edges between the different phases (clay/cracks, clay/inclusions). In this way a better segmentation of the phases of interest (cracks and inclusions) can be achieved.
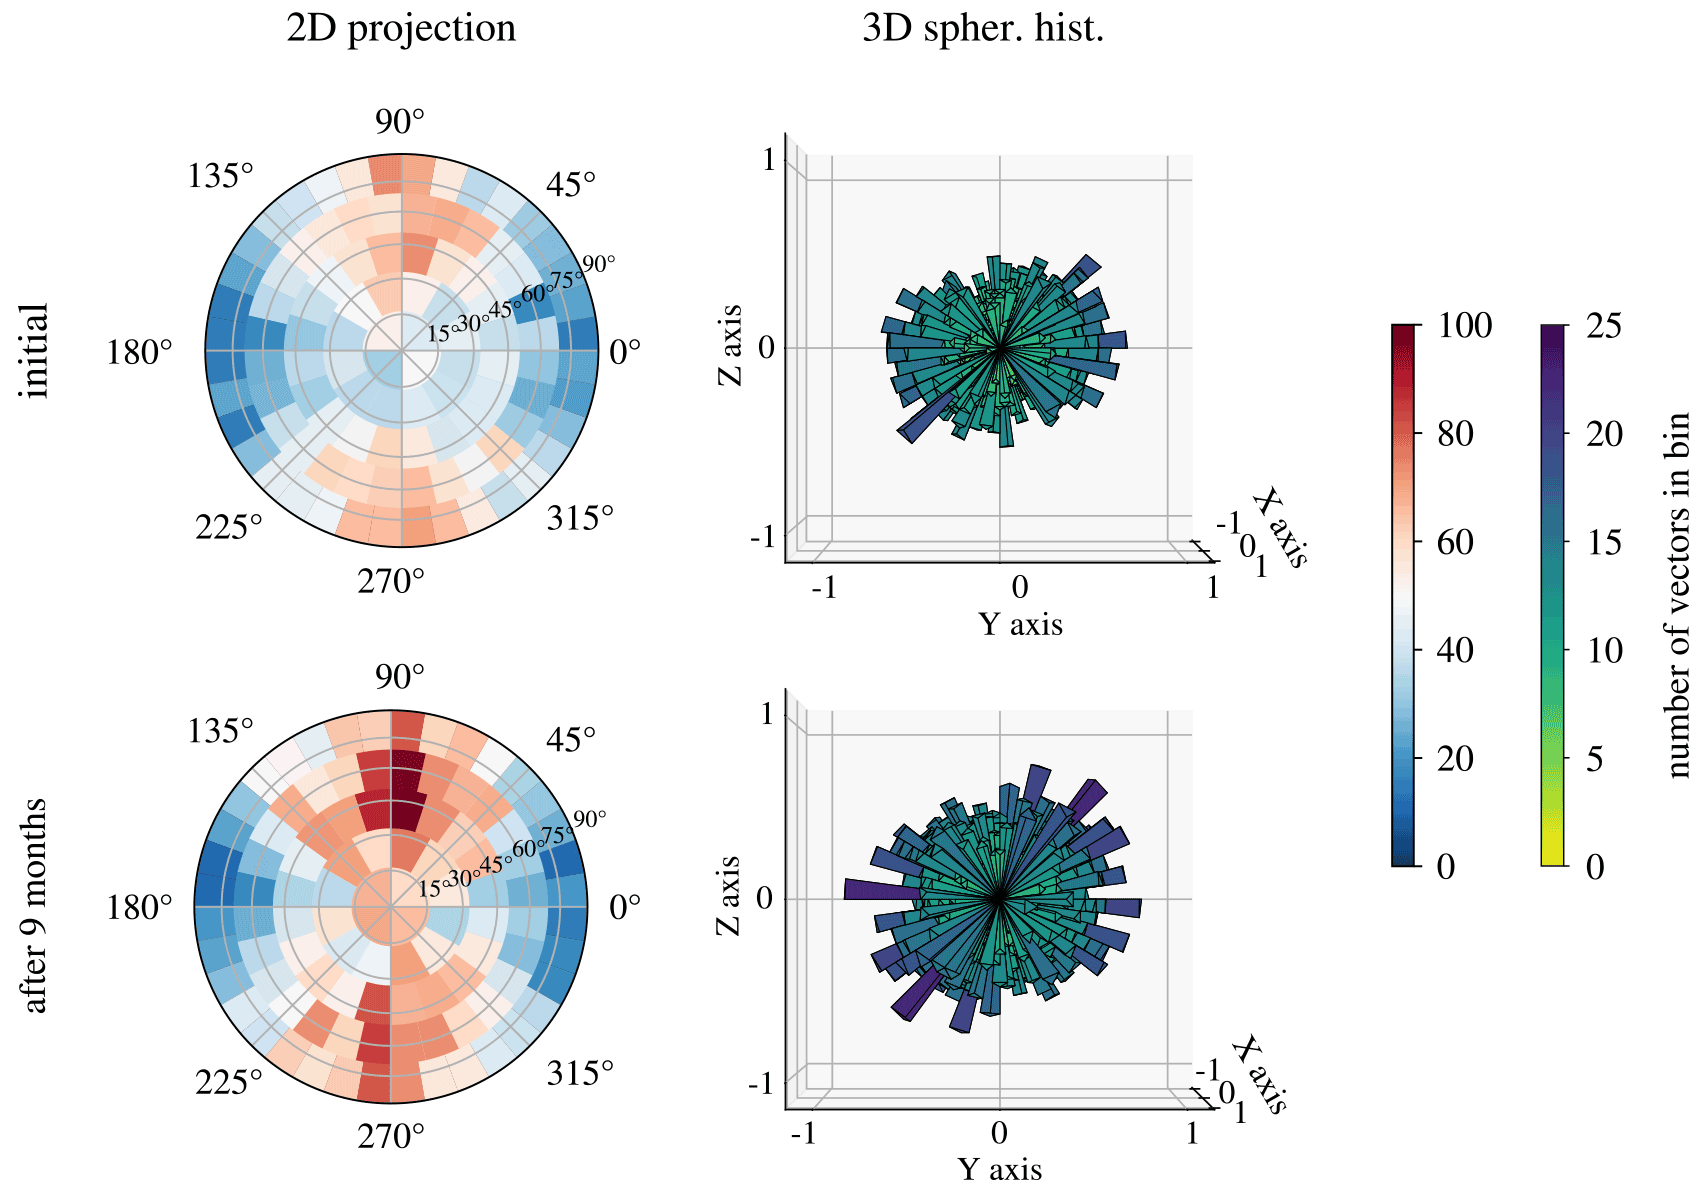
Figure 4A 2D projection (left) and spherical histogram (right) of the minimum eigenvectors of sample 02 inclusions, initially and after 9 months of exposure to CO2.
The 2D projection of the minimum eigevectors of the inclusions reveals a preferential orientation along the vertical axis – i.e. axis parallel to the bedding plane – both initially and after 9 months of exposure (Fig. 4). The vertical axis of the 2D plots is parallel to the Y axis of the spherical histograms that are plotted in this view to demonstrate the orientation of the eigenvectors on the ZY plane. After 9 months of exposure to CO2 the population of inclusions is increased, as demonstrated by both plots at the bottom of Fig. 4. This increase in the number of inclusions is considered to be an indication of carbonate dissolution that resulted in fissuring of the calcite inclusions and consequently identification of more numerous inclusion particles. The main orientation axis after dissolution remains vertical, suggesting that fissuring in the carbonate particles has mainly occurred along the shortest axis and therefore perpendicularly to the bedding plane.
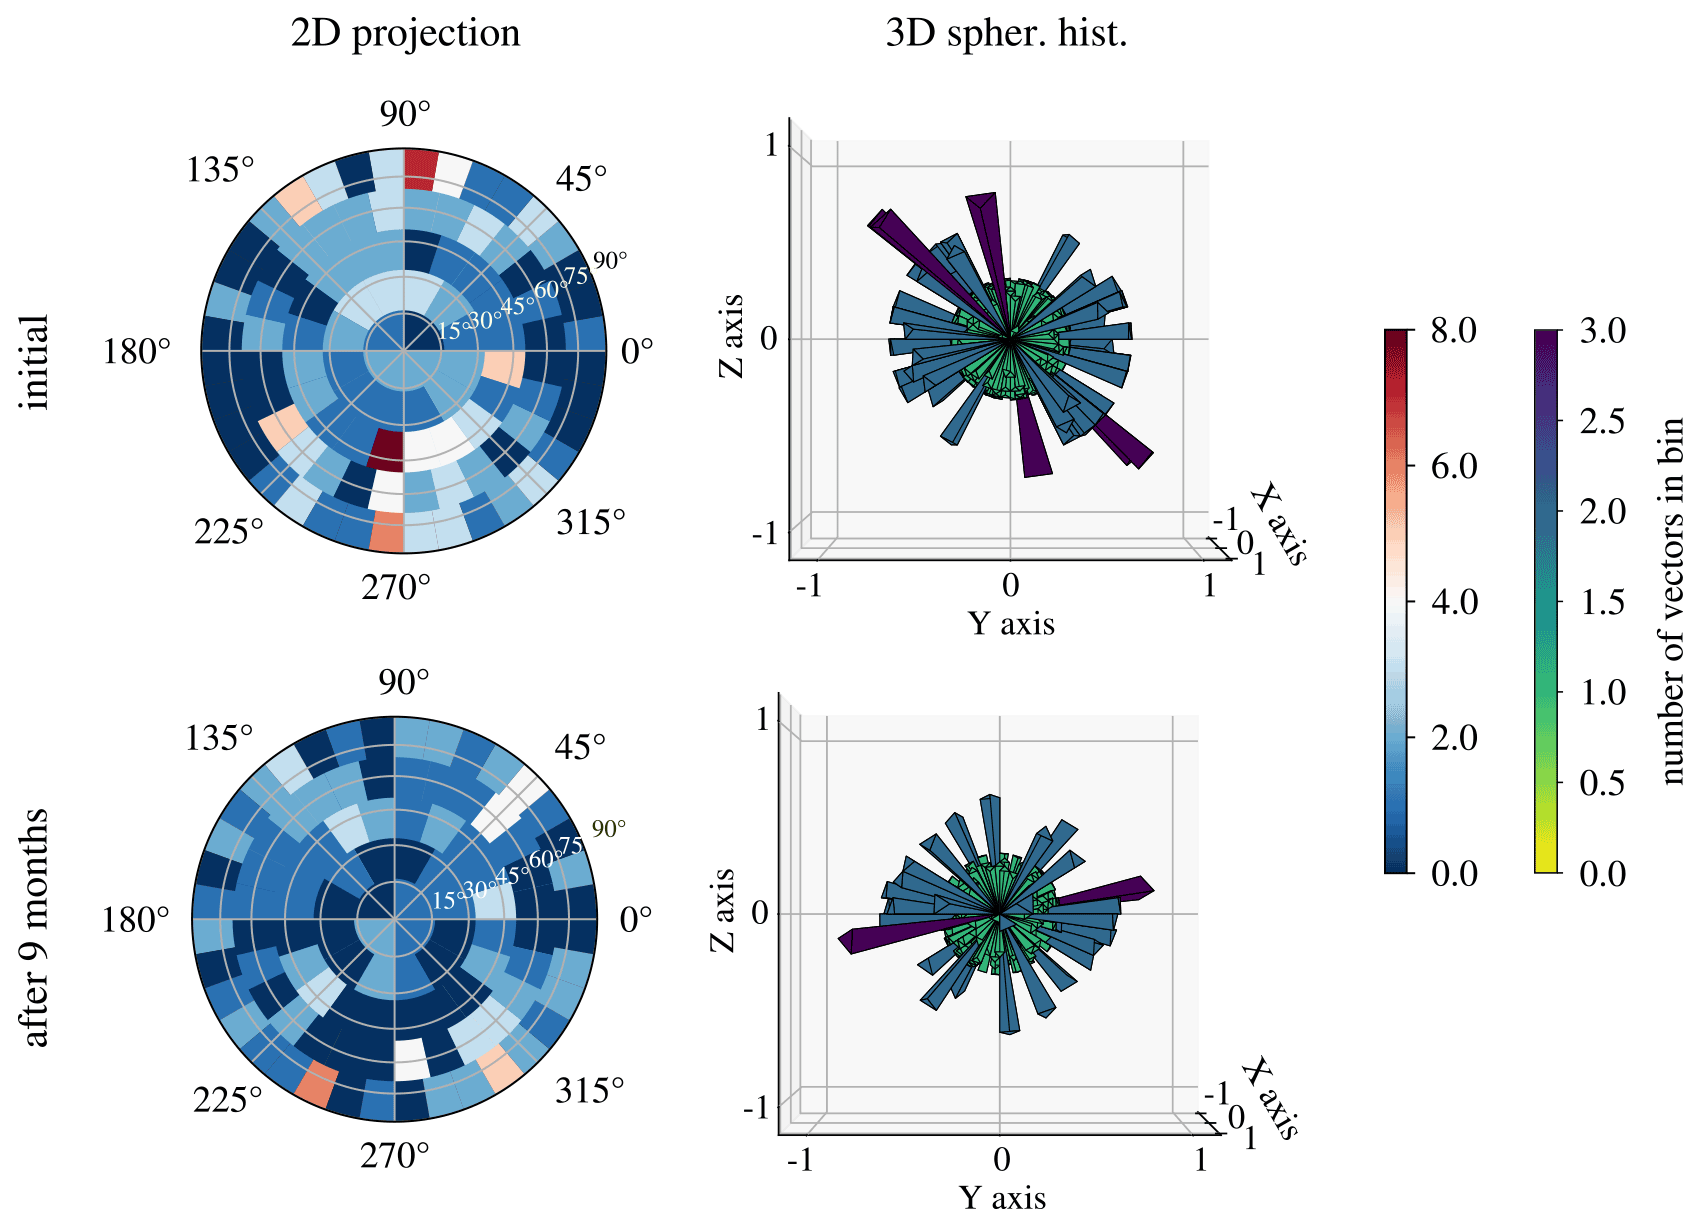
Figure 5Spherical histogram of the minimum eigenvector of the inclusions and the cracks in sample A, initially and after 9 months of exposure to CO2 (colour represents the number of projected points per bin divided by the median number of points in all bins).
In a similar way, the 2D projection and the spherical histograms of the minimum eigenvector of the identified cracks in the sample are plotted in Fig. 5: initially and after 9 months of CO2 exposure. The initial shape of the 3D histogram reveals the preferential orientation of the micro-fissures parallel to the bedding plane. This is confirmed by the high number of vectors projected on the vertical axis of the 2D plot. After 9 months of CO2 exposure, the shape of the 3D crack histogram is modified. On one hand, the number of cracks is reduced, and on the other hand, the orientation of the main pre-existing cracks is no longer parallel to the bedding.
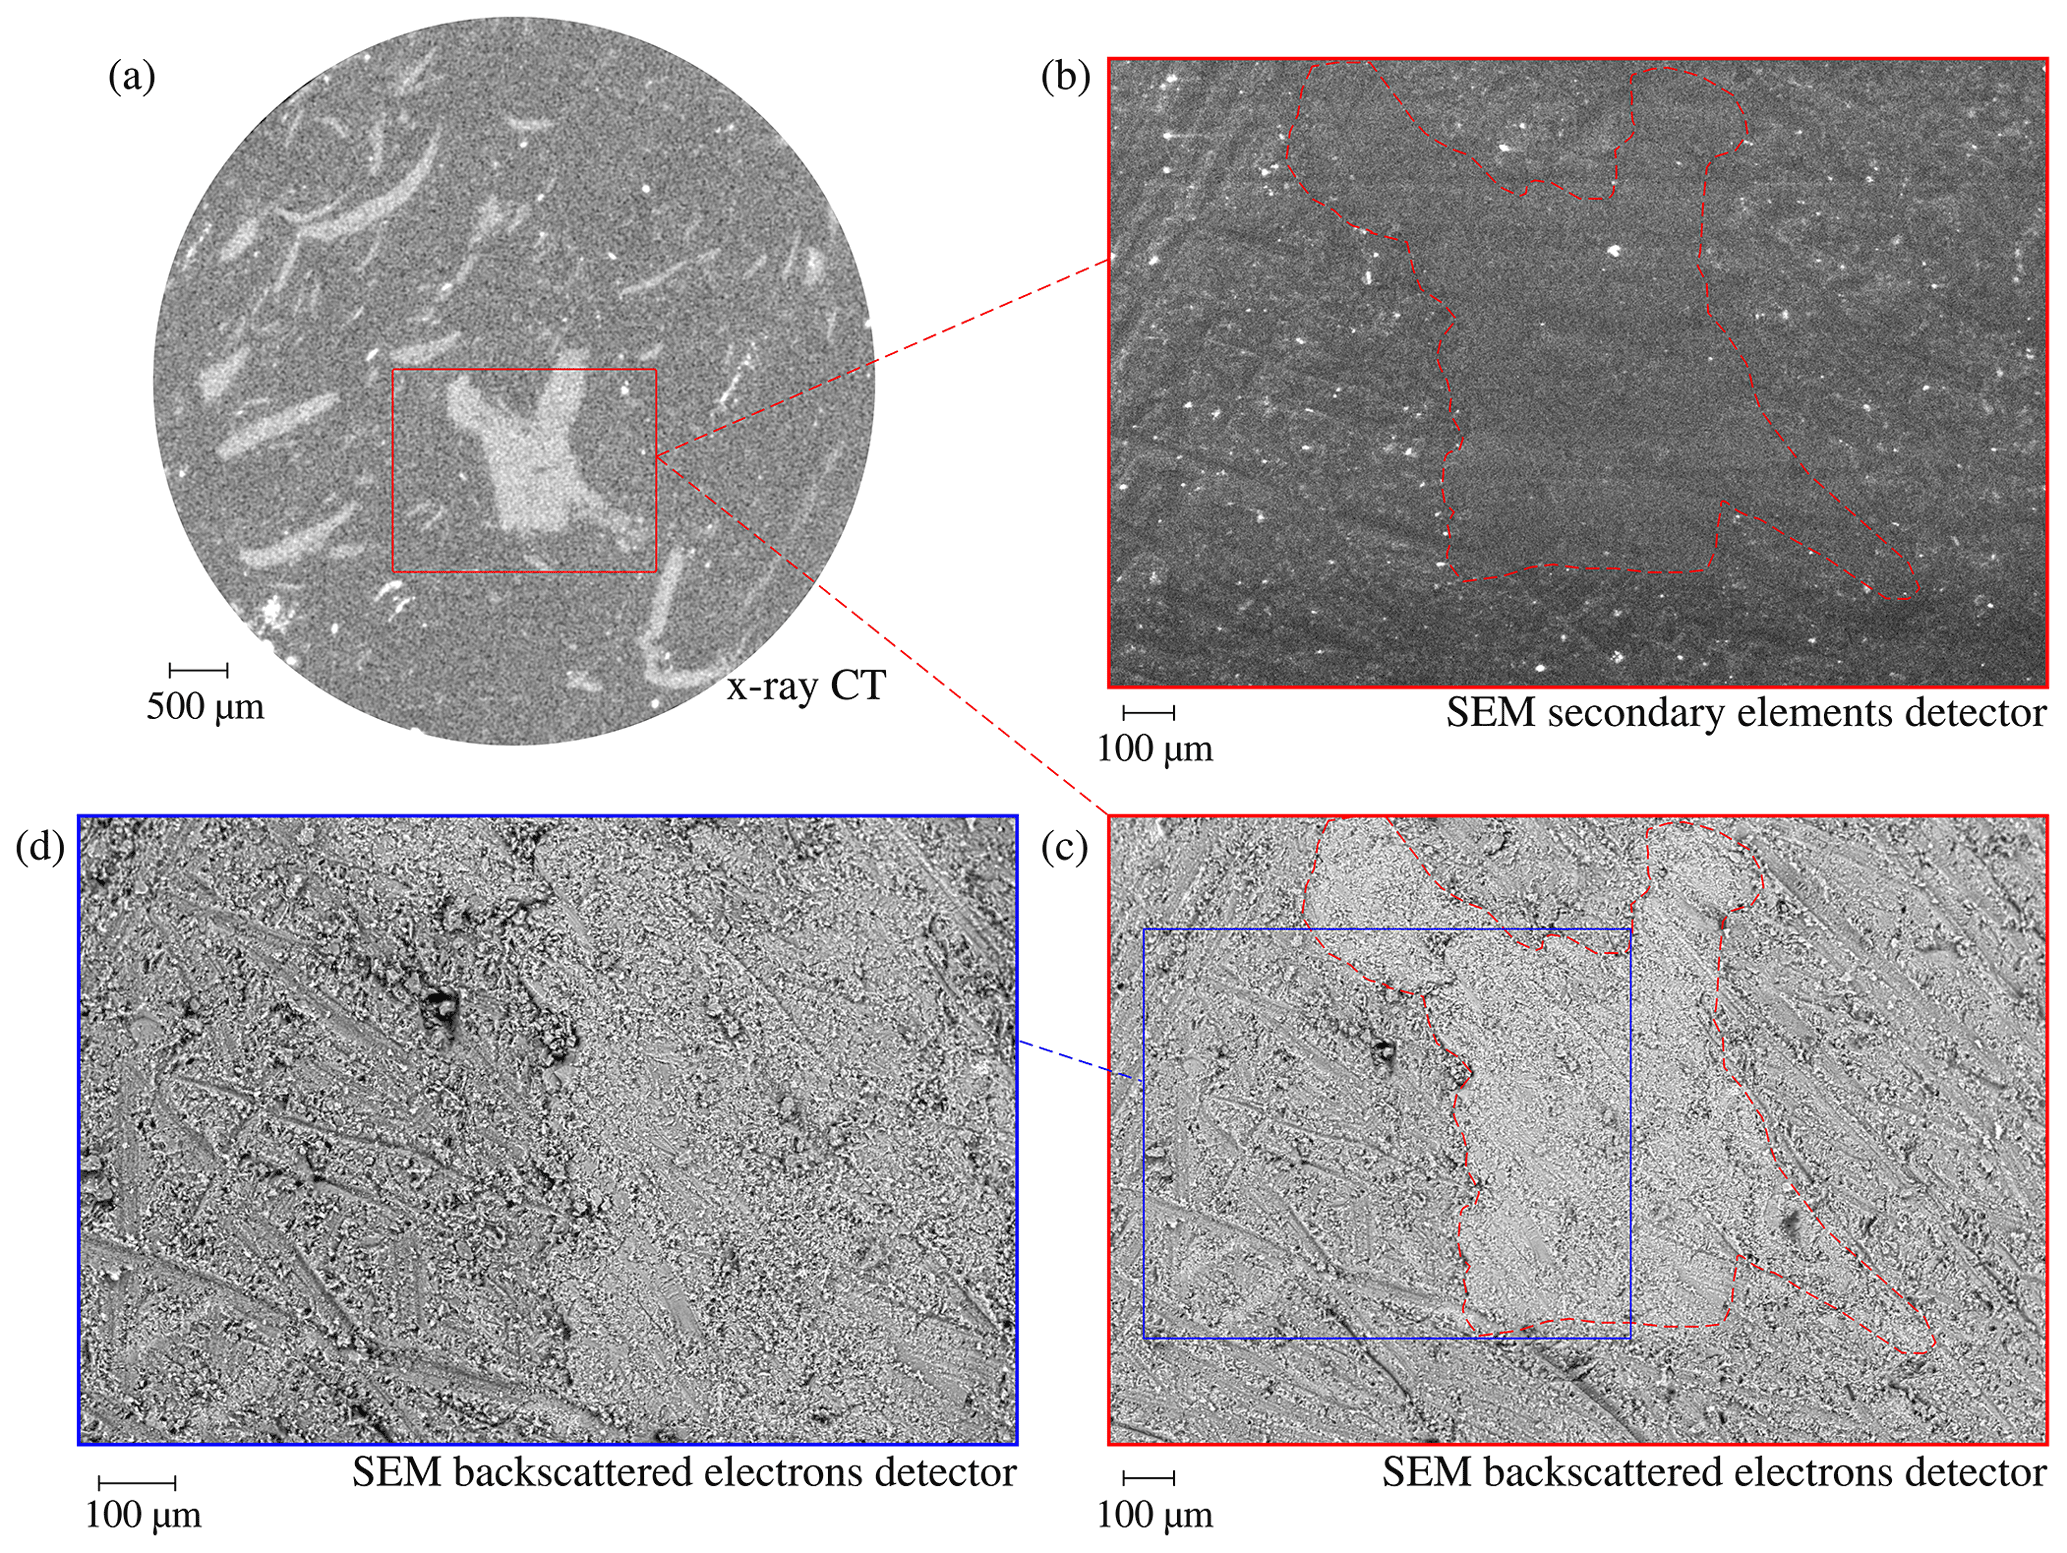
Figure 6Horizontal slice of the Opalinus Clay sample A from different imaging tools: (a) X-ray computed tomography, (b) corresponding SEM slice scanned with a secondary-element detector, (c) corresponding SEM slice scanned with a backscattered-electron detector (d) magnified selected region of (c).
Finally, with the aim of a better visualisation of the texture of the carbonic inclusions, the SEM image of the same (unpolished) slice as in Fig. 2 is presented in Fig. 6. For the SEM images, two detectors have been used: (top) a secondary-element detector that basically illustrates the surface topography and (bottom) a backscattered-electron detector that shows a Z contrast; i.e. lighter elements (such as Si, Al, O and K) are darker, and heavier elements (here Ca or C) are brighter. The secondary-element detector does not reveal any information regarding the targeted inclusion other than the fewer sandpaper traces that are more obvious on the softer clay matrix. On the other hand, the backscattered-electron detector provides a better distinction between the two phases. The higher resolution of SEM allows a better visualisation and understanding of the interface between the carbonate inclusion and the clay matrix that is otherwise not visible from the X-ray images. Even though the resolution is still at the micrometric scale, and no nanometric pores can be detected in either type of images, a distinct calcite–clay interface of increased porosity is revealed in the zoomed area of the bottom SEM image (blue window). These results confirm the findings of Minardi et al. (2021) on carbonate-rich Opalinus Clay shale that identified a bimodal pore size distribution, with a second dominant pore size between 50–100 µm corresponding to the interface of carbonate and clay particles.
In this part, the interaction of an Opalinus Clay sample with supercritical CO2 is evaluated in time by means of quantitative 3D X-ray image analysis. The unjacketed (no membrane) caprock sample is exposed from all sides (equilaterally) to direct contact with supercritical CO2 at p = 10 MPa and T = 34∘C pressure and temperature conditions, respectively. For the study of its volumetric and micro-structural response, regular X-ray scans (5.38 µm px−1 resolution) are performed. The water-saturated sample is mounted in the PEEKcell, and a first scan (00) is performed under ambient unconfined conditions. CO2 is then introduced in the cell in direct contact with the sample. The target pressure and temperature are applied and maintained stable over a period of 56 d. Further scans of the sample are performed while under pressure in the PEEKcell after 13 d (scan 01), 30 d (scan 02) and 56 d (scan 03) of CO2 exposure. A final scan is performed after the release of pressure and temperature (scan 04 at 56 d).
4.1 Volumetric response
The 3D volumetric response of the caprock material under the above-mentioned conditions is evaluated and quantified by means of DVC analysis. As explained earlier, to properly compare and analyse the acquired images, the occasional rigid-body transformation (translation and rotation) is removed so that the images are well aligned, as shown in the left column of Fig. 7. The middle vertical slice of the tested sample reveals the pre-existence of three principal horizontal fissures parallel to each other and parallel to the bedding orientation of the sample, i.e. perpendicular to the vertical axis of the sample. These micro-fissures with an initial maximum aperture of ≈ 30 µm may have been induced during sample preparation and/or during resaturation under free swelling conditions. Their existence is not necessarily an issue for the given study. On the contrary they can provide important insight into the impact of their presence upon interaction with CO2. For instance, an increasing opening of the bottom fissure can be observed in time, directly from the X-ray slices in Fig. 7 (left). Moreover, the creation and propagation of additional new micro-fissures at the bottom of the sample can be observed with time, as highlighted in the same slices.

Figure 7Volumetric response of the Opalinus Clay sample in time after exposure to supercritical CO2. Left: middle vertical slice of the X-ray CT image with the zone of increased cracking activity highlighted in red. Right: corresponding map of volumetric strain from DVC analysis.
For a more quantitative analysis of the localised response of the sample, the volumetric strain is calculated in 3D between each scan and the initial state of the sample (scan 00) that is used for reference. For the DVC analysis, the chosen parameters (half window size, node spacing etc.) are detailed with the additional provided data online. The map of the calculated volumetric strain of the middle vertical scan slices is presented in the right column of Fig. 7. It must be noted that the reported values of measured volumetric strain, total (εvol) and maximum (εvol,max), correspond to the entire 3D volume. In all scans a more pronounced expansion is measured on the location of the lowest pre-existing micro-fissure (εvol,max). Only after 2 months of CO2 exposure (scan 03) may a slight expansive activity be measured around the other two pre-existing ones. The overall expansive response of the sample (positive εvol) is clearly dominated by the expansion of the fissures. A distinct pattern is absent in the rest of the material, but the calculated volumetric strain reveals an initial expansion ( = +0.041) that in time reduces ( = +0.027) and stabilises ( = +0.024). Finally, upon pressure decrease, the material expands in a more pronounced way ( = +0.090), not only at the lower crack zone but everywhere in the sample due to stress relaxation. These results are discussed in detail in a following section.
4.2 CO2 uptake
The visualisation and quantification of CO2 penetration in the material is presented in this part, based on analysis of the GV evolution of the X-ray images after correction for volumetric strain (Stavropoulou et al., 2020). This approach is quite challenging in the context of CO2 uptake, since the density variations due to supercritical CO2 invasion are very slight (unlike the case of a denser fluid). This is why normalisation of the GVs is imperative for this kind of analysis (see Appendix).

Figure 8Fields of the grey value changes in the caprock material in time after removing the changes due to volumetric strain; the chosen colour bar represents density (in terms of GV) increase (red) or decrease (blue).
The maps of the GV variation are presented in Fig. 8. A density decrease is observed overall during the first month of exposure (00–01 and 00–02). Even though these results are somewhat noisy, a more pronounced density decrease is obtained, at the lower part of the sample, where crack initiation occurs. On the other hand, around the zones of the pre-existing fissures a density increase is measured. In this case the zones around the fissures are possibly filled in with CO2. It has to be noted that this approach is even less accurate around the crack locations. This is because the obtained fields are the result of the subtraction between the initial least fissured image (00) with a future deformed image (e.g. 02) that has more fissures. The application of the calculated deformation field on 00 cannot create these new fissures, and therefore, the density will always be decreased in the direct vicinity of the fissures (blue).
Two months after CO2 exposure, the overall density of the material increases homogeneously, if not more noticeably around the lower pre-existing fissure. It is interesting to notice that between scans 02 and 03 the volumetric activity that was measured is almost negligible. This density increase under constant volume reveals the saturation of the material with CO2. Unlike the previous two fields, here the material seems to be in equilibrium indicating that CO2 has invaded it in its entity. Final CO2 pressure release (00–04) leaves the sample with an overall increased density, in particular at the zones around the fissures and at the bottom. This final result may indicate chemo–mechanical or CO2 trapping phenomena that occurred during the 2-month exposure. The different results are discussed in the following section.
5.1 Long-term CO2 exposure
Long-duration exposure of Opalinus Clay to CO2 showed micro-structural modifications, in both the clay matrix and the carbonate zones in the material. When CO2 is placed in contact with the pore water of the shaly caprock material, it results in acidification of the pore fluid – by means of diffusion – and therefore in alteration of the chemical equilibrium. For instance, pre-existing carbonate crystals might be dissolved by the acidic fluid and enhance the transport properties of the material (Busch et al., 2008; Espinoza et al., 2011; Jia et al., 2018).
In this study, the identified cracks in the calcite zones of Opalinus Clay after long-term interaction with CO2 are associated with dissolution effects. Even though calcite dissolution has not been previously observed to result in fissuring, the fissures in the calcite zones of the material reveal a localised activity within these zones. Calcite dissolution in shales is mainly identified indirectly by post mortem analysis of either injected fluids or solid samples. In this work, the visualisation of large calcite inclusions allows the observation of micro-structural modifications that occur locally, within the area of interest (i.e. the calcite zones). Possible desaturation of the sample is not likely to explain the creation of these localised fissures, since desiccation cracks in shales appear mainly within the clay matrix or at the interface of the clay matrix with other inclusions (calcite, pyrite etc.). Fissuring in the clay matrix is however not observed even after total pressure release (unconfined conditions). On the contrary, the number of pre-existing fissures initially in the sample is reduced. This additionally ensures the potential impact of progressive pressure loss during these 9 months of exposure. Pressure loss may result in desaturation and fissuring of the sample (usually parallel to the bedding orientation) that have not been observed at the given resolution of this study.
Fissure closure can be explained by means of hydromechanical self-sealing behaviour of the material under long-term confinement. The self-sealing response of shales is one of the main properties for which this material is studied as a potential sealing material in a broader context of underground storage, such as radioactive waste, CO2 or hydrogen storage (Bossart et al., 2019; Di Donna et al., 2022, Yu et al., 2022). Hou et al. (2022) discussed the self-sealing response of caprock materials in terms of mineral precipitation. They showed that in illite-rich shale precipitation took place in quartz, i.e. Si-rich zones. In the current study, Si-rich zones are unfortunately not distinguishable from either the SEM or X-ray images. Prakash et al. (2022) pointed out a more pronounced precipitation activity in zones parallel to the direction of the bedding plane. This is in line with the identified orientation of fissures in the sample before and after confinement and CO2 exposure. The pre-existing fissures that were parallel to the bedding orientation disappear, and the fewer fissures after long-term confinement and CO2 exposure are in their majority no longer parallel to the bedding. Other works have shown that incorporation of supercritical CO2 in micro-structural interlayers can induce the beneficial swelling of smectitic clays (Alemu et al., 2011; Busch et al., 2016). This aspect is discussed in more detail in the following section, in association with the measured volumetric response of the material.
Finally, it is not clear whether these new fissures are the result of further chemical reactions due to alteration of the pore fluid's pH or whether they are related to mechanical impact from previous CO2 breakthrough (see 3D volumetric response after breakthrough in Stavropoulou and Laloui, 2022a). In either case, this result points out a potential rearrangement of the fissure network after long-term CO2 exposure that has not been previously discussed. Most importantly, these results on the micro-structural modifications show how little we still know regarding the coupled long-term THCM response of the caprock–CO2 interaction at the micro-scale and their implications to the large-scale response. Longer-duration testing under realistic boundary conditions is required for a better understanding of the complex mechanisms that occur.
5.2 THCM response
The volumetric response of Opalinus Clay to direct equilateral exposure of supercritical CO2 presented an increased activity around the zones of the three pre-existing micro-fissures. First, an overall volumetric expansion was measured (scan 01) resulting from the temperature increase for the application of supercritical conditions, i.e. from ambient 25 to 34 ∘C. This initial expansion may be additionally related to smectite swelling upon exposure to supercritical CO2 (Busch et al., 2016). Expansion was then followed by compaction until stabilisation of the volumetric strain in time, with some elevated values around the bottom fissure and the bottom of the sample.
The interpretation of this response is not straightforward since the sample is subjected to complex THCM boundary conditions. In theory, the application of constant pressure equilaterally and directly in contact with a water-saturated sample is not supposed to affect the applied effective stress that should remain zero. In other words, since CO2 is provided equilaterally on the unjacketed sample, the concept of effective stress is not valid, nor is the concept of hydraulic fracturing with the increase in pore pressure, as it is the same with the applied skeleton pressure. However, the presence of pre-existing fissures suggests that the sample is in reality not fully saturated and that matric suction (negative pore pressure) must be present locally in the fissured and partially saturated zones. Upon introduction of high-pressure CO2, suction breakdown occurs locally (decrease in effective stress), and the sample swells until stabilisation at full saturation – water and CO2. This hydromechanical interpretation can confirm the initial volumetric activity that eventually stabilises in time. Zhang et al. (2018) have previously addressed evolution of the axial effective stress of partially water-saturated montmorillonite upon injection of supercritical CO2 (10 MPa and 44 ∘C). They evaluated the swelling stresses of the material under different levels of confinement and attributed them to expansive smectite response. Otherwise, smectite swelling has been mostly observed under unconfined conditions (Schaef et al., 2012; De Jong et al., 2014; Michels et al., 2015). In this study, the boundary conditions are different but closer to unconfined conditions, with zero effective stress globally but not necessarily locally.
Another important aspect that has been discussed little in the literature is the desiccation of the material when in contact with CO2 (Espinoza and Santamarina, 2010; Miri and Hellevang, 2016; Cui et al., 2021). The pore water of the material evaporates in the anhydrous CO2, resulting in desaturation which can result in further crack opening (expansion) and pore collapse in the clay matrix. Desiccation could explain the lower volumetric expansion in time until eventual equilibrium. This little-discussed interaction can occur in real field conditions at the bottom of the caprock formation in contact with the buoyant CO2, leading to partial desaturation of the caprock and threatening its mechanical integrity and sealing capacity.
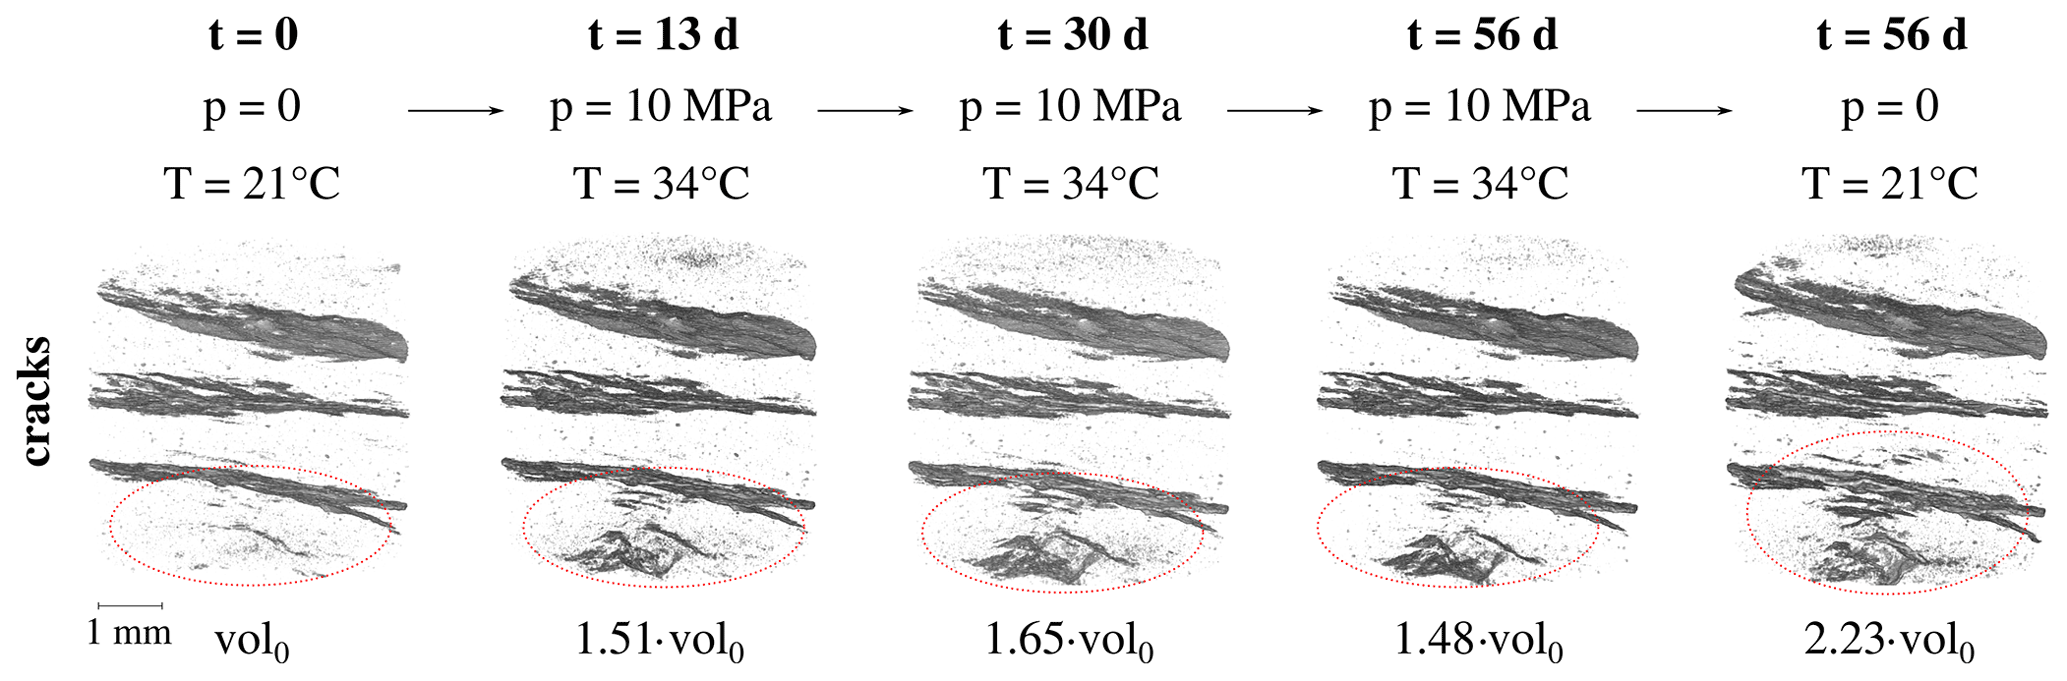
Figure 9Evolution of pre-existing fissures and appearance of new ones (encircled zones) after direct exposure to supercritical CO2 (illustration in 3D).
To better understand the impact of the aforementioned coupled THCM mechanisms, the volumetric evolution of the fissures in the different scans is calculated and presented in Fig. 9. For this calculation, the same GV threshold has been used for all the normalised scans. Whereas the volumetric increase in the pre-existing fissures has already been identified from the calculated volumetric maps of the entire sample, Fig. 9 reveals the creation and propagation of a new family of fissures at the bottom of the sample. These new fissures demonstrate in a clear way the desiccation effect of anhydrous CO2 explained above. Additional chemo–mechanical mechanisms (such as dissolution) may contribute to the initiation of these micro-fissures that are noticeably localised in a calcite-rich area at the bottom of the sample (see X-ray images in Fig. 7). Eventual dissolution aspects are hard to interpret since preferential fissuring patterns in calcite-rich zones may be due to the increased porosity between the calcite interfaces and the clay mineral interface (as shown in Fig. 6).
Phenomena related to pore fluid alteration, e.g. water evaporation in the anhydrous CO2, alteration of the pore fluid pH due to CO2 diffusion or eventual invasion of CO2 in the material, have been addressed by measuring the evolution of the density (GV) of the material in time while accounting for the corresponding volumetric strain. The density decrease that is observed overall during the first month of exposure (see 00–01 and 00–02 in Fig. 8) can be explained by the desaturation of the sample discussed earlier. Invasion of anhydrous CO2 in the material partially occurs through water evaporation; therefore the material is filled up with a fluid of lower density. The following density increase can be attributed to both pore fluid changes and CO2 uptake in the material. Geochemical interactions between the invading supercritical CO2 and the solid matrix of the material cannot be easily argued from the obtained results. For example, potential swelling of smectite has already been accounted and corrected in the given density maps, and all density changes are related to mass-related changes (uptake or loss). This is a first attempt to visualise CO2 invasion in a caprock material, and even though it is quantitative in terms of GV levels, the physical interpretation in terms of, for example, actual CO2 volume increase or water decrease requires further studies and measurement for the calibration of GVs of the different phases.
5.3 Implications for geological CO2 storage
In this work, a series of coupled phenomena that take place in a shaly caprock material have been addressed and discussed based on qualitative and quantitative measurements of 3D X-ray tomography images. The various THCM mechanisms that have been demonstrated are related to some extent to the equivalent testing conditions: stress state, CO2 pressure and time exposure, water saturation/desiccation, mineral dissolution, and precipitation. However, field conditions are different than these testing conditions. For instance, the levels of effective stress in a CO2 storage site are much higher, on the order of 10 to 20 MPa (depending on the storage depth). Consequently, the stress state of the material has an impact on the appearance of fissures. The fissures in the calcite-rich zones of the material have been visualised in an unconfined sample state (scan taken after pressure release). Similarly, desiccation fissures due to water evaporation in the invading anhydrous CO2 might not manifest (at the given resolution) under elevated levels of effective stress. However, drying of the caprock due to interaction with undissolved CO2 is a phenomenon that might take place at the interface between the reservoir and the caprock due to the buoyant tendency of CO2. Desiccation of the caprock can have implications that can threaten the caprock integrity and sealing capacity, for example facilitating CO2 breakthrough. The exact CO2 breakthrough pathway in the caprock is not easy to predict because of the high micro-structural heterogeneity of the material. The connected pore space (including fissures) is supposed to drive flow and breakthrough phenomena; however, the different competing mechanisms (e.g. desiccation, local effective stress modification) may result in the collapse of initially conductive pathways and the creation of new ones. There has been previous evidence of such phenomena in gas migration tests (Harrington et al., 2012; Cuss et al., 2014). The results of this study and their interpretation demonstrate the importance of considering the different localised effects for a better understanding of the long-term response of shales in the context of geological CO2 storage. Macroscopic or averaged measurements and observations that do not take into account the micro-structural heterogeneity of shales are limited for the development of representative constitutive and numerical models.
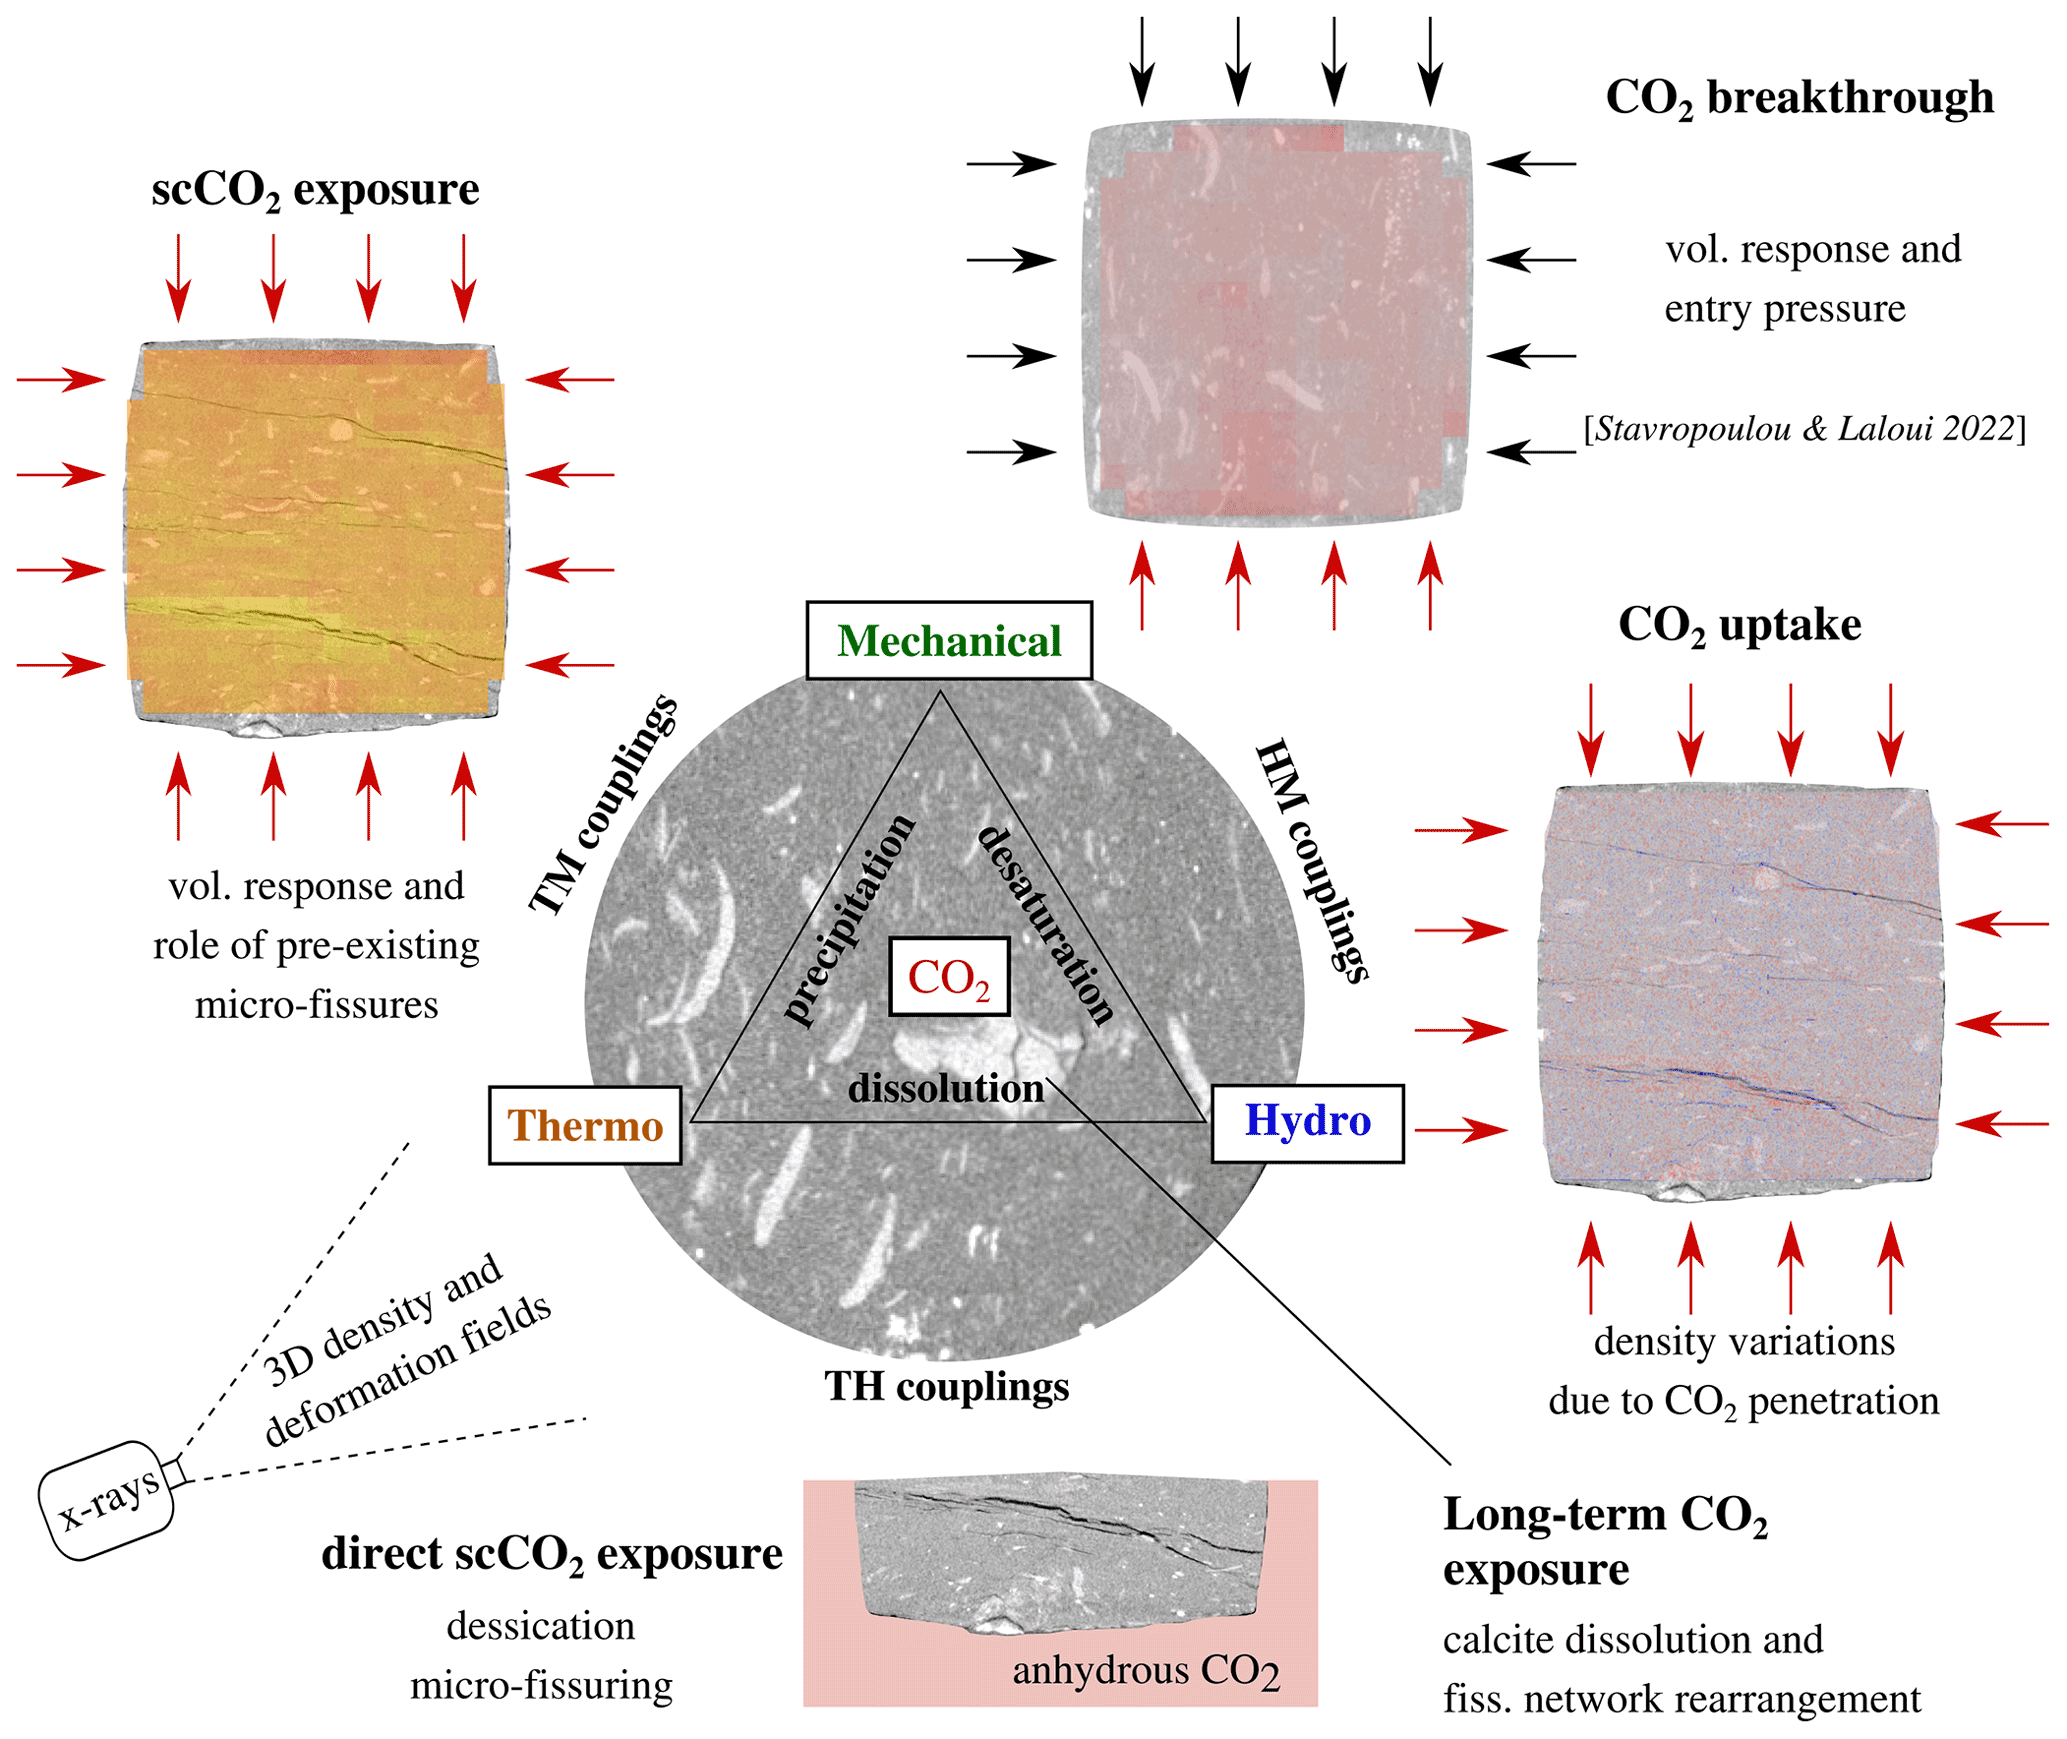
Figure 10Coupled THCM mechanisms studied with in situ X-ray imaging on small-sized shale samples.
In this work the interaction between the Opalinus Clay, a caprock representative material, with CO2 is studied with X-ray tomography imaging. The different results and observations reveal the complex response of this material due to multiple coupled phenomena that occur in parallel. Exposure to supercritical CO2 implies temperature increase in the material that results in thermal expansion (TM coupling). This expansion leads to inevitable desaturation of the material (TH coupling). At the same time, the live observation of the caprock material in time revealed another important aspect when anhydrous CO2 is in contact with the water-saturated sample. The pore water evaporates in the anhydrous CO2, causing further desiccation of the material that starts fissuring. Fissures, whether pre-existing in the material or new ones, play an important role in the CO2–caprock interaction. They drive most of the volumetric and hydraulic phenomena: swelling, desaturation, uptake, breakthrough. In the field, fissures in the caprock formation could be found around the injection wellbore or fault zones, but their impact is still not well understood.
The long-term impact of CO2 on the micro-structure of a shaly material (the Opalinus Clay) is for the first time visualised with X-ray tomography on a solid sample and under non-extreme temperature and pressure conditions (< 40 ∘C and 10 MPa, respectively). Fissuring of calcite-rich zones after 9 months of CO2 exposure is associated with dissolution-related effects (CM coupling). The mineralogical composition of these denser inclusions in the X-ray images has been confirmed from SEM–EDX measurements. Segmentation and labelling of the inclusions before and after long-duration CO2 exposure confirmed an increased number of inclusions due to fissuring, the mean orientation of which did not significantly evolve. A similar analysis has been made on the fissure network in the clay matrix of the sample before and after long-term exposure. The principal crack orientation in the sample is initially parallel to the bedding orientation of the shaly material. These fissures close with the application of confinement, as shown in Stavropoulou and Laloui (2022a), but do not re-appear 9 months later, after pressure release. This result demonstrates the self-sealing response of Opalinus Clay that can be attributed to a series of mechanisms: long-term hydromechanical loading (HM coupling), expansive smectitic response, mineral precipitation of Si-rich zones (CM couplings). In addition to the closure of pre-existing fissures, the X-ray scan after 9 months revealed the appearance of new micro-fissures in the clay matrix (other than the fissures in the calcite zones), surprisingly in a perpendicular direction to the bedding. This aspect of potential re-arrangement of the fissure network of the material is demonstrated for the first time and could be related to additional chemo–mechanical mechanisms within the clay matrix or related to CO2 breakthrough that due to self-sealing of the initial micro-fissures initiated a new optimal pathway throughout the sample. The preferential pathway of CO2 breakthrough is not yet well understood in such heterogeneous microstructures and may induce fissuring of different orientation than the in situ bedding.
Finally, the CO2 uptake in the caprock material has been investigated by combining the calculated strain fields and the GV variation in the acquired X-ray images. CO2 penetration in the sample was identified 2 months after initial exposure. It is hard to interpret the multi-phase fluid interaction in the porous space of the material prior to 2 months due to the multiple THCM phenomena that take place simultaneously and often counteract each other. It is significant that after CO2 release the density of the sample remained increased compared to the initial 2 months earlier, revealing potential CO2 trapping in the material.
Figure 10 highlights the different coupled mechanisms that have been identified in this work to occur during the CO2–caprock interaction. These topics require undoubtedly further investigation with long-term experiments under continuously monitored conditions. Analysis of the response using a non-destructive tool, i.e. X-ray tomography, allows the 3D study of the material locally, in zones where the different phenomena are prone to occur. For instance, the evolution of calcite inclusions within the sample or sealing of pre-existing fissures in the clay matrix is visualised and quantified locally in the sample, unlike previous studies where such interactions have been discussed from more macroscopic/averaged results. The study of small shale samples has significantly contributed to the better understanding of the various coupled phenomena, first by achieving better time resolutions and then by studying the response of the material under high spatial resolutions in 3D, revealing mechanisms previously undetectable with conventional testing methods and resolutions. These phenomena include the volumetric response and water evaporation during exposure to supercritical CO2, the localised chemo–mechanical interactions in calcite-rich zones, the CO2 uptake and the role of micro-fissures in the material, and the volumetric response upon CO2 breakthrough.
For the analysis of the attenuation evolution of the images, the different scans are normalised always using scan 00 for reference. The objective of this normalisation is to set the voxels that correspond to void to zero in order to be able to more reliably detect density variations. The normalisation is performed considering the parts of the image that are not supposed to vary in density with time, i.e. PEEK and aluminium. Since the void attenuation changes with the introduction of CO2, the ratio of the grey values (GV) between aluminium, PEEK and air is considered constant, as shown in Fig. A1.
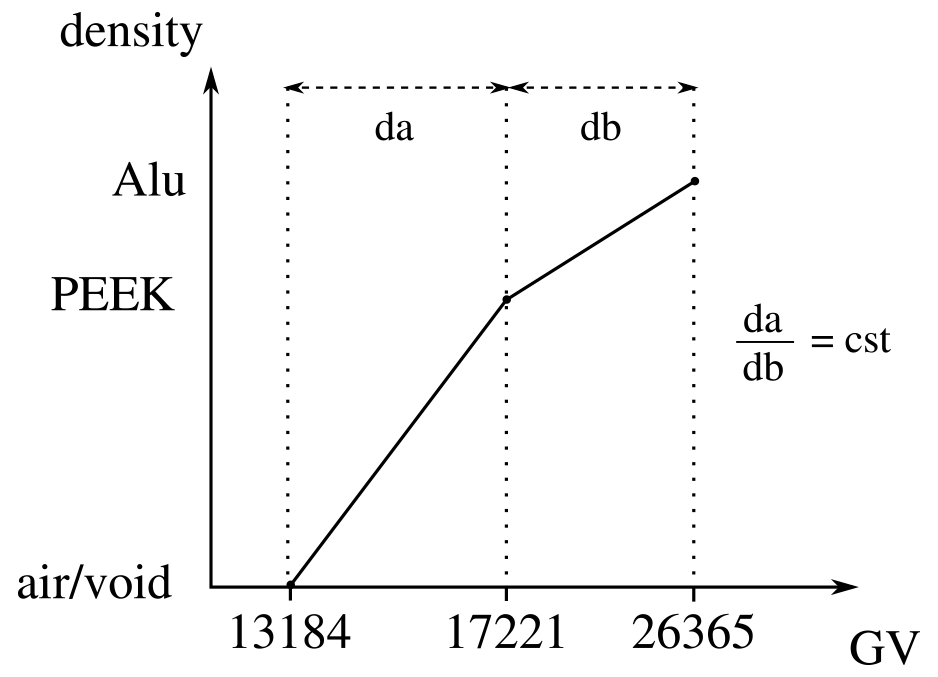
This ratio is calculated from the reference scan 00 (first row of Table A1) and considered constant in order to deduce the air grey value of the rest of the scans. The computed GV of air (first column of Table A1) is then subtracted from each scan, which is then divided by the corresponding PEEK value so that PEEK average value is 1 for the sake of simplicity. The histogram of scan 00 after normalisation is shown in Fig. A2a, while the histogram after CO2 introduction (scan 003) is changed to that in Fig. A2b. The GV normalisation of the different scans can improve the volumetric analysis (DVC), and it is indispensable for the detection of density variations.
Table A1Measured (normal font) and calculated (bold font) mean grey values (and standard deviation/error in the parentheses) of the parts of the scan that are not expected to vary in density with time for the normalisation of the images.
Figure A2Grey value histogram of normalised (a) scan 00 (no CO2) and (b) scan 01 (with CO2).
The different steps for the segmentation for the different types of phases are illustrated in Fig. B1. First, a bilateral filter is applied on the original image in order to smoothen the zones of similar phases and sharpen the edges between different phases (Fig. B1a).
The distributions of the GV levels before and after the application of this filter are plotted in Fig. B2. A narrower distribution is obtained after the bilateral filter, providing more precision for the selection of each GV range for the segmentation of the different phases. The resulting segmented slices of the inclusions and the micro-fissures after the application of a threshold GV range are shown in Fig. B1b and c, respectively. In the case of the inclusions, a double cycle of dilation and erosion of the binary image has been applied in order to reduce noise. This is not possible for a further noise reduction of the fissures' segmented image due to their 1 px thickness.
Figure B1Horizontal slices after the (a) application of a bilateral filter, (b) segmentation of the two types of inclusions (calcite and denser inclusions) and (c) micro-fissures.
Figure B2Grey value histogram of the original horizontal X-ray slice and after the application of bilateral filter of Fig. B2a.
The 3D X-ray images that have been used in this paper are provided online at Zenodo (https://doi.org/10.5281/zenodo.7330452; Stavropoulou and Laloui, 2022b). Additional data and results can be provided by the authors upon reasonable request.
ES conceived, designed, executed and analysed the presented work, as well as wrote the manuscript. LL contributed to the intellectual analysis of the results and reviewed the manuscript.
The contact author has declared that neither of the authors has any competing interests.
Publisher’s note: Copernicus Publications remains neutral with regard to jurisdictional claims in published maps and institutional affiliations.
The authors wish to thank the PIXE platform (EPFL) for the assistance during the X-ray tomography scans, as well as the Mont Terri laboratory and swisstopo for providing the tested Opalinus Clay material.
This research has been supported by the Schweizerischer Nationalfonds zur Förderung der Wissenschaftlichen Forschung (grant no. CRSK-2_196559).
This paper was edited by David Healy and reviewed by Johanna Heeb and Andreas Busch.
Alemu, B. L., Aagaard, P., Munz, I. A., and Skurtveit, E.: Caprock interaction with CO2: A laboratory study of reactivity of shale with supercritical CO2 and brine, Appl. Geochem., 26, 1975–1989, https://doi.org/10.1016/j.apgeochem.2011.06.028, 2011.
Amann-Hildenbrand, A., Bertier, P., Busch, A., and Krooss, B. M.: Experimental investigation of the sealing capacity of generic clay-rich caprocks, Int. J. Greenh. Gas Con., 19, 620–641, https://doi.org/10.1016/j.ijggc.2013.01.040, 2013
Armitage, P. J., Worden, R. H., Faulkner, D. R., Aplin, A. C., Butcher, A. R., and Iliffe, J.: Diagenetic and sedimentary controls on porosity in Lower Carboniferous fine-grained lithologies, Krechba field, Algeria: A petrological study of a caprock to a carbon capture site, Mar. Petrol. Geol., 27, 1395–1410, https://doi.org/10.1016/j.marpetgeo.2010.03.018, 2010.
Armitage, P. J., Faulkner, D. R., and Worden, R. H.: Caprock corrosion, Nat. Geosci., 6, 79–80, 2013.
Bedford, J., Fusseis, F., Leclère, H., Wheeler, J., and Faulkner, D.: A 4D view on the evolution of metamorphic dehydration reactions, Sci. Rep., 7, 1–7, https://doi.org/10.1038/s41598-017-07160-5, 2017.
Birmpilis, G. and Dijkstra, J.: Testing sensitive clays through time and length scales, IOP C. Ser. Earth Env., 710, 012021, https://doi.org/10.1088/1755-1315/710/1/012021, 2021.
Birmpilis, G., Hall, S. A., Lages, S., and Dijkstra, J.: Monitoring of the nano-structure response of natural clay under mechanical perturbation using small angle X-ray scattering and digital image correlation, Acta Geotech., 14, 1965–1975, https://doi.org/10.1007/s11440-019-00832-8, 2019.
Birmpilis, G., Andò, E., Stamati, O., Hall, S. A., Gerolymatou, E., and Dijkstra, J.: Experimental quantification of 3D deformations in sensitive clay during stress-probing, Géotechnique, 1–12, https://doi.org/10.1680/jgeot.21.00114, 2022.
Bossart, P. and Thury, M.: Characteristics of the Opalinus clay at Mont Terri, Reports of the Swiss Geological Survey, 3, 2011.
Busch, A., Alles, S., Gensterblum, Y., Prinz, D., Dewhurst, D. N., Raven, M. D., Stanjek, H., and Krooss, B. M.: Carbon dioxide storage potential of shales, Int. J. Greenh. Gas Con., 2, 297–308, https://doi.org/10.1016/j.ijggc.2008.03.003, 2008.
Busch, A., Bertier, P., Gensterblum, Y., Rother, G., Spiers, C. J., Zhang, M., and Wentinck, H. M.: On sorption and swelling of CO2 in clays, Geomechanics and Geophysics for Geo-energy and Geo-resources, 2, 111–130, https://doi.org/10.1007/s40948-016-0024-4, 2016.
Crisci, E., Ferrari, A., Giger, S. B., and Laloui, L.: Hydro-mechanical behaviour of shallow Opalinus Clay shale, Eng. Geol., 251, 214–227, https://doi.org/10.1016/j.enggeo.2019.01.016, 2019.
Cui, G., Zhu, L., Zhou, Q., Ren, S., and Wang, J.: Geochemical reactions and their effect on CO2 storage efficiency during the whole process of CO2 EOR and subsequent storage, I. J. Greenh. Gas Con., 108, 103335, https://doi.org/10.1016/j.ijggc.2021.103335, 2021.
Cuss, R., Harrington, J., Giot, R., and Auvray, C. : Experimental observations of mechanical dilation at the onset of gas flow in Callovo-Oxfordian claystone, Geol. Soc. Lond. Sp. Publ., 400, 507–519, https://doi.org/10.1144/SP400.26, 2014.
Delage, P. and Belmokhtar, M.: Drained triaxial testing of shales: insight from the Opalinus Clay, Acta Geotech., 17, 2855–2874, 2022.
Delage, P. and Tessier, D.: Macroscopic effects of nano and microscopic phenomena in clayey soils and clay rocks, Geomechanics for Energy and the Environment, 27, 100177, https://doi.org/10.1016/j.gete.2019.100177, 2021.
De Jong, S. M., Spiers, C. J., and Busch, A.: Development of swelling strain in smectite clays through exposure to carbon dioxide, Int. J. Greenh. Gas Con., 24, 149–161, https://doi.org/10.1016/j.ijggc.2014.03.010, 2014.
Desbois, G., Höhne, N., Urai, J. L., Bésuelle, P., and Viggiani, G.: Deformation in cemented mudrock (Callovo–Oxfordian Clay) by microcracking, granular flow and phyllosilicate plasticity: insights from triaxial deformation, broad ion beam polishing and scanning electron microscopy, Solid Earth, 8, 291–305, https://doi.org/10.5194/se-8-291-2017, 2017.
Di Donna, A., Charrier, P., Dijkstra, J., Andò, E., and Bésuelle, P.: The contribution of swelling to self-sealing of claystone studied through X-ray tomography, Phys. Chem. Earth Pt. A/B/C, 127, 103191, https://doi.org/10.1016/j.pce.2022.103191, 2022.
Elkady, Y. and Kovscek, A. R.: Multiscale study of CO2 impact on fluid transport and carbonate dissolution in Utica and Eagle Ford shale, J. Petrol. Sci. Eng., 195, 107867, https://doi.org/10.1016/j.petrol.2020.107867, 2020.
Espinoza, D. N. and Santamarina, J. C.: Water‐CO2‐mineral systems: Interfacial tension, contact angle, and diffusion – Implications to CO2 geological storage, Water Resour. Res., 46, W07537, https://doi.org/10.1029/2009WR008634, 2010.
Espinoza, D. N., Kim, S. H., and Santamarina, J. C.: CO2 geological storage – Geotechnical implications, KSCE J. Civil Eng., 15, 707–719, https://doi.org/10.1007/s12205-011-0011-9, 2011.
Favero, V. and Laloui, L.: Impact of CO2 injection on the hydro-mechanical behaviour of a clay-rich caprock, Int. J. Greenh. Gas Con., 71, 133–141, https://doi.org/10.1016/j.ijggc.2018.02.017, 2018.
Favero, V., Ferrari, A., and Laloui, L.: On the hydro-mechanical behaviour of remoulded and natural Opalinus Clay shale, Eng. Geol., 208, 128–135, https://doi.org/10.1016/j.enggeo.2016.04.030, 2016a.
Favero, V., Ferrari, A., and Laloui, L.: Thermo-mechanical volume change behaviour of Opalinus Clay, Int. J. Rock Mech. Min.s, 90, 15–25, https://doi.org/10.1016/j.ijrmms.2016.09.013, 2016b.
Hadian, P. and Rezaee, R.: The Effect of Supercritical CO2 on Shaly Caprocks, Energies, 13, 149, https://doi.org/10.3390/en13010149, 2020.
Harrington, J. F., Milodowski, A. E., Graham, C. C., Rushton, J. C., and Cuss, R. J.: Evidence for gas-induced pathways in clay using a nanoparticle injection technique, Mineral. Mag., 76, 3327–3336, 2012.
Hashemi, S. S. and Zoback, M. D.: Permeability evolution of fractures in shale in the presence of supercritical CO2, J. Geophys. Res.-Sol. Ea., 126, e2021JB022266, https://doi.org/10.1029/2021JB022266, 2021.
Hou, L., Yu, Z., Luo, X., and Wu, S.: Self-sealing of caprocks during CO2 geological sequestration, Energy, 252, 124064, https://doi.org/10.1016/j.energy.2022.124064, 2022.
Houben, M. E., Desbois, G., and Urai, J. L.: Pore morphology and distribution in the Shaly facies of Opalinus Clay (Mont Terri, Switzerland): Insights from representative 2D BIB–SEM investigations on mm to nm scale, Appl. Clay Sci., 71, 82–97, https://doi.org/10.1016/j.clay.2012.11.006, 2013.
IPCC: Climate Change 2022: Mitigation of Climate Change, Contribution of Working Group III to the Sixth Assessment Report of the Intergovernmental Panel on Climate Change, Cambridge University Press, Cambridge, UK and New York, NY, USA, https://doi.org/10.1017/9781009157926, https://www.ipcc.ch/report/ar6/wg3/about/how-to-cite-this-report, 2022.
Jia, Y., Lu, Y., Elsworth, D., Fang, Y., and Tang, J.: Surface characteristics and permeability enhancement of shale fractures due to water and supercritical carbon dioxide fracturing, J. Petrol. Sci. Eng., 165, 284–297, https://doi.org/10.1016/j.petrol.2018.02.018, 2018.
Kivi, I. R., Makhnenko, R. Y., and Vilarrasa, V.: Two-Phase Flow Mechanisms Controlling CO2 Intrusion into Shaly Caprock, Transport Porous Med., 141, 771–798, https://doi.org/10.1007/s11242-022-01748-w, 2022.
Li, C. and Laloui, L.: Impact of material properties on caprock stability in CO2 geological storage, Geomech. Energ. Environ., 11, 28–41, https://doi.org/10.1016/j.gete.2017.06.003, 2017.
Makhnenko, R. Y., Vilarrasa, V., Mylnikov, D., and Laloui, L.: Hydromechanical aspects of CO2 breakthrough into clay-rich caprock, Energy Proced., 114, 3219–3228,https://doi.org/10.1016/j.egypro.2017.03.1453, 2017.
Marschall, P., Horseman, S., and Gimmi, T.: Characterisation of gas transport properties of the Opalinus Clay, a potential host rock formation for radioactive waste disposal, Oil Gas Sci. Technol., 60, 121–139, https://doi.org/10.2516/ogst:2005008, 2005.
Menaceur, H., Delage, P., Tang, A. M., and Conil, N.: On the thermo-hydro-mechanical behaviour of a sheared Callovo-Oxfordian claystone sample with respect to the EDZ behaviour, Rock Mech. Rock Eng., 49, 1875–1888, https://doi.org/10.1007/s00603-015-0897-5, 2016.
Michels, L., Fossum, J. O., Rozynek, Z., Hemmen, H., Rustenberg, K., Sobas, P. A., Kalantzopoulos, G. N., Knudsen, K. D., Janek, M., Plivelic, T. S., and da Silva, G. J.: Intercalation and retention of carbon dioxide in a smectite clay promoted by interlayer cations, Sci. Rep., 5, 1–9, https://doi.org/10.1038/srep08775, 2015.
Minardi, A., Stavropoulou, E., Kim, T., Ferrari, A., and Laloui, L.: Experimental assessment of the hydro-mechanical behaviour of a shale caprock during CO2 injection, Int. J. Greenh. Gas Con., 106, 103225, https://doi.org/10.1016/j.ijggc.2020.103225, 2021.
Miri, R. and Hellevang, H.: Salt precipitation during CO2 storage – A review, Int. J. Greenh. Gas Con., 51, 136–147, https://doi.org/10.1016/j.ijggc.2016.05.015, 2016.
Mohajerani, M., Delage, P., Sulem, J., Monfared, M., Tang, A. M. and Gatmiri, B.: The thermal volume changes of the Callovo–Oxfordian claystone, Rock Mech. Rock Eng., 47, 131–142, https://doi.org/10.1007/s00603-013-0369-8, 2014.
Prakash, R., Nguene, P. C. K., Noshadravan, A., and Abedi, S.: Chemical reactions of carbonate-rich mudstones with aqueous CO2 and their impacts on rock's local microstructural and chemo-mechanical properties, J. Nat. Gas Sci. Eng., 103, 104587, https://doi.org/10.1016/j.jngse.2022.104587, 2022.
Romero, E.: Controlled-suction techniques, 4o Simpósio Brasileiro de Solos Nâo Saturados, edited by: Gehling, W. Y. Y. and Schnaid, F., Porto Alegre, Brasil, 535–542, 2021.
Rutqvist, J.: The geomechanics of CO2 storage in deep sedimentary formations, Geotech. Geol. Eng., 30, 525–551, https://doi.org/10.1007/s10706-011-9491-0, 2012.
Schaef, H. T., Ilton, E. S., Qafoku, O., Martin, P. F., Felmy, A. R., and Rosso, K. M.: In situ XRD study of Ca2+ saturated montmorillonite (STX-1) exposed to anhydrous and wet supercritical carbon dioxide, Int. J. Greenh. Gas Con., 6, 220–229, https://doi.org/10.1016/j.ijggc.2011.11.001, 2012.
Sciandra, D., Vilarrasa, V., Rahimzadeh Kivi, I., Makhnenko, R., Nussbaum, C., and Rebscher, D.: Coupled HM modeling assists in designing CO2 long-term periodic injection experiment (CO2LPIE) in Mont Terri rock laboratory, EGU General Assembly 2021, online, 19–30 Apr 2021, EGU21-8982, https://doi.org/10.5194/egusphere-egu21-8982, 2021.
Stamati, O., Andò, E., Roubin, E., Cailletaud, R., Wiebicke, M., Pinzon, G., Couture, C., Hurley, R. C., Caulk, R., Caillerie, D., Matsushima, T., Besuelle, P., Bertoni, F., Arnaud, T., Ortega Laborin, A., Rorato, R., Sun, Y., Tengattini, A., Okubadejo, O., Colliat, J. B., Saadatfar, M., Garcia, F. E., Papazoglou, C., Vego., I., Brisard, S., Dijkstra, J., and Birmpilis, G.: spam: Software for Practical Analysis of Materials, Journal of Open Source Software, Open Journals, 5, 2286, https://doi.org/10.21105/joss.02286, 2020.
Stavropoulou, E. and Laloui, L.: Evaluating CO2 breakthrough in a shaly caprock material: a multi-scale experimental approach, Sci. Rep., 12, 1–19, https://doi.org/10.1038/s41598-022-14793-8, 2022a.
Stavropoulou, E. and Laloui, L.: Insights into the interaction of a shale with CO2, in: EGUsphere, Zenodo [data set], https://doi.org/10.5281/zenodo.7330453, 2022b.
Stavropoulou, E., Andò, E., Roubin, E., Lenoir, N., Tengattini, A., Briffaut, M., and Bésuelle, P.: Dynamics of water absorption in Callovo-Oxfordian claystone revealed with multimodal X-ray and neutron tomography, Front. Earth Sci., 8, 6, https://doi.org/10.3389/feart.2020.00006, 2020
Vego, I., Tengattini, A., Andò, E., Lenoir, N., and Viggiani, G.: Effect of high relative humidity on a network of a water-sensitive particles (couscous) as revealed by in-situ X-ray tomography, Soft. Matter, 18, 4747–4755, https://doi.org/10.1039/D2SM00322H, 2022.
Viggiani, G. and Hall, S. A.: Full-field measurements, a new tool for laboratory experimental geomechanics, In Proceedings of the 4th Symposium on Deformation Characteristics of Geomaterials, 1, 3–26, 2008.
Viggiani, G., Andò, E., Takano, D., and Santamarina, J. C.: Laboratory X-ray tomography: a valuable experimental tool for revealing processes in soils, Geotech. Test. J., 38, 61–71, https://doi.org/10.1520/GTJ20140060, 2015.
Vilarrasa, V., Carrera, J., Olivella, S., Rutqvist, J., and Laloui, L.: Induced seismicity in geologic carbon storage, Solid Earth, 10, 871–892, https://doi.org/10.5194/se-10-871-2019, 2019.
Voltolini, M. and Ajo-Franklin, J. B.: The sealing mechanisms of a fracture in opalinus clay as revealed by in situ synchrotron X-ray micro-tomography, Front. Earth Sci., 8, 207, https://doi.org/10.3389/feart.2020.00207, 2020.
Wang, L. L., Bornert, M., Chanchole, S., Yang, D. S., Héripré, E., Tanguy, A., and Caldemaison, D.: Micro-scale experimental investigation of the swelling anisotropy of the Callovo-Oxfordian argillaceous rock, Clay Miner., 48, 391–402, https://doi.org/10.1180/claymin.2013.048.2.17, 2013.
Wang, S. and Tokunaga, T. K.: Capillary pressure–saturation relations for supercritical CO2 and brine in limestone/dolomite sands: Implications for geologic carbon sequestration in carbonate reservoirs, Environ. Sci. Technol., 49, 7208–7217, https://doi.org/10.1021/acs.est.5b00826, 2015.
Wollenweber, J., Alles, S., Busch, A., Krooss, B. M., Stanjek, H., and Littke, R.: Experimental investigation of the CO2 sealing efficiency of caprocks, Int. J. Greenh. Gas Con., 4, 231–241, https://doi.org/10.1016/j.ijggc.2010.01.003, 2010.
Yang, K., Zhou, J., Xian, X., Zhou, L., Zhang, C., Tian, S., Lu, Z., and Zhang, F.: Chemical-mechanical coupling effects on the permeability of shale subjected to supercritical CO2-water exposure, Energy, 248, 123591, https://doi.org/10.1016/j.energy.2022.123591, 2022.
Yasuhara, H., Kinoshita, N., Ohfuji, H., Lee, D. S., Nakashima, S., and Kishida, K.: Temporal alteration of fracture permeability in granite under hydrothermal conditions and its interpretation by coupled chemo-mechanical model, Appl. Geochem., 26, 2074–2088, https://doi.org/10.1016/j.apgeochem.2011.07.005, 2021.
Yu, H., Zhang, Y., Lebedev, M., Li, X., Wang, Z., Verrall, M., Squelch, A., and Iglauer, S.: Swelling-induced self-sealing mechanism in fractured caprock: implications for carbon geo-sequestration, AAPG Bull., 20, 221, 001, https://doi.org/10.1306/09232219136, 2022.
Zappone, A., Rinaldi, A. P., Grab, M., Wenning, Q. C., Roques, C., Madonna, C., Obermann, A. C., Bernasconi, S. M., Brennwald, M. S., Kipfer, R., Soom, F., Cook, P., Guglielmi, Y., Nussbaum, C., Giardini, D., Mazzotti, M., and Wiemer, S.: Fault sealing and caprock integrity for CO2 storage: an in situ injection experiment, Solid Earth, 12, 319–343, https://doi.org/10.5194/se-12-319-2021, 2021.
Zhang, M., de Jong, S. M., Spiers, C. J., Busch, A., and Wentinck, H. M.: Swelling stress development in confined smectite clays through exposure to CO2, Int. J. Greenh. Gas Con., 74, 49–61, https://doi.org/10.1016/j.ijggc.2018.04.014, 2018.
- Abstract
- Introduction
- Methodology, tools and principles of analysis
- Long-term micro-structural modifications
- Direct exposure to supercritical CO2
- Discussion
- Conclusions
- Appendix A: Normalisation of X-ray tomographies
- Appendix B: Segmentation of the X-ray images
- Data availability
- Author contributions
- Competing interests
- Disclaimer
- Acknowledgements
- Financial support
- Review statement
- References