the Creative Commons Attribution 4.0 License.
the Creative Commons Attribution 4.0 License.
 | 27 Jan 2022
Structural complexities and tectonic barriers controlling recent seismic activity in the Pollino area (Calabria–Lucania, southern Italy) – constraints from stress inversion and 3D fault model building
Cristina Totaro
Giusy Lavecchia
Barbara Orecchio
Rita de Nardis
Debora Presti
Federica Ferrarini
Simone Bello
Francesco Brozzetti
We reconstruct the 3D fault model of the structures causative of the 2010–2014 Pollino seismic activity by integrating structural–geological and high-resolution seismological data. We constrained the model at the surface with fault-slip data, and at depth, by using the distributions of selected high-quality relocated hypocenters. Relocations were performed through the non-linear Bayloc algorithm, followed by the double-difference relative location method HypoDD applied to a 3D P-wave velocity model. Geological and seismological data highlight an asymmetric active extensional fault system characterized by an E- to NNE-dipping low-angle detachment, with high-angle synthetic splays, and SW- to WSW-dipping, high-angle antithetic faults.
Hypocenter clustering and the time–space evolution of the seismicity suggest that two sub-parallel WSW-dipping seismogenic sources, the Rotonda–Campotenese and Morano–Piano di Ruggio faults, are responsible for the 2010–2014 seismicity. The area of the seismogenic patches obtained projecting the hypocenters of the early aftershocks on the 3D fault planes, are consistent with the observed magnitude of the strongest events (Mw=5.2, and Mw=4.3). Since earthquake-scaling relationships provide maximum expected magnitudes of Mw=6.4 for the Rotonda–Campotenese and Mw=6.2 for the Morano–Piano di Ruggio faults, we may suppose that, during the sequence, the two structures did not entirely release their seismic potential.
The reconstructed 3D fault model also points out the relationships between the activated fault system and the western segment of the Pollino Fault. The latter was not involved in the recent seismic activity but could have acted as a barrier to the southern propagation of the seismogenic faults, limiting their dimensions and the magnitude of the generated earthquakes.
- Article
(16729 KB) - Full-text XML
-
Supplement
(1213 KB) - BibTeX
- EndNote


In recent years, the reconstruction of 3D fault models (hereinafter referred to as 3DFM), obtained by integrating surface ad subsurface data, has become an increasingly practiced methodology for seismotectonic studies (e.g., Lavecchia et al., 2017; Castaldo et al., 2018; Klin et al., 2019; Ross et al., 2020; Porreca et al., 2020; Barchi et al., 2021; Di Bucci et al., 2021; SCEC, 2021). Detailed structural–geological data are used to define the active faults geometry at the surface, whereas high-quality geophysical data are needed to constrain the shape of the sources at depth. The 3DFM building helps determine the spatial relationships and the interactions between adjacent sources and identify any barriers hampering the propagation of the coseismic rupture at depth. Moreover, such an approach leads to accurately estimating the area of the seismogenic fault, and therefore the expected magnitude.
In Italy, reconstruction of 3DFM could lead to important achievements in the Apennine active extensional belt, which is affected by significant seismic activity (ISIDe, 2007; Rovida et al., 2020). This belt consists of ∼ NW–SE-striking Quaternary normal fault systems, and the related basins, located just west of or within the culmination zone of the chain (Calamita et al., 1992; Brozzetti and Lavecchia, 1994; Lavecchia et al., 1994, 2021; Barchi et al., 1998; Cinque et al., 2000; Brozzetti, 2011; Ferrarini et al., 2015, 2021). Its structural setting is very complicated due to a polyphase tectonic history characterized by the superposition of Quaternary post-orogenic extension on Miocene–Early Pliocene folds and thrusts and on Jurassic–Cretaceous sin-sedimentary faults (e.g., Elter et al., 1975; Ghisetti and Vezzani, 1982, 1983; Lipmann-Provansal, 1987; Mostardini and Merlini, 1986; Patacca and Scandone, 2007; Vezzani et al., 2010; Ferrarini et al., 2017; Brozzetti et al., 2021).
Over time, detailed structural geological studies made it possible to recognize several seismogenic faults in the Apennine active extensional belt (Barchi et al., 1999; Galadini and Galli, 2000; Maschio et al., 2005; Brozzetti, 2011) and, in some cases, to document, through paleo-seismological data, their reactivation during the Holocene (Galli et al., 2020). Furthermore, the increasing availability of high-resolution imagery allows fault mapping at the sub-meter scale (e.g., Westoby et al., 2012; Johnson et al., 2014; Cirillo, 2020; Bello et al., 2021b, 2022), while accurate geophysical prospections (e.g., ground-penetrating radar) allows the fault surface to be investigated at shallow depths (a few meters or tens of meters; e.g., Gafarov et al., 2018; Ercoli et al., 2013, 2021). Conversely, the geometries of the faults at depth are rarely available since high-resolution deep geological and geophysical constraints are often lacking (i.e., deep wells and/or seismic profiles). In fact, in recent decades, seismic reflection prospecting and deep-well exploitation for hydrocarbon research avoided the area affected by active extension and focused on the eastern front of the chain and on the Adriatic–Bradanic foreland basin system (ViDEPI: https://www.videpi.com/videpi/videpi.asp, last access: 19 April 2021).

Figure 1Seismotectonic context of the study area. (a) Active faults of the southern Apennines with major historical and instrumental earthquakes from Parametric Catalogue of Italian Earthquakes, CPTI15 v3.0 (Rovida et al., 2020, 2021). (b) Normal faults cropping out between the Mercure, Campotenese, Morano Calabro, and Castrovillari Quaternary basins (after Brozzetti et al., 2017a) with distribution of the 2010–2014 Pollino seismic activity (contoured areas) and focal mechanisms of the events with Mw>4.0 (Totaro et al., 2015, 2016).
This lack can be compensated with well relocated high-resolution seismological datasets, to be integrated with geological ones. In Italy, datasets of highly precise re-located hypocenters were collected during recent seismic sequences (Chiaraluce et al., 2004, 2005, 2011, 2017; Totaro et al., 2013, 2015). These sequences include thousands of earthquakes (in confined volumes of rock) which appear to roughly connect with the fault traces at the surface. Therefore, such distributions of earthquakes are generally referred to as ongoing rupture processes affecting an entire seismogenic fault or wide portions of them.
In some cases, very high-resolution hypocenter locations (Chiaraluce et al., 2017; Valoroso et al., 2017), as well as seismic reflection lines, allow the seismogenic structures at depth to be clearly highlighted (Sato et al., 1998; Bonini et al., 2014; Lavecchia et al., 2011, 2012a, b, 2015, 2016; Gracia et al., 2019; Porreca et al., 2018; Barchi et al., 2021).
The study area of this work includes the northern sector of the so-called “Pollino seismic gap” (Fig. 1), in which paleo-earthquakes up to M=7 are documented (Michetti et al., 1997; Cinti et al., 1997, 2002), whereas the location and size of seismogenic sources are a matter of debate (Michetti et al., 2000; Cinti et al., 2002; Papanikolaou and Roberts, 2007; Brozzetti et al., 2009, 2017a). Brozzetti et al. (2017a) mapped a set of active faults in the sector between the Mercure, Campotenese, and Morano Calabro Quaternary basins (Fig. 1a). During 2010–2014, this area was affected by a low to moderate instrumental seismicity (Pollino seismic activity), climaxing with the 25 October 2012 Mw5.2 Mormanno earthquake, and characterized by thousands of recorded events (Totaro et al., 2013, 2015). During the sequence, two other moderate events occurred close to the village of Morano Calabro: on 28 May 2012 (Mw4.3) and on 6 June 2014 (Mw4.0; Fig. 1b). According to Brozzetti et al. (2017a), the whole seismicity was arranged in two major clusters and a minor one. Each major cluster was associated with one moderate event and was generated by an independent seismogenic structure. The pre-existence of a seismic network, that was implemented after the beginning of the sequence, provided a high-quality database of relocated hypocenters (Totaro et al., 2013, 2015; Brozzetti et al., 2017a).
In such context, we reconstruct the 3DFM involved in the 2010–2014 seismic activity to investigate, at depth, the cross-cut relationships between the faults with different attitudes and timing of activation. Furthermore, we provide the geometric parameters of the sources to estimate the expected magnitudes. Finally, we discuss some 3D-seismotectonic methodological aspects, which dwell on the improvements that the proposed procedure provides to the definition of the source model and on its limits.
The Mt. Pollino massif is located at the Calabrian–Lucanian boundary (Fig. 1) in a sector of the Apennines structured during the Middle–Late Miocene contractional tectonics, which affected the western Adria Plate (D'Argenio, 1992; Patacca and Scandone, 2007; Ietto and Barilaro, 1993; Iannace et al., 2004, 2005, 2007). The surface geology in this area is characterized by the superposition of two main tectonic units derived from different paleogeographic domains. These are represented (from bottom to top), by (1) the “Apenninic” units (or “Panormide”; Triassic–Early Miocene), which are characterized by a carbonate platform, including the Verbicaro and Pollino units, locally intruded by basaltic rocks (Ogniben, 1969, 1973; Amodio Morelli et al., 1976; Iannace et al., 2007; Patacca and Scandone, 2007; Vezzani et al., 2010; Tangari et al., 2018) and (2) the “Ligurian” units (Late Jurassic–Early Cretaceous), which consist of ophiolites and deep-sea sedimentary deposits derived from the Western Tethys oceanic basin (Ogniben, 1969, 1973; Amodio Morelli et al., 1976; Liberi et al., 2006; Liberi and Piluso, 2009; Filice et al., 2012, 2013, 2015).
During the uppermost Miocene and Pliocene times, the folds and thrusts pile was displaced by WNW–ESE-striking left-lateral wrench faults (Grandjacquet, 1962; Ghisetti and Vezzani, 1982; Van Dijk et al., 2000). Subsequently, regional-scale extensional fault systems, consisting of E- and W-dipping conjugate normal faults, dissected the Tyrrhenian side and the core of the orogen, which assumed a typical basin and range relief. This Quaternary phase caused the reactivation of the previous strike-slip structures such as the Pollino fault (POL), whose normal to normal-oblique kinematics has been documented since the Early–Middle Pleistocene (Ghisetti and Vezzani, 1982, 1983; Brozzetti et al., 2017a).
At present, the age of onset of the extensional tectonic is still under discussion; it is referred by some authors to the Early Pleistocene (Ghisetti and Vezzani, 1982; Schiattarella et al., 1994; Papanikolaou and Roberts, 2007; Barchi et al., 2007; Mattei et al., 2007; Cifelli et al., 2007; Amicucci et al., 2008; Brozzetti, 2011; Robustelli et al., 2014), while it would not be older than the Middle Pleistocene, according to others (Caiazzo et al., 1992; Cinque et al., 1993; Hippolyte et al., 1995; Cello et al., 2003; Giano et al., 2003; Spina et al., 2009; Filice and Seeber, 2019).
In the Campania-Lucania and northern Calabria sectors of the southern Apennines, the active extensional belt includes three main alignments of normal faults and Quaternary basins, arranged in a right-lateral en echelon setting (Fig. 1a). From north to south they are as follows: (i) the northern alignment, including the Irpinia fault, the Melandro–Pergola and Agri basins; (ii) the intermediate alignment, developing from the Tanagro–Vallo di Diano basins to the Mercure–Campotenese and Morano Calabro basins; and (iii) the southern alignment, developing from the Castrovillari fault to the southern Crati basin (Pantosti and Valensise, 1990, 1993; Ascione et al., 2013; Galli and Peronace, 2014; Ghisetti and Vezzani, 1982, 1983; Barchi et al., 1999, 2007; Blumetti et al., 2002; Amicucci et al., 2008; Maschio et al., 2005; Villani and Pierdominici, 2010; Brozzetti, 2011; Faure Walker et al., 2012; Brozzetti et al., 2009, 2012, 2017a, b; Robustelli et al., 2014; Sgambato et al., 2020; Bello et al., 2021a).
All along the above alignments, the geometry and kinematics of the major normal faults are kinematically compatible with a SW–NE direction of extension (Maschio et al., 2005; Brozzetti, 2011; Brozzetti et al., 2009; 2017a). A similar orientation of the T axis is obtained from the focal mechanisms of the major earthquakes from CMT and TDMT databases (Pondrelli et al., 2006; Scognamiglio et al., 2006; Montone and Mariucci, 2016; Totaro et al., 2016) and from GPS data (Devoti et al., 2011; D'Agostino et al., 2014, Cheloni et al., 2017; Cambiotti et al., 2020). The recent activity of these normal fault systems is firstly suggested by the control exerted on the distribution of seismicity, as shown by the location of upper crustal instrumental earthquakes (ISIDe Working Group, 2007; Brozzetti et al., 2009; Totaro et al., 2014, 2015; Cheloni et al., 2017; Napolitano et al., 2020, 2021; Pastori et al., 2021; Sketsiou et al., 2021; De Matteis et al., 2021) and of destructive historical events (Fig. 1; Rovida et al., 2021).
The area affected by the 2010–2014 seismicity extends from the Mercure to the Campotenese and Morano Calabro basins, along the intermediate extensional fault alignment which, according to previous literature, consists of three main sets of genetically linked normal and normal-oblique active faults (Brozzetti et al., 2017a; Figs. 1b, 2; acronyms list in the Supplement Sect. S1). The first one, referred to as the Coastal Range Fault Set (CRFS; red lines in Figs. 1b, 2) dips E to NNE and encompasses four sub-parallel major fault segments named, from west to east, Gada–Ciagola (GCG), Papasidero (PPS), Avena (AVN), and Battendiero (BAT). Their strike varies southward from N–S to WNW–ESE.
The other two fault sets strike ∼ NW–SE and dip ∼ SW (blue lines in Figs. 1b, 2). The western one, developing from Rotonda to Campotenese villages, consists of two main right-stepping en echelon segments. They are referred to as the ROCS system and include the Rotonda–Sambucoso (RSB) and Fosso della Valle–Campotenese (VCT; Fig. 2). The eastern set, including the en echelon Castello Seluci–Piana Perretti–Timpa della Manca (CSPT), the Viggianello–Piani del Pollino (VPP), and the Castrovillari (CAS) faults, represents the break-away zone of the Quaternary extensional belt. In the area between these two W-dipping sets, the W- to NW-dipping Morano Calabro–Piano di Ruggio (MPR) and Gaudolino (GDN) faults show evidence of Late Quaternary activity (Brozzetti et al., 2017a; Fig. 2).
GPS and DInSAR analysis demonstrated that the Pollino area was affected by important deformation rates during the 2010–2014 seismic activity, with increasing and decreasing slip values due to the temporal and spatial variation of the recorded seismicity (Passarelli et al., 2015).
According to Michetti et al. (1997, 2000) and Cinti et al. (1997, 2002), POL and the adjacent CAS faults were associated with at least two strong earthquakes (M6.5 and M7.0), occurring in the period 2000–410 B.C. and 500–900 A.D., respectively. The epicenter of the 8 January 1693 earthquake (M5.3, CPTI15, Rovida et al., 2020, 2021; Tertulliani et al., 2014; Figs. 1b) is also located within the hanging wall of the CAS and at the footwall of the MPR fault, some kilometers eastward of the strongest 2012 and 2014 Morano Calabro events. The epicenter locations of the 1708 Mw5.5 and 1894 Mw5.1 earthquakes (Tertulliani et al., 2014; Rovida et al., 2021), close to the northern termination of the RSB and within its hanging wall, allow the latter fault to be hypothesized as the possible seismogenic source.
The main instrumental event recorded in the Pollino area is the Mw5.6 Mercure earthquake (9 September 1998; Fig. 1b), which was followed by some hundred aftershocks and that was associated by Brozzetti et al. (2009) with the SW-dipping CSPT (Figs. 1b, 2), located some kilometers to the NE of the Mercure basin.
The focal mechanisms of the three strongest earthquakes (Mw5.2, 25 October 2012 – Mormanno; Mw4.3, 28 May 2012 – Morano Calabro; Mw4.0, 6 June 2014 – Morano Calabro) are consistent with extensional (upper crustal) deformations (Montone and Mariucci, 2016; Mariucci and Montone, 2020).
All the associated WSW–ENE-oriented T axes are also quite parallel to the geological and seismological least compressional axis, as provided by the tensorial analysis in the neighboring Mercure area (Brozzetti et al., 2009; Ferranti et al., 2017) or derived from borehole breakouts (Montone and Mariucci, 2016; Mariucci and Montone, 2020) and GPS data (Devoti et al., 2011; D'Agostino et al., 2014; Cambiotti et al., 2020). As discussed by Totaro et al. (2015, 2016) and Brozzetti et al. (2017a), the available focal solutions well correlate with the Quaternary normal faults recognized in the epicentral area, represented by N–S- to NNW–SSE-striking (W-dipping) seismogenic sources.
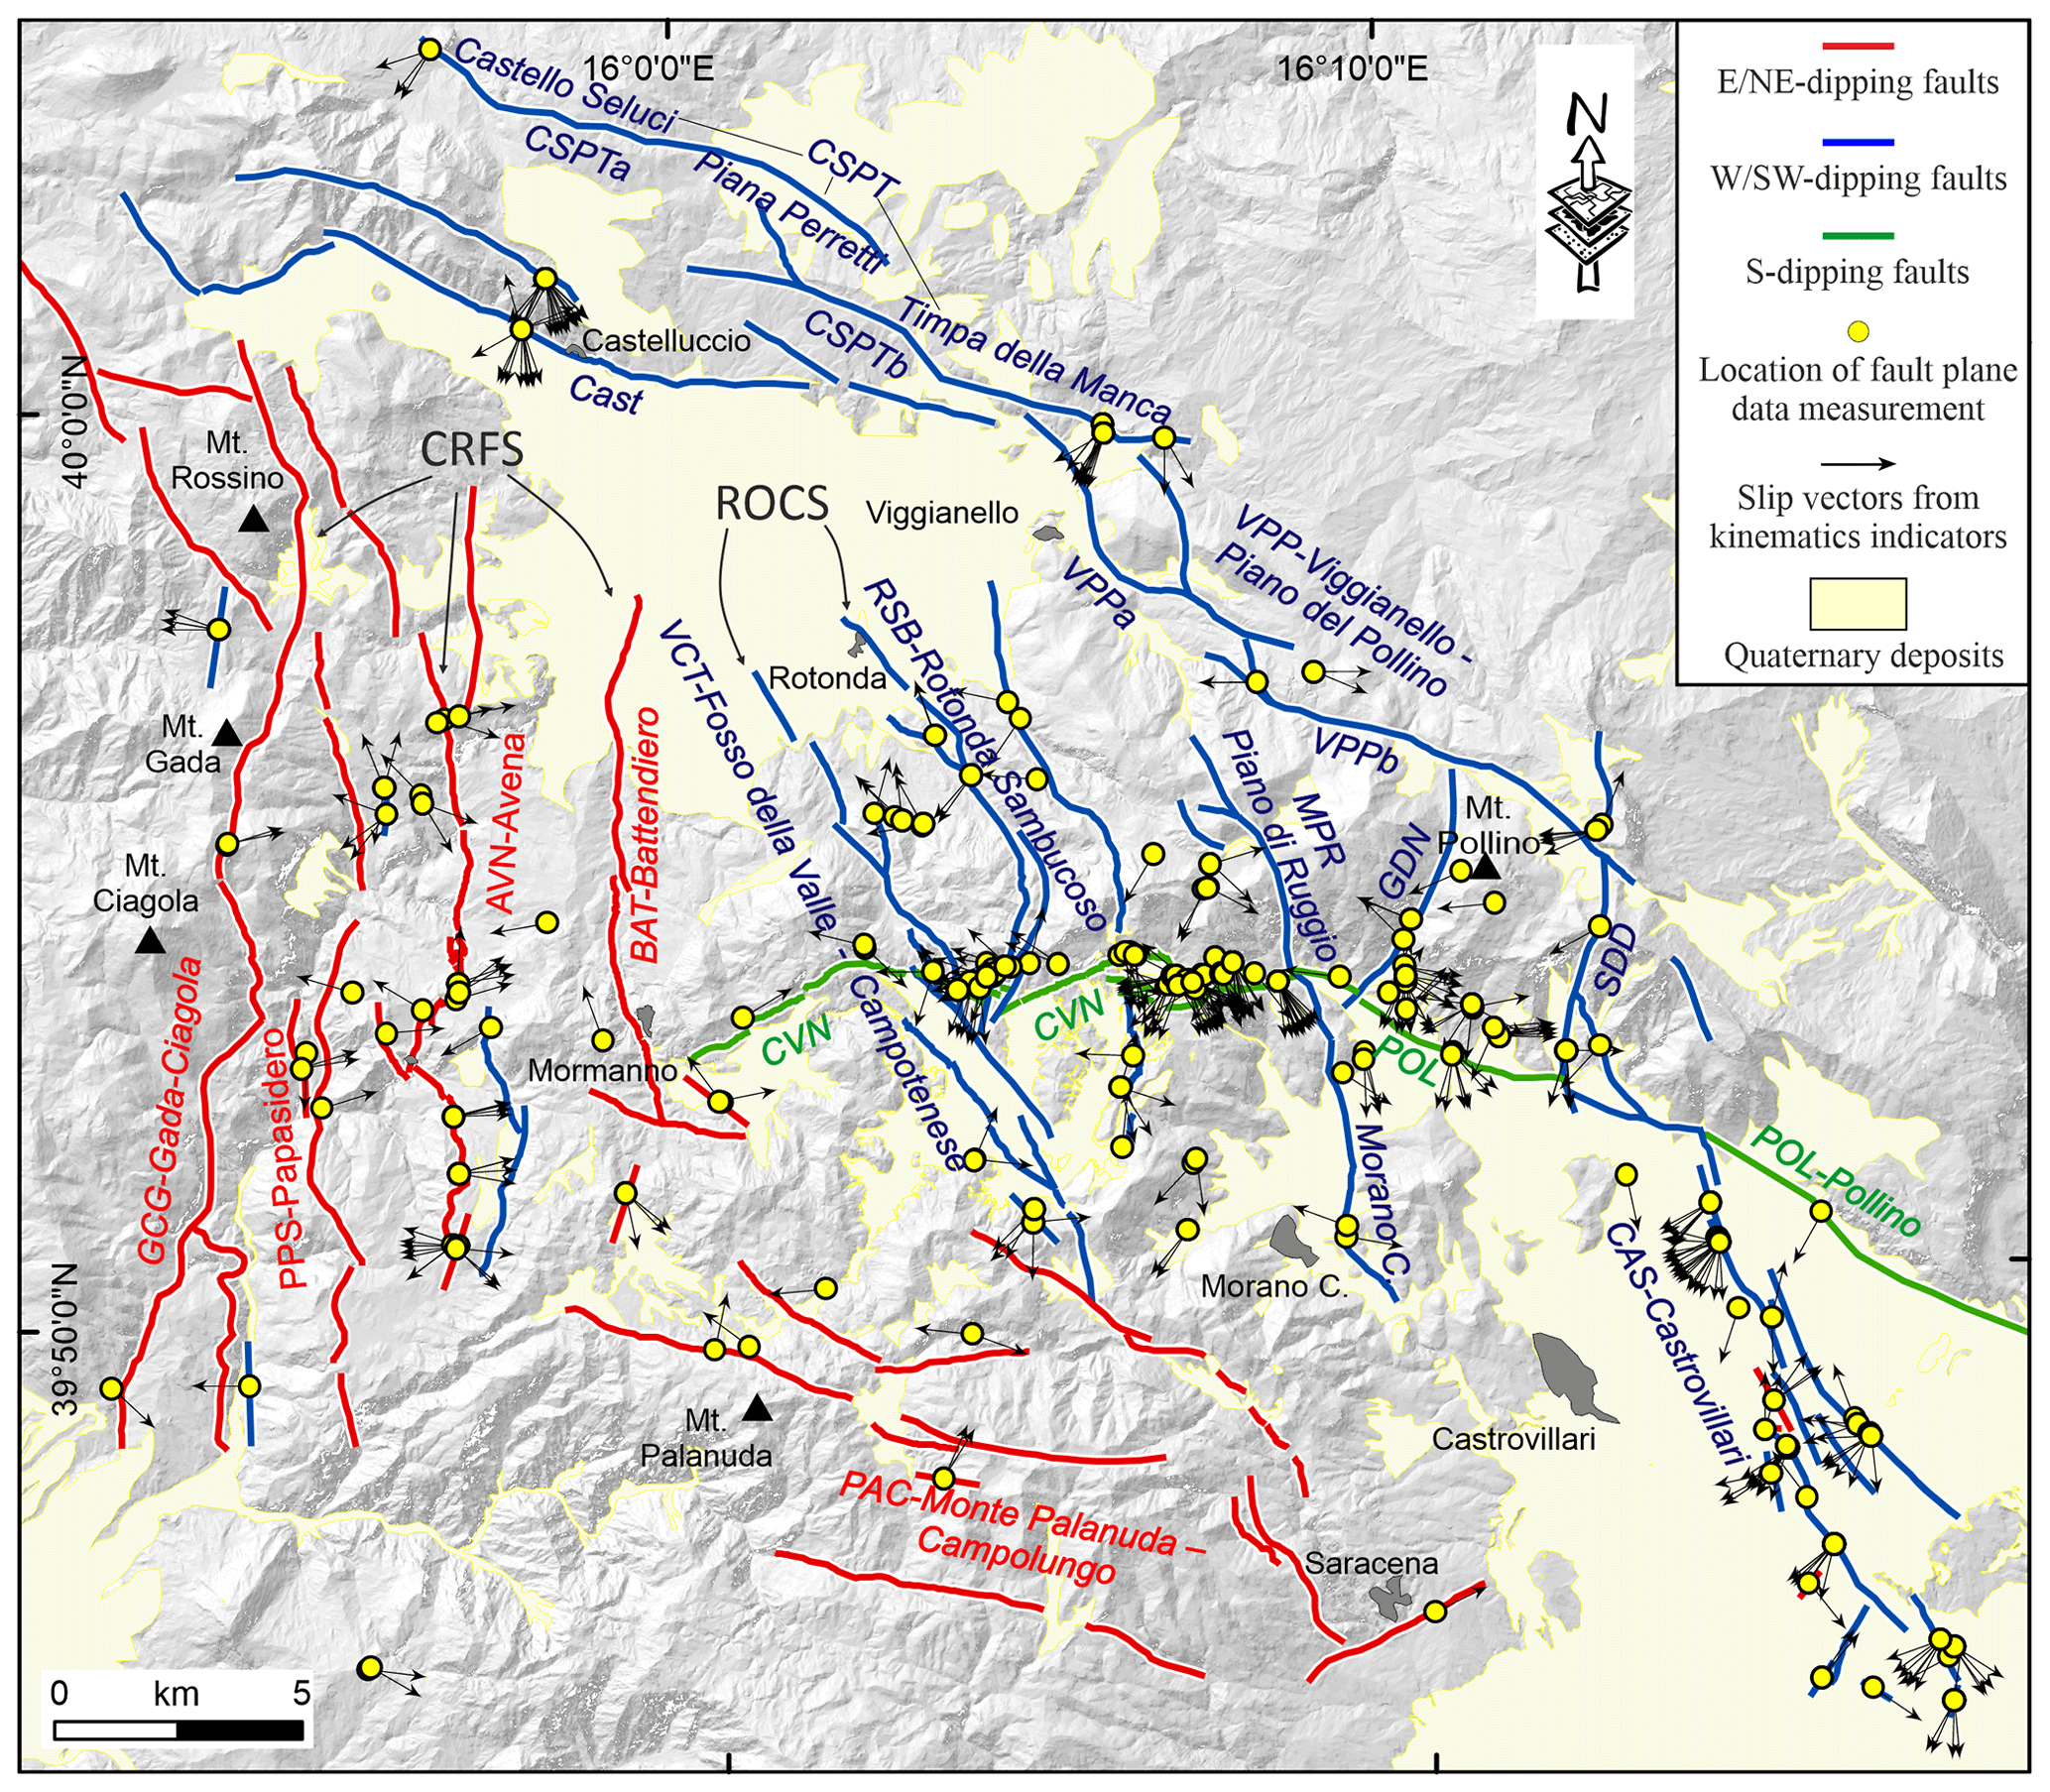
Figure 2Structural map of the Calabrian–Lucanian boundary (after Brozzetti et al., 2017a) with location of fault-slip data measurements. Fault key: CRFS: Coastal Range Fault Set; GCG: Gada–Ciagola fault; PPS: Papasidero fault; AVN: Avena fault; BAT: Battendiero fault; ROCS: Rotonda–Campotenese fault system; VCT: Fosso della Valle–Campotenese fault; RSB: Rotonda–Sambucoso; CVN: Cozzo Vardo–Cozzo Nisco fault; MPR: Morano Calabro–Piano di Ruggio fault; VPP: Viggianello–Piani del Pollino fault set; VPPa: Viggianello–Prastio fault; VPPb: Vacquarro–Piani del Pollino fault; GDN: Gaudolino fault; POL: Pollino fault; CAS: Castrovillari fault; SDD: Serra Dolcedorme fault; PAC: Monte Palanuda–Campolungo fault; Cast: Castelluccio fault; CSPT: Castello Seluci–Piana Perretti–Timpa della Manca fault; CSPTa: Castello Seluci–Piana Perretti fault; CSPTb: Timpa della Manca–La Fagosa fault.
Correlating the hypocenter distribution with the active faults at the surface, the seismogenic source of the 25 October 2012 Mormanno Earthquake (Mw5.2) is identifiable in both the segments of the WSW-dipping ROCS system (RSB and VCT in Figs. 1b, 2). These faults dip 70–75∘, at the surface, and would reach a dip of ∼55∘ at depth (Brozzetti et al., 2017a). Through similar reasonings, the WSW-dipping MPR fault was suggested to be the causative fault of the eastern Morano Calabro cluster (Fig. 1b) and of its two major events (Mw4.3 on 28 May 2012 and Mw4.0 on 6 June 2014). The fault extends for ∼7 km in a N170 direction and is co-axial with the W-dipping nodal planes of the two main events of the sequence (Fig. 1b). The partial reactivation of the CAS could be invoked to explain the minor cluster of seismicity recorded at the eastern side of the study area, although some of the events seem to be located at its footwall.
4.1 Structural survey and fault kinematic analysis
We performed a series of fieldwork campaigns, at 1:25 000 scale, in the study area and surrounding sectors, to collect fault-slip data to be integrated with the geological–structural observations reported in Brozzetti et al. (2017a). In addition to traditional survey methods, we used the Fieldmove App (PetEx Ltd., version 2019.1) installed on a tablet computer to acquire the data in the field (e.g., Allmendinger et al., 2017; Novakova and Pavlis, 2017; Testa et al., 2019; Brozzetti et al., 2020; Cirillo, 2020), and we managed them in ArcGIS v.10.8 (ArcMap©). Figure 2 shows the location of the survey sites, considered structurally homogeneous outcrops falling within a maximum distance of 500 m (see also Fig. S2 in the Supplement). The overall fault-slip dataset was first subdivided into minor and local homogenous kinematic subsets, the latter represented as pseudo-focal mechanisms using FaultKin 8 software (Marrett and Allmendinger, 1990; Allmendinger et al., 2012; Fig. 3). The fault-slip data were subsequently inverted (see following Sect. 4.3).

Figure 3Kinematic analysis and pseudo-focal mechanisms obtained from fault-slip data using the FaultKin 8 software (Allmendinger et al., 2012). Pseudo-focal mechanisms are boxed with different colors on the basis of the fault system to which they belong to (color key as in the map of Figs. 1, 2). For each fault system, the density contour of the T axis computed for each focal mechanism is reported (lower hemisphere projection). A.s.v.: average striae value, A.f.p.: average fault plane, n: number of fault-plane measurements. Numbers in the rectangles (top left of each focal mechanism) refer to the group of fault-slip data belonging to or neighboring a single site (location in Fig. S2).
4.2 Hypocenter location
To better characterize the 3D features of the tectonic structures located in the study area, we performed a high-quality hypocenter location. We enlarged, with respect to previous works by Totaro et al. (2013, 2015) and Brozzetti et al. (2017a), the time window for earthquake analyses (i.e., January 2010 and October 2018), selecting earthquakes with local magnitude greater than 1.0 and hypocentral depth range 0–30 km from the INGV and the University of Calabria database (https://www.ingv.it/, last access: 19 April 2021; http://www.sismocal.org, last access: 19 April 2021). Automatic and manually revised P- and S-wave arrival time picks have been selected for this dataset. The recording network, including both temporary and permanent stations managed by the University of Calabria and INGV (D'Alessandro et al., 2013; Margheriti et al., 2013), consisted of 61 stations with a maximum epicentral distance of 150 km (Fig. S1 in the Supplement). We computed accurate absolute hypocenter locations by applying first the non-linear Bayloc earthquake location algorithm (Presti et al., 2004, 2008) and subsequently the double-difference relative location method HypoDD (v.2; Waldhauser, 2001) and using the 3D velocity model by Orecchio et al. (2011). The Bayloc algorithm gives for each earthquake a probability density cloud with shape and size related to the main factors involved in the location process (e.g., network geometry, picking errors) and allows a generally more accurate estimate of hypocenter parameters and location uncertainties with respect to the more commonly used linearized location methods (e.g., Lomax et al., 2000; Husen and Smith, 2004; Presti et al., 2008). The application of the Bayloc algorithm provides, on average, horizontal and vertical errors of the order of 1.0 and 1.5 km, respectively, allowing us to obtain a well-constrained database. As the second step, we apply the HypoDD algorithm, which minimizes phase delay-time residuals between pairs of events recorded at common stations (Waldhauser and Ellsworth, 2000). We compute the delay times from each event to its 30 nearest neighbors within 10 km distance, and to further ensure the robustness of the double-difference inversion, only event pairs with at least eight phases observed at common stations were used. The final relocated dataset consists of 3109 events (Figs. 4 and S1). During the decade before the 2010–2014 Pollino sequence, the instrumental data, available within a range of nearly 75 km from the Mercure basin, referred to background seismic activity (Frepoli et al., 2005; Castello et al., 2006; Brozzetti et al., 2009). A significant seismic activity which affected the region was the moderate-magnitude 1998–1999 Mercure sequence that developed in the northern part of the homonym Quaternary basin (Fig. S1; Guerra et al., 2005; Arrigo et al., 2006; Brozzetti et al., 2009) and showed some similarities to the recent Mercure-Pollino sequence (e.g., prevalent kinematics of focal mechanisms and hypocentral depth range). We explored the data available for this seismic activity to compute a high-quality earthquake location, following the procedure described above for the 2010–2018 earthquake dataset. Since the recording network operating during the 1998–1999 seismic phase was significantly different from today, in terms of the number of stations deployed in the region and their spatial distribution, the available data do not allow the high level of constraint needed to perform the 3D structural model reconstruction to be reached.
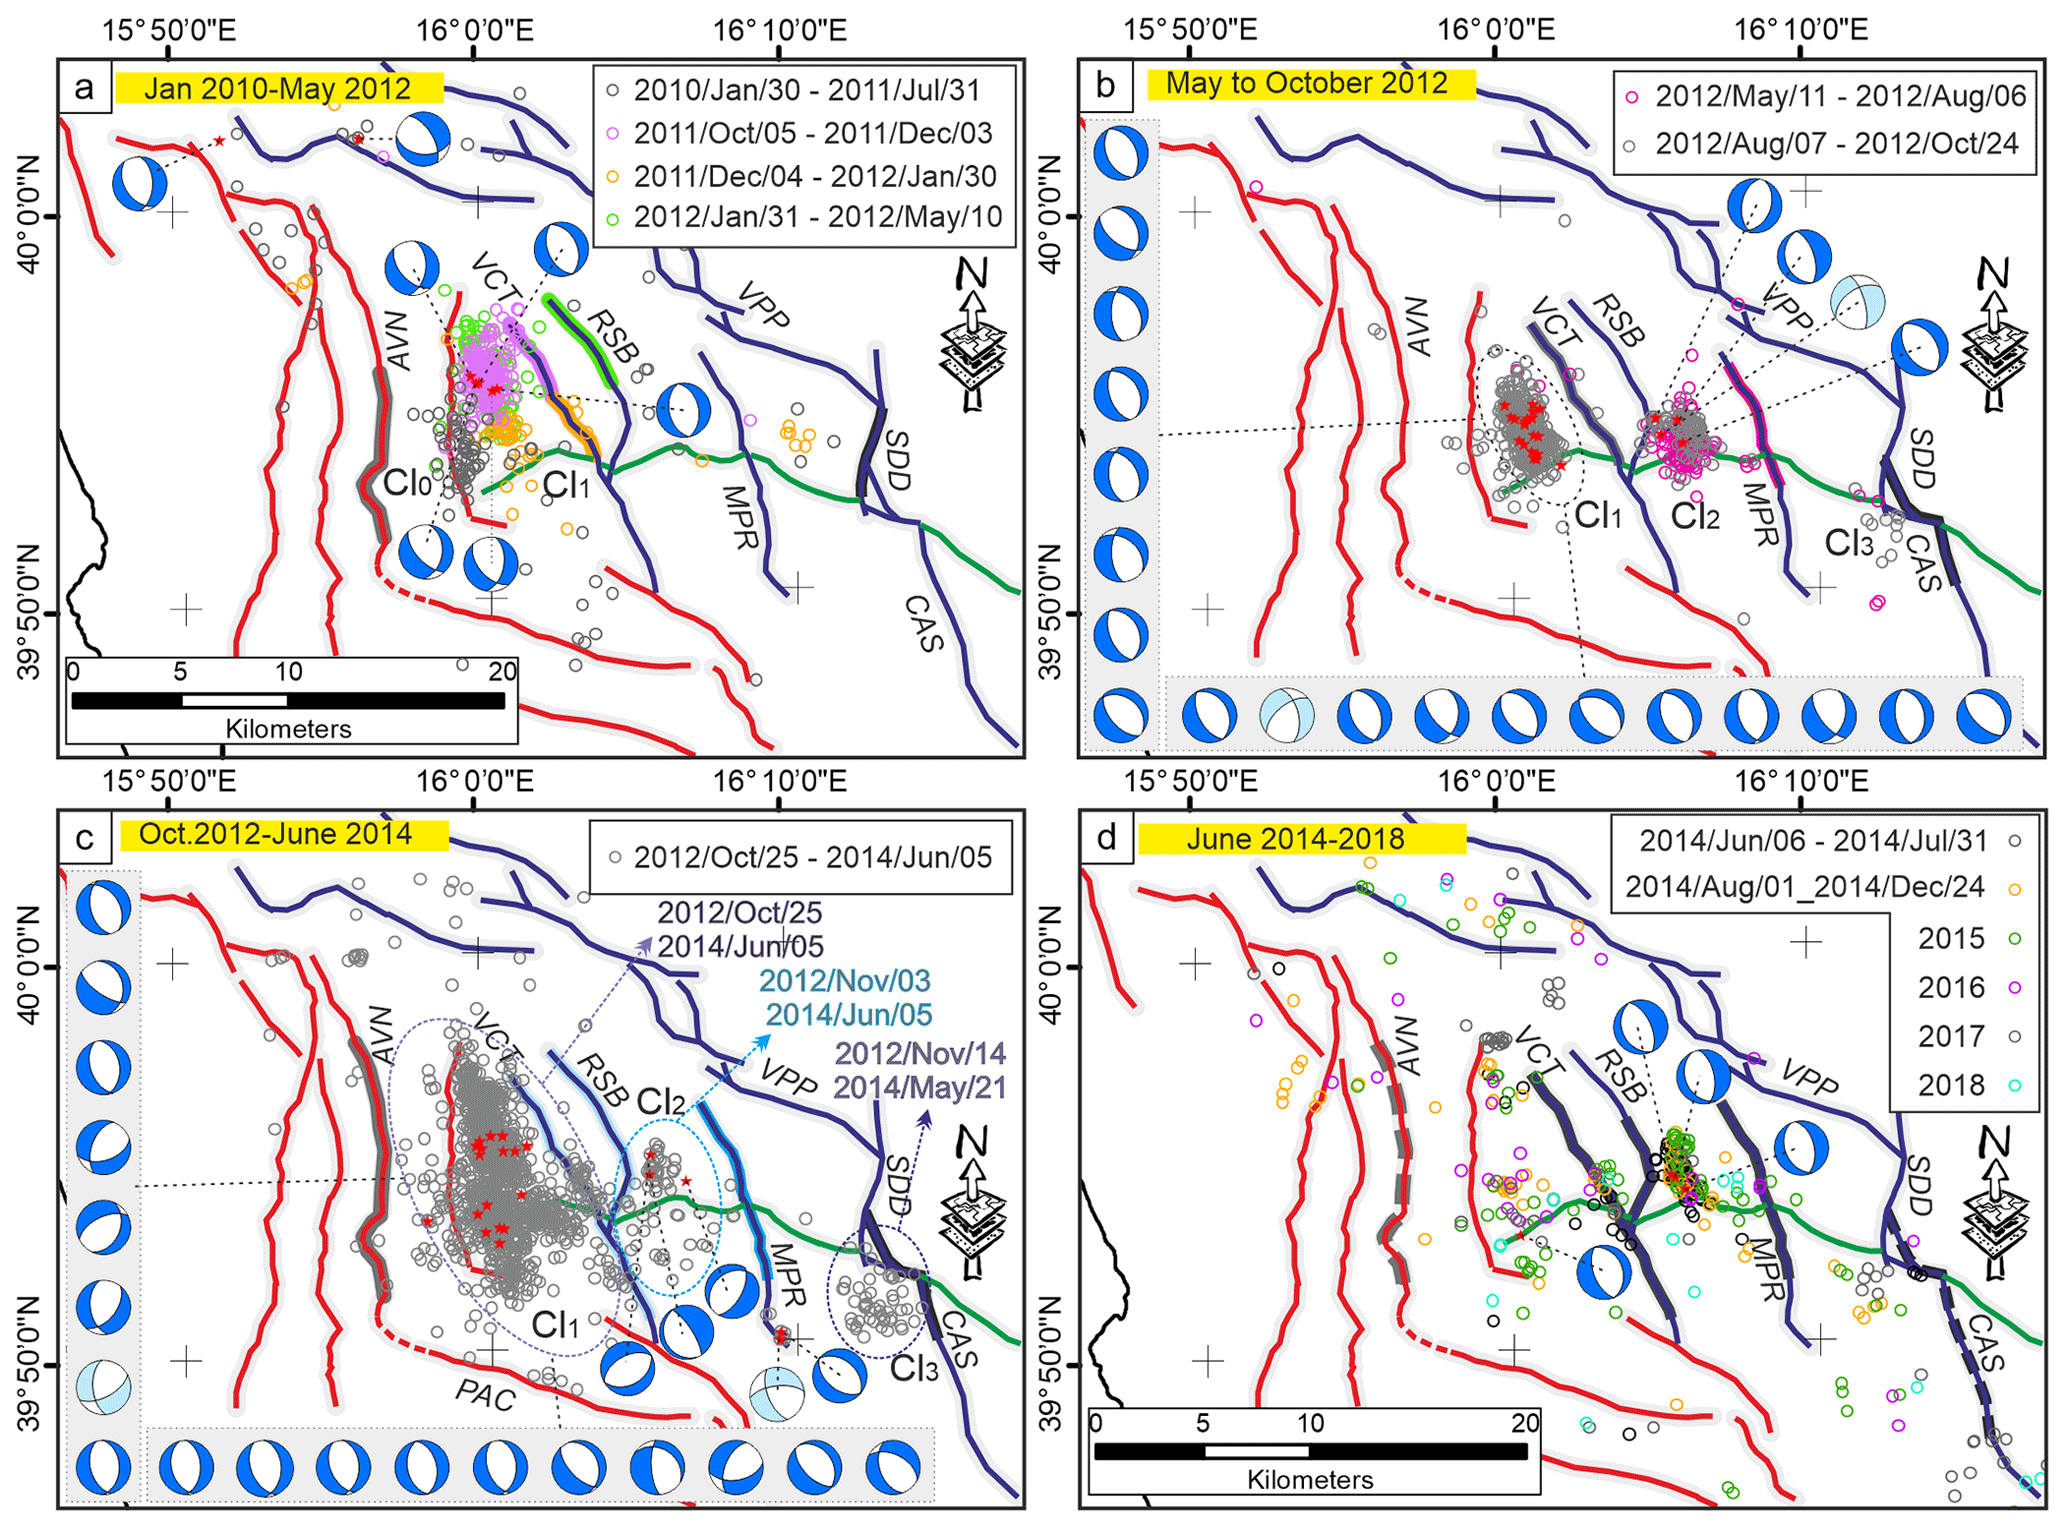
Figure 4Time–space evolution of the 2010–2018 seismic activity in the Pollino area. Each panel shows the distribution of focal mechanisms (Totaro et al., 2015, 2016) and epicenters concentrated in a series of neighboring clusters numbered as Cl 0, 1, 2, and 3 from west to east, according to their activation time. See Sect. 5.2 for the sequence description. The focal mechanisms are classified following Frohlich (2001) kinematics classification (blue beach ball: normal kinematics; light blue: normal strike kinematics). Small red circles represent the epicenters of focal mechanism solutions.
4.3 Geological and seismological stress tensor inversion
To investigate the coherence between the geological and the seismological stress fields, we applied stress tensor inversions to the available fault-slip data (Figs. 2, 3) and focal mechanisms (Fig. 4). We used the “TENSOR” program and the inversion procedure proposed in Delvaux and Sperner (2003). We applied it separately on the different datasets. The procedure computes the orientation of the three principal axes of the stress ellipsoid (σ1, σ2, σ3) and the stress ratio that optimize the misfit function (i.e., F5 in the “TENSOR” program, described as f3 in Delvaux and Sperner, 2003). The latter is built (i) to minimize the slip deviation between the observed slip line and resolved shear stress (30∘ misfit value is not expected to be exceeded) and (ii) to favor higher shear stress magnitudes and lower normal stress to promote slip on the plane. The inversion procedure provides for the preliminary (kinematic) analysis of data using an improved version of the Right Dihedron method (Angelier and Mechler, 1977) to determine the starting model parameters (e.g., the reduced stress tensor). The stress ellipsoid is then computed through a 4D grid-search inversion involving several runs during which the reduced tensor is rotated around each stress axis with a decreasing range of variability (from ±45 to ±5∘), and the full range of Φ values (0–1) is checked. Each step attempts to find the parameters that minimize the misfit function and that are used as a starting point for the next run (see for details Delvaux and Sperner, 2003).
The geological data input consists of 268 quality-controlled fault-slip data measured in the study area (Figs. 2, 3). During the formal inversion, the same weight value was assigned to each fault. The seismological data input is represented (initially) by both nodal planes of each focal mechanism; afterwards, the plane that is best explained by the stress tensor in terms of the smallest misfit function is considered as the actual fault plane (Delvaux and Barth, 2010). The inverted seismological data are represented by focal mechanisms from Totaro et al. (2015, 2016) and reported in Fig. 4. An exponential weighting factor (corresponding to the earthquake magnitudes) has been assigned to account for the prevailing kinematics of the most energetic events. The final inversion (Fig. 5) includes only the fault and focal planes that are best fitted by a uniform stress field (Gephart and Forsyth, 1984).
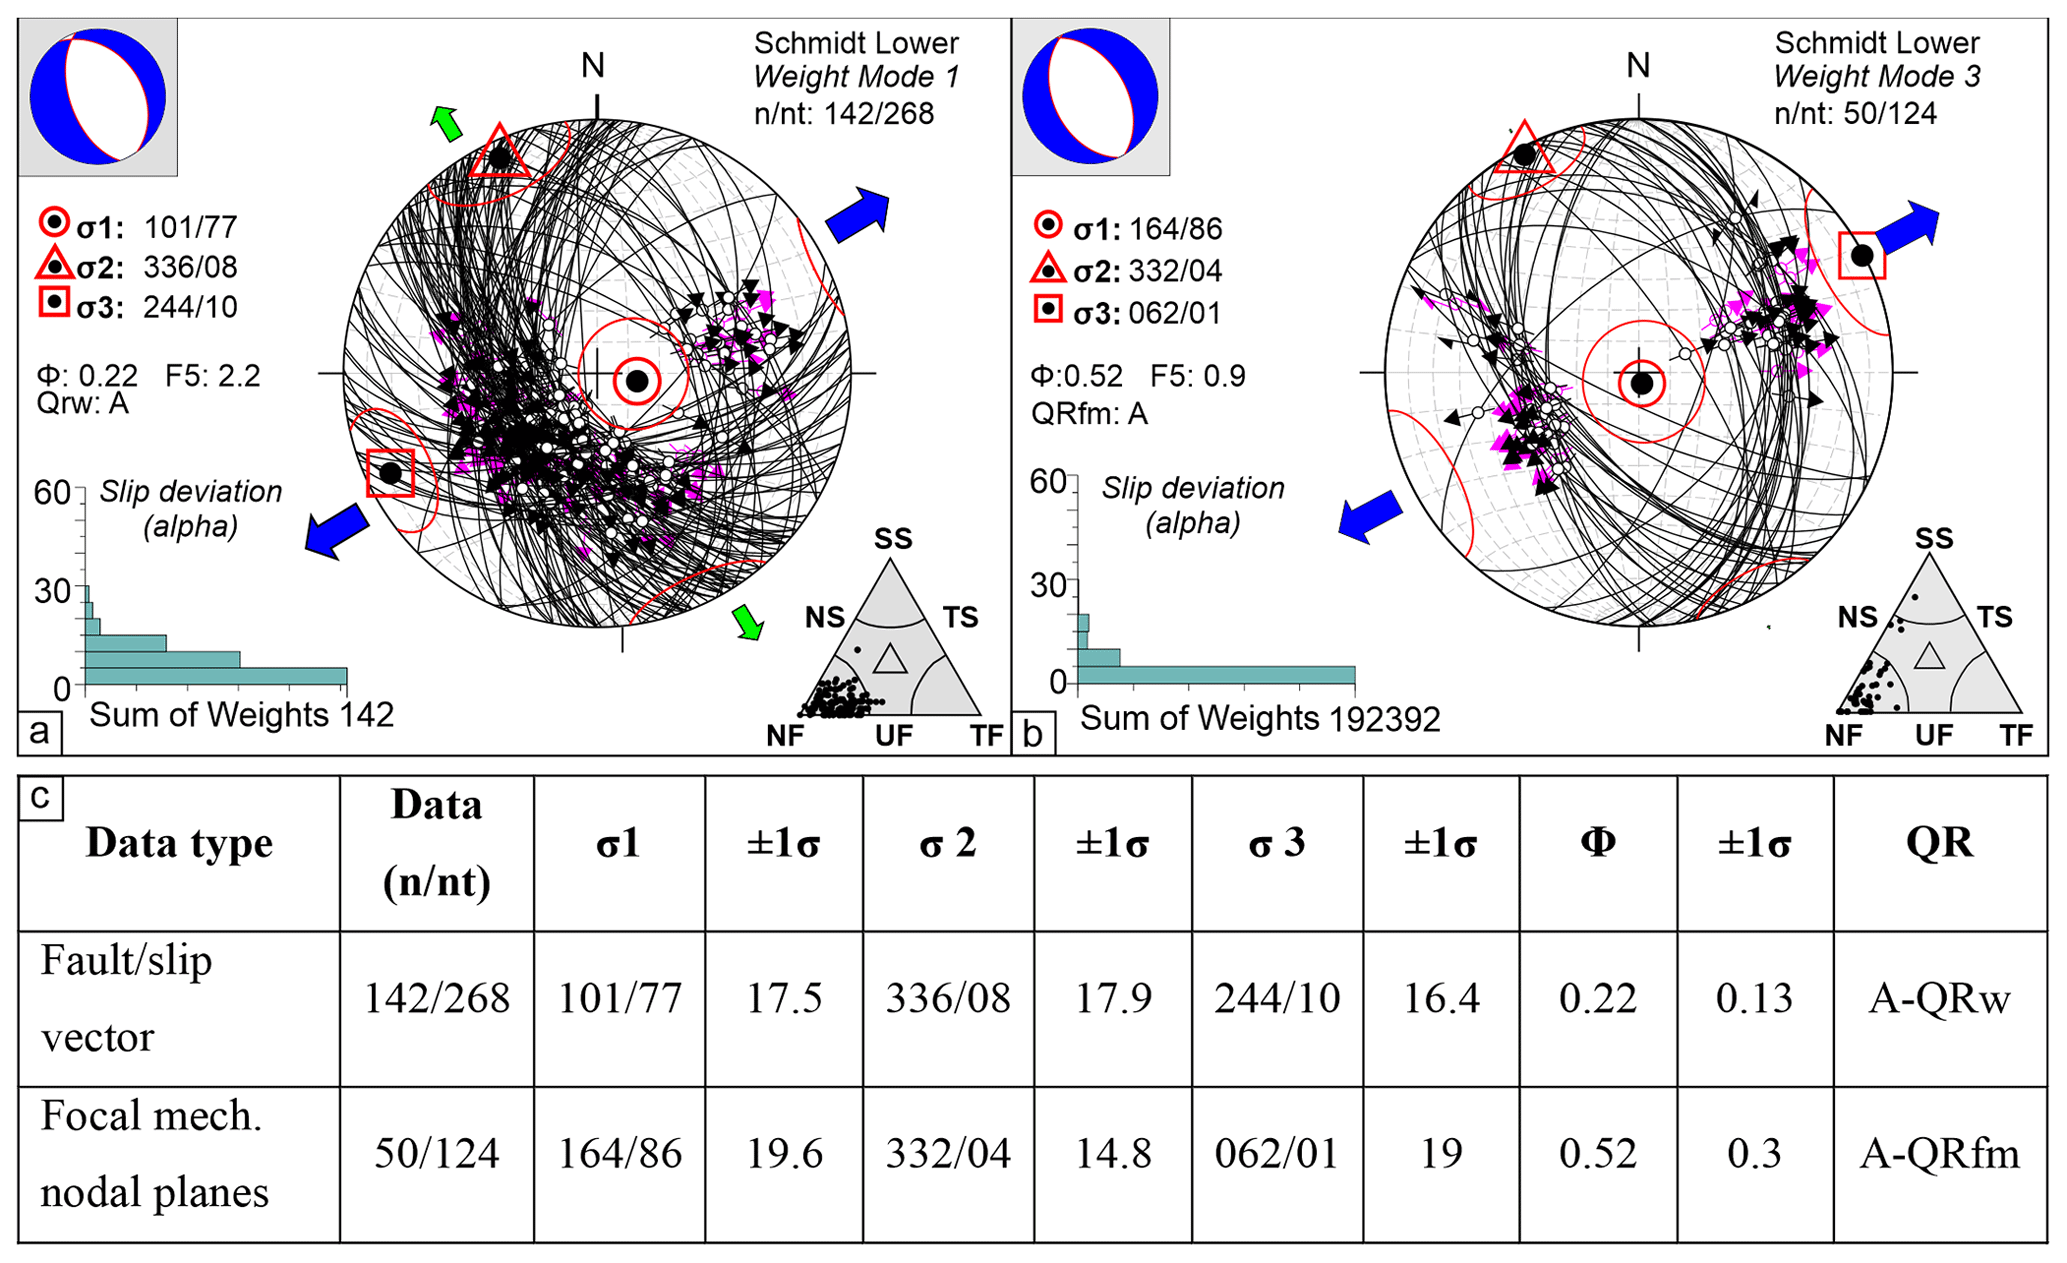
Figure 5Stress inversion results for the geological (a) and seismological (b) data. On the lower hemisphere Schmidt nets, the fault plane/slickenline pairs (a) and focal plane/kinematic indicators (rake) (b) are reported (great circles represent the fault planes; the dark and pink arrows indicate the measured slip directions (or rake) and resolved shear stress respectively). The histograms represent the corresponding misfit angles vs. the number of data points; nt: total number of fault data; n: number of successfully inverted fault data; σ1, σ2, σ3: principal stress axes; Φ: stress ratio = (σ2–σ3) (σ1–σ3); quality ranking factors (QR) and the stress inversion parameters with associated uncertainties (1σ standard deviations) are listed in panel (c). On the small upper left nets, the computed stress field represented as a focal mechanism is also reported. The triangles reported on the lower right corner of each panel (a) and (b) show the kinematic classification of data according to Frohlich (2001). (c) Geological and seismological stress tensor parameters computed starting from slip-vector measurements collected along the investigated fault systems (Figs. 2, 3) and focal mechanisms, respectively (see. Sect. 3 and Fig. 4). Key: nt: total number of data (e.g., plane/slickenline); n: inverted data; σ1, σ2, σ3: principal stress axes; Φ stress ratio = (σ2–σ3) (σ1–σ3). QR: quality ranking; AQRw as in Sperner et al. (2003) and A-QRfm as in Heidbach et al. (2010).
4.4 3D model building
Following the methodology defined by the Community Fault Model of Southern California (Nicholson et al., 2014, 2015; Plesch et al., 2014), also applied for recent Italian earthquakes (Lavecchia et al., 2017; Castaldo et al., 2018; Bello et al., 2021a), we obtained the 3DFM of the Pollino area by integrating Quaternary fault mapping (Brozzetti et al., 2009, 2017a; this paper) with a high-quality seismicity dataset (2010–2018), and by using the Move suite software v. 2019.1 (Petroleum Experts Ltd).
In particular, we created several sets of closely spaced transects (distance: 2 km) to cross and sample the seismogenic fault zones in different directions (Fig. 6). The set oriented SW–NE is approximately perpendicular (e.g., Fig. 6a and b) to the ROCS (VCT and RSB). Differently, the set oriented NW–SE is approximately sub-parallel to MPR active faults (e.g., Fig. 6f). A further NNE–SSW-striking set of transects was traced approximately perpendicular to the active fault alignment bounding the study area to the east, which includes the CSPT and VPP faults (Fig. 6g and h).
The 3DFM building was carried out following three steps graphically depicted in Fig. 7 and synthetically described below.
-
Step 1 – Extrusion of fault traces to shallow depth
The traces of the Quaternary faults are “extruded” to a pre-set depth of 2 km b.s.l., according to the fault-plane dip measured in the field. In the absence of measured dip angles, we assumed a fixed value of 60∘. The obtained so-called “fault ribbons” are rimmed upward by the topographic surface (a 10 m resolution DEM; Tarquini et al., 2012).
-
Step 2 – Down-dip extrapolation of the faults along seismological sections
Starting from the analysis of the seismological transects (Fig. 6), we traced the deep geometries by connecting the fault ribbons with the seismicity clusters at depth (Fig. 7b, c) downward to the base of the seismogenic layer.
-
Step 3 – Building of 3D fault surfaces
This step allows the final 3D reconstruction (Fig. 7c, d) to be reached by interpolating, through the Delaunay triangulation method (Delaunay, 1934), all the fault lines as interpreted along the seismological cross sections (Step 2). The result is the fault plane surface that best approximates and connects the clusters of seismicity and the surface geology (represented by the fault traces extruded).

Figure 6Epicentral map (upper-right panel) and hypocentral distributions (a–i) of the 2010–2018 seismic activity that occurred in the Pollino area. In the cross sections the earthquakes (grey dots) within a half-width of 1 km have been also reported as density contours computed using Kernel Density Estimation. The histograms related to each section show the depth distribution of the hypocenters. The traces of all the serial cross sections analyzed in this study are reported in map view (upper-right panel) as thin grey lines, while the bold lines relate to the sections (a–i) shown in this figure.
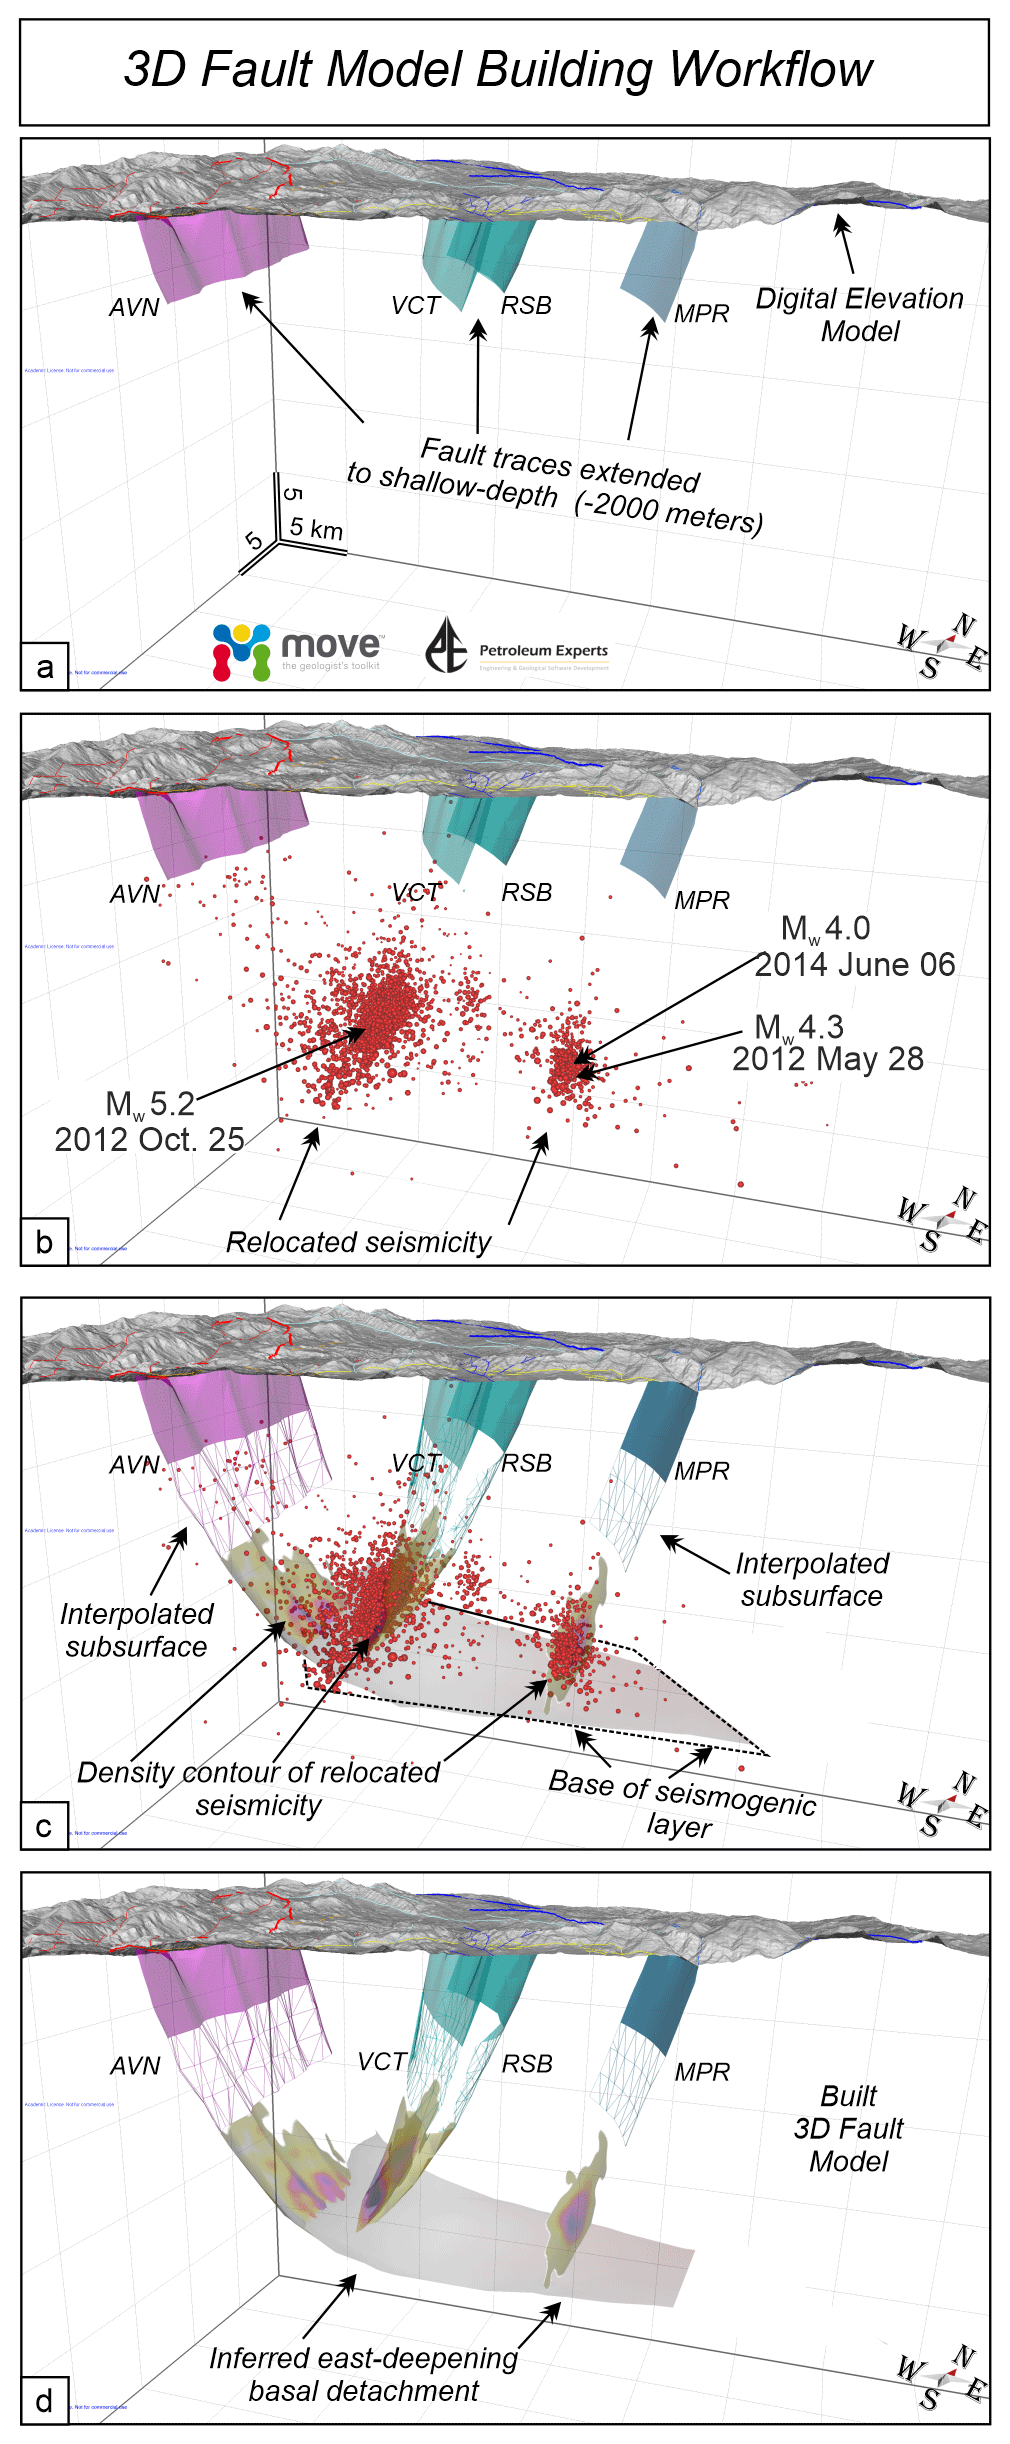
Figure 73D fault model building, from the surface (10 m resolution DEM from Tarquini et al., 2012) to the base of the seismogenic layer. Fault acronyms as in Fig. 2. (a) “Fault ribbons” obtained by extruding the fault traces mapped at the surface down to 2 km depth and considering the fault dip angles measured in the field. (b) 3D fault model as in (a) with the relocated seismicity. (c) Fault extrapolation at (seismogenic) depth through the clusters of hypocenters; the modeled faults connect the ribbons with the zones at the depth where concentrations of hypocenters are higher. The density contours of the seismicity and the base of the seismogenic layer are also shown (see also d). (d) Final 3D fault model obtained integrating the detailed Quaternary fault pattern with the high-quality 2010–2018 seismicity dataset.
5.1 Geological and seismological stress tensors
The computed geological stress tensor (Fig. 5) shows a relevant percentage of fault-slip vector pairs (∼53 %) consistent with a uniform extensional stress field which is characterized by a N244-trending and sub-horizontal σ3. The stress ratio , and the rank quality is QRw = A (ranking as in Sperner et al., 2003). Nearly all the kinematic axes related to the inverted data belong to a normal-fault regime, as also pointed out by the triangle in Fig. 5 (Frohlich, 2001).
The seismological stress tensor (Fig. 5b) obtained from inverting 50 actual fault planes (nt: 124 nodal planes) shows a normal fault regime with an ENE-WSW-trending and sub-horizontal σ3 (N062/01 ± 19). The stress ratio and the quality ranking is QRfm = A (ranking as in Heidbach et al., 2010). Most of the nodal planes show normal-fault kinematics (see Fig. 5b).
In both the inversions, a normal-fault regime with sub-horizontal and collinear (∼ SW–NE-trending) σ3 axis has been obtained. This result points out the coherence between the geological (long-term) and the present-day stress field and the persistence of this extensional regime at least since the Middle Pleistocene (Brozzetti et al., 2017a).
In addition, it is worth noting that 76 % of the successfully inverted fault-slip vector pairs are related to the active fault planes belonging to the E- and W-dipping domains (Fig. 5a), while the remaining 24 % include data related to the S-dipping system (CVN and POL). The evidence together with the similarity between the computed stress tensors is consistent with the prevalent activation, in the Late Quaternary, of the E- and W-dipping fault systems.
5.2 Time–space evolution of the Pollino sequence
The 2010–2018 seismic activity in the Pollino–Mercure area followed a peculiar evolution over time (Fig. 4) with epicenters concentrated in a series of neighboring clusters, numbered as Cluster 0, 1, 2, and 3, from west to east, according to their activation time. Such clusters, independent and unconnected to each other, are related to fault segments that are not in an along-strike continuity.
Cluster 0 (30 January 2010–31 July 2011) includes low magnitude () activity located in an NNE–SSW-oriented sector at the western boundary of the epicentral area. It is delimited westward by the more external segment of the E-dipping CRFS.
Cluster 1 started after 5 October 2011 and lasted for the entire 2011–2014 seismic activity. It extended continuously, both northward and southward, reaching a NW–SE length of ∼12 km (Fig. 4a–c). It comprehends the higher number of earthquakes and is largely the major cluster as regards the wideness (∼60 km2) and energy release. It includes 30 events with ML≥3.0 besides the strongest event of all the Pollino seismic activity (25 October 2012). During the 2015–2018 interval, Cluster 1 area was affected by low seismic activity, mostly distributed in its northern and southern portions; conversely, its central part, where epicenters were particularly dense between 2011 and 2014, became less active. Overall, the surface extent of Cluster 1, which partly overlaps with Cluster 0, is limited eastward by the W-dipping RSB and VCT faults. Its southern boundary nearly coincides with the southeastern continuation of the AVN fault (PAC, Fig. 4c).
Cluster 2 started in May 2012 in the sector between the two WSW-dipping RSB and the MPR faults. It elongates in the N–S direction, for ∼7 km to the northwest of the Morano Calabro town. Afterward, it was nearly continuously active, particularly during the periods May 2012–October 2014 (Fig. 4b, c); in the period 2015–2018, significant seismicity also persisted (Fig. 4d). Cluster 2 includes mainly low-magnitude events besides the strongest ones of 28 May 2012 and 6 June 2014 and three other earthquakes with .
Further east, in the sector comprised between MPR and the alignment VPP-SDD-CAS faults, a minor cluster of seismicity (Cluster 3) developed since December 2011 (Fig. 4a). Since then (2011–2018), it was affected by poor and low-magnitude seismicity, which, however, was clearly above the threshold of background seismicity, with two ML=3.0 events (Fig. 4a–d).
5.3 3D fault model of the Pollino area fault system
The obtained 3DFM (Fig. 8), which includes the seismogenic fault system involved during and after the 2010–2014 Pollino seismic activity (CRFS, ROCS, and MPR), also encompasses those faults (GCG, PPS, AVN, BAT, CSPT, VPP, SDD, CAS) that, while showing no direct evidence of recent seismic activity, play a significant role in the seismotectonic frame of the area.
The westernmost fault structures (i.e., GCG and PPS), whose deep geometry is not strictly constrained by subsurface data, have been interpreted according to the structural extensional style proposed by Brozzetti et al. (2017a). The latter is coherent with the reconstructions of the active extensional belt of the southern and central Apennines described in the literature (Barchi et al., 2007; Amicucci et al., 2008; Brozzetti et al., 2011, 2017a, b; Lavecchia et al., 2017). Overall, this style is characterized by an asymmetric extension driven by a low-angle (20 to 35∘) E-dipping detachment fault, which represents the basal decollement of all the other extensional structures. In the model, all the faults are traced at the surface with their dip angle as measured in the outcrop and evolve downward with nearly listric geometries to join the detachment at increasing depth from west to east. The latter represents the structurally controlled base of the seismogenic layer. The GCG (Figs. 1b, 8), which crops out at a low angle and overcomes all the other east-dipping faults (in terms of both slip and associate extension), is the currently inactive break-away zone of such a detachment. The AVN and BAT (Figs. 2, 8), which are the easternmost E-dipping splays, are suggested to be active and seismogenic, being possibly the causative structures of the Cluster 0 of hypocenters (Fig. 4a). Cluster 1 and Cluster 2, which are confined downward by the E-dipping detachment, confirm the activity of the WSW-dipping ROCS and MPR faults, so that we consider them the main geological structures involved during the 2010–2014 seismic activity (Figs. 4 and 8a, a1). Further east, the 3DFM has been widened to include the W-dipping CSPT and VPP faults, considered the outer seismogenic front of the extensional system. The along-strike continuity of POL and CVN is interrupted by the W-dipping ROCS and MPR faults (Fig. 8c, d), coherently with the cross-cut relationships observed in the field (Fig. 2). The deep geometry of POL and CVN is interrupted by the NNE-dipping AVN (Fig. 8d), which acts as the southern and basal boundary of the entire active fault system.
Finally, the 3DFM shows that almost all the 2010–2018 seismicity correlates with the W-dipping structures but without affecting their southern termination zones. In other words, no or very few events are located south of the intersection with POL and CVN faults. This latter observation suggests that although the POL and CVN did not play an active role in causing the considered seismicity, they play a significant role in influencing its distribution.
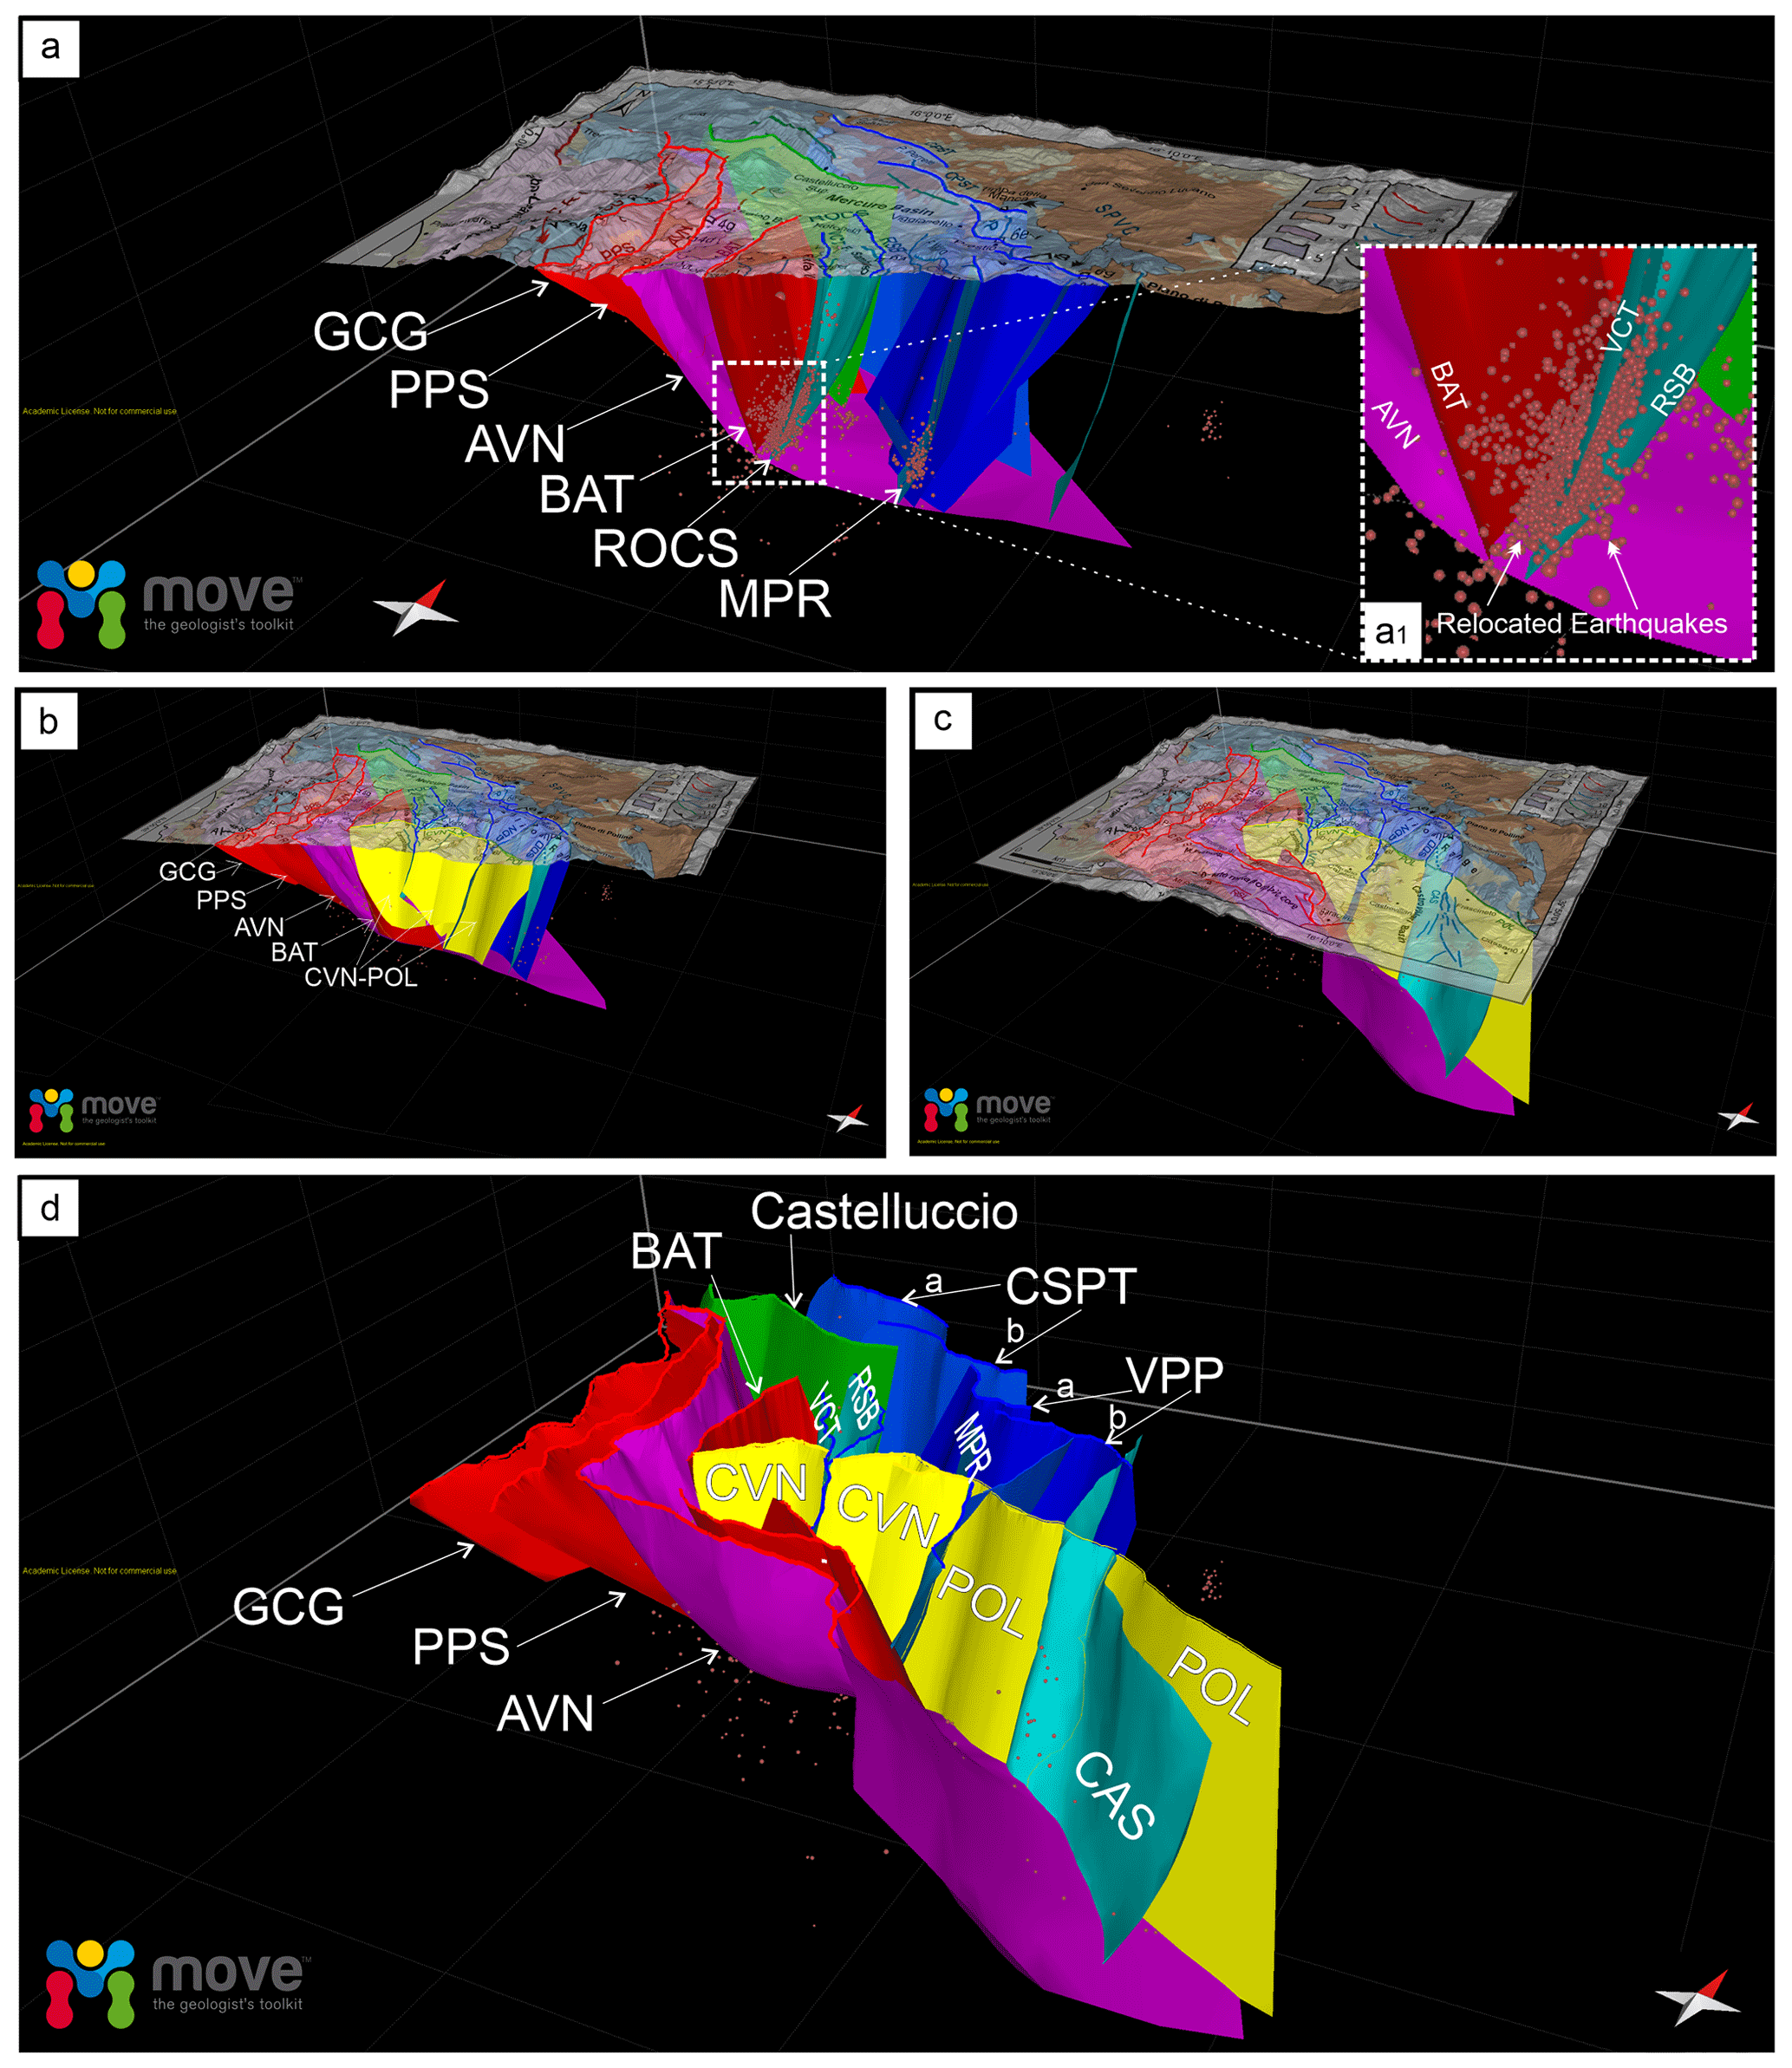
Figure 83D fault model of the extensional system at the Calabrian–Lucanian boundary extrapolated down to ∼ 10–12 km. In panels (a, b, c) the geological–structural map (from Brozzetti et al., 2017a) is superimposed over a 10 m resolution DEM (from Tarquini et al., 2012). The reconstruction of the fault systems is discussed in the paper. In (a), the lower right inset (a1) shows the detail of the main faults involved during the 2010–2018 seismic activity. (d) 3DFM of all extensional fault realized through the Move software. For the acronyms, see Sect. S1. The faults belonging to the E–NE-dipping CRFS fault set are represented in red and violet, whereas the antithetic ROCS and MPR faults are shown as blue surfaces (fault acronyms as in Fig. 2). The yellow surface is the three-dimensional surface of the POL and its westernmost segment (CVN) bounding, to the north, the Campotenese basin.
5.4 From 3D fault model to expected earthquake magnitude
Coherently with what is observed in most Apennine chains (D'Agostino et al., 2001; Ferranti et al., 2014; Montone and Mariucci, 2016; Mariucci and Montone, 2020), the upper crustal Pollino seismicity develops in response to WSW–ENE-oriented extension. This is well constrained by the focal solutions of the strongest events (Mw5.2, 25 October 2012; Mw4.3, 28 May 2012; and Mw4.0, 6 June 2014 earthquakes) and of all the Mw≥3.5 earthquakes that occurred during 2010–2014, and with the results of the geological and seismological inversion (Fig. 5). Such consistency suggests that the present stress field is in continuity with the long-term one, which has been set up at least since the Early–Middle Pleistocene, as already suggested by previous works (Papanikolaou and Roberts, 2007; Brozzetti et al., 2009, 2017a).
Comparing the distribution of all 2010–2018 seismic activity with the Late Quaternary structures mapped at the surface, we maintain that the ROCS and the MPR faults are suitable as the seismogenic sources for the Mormanno (2012, Mw5.2) and Morano Calabro (2012, Mw4.3 and 2014, Mw4.0) earthquakes, respectively. In addition, our 3DFM allows a parameterization of the sources and their seismogenic potential assessment. The map view of the W-dipping faults (Fig. 9a) depicts irregularly shaped seismogenic boxes which are delimited to the east by the fault traces (at the surface) and to the west by the branch line of each fault with the base of the seismogenic layer. Some of these boxes include historical or instrumental earthquakes (Fig. 9b), while others are not associated with any significant event.
The performed 3D reconstruction allowed us to estimate the effective area extent of all the fault segments (Fig. 9c), that, when inserted in the appropriate scaling relationships, provide the expected magnitude possibly releasable in case of entire rupture (Fig. 9c).
We also computed the magnitude values obtained using the regressions as a function of the surface fault length (Fig. 9c). Using six different empirical relations (Wells and Coppersmith, 1994; Wesnousky, 2008; Leonard, 2010; Stirling et al., 2013), we compared the values determined for all the investigated active normal faults (Fig. 9d, e).
It is evident that, for each fault, the expected magnitude computed using fault area is lower than the one calculated by using fault length. The range of variation is narrower for the values calculated on the ground of fault-area regressions (yellow bars in Fig. 9d, e).
Given the significant difference in the magnitude values computed using area- or length-based scaling relationships, we suggest that (where possible) the reconstruction of a 3D-fault geometry should be pursued and preferred in order to derive more reliable parameters to be used (Table S1). This is even more essential in complex extensional systems such as the one we investigated along the Calabrian–Lucanian border.
In fact, the 3DFM highlights that the areal extension of the W-dipping faults depends on their position within the hanging wall of the detachment (see Sect. 5.3). This implies that faults with comparable length at the surface may have significantly different areas, depending on the depths reached. The CSPT, VPP, and CAS crop out at the greatest distance from the GCG break-away zone. Consequently, they intersect the basal detachment at the higher depth and have the maximum area extent among the W-dipping fault set (Fig. 9a, d).
By applying the aforementioned scaling laws (Fig. 9) to the W-dipping faults identified to be involved during the 2010–2014 seismic activity, we calculated the expected magnitude of for the VCT and the RSB, and of for the MPR. Since the two faults (RSB + VCT) of the W-dipping ROCS have been interpreted to join at hypocentral depth to form a single structure (thus a unique seismogenic patch was reconstructed – Fig. 10a), a value of could be reached in the case of complete and concurrent ruptures on both the segments. The aforesaid values are sensibly higher than the magnitudes of the earthquakes recorded to date in the Mercure–Campotenese area (Figs. 1b, 9b), thus suggesting that the considered faults may have only partially released their seismogenic potential during historical times.
This inference also agrees with the distribution and evolution of the 2010–2018 seismic activity. The clusters of the relocated hypocenters concentrated in the deepest parts of the ROCS and MPR faults (Fig. 6) confirm that only a portion of such faults ruptured during the sequence, without the rupture reaching the surface.

Figure 9(a) Seismotectonic 3D fault model in map view. (b) Box representation of the W-dipping seismogenic faults belonging to the 3DFM with a detailed segmentation pattern. Fault traces are numbered according to the table of (c). The associated historical earthquakes from CPTI15 v3.0 (4.5<Mw<6.0; Rovida et al., 2020, 2021) and the epicentral distribution of the 2010–2018 seismic activity that occurred in the Pollino area (1.0<Mw<5.2) are also reported. (c) Expected magnitude according to scaling laws (Wells and Coppersmith, 1994; Wesnousky, 2008; Leonard, 2010; Stirling et al., 2013) and calculated based on fault area (A) and length (L). (d, e) Comparison of magnitude values calculated for all the investigated active faults, using fault-area-based (d) and fault-length-based (e) scaling relationships.
6.1 Seismogenic patches activated during 2010–2014
The seismogenic patches activated on the ROCS and MPR faults during the 2010–2014 seismic sequence are considered as the reasonable approximation of the actual portion of the faults which broke during the mainshock and the sequence of the early aftershocks. We obtained them by projecting the relocated hypocenters on the reconstructed fault surface and depicting their distribution using the Kernel density geostatistical analyst, available as a tool of the ESRI ArcGIS software package. The delimitation of each seismogenic patch and its parameterization allowed us to verify the correlation between its dimensions and the magnitude released by each fault during the mainshocks.
The temporal analysis of the sequence shows that their overall extent was already well defined within the first 72 h after the major events. In any case, inside the surrounding volumes, some seismicity had started before the mainshock and continued to persist constantly throughout the development of the entire sequence so that they include ≥ 70 % of all hypocenter locations. The along-strike elongation and area extent of the patches obtained over the VCT and MPR fault surfaces can be assumed respectively as the effective subsurface rupture length and rupture area (RLD and RA in Fig. 10b, and c, respectively, according to Wells and Coppersmith, 1994) associated with the Mw5.2 Mormanno (on VCT fault) and Mw4.0 and 4.3 Morano Calabro (on MPR fault) earthquakes.
The parameters obtained for the VCT fault are RLD = 4.9 km and RA = 8.3 km2, while RLD = 1.2 km and RA = 3.6 km2 are assessed for the MPR fault. Introducing the aforesaid parameters in the appropriate scale relationships (Fig. 10b, c), we observe a good agreement between the theoretical magnitudes based on the subsurface rupture length and the magnitudes of the mainshocks. The value obtained for the VCT fault (causative of the Mw5.2 Mormanno earthquake) is Mw5.3, whereas for the MPR fault (causative of the Mw4.0 and 4.3 Morano Calabro earthquakes) it is Mw=4.5. The magnitude calculated using the RA-based relationships provides values slightly lower than expected for the VCT (4.9<Mw<5.0) and slightly higher for the MPR (4.5<Mw<4.6). In both cases, however, the magnitude values obtained using the scale relationships differ from those observed by an amount <0.3.
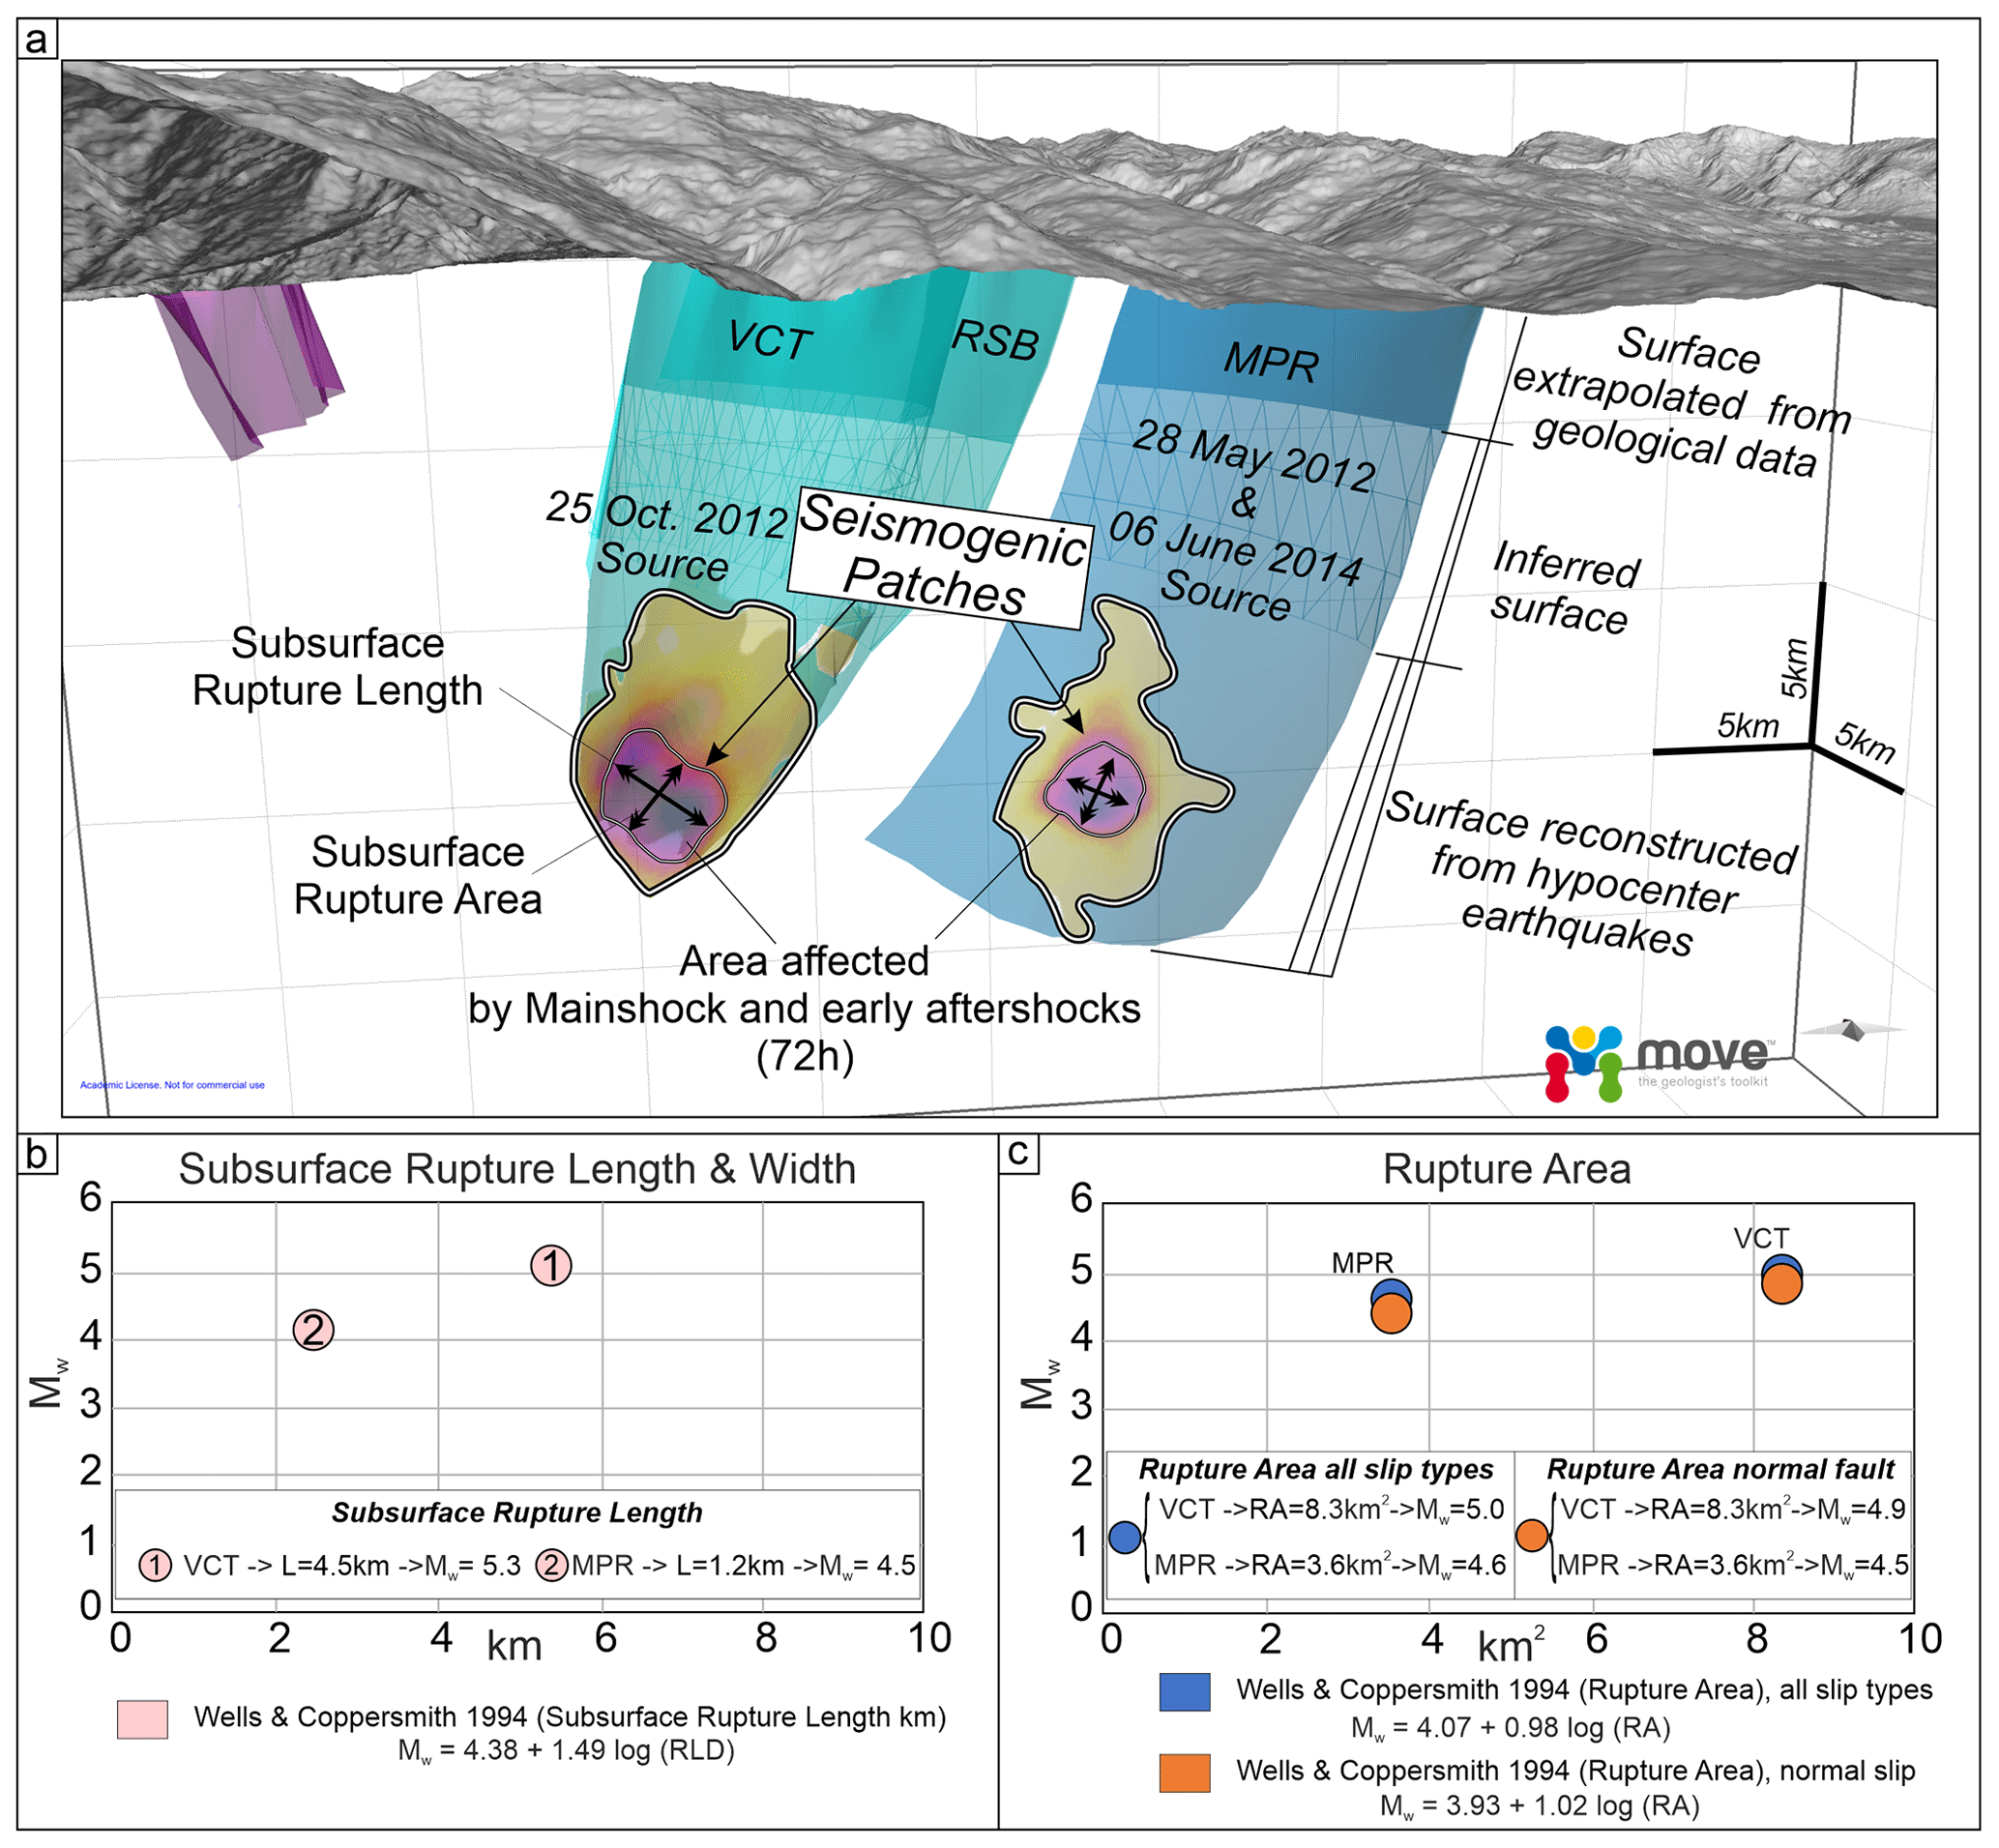
Figure 10(a) Seismogenic patches activated during the 2010–2014 seismic activity on VCT and MPR faults. Their along-strike elongation and area extent, shown by black arrows, are assumed to be the effective subsurface rupture length and rupture area (RLD and RA, according to Wells and Coppersmith, 1994). The association of the patches' rupture with the Mw5.2 Mormanno of the 25 October 2012 (on VCT fault) and Mw4.3 and 4.0 Morano Calabro (on MPR fault, 28 May 2012 and 6 June 2014, respectively) earthquakes is suggested. Panels (b) and (c) show the RLD and RA, respectively, obtained for both the VCT and MPR faults.
6.2 Possible geometric restraints to coseismic rupture propagation
The seismological dataset we used demonstrates that the two main clusters of earthquakes of the 2010–2018 seismicity were generated by as many independent sources related to the sub-parallel, 10 to 15 km long, ROCS and MPR faults.
Brozzetti et al. (2017a) highlighted that the above seismogenic style, characterized by a perpendicular-to-fault strike evolution of the seismic activity, is unlike from those which followed the major instrumental earthquakes recorded in the Apennine Extensional Belt of Italy in recent years, such as the Colfiorito 1997 (Mw6.0), L'Aquila 2009 (Mw6.3), and Norcia 2016 (Mw6.5) events (Chiaraluce et al., 2011, 2017; Lavecchia et al., 2011, 2012a, 2016). They also speculated that this peculiar behavior could have been controlled by the geometric fault pattern of the area, which is characterized by WSW-dipping faults bounded southward by nearly E–W pre-existing structures. These latter are genetically related to the regional-scale, long-lived, “Pollino lineament s.l.” (Bousquet, 1969, 1971; Ghisetti and Vezzani, 1982, 1983; Knott and Turco, 1991; Van Dijk et al., 2000) and determine the abrupt contact between the Apennine carbonate platform unit and the San Donato metamorphic core complex (Grandjaquet, 1962; Servizio Geologico Nazionale, 1970; Amodio Morelli, 1976). The cross-cut relationships detected in the field between the ROCS-MPR set and POL-CVN, highlighted in our 3D model, lead us to exclude the latter fault to have a present seismogenic role, as also supported by the distribution of the instrumental earthquakes which clusterized along with N–S-striking crustal volumes. However, this significant structural–geological boundary could exert an influence on the southward propagation of the currently active seismogenic faults, driving the eastward transfer of the active extensional deformation belt. This inference is confirmed by the spatial distribution of the hypocenters of all 2010–2018 relocated seismicity which is confined within the CVN footwall (Fig. 8d).
We reconstructed in detail the 3D geometry and kinematics of the interconnected fault pattern responsible for the moderate-magnitude earthquakes which recently affected the Pollino area (Calabrian–Lucanian boundary).
The main original outcomes are summarized as follows:
-
The geological and seismological stress tensors computed using geological and seismological data demonstrated that they are consistent with a uniform normal faulting regime characterized by an ENE–WSW-trending, sub-horizontal σ3. This result confirms the coherence between the long-term and the present-day stress field and the persistence of this extensional regime at least since the Middle Pleistocene.
-
The 2010–2018 seismic activity which affected the study area followed a peculiar evolution characterized by the concentration of epicenters in a series of sub-parallel ∼ NNW–SSE elongated clusters, independent and unconnected, which can be related to two major near-coaxial WSW-dipping faults possibly splaying from a common east-dipping basal detachment and concurrently releasing seismicity.
-
The accurate hypocenter re-locations provided a seismological dataset that was correlated with the active faults mapped at the surface. The hypocenter spatial analysis allows the geometry (3DFM) of the seismogenic sources to be reconstructed, which released seismicity during 2010–2014 and through 2018. This reconstruction, extrapolated down to the depth of ∼ 10–12 km, was the interpretative key to obtain the overall model of the Quaternary and active extension in the northern Calabria–Lucania Apennines. The 3DFM model includes all the faults playing a significant role, (either direct or indirect), on the seismogenesis of the study area.
-
The western segment of the Pollino Fault (CVN), despite not being currently active, seems to maintain a significant seismotectonic role. In fact, juxtaposing crustal sectors with different structures and compositions (Apennine platform domain to the north and San Donato metamorphic core to the south) may act as a barrier to the southern propagation of the seismogenic faults of the Mercure–Campotenese sector (ROCS, MPR), limiting their dimensions and seismogenic potential.
-
Based on the dimension and shape of all the active faults of the Pollino area, we estimated the expected magnitudes using appropriate scaling relationships. The complete rupture of individual W-dipping faults, which are recognized to have been causative of the 2010–2014 seismic activity, is expected to release a magnitude of for the VCT and the RSB, and of for the MPR. Higher values, up to Mw=6.4, could be reached in the case of the complete and concurrent rupture on both RSB and VCT. The estimated values exceed the magnitudes of the associated earthquakes which struck the area to date, leading to the hypothesis that the aforesaid faults only partially released their seismogenic potential.
-
The delimitation of the fault patches involved during 2010–2014 and their geometrical parameterization support the consistence between the theoretical magnitudes based on the subsurface rupture length and the magnitudes of the mainshocks.
-
The estimates provided Mw=5.3 for the VCT fault (which released the Mw5.2 Mormanno earthquake) and Mw=4.5 for the MPR fault (which released the Mw4.0 and 4.3 Morano Calabro earthquakes)The magnitudes calculated using the relationships based on the subsurface rupture area (Mw∼5.0 for the VCT and Mw∼4.6 for the MPR), show slightly greater deviation from the observed values.
This study pointed out that even in the case of low-to-moderate seismic activity, like the Pollino 2010–2014 one, the approach based on the three-dimensional reconstruction of the Quaternary fault surfaces (both directly involved and neighboring in the extensional system) represents a real breakthrough in the seismotectonic analysis and, ultimately, in the cognitive path that leads to a better assessment of the seismic hazard of a tectonically active area.
All vector data have been stored and managed in a georeferenced database using ArcMap (by ESRI, ArcMap/ArcGIS, v. 10.8, https://www.esri.com/en-us/home; ESRI, 2021). Kinematic analysis and pseudo focal mechanisms have been obtained using the FaultKin8 software (https://www.rickallmendinger.net/faultkin, Allmendinger, 2021; Marrett and Allmendinger, 1990; Allmendinger et al., 2012 – see references). Stress inversion of structural and seismological data has been computed using Win-Tensor, a software developed by Damien Delvaux, Royal Museum for Central Africa, Tervuren, Belgium (http://damiendelvaux.be/Tensor/WinTensor/win-tensor.html; Delvaux, 2021). The 3D fault model has been built using the MOVE Suite Software (vers. 2019.1) by Petroleum Experts Ltd., Edinburgh, Scotland, UK (https://www.petex.com/products/move-suite/; Petroleum Experts, 2021). The final editing of figures has been carried out using the CorelDRAW Graphics Suite (v. 2020, https://www.coreldraw.com/; CorelDRAW, 2021).
All the datasets presented in this study are available on request to the corresponding authors.
The supplement related to this article is available online at: https://doi.org/10.5194/se-13-205-2022-supplement.
DC and FB conceived and conducted the study. FB, DC, FF and SB wrote the paper. DC developed the 3D structural–geological model using Move software. DC, SB, and FF did GIS analysis and mapping. DC, FB, and SB performed the fieldwork. CT, DP, BO, and RdN handled the seismological analysis. FF did the geological and seismological stress-tensor inversion. DC performed the calculation of the expected magnitudes. DC prepared the figures. GL, SB, FB, and RdN reviewed the figures. DC and SB prepared the GIS geological database. All authors reviewed the final version of the paper.
The contact author has declared that neither they nor their co-authors have any competing interests.
Publisher’s note: Copernicus Publications remains neutral with regard to jurisdictional claims in published maps and institutional affiliations.
This article is part of the special issue “Tools, data and models for 3-D seismotectonics: Italy as a key natural laboratory”. It is a result of the workshop on “Tools, data and models for 3D seismotectonics: the Italian laboratory over time”, Perugia, Italy, 9–10 July 2019.
The authors are grateful to Petroleum Experts, who provided the Move 2019.1 suite software license. We are grateful to the Editor Massimiliano Porreca, to Giovanni Barreca and to an anonymous reviewer for improving the paper with their review.
This research was supported by DPC-INGV PROJECTS-S1 2014–2015 UR-Unich funds to Francesco Brozzetti and from DiSPuTer Department research funds to Rita de Nardis. This research was also supported by PRIN 2017 (2017KT2MKE) funds from the Italian Ministry of Education, University and Research to principal investigator Giusy Lavecchia.
This paper was edited by Massimiliano Porreca and reviewed by Barreca Giovanni and one anonymous referee.
Allmendinger, R. W.: FaultKin8 software, available at: https://www.rickallmendinger.net/faultkin, last access: 19 April 2021.
Allmendinger, R. W., Cardozo, N., and Fisher, D.: Structural geology algorithms: Vectors and tensors of structural geology, Cambridge, England, Cambridge University Press, 289 pp., https://doi.org/10.1017/S0016756812000192, 2012.
Allmendinger, R. W., Siron, C. R., and Scott, C. P.: Structural data collection with mobile devices: Accuracy, redundancy, and best practices, J. Struct. Geol., 102, 98–112, https://doi.org/10.1016/j.jsg.2017.07.011, 2017.
Amicucci, L., Barchi, M. R., Montone, P., and Rubilani, N.: The Vallo di Diano and Auletta extensional basins in the southern Apennines (Italy): a simple model for a complex setting, Terra Nova, 20, 475–482, https://doi.org/10.1111/j.1365-3121.2008.00841.x, 2008.
Amodio Morelli, L., Bonardi, G., Colonna, V., Dietrich, D., Giunta, G., Ippolito, F., Liguori, V., Lorenzoni, S., Paglionico, A., Perrone, V., Piccarreta, G., Russo, M., Scandone, P., Zanettin-Lorenzoni, E., and Zuppetta, A.: L'Arco calabro peloritano nell'orogene appenninico-maghrebide, Mem. Soc. Geol. It., 17, 1–60, 1976.
Angelier, J. and Mechler, P.: Sur une méthode graphique de recherche des contraintes principales également utilisable en tectonique et en séismologie: la méthode des dièdres droits, B. Soc. Gèol. Fr., 7, 1309–1318, 1977.
Arrigo, G., Roumelioti, Z., Benetatos, C., Kiratzi, A., Bottari, A., Neri, G., Termini, D., Gorini, A., and Marcucci, S.: A source study of the 9 September 1998 (Mw5.6) Castelluccio Earthquakes in Southern Italy using Teleseismic and strong motion data, Nat. Hazards, 37, 245–262, https://doi.org/10.1007/s11069-005-4644-1, 2006.
Ascione, A., Mazzoli, S., Petrosino, P., and Valente, E.: A decoupled kinematic model for active normal faults: insights from the 1980, MS=6.9 Irpinia earthquake, southern Italy, GSA Bull., 125, 1239–1259, https://doi.org/10.1130/B30814.1, 2013.
Barchi, M., Lavecchia, G., Galadini, F., Messina, P., Michetti, A. M., Peruzza, L., Pizzi, A., Tondi, E., and Vittori, E.: Sintesi delle conoscenze geologiche sulle faglie responsabili dei terremoti maggiori in Italia Centrale: Parametrizzazione ai fini della caratterizzazione della pericolosità sismica, Gruppo Naz. per la Difesa dai Terremoti, CNR, Rome, ISBN 88-900449-7-7, available at: https://emidius.mi.ingv.it/GNDT2/Pubblicazioni/Barchi.htm (last access: 19 April 2021), 1999.
Barchi, M., Amato, A., Cippitelli, G., Merlini, S., and Montone, P.: Extensional tectonics and seismicity in the axial zone of the southern Apennines, Boll. Soc. Geol. It., 7, 47–56, 2007.
Barchi, M. R., De Feyter, A., Magnani, M. B., Minelli, G., Pialli, G., and Sotera, B. M.: Extensional tectonics in the northern Apennines (Italy): Evidence from the CROP03 deep seismic reflection line, Mem. Soc. Geol. Ital., 52, 527–538, 1998.
Barchi, M. R., Carboni, F., Michele, M., Ercoli, M., Giorgetti, C., Porreca, M., Azzaro, S., and Chiaraluce, L.: The influence of subsurface geology on the distribution of earthquakes during the 2016–2017 Central Italy seismic sequence, Tectonophysics, 807, 228797, https://doi.org/10.1016/j.tecto.2021.228797, 2021.
Bello, S., de Nardis, R., Scarpa, R., Brozzetti, F., Cirillo, D., Ferrarini, F., di Lieto, B., Arrowsmith, J R., and Lavecchia, G.: Fault Pattern and Seismotectonic Style of the Campania-Lucania 1980 Earthquake (Mw6.9, Southern Italy): New Multidisciplinary Constraints, Front. Earth Sci., 8, 652, https://doi.org/10.3389/feart.2020.608063, 2021a.
Bello, S., Scott, C. P., Ferrarini, F., Brozzetti, F., Scott, T., Cirillo, D., de Nardis, R., Arrowsmith, J R., and Lavecchia, G.: High-resolution surface faulting from the 1983 Idaho Lost River Fault Mw6.9 earthquake and previous events, Sci. Data, 8, 68, 1–20, https://doi.org/10.1038/s41597-021-00838-6, 2021b.
Bello, S., Andrenacci, C., Cirillo, D., Scott, T., Brozzetti, F., Arrowsmith J R., and Lavecchia G.: High-detail fault segmentation: Deep insight into the anatomy of the 1983 Borah Peak earthquake rupture zone (Mw6.9, Idaho, USA), Lithosphere, 2022, 8100224, https://doi.org/10.2113/2021/8100224, 2022.
Blumetti, A. M., Esposito, E., Ferreli, L., Michetti, A. M., Porfido, S., Serva, L., and Vittori, E.: New data and reinterpretation of November 23, 1980, M 6.9 Irpinia-Lucania earthquake (Southern Apennines) coseismic surface effects, edited by: Dramis, F., Farabollini, P., and Molin, P., in: Large-scale vertical movements and related gravitational processes, Studi Geologici Camerti, special issue, 19-27, 2002.
Bonini, L., Toscani, G., and Seno S.: Three-dimensional segmentation and different rupture behavior during the 2012 Emilia seismic sequence (Northern Italy), Tectonophysics, 630, 33–42, https://doi.org/10.1016/j.tecto.2014.05.006, 2014.
Bousquet, J. C.: La tectonique tangentielle des series calcareo-dolomitiques du nord-est de l'Apennin Calabro-Lucanien (Italie Méridionale), Geologica Romana, 10, 23–52, 1971.
Bousquet, J. C. and Gueremy, P.: Quelques Phénomènes de Néotectonique dans l'Apennin Calabro-Lucanien et Leurs Conséquences Morphologiques, Rev. Géogr. Phys. Géol. Dynam., 10, 225–238, 1969.
Brozzetti, F.: The Campania-Lucania extensional fault system (southern Italy): a suggestion for a uniform model of active extension in the Italian Apennines, Tectonics, 30, 1–26, https://doi.org/10.1029/2010TC002794, 2011.
Brozzetti, F. and Lavecchia, G.: Seismicity and related extensional stress field: the case of the Norcia Seismic Zone (Central Italy), Ann. Tectonicae, 8, 36–57, 1994.
Brozzetti, F., Lavecchia, G., Mancini, G., Milana, G., and Cardinali, M.: Analysis of the 9 September 1998 Mw5.6 Mercure earthquake sequence (southern Apennines, Italy): a multidisciplinary approach, Tectonophysics, 476, 210–225, https://doi.org/10.1016/j.tecto.2008.12.007, 2009.
Brozzetti, F., Cirillo, D., Liberi, F., Faraca, E., and Piluso, E.: The Crati Valley Extensional System: field and subsurface evidences, Rend. Online Soc. Geol. It., 21, 159–161, 2012.
Brozzetti, F., Cirillo, D., de Nardis, R., Cardinali, M., Lavecchia, G., Orecchio, B., Presti D., and Totaro, C.: Newly identified active faults in the Pollino seismic gap, southern Italy, and their seismotectonic significance, J. Struct. Geol., 94, 13–31, https://doi.org/10.1016/j.jsg.2016.10.005, 2017a.
Brozzetti, F., Cirillo, D., Liberi, F., Piluso, E., Faraca, E., De Nardis, R., and Lavecchia, G.: Structural style of Quaternary extension in the Crati Valley (Calabrian Arc): Evidence in support of an east-dipping detachment fault, It. Journ. of Geosci., 136, 434–453, https://doi.org/10.3301/IJG.2017.11, 2017b.
Brozzetti, F., Mondini, A. C., Pauselli, C., Mancinelli, P., Cirillo, D., Guzzetti, F., and Lavecchia, G.: Mainshock Anticipated by Intra-Sequence Ground Deformations: Insights from Multiscale Field and SAR Interferometric Measurements, Geosciences, 10, 186, https://doi.org/10.3390/geosciences10050186, 2020.
Brozzetti, F., Cirillo, D., and Luchetti, L.: Timing of Contractional Tectonics in the Miocene Foreland Basin System of the Umbria Pre-Apennines (Italy): An Updated Overview, Geosciences, 11, 97, https://doi.org/10.3390/geosciences11020097, 2021.
Caiazzo, C., Giovine, B., Ortolani, F., Pagliuca, S., Schiattarella, M., Barchi, and Vitale, C.: Genesi ed evoluzione strutturale della depressione tettonica dell'alta valle del Fiume Sele (Appennino Campano Lucano), Stud. Geol. Camerti, 1992, 245–255, 1992.
Calamita, F., Pizzi, A., and Roscioni, M.: I fasci di faglie recenti ed attive di M. Vettore – M. Bove e di M. Castello - M. Cardosa (Appennino Umbro-Marchigiano), in: Studi Geologici Camerti, Università di Camerino, Camerino, Italy, available at: http://193.204.8.201:8080/jspui/handle/1336/552 (last access: 19 April 2021), 81–95, 1992.
Cambiotti, G., Palano, M., Orecchio, B., Marotta, A. M., Barzaghi, R., Neri, G., and Sabadini, R.: New Insights into Long-Term Aseismic Deformation and Regional Strain Rates from GNSS Data Inversion: The Case of the Pollino and Castrovillari Faults, Remote Sensing, 12, https://doi.org/10.3390/rs12182921, 2020.
Castaldo, R., de Nardis, R., DeNovellis, V., Ferrarini, F., Lanari, R., Lavecchia, G., Pepe, S., Solaro, G., and Tizzani, P.: Coseismic Stress and Strain Field Changes Investigation Through 3-D Finite Element Modeling of DInSAR and GPS Measurements and Geological/Seismological Data: The L'Aquila (Italy) 2009 Earthquake Case Study, J. Geophys. Res.-Sol. Ea., 123, 4193–4222, https://doi.org/10.1002/2017jb014453, 2018.
Castello, B., Selvaggi, G., Chiarabba, C., and Amato, A.: CSI Catalogo della sismicità italiana 1981–2002, versione 1.1., INGV-CNT, available at https://csi.rm.ingv.it/ (last access: 19 April 2021), Roma, 2006.
Cello, G., Tondi, E., Micarelli, L., and Mattioni L.: Active tectonics and earthquake sources in the epicentral area of the 1857 Basilicata earthquake (southern Italy), J. Geodyn., 36, 37–50, https://doi.org/10.1016/S0264-3707(03)00037-1, 2003.
Cheloni, D., D'Agostino, N., Selvaggi, G., Avallone, A., Fornaro, G., Giuliani, R., Reale, D., Sansosti, E., and Tizzani, P.: Aseismic transient during the 2010–2014 seismic swarm: evidence for longer recurrence of M ≥6.5 earthquakes in the Pollino gap (Southern Italy)?, Sci. Rep., 7, 576, https://doi.org/10.1038/s41598-017-00649-z, 2017.
Chiaraluce, L., Amato, A., Cocco, M., Chiarabba, C., Selvaggi, G., Di Bona, M., Piccinini, D., Deschamps, A., Margheriti, L., Courboulex, F., and Ripepe, M.: Complex normal faulting in the Apennines thrust-and-fold belt: The 1997 seismic sequence in Central Italy, Bull. Seismol. Soc. Am. 94, 99–116, https://doi.org/10.1785/0120020052, 2004.
Chiaraluce, L., Barchi, M. R., Collettini, C., Mirabella, F., and Pucci, S.: Connecting seismically active normal faults with Quaternary geological structures: the Colfiorito 1997 case history (Northern Apennines, Italy), Tectonics, 24, 1–16, https://doi.org/10.1029/2004TC001627, 2005.
Chiaraluce, L., Valoroso, L., Piccinini, D., Di Stefano, R., and De Gori, P.: The anatomy of the 2009 L'Aquila normal fault system (central Italy) imaged by high resolution foreshock and aftershock locations, J. Geophys. Res., 116, B12311, https://doi.org/10.1029/2011JB008352, 2011.
Chiaraluce, L., Di Stefano, R., Tinti, E., Scognamiglio, L., Michele, M., Casarotti, E., Cattaneo, M., De Gori, P., Chiarabba, C., Monachesi, G., Lombardi, A., Valoroso, L., Latorre, D., and Marzorati, S.: The 2016 Central Italy Seismic Sequence: A First Look at the Mainshocks, Aftershocks, and Source Models, Seismol. Res. Lett., 88, 757–771, https://doi.org/10.1785/0220160221, 2017.
Cifelli, F., Rossetti, F., and Mattei, M.: The architecture of brittle postorogenic extension: Results from an integrated structural and paleomagnetic study in north Calabria (southern Italy), GSA Bull., 119, 221–239, https://doi.org/10.1130/B25900.1, 2007.
Cinque, A., Patacca, E., Scandone, P., and Tozzi, M.: Quaternary kinematic evolution of the southern apennines. relationship between surface geological features and lithospheric structures, Ann. Geofisc., 36, 249–260, https://doi.org/10.4401/ag-4283, 1993.
Cinque, A., Ascione, A., and Caiazzo, C.: Distribuzione spaziotemporale e caratterizzazione della fagliazione quaternaria in Appennino meridionale, in Le Ricerche del GNDT nel Campo Della Pericolosità Sismica (1996–1999), edited by: Galadini, F., Meletti, C., and Rebez, A., 397 pp., CNR, Gruppo Naz. per la Difesa dai Terremoti, Rome, ISBN 88-900449-2-6, 2000.
Cinti, F. R., Cucci, L., Pantosti, D., D'Addezio, G., and Meghraoui, M.: A major seismogenic fault in a “silent area”: the Castrovillari fault (Southern Apennines, Italy), Geophys. J. Int., 130, 595–605, 1997.
Cinti, F. R., Moro, M., Pantosti, D., Cucci, L., and D'Addezio, G.: New constraints on the seismic history of the Castrovillari fault in the Pollino gap (Calabria, southern Italy), J. Seismol., 6, 199–217, https://doi.org/10.1023/A:1015693127008, 2002.
Cirillo, D.: Digital Field Mapping and Drone-Aided Survey for Structural Geological Data Collection and Seismic Hazard Assessment: Case of the 2016 Central Italy Earthquakes, Appl. Sci., 10, 5233, https://doi.org/10.3390/app10155233, 2020.
CorelDRAW: Graphics Suite, v. 2020, available at: https://www.coreldraw.com/, last access: 19 April 2021.
D'Agostino, N., Giuliani, R., Mattone, M., and Bonci, L.: Active crustal extension in the central Apennines (Italy) inferred from GPS measurements in the interval 1994–1999, Geophys. Res. Lett., 28, 2121–2124, https://doi.org/10.1029/2000GL012462, 2001.
D'Agostino, N.: Complete seismic release of tectonic strain and earthquake recurrence in the Apennines (Italy), Geophys. Res. Lett 41, 1155–1162, https://doi.org/10.1002/2014GL059230, 2014.
D'Alessandro, A., Gervasi, A., and Guerra, I.: Evolution and strengthening of the Calabrian regional seismic network. Adv. Geosci., 36, 11–16, 2013.
D'Argenio, B.: L'Appennino Campano Lucano. Vecchi e nuovi modelli geologici tra gli anni sessanta e gli inizi degli anni ottanta, Mem. Soc. Geol. It., 41, 3–15, 1992.
Delaunay, B.: Sur la sphere vide, Bull. Acad. Sci. USSR(VII), Classe Sci. Mat. Nat., 6, 793–800, 1934.
Delvaux, D.: Win-Tensor, available at: http://damiendelvaux.be/Tensor/WinTensor/win-tensor.html, last access: 19 April 2021.
Delvaux, D. and Sperner, B.: New aspects of tectonic stress inversion with reference to the TENSOR program, in: New Insights into Structural Interpretation and Modelling, edited by: Nieuwland, D. A., J. Geol. Soc. London Spec. Publ., 212, 75–100, 2003.
Delvaux, D. and Barth, A.: African stress pattern from formal inversion of focal mechanism data, Tectonophysics, 482, 105–128, https://doi.org/10.1016/j.tecto.2009.05.009, 2010.
Devoti, R., Esposito, A., Pietrantonio, G., Pisani, A. R., and Riguzzi, F.: Evidence of large-scale deformation patterns from GPS data in the italian subduction boundary, Earth Planet. Sci. Lett., 311, 230–241, https://doi.org/10.1016/j.epsl.2011.09.034, 2011.
De Matteis, R., Convertito, V., Napolitano, F., Amoroso, O., Terakawa, T., and Capuano, P.: Pore fluid pressure imaging of the Mt. Pollino region (southern Italy) from earthquake focal mechanisms, Geophys. Res. Lett., 48, e2021GL094552, https://doi.org/10.1029/2021GL094552, 2021.
Di Bucci, D., Buttinelli, M., D'Ambrogi, C., and Scrocca, D., and the RETRACE-3D Working Group: The RETRACE-3D multi-data and multi-expertise approach towards the construction of a 3D crustal model for the 2016–2018 Central Italy seismic sequence, Boll. Geof. Teor. Appl., 62, 1–18, https://doi.org/10.4430/bgta0343, 2021.
Elter, P., Giglia, G., Tongiorgi, M., and Trevisan, L.: Tensional and compressional areas in the recent (Tortonian to present) evolution of the northern Apennines, Boll. Geofis. Teor. Appl., 17, 3–18, 1975.
Ercoli, M., Pauselli, C., Forte, E., Frigeri, A., and Federico, C.: The Mt. Pollino Fault (southern Apennines, Italy): GPR signature of Holocenic earthquakes in a “silent” area, in: Advanced Ground Penetrating Radar (IWAGPR), 2013 7th International Workshop, IEEE, 1–6, https://doi.org/10.1109/IWAGPR.2013.6601510, Nantes, France, 2–5 July 2013.
Ercoli, M., Cirillo, D., Pauselli, C., Jol, H. M., and Brozzetti, F.: Ground-penetrating radar signature of Quaternary faulting: a study from the Mt. Pollino region, southern Apennines, Italy, Solid Earth, 12, 2573–2596, https://doi.org/10.5194/se-12-2573-2021, 2021.
ESRI: ArcMap/ArcGIS, v. 10.8, available at: https://www.esri.com/en-us/home, last access: 19 April 2021.
Faure Walker, J. P., Roberts, G. P., Cowie, P. A., Papanikolaou, I., Michetti, A. M., Sammonds, P., Wilkinson, M., McCaffrey, K. J. W., and Phillips, R. J.: Relationship between topography, rates of extension and mantle dynamics in the actively-extending Italian Apennines, Earth Planet. Sci. Lett., 325–326, 76–84, https://doi.org/10.1016/j.epsl.2012.01.028, 2012.
Ferranti, L., Palano, M., Cannavò, F., Mazzella, M. E., Oldow, J. S., Gueguen, E., Mattia, M., and Monaco, C.: Rates of geodetic deformation across active faults in southern Italy, Tectonophysics, 621, 101–122, https://doi.org/10.1016/j.tecto.2014.02.007, 2014.
Ferranti, L., Milano, G., and Pierro, M.: Insights on the seismotectonics of the western part of northern Calabria (southern Italy) by integrated geological and geophysical data: coexistence of shallow extensional and deep strike-slip kinematics, Tectonophysics, 721, 372–386, https://doi.org/10.1016/j.tecto.2017.09.020, 2017.
Ferrarini, F., Lavecchia, G., de Nardis, R., and Brozzetti, F.: Fault geometry and active stress from earthquakes and field geology data analysis: the Colfiorito 1997 and L'Aquila 2009 cases (central Italy), Pure Appl. Geoph., 172, 1079–1103, https://doi.org/10.1007/s00024-014-0931-7, 2015.
Ferrarini, F., Boncio, P., de Nardis, R., Pappone, G., Cesarano, M., Aucelli, P. P. C., and Lavecchia, G.: Segmentation pattern and structural complexities in seismogenic extensional settings: The North Matese Fault System (Central Italy), J. Struct. Geol., 95, 93–112, https://doi.org/10.1016/j.jsg.2016.11.006, 2017.
Ferrarini, F., de Nardis, R., Brozzetti, F., Cirillo, D., Arrowsmith, J R., and Lavecchia, G.: Multiple Lines of Evidence for a Potentially Seismogenic Fault Along the Central-Apennine (Italy) Active Extensional Belt – An Unexpected Outcome of the MW6.5 Norcia 2016 Earthquake, Front. Earth Sci., 9, 642243, https://doi.org/10.3389/feart.2021.642243, 2021.
Filice, F. and Seeber, L.: The Culmination of an Oblique Time-Transgressive Arc Continent Collision: The Pollino Massif Between Calabria and the Southern Apennines, Italy, Tectonics, 38, 3261–3280, https://doi.org/10.1029/2017TC004932, 2019.
Filice, F., Liberi, F., Cirillo, D., Pandolfi, L., Marroni, M., and Piluso, E.: Tectonometamorphic and structural evolution of the ophiolitic sequences from the central sector of the Catena Costiera (Northern Calabria), Rend. Online Soc. Geol. It., 21, 300–302, 2012.
Filice, F., Liberi, F., Cirillo, D., Pandolfi, L., Marroni, M., and Piluso, E.: Geological map of the central sector of the Catena Costiera (Northern Calabria), Rend. Online Soc. Geol. It., 29, 55–58, 2013.
Filice, F., Liberi, F., Cirillo, D., Pandolfi, L., Marroni, M., and Piluso E.: Geology map of the central area of Catena Costiera: insights into the tectono-metamorphic evolution of the Alpine belt in Northern Calabria, J. Maps, 11, 114–125, https://doi.org/10.1080/17445647.2014.944877, 2015.
Frepoli, A., Cinti, R., Amicucci, L., Cimini, G. B., De Gori, P., and Pierdominici, S.: Pattern of seismicity in the Lucanian Apennines and foredeep (Southern Apennines) from recording by SAPTEX temporary array, Annal. Geophys., 48, 1035–1054, 2005.
Frohlich, C.: Display and quantitative assessment of distributions of earthquakes focal mechanisms, Geophys. J. Int. 144, 300–308, https://doi.org/10.1046/j.1365-246x.2001.00341.x, 2001.
Gafarov, K., Ercoli, M., Cirillo, D., Pauselli, C., and Brozzetti, F.: Extending surface geology data through GPR prospections: Quaternary faulting signature from the Campotenese area (Calabria-Italy), 17th International Conference on Ground Penetrating Radar, GPR, 8441611, https://doi.org/10.1109/ICGPR.2018.8441611, Rapperswil, Switzerland, 18–21 June 2018.
Galadini, F. and Galli, P.: Active tectonics in the Central Apennines (Italy): Input data for seismic hazard assessment, Nat. Hazards, 22, 225–268, https://doi.org/10.1023/A:1008149531980, 2000.
Galli, P.: Recurrence times of central-southern Apennine faults (Italy): Hints from paleoseismology, Terra Nova, 32, 399–407, https://doi.org/10.1111/ter.12470, 2020.
Galli, P. and Peronace, E.: New paleoseismic data from the Irpinia fault. A different seismogenic perspective for the southern Apennines, Earth Sci. Rev., 136, 175–201, https://doi.org/10.1016/j.earscirev.2014.05.013, 2014.
Gephart, J. W. and Forsyth, D. W.: An improved method for determining the regional stress tensor using earthquake focal mechanism data: application to the San Fernando earthquake sequence, J. Geophys. Res., 89, 9305–9320, https://doi.org/10.1029/JB089iB11p09305, 1984.
Ghisetti, F. and Vezzani, L.: Strutture tensionali e compressive indotte da meccanismi profondi lungo la linea del Pollino (Appennino meridionale), Boll. Soc. Geol. It., 101, 385–440, 1982.
Ghisetti, F. and Vezzani, L.: Structural Map of Mt. Pollino (Southern Italy), 1:50 000 Scale, SELCA, Firenze, 1983.
Giano, S. I. and Martino, C.: Assetto morfotettonico e morfostratigrafico di alcuni depositi continentali pleistocenici del bacino del Pergola–Melandro (Appennino Lucano), Quaternario, 16, 289–297, 2003.
Gracia, E., Grevemeyer, I., Bartolome, R., Perea, H., Martinez-Loriente, S., Gomez de la Pena, L., Villasenor, A., Klinger, Y., Lo Iacono, C., Diez, S., Calahorrano, A., Camafort, M., Costa, S., d'Acremont, E., Rabaute, A., and Ranero, C. R.: Earthquake crisis unveils the growth of an incipient continental fault system, Nat. Commun., 10, 3482, https://doi.org/10.1038/s41467-019-11064-5, 2019.
Grandjacquet, C.: Données nouvelles sur la tectonique tertiaire des massif Calabro-Lucaniens, Bull. Soc. Geol. Fr., 7, 695–706, 1962.
Guerra, I., Harabaglia, P., Gervasi, A., and Rosa, A.B.: The 1998–1999 Pollino (Southern Apennines, Italy) seismic crisis: tomography of a sequence, Ann. Geophys., 48, 995–1007, https://doi.org/10.4401/ag-3249, 2005.
Heidbach, O., Tingay, M., Barth, A., Reinecker, J., Kurfeß, D., and Müller, B.: Global crustal stress pattern based on the world stress map database release 2008, Tectonophysics 482, 3–15, https://doi.org/10.1016/j.tecto.2009.07.023, 2010.
Hippolyte, J. C., Angelier, J., and Barrier, E.: Compressional and extensional tectonics in an arc system; example of the Southern Apennines, J. Struct. Geol. 17, 1725–1740, https://doi.org/10.1016/0191-8141(95)00066-M, 1995.
Husen, S. and Smith, R.: Probabilistic earthquake location in three-dimensional velocity models for the Yellowstone National Park region, Wyoming, Bull. Seism. Soc. Am., 94, 880–896, 2004.
Iannace, A., D'Errico, M., and Vitale, S.: Carta Geologica dell'area compresa tra Maratea, Castrovillari e Sangineto, in: Analisi Dello Strain Finito in 3D Dell'Unità Pollino-Ciagola (Confine Calabro-lucano, Italia Meridionale), edited by: Vitale, S. and Iannace, A., Studi Geologici Camerti, Nuova Serie, 2, 153–167, ISSN 0392-0631, 2004.
Iannace, A., Garcia Tortosa, F. J., and Vitale, S.: The Triassic metasedimentary successions across the boundary between Southern Apennines and Calabria–Peloritani Arc (Northern Calabria, Italy), Geol. J., 40, 155–171, https://doi.org/10.1002/gj.1001, 2005.
Iannace, A., Vitale, S., D'Errico, M., Mazzoli, S., Di Staso, A., Macaione, E., Messina, A., Reddy, S. M., Somma, R., Zamparelli, V., Zattin, M., and Bonardi, G.: The carbonate tectonic units of northern Calabria (Italy): a record of Apulian palaeomargin evolution and Miocene convergence, continental crust subduction, and exhumation of HP–LT rocks, J. Geol. Soc. Lond., 164, 1165–1186, https://doi.org/10.1144/0016-76492007-017, 2007.
Ietto, A. and Barilaro, A. M.: L'Unità di San Donato quale margine deformato Cretacico-Paleogene del bacino di Lagonegro (Appennino Meridionale-Arco Calabro), Boll. Soc. Geol. It., 112, 477–496, 1993.
ISIDe Working Group: Italian Seismological Instrumental and Parametric Database (ISIDe), Istituto Nazionale di Geofisica e Vulcanologia (INGV), https://doi.org/10.13127/ISIDE, 2007.
Johnson, K., Nissen, E., Saripalli, S., Arrowsmith, J R., McGarey, P., Scharer, K., Williams, P., and Blisniuk, K.: Rapid mapping of ultrafine fault zone topography with structure from motion, Geosphere, 10, 969–986, https://doi.org/10.1130/GES01017.1, 2014.
Klin, P., Laurenzano, G., Romano, M. A., Priolo, E., and Martelli, L.: ER3D: a structural and geophysical 3-D model of central 742 Emilia-Romagna (northern Italy) for numerical simulation of earthquake ground motion, Solid Earth, 743, 931–949, https://doi.org/10.5194/se-10-931-2019, 2019.
Knott, S. D. and Turco, E.: Late cenozoic kinematics of the Calabrian arc, southern Italy, Tectonics, 10, 1164–1172, 1991.
Lavecchia, G., Brozzetti, F., Barchi, M., Menichetti, M., and Keller, J. V. A.: Seismotectonic zoning in east-central Italy deduced from an analysis of the Neogene to present deformations and related stress fields, Geol. Soc. Am. Bull., 106, 1170–1120, https://doi.org/10.1130/0016-7606(1994)106<1107:SZIECI>2.3.CO;2, 1994.
Lavecchia, G., Boncio, P., Brozzetti, F., De Nardis, R., Di Naccio, D., Ferrarini, F., Pizzi, A., and Pomposo, G.: The April 2009 L'Aquila (central Italy) seismic sequence (Mw6.3): a preliminary seismotectonic picture, in: Recent Progress on Earthquake Geology, edited by: Guarnieri, P., Nova Science Pub., Inc., ISBN 978-1-60876-147-0, 2011, 1–17, 2011.
Lavecchia, G., Ferrarini, F., Brozzetti, F., de Nardis, R., Boncio, P., and Chiaraluce, L.: From surface geology to aftershock analysis: constraints on the geometry of the L'Aquila 2009 seismogenic fault system, Italian J. Geosciences, 131, 330–347, https://doi.org/10.3301/IJG.2012.24, 2012a.
Lavecchia, G., de Nardis, R., Cirillo, D., Brozzetti, F., and Boncio, P.: The May–June 2012 Ferrara Arc earthquakes (northern Italy): structural control of the spatial evolution of the seismic sequence and of the surface pattern of coseismic fractures, Annals of Geophysics, 55, 4, https://doi.org/10.4401/ag-6173, 2012b.
Lavecchia, G., de Nardis, R., Costa, G., Tiberi, L., Ferrarini, F., Cirillo, D., Brozzetti, F., and Suhadolc, P.: Was the Mirandola thrust really involved in the Emilia 2012 seismic sequence (northern Italy)? Implications on the likelihood of triggered seismicity effects, Boll. Geof. Teor. Appl., 56, 461–488, 2015.
Lavecchia, G., Castaldo, R., de Nardis, R., De Novellis, V., Ferrarini, F., Pepe, S., Brozzetti, F., Solaro, G., Cirillo, D., Bonano, M., Boncio, P., Casi, F., De Luca, C., Lanar, R., Manunta, M., Manzo, M., Pepe, A., Zinno, I., and Tizzani, P.: Ground deformation and source geometry of the 24 August 2016 Amatrice earthquake (Central Italy) investigated through analytical and numerical modeling of DInSAR measurements and structural-geological data, Geophys. Res. Lett., 43, 12389–12398, https://doi.org/10.1002/2016GL071723, 2016.
Lavecchia, G., Adinolfi, G. M., de Nardis, R., Ferrarini, F., Cirillo, D., Brozzetti, F., De Matteis, R., Festa, G., and Zollo, A.: Multidisciplinary inferences on a newly recognized active east-dipping extensional system in central Italy, Terra Nova, 29, 77–89, https://doi.org/10.1111/ter.12251, 2017.
Lavecchia, G., de Nardis, R., Ferrarini, F., Cirillo, D., Bello, S., and Brozzetti, F.: Regional seismotectonic zonation of hydrocarbon fields in active thrust belts: a case study from Italy, in: Building knowledge for geohazard assessment and management in the caucasus and other orogenic regions, editors by: Bonali, F. L., Pasquaré Mariotto, F., and Tsereteli N., Springer, the Netherlands, https://doi.org/10.1007/978-94-024-2046-3_7, 2021.
Leonard, M.: Earthquake fault scaling: Relating rupture length, width, average displacement, and moment release, Bull. Seismol. Soc. Am., 100, 1971–1988, https://doi.org/10.1785/0120090189, 2010.
Liberi, F. and Piluso, E.: Tectonometamorphic evolution of the ophiolitic sequences from Northern Calabrian Arc, Italian Journal Geoscience, 128, 483–493, https://doi.org/10.3301/IJG.2009.128.2.483, 2009.
Liberi, F., Morten, L., and Piluso, E.: Geodynamic significance of the ophiolites within the Calabrian Arc, Island Arc, 15, 26–43, https://doi.org/10.1111/j.1440-1738.2006.00520.x, 2006.
Lippmann-Provansal, M.: L'Appennin meridionale (Italie): Etude geomorphologique, these Doctorat, Univ. D'Aix-Marseille II, Marseille, France, 1987.
Lomax, A., Virieux, J., Volant, P., and Berge-Thierry, C.: Probabilistic Earthquake Location in 3D and Layered Model, in: Advances in Seismic Event Location, 101–134, Kluwer Academic Publishers, Netherlands, https://doi.org/10.1007/978-94-015-9536-0_5, 2000.
Margheriti, L., Amato, A., Braun, T., Cecere, G., D'Ambrosio, C., De Gori, P., and Selvaggi, G.: Emergenza nell'area del Pollino: le attività della Rete Sismica Mobile, Rapporti Tecnici INGV, 252, ISSN 2039-7941, available at: https://www.earth-prints.org/bitstream/2122/8540/1/2013_RT_252_MargheritiEtAl.pdf .pdf (last access: 19 April 2021), 2013.
Marret, R. and Allmendinger, W.: Kinematic analysis of fault-slip data, J. Struct. Geol., 12, 973–986, 1990.
Mariucci, M. T. and Montone, P.: Database of Italian present-day stress indicators, IPSI 1.4, Sci. Data, 7, 298, https://doi.org/10.1038/s41597-020-00640-w, 2020.
Maschio, L., Ferranti, L., and Burrato, P.: Active extension in Val d'Agri area, southern Apennines, Italy: Implications for the geometry of the seismogenic belt, Geophys. J. Int., 162, 591–609, https://doi.org/10.1111/j.1365-246X.2005.02597.x, 2005.
Mattei, M., Cifelli, F., and D'Agostino, N.: The evolution of the Calabrian Arc: Evidence from paleomagnetic and GPS observations, Earth Planet. Sc. Lett., 263, 259–274, https://doi.org/10.1016/j.epsl.2007.08.034, 2007.
Michetti, A. M., Ferreli, L., Serva, L., and Vittori, E.: Geological evidence for strong historical earthquakes in an “aseismic” region: The Pollino case (Southern Italy), J. Geodyn., 24, 67–86, https://doi.org/10.1016/S0264-3707(97)00018-5, 1997.
Michetti, A. M., Ferreli, L., Esposito, E., Porfido, S., Blumetti, A. M., Vittori, E., Serva, L., and Roberts, G. P.: Ground Effects during the 9 September 1998, Mw=5.6 Lauria, Earthquake and the Seismic Potential of the seismic Pollino Region in Southern Italy, Seismol. Res. Lett., 71, 31–46, https://doi.org/10.1785/gssrl.71.1.31, 2000.
Montone, P. and Mariucci, M. T.: The New Release of the Italian Contemporary Stress Map, Geophys. J. Int., 205, 1525–1531, https://doi.org/10.1093/gji/ggw100, 2016.
Mostardini, F. and Merlini, S.: Appennino centro meridionale – Sezioni geologiche e proposta di modello strutturale, Mem. Soc. Geol. Ital., 35, 177–202, 1986.
Napolitano, F., De Siena, L., Gervasi, A., Guerra, I., Scarpa, R., and La Rocca, M.: Scattering and absorption imaging of a highly fractured fluid-filled seismogenetic volume in a region of slow deformation, Geosci. Front., 11, 989–998, https://doi.org/10.1016/j.gsf.2019.09.014, 2020.
Napolitano, F., Galluzzo, D., Gervasi, A., Scarpa, R., and La Rocca, M.: Fault imaging at Mt Pollino (Italy) from relative location of microearthquakes, Geophys. J. Int., 224, 637–648, https://doi.org/10.1093/gji/ggaa407, 2021.
Nicholson, G., Plesch, A., Sorlion, C. C., Shaw, J. H., and Hauksson, E.: TheSCEC 3D community fault model (CFM-v5): an updated and expanded fault set of oblique crustal deformation and complex fault interaction for southern California, Eos Trans. Am. Geophys. Union, 95, 52, Abstract T31B-4584, 2014.
Nicholson, C., Plesch, A., Sorlien, C. C., Shaw, J. H., and Hauksson, E.: The SCEC community fault model version 5.0: an updated and expanded 3D fault set for southern California, 2015 pacific section AAPG joint meeting program, Oxnard, CA, vol. 77, 12–16 September 2015.
Novakova, L. and Pavlis, T. L.: Assessment of the precision of smart phones and tablets for measurement of planar orientations: A case study, J. Struct. Geol., 97, 93–103, https://doi.org/10.1016/j.jsg.2017.02.015, 2017.
Ogniben, L.: Schema introduttivo alla geologia del confine calabro-lucano, Mem. Soc. Geol. It, 8, 453–763, 1969.
Ogniben, L.: Schema geologico della Calabria in base ai dati odierni, Geologia Romana, 12, 243–585, 1973.
Orecchio, B., Presti, D., Totaro, C., Guerra, I., and Neri, G.: Imaging the velocity structure of the Calabrian Arc region (south Italy) through the integration of different seismological data, Boll. Geofis. Teor. Appl., 52, 625–638, 2011.
Pantosti, D. and Valensise, G.: Faulting mechanism and complexity of the November 23, 1980, Campania-Lucania earthquake, inferred from surface observation, J. Geophys. Res., 95, 15319–15341, https://doi.org/10.1029/JB095iB10p15319, 1990.
Pantosti, D. and Valensise, G.: Source geometry and long-term behavior of the 1980, Irpinia earthquake fault based on field geologic observations, Ann. Geofisc, 36, 41–49, https://doi.org/10.4401/ag-4299, 1993.
Papanikolaou, I. D. and Roberts, G. P.: Geometry, kinematics and deformation rates along the active normal fault system in the southern Apennines: implications for fault growth, J. Struct. Geol., 29, 166–188, https://doi.org/10.1016/j.jsg.2006.07.009, 2007.
Passarelli, L., Hainzl, S., Cesca, S., Meccaferri, F., Mucciarelli, M., Roessler, D., Corbi, F., Dahm, T., and Rivalta, E.: Aseismic transient driving the swarm-like seismic sequence in the Pollino range, Southern Italy, Geophys. J. Int., 201, 1553–1567, https://doi.org/10.1093/gji/ggv111, 2015.
Pastori, M., Margheriti, L., De Gori, P., Govoni, A., Lucente, F. P., Moretti, M., Marchetti, A., Di Giovambattista, R., Anselmi, M., De Luca, P., Nardi, A, Agostinetti, N. P., Latorre, D., Piccinini, D., Passarelli, L., and Chiarabba, C.: The 2011–2014 Pollino Seismic Swarm: Complex Fault Systems, Imaged by 1D Refined Location and Shear Wave Splitting Analysis at the Apennines–Calabrian Arc Boundary, Front. Earth Sci., 9, 618293, https://doi.org/10.3389/feart.2021.618293, 2021.
Patacca, E. and Scandone, P.: Geological interpretation of the CROP-04 seismic line (Southern Apennines, Italy), Boll. Soc. Geol. It., 7, 297–315, 2007.
Petroleum Experts (PetEx Ltd.): MOVE structural geology software, available at: https://www.petex.com/products/move-suite/, last access: 19 April 2021.
Plesch, A., Shaw, J. H., and Jordan, T. H.: Stochastic descriptions of basin velocity structure from analyses of sonic logs and the SCEC community velocity model (CVM-H), Presentation at 2014 SSA annual meeting, Palm Springs, CA, 6–10 September 2014.
Pondrelli, S., Salimbeni, S., Ekström, G., and Morelli, A.: The Italian CMT dataset from 1977 to the present, Phys. Earth Planet, 159, 286–303, https://doi.org/10.1016/j.pepi.2006.07.008, 2006.
Porreca, M., Minelli, G., Ercoli, M., Brobia, A., Mancinelli, P., Cruciani, F., Giorgetti, C., Carboni, F., Mirabella, F., Cavinato, G., Cannata, A., Pauselli, C., and Barchi, M. R.: Seismic reflection profiles and subsurface geology of the area interested by the 2016–2017 earthquake sequence (Central Italy), Tectonics, 37, 1116–1137, https://doi.org/10.1002/2017TC004915, 2018.
Porreca, M., Fabbrizzi, A., Azzaro, S., Pucci, S., Del Rio, L., Pierantoni, P. P., Giorgetti, C., Roberts, G., and Barchi, M. R.: 3D geological reconstruction of the M. Vettore seismogenic fault system (Central Apennines, Italy): Cross-cutting relationship with the M. Sibillini thrust, J. Struct. Geol., 131, 103938, https://doi.org/10.1016/j.jsg.2019.103938, 2020.
Presti, D., Troise, C., and De Natale, G.: Probabilistic location of seismic sequences in heterogeneous media, Bull. Seismol. Soc. Am., 94, 2239–2253, https://doi.org/10.1785/0120030160, 2004.
Presti, D., Orecchio, B., Falcone, G., and Neri, G.: Linear versus nonlinear earthquake location and seismogenic fault detection in the southern Tyrrhenian Sea. Italy, Geophys. J. Int. 172, 607–618, https://doi.org/10.1111/j.1365-246X.2007.03642.x, 2008.
Robustelli, G., Russo Ermolli, E., Petrosino, P., Jicha, B., Sardella, R., and Donato, P.: Tectonic and climatic control on geomorphological and sedimentary evolution of the Mercure basin, southern Apennines, Italy, Geomorphology 214, 423–435, https://doi.org/10.1016/j.geomorph.2014.02.026, 2014.
Ross, Z. E., Cochran, E. S., Trugman, D. T., and Smith, J. D.: 3D Fault Architecture Controls the Dynamism of Earthquake Swarms, Science, 368, 1357–1361, https://doi.org/10.1016/j.jsg.2019.103934, 2020.
Rovida, A., Locati, M., Camassi, R., Lolli, B., and Gasperini, P.: The Italian earthquake catalogue CPTI15, B. Earthq. Eng., 18, 2953–2984, https://doi.org/10.1007/s10518-020-00818-y, 2020.
Rovida, A., Locati, M., Camassi, R., Lolli, B., Gasperini, P., and Antonucci A.: Catalogo Parametrico dei Terremoti Italiani (CPTI15), versione 3.0, Istituto Nazionale di Geofisica e Vulcanologia (INGV), https://doi.org/10.13127/CPTI/CPTI15.3, 2021.
Sato, H., Hirata, H., Ito, T., Tsumura, N., and Ikawa, T.: Seismic reflection profiling across the seismogenic fault of the 1995 Kobe earthquake, southwestern Japan, Tectonophysics, 286, 19–30, https://doi.org/10.1016/S0040-1951(97)00252-7, 1998.
SCEC: https://www.scec.org/research/cfm, last access: 19 April 2021.
Schiattarella, M., Torrente, M., and Russo, F.: Analisi strutturale ed osservazioni morfotettoniche nel bacino del Mercure (Confine calabro-lucano), Il Quaternario, 7, 613–626, 1994.
Scognamiglio, L., Tinti, E., and Quintiliani, M.: Time Domain Moment Tensor (TDMT), Istituto Nazionale di Geofisica e Vulcanologia (INGV) [data set], https://doi.org/10.13127/TDMT, 2006.
Servizio Geologico d'Italia: 220 Verbicaro sheet of the Carta Geologica D'Italia, 1, 100 000 Scale, Rome, 1970.
Sgambato, C., Walker, J. P. F., and Roberts, G. P.: Uncertainty in strain-rate from field measurements of the geometry, rates and kinematics of active normal faults: implications for seismic hazard assessment, J. Struct. Geol., 131, 103934, https://doi.org/10.1016/j.jsg.2019.103934, 2020.
Sketsiou, P., De Siena, L., Gabrielli, S., and Napolitano, F.: 3-D attenuation image of fluid storage and tectonic interactions across the Pollino fault network, Geophys. J. Int., 226, 536–547, https://doi.org/10.1093/gji/ggab109, 2021.
Sperner, B., Müller, B., Heidbach, O., Delvaux, D., Reinecker, J., and Fuchs, K.: Tectonic stress in the Earth's crust: advances in the World Stress Map project, in: New Insights into Structural Interpretation and Modelling, edited by: Nieuwland, D. A., J. Geol. Soc. London Spec. Publ., 212, 101–116, https://doi.org/10.1144/GSL.SP.2003.212.01.07, 2003.
Spina, V., Galli, P., Tondi, E., and Mazzoli, S.: Fault propagation in a seismic gap area (northern Calabria, Italy): implications for seismic hazard, Tectonophysics, 476, 357–369, https://doi.org/10.1016/j.tecto.2009.02.001, 2009.
Stirling, M., Goded, T., Berryman, K., and Litchfield, N.: Selection of Earthquake Scaling Relationships for Seismic-Hazard Analysis, Bull. Geol. Soc. Am., 103, 2993–3011, https://doi.org/10.1785/0120130052, 2013.
Tangari, A. C., Scarciglia, F., Piluso, E., Marinangeli, L., and Pompilio, L.: Role of weathering of pillow basalt, pyroclastic input and geomorphic processes on the genesis of the Monte Cerviero upland soils (Calabria, Italy), Catena, 171, 299–315, ISSN 0341-8162, https://doi.org/10.1016/j.catena.2018.07.015, 2018.
Tarquini, S., Vinci, S., Favalli, M., Doumaz, F., Fornaciai, A., and Nannipieri, L.: Release of a 10-m-resolution DEM for the Italian territory: Comparison with global-coverage DEMs and anaglyph-mode exploration via the web, Comput. Geosci., 38, 168–170, https://doi.org/10.1016/j.cageo.2011.04.018, 2012.
Tertulliani, A. and Cucci, L.: New insights on the strongest historical earthquake in the Pollino region (southern Italy), Seismol. Res. Lett., 85, 743–751, https://doi.org/10.1785/0220130217, 2014.
Testa, A., Boncio, P., Di Donato, M., Mataloni, G., Brozzetti, F., and Cirillo, D.: Mapping the geology of the 2016 Central Italy earthquake fault (Mt. Vettore – Mt. Bove fault, Sibillini Mts.): geological details on the Cupi – Ussita and Mt. Bove – Mt. Porche segments and overall pattern of coseismic surface faulting, Geological Field Trips and Maps, Italian Geological Society and of the Geological Survey of Italy, 11, 1–13, https://doi.org/10.3301/GFT.2019.03, 2019.
Totaro, C., Presti, D., Billi, A., Gervasi, A., Orecchio, B., Guerra, I., and Neri, G.: The ongoing seismic sequence at the Pollino Mountains, Italy. Seismol. Res. Let., 84, 955–962, https://doi.org/10.1785/0220120194, 2013.
Totaro, C., Koulakov, I., Orecchio, B., and Presti, D.: Detailed crustal structure in the area of the southern Apennines–Calabrian Arc border from local earthquake tomography, J. Geodyn., 82, 87–97, https://doi.org/10.1016/j.jog.2014.07.004, 2014.
Totaro, C., Seeber, L., Waldhauser, F., Steckler, M., Gervasi, A., Guerra, I., Orecchio, B., and Presti, D.: An intense earthquake swarm in the southernmost Apennines: fault architecture from high-resolution hypocenters and focal mechanisms, Bull. Seismol. Soc. Am., 105, 1–6, https://doi.org/10.1785/0120150074, 2015.
Totaro, C., Orecchio, B., Presti, D., Scolaro, S., and Neri, G.: Seismogenic stress field estimation in the Calabrian Arc region (south Italy) from a Bayesian approach, Geophys. Res. Lett., 43, 8960–8969, https://doi.org/10.1002/2016GL070107, 2016.
Valoroso, L., Chiaraluce, L., Di Stefano, R., and Monachesi, G.: Mixed-Mode Slip Behavior of the Altotiberina Low-Angle Normal Fault System (Northern Apennines, Italy) through High-Resolution Earthquake Locations and Repeating Events, J. Geoph. Res.-Sol. Ea., 122, 10220–10240, https://doi.org/10.1002/2017JB014607, 2017.
Van Dijk, J. P., Bello, M., Brancaleoni, G. P., Cantarella, G., Costa, V., Frixa, A., Golfetto, F., Merlini, S., Riva, M., Toricelli, S., Toscano, C., and Zerilli, A.: A regional structural model for the northern sector of the Calabrian Arc (southern Italy), Tectonophysics, 324, 267–320, https://doi.org/10.1016/S0040-1951(00)00139-6, 2000.
Vezzani, L., Festa, A., and Ghisetti, F. C.: Geology and tectonic evolution of the Central-Southern Apennines, Italy, Special Paper of the Geological Society of America, 469, 1–58, https://doi.org/10.1130/SPE469, 2010.
Villani, F. and Pierdominici, S.: Late Quaternary tectonics of the Vallo di Diano basin (southern Apennines, Italy), Quat. Sci. Rev., 29, 3167–3183, https://doi.org/10.1016/j.quascirev.2010.07.003, 2010.
Waldhauser, F.: HypoDD: a Computer Program to Compute Double Difference Earthquake Locations, U.S. Geol. Surv, Menlo Park, California, 1–113, Open-File Report, https://doi.org/10.3133/ofr01113, 2001.
Waldhauser, F. and Ellsworth, W.: A Double-Difference Earthquake Location Algorithm: Method and Application to the Northern Hayward Fault, California, Bull. Seism. Soc. Am., 90, 1353–1368, https://doi.org/10.1785/0120000006, 2000.
Wells, D. L. and Coppersmith, K. J.: New empirical relationships among magnitude, rupture length, rupture width, rupture area, and surface displacement, Bull. Seismol. Soc. Am., 84, 974–1002, 1994.
Wesnousky, S. G.: Displacement and geometrical characteristics of earthquake surface ruptures: Issues and implications for seismic hazard analysis and the process of earthquake rupture, Bull. Seismol. Soc. Am., 98, 1609–1632, https://doi.org/10.1785/0120070111, 2008.
Westoby, M. J., Brasington, J., Glasser, N. F., Hambrey, M. J., and Reynolds, J. M.: “Structure-from-motion” photogrammetry: A low-cost, effective tool for geoscience applications, Geomorphology, 179, 300–314, https://doi.org/10.1016/j.geomorph.2012.08.021, 2012.