the Creative Commons Attribution 4.0 License.
the Creative Commons Attribution 4.0 License.
 | 31 Jan 2022
Two subduction-related heterogeneities beneath the Eastern Alps and the Bohemian Massif imaged by high-resolution P-wave tomography
Helena Žlebčíková
György Hetényi
Luděk Vecsey
Vladislav Babuška
We present high-resolution tomographic images of the upper mantle beneath the Eastern Alps and the adjacent Bohemian Massif (BM) in the north based on recordings from the AlpArray-EASI and AlpArray seismic networks. The tomography locates the Alpine high-velocity perturbations between the Periadriatic Lineament and the Northern Alpine Front. The northward-dipping lithosphere is imaged down to ∼ 200–250 km of depth, without signs of delamination. The small amount of crustal shortening compared to that in the Western Alps and the bimodal character of the positive perturbations with a separation beneath the Tauern Window indicate a dual source of the velocity heterogeneity, most probably formed by a mixture of a fragment of detached European plate and the Adriatic plate subductions. A detached high-velocity heterogeneity, sub-parallel to and distinct from the Eastern Alps heterogeneity, is imaged at ∼ 100–200 km beneath the southern part of the BM. We associate this anomaly with the western end of a SW–NE-striking heterogeneity beneath the south-eastern part of the BM, imaged in models of larger extent. The strike, parallel with the Moldanubian–Brunovistulian mantle–lithosphere boundary in the BM and with the westernmost part of the Carpathian front, leads us to consider potential scenarios relating the heterogeneity to (1) a remnant of the delaminated European plate, (2) a piece of continental-and-oceanic lithosphere mixture related to the building of the BM, particularly to the closure of the old Rheic ocean during the MD–BV collision, or (3) a lithospheric fragment going through to the NW between the Eastern Alps and Western Carpathians fronts in a preceding subduction phase. The study is dedicated to our outstanding and respected colleague Vladislav Babuška, who coined innovative views on the European lithosphere and died on 30 March 2021.
- Article
(14770 KB) - Full-text XML
-
Supplement
(10917 KB) - BibTeX
- EndNote


Teleseismic body-wave tomography represents a powerful tool to study regional velocity structure of the upper mantle and to image velocity anomalies, particularly those related to subducted plates in collision zones. The Alps have developed at a collision zone of the Eurasian and Adriatic plate since the Variscan orogeny (Fig. 1). The classical concept assumed that the European lithospheric slab subducted south-eastward–southward along the entire Alps (Laubscher, 1970; Mueller, 1982) without any segmentation. However, interactions of the European lithosphere with the translating and rotating Adriatic plate and several micro-plates involved in the collision, tearing, and retreat of the slabs resulted in the bent (arcuate) shape of the western Alpine mountain range on the surface and in the complicated geometry of the rigid lithosphere penetrating the ductile mantle.
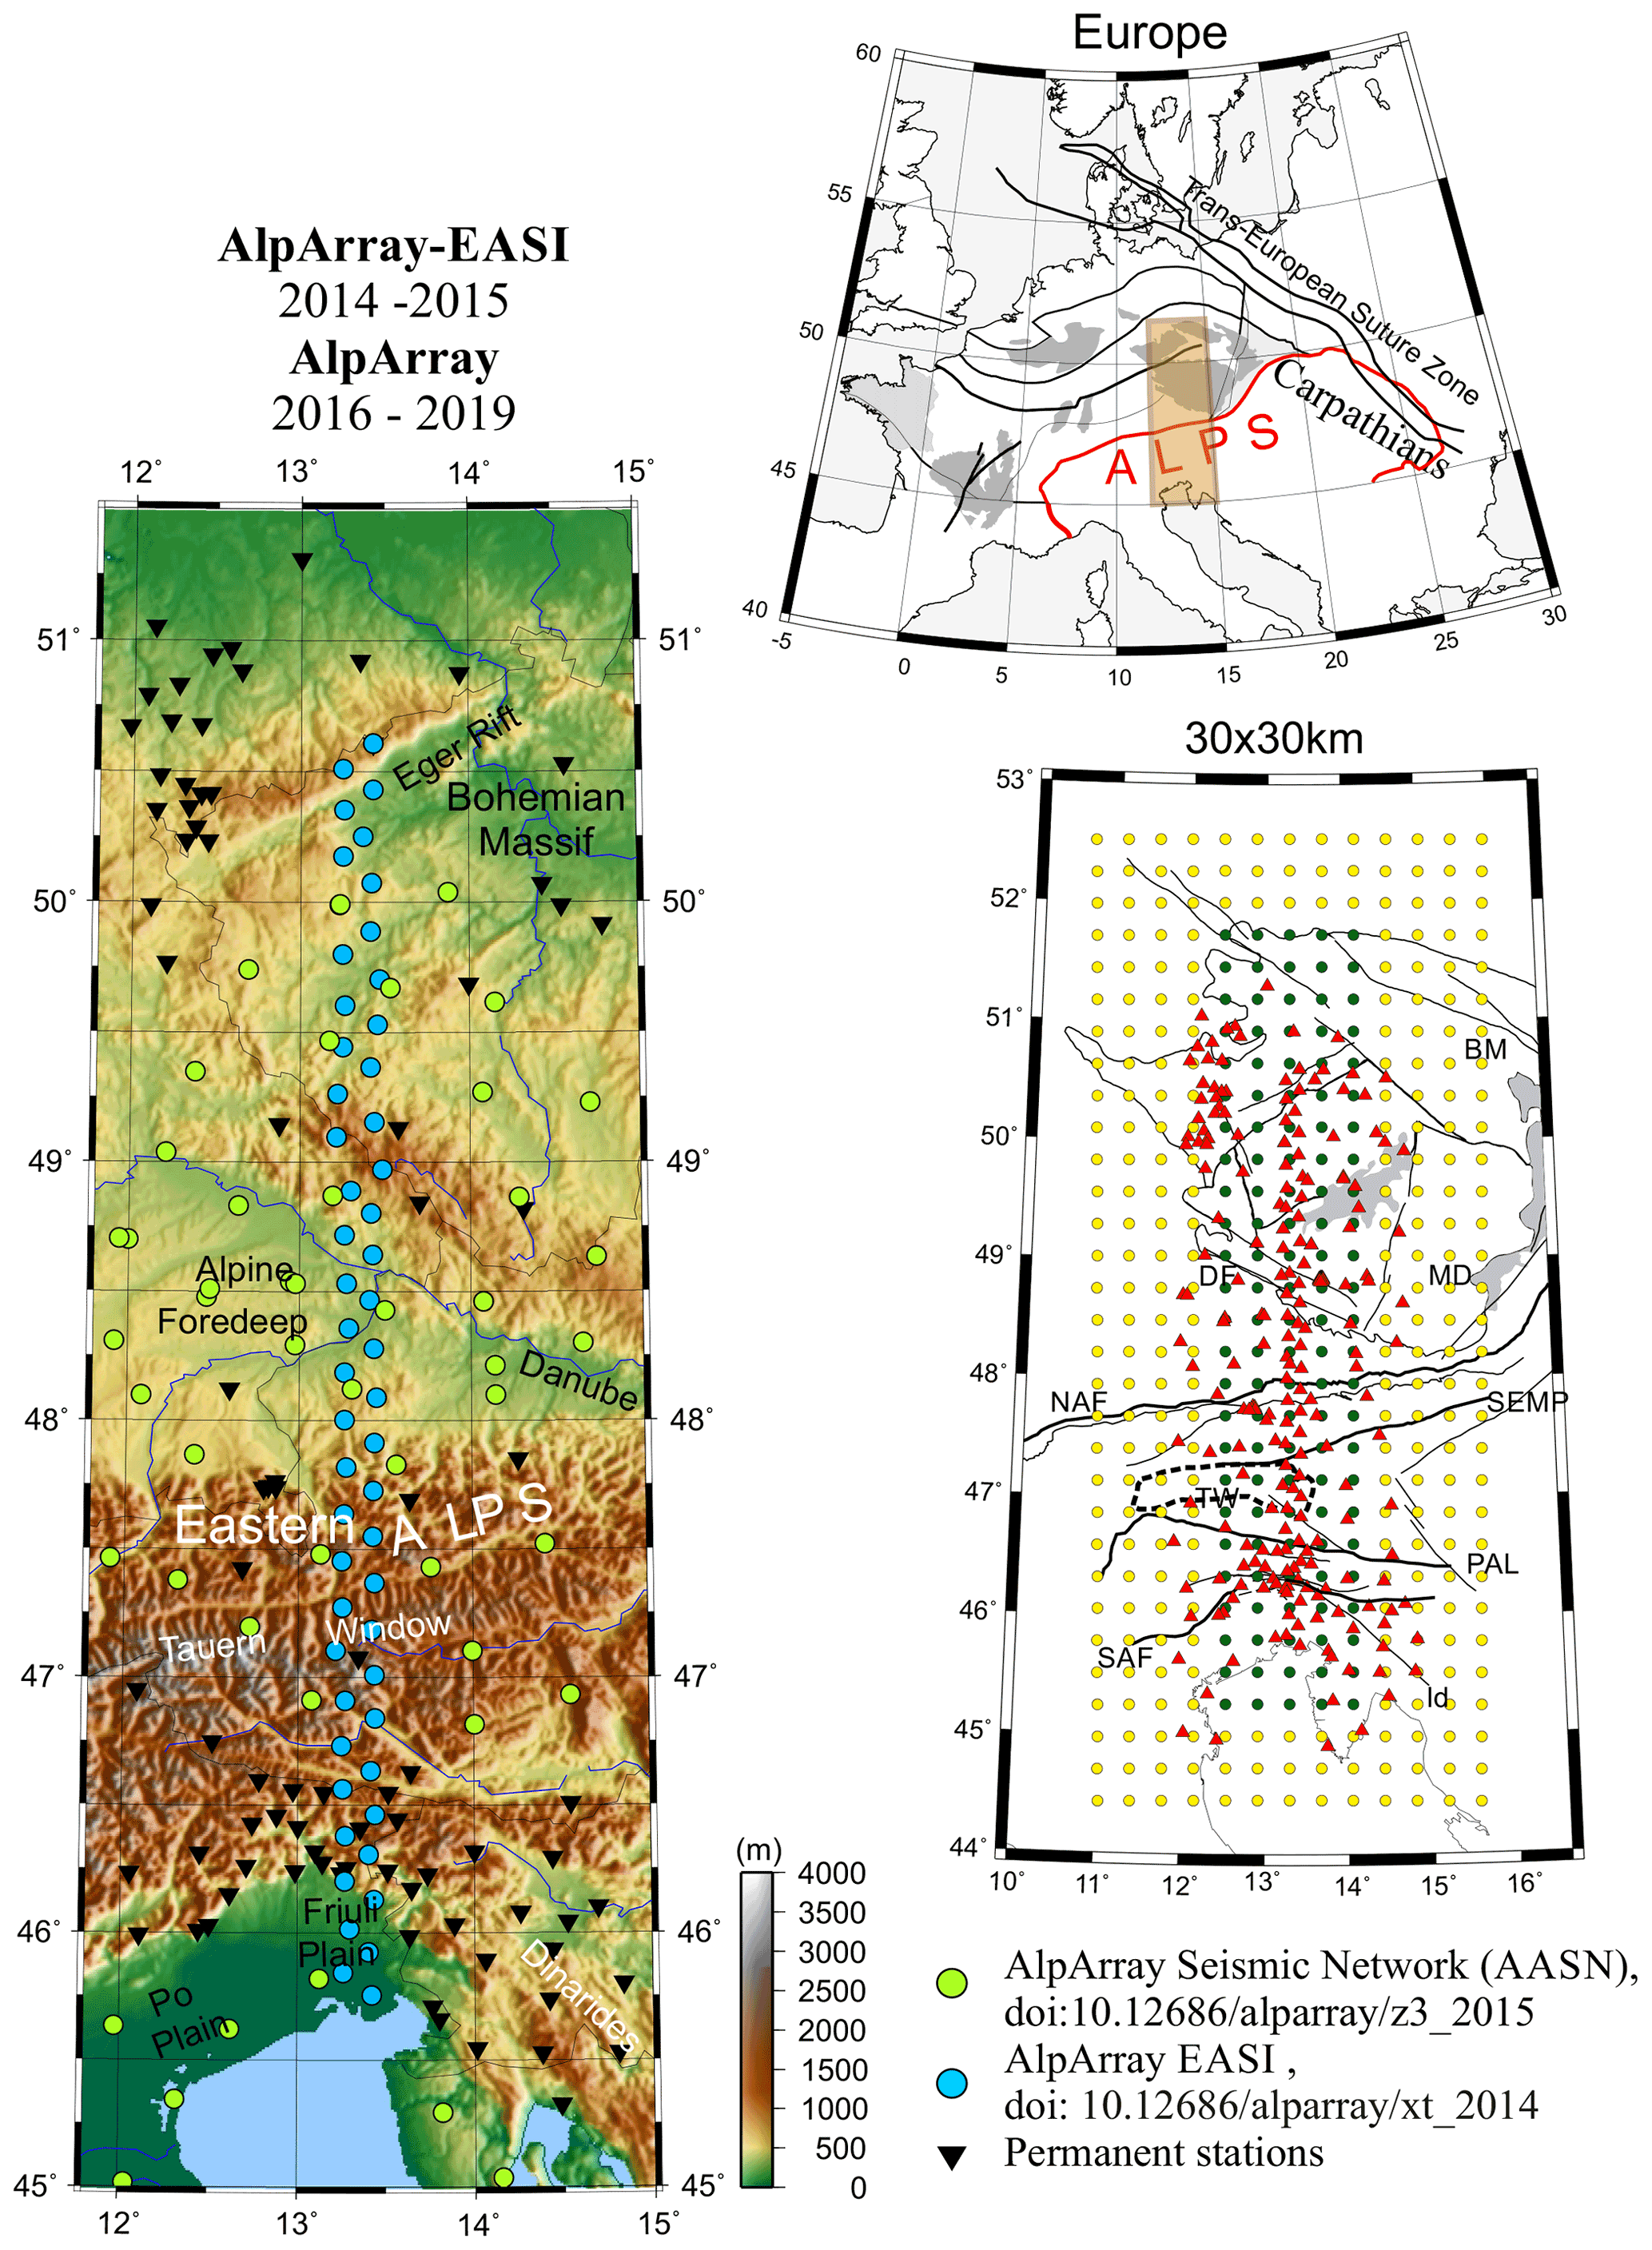
Figure 1Elevation map of the western part of the Bohemian Massif and the Eastern Alps, with the EASI and AASN seismological stations (a). The region is marked in light brown along with Variscan massifs (dark grey patches) in (b), also presenting the large-scale tectonic context. The grid for the modelling structure of the region (c) shows inverted and non-inverted nodes filled in dark green and in yellow, respectively. Labels of main tectonic faults and units: PAL – Periadriatic Lineament, NAF – Northern Alpine Front, SAF – Southern Alpine Front, SEMP – Salzach–Ennstal–Mariazell–Puchberg fault, TW – Tauern Window (dashed), DF – Danube fault, Id – Idria fault, MD – Moldanubian part of the Bohemian Massif (BM).
Early tomographic models of Europe (Aki et al., 1977; Spakman, 1990) have been replaced with more advanced models of segmented Alpine slab during the last decades (Wortel and Spakman, 2000; Kissling et al., 2006; Malusa et al., 2021, for reviews). For the first time, Babuška et al. (1990) imaged two segments of Alpine slab, one dipping SE–S beneath the Western Alps and another dipping N beneath the Eastern Alps, with a gap between them. The density of stations and teleseismic rays enabled resolving the high-velocity heterogeneities only on a 1.5∘ × 1.5∘ grid, but the bent shape of the south-eastward-dipping subduction of the European plate in the Western Alps and steep northward-dipping lithosphere beneath the Eastern Alps, with a gap between the two Alpine slabs, were evident. More recent tomographic studies from data recorded in regional passive seismic experiments with densely spaced stations resolved the Alpine subductions at finer grids and confirmed the suggested change in polarity between the distinct western and eastern Alpine lower lithosphere roots (Lippitsch et al., 2003; Mitterbauer et al., 2011; Karousová et al., 2013; Zhao et al., 2016; Hua et al., 2017). Standard isotropic regional velocity tomography (e.g. Piromallo and Morelli, 2003; Koulakov et al., 2009) based on pre-AlpArray data (Hetényi et al., 2018a) imaged the south-eastward-dipping curved slab of the Eurasian lithosphere in the Western Alps and the northward-dipping plate beneath the Eastern Alps of similar sizes (geometry), though interpretations are different. Dando et al. (2011) interpret high-velocity heterogeneities at the bottom of their regional tomographic model of the upper mantle beneath the Alpine–Pannonian region (Lombardi et al., 2009; Hetényi et al., 2009) as a graveyard of relict downwelling of continental lithosphere.
While resolution of early tomography of the Alpine region allowed researchers to deal only with the large and most distinct heterogeneities in the upper mantle, accumulation of high-quality data from the dense AlpArray network motivated us to search finer images of the upper mantle and to search for answers on segmentation of the Alps, dip directions of the subductions, their relevance to the European or Adriatic plate, extent of slab delamination, and particularly to elucidate the smaller size heterogeneity beneath the Bohemian Massif north of the Eastern Alps subduction. We concentrate in this paper on imaging the Europe–Adria plate collision across a transect in the Eastern Alps (EASI), aiming at understanding orogen-forming processes, and present high-resolution tomographic images of the upper mantle beneath the Eastern Alps and the adjacent Bohemian Massif (BM) in the north. The upper mantle beneath the BM is slow in general (e.g. Piromallo and Morelli, 2003; Amaru, 2007; Koulakov et al., 2009; Fichtner and Villaseñor, 2015). Based on data from the AlpArray-EASI (Hetényi et al., 2018b) and AlpArray Seismic (AASN) networks (AlpArray Seismic Network, 2014, 2015; Hetényi et al., 2018a), our tomography shows a high-velocity heterogeneity of small size at ∼ 100–200 km beneath the south-eastern part of the BM (referred to as HV-BM throughout the paper), sub-parallel to and distinct from the Eastern Alps high-velocity heterogeneity (labelled HV-EA). Kästle et al. (2018) identified in their surface-wave tomography approximately 1∘ to the north of the Periadriatic Fault a high-velocity heterogeneity, similar to HV-BM, but further to the west. Considering the NE continuations of the HV-BM as imaged in body-wave tomography of a larger extent (e.g. Karousová et al., 2013; Paffrath et al., 2021), the heterogeneity strikes with the SW–NE trend, in parallel with the boundary of the Moldanubian (MD) and Brunovistulian (BV) mantle–lithosphere in the BM and the westernmost part of the Carpathian front. Finding a secondary slab and/or thickened and cold lithosphere north of the Alps strengthens our motivation to determine its proper location and discuss hypotheses regarding its origin. Besides linking the shallow most probably dual-source heterogeneity beneath the Eastern Alps to subduction of the Adriatic plate, we also present and discuss in our paper three potential scenarios of the origin of the positive heterogeneity located beneath the southern Bohemian Massif (HV-BM).
High spatial density of stations involved in passive seismic experiments, high-quality recorded data, and dense ray coverage of the upper mantle under study are essential prerequisites for reliable high-resolution tomographic imaging. The AlpArray passive seismic experiment, realized in a broad European cooperation (Hetényi et al., 2018a), provided the necessary high-quality recordings for such a study. We collected recordings from stations of the AlpArray Seismic Network (AASN, https://doi.org/10.12686/alparray/z3_2015) and AlpArray-EASI network (https://doi.org/10.12686/alparray/xt_2014). All the AASN stations installed in a 200 km wide band (Fig. 1) along the densely spaced stations of the AlpArray-EASI complementary experiment (Hetényi et al., 2018b) were selected for this study. The N–S band of the EASI stations is oriented perpendicularly to the eastern Alpine chain (crest) and runs through the BM in the north to the Adriatic Sea in the south with a length of ∼ 540 km.
We have applied several procedures to check the data quality (Vecsey et al., 2017), particularly data completeness and correct timing, to eliminate periods with the uncorrected leap seconds or failures of clock synchronizations. In station metadata files we fixed, for example, wrong channel naming, station mislocation, and incorrect units for poles and zeros (mixing Hz and radians per second as units). We collected seismograms from 1920 earthquakes recorded at 240 temporary and permanent stations involved in the AlpArray experiments, from which we selected a subset of 201 top-quality earthquakes from epicentral distances greater than 30∘ with as uniform as possible distribution relative to the region of the Eastern Alps (Fig. S1). From this dataset we picked coherently teleseismic P-wave arrival times with a fully automatic picker, TimePicker 2017 (Vecsey, 2021), developed in the ObsPy/Python platform (Krischer et al., 2015). The TimePicker 2017 is based on two-step signal cross-correlations and allows us to measure absolute arrival times (Fig. S2a). Instead of a subjective selection of a reference trace, we cross-correlate all pairs of traces in the first step. For each trace a time shift related to maxima of the cross-correlation function is determined. Traces at individual stations are then shifted by a weighted average of the time shifts gained from cross-correlations with all other stations which recorded the event. The low-noise beam trace, created as a stack of the shifted traces at all stations, forms the reference trace for performing new beam-forming and arrival-time picking of an event in the second cross-correlation step.
In the second step, we correlate traces of all stations with the reference low-noise beam trace. The waveforms are aligned according to the times related to the maxima of the cross-correlation functions. The new low-noise beam is computed as a median of all aligned traces, and the P-wave onset on the beam is determined automatically (see Fig. S2). Then, arrival times at individual stations are derived from differences between times of corresponding extremes. Arrival times on the station signals are measured by three different methods. The final times of individual extremes (green P1 and P2 in Fig. S2a) and their error estimates are computed from the normal distribution, which approximates a mixture of normal distributions of partial picks (for details see Fig. S2a). We have applied the picker to the full dataset of 1920 teleseismic events recorded by the AASN. Figure S2b shows uncertainties of the measured P-wave arrivals as well as means and medians for both the complete dataset and for events selected for tomography (see below).
Each earthquake in the subset of selected 201 earthquakes was recorded at least by 50 stations of the array, i.e. at least 20 % of all the stations in the area. In this dataset, 130 rays per event sampled the mantle on average. The conditions ensure sufficient stability of the reference level in computing the relative travel-time residuals. The north–south elongated shape of the region oriented across the Alpine structures and perpendicular to the strike of the presumed subduction does not guarantee the same resolution along and across the strike. To eliminate mapping effects of heterogeneities alongside the model into its internal part and to enhance the resolution in the direction of the subductions, we selected additional rays coming from the northern and southern 60∘ wide azimuth bins. Only rays propagating through the model within the two azimuthal fans (see Fig. S1b) have been included in the final tomographic inversions, tested, discussed, and interpreted further. These data come from 244 earthquakes, each of them being recorded by 120 stations on average, i.e. by 50 % of stations in the region. Figure S5 demonstrates that potential bias coming from heterogeneities west and east of the N–S-oriented elongated array is weak and that the events from the 60∘ cones better illuminate the Bohemian Massif (BM)–Eastern Alps (EA) structures.
Teleseismic data cannot resolve velocities in the crust itself due to their sub-vertical propagation at shallow depths. To avoid mapping effects from the crust into the velocity perturbations in the upper mantle (e.g. Karousová et al., 2012), one has to introduce crustal corrections. Unfortunately, up to now, there has been no uniform, sufficiently detailed model of the crust for Europe or for the AlpArray region. For our body-wave studies in Europe we have collected accessible information on the crust for each station from different sources: from Karousová et al. (2012, and references therein) for the BM mostly based on results of controlled source seismics; from e.g. Di Stefano et al. (2011), Hua et al. (2017), and Tesauro et al. (2008) for areas south of the BM; and from Hetényi et al. (2018b) along the EASI transect. The crust is characterized beneath each station by the depth of Moho, the dip angle, and dip direction if the Moho is not flat, the Moho jump if there is any, velocity in the crust, thickness of sediments, and sediment velocity (Fig. S3). Sometimes there are significant differences between different models in their overlapping parts; therefore, we do not attempt to create any kind of “fine”-gridded model of the crust. Instead, we tune the corrections individually beneath each station and correct the travel-time residuals along each individually traced ray for the difference in the “real” crust and the crust of the reference model. Carefully pre-processed P-wave travel-time residuals calculated relative to the IASPEI'91 velocity model (Kennett and Engdahl, 1991), corrected for the crust, normalized by the average residual per event, and cleaned from outliers serve as input to the inversion in which we do not invert for the crust. With this approach we gathered a high-quality and uniform dataset of travel-time residuals for a proper tomographic inversion to resolve structures in our target region and below the crust. Of course, all crustal models remain idealized models and are not 100 % correct. Therefore, small “uncorrected” perturbations remain in each teleseismic tomography model of the upper mantle, which one needs to consider when interpreting the results.
We retrieved the velocity perturbations in the upper mantle with the isotropic mode of the coupled anisotropic–isotropic tomographic code AniTomo (Munzarová et al., 2018a) derived from the broadly used Telinv code (e.g. Weiland et al., 1995; Arlitt et al., 1999; Lippitsch et al., 2003; Sandoval et al., 2004; Shomali et al., 2006; Eken et al., 2007; Karousová et al., 2012, 2013; Plomerová et al., 2016; Silvennoinen et al., 2016; Chyba et al., 2017).
Weak anisotropy with hexagonal symmetry, with the high-velocity a axis or with the low-velocity b axis generally oriented in 3D, are assumed in the coupled anisotropic–isotropic tomographic code AniTomo. Velocity at each point can be expressed as
where is the isotropic component of anisotropic velocity, k is strength of anisotropy, and α is an angle between the symmetry axis and wave propagation direction (for details see Munzarová et al., 2018a). The linearized relation between a travel-time residual Δt and perturbations of the four anisotropic parameters (isotropic component of the anisotropic velocity), Δk (strength of anisotropy), Δλ, and Δθ (azimuth and inclination of the symmetry axis) at each grid node (indexed with i) attains the form
Due to the elongated shape of the region (Fig. 1), which is not suitable for coupled anisotropic–isotropic tomography and is out of the scope of this paper, we apply to the AlpArray-EASI data only the isotropic mode of the AniTomo code, in the first step. Then Eq. (2) reduces to the relation between the travel-time residual and the isotropic velocity perturbations:
The system of linear equations is then solved with the standard damped least-square method (e.g. Menke, 1984):
where m is a vector of model parameters at all nodes. Data vector d contains travel-time residuals Δt and matrix A stores the partial derivatives from Eq. (2) or (3). Errors of arrival-time measurements are considered in weighting matrix WD. Damping factor ε2 stabilizes the ill-posed problem. Horizontal smoothing of model parameters can be achieved via matrix WM. There is no vertical smoothing in the code. The inverse in Eq. (4) is approximated by truncated singular value decomposition. A 3D ray-tracing bending technique called Simplex (Steck and Prothero, 1991), in which ray paths are distorted by sinusoidal signals, is applied. Reliability of the model parameters for a given ray distribution and inversion setup can be assessed with resolution matrix R:
The area of about 400 000 km2, centred at 13.3∘ E, 48.5∘ N, is approximated by a 30 × 30 km cell size horizontally. The images are calculated down to 435 km of depth with 30 km spacing. To minimize creating false perturbations, we invert for the velocity perturbations only in the central cells, which are well-sampled by crisscrossing rays (Fig. S1), i.e. in nodes between depths of 60 and 420 km. The model covers the Eastern Alps and a core of the BM, an area of ca. 140 400 km2 in total. Variance reduction of the final model for the chosen damping parameter reaches 66 % (Fig. S4), and we kept the results after the second iteration (Fig. S4) as a further iteration has not resulted in any significant change in the velocity perturbations.
The distinct, high-velocity, northward-dipping, ∼ 140 km broad perturbations related to the eastern Alpine root, imaged in the upper ∼ 250 km of the mantle by previous tomography (Babuška et al., 1990; Karousová et al., 2013; Hetényi et al., 2018b), had a tendency to split when we exploited data from the EASI experiment and nearby permanent stations (Plomerová et al., 2018). However, “only” adding data from the AASN led to the clear visualization of two separate sub-parallel high-velocity heterogeneities beneath the broader eastern Alpine region, both dipping to the north and each about 80 km thick (Figs. 2 and 3), with a low-velocity separation zone of ∼ 80–100 km extent.
A clear decrease in amplitudes with depth dominates in the horizontal depth slices (Fig. 2a) through the EASI-AA velocity perturbation model. They exceed ± 1 % only exceptionally below 220 km of depth (two deepest layers shown in Fig. 2). Negative perturbations in the two uppermost mantle layers concentrate along the Eger Rift (ER) and can be related to the lithosphere thinning in this region relative to the MD part of the BM (e.g. Plomerová and Babuška, 2010; Plomerová et al., 2016). At greater depth, the lower velocities dominate in the sub-lithospheric mantle beneath the whole BM (e.g. Amaru, 2007; Fichtner and Villasenor, 2015). The distinct positive velocity perturbations related to the eastern Alpine root are located north of the PAL at ∼ 47∘ N and are distinct down to 225 km of depth. At greater depths both the positive and weak negative perturbations are arbitrarily mixed and do not indicate any continuous object. A relatively smaller-sized positive velocity heterogeneity, north of the strongest large one, lies beneath the southern BM at 100–200 km of depth.

Figure 2Depth slices through the new EASI-AA velocity perturbation model (a) along with depth contours of the 1.5 % perturbations in map view (b). The arrow marks the northward dip of the central and eastern part of the eastern Alpine heterogeneity. Labels of main tectonic faults and units: PAL – Periadriatic Lineament, NAF – Northern Alpine Front, SAF – Southern Alpine Front, SEMP – Salzach–Ennstal–Mariazell–Puchberg fault, TW – Tauern Window (dashed), DF – Danube fault, Id – Idria fault, MD – Moldanubian and TB – Teplá–Barrandian units of the Bohemian Massif (BM), ER – Eger Rift.
To have a better sense of both lateral and vertical changes in the perturbations and thus the dip of the high-velocity heterogeneities, we contour the 1.5 % positive perturbations between 90 and 210 km of depth (Fig. 2b). The contours clearly mark the northward dip of the EA slab, particularly in its eastern part (east of 13.3∘ E). A dip of the western rim of the slab is not clear from the contour curves only, as it appears to become steeper and thins significantly with depth. Similarly, it is difficult to judge a dip direction of the smaller-sized positive heterogeneity around ∼ 48.7∘ N (HV-BM) in this visualization.
To image the dip directions of the heterogeneities, we present five N–S vertical cross sections through the EASI-AA model (Fig. 3a–c), perpendicular to the strike of the mountain belt. The images of slab geometry suggest changes along-strike of the Alpine orogen, even at short distances, but one has to keep in mind changes in resolutions toward the margins of the model as well (see sections with synthetic tests). In general, the positive perturbations reach down to ∼ 220 km. All perturbations below ∼ 250 km of depth are very weak without any clustering or evident association with the stronger heterogeneities above this level. The positive perturbations beneath the BM, mapped only between ∼ 100 and ∼ 220 km depths (marked as III in Fig. 3), are slightly weaker in comparison with those beneath the EA (marked as I and II in Fig. 3) and disconnected from shallow parts. On the other hand, the strongest heterogeneity in the south does not exhibit clear signs of detachment, and thus through its dip and connection to crustal levels an association with a continuous subduction of the Adriatic plate could be possible. The limits of the numerically obtained well-resolved area, derived from resolution matrix, are reported in the figures with grey shading.
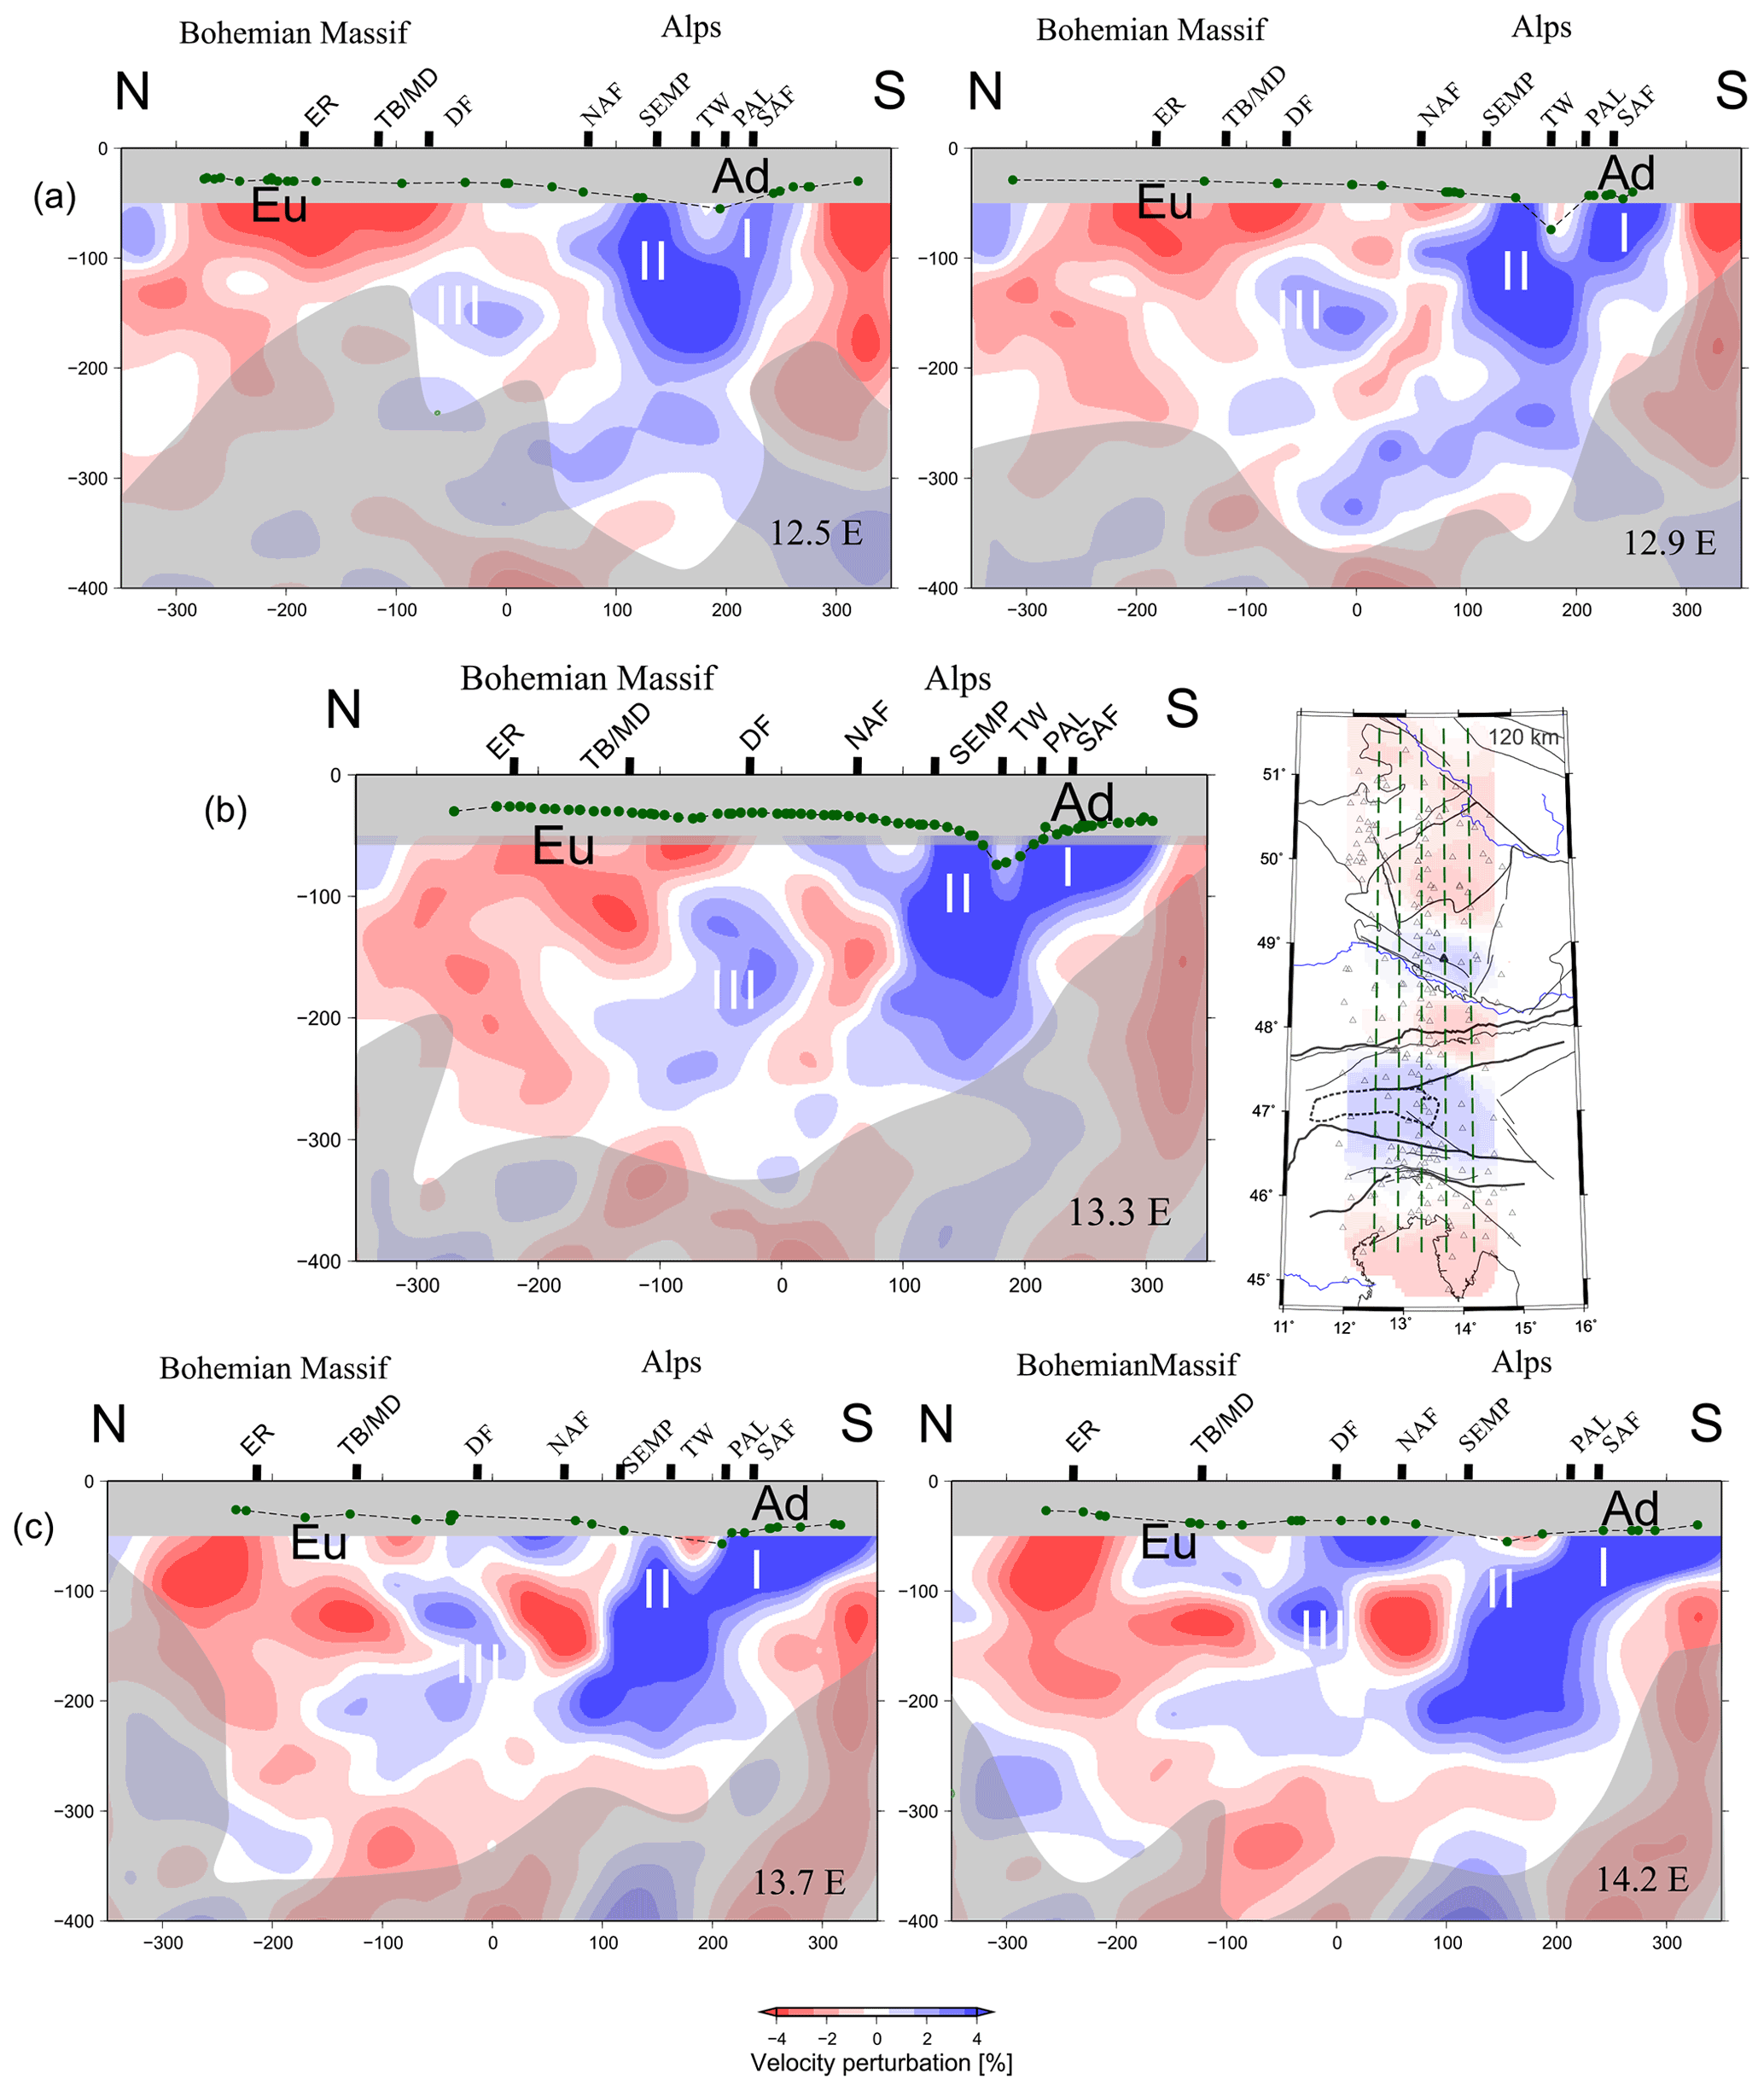
Figure 3Five north–south-oriented vertical cross sections through the EASI + AA velocity perturbation model: (a) east of the EASI, (b) along the EASI profile, and (c) west of the EASI. The location of the cross sections is marked in the map in the central part of the figure. The along-longitude cross sections run from 51.65 to 45.35∘ N. Fault abbreviations are as earlier: Eu – Europe, Ad – Adria. Shading of the less well-resolved region was set according to the resolution matrix, ray coverage of grid cells, and derivative weighted sums. The contour follows a value of 0.15 of diagonal elements of the resolution matrix. Green dots mark Moho depths in the model used for calculation of crustal corrections (see also Fig. S3). Travel times are not inverted for velocity perturbations in the crust (nodes at 30 km of depth).
The positive velocity perturbations seem to penetrate the sub-lithospheric mantle in the northward direction, in general, at an apparent dip of ∼ 45∘ or more. The general dip of these heterogeneities marked in the cross sections changes only slightly in direction toward the Central Alps. In the central cross sections, the HV-EA heterogeneity appears shorter than in the easternmost cross section, while the detached lithosphere fragment beneath the BM reaches slightly deeper. Cross sections through a 3D visualization of along-strike changes in the velocity perturbation in the EASI-AA model can be found in Fig. S9.
Looking at perturbations of the HV-EA heterogeneity at greater details, one can recognize its potential dual source. The positive heterogeneities I and II (Fig. 3) are separated just beneath the TW, where we modelled the European and Adriatic crust contact (Hetényi et al., 2018b). Dip directions of the heterogeneities slightly change – HV-EA-part II seems to immerse southward (Fig. 3a, b), whereas HV-EA-part I dips to the north. This allows us to argue for a mixing of a detached EU slab fragment and the shallow Adria slab connected at depth, as already suggested in Babuška et al. (1990) using a much coarser model inferred from P residuals. The length of the subduction imaged in our tomography beneath the Eastern Alps is similar to that in Lippitsch et al. (2003) and fits the upper limit of the amount of Adria–Europe Neogene convergence described in Le Breton et al. (2017).
We have performed several synthetic tests to evaluate the resolution of the tomography results, particularly its ability to detect the two separate sub-parallel slabs beneath the Eastern Alps and BM as well as their dip direction. The polarity reversal of the northward subduction beneath the E Alps relative to the south-eastward subduction in the Western Alps is of particular importance. The polarity flip is still questioned by some authors (e.g. Kind et al., 2021, this issue) in spite of long-lasting various inferences speaking for the change in subduction polarity beneath the Western and Eastern Alps with a gap between them (e.g. Babuška et al., 1990; Lippitsch et al., 2003; Zhao et al., 2016; Paffrath et al., 2021, this issue, and references therein).
Test 1 (Figs. 4, S6a–d) was designed to compare data-retrieved perturbations with those resulting from one or two narrow vertical synthetic heterogeneities, without imposing any polarity of the subductions. The model with one 5 % velocity heterogeneity does not reproduce the velocity perturbations retrieved from real data. The model with two steep heterogeneities mimics the perturbations much better in both the central part of the model and its margins. The perturbations retrieved from the synthetic vertical heterogeneities remain vertical for the real ray geometry or with a weak southward-dipping tendency in the westernmost profile, which contradicts the northward dip of real perturbations. Evidently, there is no northward smearing due to the ray geometry.
Having documented the existence of two separate heterogeneities, one beneath the southern BM (HV-BM) and the second beneath the Eastern Alps (HV-EA), we have tested their relative orientations. Test 2 (Figs. 4, S6a–d) assumes two heterogeneities as in Test 1, but with 27∘ southward dip. The resulting perturbations do not reproduce the northward dip of the real perturbations. On the other hand, Test 3 with the two heterogeneities dipping to the north at 27∘ mimics the dip of real perturbations very well. Test 4 with two bivergently dipping heterogeneities (towards each other) matches the geometry of the real perturbations only at shallow depths above ∼ 150 km, but the deeper part of the northern heterogeneity is completely missing.
The synthetic tests performed above corroborate the fact that the data from the AlpArray and EASI networks are able to image two separate northward-dipping sub-parallel slabs beneath the Eastern Alps and southern rim of the BM. The two slabs are separated from each other, and the northern one is not connected with the shallow parts of the lithosphere (above ∼ 100 km). The difference between the dip directions of the subductions beneath the Eastern Alps and the subductions beneath the Western and Central Alps is undoubtedly real, and it is not produced by potential smearing due to ray geometry.
Besides the specific tests described above we also performed standard checkerboard tests to assess the resolution capability of the network (Fig. S7). The checkerboard test confirms that positive and negative perturbations are retrieved well down to at least 240 km with a weak vertical smearing (Fig. S7a – horizontal slices). Also, the vertical cross section through the central part of the model (Fig. S7b) images the synthetic perturbations reliably.
The present shape of the Alpine mountain chain, characterized by the curved Western Alps and east–west-striking Central and Eastern Alps, reflects a multi-phase action of tectonic forces during the collision of the European and Adriatic plates, the AlCaPa micro-plate, and numerous lithosphere fragments in the regions, as well as the Piemont oceanic lithosphere. The processes are imprinted in the complex architecture of the broader Alpine region in both the crust (Handy et al., 2010; Rosenberg and Kissling, 2013; Schlunegger and Kissling, 2015) and the mantle (e.g. Kissling et al., 2006). Continuing debates on the exact setting of the Moho depth in the Alps and on the “gap” near the Tauern Window (Spada et al., 2013; Hetényi et al., 2018b; Brückl et al., 2010) document the complex structure of the Alpine orogen.
Though the upper mantle structure is less diverse in comparison with the crust, in general, ongoing studies of the Alpine upper mantle continue to reveal new and more detailed features in the geometry of the lower lithosphere, dip direction of the Alpine slabs, tears or detachments of the slabs, and interactions of the Alps with the Apennines and Dinarides. The current stage of knowledge from results of various disciplines – seismology, geology, petrology, tectonics, paleo-magnetism, geochemistry, and GPS studies, among others – reflects differences in the segmented slab responses to the acting forces. The complex structure of the fragmented Alpine slab(s) and the broader Europe–Adria collision zone is now visualized in tomography snapshots. The boundary between the central and eastern slab segments of the Alps is placed at the western end of the Tauern Window, i.e. at the northward prolongation of the Giudicarie–Brenner Fault, as already proposed by Handy et al. (2015) and other more recent authors to separate different crustal (lower crustal wedges) and mantle (slab gaps, slab dips) structures (e.g. Lippitsch et al., 2003; Schmid et al., 2004; Rosenberg et al., 2018). In recent studies, Paffrath et al. (2021) and Handy et al. (2021) document a change from a S-dipping slab to a N-dipping slab beneath the western part of the Eastern Alps (i.e. beneath the Tauern Window). This is in agreement with the previously proposed geometries of Babuška et al. (1990), Lippitsch et al. (2003), and Zhao et al. (2016). Mock et al. (2020) note a discordance between the slab geometry at depth and the boundary between the Eastern and Central Alps observed at the surface.
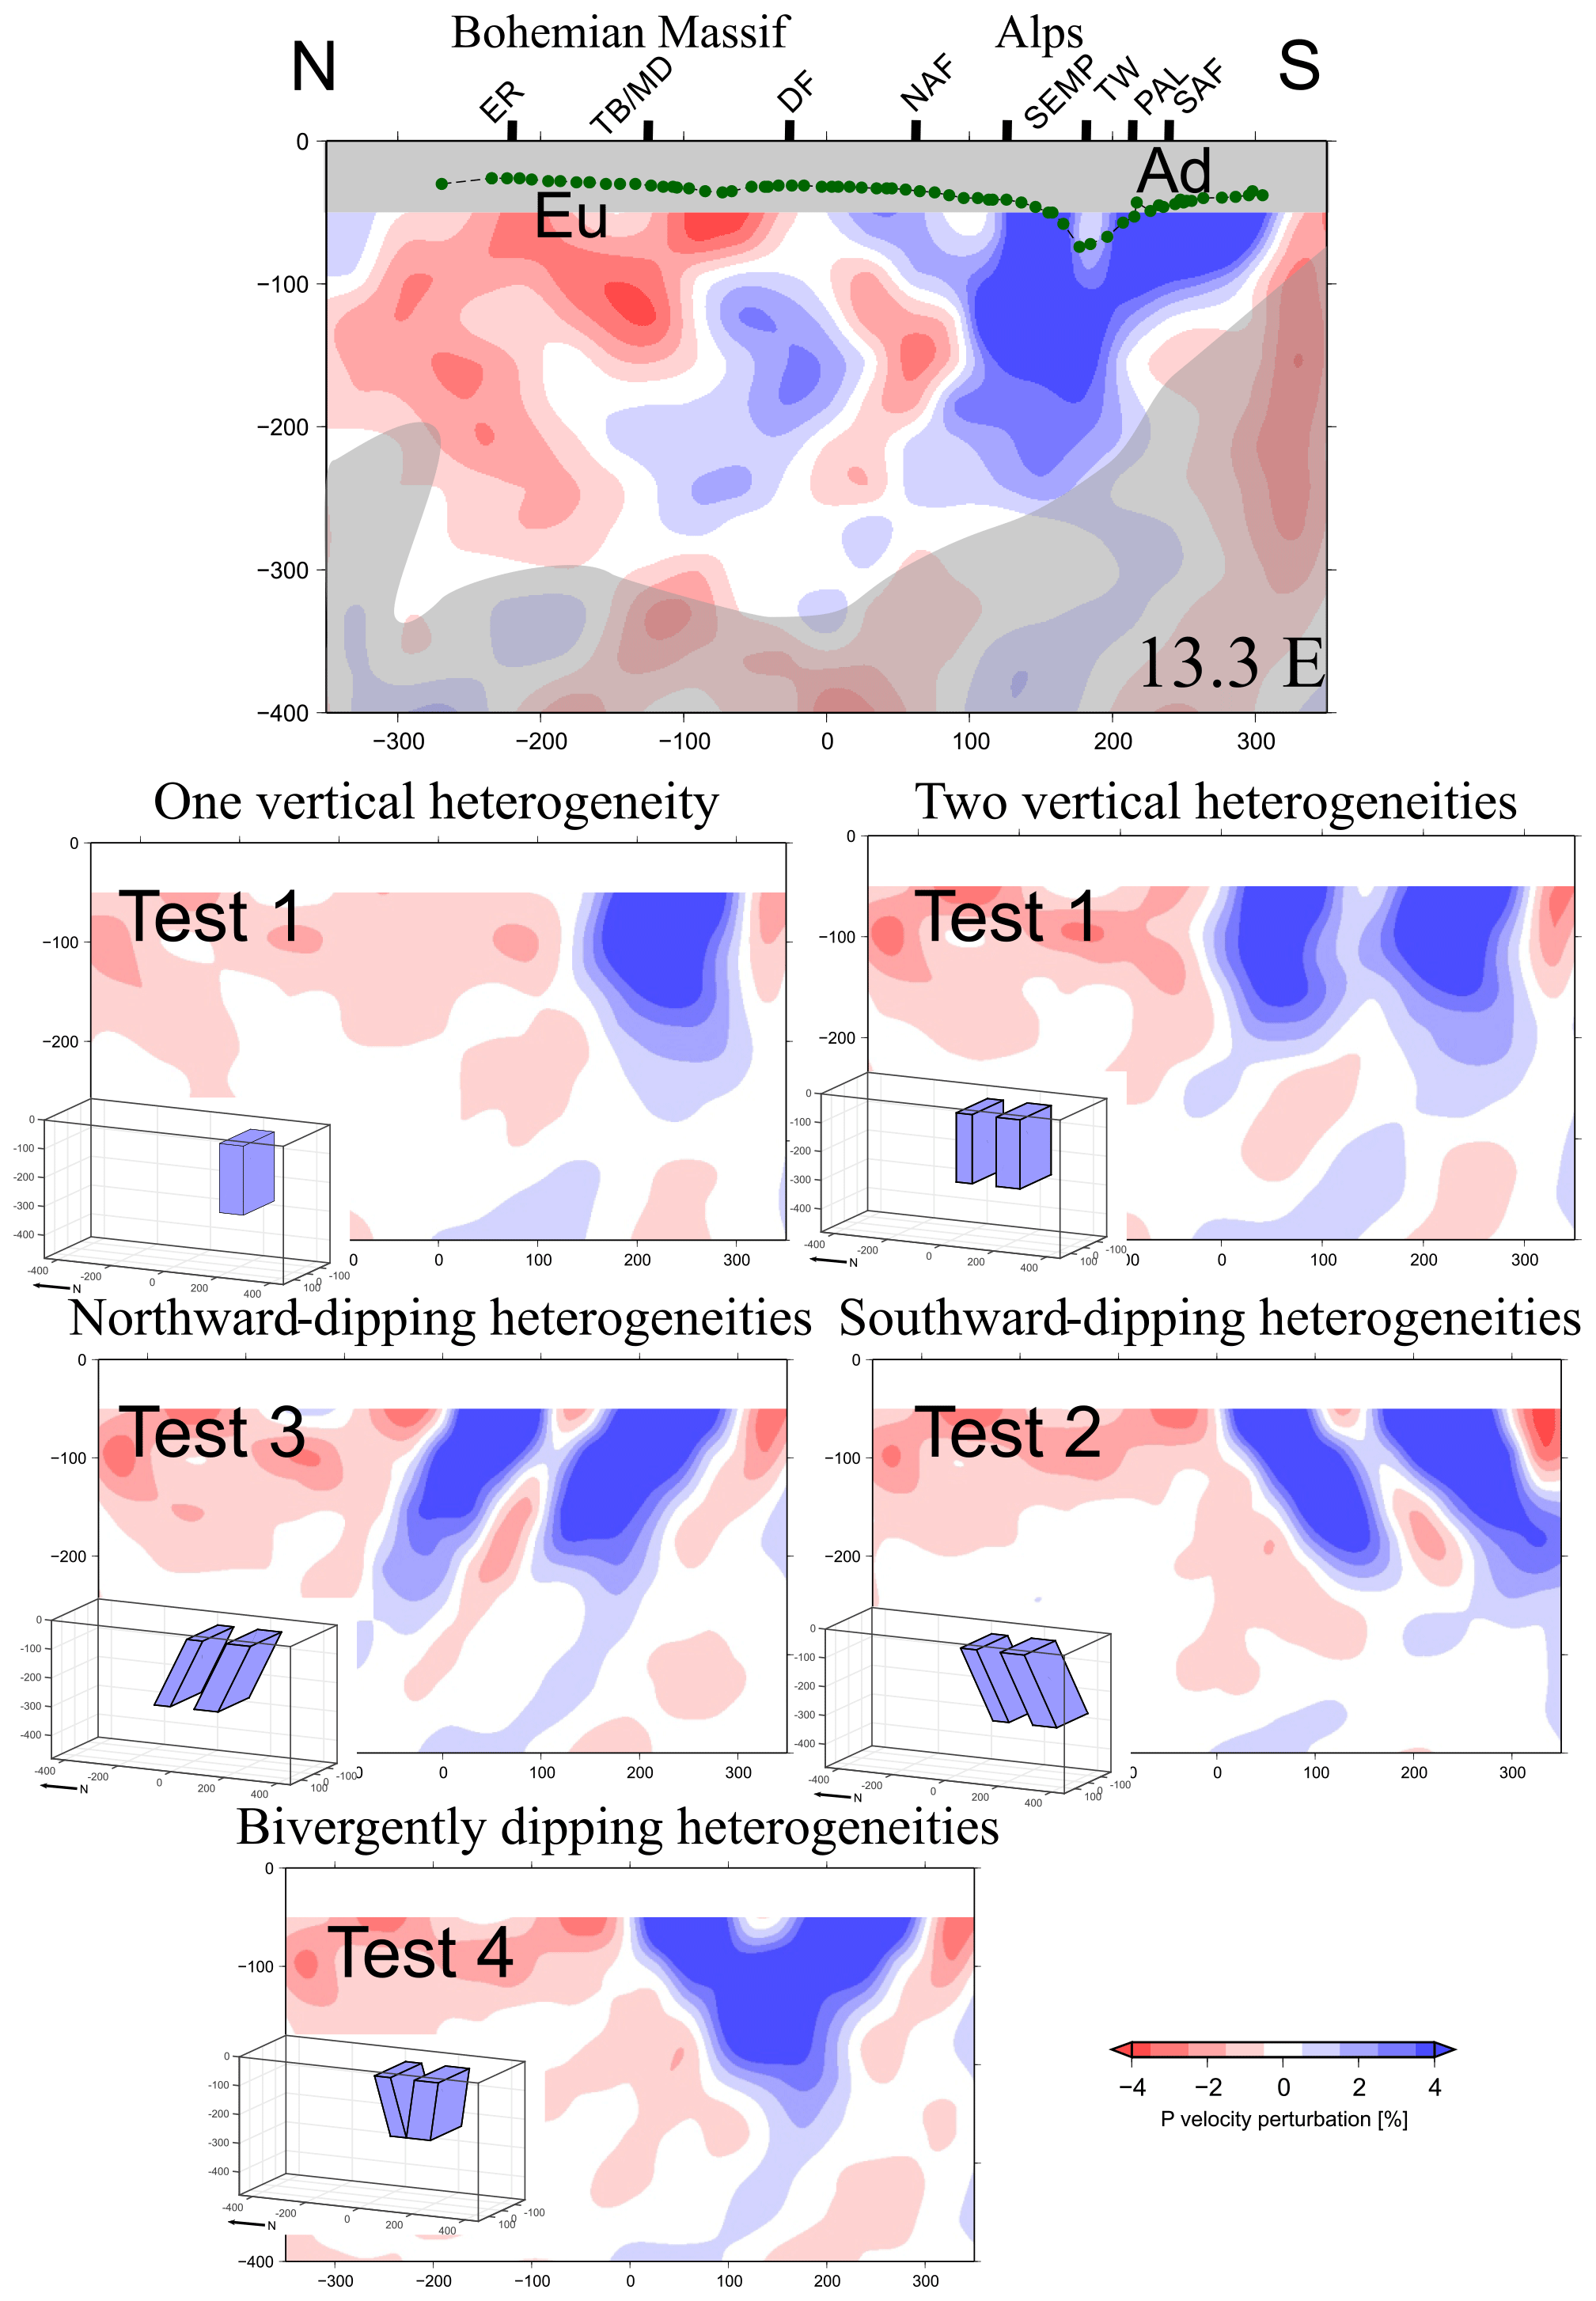
Figure 4Synthetic tests of tomography capability to resolve one or two sub-parallel heterogeneities (TEST1) and their dip directions (TEST2, TEST3, and TEST4) in the central cross section along the EASI. The similar north–south cross sections parallel to the central EASI profile on its east and west, corresponding to profiles in Fig. 3, are in Supplement Fig. S6a–d. The along-longitude cross sections run from 51.65 to 45.35∘ N. Fault labels are as in Fig. 2.
As early as 1990 Babuška et al. (1990) suggested segmentation of the Alpine slab into the western and eastern parts with opposite polarities, as well as a gap between them, in the tomography of central Europe, in which the authors inverted crust-corrected and source-side clustered travel-time residuals. This model (Fig. 5) has rather high variance reduction of 70 % but a resolution of only 1.5∘ × 1.5∘ due to station spacing available at that time. The Alpine slab segmentation has been confirmed in the upper mantle tomography of the Alpine orogen by Lippitsch et al. (2003). Their regional tomography with a finer lateral grid of 50 × 50 km has the highest resolution around 12∘ E, just between the two strongest high-velocity perturbations beneath the Central and Eastern Alps, where the passive seismic network TRANSALP was deployed. Later tomography of the upper mantle, which included the Eastern Alps with data from regional passive experiments (Dando et al., 2011; Mitterbauer et al., 2011; Karousová et al., 2013), also retrieved the northward-dipping high-velocity heterogeneity of similar geometries (Fig. 5) in 250 km of the upper mantle. The imaged triangular shape of the LAB model (e.g. Babuška and Plomerová, 1992) beneath the thickened lithosphere of the Eastern Alps, which is detached from that beneath the Western and Central Alps, led Babuška et al. (1990) to suggest three main phases in building the Eastern Alps lithosphere root: (1) NW translation of the Adria and its thrusting over the (subducting?) European plate in the Alps, (2) fragmentation of the northern Adria along a deep-seated fault (possibly the Giudicarie Fault or at least a spatially nearby structure), and (3) counter-clockwise rotation of the Adria resulting in a start of its subduction after a collision with the European plate in the Eastern Alps (e.g. Ustaszewski et al., 2008), potentially above a delaminated European lithosphere residing at greater depths (Paffrath et al., 2021; Handy et al., 2021). The complexity of this region is reflected in ambiguous views on the crust, which is interpreted as a triple junction of three crustal terranes (Brückl et al., 2010), although the deformation style between the Eastern Alps and the Pannonian Basin is usually considered diffuse on the surface. Instead, e.g. Ustaszewski et al. (2008) and Horváth et al. (2015) assume that the Pannonian Basin is underlain by gradually thinned European and Adriatic crust, which has been recently imaged by Kalmár et al. (2021).
The most recent tomography of the entire Alps and surrounding regions (Paffrath et al., 2021; Handy et al., 2021 – both this issue) exploits data from the AlpArray seismic network and AlpArray complementary experiments. The large-scale AlpArray tomography and the EASI-AA model along the EASI with similar gridding exhibit remarkable coincidence of perturbation patterns. In both tomography images, the HV-EA is located between the PAL in the south and the NAF in the north, but the large-scale tomography (Paffrath et al., 2021, this issue) images the Eastern Alps subduction below 150 km of depth with low-velocity perturbations (red) above it. At this depth, horizontal slices show characteristic separation of the Western, Central, and Eastern Alps, which becomes more distinct deeper in the mantle. Similarly, Zhao et al. (2016) show only weak positive perturbations at 100 km beneath the Eastern Alps, but this region lies in a relatively less well-resolved part of their model.
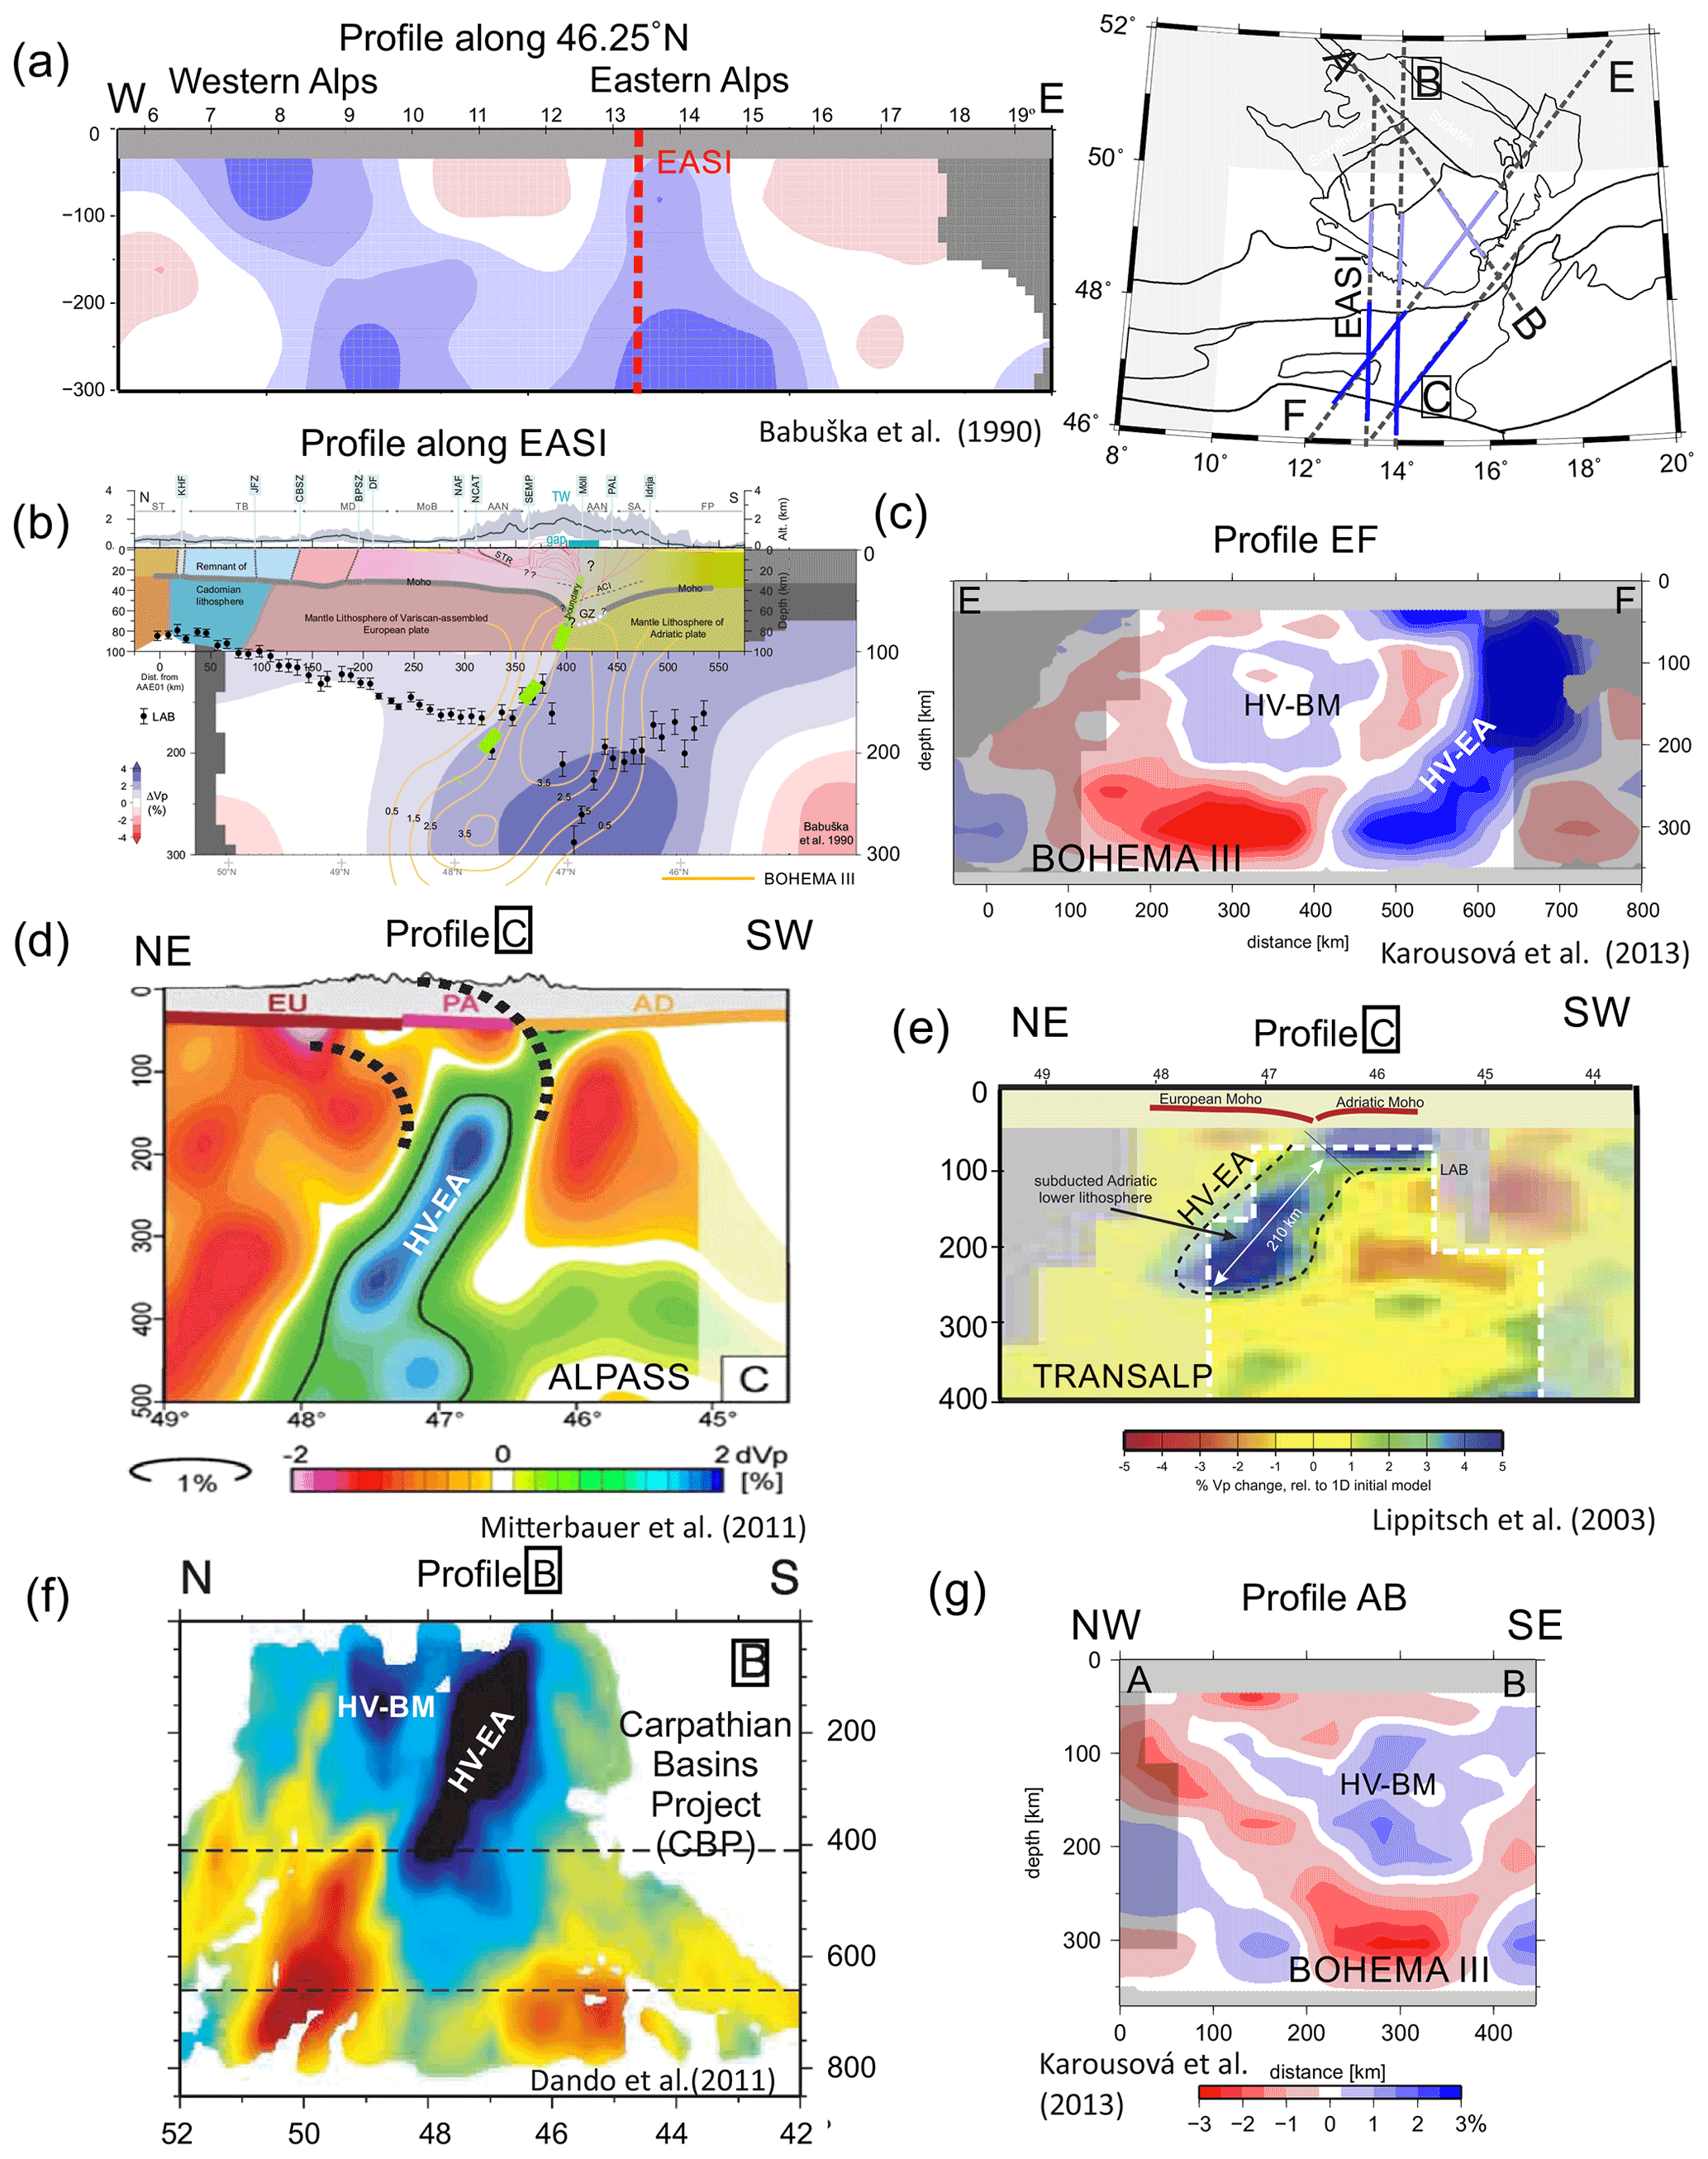
Figure 5Cross sections through various regional teleseismic P-wave tomography results showing segmentation of the Western and Eastern Alps and changes in the slab dip directions (a, b), the northward dip of the steep slab (HV-EA) beneath the Eastern Alps (b–f), and the small-sized HV-BM heterogeneity beneath the Bohemian Massif (c, f, g). Cross sections (a, b) from Babuška et al. (1990), with the crust in (b) from Hetényi et al. (2018b) and perturbation contours in (b) from Karousová et al et al. (2013). The profile locations in map view are in the upper right. The dark and light blue highlights refer to the location of the positive perturbations beneath the Eastern Alps and the Bohemian Massif (HV-EA and HV-BM), respectively. The full set of colour palettes can be found in the original publications.
A local discrepancy between models is present in the northern BM, where the large tomography returns positive perturbation, but the EASI-AA tomography maps low velocities there in accordance with other studies (e.g. Plomerová et al., 2016). However, the large-scale and EASI-AA tomography detects positive perturbations beneath the Moldanubian part of the southern BM. The perturbations continue further to the south-west in the EASI-AA in comparison with Paffrath (2021) tomography. Similar local high-velocity perturbations down to ∼ 250 km of depth, isolated from the EA heterogeneity, have also been detected in body-wave tomography by Dando et al. (2011) and Karousová et al. (2013) (Fig. 5) as well as in surface-wave tomography by Kästle et al. (2018, 2020), though the surface waves localize the similar high-velocity heterogeneity further south-west of the BM.
The north-oriented dip of the EA subduction, imaged in early tomography studies (Babuška et al., 1990; Aric et al., 1989), was questioned for a long time, until Lippitsch et al. (2003) clearly imaged the northward-dipping structures using TRANSALP data. Subsequent regional passive experiments provided body-wave data for tomography of the Eastern Alps and surrounding regions (namely in the Bohemian Massif and Pannonian Basin – BOHEMA, e.g. Karousová et al., 2013; Plomerová et al., 2016; ALPASS, e.g. Mitterbauer et al., 2011; and CBP, e.g. Dando et al., 2011, with passive experiments) and imaged the northward dip of the EA slab as well. Some of them agree in interpreting it to be of Adriatic plate origin (Karousová et al., 2013). However, Mitterbauer et al. (2011), and similarly in recent tomography based on the newest AlpArray data by Paffrath et al. (2021, this issue), the positive perturbations below 150 km are associated with a delaminated EU slab (see also Handy et al., 2021, this issue). Kästle et al. (2020) relate the HV-EA mainly with the European plate subductions as well and leave no role or only a minor role for the Adriatic subduction. The authors explain the northward-dipping subduction modelled beneath the Eastern Alps by imaging a combination of the short Adriatic and deep-delaminated, potentially overturned European slabs.
Synthetic tests from the EASI-AA dataset in our study proved that the EASI-AA model is capable imaging the two sub-parallel northward-dipping heterogeneities – the large and strong southern one beneath the Eastern Alps with connection to shallow depths and the weaker northern one beneath the southern BM that is apparently disconnected. To understand the positive perturbations beneath the southern BM, we compare it with results from the large-scale Paffrath et al. (2021) tomography and with the regional tomography of the BM (Karousová et al., 2013) of resolution similar to ours (Fig. 6). The strongest positive perturbations related to that heterogeneity overlap in the models, though they are of unrealistically large extent in the Paffrath et al. (2021, this issue) model. Paffrath et al. (2021) also show the strong positive perturbations beneath the north-western part of the BM (beneath the Eger Rift), where the lithosphere thins significantly (∼ 80 km). This is well-imaged by negative perturbations in the EASI-AA and in BOHEMA models (Karousová et al., 2013; Plomerova et al., 2016). Images of perturbations at 180 km of depth stress the importance of using data from stations in the northern part of the EASI array. Data from these stations capture the positive velocity perturbations much farther to the SW, beneath the southern rim of the BM, than the other two tomography studies. Cross sections through the BM regional tomography (see Fig. 5) locate the increased velocities within the low-velocity BM upper mantle (e.g. Amaru, 2007; Fichtner and Villasenor, 2015). The SW–NE elongated shape of the heterogeneity follows the boundary between the MD and BV mantle–lithosphere domains (Babuška and Plomerová, 2013).
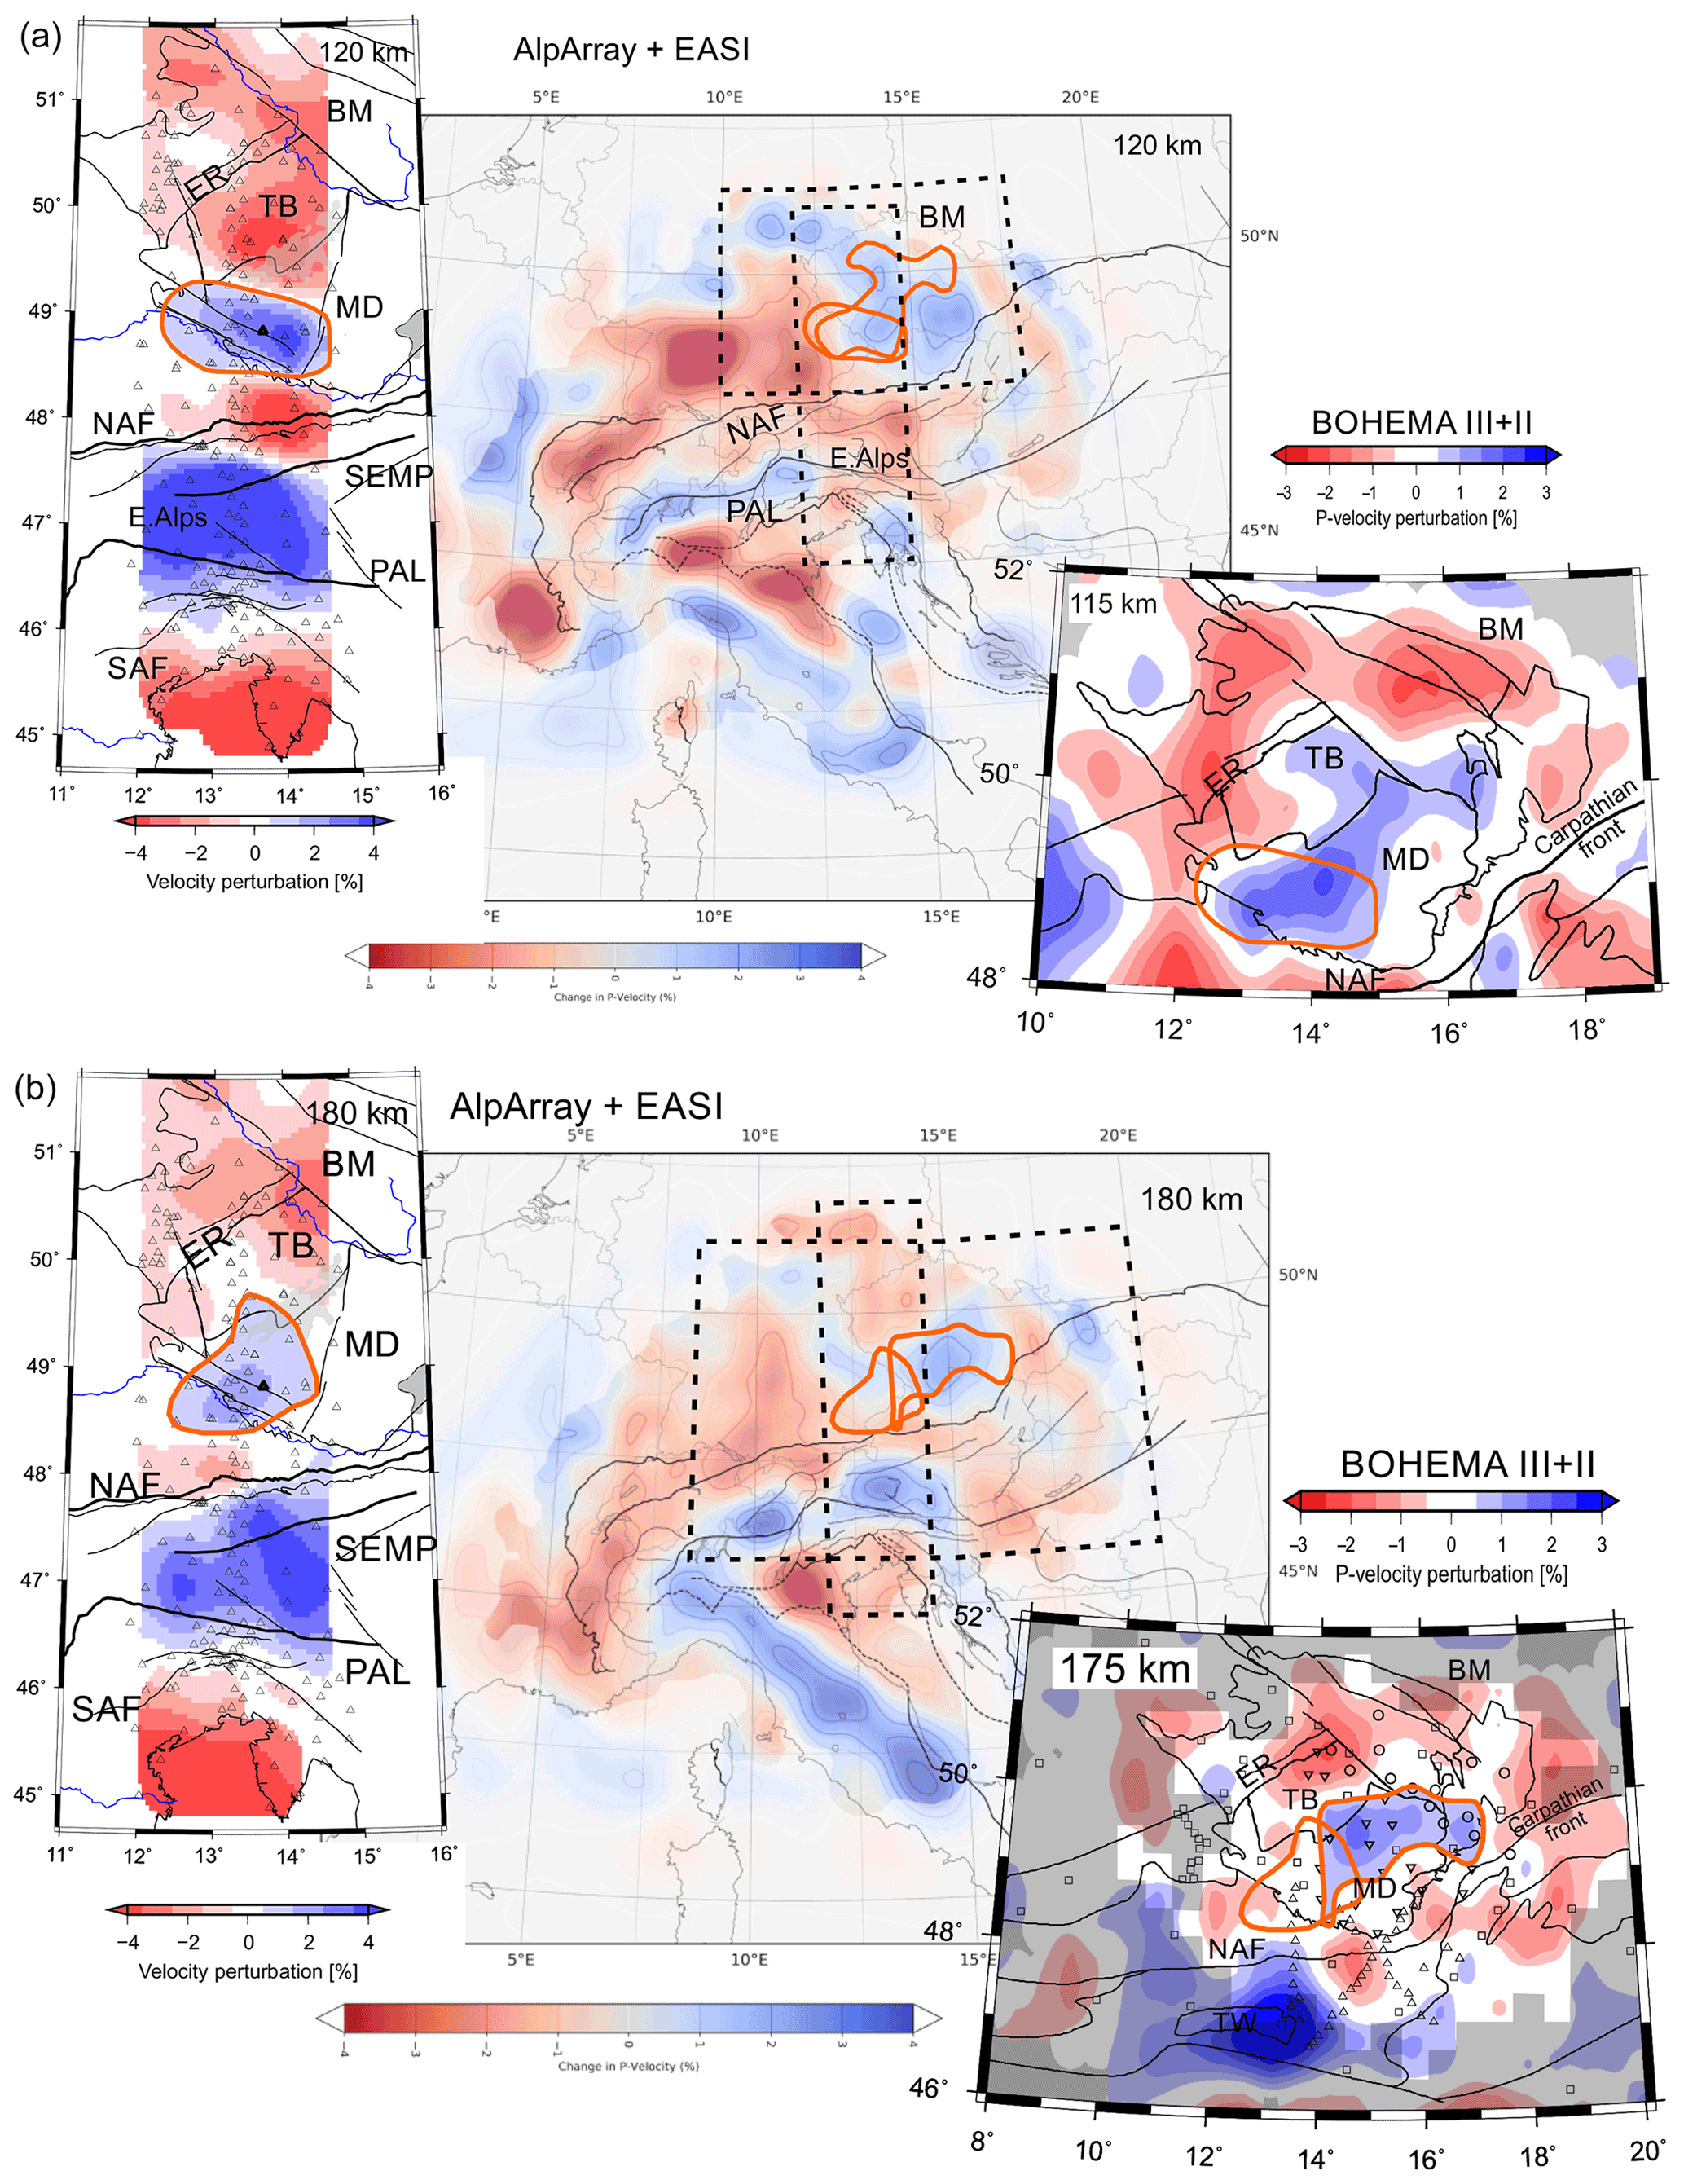
Figure 6Horizontal slices at 120 (a) and 180 km (b) depths through the velocity perturbation model EASI-AA (left) (this paper), the model by Karousová et al. (2013) (right), and the model by Paffrath et al. (2021, this issue) (centre), on which the HV-BM from the other two models is marked by orange contours. Labels are as in Fig. 2.
Different types of seismic waves propagate with different velocities and sample the mantle volume in different directions and wavelength, which affects the velocity–velocity perturbation images of the upper mantle and corresponding resolution. A cross section along 13.5∘ E through the MeRE2020 model, which is a shear-wave velocity perturbation model from Rayleigh phase velocities (El-Sharkawy et al., 2020), runs parallel to the EASI transect in our P-wave model. The authors relate positive perturbations eastward of the cross section at ∼ 45∘ N to the northernmost part of the Dinarides slab and image a short (only down to 150 km of depth) European slab, without any delamination. On the other hand, the body-wave tomography by Paffrath et al. (2021) sees the top of the high-velocity heterogeneity beneath the Eastern Alps at 150 km of depth. The heterogeneity extends down to ∼ 300 km of depth. The authors interpret it as the delaminated European plate lithosphere. There is an obvious contradiction between these two interpretations. To test whether a potential delamination can be detected in our EASI-AA tomography, we performed additional synthetic tests (Fig. S8). In each test the top of the steep 5 % high-velocity heterogeneity shallows from 150 to 60 km depths. Due to the leakage, which exists in each teleseismic P-wave tomography, one has to be careful and concentrate only on distinct features. Figure 8 demonstrates that the dark blue perturbations in the model with shallow heterogeneity reproduce the dark blue perturbations in the model from real data better than the model with heterogeneity below 150 km of depth. The tests demonstrate that slab detachment larger than the 30 km grid would be revealed in our EASI-AA model. Two northward-dipping slabs (Fig. 7), the northern small-sized delaminated one approximated with a 3 % velocity increase and the southern attached one with a 5 % velocity increase, mimic the velocity perturbations retrieved beneath the Bohemian Massif and beneath the Eastern Alps from real data well (Fig. 3). The leakage of the model perturbations of the HV-BM towards the surface is weak and acts against the negative perturbations imaged from real data. There is no surprise that a simple prism model cannot reproduce tiny details of the complex HV-EA heterogeneity.
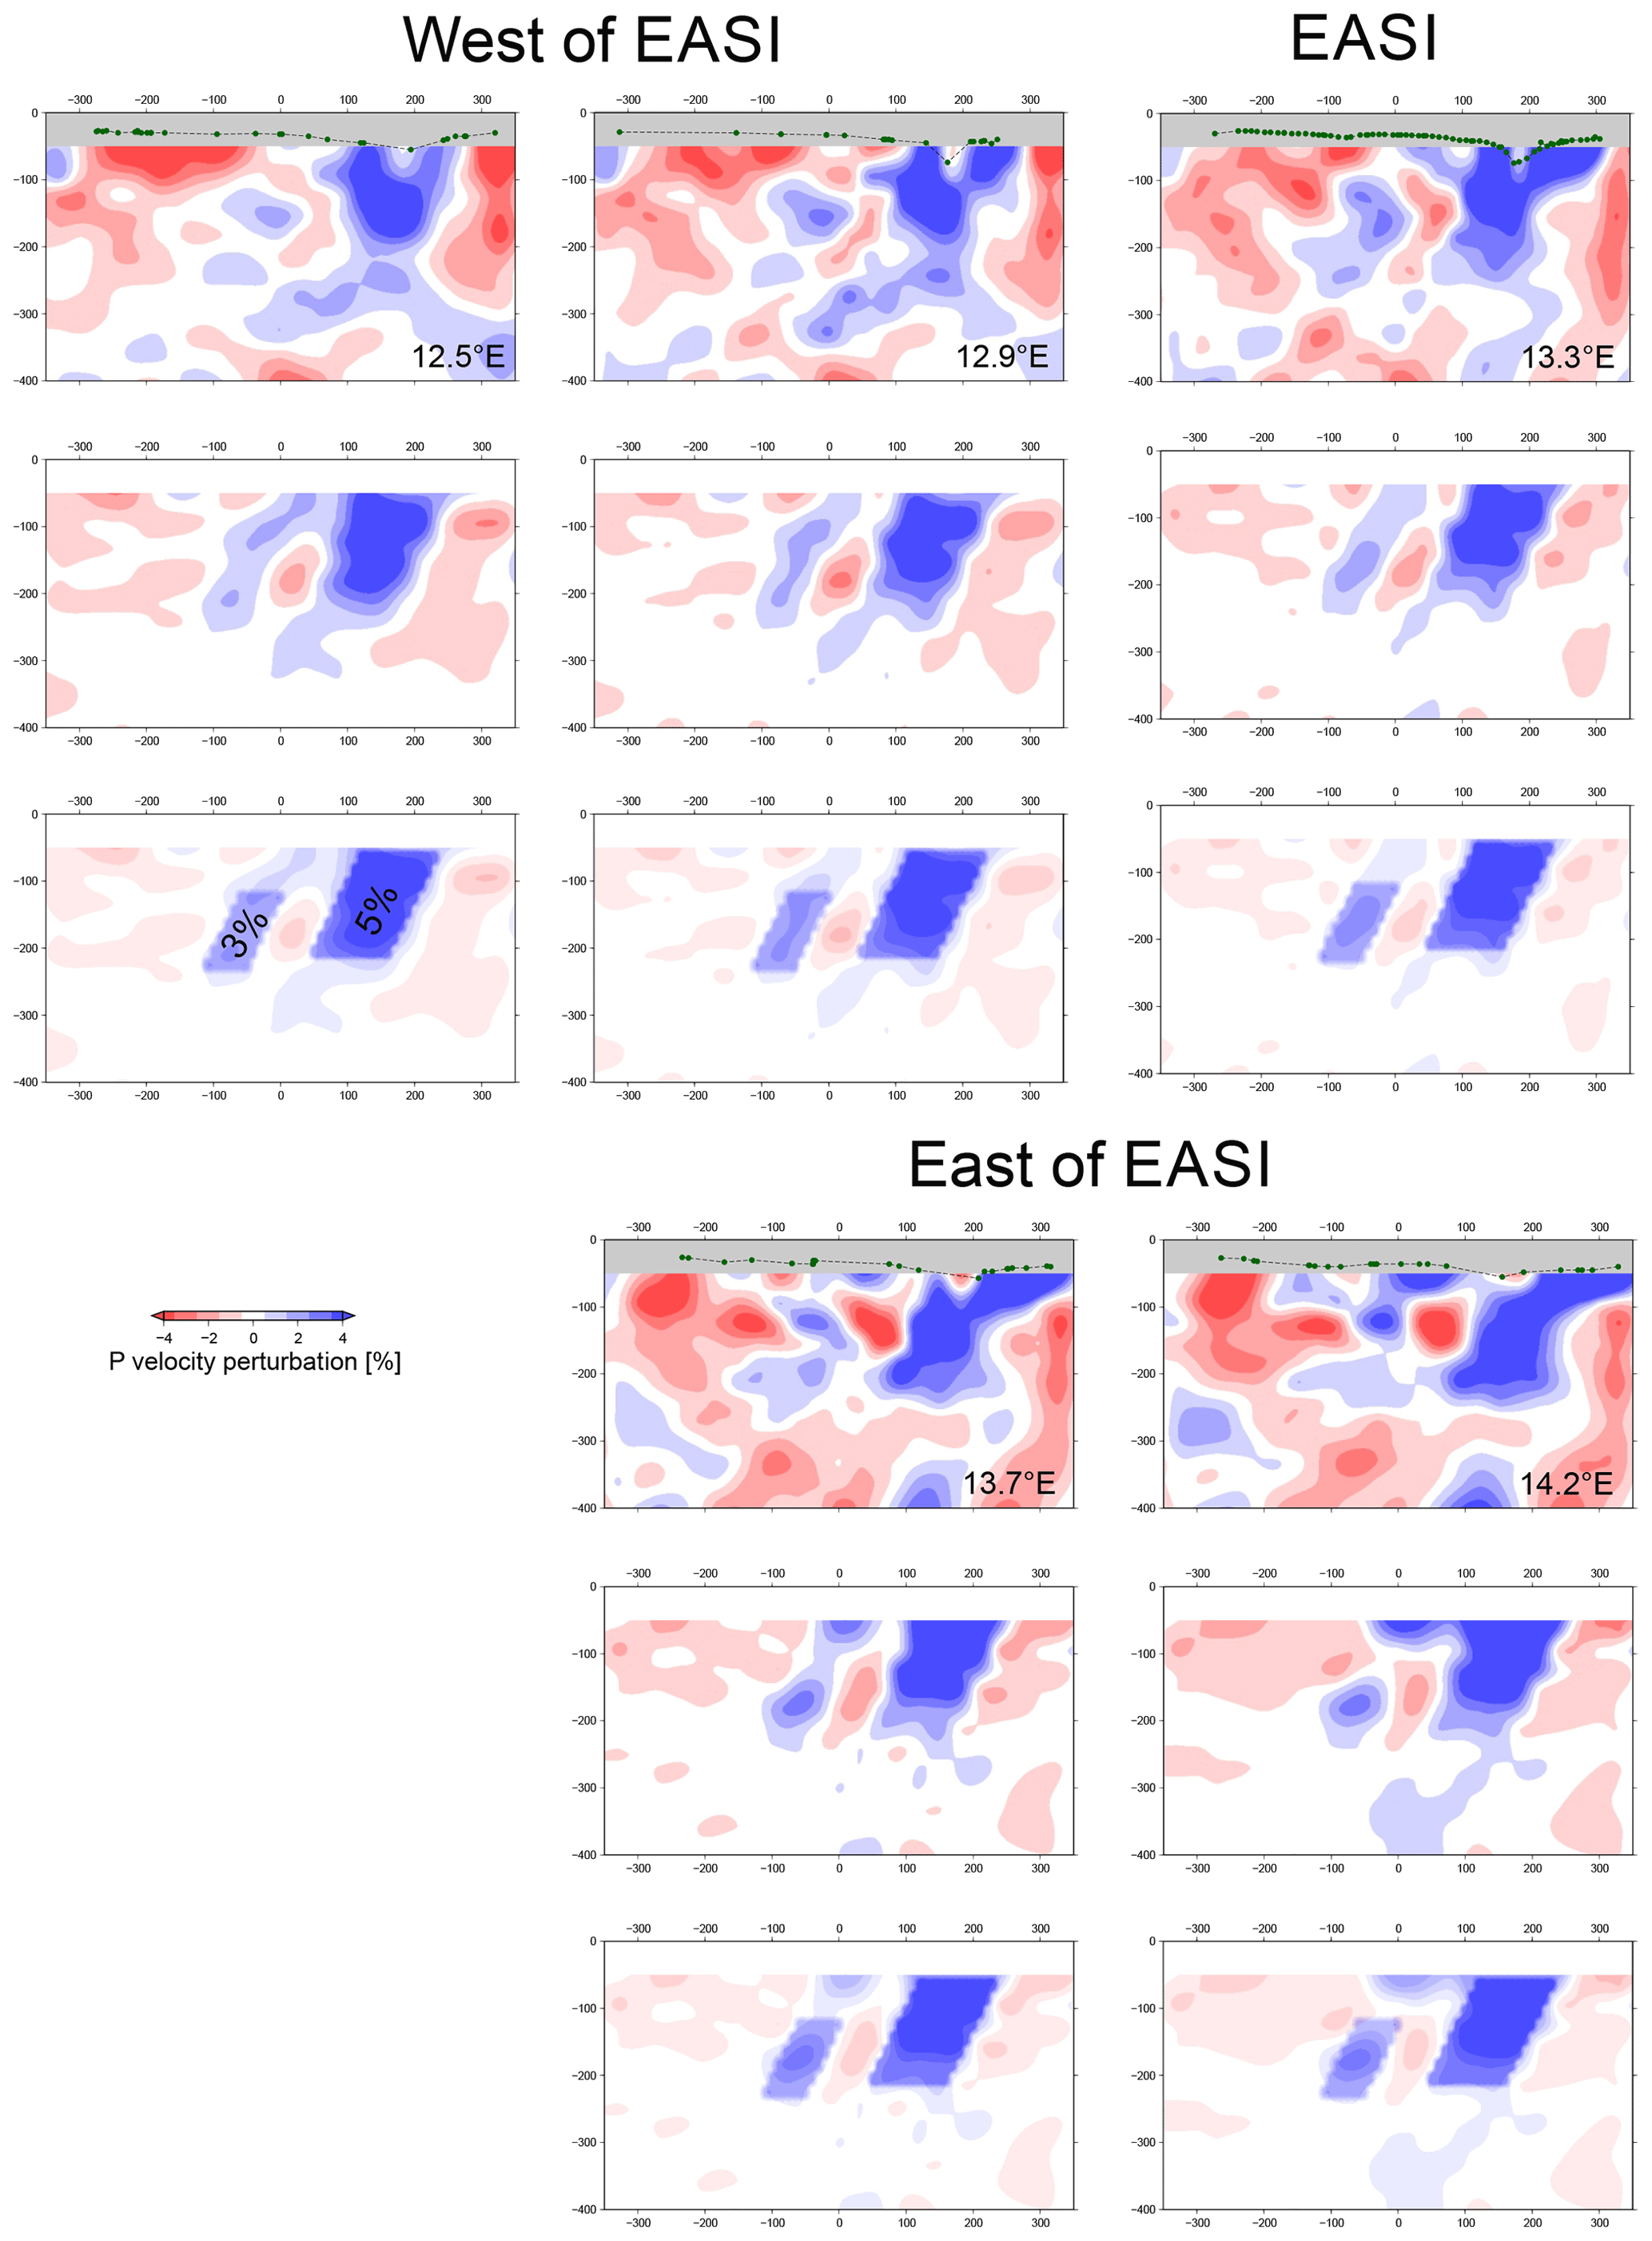
Figure 7Velocity perturbations along the five vertical along-longitude cross sections calculated from real data (upper row) and those (middle row) calculated from two synthetic 3 % and 5 % heterogeneities (bottom), plotted over the retrieved perturbations. Green dots mark Moho depths in the model used for calculation of crustal corrections (see also Fig. S3). The along-longitude cross sections run from 51.65 to 45.35∘ N.
The inconsistency between the above-mentioned results in the upper ∼ 150 km of the upper mantle could come from different sources, e.g. a sub-optimal ray coverage in that area and depth range, but also can reflect differences in crustal corrections applied. A certain role can also be played by the difference in size of the arrays. Velocity perturbations in P-wave tomography are linked to averages within each layer (a plane of grid nodes), which might differ in a large array from that of a smaller-sized array. Data from large-scale arrays allow us to model heterogeneities down to greater depths than a smaller-sized regional tomography, which can, on the other hand, provide finer images. While tomography images presented here have the best resolution above 200 km and allow imaging a shallow slab beneath the Eastern Alps attached to Adriatic plate, the large-scale model from the entire AlpArray has the best resolution at depths 200–400 km (Paffrath et al., 2021, this issue) and is thus able to image the deep-delaminated European slab beneath the Eastern Alps.
The role of applying proper crustal corrections is significant in teleseismic regional tomography. Not applying any crustal corrections or applying inadequate ones can strongly affect velocity perturbations within the upper ∼ 100 km of the upper mantle (e.g. Karousová et al., 2013), which is the zone where the models discussed above differ. “Overcorrecting” the travel times due to the crustal model used, regardless of the method of correcting itself, can delete, erase, or substantially reduce positive perturbations in the upper 100 km if crust that is too slow and thick is considered and vice versa. From this point of view, developing a uniform, detailed, and reliable model of the European crust is urgently needed.
Various evolution scenarios for the Eastern Alps slab exist, but there are none for the HV-BM beneath the southern BM. For detailed scenarios of the Alps subduction and the Europe–Adria plate collision we refer to Schmid et al. (2004), Handy et al. (2010, 2015), Le Breton et al. (2017), Kissling and Schlunegger (2018), Rosenberg et al. (2018), and Paffrath et al. (2021) as well as references therein. Their models of Alpine orogeny include subductions of the European and Adriatic plates, slab roll-back, tearing, break-offs and delamination, widespread intra-crustal and crust–mantle decoupling, and the NW translation and counter-clockwise rotation of the Adriatic plate. All these processes, accompanied by thermal erosion and/or deglaciation uplifts, are reflected in the different structure of the WA and EA. But how do we interpret the positive velocity perturbations within the low-velocity upper mantle beneath the southern BM (HV-BM)?
The elongated HV-BM is ∼ 80 km wide and extends, considering both the EASI-AA and Paffrath et al. (2021) model, approximately 12.5–16∘ E over a length of ∼ 300 km on the surface. The elongated shape of this heterogeneity strikes in the SW–NE azimuth and extends from ∼ 100 km down to ∼ 200 km of depth. We estimate the total volume of the HV-BM at 1.5 million km3; these dimensions are comparable to a small lithospheric segment. The smaller part of the HV-BM imaged in the EASI-AA model extends at a low angle relative to the eastern Alpine front. But considering its full size, it is sub-parallel to the MD–BV contact in the BM as well as the Western Carpathians front. The high-velocity material hovers in the low-velocity upper mantle beneath the BM. We outline three potential scenarios as an explanation for he origin of this positive heterogeneity.
The simplest explanation would be to consider it as a fragment of the delaminated part of the European plate subductions, analogous to the scenario proposed by Handy et al. (2015) for the delamination of European lithosphere further to the south beneath the Eastern Alps (Fig. 8a). In their model, the second break-off or delamination of the European slab at ∼ 25 Ma opened space for the northward subduction of the Adriatic plate, pushed by Africa from the south and rotated by pulling due to subduction of its SE rim beneath the Hellenides. The delaminated piece of the continental lithosphere has continued sinking into the mantle in the model since then. However, the HV-BM is located at shallow depth (above ∼ 200 km, not really compatible with sinking) and is too far to the north (at ∼ 49∘ N) from the Periadriatic Fault System. Therefore, an association of the HV-BM with the delaminated fragment of the EU subduction is not likely. Also, the clearly imaged separation (negative anomaly) between the subducting HV-EA and the HV-BM is a feature that would not be explained in this scenario.
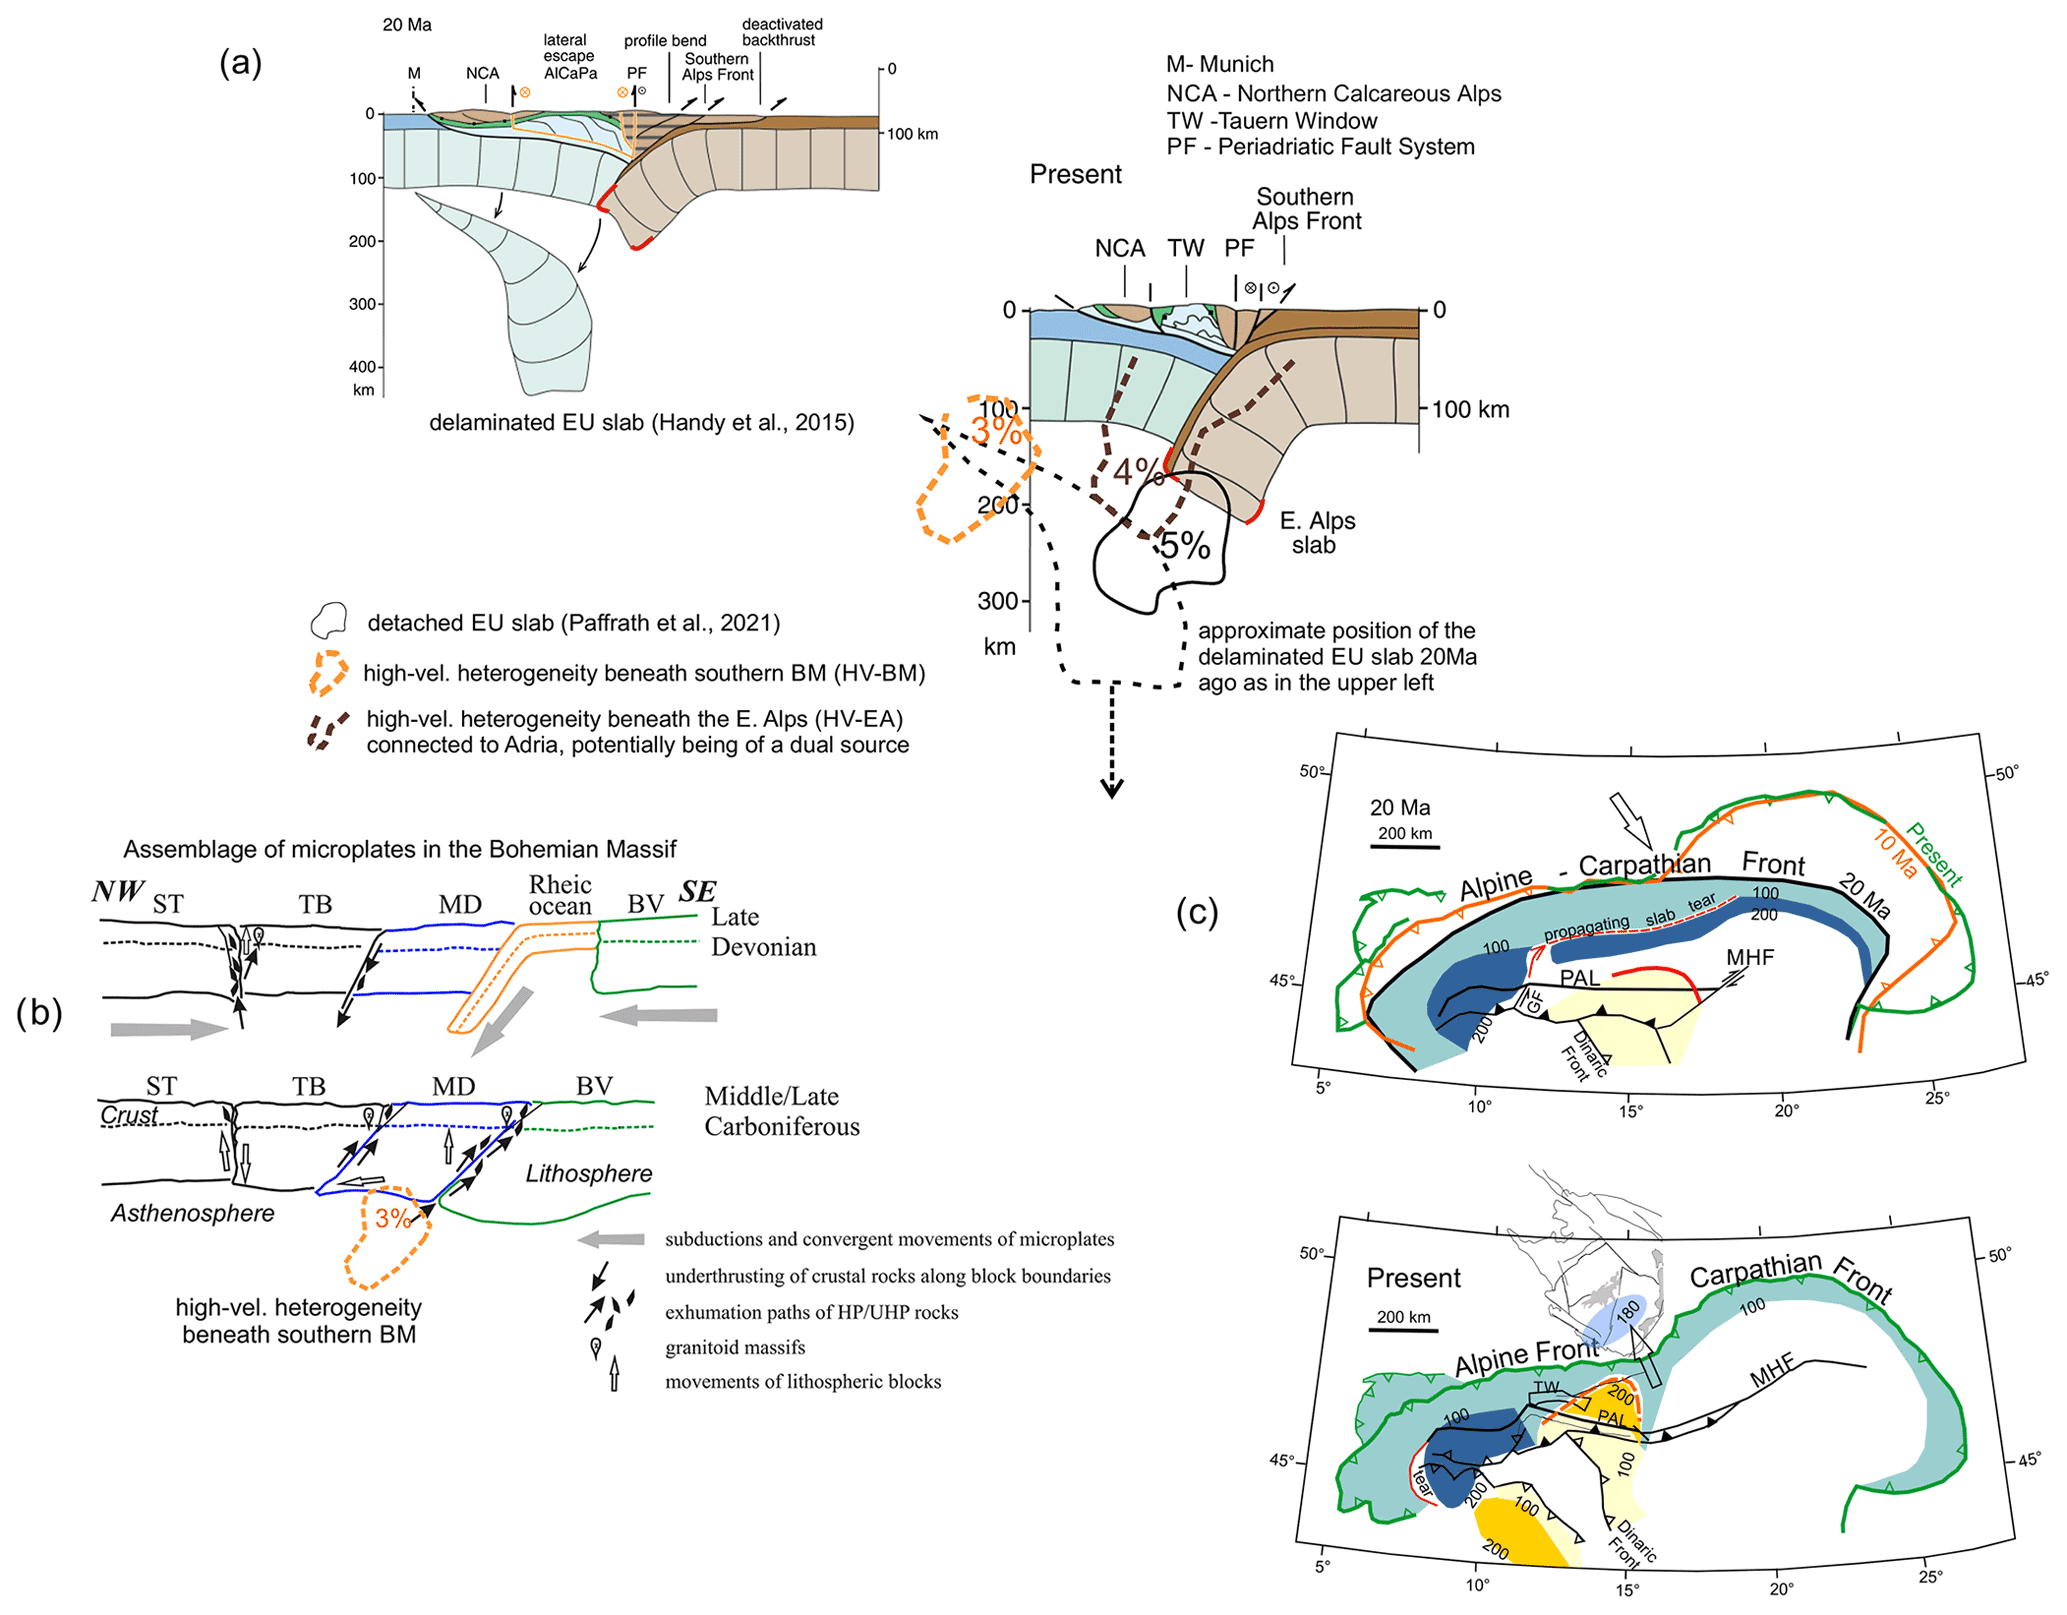
Figure 8Interpretation of the slab at shallow depth beneath the Eastern Alps (HV-EA), its Adriatic vs. European provenance, and potential scenarios for the origin of the heterogeneity beneath the south-eastern Bohemian Massif (HV-BM). (a) Cartoons of the European slab (EU) delamination at 20 Ma (upper left) and configuration of the Europe–Adria plate collision at present (lower right). Figure redrawn from Handy et al. (2015) (for the location of the profile see their Fig. 10) by overlaying the location of the high-velocity heterogeneities from the EASI-AA model in a cross section along 13.3∘ E (Fig. 3b) and the model of Paffrath et al. (2021); (b) a scenario considering closure of the Rheic ocean and collision of the Brunovistulian micro-plate with the Moldanubian part of the BM in a portion of a schematic cartoon by Babuška and Plomerová (2013), with a piece of remnant lithosphere image as the HV-BM in this paper; (c) a scenario related to fragmentation of the Alpine and Carpathian front. Differences in the roll-back subductions of the Alps and the Carpathians (e.g. Royden and Burchfiel, 1989; Royden, 1993), northward push of Adria, and European slab delamination beneath the Eastern Alps (Handy et al., 2015) could have formed complex flows in the asthenosphere, which might “transport” lithosphere fragments toward the north-west. For more details see the main text. The high-velocity contours are drawn according to Fig. 3b.
The BM is an assemblage of fragments of continental lithosphere with their own large-scale anisotropic fabrics (e.g. Babuška and Plomerová, 2013, 2020). Changes in the fabrics delineate boundaries between the mantle–lithosphere domains. The location of the HV-BM, following the boundary of the MD–BV mantle–lithosphere domains, evokes a possible link to the MD–BV collision, which is related to the closure of the Rheic ocean in the late Devonian to the middle–late Carboniferous (Babuška and Plomerová, 2013, and discussion and references therein). The HV-BM is disconnected from the BM lithosphere in tomography cross sections (see e.g. Figs. 3, 5). The continual subduction of the oceanic plate due to negative buoyancy would have led to a removal of the denser materials from shallow depths since then. The Phanerozoic continental mantle–lithosphere may mechanically decouple from the upper or the full crust, since this lower lithosphere is denser than the asthenosphere into which it subducts. Densification of the lower crust through metamorphic reactions may enhance this process if the convergence is fast (e.g. 2 cm yr−1 in Hetényi et al., 2011). The Phanerozoic continental mantle–lithosphere, composed of originally lighter rocks than those in the asthenosphere, becomes denser due to metamorphic phase changes as it subducts. This is the general process; however, at low convergence rates it is able to slowly return from the negative to positive buoyancy range (Boonma et al., 2019). Such a process could “stop” subductions and allow for long-term survival of this lithosphere material in the asthenosphere, with the high-velocity anomaly caused by chemical composition rather than temperature. Thus, the HV-BM could represent a remnant of the Rheic oceanic closure and/or a relic of the MD–BV collision, captured in the slow sub-lithospheric BM mantle (Fig. 8b).
A third scenario (Fig. 8c) could be some relatively light material brought to its current position beneath the BM not too long ago to survive there (i.e. not to sink rapidly). In this hypothesis the anomaly beneath the BM could be derived from subduction and lateral transport in the mantle of the oceanic embayment of the Alpine Tethys. To get such material there is difficult but not impossible considering the evolution of the European plate and the Carpathians. The shape of the originally linear, W–E-running Alpine–Carpathians front has changed since the time of the second European slab break-off, AlCaPa lateral escape, and beginning of the Adria subduction (Handy et al., 2015). The Carpathians front curved significantly and migrated to the north. Differences in the roll-back subductions of the Alps (e.g. Royden and Burchfiel, 1989; Royden, 1993) and the Carpathians, northward push of Adria, and European slab delamination beneath the EA could have formed complex flows in the asthenosphere (e.g. Vignaroli et al., 2008), which could “transport” a purely oceanic lithosphere or a mix of oceanic and continental lithosphere fragments through the open space between the eastern Alpine and Carpathian slabs north–north-westward into the mantle beneath the BM. The rotational displacement of the Adriatic plate indenter provided an additional driving force for modifications of the Alpine–Carpathian–Dinaric orogenic system (Ustaszewski et al., 2008). Remnants of the Penninic–Piemont oceanic lithosphere (Brückl et al., 2014 – Fig. 9 there), squeezed east of 14∘ E between the AlCaPa and European plates in the Western Carpathians and pushed from the south by the Adria, can offer a possible explanation for the origin of the SW–NE elongated HV-BM striking sub-parallel to the Western Carpathian front.
Finding an unambiguous model of the complex Alpine orogeny and structure of the upper mantle in the broader surroundings of the Alps requires multi-method and interdisciplinary research that covers various spatial scales. The combination of gravity and seismic data represents one of such approaches (e.g. Lowe et al., 2021, this issue; Scarponi et al., 2021). Lowe et al. (2021, this issue) converted modified standard isotropic velocity perturbation models into velocity and then density models. Those are after that used to calculate the gravity signal, predicted up to 40 mGal for various slab configurations mimicking the Alps. The applied methods include severe simplifying assumptions. Nevertheless, neither including pre-defined slab geometries nor accounting for compositional and thermal variations with depth brings satisfactory results, which would allow them to distinguish between their two different slab configurations. The freshly compiled pan-Alpine surface-gravity database (Zahorec et al., 2021) will undoubtedly provide new impetus for structural investigations combining seismology and gravity. Regarding the gravity effect of the HV-BM, the expected signal is too weak to appear there clearly, as crustal effects are predominant in that area of the BM.
The anisotropic nature of the Earth has been proved to be a general characteristic in different seismological studies. Anisotropy influences mainly velocities and polarizations of seismic waves. Seismic anisotropy of the Earth's upper mantle carries key information for deciphering the tectonic history of the lithosphere–asthenosphere system (e.g. Babuška and Cara, 1991; Sobolev, 1999; Fouch and Rondenay, 2006; Long and Becker, 2010; Babuška and Plomerová, 2020, and references therein). However, effects of directional dependences of velocities are not considered in standard isotropic tomography images. Only long-wavelength shear-velocity models from surface waves traditionally include azimuthal and/or radial anisotropy in the mantle. Ignoring seismic anisotropy and assuming isotropic wave propagation or considering only azimuthal and/or radial anisotropy leads to significant isotropic and anisotropic imaging artefacts that may lead to spurious interpretations (van der Beek and Faccenda, 2021). In this study of the broader region around the Eastern Alps we have applied the isotropic mode of a coupled anisotropic–isotropic teleseismic P-wave tomography developed by Munzarová et al. (2018a). In spite of the general good agreement with the high-resolution large-scale isotropic tomography (Paffrath et al., 2021, this issue), the images can be biased due to seismic anisotropy (Eken et al., 2012; Qorbani et al., 2015, 2016; Bokelmann et al., 2021; Handy et al., 2021). Laterally varying anisotropy, which correlates with tectonics of the region, has been indicated in shear-wave splitting (e.g. Link and Rumpker, 2021). After collecting a sufficient amount of well-distributed high-quality data we will run the coupled anisotropic–isotropic mode of the code, which was successfully applied in northern Fennoscandia (Munzarová et al., 2018b). The resulting 3D anisotropic model of the region will map laterally and vertically varied anisotropy with symmetry axes oriented generally (i.e. inclined) in 3D. This further investigation may help decide among the drafted scenarios for the origin of the HV-BM or point to new ones.
The teleseismic P-wave tomography of the upper mantle beneath the Eastern Alps and the Bohemian Massif, as presented here, locates the Alpine high-velocity perturbations between the Periadriatic Lineament (PAL) and the Northern Alpine Front (NAF). The northward-dipping slab is imaged down to ∼ 200 km, without distinct signs of delamination from the Adriatic plate. The bimodal character of the positive perturbations with a separation beneath the Tauern Window indicates a dual source of the heterogeneity, most probably formed by a mixture of a fragment of detached European plate and the Adriatic plate subductions. The fine-gridded EASI-AA model of velocity perturbations images the individual high-velocity heterogeneity beneath the southern part of the Bohemian Massif at depths of ∼ 100–200 km. Its eastward continuation is visualized in other tomography results as well. Interpreting this heterogeneity as a remnant of the delaminated European plate seems unlikely. The SW–NE trend of the heterogeneity strike, in parallel with the Moldanubian–Brunovistulian mantle–lithosphere boundary in the Bohemian Massif or with the westernmost part of the Carpathian front, leads us to consider it to be a piece of a mixture of the continental and oceanic lithosphere related to building of the BM, particularly to the closure of the old Rheic ocean during the MD–BV collision, or a lithospheric fragment going through to the NW between the Eastern Alps and Western Carpathian fronts in a preceding subduction phase.
The Python script TimePicker 2017 (Vecsey, 2021) is available upon request to the author. AlpArray-EASI data are freely and openly available on EIDA under network code XT for 2014–2015. AlpArray Seismic Network data are currently available to AlpArray Working Group members as per a signed project agreement. They will become fully and openly available as of 1 April 2022 under network code Z3 for temporary stations and also under virtual network code ALPARRAY for all stations. Citations for these two datasets as well as for the permanent network are provided in the references.
The supplement related to this article is available online at: https://doi.org/10.5194/se-13-251-2022-supplement.
The complete member list of the AlpArray-EASI Working Group and the AlpArray Working Group can be found at http://www.alparray.ethz.ch.
JP processed the P-wave residuals, analysed and interpreted results, and wrote the paper. HZ ran the AniTomo code. GH participated in interpretations and writing the paper. LV developed and applied the P-wave arrival time picker, and VB participated in early-stage discussions.
The contact author has declared that neither they nor their co-authors have any competing interests.
Publisher's note: Copernicus Publications remains neutral with regard to jurisdictional claims in published maps and institutional affiliations.
This article is part of the special issue “New insights into the tectonic evolution of the Alps and the adjacent orogens”. It is not associated with a conference.
We thank Mark R. Handy and the anonymous reviewer for their valuable criticism and suggestions, which led to important clarifications and improvement of the paper, as well as Emanuel K. Kästle for his editorial work. Research within this study was supported by the Grant Agency of the Czech Republic (grant no. 21-25710), and station operation was supported by projects CzechGeo/EPOS-Sci CZ.02.1.01/0.0/0.0/16_013/0001800 (OP RDE) as well as CzechGeo/EPOS LM2010008 and LM2015079. We acknowledge the operation of the temporary seismic network XT of the AlpArray-EASI complementary experiment and the AlpArray Seismic Network Z3. Contributions from all permanent seismic networks used in this study are acknowledged as follows: BW – Department of Earth and Environmental Sciences, Geophysical Observatory, University of München, 2001; CR – University of Zagreb, 2001; CZ – Institute of Geophysics of the CAS, 1973; GR – Federal Institute for Geosciences and Natural Resources, 1976; IV – INGV Seismological Data Centre, 2006; MN – MedNet Project Partner Institutions, 1990; NI – OGS and University of Trieste, 2002; OE – ZAMG, 1987; SI – ZAMG, 2006; SL – Slovenian Environment Agency, 1990; SX – University of Leipzig, 2001; TH – Friedrich-Schiller-Universität Jena, 2009.
This research has been partly supported by the Grant Agency of the Czech Republic (grant no. 21-25710).
This paper was edited by Emanuel Kästle and reviewed by M. R. Handy and one anonymous referee.
Aki, K., Christofferson, A., and Husebye, E. S.: Determination of the three dimensional seismic structure of the lithosphere, J. Geophys. Res., 82, 277–296, 1977.
AlpArray Seismic Network: Eastern Alpine Seismic Investigation (EASI), AlpArray Complementary Experiment, AlpArray Working Group, Other/Seismic Network, https://doi.org/10.12686/alparray/xt_2014, 2014.
AlpArray Seismic Network: AlpArray Seismic Network (AASN) temporary component, AlpArray Working Group, Other/Seismic Network, https://doi.org/10.12686/alparray/z3_2015, 2015.
Amaru, M. L.: Global travel time tomographywith 3-D reference models, Geol. Traiectina, 274, PhD thesis, Utrecht Univ., 174, Geologica Ultraiectina, 274, 174 pp., Utrecht University, ISBN 978-90-5744-139-4, 2007.
Aric, K., Gutdeutsch, R., Leichter, B., Lenhardt, W., Plomerová, J., Babuška, V., Pajdušák, P., and Nixdorf, U.: Structure of the lithosphere in the Eastern Alps derived from P-residual analysis, Arbeiten aus Zentralanstalt fur Meteorologie und Geodynamik, Nr. 370, H. 73, Wien, Zentralanstalt fur Meteorologie und Geodynamik, 26 pp., 1989.
Arlitt, R., Kissling, E., and Ansorge, J.: Three-dimensional crustal structure beneath the TOR array and effects on teleseismic wavefronts, Tectonophysics, 314, 309–319, 1999.
Babuška, V. and Cara, M.: Seismic anisotropy in the Earth, Kluwer Acad. Publishers, Dordrecht, 217 pp., ISBN 0-7923-1321-6, 1991.
Babuška, V. and Plomerová, J.: The lithosphere in central Europe – seismological and petrological aspects, Tectonophysics, 207, 141–163, 1992.
Babuška, V. and Plomerová, J.: Boundaries of mantle-lithosphere domains in the Bohemian Massif as extinct exhumation channels for high-pressure rocks, Gondwana Res., 23, 973–987, https://doi.org/10.1016/j.gr.2012.07.005, 2013.
Babuška, V. and Plomerová, J.: Growth of primordial continents by cycles of oceanic lithosphere subductions: Evidence from tilted seismic anisotropy supported by geochemical and petrological findings, Solid Earth, 5, 50–68, https://doi.org/10.1016/j.sesci.2019.12.003, 2020.
Babuška, V., Plomerová, J., and Granet, M.: The deep lithosphere in the Alps: a model inferred from P residuals, Tectonophysics, 176, 137–165, 1990.
Bokelmann, G., Hein, G., Kolinsky, P., Bianchi, I., and Working Group, A.: Shear-Wave Splitting in the Alpine Region, EGU General Assembly 2021, online, 19–30 Apr 2021, EGU21-5377, https://doi.org/10.5194/egusphere-egu21-5377, 2021.
Boonma, K., Kumar, A., Garcia-Castellanos, D., Jiménez-Munt, I., and Fernández, M.: Lithspsheric mantle buoyancy: the role of tectonic convergence and mantle composition, Sci. Rep., 9, 17953, https://doi.org/10.1038/s41598-019-54374-w, 2019.
Brückl, E. and Hammerl, C.: Eduard Suess' conception of the Alpine orogeny related to geophysical data and models, Austr. J. Earth Sci., 107, 94–114, 2014.
Brückl, E., Behm, M., Decker, K., Grad, M., Guterch, A., Keller, G. R., and Thybo, H.: Crustal structure and active tectonics in the Eastern Alps, Tectonics, 29, TC2011, https://doi.org/10.1029/2009TC002491, 2010.
Chyba, J., Plomerová, J., Vecsey, L., and Munzarová, H.: Tomography study of the upper mantle around the TESZ based on PASSEQ experiment data, Phys. Earth Planet In., 266, 29–38, https://doi.org/10.1016/j.pepi.2017.01.002, 2017.
Dando, B. D. E., Stuart, G. W., Houseman, G. A., Hegedus, E., Bruckl, E., and Radovanovic, S.: Teleseismic tomography of the mantle in the Carpathian-Pannonian region of central Europe, Geophys. J. Int., 186, 11–31, https://doi.org/10.1111/j.1365-246X.2011.04998.x, 2011.
Department of Earth and Environmental Sciences, Geophysical Observatory, University of München: BayernNetz, https://doi.org/10.7914/SN/BW, 2001.
Di Stefano, R., Bianchi, I., Ciaccio, M. G., Carrara, G., and Kissling, E.: Three-dimensional Moho topography in Italy: New constraints from receiver functions and controlled source seismology, Geochem. Geophy. Geosy., 12, Q09006, https://doi.org/10.1029/2011GC003649, 2011.
Eken, T., Shomali, H., Roberts, R., and Bödvarsson, R.: Upper mantle structure of the Baltic Shield below the Swedish National Seismological Network (SNSN) resolved by teleseismic tomography, Geophys. J. Int., 169, 617–630, 2007.
Eken, T., Plomerová, J., Vecsey, L., Babuška, V., Roberts, R., Shomali, H., and Bodvarson, R.: Effects of seismic anisotropy on P-velocity tomography of the Baltic Shield, Geophys. J. Int., 188, 600–612, https://doi.org/10.1111/j.1365-246X.2011.05280.x, 2012.
El-Sharkawy, A., Meier, T., Lebedev, S., Behrmann, J. H., Hamada, M., Cristiano, L., Weidle, C., and Köhn, D.: The slab puzzle of the Alpine-Mediterranean region: Insights from a new, high-resolution, shear wave velocity model of the upper mantle, Geochem. Geophy. Geosy., 21, e2020GC008993, https://doi.org/10.1029/2020GC008993, 2020.
Federal Institute for Geosciences and Natural Resources: German Regional Seismic Network (GRSN), Bundesanstalt für Geowissenschaften und Rohstoffe, https://doi.org/10.25928/mbx6-hr74, 1976.
Fichtner, A. and Villasenor, A.: Crust and upper mantle of the western Mediterranean–Constraints from full-waveform inversion, Earth Planet. Sc. Lett., 428, 52–62, https://doi.org/10.1016/j.epsl.2015.07.038, 2015.
Fouch, M. J. and Rondenay, S.: Seismic anisotropy beneath stable continental interiors, Phys. Earth Planet In., 158, 292e320, https://doi.org/10.1016/j.pepi.2006.03.024, 2006.
Handy, M. R., Schmid, S. M., Bousquet, R., Kissling, E., and Bernoulli, D.: Reconciling plate-tectonic reconstructions of Alpine Tethys with the geological–geophysical record of spreading and subduction in the Alps, Earth-Sci. Rev., 102, 121–158, https://doi.org/10.1016/j.earscirev.2010.06.002, 2010.
Handy, M. R., Ustaszewski, K., and Kissling, E.: Reconstructing the Alps–Carpathians–Dinarides as a key to understanding switches in subduction polarity, slab gaps and surface motion, Int. J. Earth Sci., 104, 26201, https://doi.org/10.1007/s00531-014-1060-3, 2015.
Handy, M. R., Schmid, S. M., Paffrath, M., Friederich, W., and the AlpArray Working Group: Orogenic lithosphere and slabs in the greater Alpine area – interpretations based on teleseismic P-wave tomography, Solid Earth, 12, 2633–2669, https://doi.org/10.5194/se-12-2633-2021, 2021.
Hetényi, G., Stuart, G. W., Houseman, G. A., Horváth, F., Hegedűs, E., and Brückl, E.: Anomalously deep mantle transition zone below Central Europe: Evidence of lithospheric instability, Geophys. Res. Lett., 36, L21307, https://doi.org/10.1029/2009GL040171, 2009.
Hetényi, G., Godard, V., Cattin, R., and Connolly, J. A. D.: Incorporating metamorphism in geodynamic models: the mass conservation problem, Geophys. J. Int., 186, 6–10, https://doi.org/10.1111/j.1365-246X.2011.05052.x, 2011.
Hetényi, G., Molinari, I., Clinton, J., Bokelmann, G., Bondár, I., Crawford, W. C., Dessa, J-X., Doubre, C., Friederich, W., Fuchs, F., Giardini, D., Gráczer, Z., Handy, M. R., Herak, M., Jia, Y., Kissling, E., Kopp, H., Korn, M., Margheriti, L., Meier, T., Mucciarelli, M., Paul, A., Pesaresi, D., Piromallo, C., Plenefisch, T., Plomerová, J., Ritter, J., Rümpker, G., Šipka, V., Spallarossa, D., Thomas, C., Tilmann, F., Wassermann, J., Weber, M., Wéber, Z., Wesztergom, V., Živčić, M., AlpArray Seismic Network Team, AlpArray OBS Cruise Crew, and AlpArray Working Group: The AlpArray Seismic Network: a large-scale European experiment to image the Alpine orogeny, Surv. Geophys., 1–25, https://doi.org/10.1007/s10712-018-9472-4, 2018a.
Hetényi, G., Plomerová, J., Bianchi, I., Kampfová Exnerová, H., Bokelmann, G., Handy, M. R., Babuška, V., and AlpArray-EASI Working Group: From mountain summits to roots: Crustal structure of the Eastern Alps and Bohemian Massif along longitude 13.3∘ E, Tectonophysics, 744, 239–255, doi:10.1016, 2018b.
Horváth, F., Musitza, B., Balázs A., Végh, A., Uhrin, A., Nádor, A., Koroknai, A., Pap, N., Tóth, T., and Wórum, G.: Evolution of the Pannonian basin and its geothermal resources, Geothermics, 53, 328–352, https://doi.org/10.1016/j.geothermics.2014.07.009, 2015.
Hua, Y., Zhao, D., and Xu, Y.: P wave anisotropic tomography of the Alps, J. Geophys. Res.-Sol. Ea., 122, 4509–4528, https://doi.org/10.1002/2016JB013831, 2017.
INGV Seismological Data Centre: Rete Sismica Nazionale (RSN), Istituto Nazionale di Geofisica e Vulcanologia (INGV), Italy, https://doi.org/10.13127/SD/X0FXnH7QfY, 2006.
Institut für Geowissenschaften, Friedrich-Schiller-Universitaet Jena: Thüringer Seismologisches Netz, https://doi.org/10.7914/SN/TH, 2009.
Institute of Geophysics of the Czech Academy of Sciences (CAS): Czech Regional Seismic Network, https://doi.org/10.7914/SN/CZ, 1973.
Kalmár, D., Hetényi, G., Balázs, A., Bondár, I., and AlpArray Working Group: Crustal thinning from orogen to back-arc basin: the structure of the Pannonian Basin region revealed by P-to-S converted seismic waves, J. Geophys. Res., 126, e2020JB021309, https://doi.org/10.1029/2020JB021309, 2021.
Karousová, H., Plomerová, J., and Babuška, V.: Three-dimensional velocity model of the crust of the Bohemian Massif and its effects on seismic tomography of the upper mantle, Stud. Geophys. Geod., 56, 249–267, https://doi.org/10.1007/s11200-010-0065-z, 2012.
Karousová, H., Plomerová, J., and Babuška, V.: Upper mantle structure beneath the southern Bohemian Massif and its surroundings imaged by high-resolution tomography, Geophys. J. Int., 194, 1203–1215, https://doi.org/10.1093/gji/ggt159, 2013.
Kästle, E. D., El-Sharkawy, A., Boschi, L., Meier, T., Rosenberg, C., Bellahsen, N., and Weidle, C. C.: Surface Wave Tomography of the Alps Using Ambient-Noise and Earthquake Phase Velocity Measurements, J. Geophys. Res.-Sol. Ea., 123, 1770–1792, https://doi.org/10.1002/2017jb014698, 2018.
Kästle, E. D., Rosenberg, C., Boschi, L., Bellahsen, N., Meier, T., and El-Sharkawy, A., Slab break-offs in the Alpine subduction zone, Int. J. Earth Sci., 109, 587–603, https://doi.org/10.1007/s00531-020-01821-z, 2020.
Kennett, B. L. N. and Engdahl, E. R.: Traveltimes for global earthquake location and phase identification, Geophys., J. Int., 105, 429–465, 1991.
Kind, R., Schmid, S. M., Yuan, X., Heit, B., Meier, T., and the AlpArray and AlpArray-SWATH-D Working Groups: Moho and uppermost mantle structure in the Alpine area from S-to-P converted waves, Solid Earth, 12, 2503–2521, https://doi.org/10.5194/se-12-2503-2021, 2021.
Kissling, E. and Schlunegger, F.: Rollback orogeny model for the evolution of the Swiss Alps, Tectonics, 37, 1097–1115, https://doi.org/10.1002/2017TC004762, 2018.
Kissling, E., Schmid, S. M., Lippitsch, R., Ansorge, J., and Fügenschuh, B.: Lithosphere structure and tectonic evolution of the Alpine arc: new evidence from high-resolution teleseismic tomography, Eurpean Lithosphere Dynamics, edited by: Gee, D. G. and Stephenson, R. A., The Geological Society, London, Memoirs of Geol. Soc., Vol. 32, 129–145, https://doi.org/10.1144/GSL.MEM.2006.032.01.08, 2006.
Koulakov, I., Kaban, M. K., Tesauro, M., and Cloetingh, S.: P- and S velocity anomalies in the uppermantle beneath Europe from tomographic inversion of ISC data, Geophys. J. Int., 179, 345–366, 2009.
Krischer, L., Megies, T., Barsch, R., Beyreuther, M., Lecocq, T., Caudron, C., and Wassermann, J.: ObsPy: a bridge for seismology into the scientific Python ecosystem, Comput. Sci. Discov., 8, 014003, https://doi.org/10.1088/1749-4699/8/1/014003, 2015.
Laubscher, H. P.: Bewegung und Wärme in der alpinen Orogenese, Schweizerische mineralogische und petrographische Mitteilungen, Bulletin suisse de minéralogie et pétrographie, 50, 565–596, 1970.
Le Breton, E., Handy, M. R., Molli, G., and Ustaszewski, K.: Post-20 Ma motion of the Adriatic plate: New constraints from surrounding Orogens and implications for crust-mantle decoupling, Tectonics, 36, 1–20, https://doi.org/10.1002/2016TC004443, 2017.
Link, F. and Rumpker, G.: Resolving Seismic Anisotropy of the Lithosphere–Asthenosphere in the Central/Eastern Alps Beneath the SWATH-D Network2021, Front. Earth Sci., 9, 679887, https://doi.org/10.3389/feart.2021.679887, 2021.
Lippitsch, R., Kissling, E., and Ansorge, J.: Upper mantle structure beneath the Alpine orogen from high-resolution teleseismic tomography, J. Geophys. Res., 108, B82376, https://doi.org/10.1029/2002JB002016, 2003.
Lombardi, D., Braunmiller, J., Kissling, E., and Giardini, D.: Alpine mantle transition zone imaged by receiver functions, Earth Planet. Sc. Lett., 278, 163–174, https://doi.org/10.1016/j.epsl.2008.11.029, 2009.
Long, M. D. and Becker, T. W.: Mantle dynamics and seismic anisotropy, Earth Planet Sc. Lett., 297, 341–354, 2010.
Lowe, M., Ebbing, J., El-Sharkawy, A., and Meier, T.: Gravity effect of Alpine slab segments based on geophysical and petrological modelling, Solid Earth, 12, 691–711, https://doi.org/10.5194/se-12-691-2021, 2021.
Malusà, M. G., Guillot, S., Zhao, L., Paul, A., Solarino, S., Dumont, T., Schwartz, S., Aubert, C., Baccheschi, P., Eva, E., LU., Y., Lyu, C., Pondrelli, S., Salimbeni S., Sun, W., and Yuan, H.: The Deep Structure of the Alps based on the CIFALPS Seismic Experiment: A Synthesis, Geochem. Geophy. Geosy., 22, e2020GC009466, https://doi.org/10.1029/2020GC009466, 2021.
MedNet Project Partner Institutions: Mediterranean Very Broadband Seismographic Network (MedNet), Istituto Nazionale di Geofisica e Vulcanologia (INGV), https://doi.org/10.13127/SD/fBBBtDtd6q, 1990.
Menke, W.: Geophysical Data Analysis: Discrete Inverse Theory, 1st Edn., Academic Press, Inc., ISBN 0-12-490921-3, 1984.
Mitterbauer, U., Behm, M., Brueckl, E., Lippitsch, R., Guterch, A., Keller, G. R., Kozlovskaya, E., Rumpfhuber, E. M., and Sumanovic, F.: Shape and origin of the East-Alpine slab constrained by the ALPASS teleseismic model, Tectonophysics, 510, 195–206, 2011.
Mock, S., von Hagke, C., Schlunegger, F., Dunkl, I., and Herwegh, M.: Long-wavelength late-Miocene thrusting in the north Alpine foreland: implications for late orogenic processes, Solid Earth, 11, 1823–1847, https://doi.org/10.5194/se-11-1823-2020, 2020.
Mueller, S.: Deep structure and recent dynamics in the Alps, edited by: Hsü, K., Mountain building processes, Acad. Press London, 85–93, ISBN 0-12-357980-5, 1982.
Munzarová, H., Plomerová, J., and Kissling, E.: Novel anisotropic teleseismic body-wave tomography code AniTomo to illuminate heterogeneous anisotropic upper mantle, Part I – Theory and inversion tuning with realistic synthetic data, Geophys. J. Int., 215, 524–545, https://doi.org/10.1093/gji/ggy296, 2018a.
Munzarová, H., Plomerová, J., Kissling, E., Vecsey, L., and Babuška, V.: Novel anisotropic teleseismic body-wave tomography code AniTomo to illuminate heterogeneous anisotropic upper mantle, Part II – Application to data of passive seismic experiment LAPNET in northern Fennoscandia, Geophys. J. Int., 215, 1388–1409, https://doi.org/10.1093/gji/ggy327, 2018b.
OGS (Istituto Nazionale di Oceanografia e di Geofisica Sperimentale) and University of Trieste: North-East Italy Broadband, https://doi.org/10.7914/SN/NI, 2002.
Paffrath, M., Friederich, W., Schmid, S. M., Handy, M. R., and the AlpArray and AlpArray-Swath D Working Group: Imaging structure and geometry of slabs in the greater Alpine area – a P-wave travel-time tomography using AlpArray Seismic Network data, Solid Earth, 12, 2671–2702, https://doi.org/10.5194/se-12-2671-2021, 2021.
Piromallo, C. and Morelli, A.: P-wave tomography of the mantle under the Alpine-Mediterranean area, J. Geophys. Res., 108, 2065, https://doi.org/10.1029/2002JB001757, 2003.
Plomerová, J. and Babuška, V.: Long memory of mantle lithosphere fabric – European LAB constrained from seismic anisotropy, Lithos, 120, 131–143, 2010.
Plomerová, J., Munzarová, H., Vecsey, L., Kissling, E., Achauer, U., and Babuška, V.: Cenozoic volcanism in the Bohemian Massif in the context of P-and S-velocity high-resolution teleseismic tomography of the upper mantle, Geochem. Geophy. Geosy., 17, 3326–3349, 2016.
Plomerová, J., Vecsey, L., Babuška, V., Munzarová, H., Hetényi, G., Bianchi, I., and the AlpArray-EASI Working Group: Deep lithosphere structure across the East-Alpine root towards theBohemian Massif, Geophysical Research Abstracts, Vol. 20, EGU General Assembly 2018, EGU2018-12326-1, 2018.
Qorbani, E., Bianchi I., and Bokelmann, G.: Slab detachment under the Eastern Alps seen by seismic anisotropy, Earth Planet. Sc. Lett., 409, 96–108, https://doi.org/10.1016/j.epsl.2014.10.049, 2015.
Qorbani, E., Bokelmann, G., Kovacs, I., Horvath, F., and Falus, G.: Deformation in the asthenospheric mantle beneath the Carpathian-Pannonian Region, J. Geophys. Res.-Sol. Ea., 121, 6644–6657, https://doi.org/10.1002/2015JB012604, 2016.
Rosenberg, C. L. and Kissling, E.: Three-dimensional insight into Central-Alpine collision: Lower-plate or upper-plate indentation?, Geology, 41, 1219–1222, https://doi.org/10.1130/G34584.1, 2013.
Rosenberg, C. L., Schneider, S., Scharf, A., Bertrand, A., Hammerschmidt, K., Rabaute, A., and Brun, J.-P.: Relating collisional kinematics to exhumation processes in the Eastern Alps, Earth-Sci. Rev., 176, 31–344, https://doi.org/10.1016/j.earscirev.2017.10.013, 2018.
Royden, L. H.: Evolution of retreating subduction boundaries formed during continental collision, Tectonics, 12, 629–638, https://doi.org/10.1029/92TC02641, 1993.
Royden, L. H. and Burchfirl, B. C.: Are systematic variations in thrust belt style related to plate boundary processes? (The Western Alps versus the Carpathians), Tectonics, 8, 51–61, https://doi.org/10.1029/TC008i001p00051, 1989.
Sandoval, S., Kislling, E., Ansorge, J., and SVEKALAPKO Seismic Tomography working Group: High-resolution body wave tomography beneath the SVEKALAPKO array – II. Anomalous upper mantle structure beneath the central Baltic Shield, Geophys. J. Int., 157, 200–214, https://doi.org/10.1111/j.1365-246X.2004.02131.x, 2004.
Scarponi, M., Hetényi, G., Plomerová, J., Solarino, S., Baron, L., and Petri, B.: Joint seismic and gravity data inversion to image intra-crustal structures: the Ivrea Geophysical Body along the Val Sesia profile (Piedmont, Italy), Front Earth Sci., 9, 671412, https://doi.org/10.3389/feart.2021.671412, 2021.
Schlunegger, F. and Kissling, E.: Slab rollback orogeny in the Alps and evolution of the Swiss Molasse basin, Nat. Commun., 6, 8605, https://doi.org/10.1038/ncomms9605, 2015.
Schmid, S. M., Fügenschuh, B., Kissling, E., and Schuster, R.: Tectonic map and overall architecture of the Alpine orogeny, Eclogae Geol. Helv., 97, 93–117, 2004.
Shomali, Z. H., Roberts, R. G., Pedersen, L. B., and the TOR Working Group: Lithospheric structure of the Tornquist Zone resolved by nonlinear P and S teleseismic tomography along the TOR array, Tectonophysics, 416, 133–149, 2006.
Silvennoinen, H., Kozlovskaya, E., and Kissling, E.: POLENET/LAPNET teleseismic P wave travel time tomography model of the upper mantle beneath northern Fennoscandia, Solid Earth, 7, 425–439, https://doi.org/10.5194/se-7-425-2016, 2016.
Slovenian Environment Agency: Seismic Network of the Republic of Slovenia, https://doi.org/10.7914/SN/SL, 1990.
Sobolev, S., Gresillaud, A., and Cara, M.: How robust is isotropic delay time tomography for anisotropic mantle?, Geophys. Res. Lett., 26, 509–512, 1999.
Spada, M., Bianchi, I., Kissling, E., Agostinetti, N. P., and Wiemer, S.: Combining controlled-source seismology and receiver function information to derive 3-D Moho topography for Italy, Geophys. J. Int., 194, 1050–1068, https://doi.org/10.1093/gji/ggt148, 2013.
Spakman, W.: Tomographic images of the upper mantle below central Europe and the Mediterranean, Terra Nova, 2, 542–553, https://doi.org/10.1111/j.1365-3121.1990.tb00119.x, 1990.
Steck, L. K. and Prothero, W. A.: A 3-D raytracer for teleseismic bodywave arrival times, Bull. Seism. Soc. Am., 81, 1332–1339, 1991.
Tesauro, M., Kaban, M. K., and Cloetingh, S.: EuCRUST-07: A new reference model for the European crust, Geophys. Res. Lett., 35, L05313, https://doi.org/10.1029/2007GL032244, 2008.
TRANSALP Working Group: European orogenic processes research transects the eastern Alps, Eos Trans. AGU, 82, 453, 460–461, 2001.
University of Leipzig: SXNET Saxon Seismic Network, https://doi.org/10.7914/SN/SX, 2001.
University of Zagreb: Croatian Seismograph Network, https://doi.org/10.7914/SN/CR, 2001.
Ustaszewski, K., Schmid, S. M., Fügenschuh, B., Tischler, M, Kissling, E., and Spakman, W.: A map-view restoration of the Alpine-Carpathian-Dinaridic system for the Early Miocene, Swiss J. Geosci., 101, S273–S294, 2008
van der Beek, B. P. and Faccenda, M.: Imaging upper mantle anisotropy with teleseismic P-wave dealys: insights from tomographic reconstructions of subduction simulations, Geophys. J. Int., 225, 2097–2119, https://doi.org/10.1093/gji/ggab081, 2021.
Vecsey, L.: TimePicker 2017 [code], Institute of Geophysics of the Czech Academy of Sciences, Prague, https://www.ig.cas.cz/en/time-picker-2017/ (last access: 25 January 2022), 2021.
Vecsey, L., Plomerová, J., Jedlička, P., Munzarová, H., Babuška, V., and the AlpArray working group: Data quality control and tools in passive seismic experiments exemplified on the Czech broadband seismic pool MOBNET in the AlpArray collaborative project, Geosci. Instrum. Method. Data Syst., 6, 505–521, 2017.
Vignaroli, G., Faccenna, C., Jolivet, L., Piromalo, C., and Rossetti, F.: Subduction polarity reversal at the junction between the Western Alps and the Northern Apennines, Italy, Tectonophys, 450, 34–50, https://doi.org/10.1016/j.tecto.2007.12.012, 2008.
Weiland, C., Steck, L., Dawson, P., and Korneev, V.: Nonlinear teleseismic tomography at Long Valley caldera, using three-dimensional minimum travel time ray tracing, J. Geophys. Res., 100, 20379–20390, https://doi.org/10.1029/95JB01147, 1995.
Wortel, M. J. R. and Spakman, W.: Subduction and slab detachment in the Mediterranean-Carpathian region, Science, 290, 910–917, 2000.
Zahorec, P., Papčo, J., Pašteka, R., Bielik, M., Bonvalot, S., Braitenberg, C., Ebbing, J., Gabriel, G., Gosar, A., Grand, A., Götze, H.-J., Hetényi, G., Holzrichter, N., Kissling, E., Marti, U., Meurers, B., Mrlina, J., Nogová, E., Pastorutti, A., Salaun, C., Scarponi, M., Sebera, J., Seoane, L., Skiba, P., Szűcs, E., and Varga, M.: The first pan-Alpine surface-gravity database, a modern compilation that crosses frontiers, Earth Syst. Sci. Data, 13, 2165–2209, https://doi.org/10.5194/essd-13-2165-2021, 2021.
ZAMG – Central Institute for Meteorology and Geodynamics: Province Südtirol, https://www.fdsn.org/networks/detail/SI/ (last access: 24 January 2022), 2006.
ZAMG – Zentralanstalt für Meterologie und Geodynamik: Austrian Seismic Network, https://doi.org/10.7914/SN/OE, 1987.
Zhao, L., Paul, A., Malusà, M. G., Xu, X., Zheng, T., Solarino, S., Guillot, S., Schwartz, S., Dumont, T., Salimbeni, S., Aubert, C., Pondrelli, S., Wang, Q., and Zhu, R.: Continuity of the Alpine slab unraveled by high-resolution P wave tomography, J. Geophys. Res.-Sol. Ea., 121, 8720–8737, https://doi.org/10.1002/2016JB013310, 2016.
- Abstract
- Introduction
- Data
- Methods
- Results
- Resolution tests
- Imaging the high-velocity perturbations in different tomography models
- Potential scenarios for geneses of the high-velocity heterogeneities
- Conclusions
- Code and data availability
- Team list
- Author contributions
- Competing interests
- Disclaimer
- Special issue statement
- Acknowledgements
- Financial support
- Review statement
- References
- Supplement