the Creative Commons Attribution 4.0 License.
the Creative Commons Attribution 4.0 License.
 | 17 Mar 2022
Late Quaternary faulting in the southern Matese (Italy): implications for earthquake potential and slip rate variability in the southern Apennines
Eugenio Auciello
Vincenzo Amato
Pietro Aucelli
Paola Petrosino
Anna C. Tangari
Brian R. Jicha
We studied the Gioia Sannitica active normal fault (GF) along the southern Matese fault (SMF) system in the southern Apennines of Italy in detail. The current activity of the fault system and its potential to produce strong earthquakes have been underestimated so far and are now defined here. Precise mapping of the GF fault trace on a 1:20 000 geological map and point and line data on the geometry, kinematics, and slip rate of the faults forming the SMF system are made available in electronic format. The GF, and the entire fault system along the southern Matese mountain front in general, is made of slowly slipping faults with a long active history revealed by the large geologic offsets, mature geomorphology, and complex fault patterns and kinematics. Present activity has resulted in late Quaternary fault scarps resurrecting the foot of the mountain front and Holocene surface faulting. The resurrected mountain front indicates variation in slip rate through time. The slip rate varies along-strike, with a maximum Upper Pleistocene–Holocene slip rate of ∼ 0.5 mm yr−1. Activation of the 11.5 km long GF can produce up to M 6.2 earthquakes. If activated together with the 18.5 km long Ailano–Piedimonte Matese fault (APMF), the seismogenic potential would be M 6.8. The slip history of the two faults is compatible with a contemporaneous rupture. The observed Holocene displacements on the GF and APMF are compatible with activations during some poorly constrained historical earthquakes, such as the 1293 (M 5.8), 1349 (M 6.8; possibly a southern prolongation of the rupture on the Aquae Iuliae fault), and 346 CE earthquakes. A fault rupture during the poorly constrained 847 CE earthquake is also chronologically compatible with the dated displacements.
- Article
(14518 KB) - Full-text XML
-
Supplement
(66889 KB) - BibTeX
- EndNote


Detailed field mapping of active faulting is essential for populating fault databases oriented at mitigating the seismic risk from ground shaking and fault displacement hazard (e.g. DISS Working Group, 2018; Styron and Pagani, 2020; Faure Walker et al., 2021; California U.S. Alquist-Priolo Earthquake Fault Zoning Act, https://www.conservation.ca.gov/cgs/alquist-priolo, last access: 30 July 2021; New Zealand Active Faults Database, https://data.gns.cri.nz/af/, last access: 30 July 2021; ITaly HAzards from CApable faults, ITHACA, http://sgi2.isprambiente.it/ithacaweb/, last access: 30 July 2021). The implementation of accurate fault mapping is particularly important in areas where geodetic or seismologic evidence of active tectonics contrasts with poor knowledge of active faulting from surface geology.

Figure 1Simplified tectonic map of the Matese area (southern Apennines) showing traces of Quaternary normal faults, epicentres of the largest historical earthquakes (from CPTI15, Rovida et al., 2020; from CFTI5Med for events before 1000 CE, Guidoboni et al., 2019; ∗ epicentre from Galli and Naso, 2009), and locations of the southern Matese fault system and Gioia Sannitica normal fault studied in this work. The mean extension direction in the inset is derived from orientations of GPS velocity vectors and T axes of focal mechanisms (modified from Boncio et al., 2016). Focal mechanisms are from the RCMT Catalogue (http://rcmt2.bo.ingv.it/, last access: 30 July 2021). In the inset map, the double arrows parallel to the Apennines indicate areas of seismic moment deficit (M ≥ 6.5) compared to tectonic (geodetic) strain accumulated in the last 500 years according to D'Agostino (2014); focal mechanisms refer to M ≥ 6.5 instrumental earthquakes, and circles are historical earthquakes with M ≥ 6.0 (CPTI15).
In the central and southern Apennines of Italy, presently stretching at rates of ∼ 3 mm yr−1 in the SW–NE direction, two areas were highlighted as being characterized by a significant deficit of seismic moment release for the last 500 years (D'Agostino, 2014; Fig. 1). Shortly after the characterization, one of the areas was struck by the 2016 central Italy normal faulting earthquakes on the Mt. Vettore–Mt. Bove normal fault (maximum Mw = 6.5; Chiaraluce et al., 2017; Civico et al., 2018). The second area extends for ∼ 80 km between the central and southern Apennines and includes a large part of the Matese mountains. In the Mt. Vettore–Mt. Bove area, paleoseismologic studies have demonstrated that the fault responsible for the 2016 earthquake ruptured repeatedly in prehistoric times, with an average recurrence interval of 1.8 ± 0.3 kyr, and that the penultimate earthquake occurred well before the historical catalogue (Cinti et al., 2019; Galli et al., 2019). Thus, the 2016 earthquakes demonstrate that the geology of active faults is equally as critical as historical seismicity for estimating the true seismic potential in areas characterized by low strain rates (velocities of a few millimetres per year) and long return periods of strong earthquakes (≥ M 6.5) such as the Italian Apennines. This has implications in seismic hazard assessments (e.g. Valentini et al., 2019).
In the Matese mountains, the geology of active faults is poorly constrained, with only two known active normal faults: the SW-dipping Aquae Iuliae fault and the NE-dipping northern Matese fault system (Di Bucci et al., 2005; Galli and Naso, 2009; Boncio et al., 2016; Ferrarini et al., 2017; Galli et al., 2017) (Fig. 1). To the SE, the activity of the Matese normal faults is less constrained. In a recent attempt to derive fault slip rates from geodetic data for the Matese area (Carafa et al., 2020), the results were not conclusive due to the sparseness of GNSS stations and the paucity of geologic constraints.

Figure 2(a) Oblique view of the southern Matese mountain front from a 5 m resolution digital elevation model (DEM) with traces of the Ailano–Piedimonte Matese (APMF) and Gioia Sannitica (GF) normal faults. (b) Detailed view of the GF fault trace, indicated by black arrows, on a 1 m resolution DEM from airborne lidar.
This paper focuses on the normal faults cropping out along the southern slopes of the Matese mountains, named the southern Matese fault system (SMF, Ailano–Piedimonte Matese and Gioia Sannitica faults; Fig. 2). The main goal is to determine if the SMF must be considered active and what its seismogenic potential and slip rate are. Attention is paid to evidence of slip rate variations. Discovering variations in the rate of activity is important for identifying the most appropriate time window for computing the average long-term slip rate and its variability, which in turn are crucial parameters for assessing earthquake recurrence and the associated seismic hazard (e.g. Cowie et al., 2012). There is evidence that slip rates vary in time for the active normal fault systems of the Italian Apennines (e.g. Benedetti et al., 2013; Cowie et al., 2017). Evidence of possible temporal slip rate variation along the SMF is suggested by paleoseismological data on the Aquae Iuliae fault (Galli and Naso, 2009), where the paleoseismology-derived throw rates (1.5–1.9 mm yr−1) are 3-to-4 times higher than the long-term throw rates estimated from offset of Middle Pleistocene terraces or from fault scarp morphology (after 230 ka to later than the Last Glacial Maximum throw rates of 0.2–0.5 mm yr−1; Boncio et al., 2016; Cinque et al., 2000; Galli and Naso, 2009). These differences open a question as to whether they are due to uncertainties in constraining the ages and offsets of geological and geomorphological markers or evidence of slip rate variations.
A tectonic geomorphology investigation of the mountain front along the SMF system (Ascione et al., 2018; Valente et al., 2019) highlights that in the last ∼ 600 ka the E–W-striking faults in the central part of the system are characterized by higher slip rate compared to the NW–SE-striking faults located at the western and eastern sides of the system, which are considered less active faults. Specifically, a higher mountain front maturity, interpreted as a consequence of low, waning fault activity, has been highlighted for the NW–SE-striking San Potito mountain front along the Gioia Sannitica fault, which is the fault studied in this work. The inferred low tectonic activity along the NW–SE San Potito mountain front described by Valente et al. (2019) appears to contrast with the presence of metre-scale fault scarps along the fault trace revealed by high-resolution topography that will be described in this paper, which might indicate recent surface faulting. These apparently contrasting observations might be an indication of recent fault reactivation or acceleration of a former low-slipping fault, which would imply slip rate variation through time.
We seek to answer the above questions by performing an earthquake geology study aimed at mapping the fault traces in detail, collecting field evidence of recent activity (particularly Upper Pleistocene–Holocene activity), looking for evidence of earthquake-related surface faulting episodes, and combining all the collected data in a consistent seismotectonic frame for estimating the likely earthquake potential. We start studying the geology of the Gioia Sannitica normal fault in detail for the reasons introduced above and because this is the least constrained fault of the system. The results are described in Sect. 4, and a detailed, 1:20 000-scale geologic map of the Gioia Sannitica normal fault is attached as Plate S1 in the Supplement. Fault scarp heights are recognized, carefully selected to avoid scarps of non-tectonic origin, measured using high-resolution topography, and used to derive fault slip rates. In Sect. 4.2, we describe evidence of Holocene surface faulting discovered on both the Gioia Sannitica and Ailano–Piedimonte Matese faults. For the first time, we show clear evidence of late Quaternary and Holocene faulting, thanks to detailed field analyses of fault zones in Quaternary sediments and radioisotopic dating (14C and ) of faulted sediments. In Sect. 5, we integrate our new data with data from previous geological studies on the Ailano–Piedimonte Matese fault (Boncio et al., 2016). Our results are then discussed in the light of the study by Valente et al. (2019). Finally, the new and pre-existing data are discussed together in terms of present activity, overall seismogenic potential, and slip rate variability of the SMF system.
2.1 General geologic setting
The Matese mountains form a 20 km wide, 50 km long massif of carbonate rocks elongated in the NW–SE direction in the northern part of the southern Apennines of Italy. The massif has a maximum elevation of about 2000 and is delimited to the NE by the Bojano depression and to the W and SW by the valley of the Voltuno River (Venafro and Alife depressions). This morphologic setting is largely due to Quaternary extensional tectonics and down-faulting along NE-dipping and SW-dipping normal faults that border the massif to the NNE and the SSW, respectively (Aucelli et al., 2013; Amato et al., 2014; Ascione et al., 2018; Valente et al., 2019).
The Matese massif is made up of successions of Meso-Cenozoic carbonate rocks with sedimentary facies varying from a shallow-water carbonate platform in the south to bypass margin and slope-to-basin transition facies in the north. The arrangement of the Meso-Cenozoic sedimentary facies was controlled by Jurassic normal faults, striking mostly E–W, which determined the progressive transition from a persistent structural high in the central and southern Matese mountains to deep basin conditions in the northern Matese mountains (Calabrò et al., 2003; Valente et al., 2019). The Cretaceous, Jurassic, or Triassic carbonate successions are covered discontinuously by Upper Miocene hemipelagic and turbiditic siliciclastic deposits related to the Apennine orogeny (D'Argenio et al., 1973; Di Bucci et al., 1999; Patacca and Scandone, 2007 with references).
Upper Miocene–Pliocene Apennine compression deformed the Meso-Cenozoic units via NE-directed shortening, generating S-dipping reverse faults and NNE-to-N-verging folds and monoclines. The geometry of compressional structures was largely conditioned by the pre-existing E–W faults. The Mio-Pliocene compressional structures are post-dated by Quaternary high-angle normal faults. Normal faulting has dissected the western side of the Matese mountains since the Early Pleistocene, produced a massive deposition of slope-derived breccias, and formed the Venafro and Alife depressions along the Volturno River valley (Ferranti et al., 1996; Brancaccio et al., 1997; Calabrò et al., 2003). The early stages of crustal extension (Early–Middle Pleistocene) were characterized by the formation of major SW–NE-trending structures such as the Garigliano graben, which hosts the Roccamonfina volcano west of the Matese ridge, and the Venafro basin on the northwestern side of the Matese. There is also evidence of Middle Pleistocene volcaniclastic sediments faulted by SW–NE-striking normal faults originating during this phase of NW–SE-oriented extension (Amato et al.., 2014, 2017; Boncio et al., 2016). During this stage, inherited E–W-striking Mesozoic normal faults were reactivated with left-lateral normal-oblique kinematics (Boncio et al., 2016).
After the NW–SE-directed extension, normal faulting driven by SW–NE extension became dominant in the Middle Pleistocene, generating major NW–SE-striking faults and reactivating pre-existing normal and strike-slip faults across the entire Matese area (Ferranti et al., 1996; Calabrò et al., 2003; Di Bucci et al., 2005; Amato et al., 2014). Overall, five major depressions originated due to normal faulting: the Venafro and Alife depressions to the W and SW, the Isernia and Bojano depressions to the N and NE, and the Matese Lake depression in the core of the Matese massif (Fig. 1). The Quaternary extension was accompanied by accumulation of continental deposits within the depressions and along the mountain fronts, including Pleistocene slope-derived breccias, lacustrine and alluvial deposits, and large Middle Pleistocene to Holocene alluvial fans (Brancaccio et al., 1997; Di Bucci et al., 2005; Amato et al., 2014; Valente et al., 2019). Middle Pleistocene sediments often contain pyroclastic horizons, mostly deriving from the nearby Roccamonfina stratovolcano (0.55–0.15 Ma activity; Luhr and Giannetti, 1987; Rouchon et al., 2008) and from the Campanian Volcanic Zone (Rolandi et al., 2003), including the Campanian Ignimbrite (39 ka) and the Neapolitan Yellow Tuff (15 ka) (De Vivo et al., 2001; Deino et al., 2004; Giaccio et al., 2017).
2.2 Quaternary tectonics
Three main normal fault systems can be mapped in the Matese area (Fig. 1): (1) the NE-dipping northern Matese fault system, (2) the SW-dipping Aquae Iuliae and Gallo–Letino–Matese Lake fault systems in the central Matese, and (3) the SW-dipping SMF system. The Presenzano–Ailano fault system connects the SMF with the SW-dipping San Pietro Infine fault and allows extensional strain to be transferred to the west (Boncio et al., 2016).
Late Quaternary faulting and Holocene surface faulting associated with historic or pre-historic earthquakes are known for the northern Matese fault system (Galli and Galadini, 2003; Di Bucci et al., 2005; Ferrarini et al., 2017; Galli et al., 2017) and for the Aquae Iuliae fault (Galli and Naso, 2009; Boncio et al., 2016). For the Gallo–Letino–Matese Lake fault system, evidence of post-compressional Quaternary faulting has been documented using structural geology and tectonic geomorphology analyses (Bousquet et al., 1993; Calabrò et al., 2003; Aucelli et al., 2013; Valente et al., 2019).
The SMF can be divided into the Ailano–Piedimonte Matese fault to the NW, and the Gioia Sannitica fault to the SE (Boncio et al., 2016). The 18 km long Ailano–Piedimonte Matese fault is in turn divided into the Raviscanina and Piedimonte Matese fault sections (Fig. 2). The Raviscanina section is 11.5 km long, strikes NW–SE, and progressively bends ∼ W–E in the southern part (∼ 1 km SE of Sant'Angelo d'Alife village). The Piedimonte Matese fault section is 7 km long and strikes from W–E to WSW–ENE. The eastern part of the Piedimonte Matese fault section, striking ∼ W–E, has strong geomorphic evidence of Quaternary activity, while in the western part, striking WSW–ENE, there is less evidence due to cover deposits and larger mountain front sinuosity.
Along the Raviscanina section of the Ailano–Piedimonte Matese fault, a later than 350 ka throw rate of 0.27–0.30 mm yr−1 has been documented by Boncio et al. (2016). The strongest geomorphic evidence of late Quaternary faulting is in the southern part of the section, close to the bend, where late Quaternary throw rates of ≥ 0.15 mm yr−1 have been estimated. Boncio et al. (2016) suggest that the entire SMF may be presently active and possibly responsible for the 346 CE earthquake.
Valente et al. (2019), integrating a previous study by Ascione et al. (2018), performed a tectonic geomorphology and Quaternary stratigraphy analysis of the SMF mountain front, including the system of alluvial fans along the mountain front and the sedimentary basin in the hanging wall (Alife basin). The authors divide the SMF into the Raviscanina–Piedimonte Matese front (RPf in their Fig. 1) and San Potito Sannitico front (SPf in their Fig. 1). The Raviscanina–Piedimonte Matese front does not coincide with the Ailano–Piedimonte Matese fault previously defined in Boncio et al. (2016), as they do not consider the northern, NW–SE-striking fault strand near Ailano. The San Potito Sannitico front corresponds to the northern half of the Gioia Sannitica fault.
In their study, Ascione et al. (2018) and Valente et al. (2019) show that the geomorphology of the SMF front varies along-strike. The shape of the mountain front changes from convex in the Raviscanina area, to rectilinear in the Piedimonte Matese area, and then to concave in the San Potito area. The calculated mountain front sinuosity (from 1.53 to 1.64) seems to indicate relatively slow mountain front activity (Bull, 1987), with values that are lower in the Raviscanina–Piedimonte Matese front (1.53) compared to the San Potito Sannitico front (1.64). The morphometry and the degree of entrenching of the alluvial fans is consistent with a higher tectonic subsidence in the Raviscanina–Piedimonte Matese front compared to the San Potito Sannitico front. In summary, the authors suggest that there is an increase in the maturity of the mountain front moving from NW (Raviscanina) to SE, due to an evolution of the SMF since ∼ 600 ka that determined a differentiation of the activity rate of the central part of the system compared to the faults at the eastern and western sides of the system. In particular, the Raviscanina–Piedimonte Matese front, that in their final model is thought to be a main fault with average E–W strike, is considered to have the highest activity, while the NW–SE San Potito Sannitico front is considered to have a lower, waning activity rate. For the Raviscanina–Piedimonte Matese mountain front, they estimated a post-Middle Pleistocene throw rate of >0.2–0.3 mm yr−1.
2.3 Seismicity
Several strong earthquakes struck the Matese region during the last 2 millennia (M 7.0 in 346 CE; M 5.6 in 847 CE; M 5.8 in 1293 CE; M 6.8 in 1349 CE; M 7.2 in 1456 CE; M 7.1 in 1688 CE; and M 6.7 in 1805 CE; Guidoboni et al., 2019; Rovida et al., 2020; Fig. 1). The NE-dipping northern Matese faults were responsible for the 1805 CE earthquake in the Bojano area (Espostito et al., 1987; Porfido et al., 2002; Cucci et al., 1996; Galli and Galadini, 2003; Serva et al., 2007) and possibly for the first shock of the 1456 CE earthquake sequence (Galli and Galadini, 2003), even though a different interpretation has been proposed for the latter event (Fracassi and Valensise, 2007).
The location of the ancient 847 CE earthquake is highly uncertain. In the CFTI5Med catalogue (Guidoboni et al., 2019) it is located north of the Matese massif, near Isernia. According to Bottari et al. (2020), the macroseismic area could be larger, and the source is thus located significantly SW of the CFTI5Med epicentre, possibly on the Aquae Iuliae fault, as suggested by Galli and Naso (2009), or on the SMF system.
The 1349 CE earthquake has been associated with the SW-dipping Aquae Iuliae fault on the basis of paleoseismologic investigations (Galli and Naso, 2009), while the sources responsible for the 1293 and 1688 CE earthquakes in the southern Matese are still unknown (1293 CE) or poorly constrained (1688 CE; Di Bucci et al., 2006; Serva et al., 2007). A strong ancient earthquake is known to have seriously damaged the area E, W, and SW of the Matese massif in 346 CE (Galadini and Galli, 2004), but the causative fault is unknown. Only hypothetical associations to the Aquae Iuliae fault (Galli and Naso, 2009) or to the SMF system (Boncio et al., 2016; Valente et al., 2019) have been proposed.
Since 1980 CE, there have been no strong earthquakes associated with a fault in the southern Matese. The largest recorded earthquake occurred in 2013 CE (Mw 5.2) within the core of the southeastern Matese massif at a depth of 10–20 km (Ferranti et al., 2015). The focal mechanism indicates normal faulting on NW–SE-striking normal faults, nearly parallel to the normal faults mapped at the surface, but its association to the down-dip prolongation of the outcropping faults is not clear. A small-magnitude event occurred in 2016 CE (Mw 4.1), ∼ 10 km NE of the northern Matese fault system at depths shallower than ∼ 10 km. The 2013 and 2016 earthquakes share a common SW–NE-oriented direction of extension, which is consistent with directions obtained from structural geology of late Quaternary normal faults (Ferranti et al., 2015; Boncio et al., 2016; Ferrarini et al., 2017) and GPS data (Ferranti et al., 2014; D'Agostino, 2014; Carafa et al., 2020).
Table 1Summary of experiments.
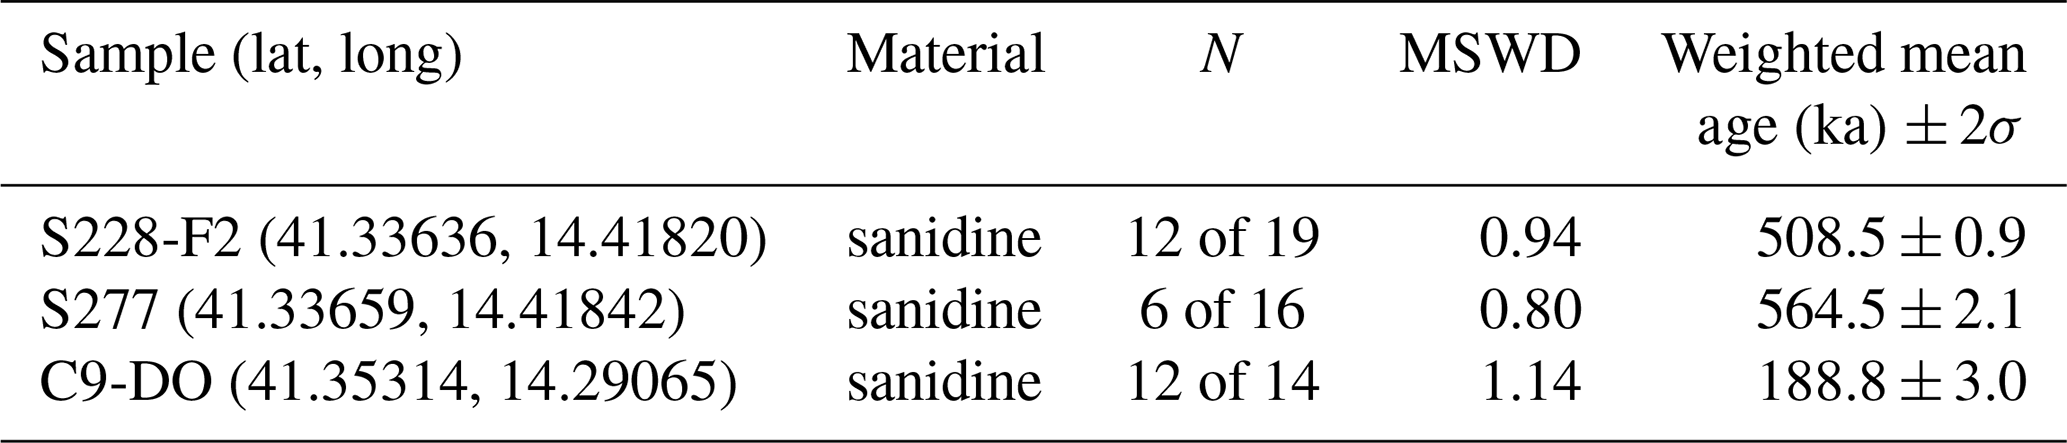
Ages calculated relative to 1.1864 Ma Alder Creek sanidine (Jicha et al., 2016) using decay constants of Min et al. (2000). Uncertainties are shown at a 95 % confidence level
3.1 Field mapping and fault scarp measurements
Geological mapping was based on a traditional field survey supplemented with a digital survey on a GPS-integrated digital mapping suite (Field Move Software Suite, Petroleum Experts). The topographic maps in digital format were made available by the Campania Regional authority (Carta Tecnica Regionale, CTR; this is the Italian name and acronym for the 1:5000 scale topographic map of the Campania Region). The fault traces and Quaternary units were mapped on a 1 m resolution digital elevation model (DEM) from airborne lidar made available by the Italian Ministry of Environment. The lidar DEM was used to extract topographic profiles across fault scarps for measuring throw values. Particular attention was paid to the identification of appropriate sites for scarp analysis, which were selected in order to avoid anthropogenic modifications or erosional processes that might determine non-tectonic exhumation of the fault. Throw and slip rates across the measured fault scarps were estimated using the age constraints of faulted sediments and morphologies from the site or from nearby correlated sites.
Two sites were analysed using a paleoseismologic approach. They are two outcrops of fault zones exposed by a road cut across the Gioia Sannitica fault splays and a small hand-dug trench (∼ 3 m long, ∼ 1 m deep) located in the vicinity of an outcropping limestone fault plane of the Raviscanina fault section of the Ailano–Piedimonte Matese fault.
3.2 Sample dating
Three tephra layers interbedded within faulted alluvial fan and colluvial sediments were sampled for lithological analysis and dating. Samples were mostly extracted from deeply argillified, slightly indurated to lithified deposits. In the scanning electron microscopy laboratory of DiSTAR – University of Naples “Federico II”, they were repeatedly washed in deionized water in order to remove the clay fraction, then treated with at least four 10 min long ultrasonic washing with renewal of water. The clasts were dried and sieved at 1 phi intervals, and finally a lithological component analysis was carried out on the 1 and 2 phi fractions under a binocular microscope. Unfortunately, no well-preserved glass fragment survived washing pre-treatment, and hence chemical composition of glass, useful for tephrostratigraphic analysis, could not be achieved. The coarsest and best preserved sanidine phenocrysts were extracted from the three samples for dating. Single crystal fusions were performed at the University of Wisconsin-Madison. Isotopic analyses were conducted using a Noblesse multi-collector mass spectrometer (Jicha et al., 2016). The weighted mean ages listed in Table 1 are calculated relative to the 1.1864 Ma Alder Creek sanidine standard. Complete analytical data are provided in Table S1 in the Supplement.
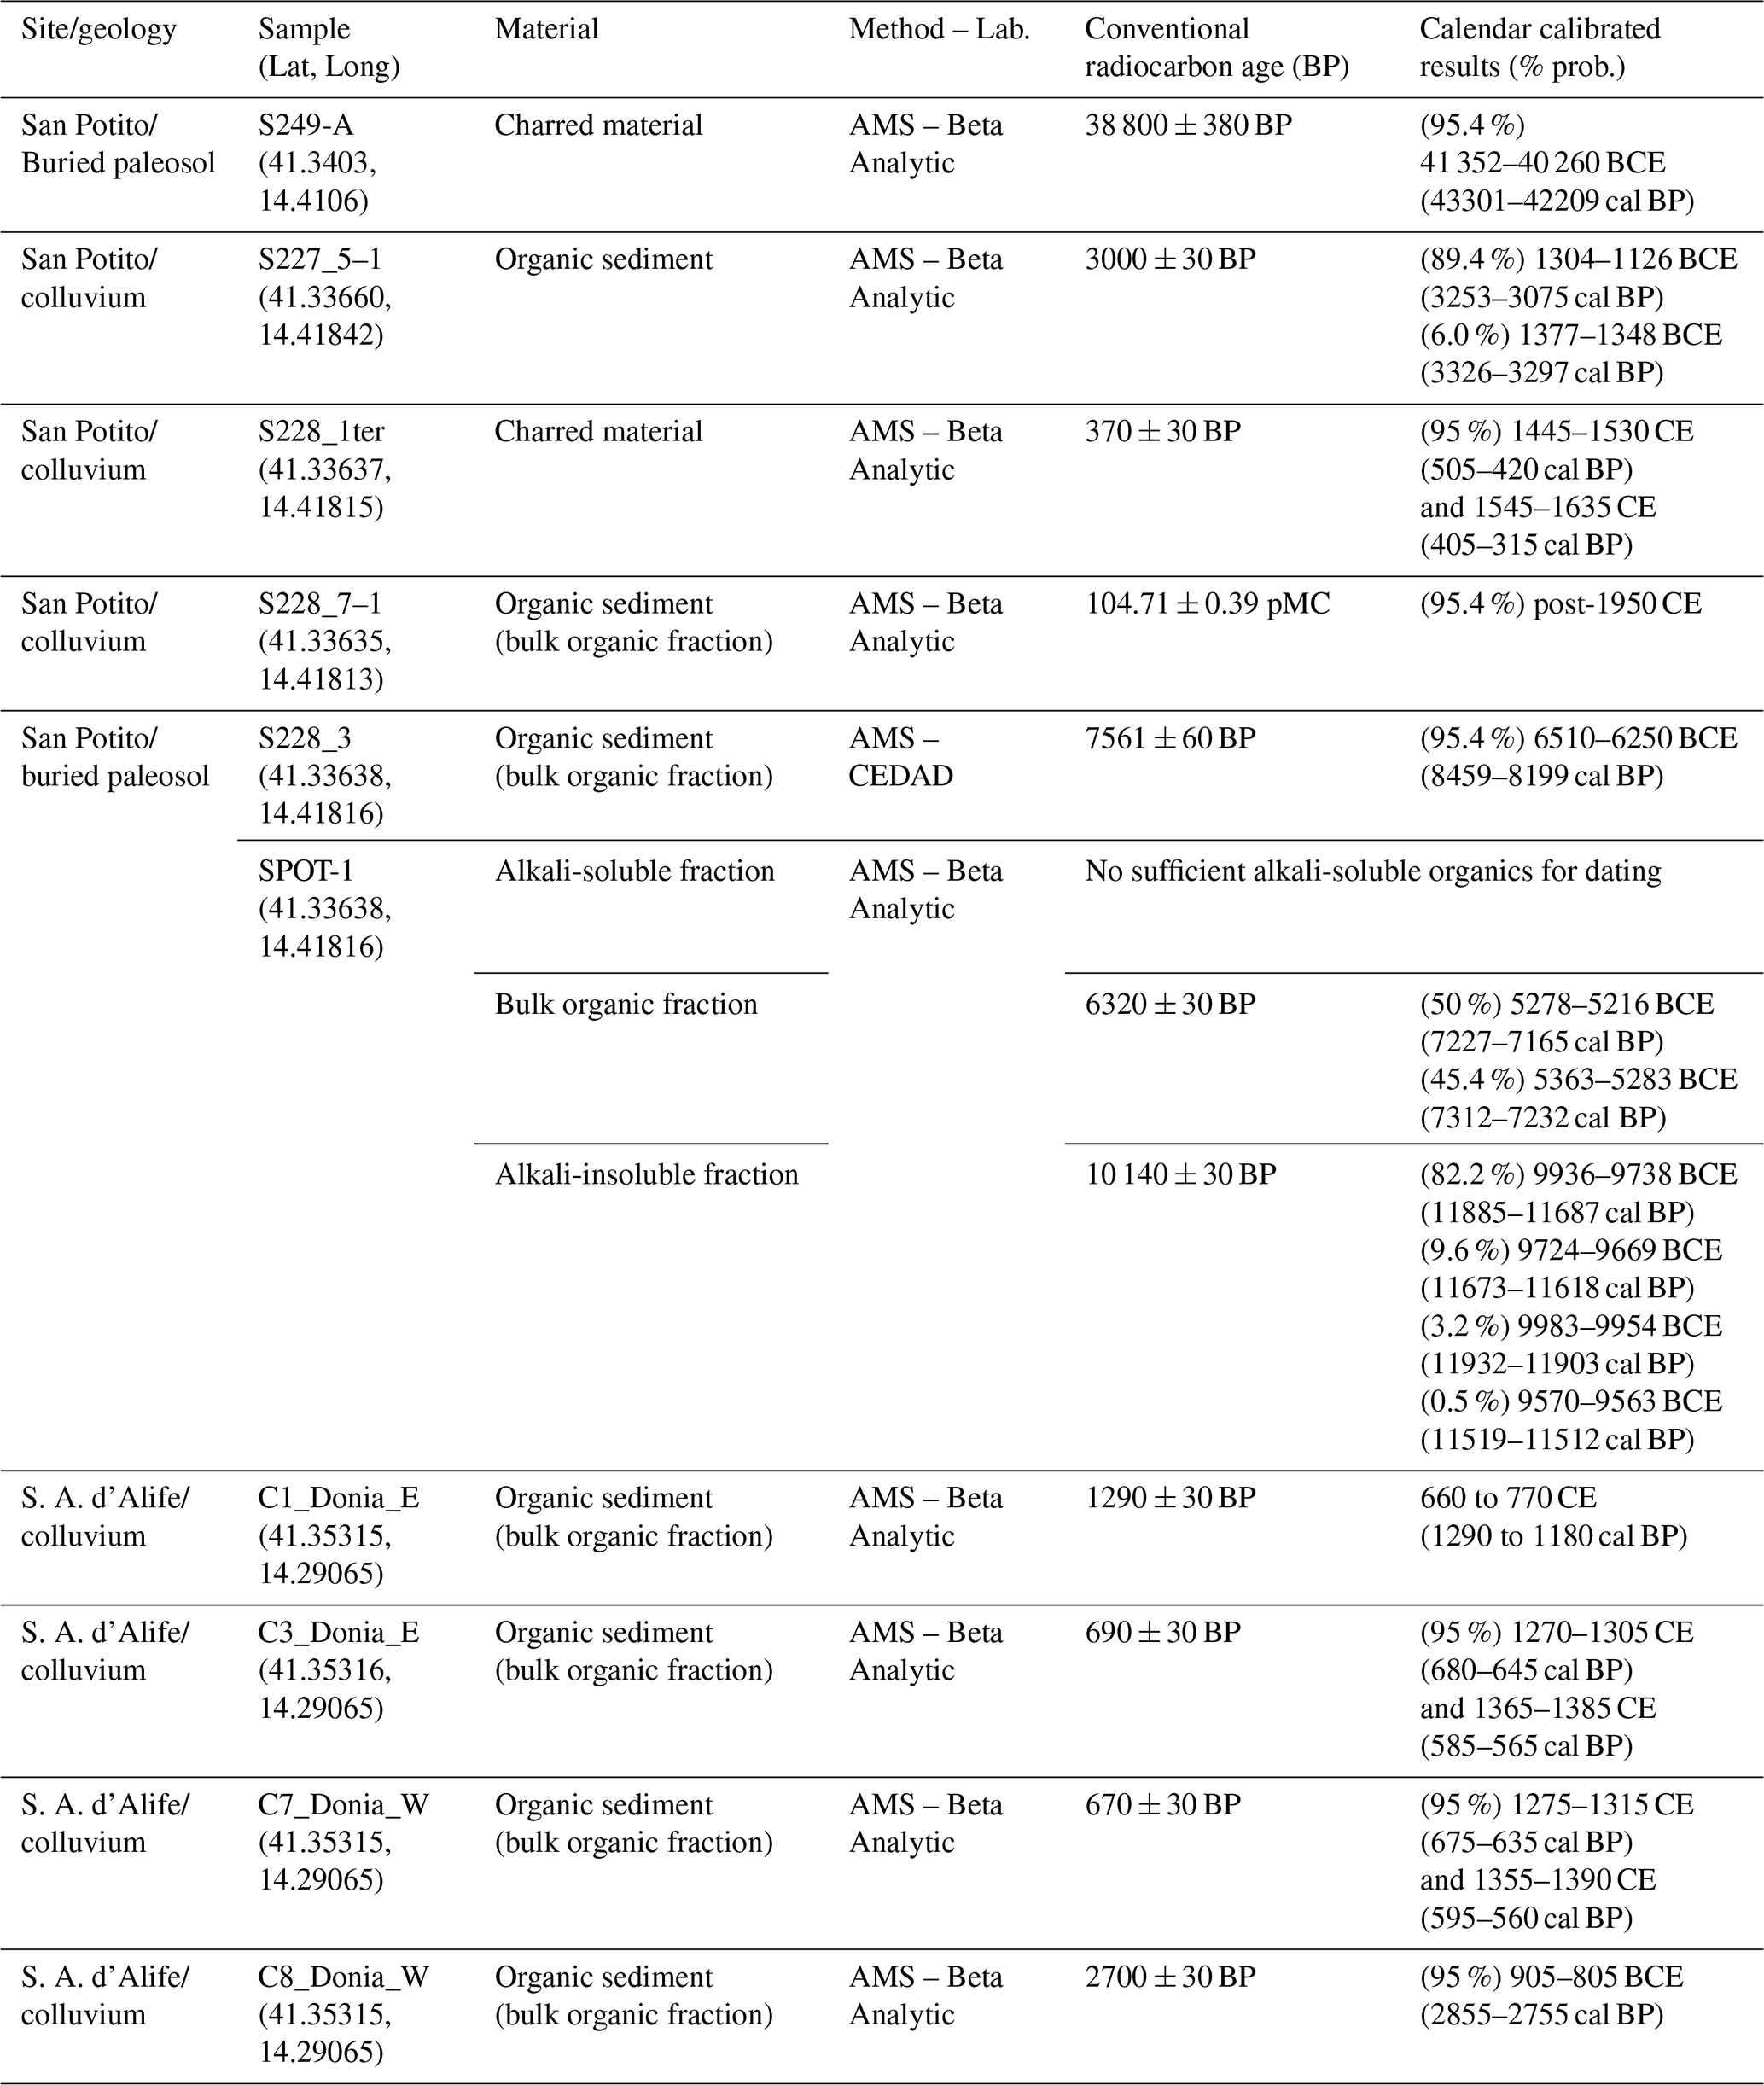
The radiocarbon dating was performed on charred material or bulk organic sediments using an accelerator mass spectrometry (AMS) technique in the laboratories of Beta Analytic (https://www.radiocarbon.com/, last access: 29 October 2021) and CEDAD (Italy, http://www.cedad.unisalento.it/en/, last access: 30 July 2021) (Table 2). For the buried paleosol faulted by the Gioia Sannitica fault (samples S228_3 and SPOT-1 in Table 2), given its importance for constraining the Holocene activity of the fault and in order to verify the occurrence of possible contamination by young carbon, we dated the alkali-soluble organic fraction, the bulk organic fraction, and the alkali insoluble fraction in the Beta Analytic laboratory for one sample (SPOT-1; details of the method can be found at https://www.radiocarbon.com/ams-dating-sediments.htm, last access: 29 October 2021). The complete reports of the radiocarbon dating analyses are in Annex S1 in the Supplement.
3.3 Paleosol analysis
The paleosol faulted by the Gioia Sannitica fault, which developed on altered tuff, was analysed at the University of Chieti for morphology and geochemistry. Physical and chemical analyses (soil texture, pH (H2O), organic matter content, and cation exchange capacity (CEC)) were performed on an air-dried and sieved (< 2 mm) fraction of the bulk sample of each soil horizon (van Reeuwijk, 2002; Burt, 2004). Micro-morphological observations were made on thin sections (10 cm × 5 cm × 30 µm) from undisturbed soil samples. Selective extraction techniques were used to determine different forms of Al, Fe, and Si such as acid ammonium oxalate extractable Alo, Feo, and Sio (Schwertmann, 1964); sodium pyrophosphate extractable Alp (Bascomb,1968); and dithionite–citrate–bicarbonate extractable iron pool Fed (Mehra and Jackson, 1960). Their amount was measured using atomic absorption spectroscopy (AAS) on the fine earth fraction (< 2 mm). The total iron content, Fet, was analysed using a Rigaku Supermini X-ray fluorescence (XRF) spectroscopy. These data were used to calculate pedogenetic indices, shown in Table S2 in the Supplement, to estimate the andic properties of the paleosol (ICOMAND, 1988; Parfitt and Wilson, 1985; Tangari et al., 2018) and the degree of soil maturity (e.g. Arduino et al., 1984; Scarciglia et al., 2018).
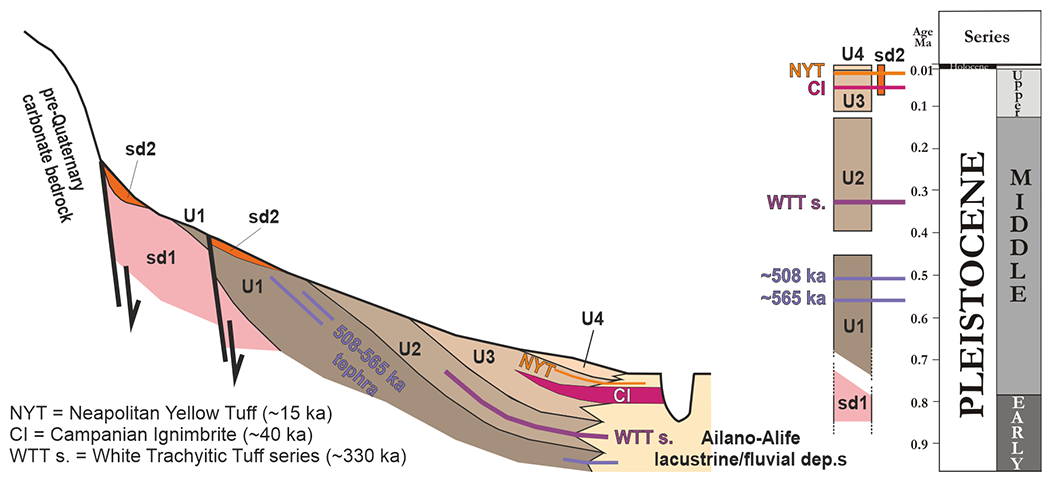
Figure 3Schematic morpho-stratigraphic relations and ages of the Quaternary units in the hanging wall of the Gioia Sannitica normal fault (southern Matese fault system). The lithology of the units is described in the text (see Sect. 4.1.1.) and in Plate S1.
4.1 Geology of the Gioia Sannitica normal fault from field mapping
The Gioia Sannitica normal fault (GF) has been mapped in detail along the piedmont of the southern Matese ridge (Fig. 2). A detailed geologic map with cross sections is available as Plate S1. Plate S1 contains the synthetic stratigraphic logs of numerous shallow-depth drill holes used to constrain the Quaternary stratigraphy. The fault can be divided into two fault sections on the basis of fault geometry, Quaternary geology, and geomorphology of the hanging wall and footwall blocks: the San Potito section to the north and the Castello di Gioia section to the south.
4.1.1 Geomorphology and stratigraphy of the southern Matese piedmont along the GF
The GF has created a mountain front along the foot of the southwestern slopes of the Matese carbonate ridge that strikes on average 130∘ in the northern part (San Potito fault section) and 155∘ in the southern part (Castello di Gioia fault section) of the fault region, with a ∼ 2 km wide embayment between these two areas (Mount Erbano embayment; Fig. 2). The range slopes moderately (25–40∘) down to the mountain front without sharp and steep faceted spurs. The slope profile is straight to concave (see Fig. 2 and geologic sections in Plate S1), suggesting a range front that is not very active or that has a low uplift rate, as already suggested by Valente et al. (2019). However, low linear scarps at the mountain front rise from the gently dipping slopes, indicating recent rejuvenation due to normal faulting (Fig. 2b).
Different generations of entrenched and superimposed alluvial fans and slope deposits accumulated in the hanging wall of the GF. Alluvial fans cover the bedrock units in the hanging wall of the GF in the northern part (San Potito section), where the top surfaces of alluvial fans slope gently to the SW down to the adjacent Alife plain. Isolated outcrops of carbonate or siliciclastic pre-Quaternary bedrock arise from the piedmont, suggesting that the alluvial fans prograded into a morphologically articulated substratum. The hanging wall of the Castello di Gioia section is in general less depressed than its San Potito counterpart. Continental deposits are less diffuse and are confined closer to the fault trace.
The morpho-stratigraphic relations among the mapped Quaternary units are shown in Fig. 3. The unit ages are based on volcanic layers and buried paleosols dated in this work, integrated with chronologic determinations in the Ailano–Piedimonte Matese continental succession from previous works (Boncio et al., 2016; Valente et al., 2019) and regional-scale correlations with the Quaternary basins around the Matese massif (Brancaccio et al., 1997; Amato et al., 2014, 2017). We have distinguished two generations of slope-derived deposits (units sd1 and sd2) and four generations of alluvial fan deposits (units U1, U2, U3 and U4), interfingering with coeval fluvial (al) or lacustrine (lac) deposits in the Volturno River plain.
Units sd1 and U1 are made up of carbonate slope-derived breccias and dense to poorly cemented alluvial fan gravels, respectively. Slope breccias crop out only at the base of carbonate slopes, often faulted against the Triassic dolostones. From a sedimentological point of view, these deposits can be correlated with the Early–Middle Pleistocene slope-derived breccia cropping out widely along the fault-controlled range front in the Volturno River valley, Venafro basin, Prata Sannita area (Brancaccio et al., 1997; Amato et al., 2017), and Letino–Matese lake area (Aucelli et al., 2013) (Fig. 1). Specifically, the oldest mapped deposits are the well-cemented angular breccia of unit sd1, which can be reasonably correlated with the Early Pleistocene slope breccias of the Laiano Synthem (Carannante et al., 2011), as described by Amato et al. (2018) in the Calore River area, which is about 20 km SE of the GF.
In the upper part of the U1 alluvial fan gravels, we sampled two layers of distal tephra containing altered leucite-bearing pumice fragments and sanidine crystals that gave ages of 564.5 ± 2.1 ka (sample S-227; Table 1) and 508.5 ± 0.9 ka (sample S228-F2) (samples located in the San Potito site of Fig. 2b; see Sect. 4.2.1); see Table S1 for the complete dataset. Sample S-AIL12 of Valente et al. (2019) from the Ailano area (along the southern Matese mountain front), attributed to the early stages of activity of the Roccamonfina volcano, gave a 564.9 ± 2.4 ka age, which corresponds well with the age of 564.5 ± 2.1 ka found here for sample S227. Unit U1 is hence coeval, at least in part, with the Ailano lacustrine deposits (Valente et al., 2019) and can be correlated with the lacustrine fluvial unit MU1 described in the Venafro basin, about 30 km NW of the GF, by Amato et al. (2017), who dated the upper part of the unit to ∼ 475 ka. Therefore, based on tephra ages and regional correlations, the succession formed by units sd1 and U1 can be considered to be part of the Early Pleistocene to Middle Pleistocene (older than ∼ 450 ka), with sd1 and U1 possibly being heteropic to each other in the lower part of the succession (Fig. 3).
Unit U2 is made up of heterometric carbonate alluvial fan gravels in a brown silty-sand matrix with interlayers of decimetre-thick dark brown leucite-free tuffs and thicker pedogenic layers that have been observed in the field and in numerous boreholes (Plate S1). In the light of their stratigraphic position (younger than U1 unit) and the fact that low-K series leucite-free explosive products of the 35 km distant Roccamonfina volcano are younger than at least 385 ka (Brown Leucitic Tuff, Luhr and Giannetti, 1987), these leucite-free tuffs can be tentatively ascribed to the White Trachytic Tuff series (De Rita and Giordano, 1996). Thus, the age of this unit can be seen to reasonably range from the Middle to Upper Pleistocene.
Units sd2 and U3 comprise slope-derived colluvial and alluvial fan gravel deposits, respectively. Colluvial deposit sd2 (Upper Pleistocene–Holocene) is made up of poorly organized gravels in a brown sandy matrix with dark silty-sand pedogenic layers. A buried paleosol cropping out ∼ 1.4 km ENE of San Potito Sannitico within the colluvial unit has been dated at 43.3–42.2 ka (see Table 2), thus indicating that a large part of the colluvial gravels accumulated during the glacial periods of Upper Pleistocene. Unit sd2 includes thin layers of Holocene colluvial deposits accumulated mostly in the hanging wall and in proximity of the GF trace (see Sect. 4.2.1). Alluvial fans of unit U3 (Upper Pleistocene) are formed by prevailing medium grain-sized carbonate gravel, matrix- to grain-supported, with textural and structural characters of debris and hyperconcentrated flows. The unit contains reworked tephra layers and paleosols developed on pyroclastic materials ascribed to Neapolitan volcanoes active during the Late Pleistocene (Leone, 2016; Amato et al., 2018). In general, they show a better organization than the deposits of older generations. In some cases, they are deposited within the entrenchment of older fans, forming terraced deposits. The U3 alluvial fans slope gently down to the Alife plain, and the distal fans interfinger with the alluvial deposits of the Volturno River, which contain the ∼ 40 ka Campanian Ignimbrite (Valente et al., 2019).
Unit U4 is made up of Holocene small alluvial fans formed by heterometric calcareous gravel and sandy gravel. In the distal part, the fan gravels have decreasing clast size, are supported by sandy matrix, and contain paleosols and archaeological remains.
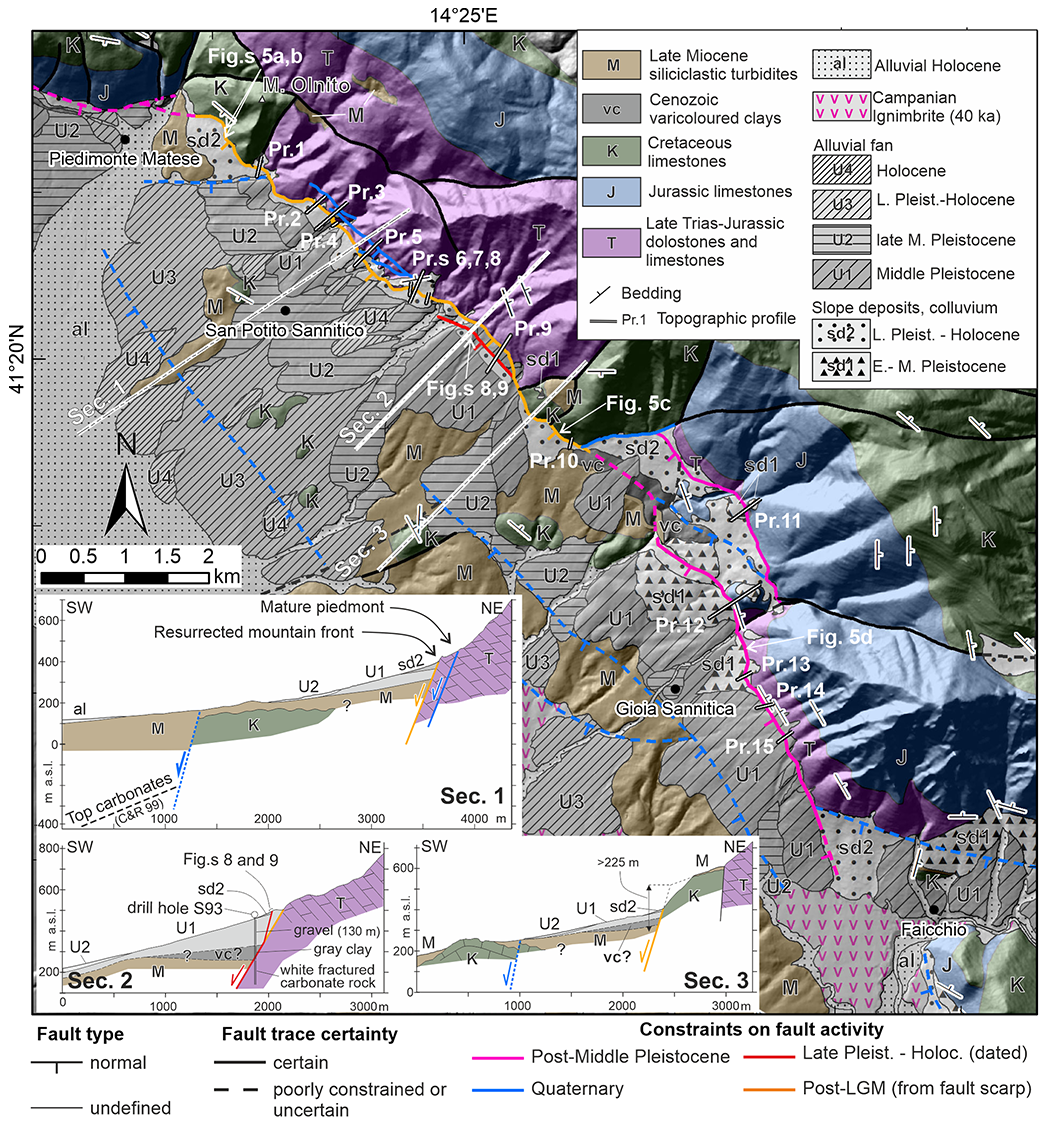
Figure 4Geologic map of the Gioia Sannitica normal fault (additional details and cross sections in Plate S1). In Sect. 1 of this figure, C&R 99 stands for Corniello and Russo (1999). Fault traces are represented with different colours indicating different age constraints on fault activity derived from all the data collected in this work (discussed in the dedicated Sect. 5.2).
4.1.2 Geometry, kinematics, and fault scarp morphology
The GF extends from the Piedimonte Matese town to the southwestern slopes of Mount Monaco di Gioia for a total length of ∼ 11.5 km (Fig. 4). The northern San Potito fault section is ∼ 5.5 km long. The southern Castello di Gioia fault section is ∼ 3.5 km long. A ∼ 2 km long subdued fault scarp connects the San Potito and Castello di Gioia sections across the Mount Erbano embayment. A sharp bend from the NW–SE to ∼ W–E direction connects the GF with the Ailano–Piedimonte Matese fault. To the south, a ∼ 1 km wide gap separates the GF from a SW-dipping normal fault (which has only poor geomorphic evidence of recent activity) that delimits the small Mount Acero carbonate ridge to the west (Fig. 2).
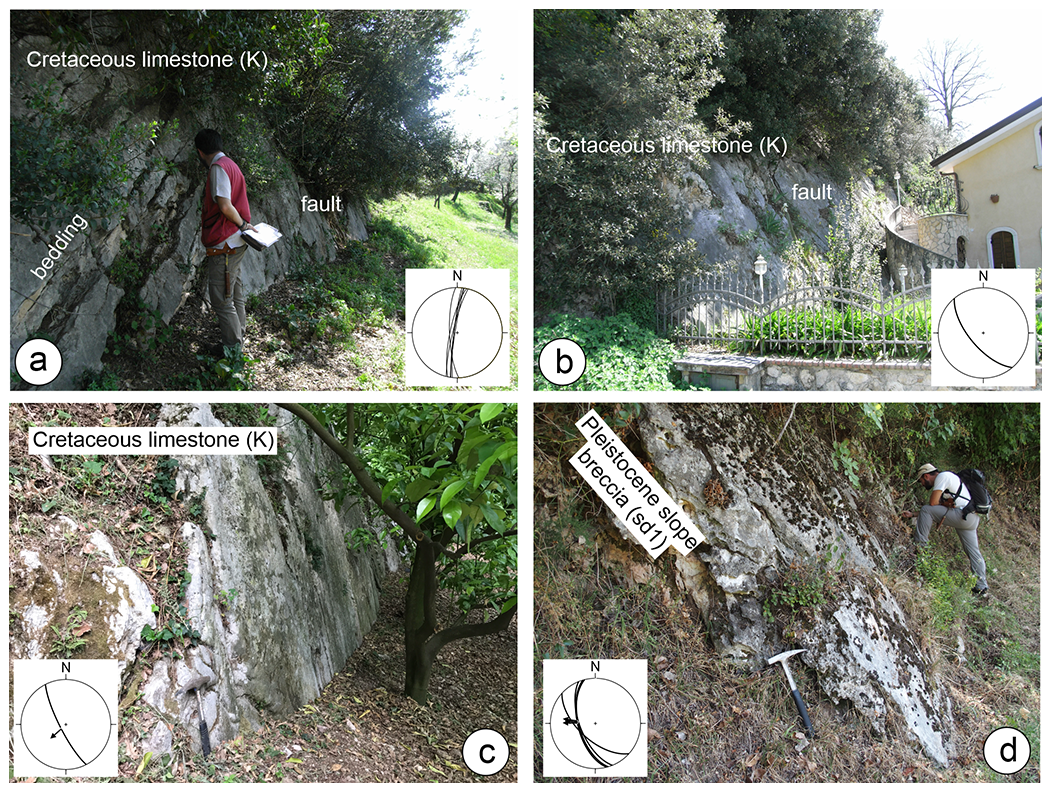
Figure 5Field view of the Gioia Sannitica normal fault on carbonate bedrock (a–c; San Potito fault section) and on Quaternary breccia (c; Castello di Gioia fault section). The location of these images is marked in Fig. 4.
San Potito fault section
The average strike of the San Potito section is 130∘. When viewed in more detail, it can be seen that the fault trace is formed by longer strands striking NW–SE that are separated by short strands where the fault bends ∼ W–E. Striated fault planes at the base of carbonate scarps crop out discontinuously in the northern, central, and southern parts of the fault trace (Fig. 5a–c). The slip vectors plunge to the SW and SSW, determining normal dip-slip to left-lateral normal-oblique kinematics. Close to the southern part of the fault section (Fig. 4, south of Fig. 5c), the fault bends E–W and the kinematics is normal with right-lateral component (WSW-plunging slip vectors) (see Table S3 in the Supplement for the structural data).
The fault displaces Late Miocene siliciclastic deposits, containing a lithological unit of varicoloured clays (sensu Vitale and Ciarcia, 2018), against the Cretaceous or Late Triassic–Jurassic carbonate bedrock (Fig. 4 and Plate S1). The geological displacement is likely very large, but the amount of vertical throw cannot be precisely constrained, as the Miocene siliciclastic rocks unconformably overlie Cretaceous or Jurassic carbonate rocks, indicating that the pre-Miocene bedrock was already faulted, and the morphology already articulated at the time of the Miocene siliciclastic sedimentation. Pre-Miocene faulting occurred on faults striking from SW–NE to ∼ W–E. It is also likely that NW–SE-striking normal faults, including the GF itself, were already formed before the Miocene siliciclastic sedimentation, as evidenced by the different pre-Miocene bedrock in the hanging wall and footwall blocks of the GF fault (Cretaceous in the hanging wall and Late Triassic–Jurassic in the footwall; see geologic map and sections in Plate S1). Therefore, the total displacement was accumulated both before and after the Late Miocene. A throw of > 225 m, postdating the base of the Late Miocene siliciclastic deposits, can be estimated in the southern part of the San Potito fault section (cross section 3 in Fig. 4). In the same area, Early (?) Pleistocene slope breccia (sd1, close to cross section 3 in Fig. 4) hang 75–100 m upslope from the fault trace in the footwall, thus indicating that throw > 75–100 m was accumulated in the Quaternary. In the central part of the fault, the total throw is estimated to be > 1000 m (cross section C–C' in Plate S1; Fig. 4).
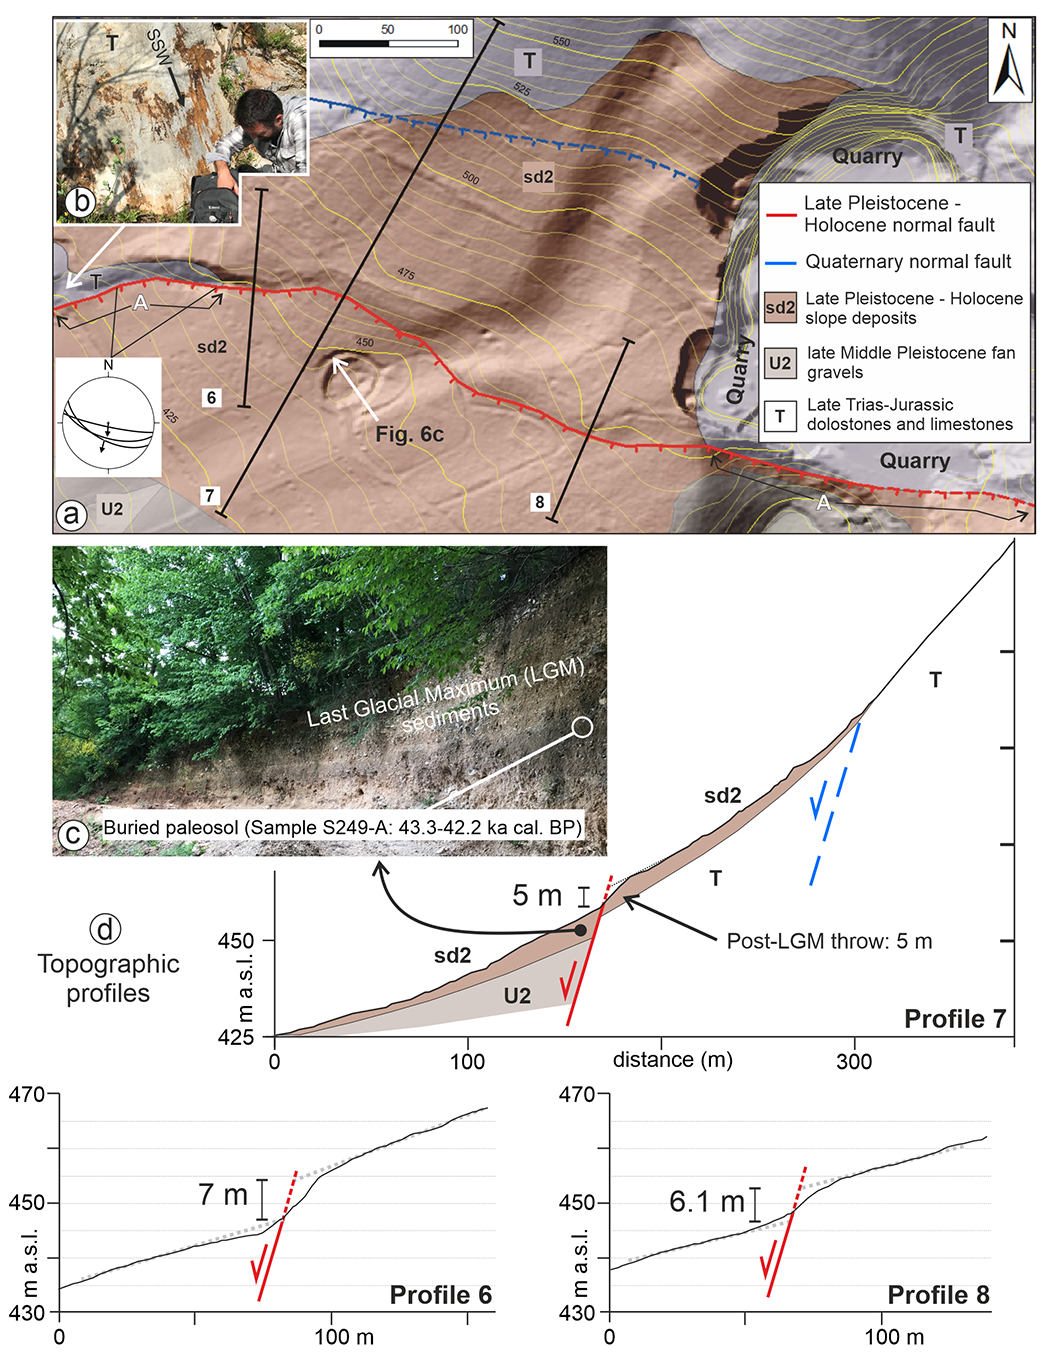
Figure 6Detail of the geologic map (a), view of the striated fault plane on bedrock (b), field view of the sd2 slope sediments within which a buried paleosol was sampled for radiocarbon dating (c), and topographic profiles across the Gioia Sannitica normal fault trace (San Potito fault section) (d). The area marked with “A” in (a) is scarp disturbed by anthropic activity (not analysed for scarp measurements). The topography is from the 1 m resolution lidar DEM. The location of this area is shown in Figs. 2b and 4.
Sharp changes in slope between the carbonate bedrock and the continental cover and fault scarps on both bedrock and continental deposits have been observed in numerous places along the fault trace. Particularly informative is the site located ENE of San Potito Sannitico (see Fig. 2a), where the fault forms a 5–7 m high scarp that has been measured by the 1 m resolution lidar DEM on Upper Pleistocene slope colluvial deposits of unit sd2 (Fig. 6). The fault plane on Triassic bedrock crops out on the western side of the map of Fig. 6a and shows slickenlines plunging to the SSW (Fig. 6b). Both the western and eastern sides of the fault scarp are disturbed by anthropogenic modifications (A in Fig. 6a) and have been discarded from scarp measurements. The central, undisturbed part of the scarp is located just along the projection of the measured bedrock fault plane and is formed entirely within unit sd2. There is no lithology variation across the scarp, suggesting that differential erosion is not a plausible mechanism for scarp formation. Moreover, a small valley crossing the scarp is only slightly incised within unit sd2 downslope the scarp and is much more incised within unit sd2 upslope from the scarp. All these features suggest that the scarp formed due to normal faulting. The slope deposits of unit sd2, observed in an anthropogenic cut downslope from the scarp, contain a buried paleosol dated to 43.3–42.2 ka (cal. BP; Table 2; Fig. 6c), indicating that the upper part of the succession accumulated during the Last Glacial Maximum (LGM), when large volumes of coarse-grained sediments piled up at the piedmont of the Apennine ridges (e.g. Giraudi and Frezzotti, 1997). Considering that the dip of the LGM deposits is nearly coincident with the dip of the topographic surface (profile 7 in Fig. 6d), it is likely that the fault offset the topographic surface and the underlying stratigraphy after the LGM sedimentation (i.e. post-LGM fault scarp).
Table 3Measured throw and slip rates along the Gioia Sannitica (GF) and Ailano–Piedimonte Matese (APMF) normal faults.
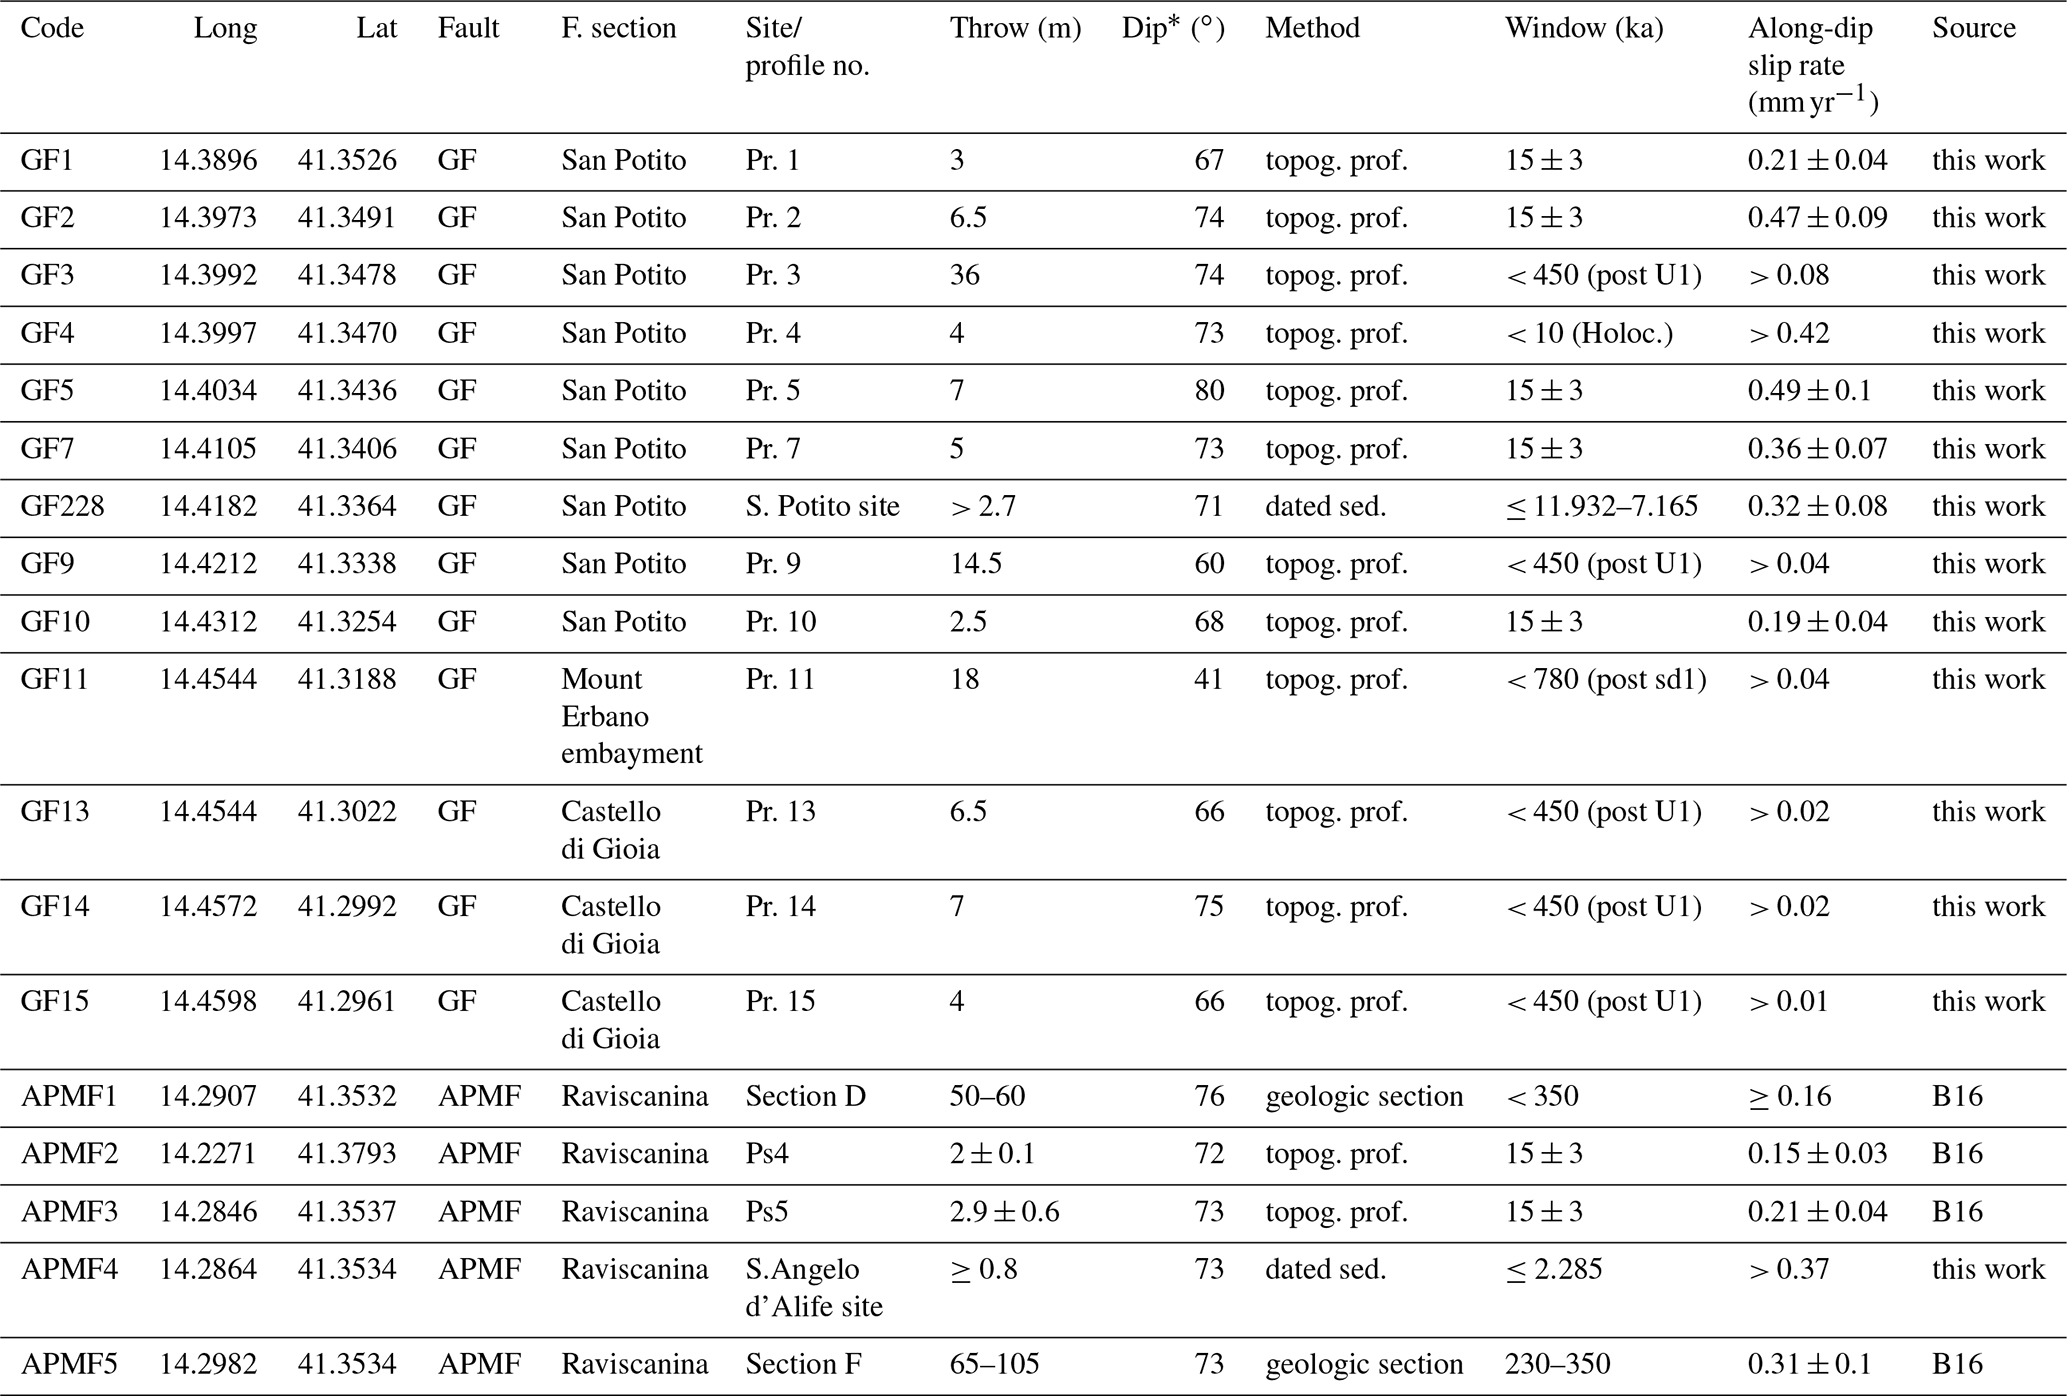
∗Fault dip measured at the site or taken from the closest fault outcrop. B16 indicates that the source is Boncio et al. (2016).
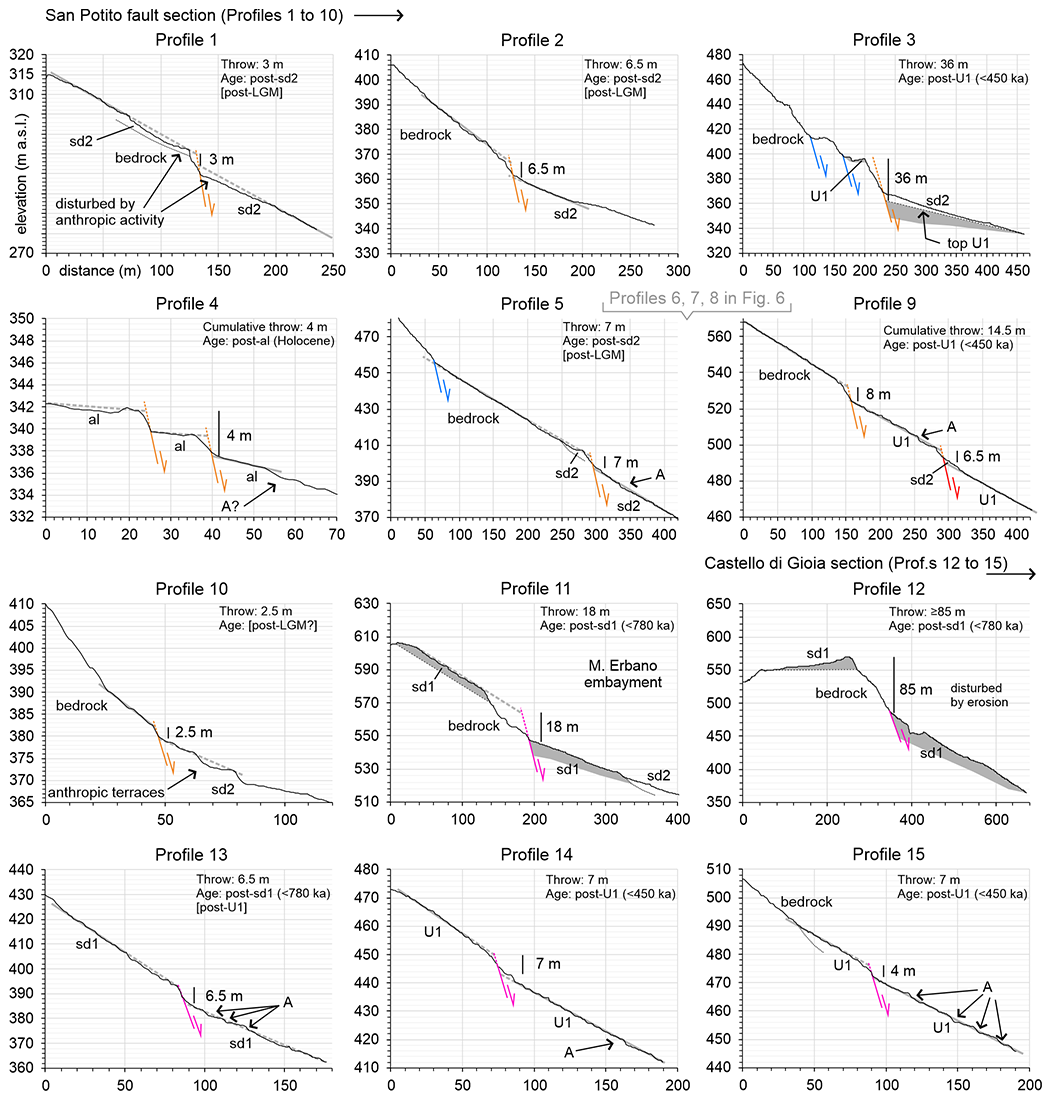
Figure 7Topographic profiles across the Gioia Sannitica normal fault trace extracted from the 1 m resolution lidar DEM. The points indicated with “A” show small anthropogenic terraces or excavations (which do not significantly modify the mean slope profile). Fault colours are the same as in Fig. 4 (constraints on fault activity). The preferred age of faulting, reported in square parentheses, for profiles 1, 2, 5, and 10 is based on comparison with fault scarps in Fig. 6. The preferred age for profile 13 is based on similarity with scarps in profiles 14 and 15. The estimated slip rates are reported in Table 3. The locations of profile traces are given in Fig. 4.
Figure 7 shows topographic profiles across the GF fault scarp extracted from the 1 m resolution lidar DEM (profiles 1 to 10, location in Fig. 4). Table 3 summarizes the throws measured on topographic profiles across fault scarps. In particular, east of Piedimonte Matese, at the foot of the Mount Olnito slope (Fig. 4), late Quaternary colluvial deposits of unit sd2 and a small valley (profile 1 in Fig. 7) are faulted and uplifted upslope (NNE) of a ∼ 3 m high fault scarp, suggesting recent faulting, possibly after the LGM for similarity with the area of Fig. 6. A ∼ 36 m high fault scarp is measured along profile 3, with gravels of Middle Pleistocene unit U1 in both hanging wall and footwall that indicate post-U1 (i.e. after 450 ka) faulting. The same fault trace forms a ∼ 4 m high fault scarp across a ∼ 15 m wide zone on the floor of a Holocene alluvial plain (profile 4) that could be the result of cumulated Holocene surface faulting events. A long profile built along the riverbed close to profile 4 shows a knickpoint across the fault trace (“knick zone” in Fig. S1 in the Supplement). The knickpoint height (elevation difference between crest and toe) is 3–4 m. By considering the long profile slope and the fault dip, the throw is on the order of 2–3 m, which is less than the cumulated throw measured on profile 4. This is consistent with profile 4, as the knickpoint should have registered younger slip compared to the top of the Holocene alluvium, reinforcing the hypothesis of Holocene surface faulting. South of the fault scarp illustrated in Fig. 6, two synthetic splays form a ∼ 14.5 m high cumulative fault scarp (profile 9). The upper splay forms a ∼ 12 m high scarp (elevation difference between crest and toe), interpreted as due to ∼ 8 m of vertical displacement of the topographic surface. The similarity of the slope angle in the hanging wall (on U1 deposits) and footwall (on carbonate bedrock) suggests that the ∼ 8 m of throw accumulated after the sedimentation of U1. The lower splay vertically offsets the topographic surface on top of U1 by ∼ 6.5 m. Therefore, the cumulative scarp seems to have formed due to post-U1 (i.e. after 450 ka) faulting. Further to the south, the two splays merge into a single trace forming a 2–3 m high scarp for which we have no age constraints (profile 10). A 2.5 m post-LGM throw can be tentatively inferred due to its small size and for comparison with the scarps previously described.
Castello di Gioia fault section
The Castello di Gioia section strikes 155∘ on average at the foot of the Mount Monaco di Gioia slope with a simple linear fault trace. Striated fault planes crop out in the central part of the fault trace (Figs. 4 and 5d). The slip vectors plunge to WSW, determining normal kinematics with slight right-lateral component; in one site, both S- and SW-plunging slip vectors have been observed.
The fault displaces Late Miocene siliciclastic deposits against Late Triassic dolostones, with vertical geological separation exceeding 1000 m (Plate S1, section F–F'). It is likely that such a large total geological displacement was accumulated both before and after the Late Miocene, similar to the San Potito fault section. Near Castello di Gioia, the Early (?) Pleistocene slope breccia of unit sd1 hangs ∼ 80–100 m in the footwall of the fault, suggesting that > 80 m of throw accumulated in the Quaternary (Fig. 7, profile 12). However, the site crossed by profile 12 is disturbed by an unquantified amount of erosion, preventing reliable throw estimates.
In the Mount Erbano embayment, NW–SE-striking Quaternary normal faults displacing the pre-Quaternary bedrock and the Early (?) Pleistocene sd1 slope breccia have been mapped. The fault crossed by profile 11 (Fig. 7) is characterized by a ∼ 18 m high fault scarp with sd1 breccia in both hanging wall and footwall, with no additional evidence of late Quaternary activity.
The connection between the Castello di Gioia and San Potito fault sections is poorly constrained and is inferred here (geologic map in Plate S1) on the basis of displacement of pre-Quaternary bedrock and escarpments on the Early (?) Pleistocene sd1 slope breccia between the terminations of the Castello di Gioia and San Potito fault traces.
Fault scarps on slopes covered by continental deposits of the units U1 and sd1 have been observed in the central part of the Castello di Gioia section. The scarps have heights on the order of 4 to 7 m and interrupt the regular, gently dipping slopes of the Mount Monaco di Gioia piedmont (profiles 13–15 in Fig. 7). This indicates that the scarp formed after the sedimentation of unit U1, possibly in more recent times.
The Castello di Gioia fault section has been mapped up to the Faicchio area, where geologic and geomorphic evidence of Upper Pleistocene–Holocene faulting dissipate. Here the Mount Monaco di Gioia mountain front, in the footwall of the Castello di Gioia fault section, suddenly bends from NW–SE to WNW–ESE and further to the E bends WSW–ENE for a total length of ∼ 8 km (Fig. 2). The mountain front is controlled by a S-dipping normal fault that appears to be capped by Early–Middle Pleistocene deposits of the sd1 and U1 units. Further to the SE, a SW-dipping normal fault can be inferred along the SW slope of the Mount Acero Jurassic–Cretaceous carbonate ridge (Fig. 2; Plate S1). A ∼ 1.2 km wide stepover separates the Mount Acero fault from the Castello di Gioia fault section. We could not observe fault planes, scarps, or other evidence of Upper Pleistocene–Holocene activity along the Mount Acero fault trace.
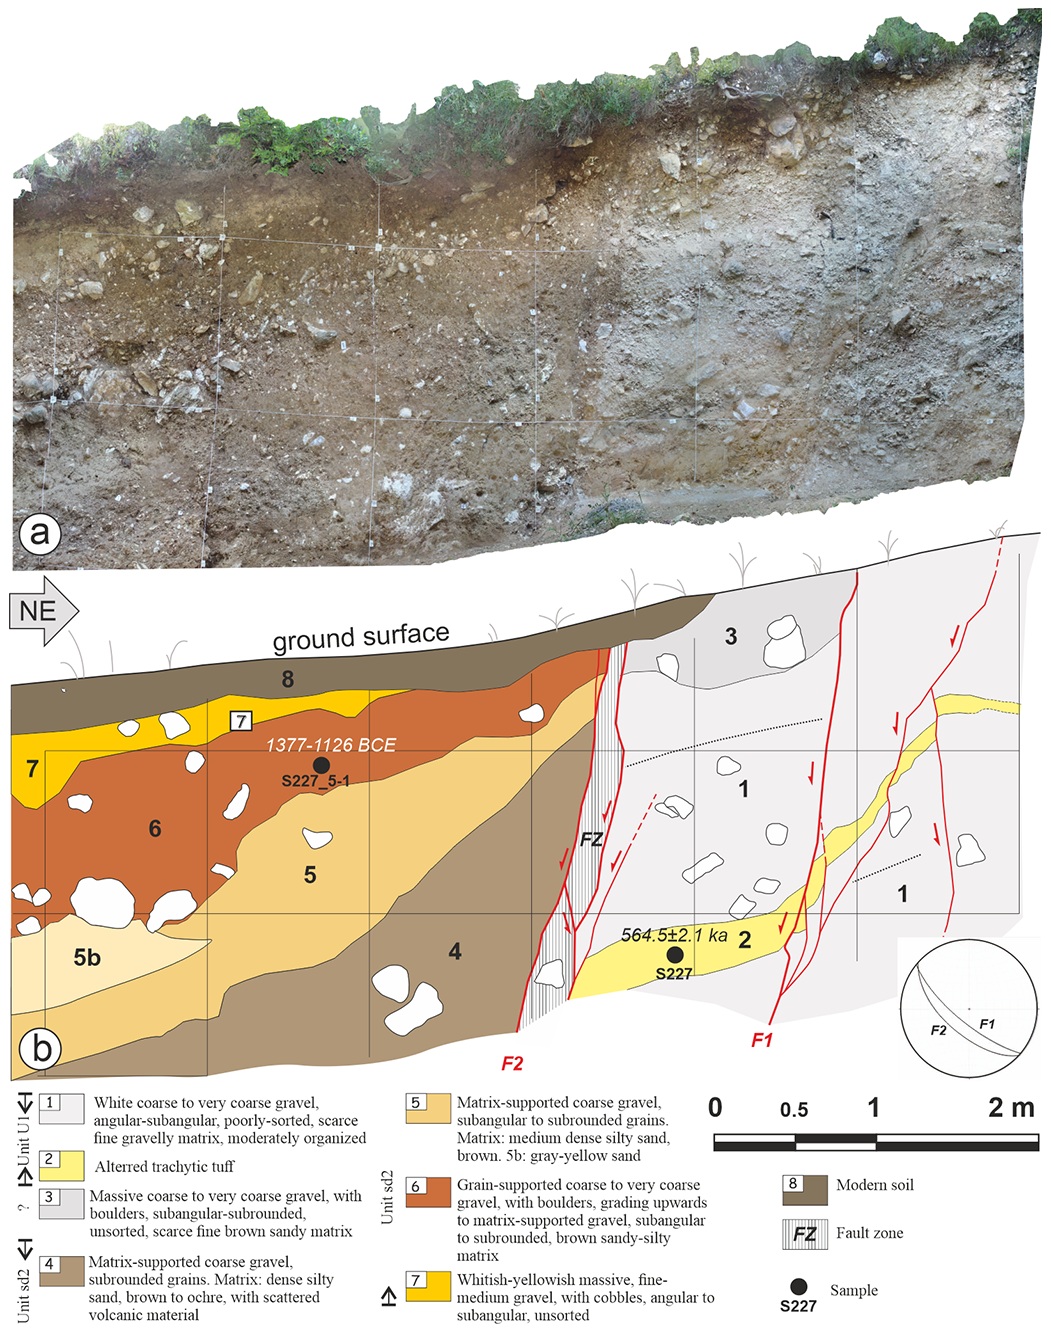
Figure 8Photomosaic (a) and interpreted log (b) of fault zone 1 in the western splay of the Gioia Sannitica normal fault (San Potito fault section, central part). Unit numbering (1 to 8) refers only to this outcrop (units do not necessarily correlate with other units with the same number in Figs. 9 and 10); the stratigraphic position of units U1 and sd2 is indicated in Fig. 3. The complete details of the age determinations are given in Tables 1, 2, and S1. The location of this outcrop is given in Figs. 2b and 4.
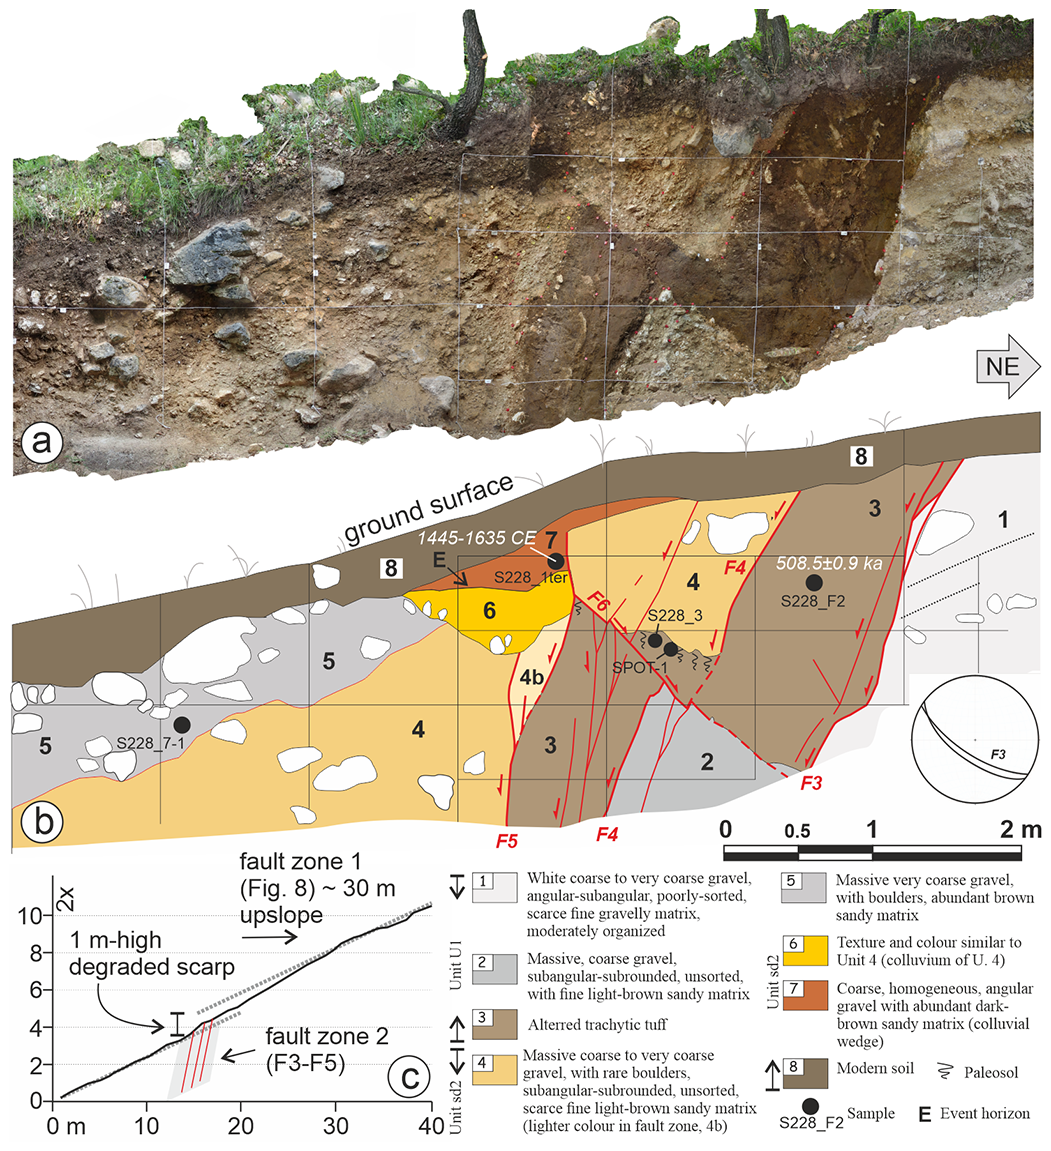
Figure 9Photomosaic (a) and interpreted log (b) of fault zone 2 and micro-topographic profile (c) across the fault zone in the western splay of the Gioia Sannitica normal fault (San Potito fault section, central part; location shown in Figs. 2b and 4). Unit numbering (1 to 8) refers only to this outcrop (units do not necessarily correlate with other units with the same number in Figs. 8 and 10); the stratigraphic position of units U1 and sd2 is indicated in Fig. 3. Event horizon (E) refers to the topographic surface at the time of the last surface faulting event. The complete details of the age determinations are given in Tables 1, 2, and S1. Detailed analysis of the paleosol (sample S228_3 and SPOT-1) is given in Text S1. Photographic details of the fault zone; a restoration of displacements on faults F4, F5, and F6; and a possible restoration of the last two surface faulting events are reported in Figs. S2, S3, and S4, respectively.
4.2 Upper Pleistocene–Holocene surface faulting
4.2.1 The San Potito site on the Gioia Sannitica Fault
In the central–southern part of the San Potito fault section, the fault is formed by two parallel splays (section 2 in Fig. 4). The eastern splay separates the continental deposits from the dolomitic bedrock, while the western splay is within the continental deposits. Across the western splay, a ∼ 40 m long cut along a dirty road was accurately cleaned and logged for analysing two fault zones, one located in the footwall of the splay (fault zone 1, Fig. 8) and the other located on the main trace of the splay (fault zone 2, Fig. 9; a photographic documentation of fault zone 2 is reported in Fig. S2 in the Supplement).
Fault zone 1 (Fig. 8) is formed by two SW-dipping normal fault strands, F1 and F2. F2 separates poorly organized, coarse, and white gravel in the footwall (unit 1, corresponding to unit U1 of the geologic map in Fig. 4 and Plate S1) from a succession of stacked, matrix-rich colluvial gravel units in the hanging wall (units 4 to 7, belonging to unit sd2 of the geologic map in Fig. 4 and Plate S1).
Unit 1 contains a 20 cm to 40 cm thick layer of yellow (lower part) to yellowish grey (upper part) distal tephra (unit 2) containing yellowish glass aggregates, poorly preserved leucite-bearing grey pumice fragments, rare loose sanidine crystals that are dated to 564.5 ± 2.1 ka (sample S-227; Tables 1 and S1), brown and minor green clinopyroxene and few dark mica grains, and a lithic fraction formed by leucite-bearing lava fragments.
Colluvial units 4, 5, and 6 are faulted in the hanging wall of fault F2. The youngest faulted unit is unit 6, the fine-grained matrix of which has been dated to 1377–1126 BCE (sample S227_5-1, Table 2).
Fault zone 2 (Fig. 9) is formed by three main SW-dipping normal fault strands (F3, F4, and F5), a NE-dipping antithetic fault (F6), and several secondary synthetic shear planes. Fault F3 separates organized, coarse, white gravels in the footwall (unit 1, corresponding to unit U1 of the geologic map in Fig. 4 and Plate S1) from a succession of colluvial gravels (unit 2) covered by a thick body of brown distal tephra (unit 3). The tephra contains whitish to grey glass aggregates, rare, very altered pumice fragments with leucite crystals, loose crystals of abundant sanidine and minor green and brown clinopyroxene grains, and a lithic fraction with limestone and rare leucite-bearing lava fragments. The sanidine crystals have been dated to 508.5 ± 0.9 ka (Tables 1 and S1). In the hanging wall of faults F3–F4 there is a succession of colluvial deposits belonging to unit sd2 of the geologic map (Fig. 4 and Plate S1).
The tephra unit is trapped within the main fault zone between F3 and F5, and the original geometry cannot be reconstructed due to synthetic and antithetic faulting and erosion. The top of the tephra unit, in the hanging wall of fault F4, is altered by a paleosol buried by coarse, unorganized, white gravels (unit 4), likely deriving from erosion and colluviation of unit 1. The buried paleosol has the appearance of a volcanic soil with andic properties. In detailed analysis (see Text S1 and Table S4 in the Supplement for a detailed description), the paleosol shows weak andic properties and poor pedogenetic evolution, suggesting a young age (Upper Pleistocene–Holocene) and possible disturbance by erosional ad colluvial processes. Two paleosol samples that are close to each other have been collected for radiocarbon dating (samples S228_3 and SPOT-1 in Fig. 9b and Table 2). One sample (S228_3) was analysed by the CEDAD laboratory for dating the bulk organic fraction, which gave ages of 6510–6250 BCE (Table 2). In order to check if possible contamination by young carbon could have affected the results, a second sample (SPOT-1) was collected and analysed by the Beta Analytic laboratory for 14C dating the bulk organic fraction, alkali-soluble fraction, and alkali-insoluble fraction (see Sect. 3.2). The analysis gave no sufficient alkali-soluble organics for dating. the dating of the bulk organic fraction gave ages ranging from 5363 to 5216 BCE, and the dating of the alkali insoluble fraction gave ages ranging from 9983 to 9563 BCE. There is large variation in the results, possibly due to contamination with young carbon for the youngest ages, disturbance due to colluviation, or the duration of the pedogenic process. Nevertheless, all the results converge towards a Holocene age of the paleosol, possibly developed during the early to middle Holocene thermal optimum (e.g. Giraudi et al., 2011), in agreement with the results from paleosol analysis (Text S1 and Table S4).
The paleosol and the overlying unit 4 are faulted by F4 and F5. In the hanging wall of F5, a sequence of colluvial units crops out. The lack of organic material prevented any attempt of dating unit 4. Part of unit 4 is trapped between fault F5 and a synthetic splay of F5 and is affected by shear fabric (unit 4b). Unit 5 differs from unit 4 due to average larger percentage of boulders and the presence of a brown, sandy matrix. Radiocarbon dating of the bulk organic fraction within the matrix of unit 5 gave a very young age (post-1950 CE; Table 2, sample 228_7-1), which is younger than the overlying unit 7 (see below), suggesting that the result is unreliable due to likely contamination by young carbon.
Two wedge-shaped colluvial units (units 6 and 7) are present between units 4–5 and the modern soil. Unit 6 is formed by coarse, non-organized, whitish gravels, with textural and compositional features very similar to unit 4, suggesting that it formed by colluviation of material from unit 4. The bottom of unit 6 is an erosional surface that cuts units 5, 4, and 4b. Unit 6 seals a synthetic splay of F5 and is faulted by the main F5 strand (Figs. 9b and S2). The facies and wedge-shaped geometry of unit 6, thickening towards F5, suggest that the sedimentation was sourced by a fault scarp that exposed unit 4 in the footwall of F5, possibly after a surface faulting event (scarp-derived colluvial wedge). The colluvial wedge was then faulted by the main F5 strand. Unit 7 is a wedge-shaped, gravel unit that is rich in dark brown organic matrix with charcoals dated to 1445–1625 CE (Table 2, sample 228_1ter). The wedge thickens sharply in the hanging wall of F5 and seals a steep scarp formed by F5, with unit 4 in the footwall. There is no evidence of faulting of (or shear fabric within) unit 7 (see also Fig. S2).
Tectonic interpretation of fault zone 2 (Fig. 9)
The tectonic interpretation of the outcrop in Fig. 9 is difficult due to the complex architecture of the fault zone. Nevertheless, the buried paleosol between units 3 and 4 provides insights into the minimum Holocene displacement. The overall properties and numerical ages of the faulted paleosol indicate weak pedogenesis over a short period of time. The soil overlies a much older parent material (> 500 ka), suggesting that the faults displacing the paleosol were activated or reactivated after a long period without sediment accumulation and after a period of pre-Holocene erosion. After the onset (or restart) of faulting, a significant hanging wall subsidence and sediment accumulation occurred, as evidenced by the accumulation of colluvial deposits of unit 4 and younger.
The paleosol is displaced by F4, F5, and the antithetic fault F6. F6 is an antithetic splay of F3 and displaces fault F4 and the paleosol by about 25 cm (see Fig. S3 in the Supplement for the restoration of F4, F5 and F6). The paleosol is vertically displaced > 1.2 m by F4 and > 1.5 m by F5 (total minimum throw > 2.7 m) (Fig. S3b).
Considering the geometric and sedimentary features of units 6 and 7 and their relation to fault F5, two surface faulting events can be hypothesized (see Fig. S4 in the Supplement for a restoration of the surface faulting events).
The most recent surface faulting event (MRE) should have formed a free face exposing unit 4 (Fig. S4, stage 5). Unit 7, which covers the steep fault scarp without evidence of shear (see Fig. S2), should have deposited shortly after the surface faulting event. Considering that the maximum thickness of unit 7 measured close to the fault is ∼ 30 cm, a coseismic surface throw between 30 and 60 cm can be hypothesized (50 cm of vertical displacement in Fig. S4, stage 5).
The penultimate surface faulting event (PE), should have formed a free face on unit 4 that sourced unit 6 (Fig. S4, stages 1 to 3). After PE, the vertical displacement of which is hypothesized to be of the same size of MRE, it seems necessary to consider (a) a first period of fault-parallel erosion in the hanging wall of the reactivated F5 that cuts into units 5, 4, and 4b, probably accompanied by partial degradation of the exposed free face (Fig. S4, stage 3a), and (b) a second period during which the colluvial accumulation from the partially degraded fault scarp forms unit 6 (Fig. S4, stage 3b).
A ∼ 1 m high degraded and retreated scarp across the F3–F5 fault zone is visible on a detailed topographic profile of the ground surface (Fig. 9c), supporting the interpretation of surface faulting.
4.2.2 The Sant'Angelo d'Alife trench site on the Ailano–Piedimonte Matese fault
A small trench was dug across the southern part of the Raviscanina fault section (see Fig. 2 for location) in order to build upon previous work (Boncio et al., 2016) and obtain additional age constraints on the Ailano–Piedimonte Matese fault (APMF) activity.
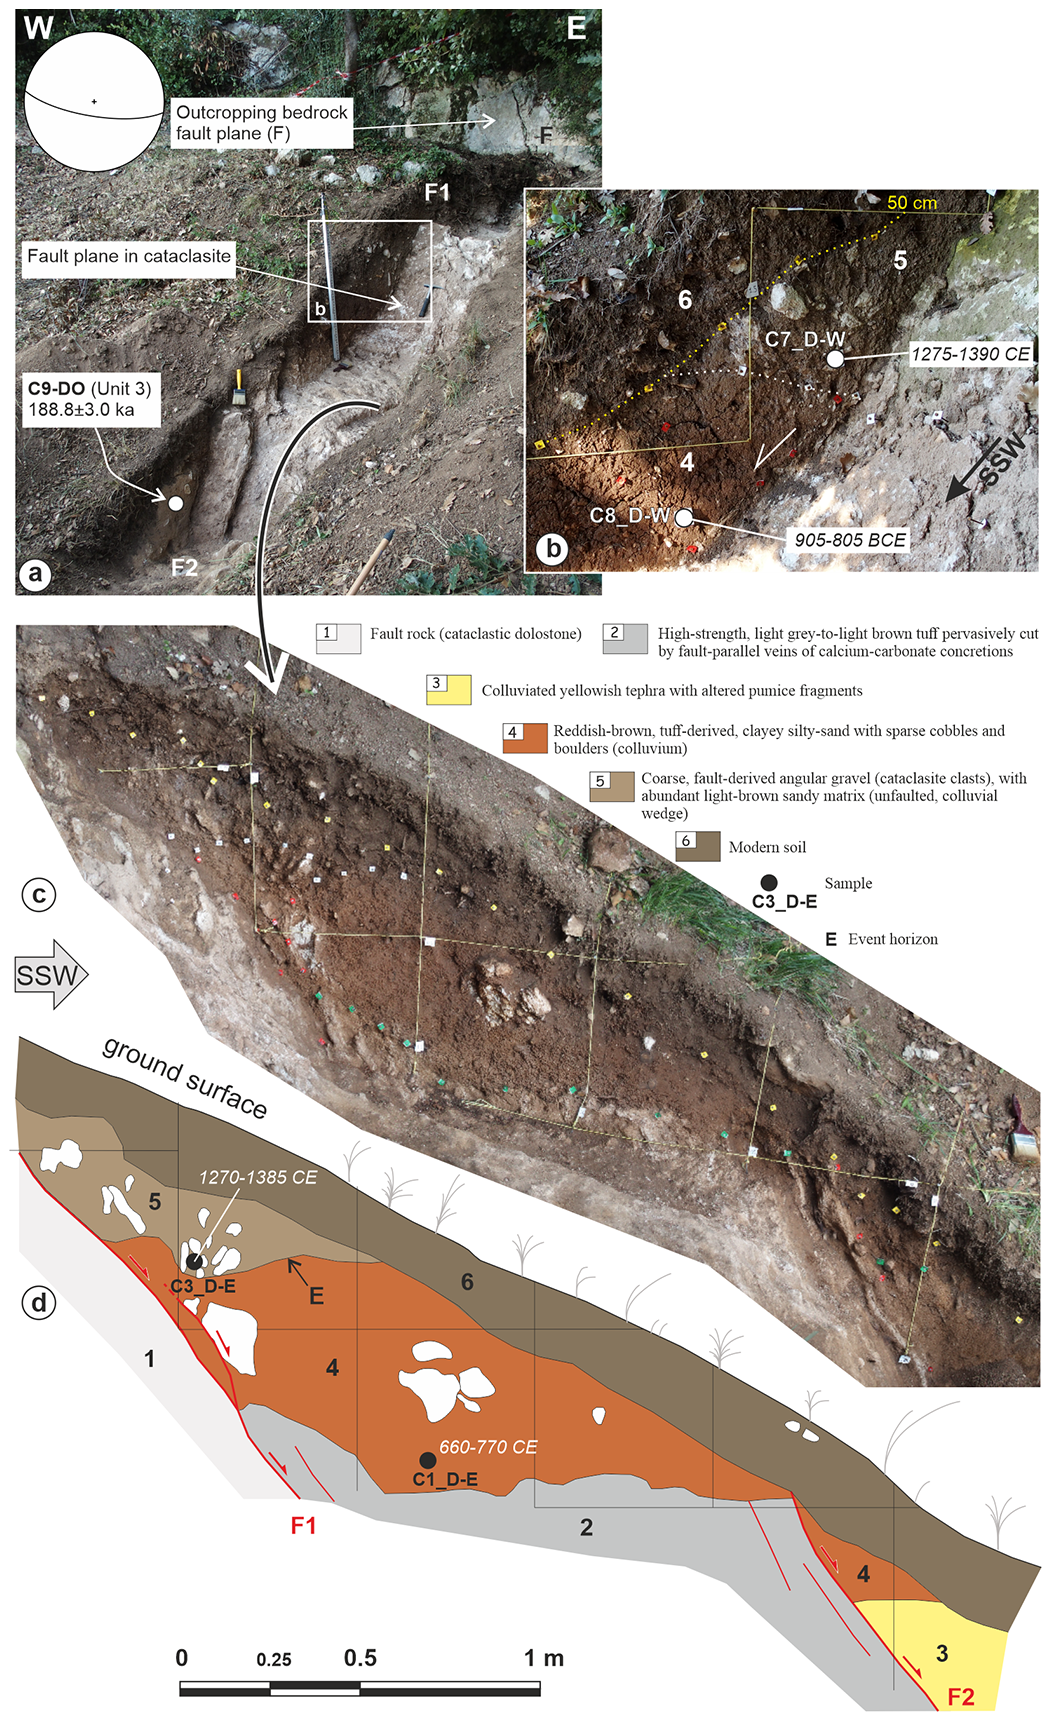
Figure 10Field view from the northern wall (a), a more detailed view of the same wall (b), and a photomosaic and log of the southern wall (c, d) of a shallow hand-dug trench across the southern Ailano–Piedimonte Matese fault (Raviscanina fault section, southern area) near Sant'Angelo d'Alife. Unit numbering (1 to 6) refers only to this outcrop (units do not necessarily correlate with other units with the same number in Figs. 8 and 9); units 3 to 6 belong to unit sd2 shown in Fig. 3. Fault numbering (F1, F2) refers only to this outcrop (not the same as that in Figs. 8 and 9). Event horizon (E) refers to the topographic surface at the time of the last surface faulting event. The complete details of the age determinations are given in Tables 1, 2, and S1. The location of this area is shown in Fig. 2a.
The trench crosses a fault zone formed by a main fault (F1) and a synthetic splay (F2) (Fig. 10). Fault F1 separates cataclastic dolostone in the footwall (unit 1) from high-strength, light grey to light brown tuff pervasively cut by fault-parallel veins of calcium carbonate concretions (unit 2). The upper part of Unit 2 is truncated by an erosional surface and covered by reddish-brown, clayey colluvium containing sparse carbonate clasts (unit 4) faulted by F1 and F2. Radiocarbon dating of two samples from unit 4 gave Holocene ages with significantly different dates, varying from 770 and 660 CE (sample C1_D-E; Fig. 10d) to 905 and 805 BCE (sample C8_D-W; Fig. 10b), indicating large age uncertainty, possibly due to contamination by young carbon in sample C1_D-E. Unit 4 is covered by a wedge-shaped colluvial unit formed by a light brown silty-sand matrix with abundant cataclasite clasts derived from the F1 fault rock (unit 5). The matrix of unit 5 has been dated between 1270 and 1385 CE (samples C3_D-E and C7_D-W; Table 2). Unit 5 is not faulted. This unit possibly formed after the fault rock was exposed to weathering and erosion due to a surface faulting event (scarp-derived colluvial wedge).
Fault F2 vertically displaces the bottom of unit 4 by ∼ 30 cm. In the hanging wall of F2, unit 4 covers a 188.8 ± 3.0 ka old colluviated tephra unit (unit 3) made up of very altered whitish to yellowish pumice fragments, abundant loose sanidine crystals and rare green and brown clinopyroxene crystals, and several opaque grains in the finer fraction (sample C9-DO; Tables 1 and S1). Unit 3 is colluviated, and therefore it is younger than the obtained ages.
The total minimum vertical displacement accumulated by unit 4 is estimated to be ∼ 0.8 m, corresponding to the maximum vertical thickness of unit 5 (∼ 0.5 m; the space created by surface faulting and filled by the colluvial wedge) plus the 0.3 m of displacement on F2.
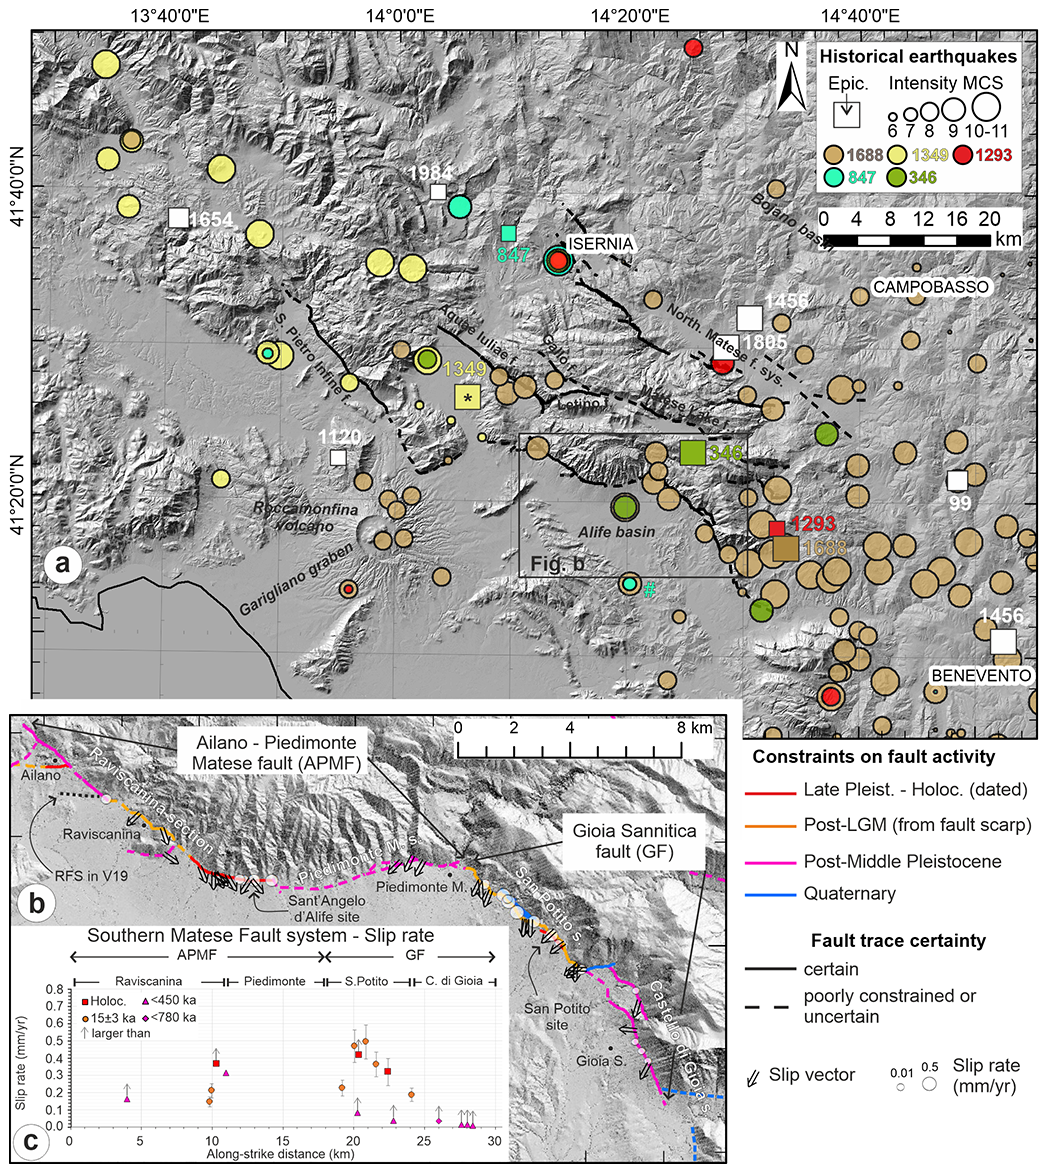
Figure 11(a) Distribution of intensity data points (from DBMI15, Locati et al., 2021) of the largest historical earthquakes in the Matese area (epicentres from CPTI15, Rovida et al., 2020; from CFTI5Med for events before 1000 CE, Guidoboni et al., 2019; the asterisk shows the epicentre from Galli and Naso, 2009); the hash symbol shows the intensity data point of the 847 CE earthquake from Bottari et al., 2020. (b) Fault activity classification and fault slip data along the southern Matese fault system are based on data from this work (GF, Sant'Angelo d'Alife site) and from Boncio et al. (2016) (APMF); “RFS in V19” indicates the Raviscanina fault scarp mapped in Valente et al. (2019). (c) Along-strike slip rate distribution.
5.1 Architecture and kinematics of the GF and the entire SMF system
The detailed study of the GF appears to provide a fundamental piece of evidence to understand the overall geometry, kinematics, and activity of the entire SMF system. The characterization of the 30 km long SMF system is in turn crucial for drawing a complete tectonic picture of the Matese area, where several historical earthquakes are still without an associated seismogenic fault (Fig. 1). In order to understand the implications that our findings have within the regional context of the Matese tectonics, in Fig. 11a and b the GF is mapped together with all the other known Matese normal faults (Di Bucci et al., 2005; Galli and Naso, 2009; Boncio et al., 2016; Ferrarini et al., 2017; Galli et al., 2017; Valente et al., 2019). In particular, for the SMF system reported in Fig. 11b, the results from our detailed field mapping are integrated with data of comparable detail published by Boncio et al. (2016) for the Ailano–Piedimonte Matese fault (their Fig. 9). Valente et al. (2019) mapped several short (certain or inferred) secondary faults within the Alife basin in the hanging wall of the SMF. Not all of the faults mapped by Valente et al. (2019) are reported in Fig. 11, as the following discussion will focus on the main fault. This does not mean that other secondary faults cannot be present in the hanging wall of the main SMF.
Once integrated with the previous data, the results of our fault mapping show that the geometry of the SMF system is complex (Fig. 11b), with NW–SE, E–W, and WSW–ENE fault sections. The northern Raviscanina section strikes NW–SE on average and bends ESE and then to E–W in the southern portion, approaching the Piedimonte Matese section. Internally, the Raviscanina section bends E–W locally and intersects with short E–W- to SW–NE-striking faults in the hanging wall. The Piedimonte Matese section strikes from E–W to WSW–ENE. The San Potito and Castello di Gioia sections of the Gioia Sannitica fault strikes NW–SE on average. The largest part of the SMF system strikes NW–SE.
A summary of fault geometry (strike, dip) and kinematics (slip vector trend) is presented in Fig. 12 (numerical data in Table S3). All of the fault sections are represented in the diagrams of Fig. 12, but unfortunately the sampling of fault slip data is not homogeneous along the system and depends on the different exposure conditions. Therefore, in Fig. 12 there could be some bias due to under-sampling of poorly exposed faults. In order to avoid over-sampling for well-exposed outcrops, only one representative measurement (or an average) has been plotted. The most under-sampled fault section is the ∼ E–W Piedimonte Matese section due to the poor exposure of the fault plane, which is covered by alluvial fan sediments for most of the section length. The prevailing measured strikes range between 115 and 140∘. Variations in the E–W strike (95–105∘) are measured at a smaller scale within major NW–SE faults (Fig. 12a). Dip angles are mostly within the range typical of high-angle normal faults (60–80∘, Fig. 12b).
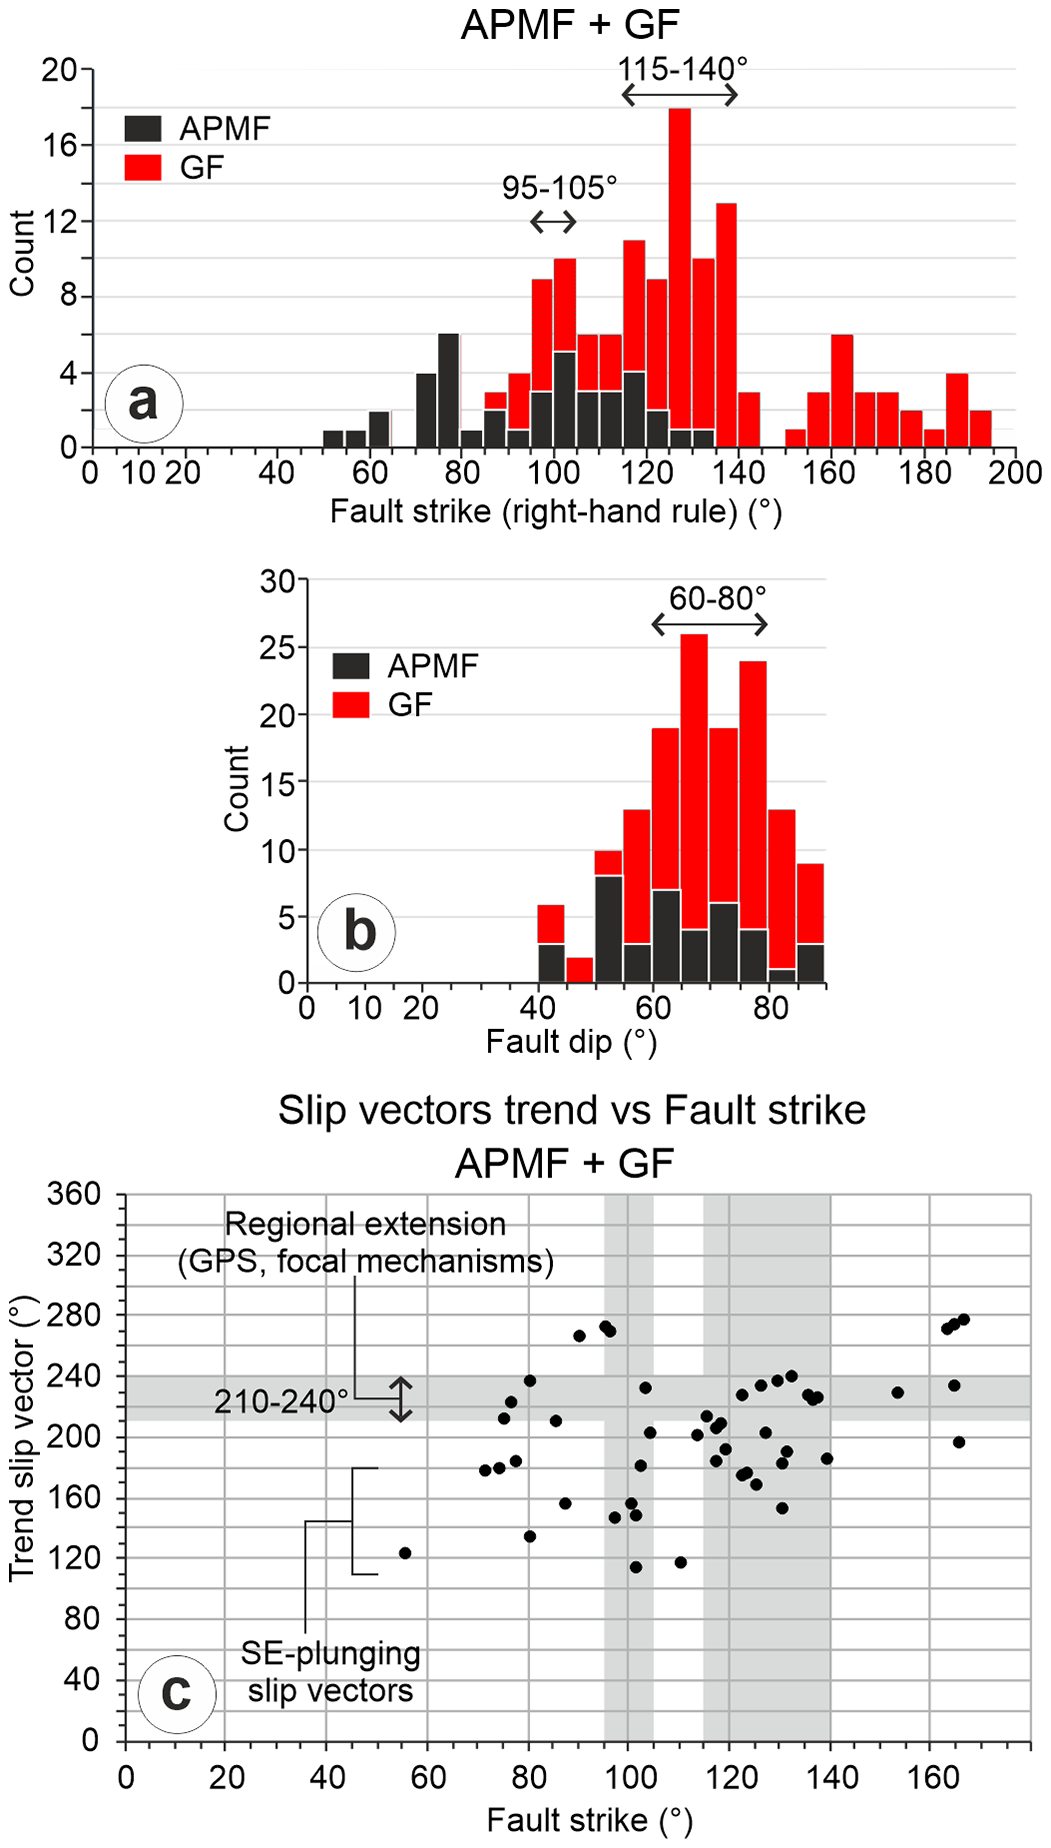
Figure 12Summary of structural data for fault strike (a), fault dip (b), and slip vector trend (c) collected along the southern Matese fault system in this work (GF) and in Boncio et al. 2016 (APMF). Grey vertical bands in (c) correspond to the ranges of strike that are most represented in (b). Numerical values, locations, and sources of point data are given in Table S3.
The orientation of slip vectors is uneven along-strike in the SMF system. The trend of slip vectors varies from 270 to 110∘, with prevailing slip vectors plunging to the SW (200–240∘; 20 out of 52 data points) and to the SE (110–180∘; 15 out of 52 data points). SW-plunging slip vectors are consistent with the direction of active regional extension obtained from focal mechanisms and GPS velocity vectors (210–240∘, Figs. 1 and 12c). Interestingly, both SW-plunging and SE-plunging slip vectors are recorded on the NW–SE, E–W, and WSW–ENE faults. This pattern cannot be explained by simple models of normal fault growth, even considering variations due to slip vector convergence towards the fault centre during fault growth (Roberts, 1996; Roberts and Michetti, 2004). It seems more likely that this pattern is the result of a different tectonic model, possibly characterized by repeated reactivations of pre-existing faults. The geometrical pattern of interfering NW–SE and nearly E–W faults has been observed by previous authors to be common in the Matese area and is interpreted as being the result of interaction between newly formed Quaternary NW–SE faults and reactivated pre-existing E–W Mesozoic faults (e.g. Calabrò et al., 2003). Even in this context, the presence of SE-plunging slip vectors is not easily explained. A possible explanation has been proposed by Boncio et al. (2016), also thanks to structural analysis and relative chronology of slip vectors (e.g. Fig. 16 in Boncio et al., 2016), and by Amato et al. (2017) based on tectono-stratigraphic arguments. According to those authors, SE-plunging slip vectors were recorded mostly during the NW–SE extensional phase that opened the Garigliano graben in the Early–Middle Pleistocene when new NE-striking normal faults formed and pre-existing Jurassic E–W normal faults and pre-Miocene or pre-Quaternary NW–SE normal faults were reactivated with left-lateral normal-oblique kinematics. The mutual relationships among fault segments with different orientations and the overall geometries in the system probably evolved through time, depending on the dominant extensional direction. The present overall architecture shown in Fig. 11b was likely achieved during the latest stage of extension, dominated by NE-directed stretching, that has been operating since Middle Pleistocene and is still active.
5.2 Fault activity and slip rates
Following the approach proposed by Faure Walker et al. (2021), in Fig. 12b the constraints on fault activity are preserved at the level of the single fault trace, which is the primary level of data collection in the field (fault traces are available in shapefile and kmz formats in the Supplement). The extent of a trace depends on the distance over which the criteria for determining the activity and location certainty remain the same. This is a useful way to avoid propagating uncertainties along the entire fault, to identify traces where the lack of constraints on very recent activity might indicate poor exposure or less active portions of the fault system, or simply to identify traces where further investigations should be planned to reduce uncertainties. This is also a way to help seismic hazard modellers who use fault data to perform more complete uncertainty analyses. Fault activity classes are divided considering (a) evidence of displacement of dated Upper Pleistocene–Holocene sediments, which is the strictest constraint for fault activity, (b) post-LGM fault scarps, (c) evidence of faulted Middle Pleistocene sediments, and (d) evidence of Quaternary activity, intended as a generic control over the Quaternary evolution of the area, without further constraints. Post-LGM fault scarps are scarps, clearly related to the presence of a fault, that interrupt the regularity of the slope and that can be explained only by invoking a fault displacement of the topographic surface (i.e. the original topography can be reconstructed after fault restoration) that occurred after the LGM (i.e. after 15 ± 3 ka ago; Giraudi and Frezzotti, 1997). Post-LGM fault scarps have been widely used in the Apennines to derive fault activity and slip rates (e.g. Roberts and Michetti, 2004). Nevertheless, the interpretation of a post-LGM fault scarp is not always straightforward, often due to the lack of age constraints for the displaced topographic surface. In this work, the classification was done only after calibration with the site in Fig. 6, where the fault scarp is clearly post-LGM. All the fault traces classified as post-LGM share similar morpho-tectonic evidence to that seen in Fig. 6, including the size of the scarp (i.e. scarps of the same order of height).
The displacement of the dated sedimentary layers and the vertical displacement reconstructed across fault scarps were used to derive slip rates that have the same chronologic constraints as the host fault trace. The slip rates were obtained by measuring the throw rate and then converting it into slip rate by using the fault dip measured in the site or taken from the closest outcrop. Therefore, the obtained value is the along-dip slip rate, which is equal to the net slip rate only for pure dip-slip faults. We feel that this approximation is acceptable considering that there are uncertainties in the measurements, that the slip vectors are not always measurable, and that the measured rake angles at or close to the sites of slip rate measurement are close to dip-slip. The results are summarized in Table 3 and represented graphically in Fig. 11b. In order to have a complete picture of the entire SMF system, we included also a number of previously published punctual slip rate data (i.e. Boncio et al., 2016). Other slip or throw rate estimates have been proposed by Cinque et al. (2000, ∼ 1 mm yr−1; > 0.5 mm yr−1 in a related paper by Galadini et al., 2001), and more recently by Valente et al. (2019; inferred displacement rate > 0.2–0.3 mm yr−1 at the boundary of the Raviscanina–Piedimonte Matese mountain front). Unfortunately, we could not incorporate these data, as the precise criteria used in obtaining them are not described, and the values thus cannot be assigned precisely to a point or to a specific fault trace. Assigning slip rate data to the precise points of measurement is important, as it is recognized that slip (and consequently slip rate) can vary significantly along-strike, and detailed along-strike slip-rate profiles are needed to use them for seismic hazard applications (e.g. Faure Walker et al., 2019).
Two fault traces are constrained by displacement of dated Upper Pleistocene–Holocene sediments: the synthetic hanging wall splay in the central portion of the San Potito section and the southern portion of the Raviscanina section, both of which investigated in this work. The synthetic splay of the San Potito section is 110–130 m away from the main fault trace and likely joins with the principal fault plane at shallow depths (see section 2 in Fig. 4). Therefore, the activity of the splay provides insights into the activity of the main fault. The Holocene buried paleosol, displaced > 2.7 m vertically by the fault strands F4 and F5 (Figs. 9 and S3), provides constraints on the minimum slip rate. By considering the oldest and youngest paleosol ages obtained from the different dating analyses (11 932 and 7165 years cal BP, respectively; Table 2), the minimum obtained slip rate ranges from 0.24 to 0.4 mm yr−1. The average minimum slip rate is 0.32 ± 0.08 mm yr−1.
In the Sant'Angelo d'Alife site, the minimum calculated slip rate is 0.37 mm yr−1, obtained by dividing the > 0.8 m throw of unit 4 by the largest time window between the age of the faulted unit 4 and the age of the unfaulted unit 5 (time window of ≤2285 years).
The post-LGM slip rates were obtained from the throw measured by restoring the fault scarps (Fig. 7), divided by the time window of 15 ± 3 ka (Giraudi and Frezzotti, 1997; Roberts and Michetti, 2004). The obtained values range from 0.15 and 0.49 mm yr−1 (Table 3). In one case (profile 4) a time window of 10 ka was considered, as the scarp offsets the top of the Holocene alluvium (al unit in Fig. 4), providing minimum slip rates of 0.42 mm yr−1.
The post-Middle Pleistocene slip rates are minimum values obtained from the throw measured by restoring the fault scarps (Fig. 7), divided by the age of the stratigraphic unit beneath the topographic surface. The fault scarps crossed by profiles 13, 14, and 15 along the Castello di Gioia section (Fig. 7) are very similar in terms of geometry and size of the scarp to the post-LGM scarps of Fig. 6, suggesting a likely post-LGM age. Nevertheless, in the absence of clear constraints, we used the conservative time window of < 450 ka (younger than unit U1). The minimum post-Middle Pleistocene slip rates calculated over the entire SMF vary from 0.01 to 0.31 mm yr−1.
The along-strike SMF slip rate profile is shown in Fig. 11c. From the profile, a pattern of increasing slip rate towards the Sant'Angelo d'Alife trace and towards the central San Potito trace comes out. However, the profile has several gaps, numerous data are only minimum values, and all of these limitations make the interpretation not straightforward. There is a large gap along the entire Piedimonte Matese section. Hence, it is not possible to conclude whether a maximum or a minimum slip rate is expected within that section. This can have important implications in terms of fault segmentation. In fact, a maximum within the Piedimonte Matese section would imply a full linkage of the faults (e.g. Cowie, 1998), and the potential for a single large rupture along the entire SMF system should be considered in case of earthquake reactivation. On the other hand, a minimum of slip rate would imply a less active fault section and possibly a barrier to the propagation of the rupture during earthquake reactivation. We cannot exclude either of the two hypotheses, even though the lack of young scarps similar to those observed in the San Potito section allows us to prefer the hypothesis of a less active (i.e. minimum slip rate) Piedimonte Matese fault section. The slip rate possibly decreases from the Sant'Angelo d'Alife site towards the eastern end of the Piedimonte Matese section and then starts to increase again towards the San Potito site.

Figure 13Age constraints for surface faulting events according to data collected at the San Potito (GF) and Sant'Angelo d'Alife (APMF) sites compared with the ages of historical earthquakes.
5.3 Comparison with other tectonic models and implications for time variability of slip rate
An evolutionary model of the SMF system has been proposed by Valente et al. (2019) on the basis of their tectonic geomorphology study, which has been summarized in Sect. 2.2. In their model, the evolution of the fault system during the last ∼ 600 ka would have determined a progressive increase in activity along a major E–W-striking fault in the central part of the system. The main central E–W-striking fault is mapped from the western tip of the fault, named the Raviscanina fault scarp (RFS in Fig. 11b), to the eastern tip of the Piedimonte Matese fault section (see Fig. 13 in Valente et al., 2019). This active E–W-striking normal fault is considered an inherited, reactivated fault, which interacted with newly formed NW–SE-striking normal faults during the NE-directed Quaternary extension. This process would have determined local extension to be oriented N–S. This evolution would have determined the deactivation of the NW–SE-striking Ailano fault trace, and the progressive decrease of activity along the San Potito fault section. The low activity of the San Potito section would be indicated by the overall higher maturity of the mountain front and higher degree of entrenching of the alluvial fans. The onset of extension along N–S-striking normal faults, which is supposed to have been in the hanging wall of the main E–W fault, would have favoured the progressive deactivation of the San Potito fault.
Table 4Magnitudes obtained from surface fault length and possible rupture scenarios for historical earthquakes.
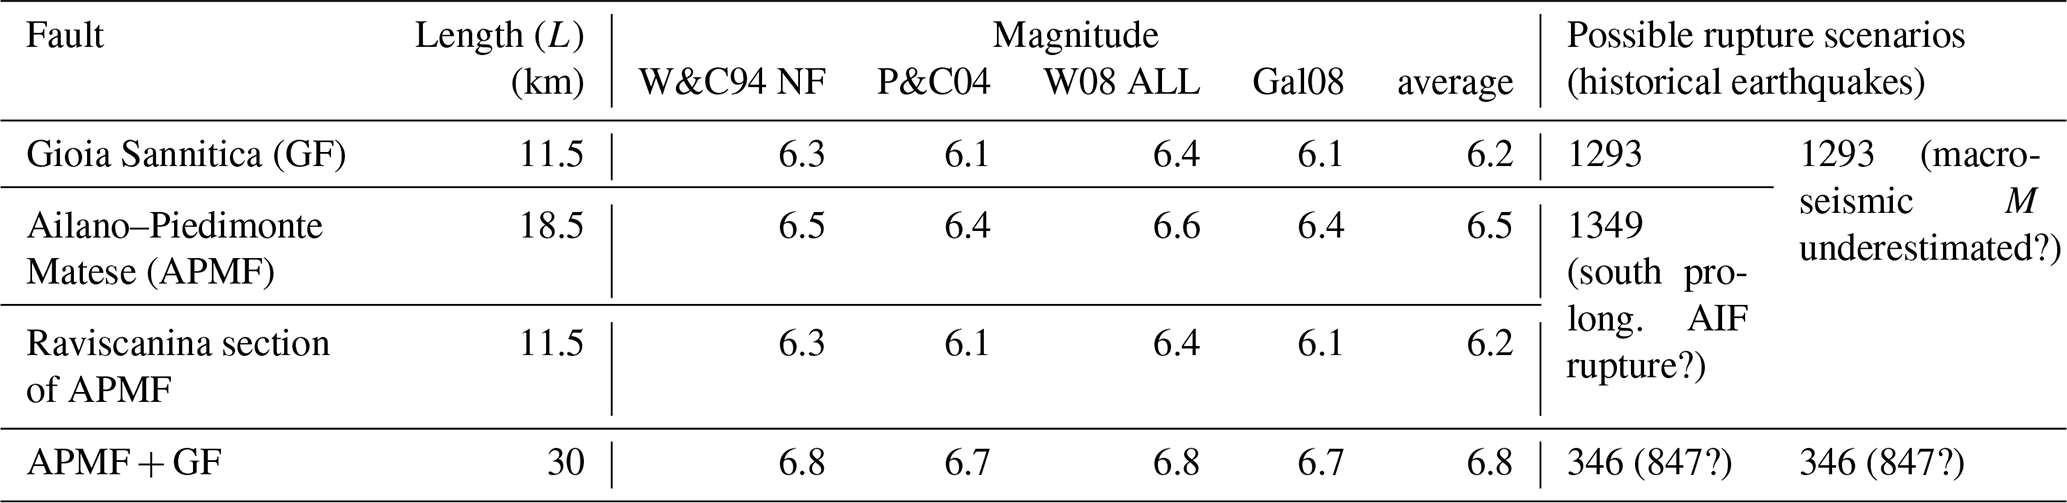
W&C94 indicates data from Wells and Coppersmith (1994) (normal faulting). P&C04 indicates data from Pavlides and Caputo (2004). W08 ALL indicates data from Wesnousky (2008) (all kinematics). Gal08 indicates data from Galli et al. (2008). AIF stands for Aquae Iuliae fault.
Our results from the Sant'Angelo d'Alife fault trace at the southern termination of the Raviscanina fault section are characterized by higher slip rates and thus agree with Valente et al. (2019). In reality, the Raviscanina section bends progressively from NW–SE by 100∘ to an E–W direction. This bend occurs close to the central part of the SMF system. On the other hand, our results on the San Potito section, where we found clear evidence of Holocene faulting and the largest slip rates, contrast with Valente et al. (2019). In the map of Fig. 11b, derived from detailed field mapping, we cannot recognize a main E–W-striking fault from the western tip of the RFS and the eastern tip of the Piedimonte Matese section. Therefore, further comparisons with the Valente et al. (2019) model are difficult, probably due to the different scales of fault mapping.
The discrepancy between our findings and the conclusions by Valente et al. (2019) about the activity of the San Potito section is of particular interest. The apparent discrepancy can be due to both (a) the rejuvenation of the mountain front along the Gioia Sannitica fault in recent times that produced small wavelength scarps detectable only with detailed fault mapping and (b) the different scale used in Valente et al. (2019) compared to this study. The study by Valente et al. (2019), performed at the scale of the entire mountain front, was able to identify the first-order pattern, characterized by a mature mountain front along a low-slip rate fault, but was not sufficiently detailed to identify recent fault scarps. If this interpretation is correct, this would imply a recent reactivation or acceleration of the fault. This also suggests that tectonic geomorphology at the scale of the mountain front should be complemented with detailed, local-scale fault mapping in order to catch the details necessary to constrain variations that occurred over short timescales.
In support of the above interpretation, the bedrock and Quaternary geology of the area defined in our work indicates that the GF has a long tectonic history that started before the synorogenic sedimentation of Late Miocene flysch (different pre-Miocene bedrock in the hanging wall and footwall). The activity continued after the Mio-Pliocene compressional tectonic phase and persisted for the entire Quaternary. The mature geomorphology, indicated by straight-to-concave mountain slopes, poorly faceted front, and entrenched alluvial fans, might be the result of the combined long pre-Quaternary and Quaternary geomorphological evolution and average low-slip rate. Recent resurrection or acceleration of fault activity after a period of inactivity or of very low slip rate determined the formation of morphotectonic markers of young fault activity, mostly in the form of metric-scale post-LGM scarps. Faulting of the < 12 ka paleosol that overlies the > 500 ka sediments along a synthetic splay in the San Potito site suggests that reactivation occurred in the Holocene after a long period of low or negligible subsidence and erosion in the hanging wall of the Gioia Sannitica fault.
This suggests that the most appropriate slip rates to use for seismic hazard applications are those calculated for the Holocene or post-LGM time window.
5.4 Seismogenic potential
The identification of colluvial wedges sedimented in close relation with fault activity (e.g. Figs. 9 and S4) and the occurrence of post-LGM metre-scale scarps and smaller scarps on Holocene alluvium (Fig. 7) indicate that the GF is capable of producing surface faulting events during moderate-to-strong earthquakes. Given the geological evidence of fault activity, two questions arise for the GF and APMF, i.e. (i) how large the expected earthquake potential is (ii) and whether there were any historical earthquakes that can be associated with these faults.
Concerning the earthquake potential, fault lengths and the derived magnitudes estimated from various empirical relationships available in the literature (Wells and Coppersmith, 1994; Pavlides and Caputo, 2004; Galli et al., 2008; Wesnousky, 2008) are summarized in Table 4. The obtained values assume that the entire mapped fault length will rupture during the earthquake. The lengths of GF and APMF taken separately are 11.5 and 18.5 km, respectively. Due to the uncertain activity of the Piedimonte Matese section in very recent times (Upper Pleistocene–Holocene), we have also separately considered the Raviscanina fault section (length 11.5 km). The average estimated magnitudes are M 6.2, M 6.2, and M 6.5 for the GF, Raviscanina fault section, and entire APMF, respectively. Assuming a rupture of both the APMF and GF (total length of 30 km), the estimated average magnitude is M 6.8.
The data collected in the San Potito and Sant'Angelo d'Alife sites give insights into the possible association of historical earthquakes to the faults (Figs. 11a and 13); some possible rupture scenarios compatible with dates of historical earthquakes are proposed in Table 4. The association of the 1688 CE large earthquake (M 7.1) can be excluded, as the last surface faulting event on both GF and APMF occurred before 1688 CE and because the macroseismic epicentre is located much to the south of the GF (Serva et al., 2007). The youngest wedge-shaped colluvial units in the two studied sites can be interpreted as scarp-derived colluvial wedges (CW in Fig. 13) that accumulated in the hanging wall of the free face shortly after surface faulting events (e.g. McCalpin, 2009). The ages of the CWs are similar at both sites, suggesting that APMF and GF could have been activated during the same event or during two events close in time. The events are compatible with the 1349 CE earthquake or 1293 CE earthquake (or both). The strong 1349 CE event (M 6.8) has been associated with the Aquae Iuliae fault, located 4.5 km N of the APMF (Galli and Naso, 2009). An activation of the APMF and/or GF during the 1349 CE event cannot be excluded. The Aquae Iuliae fault is not a long fault (∼ 20 km in Galli and Naso, 2009; 16.5 km in Boncio et al., 2016), and a longer rupture could match the estimated magnitude better (rupture ∼ > 30 km for M = 6.8). Nevertheless, the damage is distributed mostly to the NW of the Aquae Iuliae fault and not to the SE as would be expected in case of an activation of the APMF and/or the GF (Fig. 11a). Therefore, an association of the 1349 earthquake to the APMF and/or GF is uncertain. An activation of the GF and/or APMF during the 1293 CE earthquake seems plausible. The earthquake is constrained by a few data points, with heavy damage documented 20 km north (intensity IX) and 18 km south (intensity VIII–IX) of the estimated epicentre (southern Matese; Guidoboni et al., 2019). The estimated magnitude from historical data is moderate (M 5.8), and an activation of the GF alone (located between the two damaged sites) or the APMF alone, seems plausible. If we assume a reactivation of both the GF and APMF, we should conclude that the macroseismic magnitude in the historical catalogue probably underestimates the true magnitude of the event. Considering that the event is very old and poorly documented, we consider this hypothesis plausible.
A second, faulted wedge-shaped colluvial unit is present in the San Potito site beneath the most recent CW (unit 6 in Fig. 9). Unit 6 is free of organic matrix, suggesting deposition during a cold period. Assuming that the sediments of unit 6 originated from a fault scarp formed before 1293 CE, the only known earthquake sufficiently large to likely produce surface faulting is the 346 CE earthquake (Galadini and Galli; 2004; Guidoboni et al., 2019). The cold period during which unit 6 was formed could correspond with the cold period of the High Middle Ages (e.g. Giraudi, 2005; see grey areas in Fig. 13). The colluvial unit sourced by the 346 CE scarp would have been faulted by the 1293 CE event, with a corresponding inter-event time of ∼ 950 years.
If the macroseismic area of the 847 CE earthquake is larger than that reported in the CFTI5Med catalogue, and the epicentre is located WSW of the Matese massif, as proposed by Bottari et al. (2020), this earthquake could be considered a possible source of surface faulting in the studied area. We think that the association of the 847 CE event with the SMF is weak, due to the paucity of macroseismic data. Nevertheless, its age is compatible with the ages of faulting at both the San Potito and Sant'Angelo d'Alife sites. Therefore, the possible association of the 847 CE event with the SMF suggested by Bottari et al. (2020) cannot be excluded.
It is evident that the earthquake history of the SMF is still fragmentary. If asked to indicate a preferred interpretation on the basis of all the collected data our preferred interpretation would be a rupture of the SMF during the 1293 CE event, perhaps with separate ruptures on GF and APMF that are close in time or a partial rupture for the 1293 CE (GF) and 1349 CE (APMF) event and a rupture of the entire SMF during the 346 CE event. The different possible associations proposed in Table 4 can help seismic hazard modellers in testing different rupture scenarios. Additional paleoseismological studies could help to reduce the uncertainties.
The seismogenic potential estimated in this work and the likely association with poorly known, ancient historical earthquakes have obvious implications for seismic hazard of this region. In fact, seismic hazard assessments for practical applications (e.g. building design, civil protection; MPS04, Stucchi et al., 2011) are currently based on historical earthquakes of the last millennium, with no possibility of including the effects of older events or faults able to source long-recurrence earthquakes. Therefore, the seismic hazard of the southern Matese area (and to its west) is probably underestimated.
The 11.5 km long Gioia Sannitica normal fault (GF), at the foot of the southern Matese mountain front, is an active fault showing evidence of surface faulting during the Upper Pleistocene–Holocene (post-LGM fault scarps, faulted colluvial deposits, and paleosols). The GF and the 18 km long Ailano–Piedimonte Matese fault (APMF) form the 30 km long southern Matese Fault system. The average slip rate varies along-strike, as expected, with the largest Upper Pleistocene–Holocene slip rates being ∼ 0.5 mm yr−1.
The mature mountain front morphology can be explained by low uplift rates and the long geologic history of the fault. The onset of fault activity can be dated back to the early Quaternary (and possibly earlier). The combined presence of small post-LGM fault scarps at the foot of the mature mountain front can be explained by recent resurrection (or acceleration) of fault activity after a period of inactivity or of very low slip rate. This implies slip rate variability through time. Multiple slip episodes have been constrained between 9983 BCE and 1635 CE on the GF and between 905 BCE and 1390 CE on the APMF. The two sites are compatible with surface faulting events that could have ruptured the entire southern Matese fault system. Separate activation of the GF and APMF is also compatible with the observed displacements. The estimated seismogenic potential for each individual fault is M 6.1 for the GF or Raviscanina fault section alone and M 6.5 for the APMF alone. In cases that include rupturing of the entire southern Matese fault system, the seismogenic potential would be up to M 6.8. The observed displacements on the GF and APMF are compatible with activations during some poorly constrained historical earthquakes, such as the 1293 (M 5.8), 1349 (M 6.8; southern prolongation of the rupture on the Aquae Iuliae fault?) and 346 CE earthquakes. A fault rupture during the 847 CE poorly constrained earthquake is also compatible with the dated displacements.
All datasets presented in this study are included in the article and in the Supplement.
The supplement related to this article is available online at: https://doi.org/10.5194/se-13-553-2022-supplement.
PB contributed to conceptualization, funding acquisition, investigation (field mapping), data curation, data analysis, supervision, and validation. EA contributed to conceptualization, investigation (field mapping), data curation, and data analysis. VA and PA contributed to investigation (field mapping), data curation, and data analysis (mostly Quaternary geology and geomorphology). PP analysed the tephra layers. ACT analysed the San Potito paleosol. BRJ performed experiments for sample dating. PB and EA wrote the original draft. All the authors contributed to review and editing of the manuscript.
The contact author has declared that neither they nor their co-authors have any competing interests.
Publisher's note: Copernicus Publications remains neutral with regard to jurisdictional claims in published maps and institutional affiliations.
This article is part of the special issue “Tools, data and models for 3-D seismotectonics: Italy as a key natural laboratory”. It is a result of the workshop on “Tools, data and models for 3D seismotectonics: the Italian laboratory over time”, Perugia, Italy, 9–10 July 2019.
Part of this wok was realized during the PhD project of Eugenio Auciello. We thank Fabio Scarciglia (Department of Biology, Ecology and Earth Sciences (DiBEST), University of Calabria) for providing suggestions regarding the micromorphological analysis of the San Potito paleosol. We thank the editor Frank Pazzaglia and the reviewers Alessandro Maria Michetti, Francesco Pavano, and Ettore Valente for the detailed review and useful comments. We are grateful to former Italian Ministero dell'Ambiente e della Tutela del Territorio e del Mare (MATTM) (now Ministero della Transizione Ecologica) for providing lidar data, distributed with a Creative Commons Attribution 3.0 (CC BY-SA 3.0 IT) license.
This research has been supported by the Departments DiSPUTer and INGEO of “G. d'Annunzio” University of Chieti – Pescara via the “ex 60 %” research funds provided to Paolo Boncio.
This paper was edited by Frank Pazzaglia and reviewed by Alessandro Maria Michetti, Francesco Pavano, and Ettore Valente.
Amato, V., Aucelli, P. P. C., Cesarano, M., Jicha, B., Lebreton, V., Orain, R., Pappone, G., Petrosino, P., and Russo Ermolli, E.: Quaternary evolution of the largest intermontane basin of the Molise Apennine (centralsouthern Italy), Rend. Lincei, 25, 197–216, https://doi.org/10.1007/s12210-014-0324-y, 2014.
Amato, V., Aucelli, P. P. C., Bellucci Sessa, E., Cesarano, M., Incontri, P., Pappone, G., Valente, E., and Vilardo G.: Multidisciplinary approach for fault detection: integration of PS-InSAR, geomorphological, stratigraphic and structural data in the Venafro intermontane basin (Central–Southern Apennines, Italy), Geomorphology, 283, 80–101, https://doi.org/10.1016/j.geomorph.2017.01.027, 2017.
Amato, V., Aucelli, P. P. C., Cesarano, M., Filocamo, F., Leone, N., Petrosino, P., Rosskopf, C. M., Valente, E., Casciello, E., Giralt, S., and Jicha, B. R.: Geomorphic response to late Quaternary tectonics in the axial portion of the Southern Apennines (Italy): A case study from the Calore River valley, Earth Surf. Proc. Land., 43, 2463–2480, https://doi.org/10.1002/esp.4390, 2018.
Arduino, E., Barberis, E., Carraro, F., and Forno, M. G.: Estimating relative ages from iron-oxide/total-iron ratios of soils in the western Po Valley (Italy), Geoderma, 33, 39–52, 1984.
Ascione, A., Ciotoli, G., Bigi, S., Buscher, J., Mazzoli, S., Ruggiero, L., Sciarra, A., Tartarello, M. C., and Valente, E.: Assessing mantle versus crustal sources for non-volcanic degassing along fault zones in the actively extending southern Apennines mountain belt (Italy), Geol. Soc. Am. Bull., 130, 1697e1722, https://doi.org/10.1130/B31869.1, 2018.
Aucelli, P. P. C., Cesarano, M., Di Paola, G., Filocamo, F., and Rosskopf, C. M.: Geomorphological map of the central sector of the Matese Mountains (Southern Italy): an example of complex landscape evolution in a Mediterranean mountain environment, J. Maps, 9, 604–616, https://doi.org/10.1080/17445647.2013.840054, 2013.
Bascomb, C. L.: Distribution of pyrophosphate-extractable iron and organic carbon in soils of various groups, J. Soil Sci., 19, 251–268, 1968.
Benedetti, L., Manighetti, I., Gaudemer, Y., Finkel, R., Malavieille, J., Pou, K., Arnold, M., Aumaître, G., Bourlès, D., and Keddadouche, K.: Earthquake synchrony and clustering on Fucino faults (Central Italy) as revealed from in situ 36Cl exposure dating, J. Geophys. Res.-Sol. Ea., 118, 1–27, https://doi.org/10.1002/jgrb.50299, 2013.
Boncio, P., Dichiarante, A. M., Auciello, E., Saroli, M., and Stoppa, F.: Normal faulting along the western side of the Matese Mountains: implications for active tectonics in the Central Apennines (Italy), J. Struct. Geol., 82, 16–36, https://doi.org/10.1016/j.jsg.2015.10.005, 2016.
Bottari, C., Ferranti, L., Di Maio, R., Frisetti, A., De Paola, C., La Manna, M., Piegari, E., and Marazzi, F.: The 847 CE earthquake in central–southern Italy: New hints from archaeosismological and geophysical investigations in the Volturno River Valley area, Tectonophysics, 774, 228301, https://doi.org/10.1016/j.tecto.2019.228301, 2020.
Bousquet, J. C., Grellet, B., and Sauret, B.: Neotectonic setting of the Benevento area: comparison with the epicentral zone of the Irpinia earthquake, Ann. Geofis., 36, 245–251, 1993.
Brancaccio, L., Cinque, A., Di Crescenzo, G., Santangelo, N., and Scarciglia, F.: Alcune osservazioni sulla tettonica quaternaria nell'Alta Valle del F. Volturno, Il Quaternario, 10, 321–328, 1997.
Bull, W. B.: Relative rates of long-term uplift of mountain fronts, in: Directions in Paleoseismology, Open File Rep. 87–673, edited by: Crone, A. J. and Omdahl, E. M., Geol. Surv. of U. S., Denver, Colorado, 192–202, 1987.
Burt, R.: Soil survey laboratory methods manual, in: Soil Survey Investigations Report No 42, Version 4.0, edited by: Burt, R., United States Department of Agriculture – National Resources Conservation Service (USDA – NRSC), Lincoln, NE, 2004.
Calabrò, R. A., Corrado, S., Di Bucci, D., Robustini, P., and Tornaghi, M.: Thin-skinned vs. thick-skinned tectonics in the Matese Massif, Central–Southern Apennines (Italy), Tectonophysics, 377, 269–297, 2003.
Carafa, M. M. C., Galvani, A., Di Naccio, D., Kastelic, V., Di Lorenzo, C., Miccolis, S., Sepe, V., Pietrantonio, G., Gizzi, C., Massucci, A., Valensise, G., and Bird, P.: Partitioning the ongoing extension of the central Apennines (Italy): Fault slip rates and bulk deformation rates from geodetic and stress data, J. Geophys. Res.-Sol. Ea., 125, e2019JB018956, https://doi.org/10.1029/2019JB018956, 2020.
Carannante, G., Cesarano, M., Pappone, G., and Putignano, M. L.: Note Illustrative della Carta Geologica d'Italia alla scala 1:50 000 foglio 431 (Caserta Est), Servizio Geologico d'Italia, ISPRA, Roma, 2011.
Chiaraluce, L., Di Stefano, R., Tinti, E., Scognamiglio, L., Michele, M., Casarotti, E., Cattaneo, M., De Gori, P., Chiarabba, C., Monachesi, G., Lombardi. A., Valoroso, L., Latorre, D., and Marzorati, S.: The 2016 central Italy seismic sequence: A first look at the mainshocks, aftershocks, and source models, Seismol. Res. Lett., 88, 757–771, https://doi.org/10.1785/0220160221, 2017.
Cinque, A., Ascione, A., and Caiazzo, C.: Distribuzione spazio-temporale e caratterizzazione della fagliazione quaternaria in Appennino meridionale, in: Le ricerche del GNDT nel campo della pericolosità sismica (1996–1999), edited by: Galadini, F., Meletti, C., and Rebez, A., CNR-Gruppo Nazionale per la Difesa dai Terremoti–Rome, pp. 203–218, 2000.
Cinti, F. R., De Martini, P. M., Pantosti, D., Baize, S., Smedile, A., Villani, F., Civico, R., Pucci, S., Lombardi, A. M., Sapia, V., Pizzimenti, L., Caciagli, M., and Brunori, C. A.: 22-kyr-Long Record of Surface Faulting Along the Source of the 30 October 2016 Earthquake (Central Apennines, Italy), From Integrated Paleoseismic Data Sets, J. Geophys. Res.-Sol. Ea., 124, 9021–9048, https://doi.org/10.1029/2019JB017757, 2019.
Civico, R., Pucci, S., Villani, F., Pizzimenti, L., De Martini, P. M., Nappi, R., and the Open EMERGEO Working Group: Surface ruptures following the 30 October 2016 Mw 6.5 Norcia earthquake, central Italy, J. Maps, 14, 151–160, https://doi.org/10.1080/17445647.2018.1441756, 2018.
Corniello, A. and Russo, D.: La piana del medio corso del F. Volturno (Campania) Idrogeologia e vulnerabilità all'inquinamento delle falde, in: Atti 1∘ Convegno Nazionale Protezione e gestione delle acque sotterranee: metodologie, tecnologie e obiettivi, Marano sul Panaro, Modena, 20–22 Settembre 1990, 1, 131–148, 1990.
Cowie, P. A.: A healing-reloading feedback control on the growth rate of seismogenic faults, J. Struct. Geol., 20, 1075–1087, 1998.
Cowie, P. A., Roberts, G. P., Bull, J. M., and Visini, F.: Relationships between fault geometry, slip rate variability and earthquake recurrence in extensional settings, Geophys. J. Int., 189, 143–160, https://doi.org/10.1111/j.1365-246X.2012.05378.x, 2012.
Cowie, P. A., Phillips, R. J., Roberts, G. P., McCaffrey, K., Zijerveld, L. J. J., Gregory, L. C., Faure Walker, J., Wedmore, L. N. J., Dunai, T. J., Binnie, S. A., Freeman, S. P. H. T., Wilcken, K., Shanks, R. P., Huismans, R. S., Papanikolaou, I., Michetti, A. M., and Wilkinson, M.: Orogen-scale uplift in the central Italian Apennines drives episodic behaviour of earthquake faults, Sci. Rep.-UK, 7, 44858, https://doi.org/10.1038/srep44858, 2017.
Cucci, L., D'Addezio, G., Valensise, G., and Burrato, F.: Investigating seismogenic faults in Central and Southern Apennines (Italy): modelling of fault-related landscape features, Ann. Geofis., 39, 603–618, 1996.
D'Agostino, N.: Complete seismic release of tectonic strain and earthquake recurrence in the Apennines (Italy), Geophys. Res. Lett., 41, 1155–1162. https://doi.org/10.1002/2014GL059230, 2014.
D'Argenio, B., Pescatore, T., and Scandone, P.: Schema geologico dell'Appennino meridionale (Campania Lucania), in: Moderne vedute sulla geologica dell'Appennino, Acc. Naz. Lincei, Rome, 183, 49–72, 1973.
De Rita, D. and Giordano, G.: Volcanological and structural evolution of the Roccamonfina volcano: the summit caldera, in: Volcano Instability on the Earth and Other Planets, edited by: McGuire, W. J., Jones, A. P., and Neuberg, J., Geol. Soc. Sp., 110, 209–224, 1996.
De Vivo, B., Rolandi, G., Gans, P. B., Calvert, A., Bohrson, W. A., Spera, F. J., and Belkin, H. E.: New constraints on the pyroclastic eruptive history of the Campanian volcanic plain (Italy), Miner. Petrol., 73, 47–65, 2001.
Deino, A. L., Orsi, G., De Vita, S., and Piochi, M.: The age of the Neapolitan Yellow Tuff caldera-forming eruption (Campi Flegrei caldera, Italy) assessed by dating method, J. Volcanol. Geoth. Res., 133, 157–170, 2004.
Di Bucci, D., Corrado, S., Naso, G., Parotto, M., and Praturlon, A.: Evoluzione tettonica neogenico-quaternaria dell'area molisana, B. Soc. Geol. Ital., 118, 13–30, 1999.
Di Bucci, D., Naso, G., Corrado, S., and Villa, I. M.: Growth, interaction and seismogenic potential of coupled active normal faults (Isernia Basin, central–southern Italy), Terra Nova, 17, 44–55, 2005.
Di Bucci, D., Massa, B., and Zuppetta, A.: Relay ramps in active normal fault zones: A clue to the identification of seismogenic sources (1688 Sannio earthquake, Italy), GSA Bull., 118, 430–448, https://doi.org/10.1130/B25783.1, 2006.
DISS Working Group: Database of Individual Seismogenic Sources (DISS), Version 3.2.1: A compilation of potential sources for earthquakes larger than M 5.5 in Italy and surrounding areas, Istituto Nazionale di Geofisica e Vulcanologia, https://doi.org/10.6092/INGV.IT-DISS3.2.1.diss.rm.ingv.it/diss/, 2018.
Esposito, E., Luongo, G., Marturano, A., and Porfido, S.: Il terremoto di S. Anna del 26 luglio 1805, Mem. Soc. Geol. It., 37, 171–191, 1987.
Faure Walker, J. P., Visini, F., Roberts, G., Galasso, C., McCaffrey, K., and Mildon, Z.: Variable Fault Geometry Suggests Detailed Fault-Slip-Rate Profiles and Geometries Are Needed for Fault-Based Probabilistic Seismic Hazard Assessment (PSHA), B. Seismol. Soc. Am., 109, 110–123, https://doi.org/10.1785/0120180137, 2019.
Faure Walker, J., Boncio, P., Pace, B., Roberts, G., Benedetti, L., Scotti, O., Visini, F., and Peruzza, L.: Fault2SHA Central Apennines database and structuring active fault data for seismic hazard assessment, Scientific Data, 8, 1–20, https://doi.org/10.1038/s41597-021-00868-0, 2021.
Ferranti, L., Oldow, J. S., and Sacchi, M.: Pre-Quaternary orogen-parallel extension in the Southern Apennine belt, Italy, Tectonophysics, 260, 325–347, 1996.
Ferranti, L., Palano, M., Cannavò, F., Mazzella, M. E., Oldow, J. S., Gueguen, E., Mattia, M., and Monaco, C.: Rates of geodetic deformation across active faults in southern Italy, Tectonophysics, 621, 101–122, https://doi.org/10.1016/j.tecto.2014.02.007, 2014.
Ferranti, L., Milano, G., Burrato, P., Palano, M., and Cannavò, F.: The seismogenic structure of the 2013–2014 Matese seismic sequence, southern Italy: implication for the geometry of the Apennines active extensional belt, Geophys. J. Int., 201, 823–837, https://doi.org/10.1093/gji/ggv053, 2015.
Ferrarini, F., Boncio, P., de Nardis, R., Pappone, G., Cesarano, M., Aucelli, P. P. C., and Lavecchia, G.: Segmentation pattern and structural complexities in seismogenic extensional settings: The North Matese Fault System (Central Italy), J. Struct. Geol., 95, 93–112, https://doi.org/10.1016/j.jsg.2016.11.006, 2017.
Fracassi, U. and Valensise, G.: Unveiling the sources of the catastrophic 1456 multiple earthquake: Hints to an unexplored tectonic mechanism in Southern Italy, B. Seismol. Soc. Am., 97, 3, 725–748, https://doi.org/10.1785/0120050250, 2007.
Galadini, F. and Galli, P.: The 346 A.D. earthquake (central–southern Italy): an archaeoseismological approach, Ann. Geophys., 47, 885–905, 2004.
Galadini, F., Meletti, C., and Vittori, E.: Major active faults in Italy: available surficial data, Neth. J. Geosci., 80, 273–296, 2001.
Galli, P. and Galadini, F.: Disruptive earthquakes revealed by faulted archaeological relics in Samnium (Molise, southern Italy), Geophys. Res. Lett., 30, 1266, https://doi.org/10.1029/2002GL016456, 2003.
Galli, P. and Naso, J.: Unmasking the 1349 earthquake source (southern Italy): paleoseismological and archaeoseismological indications from the Aquae Iuliae fault, J. Struct. Geol., 31, 128–149, https://doi.org/10.1016/j.jsg.2008.09.007, 2009.
Galli, P., Galadini, F., and Pantosti, D.: Twenty years of paleoseismology in Italy, Earth-Sci. Rev., 88, 89–117, https://doi.org/10.1016/j.earscirev.2008.01.001, 2008.
Galli, P., Giaccio, B., Messina, P., Peronace, E., Amato, V., Naso, G., Nomade, S., Pereira, A., Piscitelli, S., Bellanova, J., Billi, A., Blamart, D., Galderisi, A., Giocoli, A., Stabile, T., and Thil, F.: Middle to Late Pleistocene activity of the northern Matese fault system (southern Apennines, Italy), Tectonophysics, 699, 61–81, https://doi.org/10.1016/j.tecto.2017.01.007, 2017.
Galli, P., Galderisi, A., Peronace, E., Giaccio, B., Hajdas, I., Messina, P., Pileggi, D., and Polpetta, F.: The awakening of the dormant Mount Vettore fault (2016 central 838 Italy earthquake, Mw 6.6): Paleoseismic clues on its millennial silences, Tectonics, 38, 687–705, https://doi.org/10.1029/2018TC005326, 2019.
Giaccio, B., Niespolo, E. M., Pereira, A., Nomade, S., Renne, P. R., Albert, P. G., Arienzo, I., Regattieri, E., Wagner, B., Zanchetta, G., Gaeta, M., Galli, P., Mannella, G., Peronace, E., Sottili, G., Florindo, F., Leicher, N., Marra, F., and Tomlinson, E. L.: First integrated tephrochronological record for the last ∼ 190 kyr from the Fucino Quaternary lacustrine succession, central Italy, Quaternary Sci. Rev., 158, 211–234, https://doi.org/10.1016/j.quascirev.2017.01.004, 2017.
Giraudi, C.: Middle to Late Holocene glacial variations, periglacial processes and alluvial sedimentation on the higher Apennine massifs (Italy), Quaternary Res., 64, 176–184, 2005.
Giraudi, C. and Frezzotti, M.: Late Pleistocene glacial events in the central Apennines, Italy, Quaternary Res., 48, 280–290, https://doi.org/10.1006/qres.1997.1928, 1997.
Giraudi, C, Magny, M, Zanchetta, G., and Drysdale, R. N.: The Holocene climate evolution of the Mediterranean Italy: A review of the geological continental data, Holocene, 21, 105–115, 2011.
Guidoboni, E., Ferrari, G., Tarabusi, G., Sgattoni, G., Comastri, A., Mariotti, D., Ciuccarelli, C., Bianchi, M. G., and Valensise, G.: CFTI5Med, the new release of the catalogue of strong earthquakes in Italy and in the Mediterranean area, Scientific Data, 6, 80, https://doi.org/10.1038/s41597-019-0091-9, (2019).
ICOMAND: Circular Letter No. 10, International Committee on the Classification of Andisols, New Zealand Soil Bureau, Lower Hutt, New Zealand, 1988.
Jicha, B. R., Singer, B. S., and Sobol, P.: Re-evaluation of the ages of sanidine standards and supereruptions in the western US using a Noblesse multi-collector mass spectrometer, Chem. Geol., 431, 54–66, https://doi.org/10.1016/j.chemgeo.2016.03.024, 2016.
Leone, N.: Studio dell'evoluzione quaternaria di alcune conche intermontane dell'Appennino campano-molisano, a supporto della pianificazione e gestione del territorio e della prevenzione del rischio sismico, unpublished PhD thesis (Tesi di Dottorato in Scienze Biologiche, Biomediche dell'Ambiente e del Territorio), Università degli Studi del Molise, Italy, https://iris.unimol.it/handle/11695/75943 (last access: 29 October 2021), 2016 (in Italian).
Locati, M., Camassi, R., Rovida, A., Ercolani, E., Bernardini, F., Castelli, V., Caracciolo, C. H., Tertulliani, A., Rossi, A., Azzaro, R., D'Amico, S., and Antonucci, A.: Database Macrosismico Italiano (DBMI15), versione 3.0, Istituto Nazionale di Geofisica e Vulcanologia (INGV), https://doi.org/10.13127/DBMI/DBMI15.3, 2021.
Luhr, J. F. and Giannetti, B.: The Brown Leucitic Tuff of Roccamonfina Volcano (Roman Region, Italy), Contrib. Mineral. Petr., 95, 420–436, 1987.
McCalpin, J. P. (Ed.): Paleoseismology, 2nd edn., International Geophysics 95, Academic Press, USA, 629 pp., 2009.
Mehra, O. P. and Jackson, M. L.: Iron oxide removal from soils and clays by a dithionite-citrate system buffered with sodium bicarbonate, Clay. Clay Miner., 7, 317–327, 1960.
Min, K., Mundil, R., Renne, P. R., and Ludwig, K. R.: A test for systematic errors in geochronology through comparison with analysis of a 1.1-Ga rhyolite, Geochim. Cosmochim. Ac., 64, 73–98, 2000.
Parfitt, R. L. and Wilson, A. D.: Estimation of allophane and halloysite in three sequences of volcanic soils, New Zealand, in: Volcanic Soils, edited by: Fernandez Caldas, E. and Yaalon, D. H., Catena Supplement 7, Catena Verlag, Braunschweig, Desdedt, Germany, 1–8, 1985.
Patacca, E. and Scandone, P.: Geology of the southern Apennines, B. Soc. Geol. Ital., Spec. Issue, 7, 75–119. 2007.
Pavlides, S. and Caputo, R.: Magnitude versus faults' surface parameters: quantitative relationships from the Aegean Region, Tectonophysics, 380, 159–188, 2004.
Porfido, S., Esposito, E., Vittori, E., Tranfaglia, G., Michetti, A. M., Blumetti, M., Ferreli, L., Guerrieri, L., and Serva, L.: Areal distribution of ground effects induced by strong earthquakes in the Southern Apennines (Italy), Surv. Geophys., 23, 529–562, 2002.
Roberts, G. P.: Variation in fault-slip directions along active and segmented normal fault systems, J. Struct. Geol., 18, 835–845, 1996.
Roberts, G. P. and Michetti, A. M.: Spatial and temporal variations in growth rates along active normal fault systems: an example from The Lazio–Abruzzo Apennines, central Italy, J. Struct. Geol., 26, 339–376, 2004.
Rolandi, G., Bellucci, F., Heizler, M. T., Belkin H. E., and De Vivo, B.: Tectonic controls on the genesis of ignimbrites from the Campanian Volcanic Zone, southern Italy, Miner. Petrol., 79, 3–31, 2003.
Rouchon, V., Gillot, P. Y., Quidelleur, X., Chiesa, S., and Floris, B.: Temporal evolution of the Roccamonfina volcanic complex (Pleistocene), Central Italy, J. Volcanol. Geoth. Res., 177, 500–514, https://doi.org/10.1016/j.jvolgeores.2008.07.016, 2008.
Rovida, A., Locati, M., Camassi, R., Lolli, B., and Gasperini, P.: The Italian earthquake catalogue CPTI15, B. Earthq. Eng., 18, 2953–2984, https://doi.org/10.1007/s10518-020-00818-y, 2020.
Scarciglia, F., Mercatante, G., Fondevilla, V., Anadón, R., Oms, O., Donato, P., Agnini, C., Papini, M., Rook, L., and Ghinassi, M.: Pleistocene paleosol development and paleoenvironmental dynamics in East Africa: A multiproxy record from the Homo-bearing Aalat pedostratigraphic succession, Dandiero basin (Eritrea), Quaternary Sci. Rev., 191, 275–298, 2018.
Schwertmann, U.: Differenzierung der Eisenoxyde des Bodens durch photochemische Extraktion mit saurer Ammoniumoxalat-Lösung, Z. Pflanzenernahr. Dung. Bodenkd., 105, 194–202, 1964.
Serva, L., Esposito, E., Guerrieri, L., Porfido, S., Vittori, E., and Comerci, V.: Environmental effects from five historical earthquakes in southern Apennines (Italy) and macroseismic intensity assessment: Contribution to INQUA EEE Scale Project, Quatern. Int., 173, 30–44, 2007.
Stucchi, M., Meletti, C., Montaldo, V., Crowley, H., Calvi, G. M., and Boschi, E.: Seismic hazard assessment (2003-2009) for the Italian building code, B. Seismol. Soc. Am., 101, 1885–1911, https://doi.org/10.1785/0120100130, 2011.
Styron, R. and Pagani, M.: The GEM Global Active Faults Database, Earthq. Spectra, 36, 160–180, 2020.
Tangari, A. C., Scarciglia, F., Piluso, E., Marinangeli, L., and Pompilio, L.: Role of weathering of pillow basalt, pyroclastic input and geomorphic processes on the genesis of the Monte Cerviero upland soils (Calabria, Italy), Catena, 171, 299–315, 2018.
Valente, E., Buscher, J. T., Jourdan, F., Petrosino, P., Reddy, S. M., Tavani, S., Corradetti, A., and Ascione, A.: Constraining mountain front tectonic activity in extensional setting from geomorphology and Quaternary stratigraphy: A case study from the Matese ridge, southern Apennines, Quaternary Sci. Rev., 219, 47–67, https://doi.org/10.1016/j.quascirev.2019.07.001, 2019.
Valentini, A., Pace, B., Boncio, P., Visini, F., Pagliaroli, A., and Pergalani, F.: Definition of seismic input from fault-based PSHA: Remarks after the 2016 central Italy earthquake sequence, Tectonics, 38, 595–620, https://doi.org/10.1029/2018TC005086, 2019.
van Reeuwijk, L. P.: Procedures for soil analysis, Technical Paper, 9, 6th edn., International Soil Reference and Information Centre, USA, 119 pp., 2002.
Vitale, S. and Ciarcia, S.: Tectono-stratigraphic setting of the Campania region (southern Italy), J. Maps, 14, 9–21, https://doi.org/10.1080/17445647.2018.1424655, 2018.
Wells, D. L. and Coppersmith, K. J.: New Empirical Relationships among Magnitude, Rupture Length, Rupture Width, Rupture Area, and Surface Displacement, B. Seismol. Soc. Am., 84, 974–1002, 1994.
Wesnousky, S. G.: Displacement and Geometrical Characteristics of Earthquake Surface Ruptures: Issues and Implications for Seismic-Hazard Analysis and the Process of Earthquake Rupture, B. Seismol. Soc. Am., 98, 1609–1632, https://doi.org/10.1785/0120070111, 2008.