the Creative Commons Attribution 4.0 License.
the Creative Commons Attribution 4.0 License.
 | 24 Mar 2022
Matrix gas flow through “impermeable” rocks – shales and tight sandstone
Julian Mecklenburgh
Yusuf Bashir
The effective pressure sensitivity of gas flow through two shales (Bowland and Haynesville shales) and a tight gas sandstone (Pennant sandstone) was measured over the typical range of reservoir pressure conditions. These are low-permeability rocks such as can be exploited as cap rocks above reservoirs that might be developed to store compressed air, methane, or hydrogen or to bury waste carbon dioxide, all of which may become important components of the forthcoming major changes in methods of energy generation and storage. Knowledge of the petrophysical properties of such tight rocks will be of great importance in such developments. All three rocks display only a small range in log10 permeability at low pressures, but these decrease at dramatically different rates with increasing effective pressure, and the rate of decrease itself decreases with pressure, as the rocks stiffen. The pressure sensitivity of the bulk moduli of each of these rocks was also measured and used to formulate a description of the permeability decrease in terms of the progressive closure of narrow, crack-like pores with increasing pressure. In the case of the shales in particular, only a very small proportion of the total porosity takes part in the flow of gases, particularly along the bedding layering.
- Article
(6130 KB) - Full-text XML
- BibTeX
- EndNote


Shales (laminated mudstones) are of particular importance because their fine grain size and tight pore structure gives them a particularly low matrix permeability and hence makes them excellent cap rocks for the containment of oil, water, and gases. This includes their future use as a sealant for the storage containment of the fuel gases hydrogen and methane, as compressed air storage, and for the disposal deep underground of waste liquids and gases, including waste carbon dioxide. Organic shales are source rocks for petroleum and become source, reservoir, and seal for unconventional natural gas (shale gas). The enormous economic importance of shales cannot be overstated, and this demands an ever-increasing understanding of their petrophysical properties.
Compared to conventional reservoir rock materials (sandstones, limestones), shales are particularly difficult to work with. Their commonly laminated nature often makes them highly fissile, with a tendency to split along the layering. Thus coring and cutting operations for sample preparation are often difficult, and their physical properties (elasticity, mechanical strength, permeability, elastic wave velocities) are generally anisotropic. Determination of properties that involve working with elevated pore pressures become time-dependent, according to the slow rates of fluid permeation though the microstructure in response to applied effective pressure changes, and the rock itself may display time-dependent deformation (creep) under load. Mineralogically, shales can be highly variable, particularly with respect to the relative proportions of the major mineral components: framework silicates, clays and other phyllosilicates, and carbonates (Lazar et al., 2015; Diaz et al., 2013; Dowey and Taylor, 2020). This can be expected to be reflected in the spectrum of petrophysical properties of shales.
In contrast to shales, tight gas sandstones (e.g. Zee Ma et al., 2016) may display similarly low permeabilities and porosities but lack extreme fissility and typically possess a matrix of coarser-grained framework silicate minerals (quartz and feldspar), with primary pore spaces filled with some detrital micas but also authigenic growths of clay minerals and hydrated oxide phases. Thus their properties tend to form an upper (more permeable and less anisotropic) bound to the range of properties displayed by shales. For this reason, we have included such a rock type in this study for comparison. Here we also present a study of the matrix permeability of two rather different shales. Permeability and storativity were measured parallel to the layering under hydrostatic loading conditions as a function of total confining pressure and pore pressure of argon gas and normal to layering at one pore pressure only. Results were fitted to a simple physical model. The spectrum of behaviours observed provides insight into the physical controls on the matrix permeabilities of these rocks.
Two shale samples recovered from depth in boreholes were used. The samples are strikingly mineralogically and microstructurally different. They were characterized mineralogically by quantified X-ray diffraction analysis, which was also used to estimate grain density using published mineral densities. All samples were oven-dried at 60 ∘C until constant weight (at least 1 week) and then maintained at that temperature until use. All experiments were carried out in this oven-dried state. Other than with the degree of water saturation in the as-supplied state, it can be very difficult to test shales with varying degrees of controlled or with total water saturation. The sandstone studied was from a surface exposure but was treated in the same way as the shales.
2.1 Pennant sandstone
This is a hard, grey marine sandstone (Fig. 1a and b) of upper Carboniferous age (Kelling, 2017) that outcrops in South Wales, Great Britain. We have previously reported rock mechanics studies on this rock in Hackston and Rutter (2016) and Rutter and Hackston (2017). All measurements reported were made normal to bedding. Bedding planes are not apparent in the hand specimen.
Modal proportions (vol % solids) were as follows: quartz and feldspar 73.7; phyllosilicates 9.8; (estimated uncertainties ± 4 % of cited percentages). Other key physical properties are as follows: grain density 2661 ± 120 kg m−3; bulk density 2558 ± 35 kg m−3; total porosity 3.89 ± 0.04 % from XRD or 4.60 ± 0.01 % using a helium porosimeter.
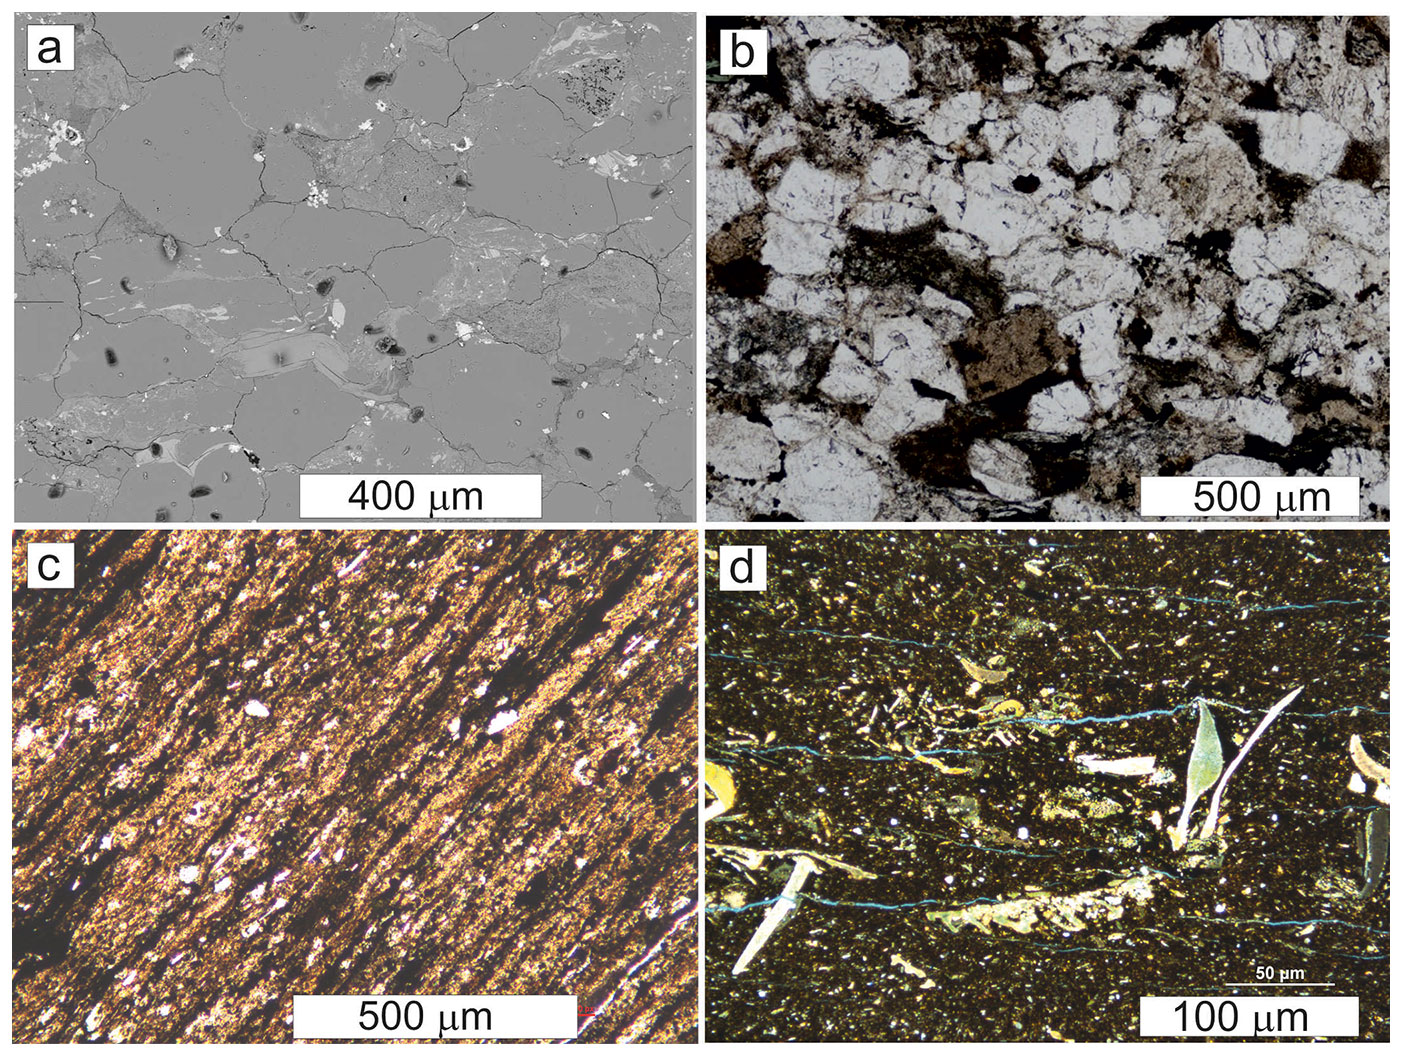
Figure 1Microstructures of the rocks tested. (a) Back-scattered electron (BSE) image and (b) optical image (plane-polarized light, PPL) of Pennant sandstone, bedding trace parallel to long side of image, showing large quartz grains (mid-grey in a) with sutured contacts caused by pressure solution and remaining pore spaces largely filled by iron hydroxide (white in a) and authigenic clay minerals (light grey in a), reducing the overall porosity to 4.6 %. (c) Microstructure (PPL image of polished thin section) of Bowland shale, finely and homogeneously banded with elongate clusters of organic material and pyrite (black) and silt-sized grains of quartz in a matrix of elongate clusters of phyllosilicate (clay and detrital micas) grains. (d) Microstructure of Haynesville shale. (PPL image of polished thin section; long side of image is parallel to layering.) Bioturbation destroys continuity of layering. Rock is only weakly banded but nevertheless fissile; bedding-parallel cracks can be seen, opened during thin-section preparation. Calcareous fossil fragments and authigenic calcite-filled voids, in matrix of finer-grained phyllosilicate (clays and detrital micas) and fine silt-sized framework silicates.
2.2 Bowland shale
This is a phyllosilicate-rich, carbonate-poor siliceous mudstone (Fig. 1c), which is very pyrite-rich, (8.3 wt %) and of lower Carboniferous age. It was the target formation for exploitation of shale gas in northern England.
Depth was 2060.55 m, and the provider sample identifier was IG 5-8W. The location was west Manchester, UK.
Modal proportions (vol % solids) were as follows: quartz and pyrite 38.4; phyllosilicates 61.6; carbonates 0 (estimated uncertainties ± 4 % of cited percentages).
Other key physical properties are as follows: grain density 2842 ± 120 kg m−3; bulk density 2714 ± 38 kg m−3; total porosity 4.50 ± 0.02 % from XRD or 4.6 ± 0.1 % using a helium porosimeter.
Total organic carbon was 1.14 ± 0.2 wt %. Water loss from drying was 0.74 ± 0.15 vol %, and hence initial water saturation was 13 %.
2.3 Haynesville shale
This is a phyllosilicate-poor, carbonate-rich siliceous mudstone (Fig. 1d). It is pyrite-poor (0.7 wt %), of upper Jurassic age (Hammes et al., 2011), and has successfully been exploited for shale gas in the southern United States.
The sample location was Hewitt Land LLC well, Caspian Field, de Soto parish, Louisiana, USA, and the core was taken from a depth of 3730.6 m.
Modal proportions (vol % solids) were as follows: quartz and feldspar and pyrite 34.5; phyllosilicates 13.4; carbonates 52.1 (estimated uncertainties ± 4 % of cited percentages).
Sample grain density is 2703 ± 120 kg m−3; bulk density is 2453 ± 35 kg m−3; total porosity is 9.26 ± 0.04 % from XRD or 7.6 ± 0.1 % using a helium porosimeter. Total organic carbon was 1.3 ± 0.2 wt %.
Defining velocity anisotropy as , the anisotropies of Bowland and Haynesville shales are respectively 30.7 % and 32.2 % at 100 MPa total confining pressure. The velocity anisotropy of Pennant sandstone at elevated pressure was not determined. At room pressure it is 15.5 % comparing velocity normal to bedding (slower) with mean velocity parallel to bedding, whilst it is 3.1 % for velocities measured in the plane of the bedding. Anisotropies will be less at elevated pressure.
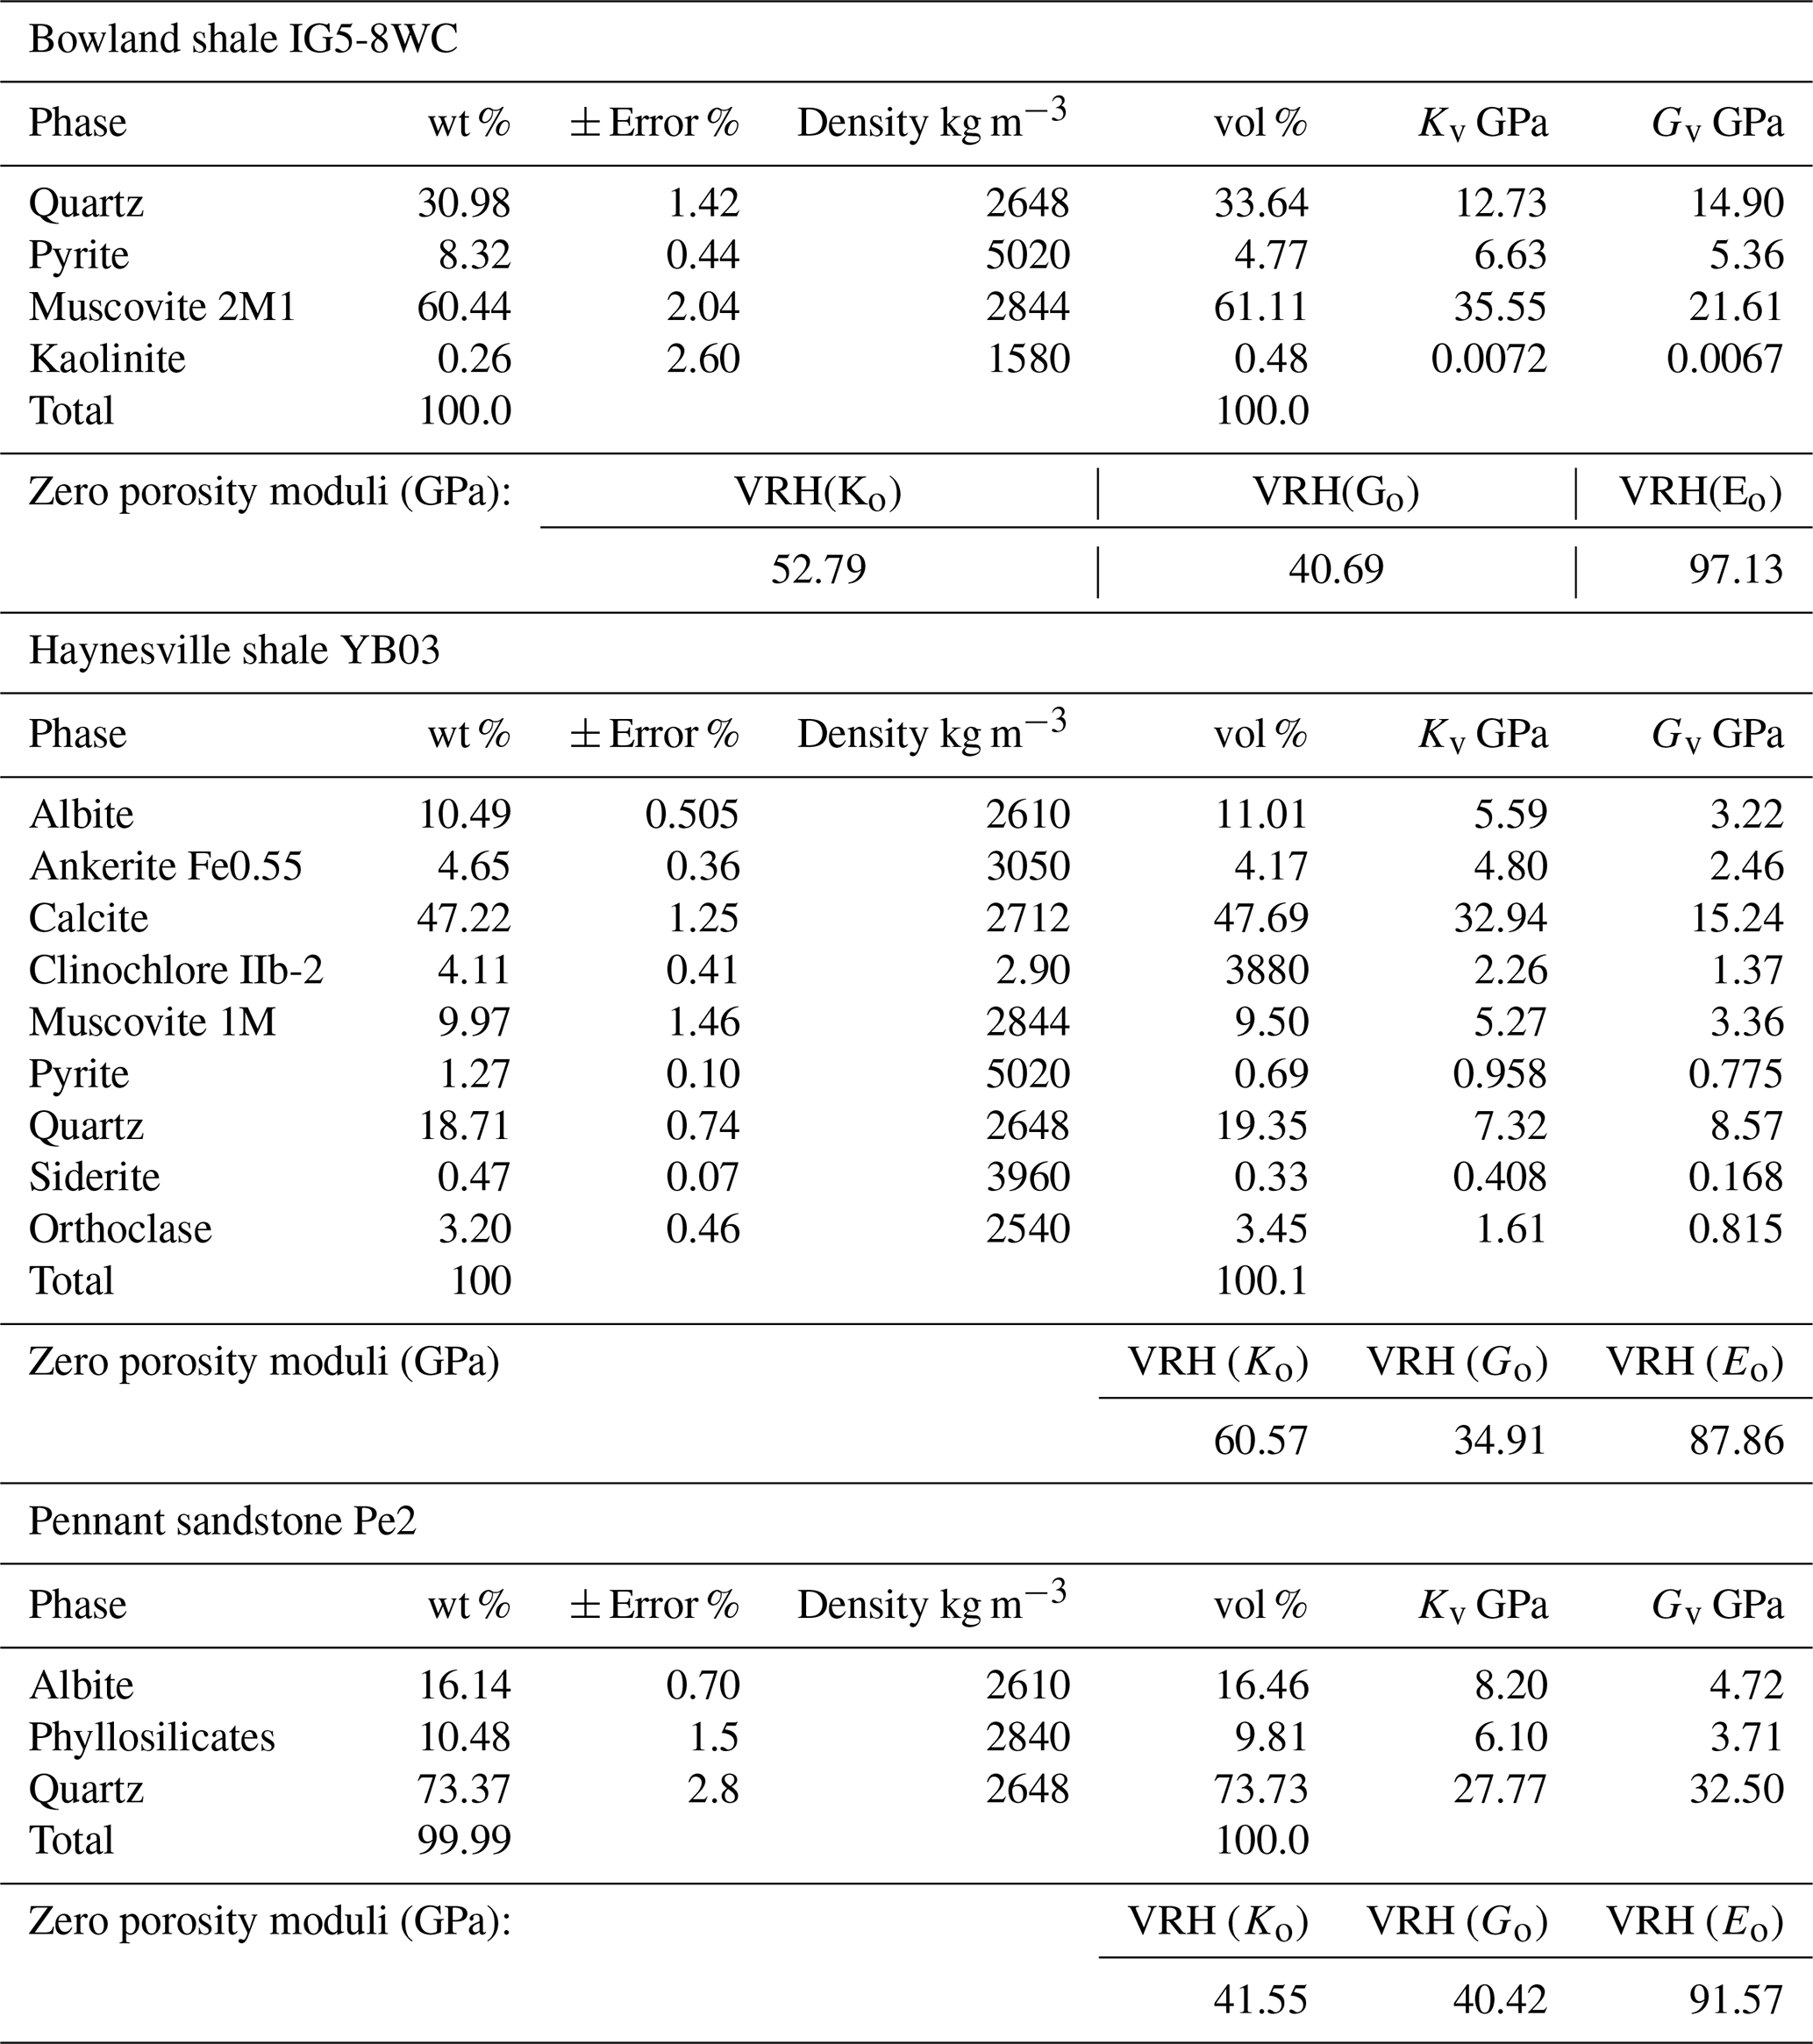
The weight percent values for the mineralogical composition of all rock types were converted to volume percent using tabulated densities from the literature (Mavko et al., 2009; Mondol et al., 2008), and together with averaged mineral elastic properties the bulk elastic properties of the rocks estimated were as Voigt–Reuss–Hill (VRH) averages, assuming zero porosity. These are listed in Table 1.
Some comparisons of behaviour are made with previously published (Mckernan et al., 2017) data on Whitby shale. This is a well-foliated, silt-bearing, clay-rich, carbonate-poor mudstone of liassic age, with 8.1 % total porosity and 1.5 % volume amorphous organic matter.
Table 1Phase fractions, mineral densities, and Voigt-averaged bulk and shear moduli Kv and Gv (from literature) and calculated zero porosity elastic moduli as Voigt–Reuss–Hill (VRH) averages (GPa) for Bowland and Haynesville shales and for Pennant sandstone. Organic fraction not included. Mineral phase Reuss-average elastic moduli can be calculated from the other values supplied. K0= bulk modulus; G0= shear modulus; E0= Young's modulus (VRH-averaged whole-rock values assuming isotropy). Modal volume percent is the percentage of the solids.
3.1 Permeability measurements
Permeability measurements were made on cylindrical samples of either 25.4 or 20 mm nominal diameter, cut to lengths of the same order or shorter. The latter is generally necessary for very low-permeability rocks, but quite apart from this it was not possible to obtain long cores from slabbed drill cores of the shales. Problems were also encountered during shale specimen preparation owing to the friable nature of these materials. Porous sintered stainless steel (316L) filter plates (17 % porosity) were placed at either end of the sample to spread the pore fluid uniformly over the ends of the rock samples. The assembly was jacketed in a heat-shrinkable polymer jacket, so that pore fluid pressures less than the confining pressure could be applied. Confining pressures (hydraulic oil, a synthetic ester, di-octyl sebacate, trade name Reolube DOS®) ranging up to a little over 100 MPa were used. This fluid has the advantage of a relatively small rate of change in viscosity with pressure (see Rutter and Mecklenburgh, 2017, 2018, for further details). In all experiments argon gas was used as the pore fluid, at pressures ranging up to 80 MPa. The higher viscosity of a liquid pore fluid would have led to very long experimental durations. The confining and pore pressures ranges cover the full extent of likely pressures to be encountered in engineering operations to depths of ca. 4 km.
Although it was intended that experiments would be carried out under hydrostatic confinement conditions, the presence of a contrast in elastic properties of the specimen against the porous end plates and the steel loading pistons induces a shear stress along these interfaces. This in turn causes the stress state in the specimen to deviate from hydrostatic and to reduce the average mean stress. Deviations from hydrostatic loading are most severe when the length of the specimen becomes less than twice the diameter. For this reason, mechanical testing of rocks is usually carried out on specimens with a length : diameter ratio of 2.5:1 or more. Finite-element analysis (FEA) of the stress state in rocks confined between steel end plates was carried out to assess the expected departures from hydrostatic loading, and the effects predicted must be borne in mind when interpreting the permeability data.
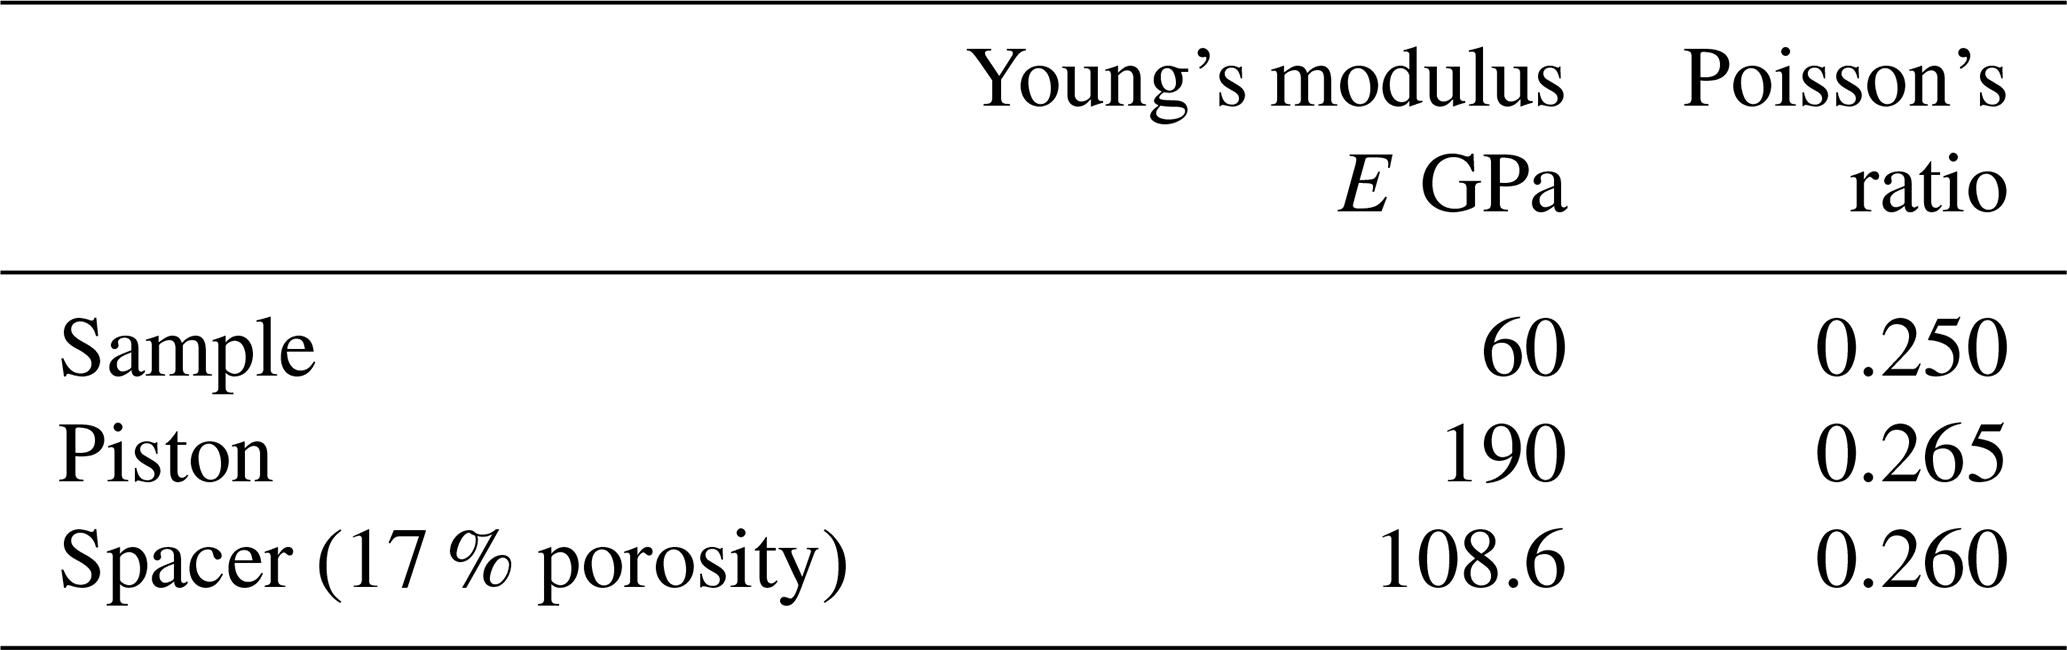
Figure 2 presents the results of finite-element analyses showing stress profiles along the axes of samples with a length : diameter ratios (a) 2.5:1 and (b) 1:1, with a hydrostatic pressure of 200 MPa applied to the outer cylindrical surfaces. At each end of the sample a 3 mm thick, porous sintered steel disc was placed. Positions of boundaries between the solid steel pistons, the porous discs and the sample material are indicated, and the elastic moduli of these materials are given in Table 2. In both cases the sample diameter was 25.0 mm. Along-axis stress component variations were more varied than across the radius. Most of the stress heterogeneity (departure from the applied 200 MPa hydrostatic pressure) resides in and immediately adjacent to these discs, and for each stress component it is of similar magnitude for both specimen lengths. Within the greater part of the sample volume in each case the axial normal stress is higher than the radial normal stress, and these components are similar to the principal stress values. For the longer sample, the stress state is near hydrostatic over 0.8 of the specimen length, but in the case of the shorter sample the stress components are notably non-hydrostatic over most of the specimen length, with maximum differential stress reaching 15 MPa (7 % of the applied hydrostatic stress) in the central part of the sample.
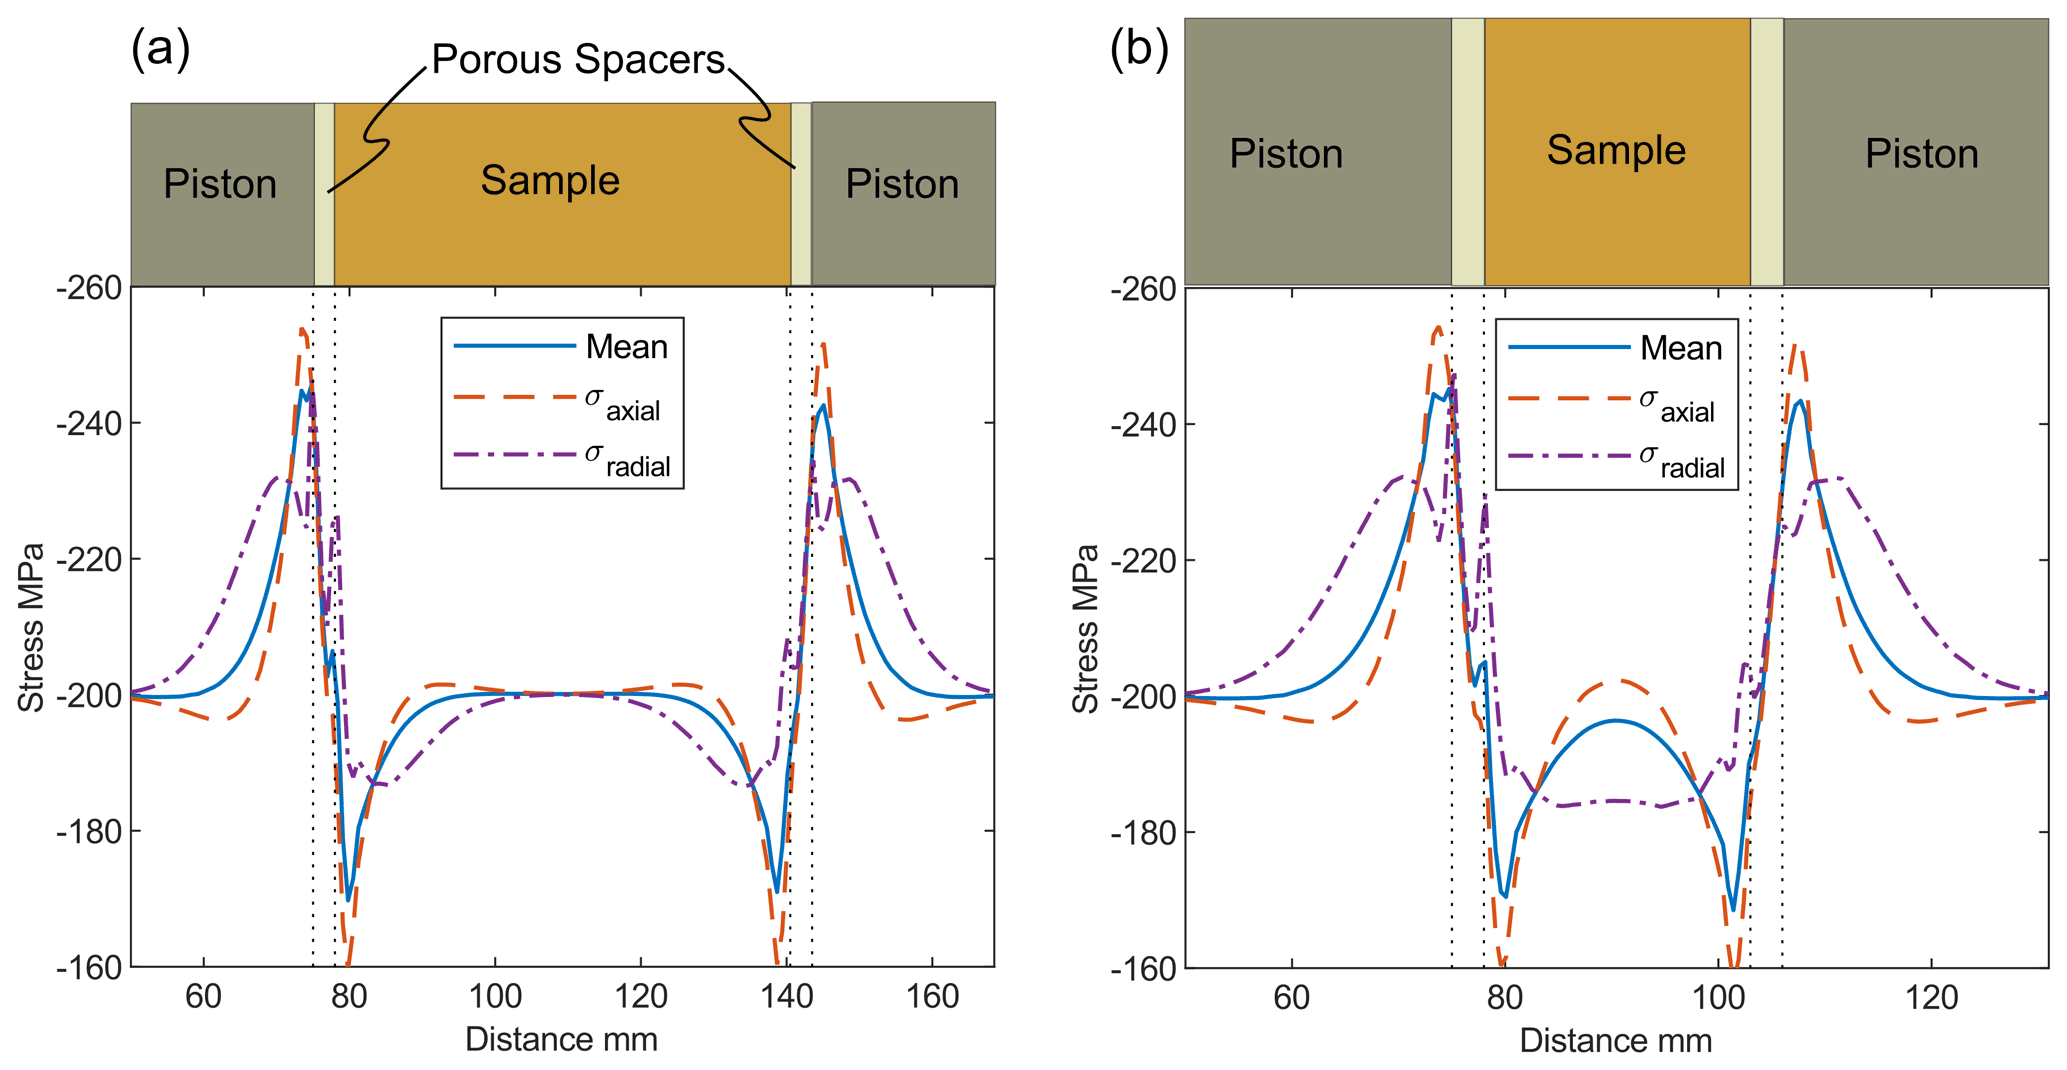
Figure 2Results of finite-element analyses showing stress profiles of mean stress, axial normal stress, and radial normal stress along the axes of samples with a length : diameter ratios (a) 2.5:1 and (b) 1:1, each with a diameter of 25.4 mm. At the top of each figure is a scaled schematic of the assembly; note the aspect ratio of the sample in each case. Externally applied hydrostatic stress was 200 MPa. For the longer sample the stress state in the greater part of the sample was near homogeneous, but for the shorter one a differential stress on the order of 7 % of the applied hydrostatic stress was induced.
A small number of permeability measurements were made using the pulse-transient-decay method of Brace et al. (1968), as modified by Cui et al. (2009). We have previously shown (Mckernan et al., 2017) that this method produces data in excellent agreement with the oscillating pore pressure method, which was used for almost all of the experimental results reported here (Kranz et al., 1990; Fischer and Paterson, 1992; Faulkner and Rutter, 2000; Bernabé et al., 2006; Mckernan et al., 2017). Whilst keeping the confining pressure constant and after establishing a constant pore pressure in the sample, a sinusoidal oscillation of pore pressure, of known period and of an amplitude of about 1 MPa, was applied at one end of the sample (upstream). As the pressure wave propagated through the sample, it became phase-shifted and lost amplitude. The amplitude ratio (gain) and phase shift angle were measured. The solution to the transport equation for these measured parameters is given by Bernabé et al. (2006) in terms of two dimensionless numbers, η and ξ, from which permeability and sample storativity can be calculated using
Here, S is the cross-sectional area of the sample (normal to flow path), L is specimen length, βD is downstream volume storativity and β is specimen storativity, T is the period of the pore pressure oscillation, k is specimen permeability, and μ is viscosity of the pore fluid. Argon gas viscosity as a function of pressure data was reported by Michels et al. (1954). Storativity is the product of the volume of the space occupied by the fluid with the pore fluid (isothermal) gas compressibility. Argon compressibility is non-linear over the pore pressure range used (Gosman et al., 1969) and substantially non-ideal above about 20 MPa. , where ϕ is specimen effective porosity, Vs is total specimen volume, and Vd is downstream reservoir volume. It cannot be assumed that effective (conductive) porosity estimated from permeability measurements will necessarily be equal to total porosity measured independently.
The apparatus used was the same as used for experiments reported by Rutter and Mecklenburgh (2017, 2018). Pressure transducers with a resolution of 0.02 MPa were used for pore pressure measurements, and confining pressure was measured to an accuracy better than 0.3 MPa. The minimum pore pressure used was 10.0 MPa. This is sufficiently high to avoid exsorption of gas from mineral surfaces and to avoid slip flow of gas through pore spaces (Knudsen/Klinkenberg effect, Mckernan et al., 2017). It was determined that the experimental assembly shows no detectable gas flow when a rock sample is replaced by an impermeable steel plug.
Table 2Elastic constants of the components in the finite-element models.
3.2 Error, uncertainty, and reproducibility
The accuracy of reported permeability depends on uncertainties of the parameters in Eq. (1). η and ξ can be measured to within about 2 % of the true value, and S, T, L, and μ to within 1 %. The least certainly known parameter is the downstream volume, which is determined as the difference between the total volume of the pore pressure pipework measured with and without the downstream pipework connected, each measured by the pore pressure change produced by a known volumometer piston displacement. The downstream reservoir volume Vd was measured to be 445 ± 30 mm3, including the volume of the downstream porous steel filter. These uncertainties translate to an accuracy of log10 permeability of ± 0.1 log units. This is small, given that permeability varies with pressure by 1 to 3 orders of magnitude.
The largest apparent uncertainties in reported permeability data arise from hysteretic changes in the behaviour of the rock itself as effective pressure is cycled and will be discussed when the data are presented.
3.3 Bulk modulus measurements
Bulk modulus measurements as a function of confining and pore pressures were made as far as possible on physically the same samples that were used for the permeability measurements, to avoid any influence of mineralogical or microstructural differences. Measurements were made over a range of total confining pressures up to 200 MPa after the permeability measurements were made, with constant pore pressures of argon gas, typically at nominally 10, 35, 67, and 100 MPa. The method involved measuring the volume of pore fluid (argon gas) progressively expelled as the total confining pressure was increased at constant pore pressure. This measures the compressibility of the pore spaces. P-wave acoustic velocity measurements were made at the same time, although these data are not reported here.
Unlike for permeability measurements, porous steel plates were not used at the ends of the specimens for pore fluid displacement measurements. For the relatively porous and permeable Haynesville shale and Pennant sandstone, a short hole, normally 15 mm long and 1.5 mm in diameter, was drilled into the end of the specimen facing the pore pressure inlet pipe, to facilitate the flow of gas into and out of the specimen. This was thought to be unlikely to be adequate for the lower-porosity and lower-permeability Bowland shale; therefore samples were cut in half parallel to the long axis so that a 2 mm thick, porous steel plate could be inserted, to facilitate gas flow over a wide surface area of the rock, yet without affecting the P-wave velocity along the length of the specimen.
When considering the results, the procedure for pressure application is of importance. For the tests with pore pressure, the application of a confining pressure slightly greater than the eventual pore pressure was made, followed by the application of the pore pressure. Then the total confining pressure was increased stepwise away from the constant pore pressure. Thus tests at high pore pressure have been exposed to much higher effective pressures before the application of pore pressure than when the test pore pressure is to be low.
When pore pressure was made non-zero, constant pore pressure was maintained using a servo-controlled pore volumometer. Each applied increment of the confining pressure caused a small elastic contraction of the pore volume that attempts to raise the pore pressure. The servo-controller backs off the moveable piston in the pore volumometer in order to keep the pore pressure constant. The distance swept by the volumometer piston at constant pore pressure allows the volume of gas expelled to be measured to a resolution of 0.4 mm3. In this way the history of pore volume change at constant pore pressure during progressive loading by the confining pressure can be determined. The compressibility of the pore space Cpc is given by the fractional change in pore volume Vp in response to a change in confining pressure Pc at constant pore pressure Pp (Zimmerman, 1991) and is the reciprocal of the dry pore space bulk modulus Kϕ:
Note Vp=ϕVb, where Vb is the total sample volume. Kdry is the bulk modulus of the porous aggregate. Its reciprocal compressibility Cbc, the bulk volume change in response to a change in confining pressure at constant pore pressure, is defined by
where Vb is the bulk volume, including the pore space. The zero porosity bulk modulus of the constituent mineral aggregate is defined as Ko (Table 1); then the dry bulk modulus Kdry (=Kbc) is given (Mavko et al., 2009) by
A decrease in permeability with increasing Terzaghi effective pressure (Pc−Pp) (Terzaghi, 1923) is primarily due to the pressure dependence of Kdry, leading to progressive closure of pore space. Thus the independent determination of Kdry from pore volumometry measurements provides a basis for the interpretation of the pressure sensitivity of permeability.
Note that we have no means of measuring directly the influence of pore pressure change on bulk deformation of the sample, characterized by the compressibility Cbp, or
This would require strain gauges or an equivalent to be mounted on the outer surface of the rock sample (e.g. Hasanov et al., 2019, 2020). However, Kbp can be obtained from
Biot and Willis (1957), Skempton (1960), and Nur and Byerlee (1971) obtained a theoretical expression for the effective pressure coefficient (Biot coefficient) m for elastic deformations (including deformations of pore spaces) of a mechanically linear, homogeneous, and isotropic rock, so that effective pressure and
Note that this effective pressure coefficient is not necessarily the same as that describing empirically the influence of pore pressure on permeability (called n in this paper) or on elastic wave velocities or the failure characteristics of rocks (whether frictional sliding or intact rock failure).
m is also given by
Sample storativity is related to these stiffness parameters by
where Kf is pore fluid bulk modulus (Hasanov et al., 2019).
In all calculations we assume Ko is negligibly sensitive to effective pressure, compared to porous rock stiffnesses such as Kdry, following data for Ko for minerals such as quartz via ultrasonic measurements (e.g. Calderón et al., 2007, who give Ko=37.5 (GPa) and 4.7 ⋅ P (GPa)). Similar pressure coefficients are reported for a wide range of other silicate minerals (Anderson, 2007) and for phyllosilicates (Zanazzi and Pavese, 2002).
A full tabulation of experimental results is given in the supplementary data file DF1 (Rutter and Mecklenburgh, 2022).
4.1 Permeability results
Experimental conditions and results are presented graphically in Fig. 3 through Fig. 8. The first pressure cycle applied to most rocks results in higher permeabilities and a relatively rapid rate of decrease in permeability with pressure, as inelastic cracks become progressively and permanently closed. Subsequent pressure cycles up to the maximum pressure previously attained are more nearly elastic and reproducible, although there can be a small tendency to reduce permeability slightly with subsequent pressure cycles. The first stage in a suite of permeability measurements covering a wide range of confining and pore pressures therefore must be to take the sample to the maximum effective pressure to which it is to be exposed, to ensure closure of these inelastic cracks and pores up to that pressure.
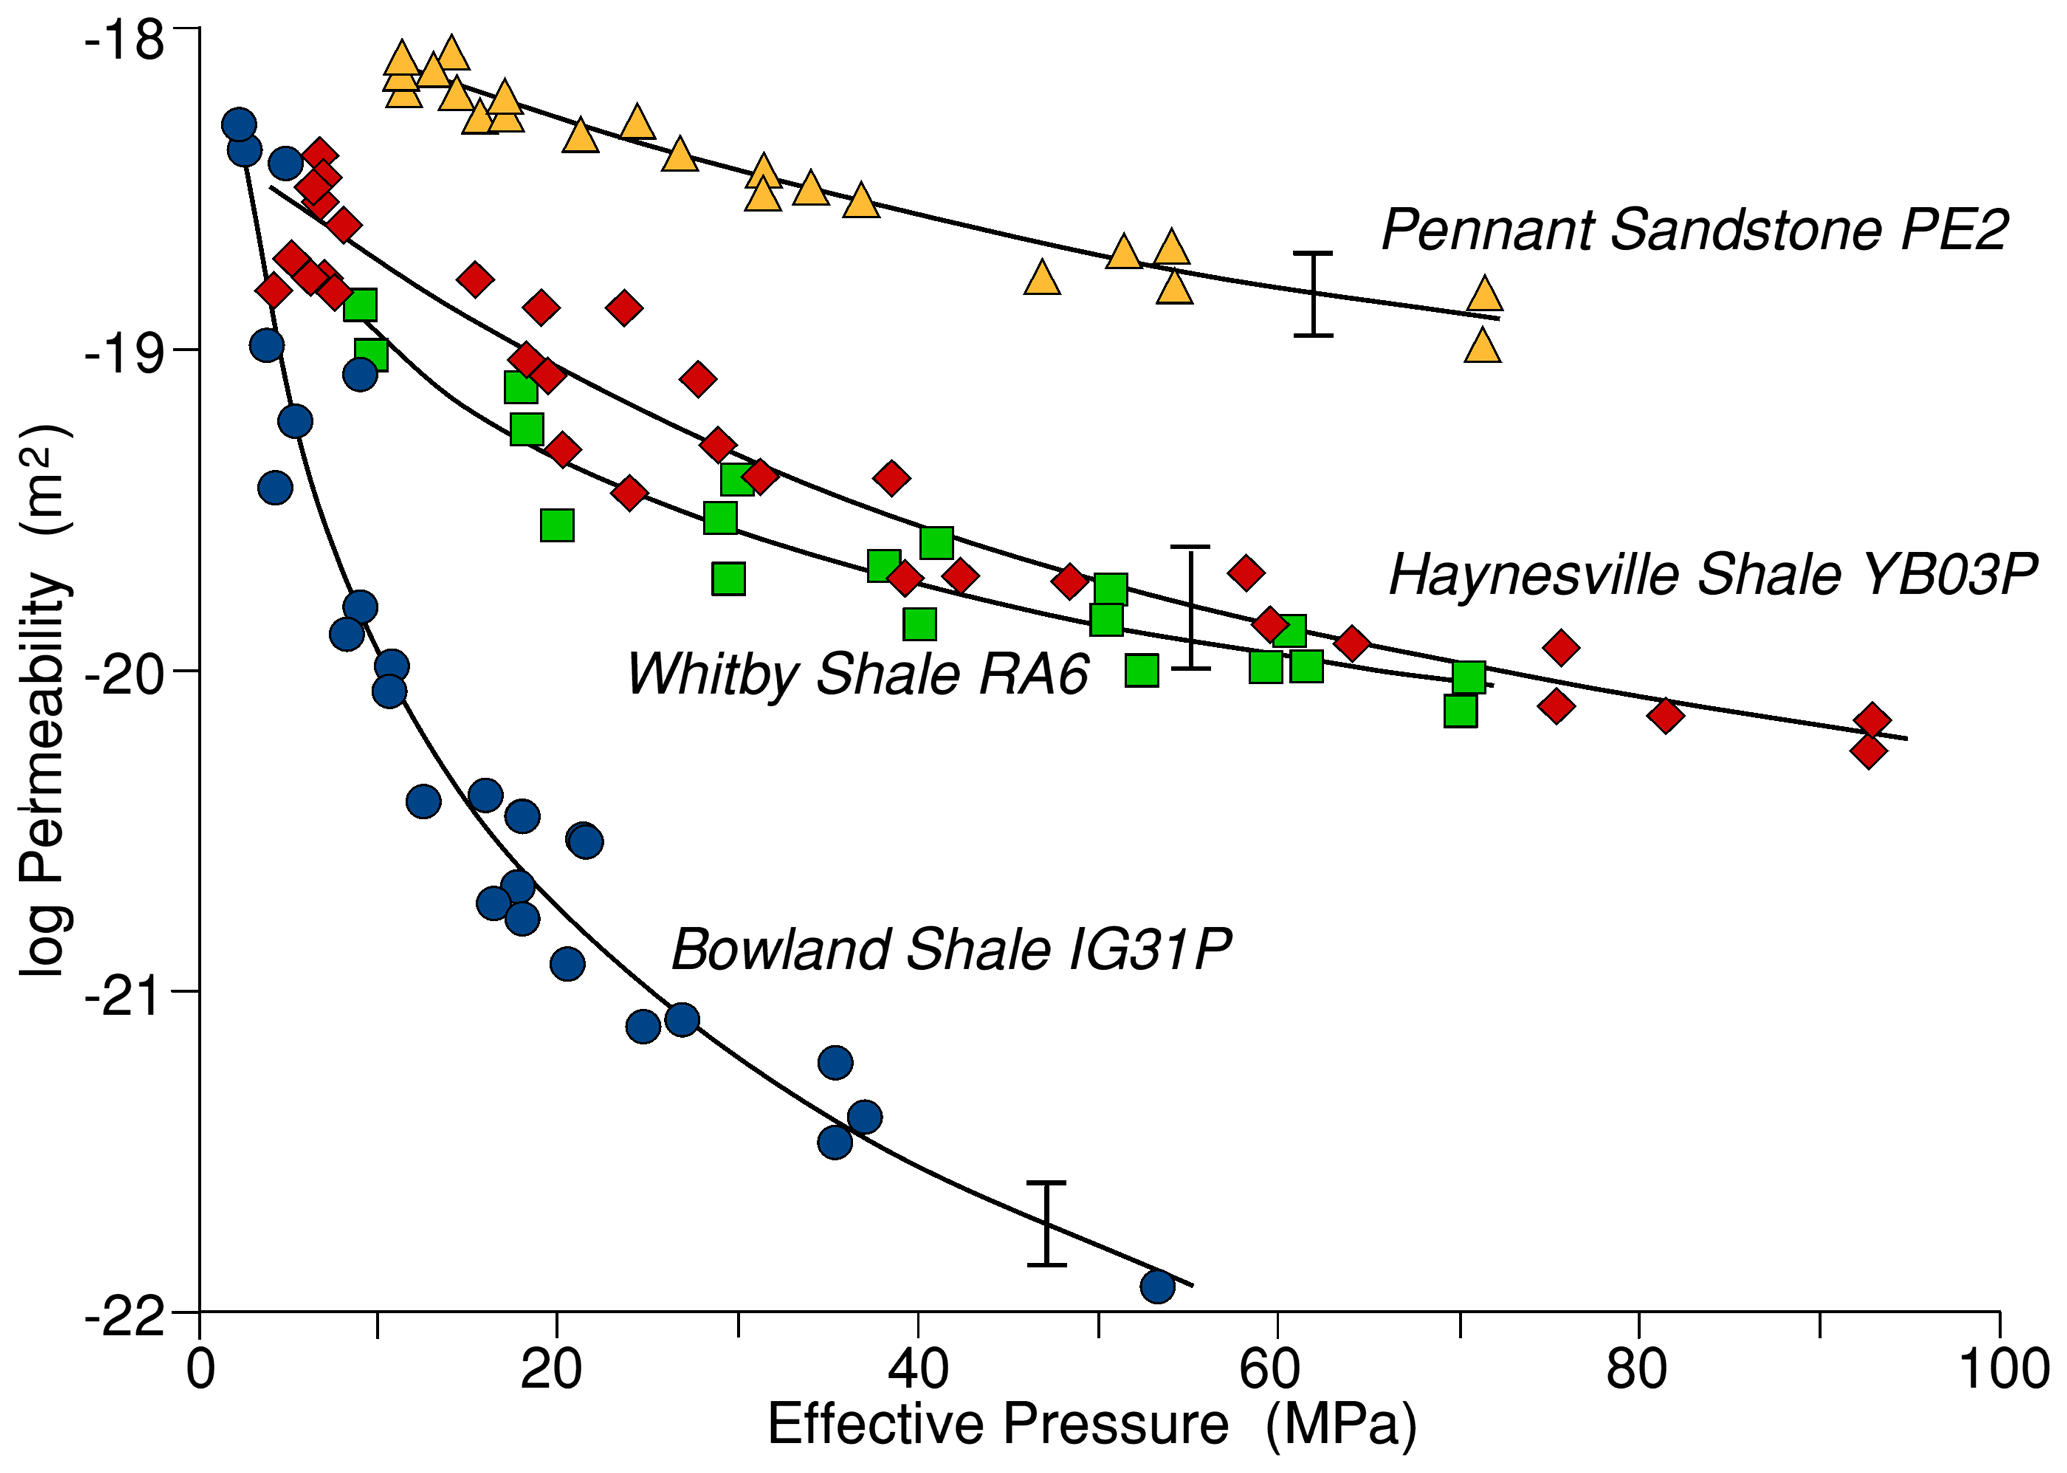
Figure 3Matrix permeability of Pennant sandstone for flow normal to bedding and for Bowland and Haynesville shales for flow parallel to layering as a function of effective pressure (Pc−nPp) over a wide range of pore pressures of argon gas. Data of Mckernan et al. (2017) for Whitby shale sample RA6 at a constant argon gas pore pressure of 25 MPa are also shown for comparison. In each case data from the first pressure cycle up to the maximum effective pressure attained have been excluded. All rocks show permeability decreasing more slowly with effective pressure at higher effective pressures. Error bars are shown as estimated for the 10 MPa pore pressure data.
4.1.1 Form of data and reproducibility
In the regime of elastic behaviour permeability (as log k) is not usually linear, neither on a k vs. Pc plot nor even on a log k vs. Pc plot, but is concave upwards (Fig. 3). The decrease in permeability with effective pressure is due to elastic closure of conductive cracks and pores, and this is expected to become more difficult as the porous material stiffens at higher pressure. Thus although it is common, and useful for the purpose of modelling reservoir behaviour (e.g. Kwon et al., 2001; Bustin et al., 2008; Cui et al., 2009; Heller et al., 2014; Mckernan et al., 2017) to describe quantitatively the relationship between log10k and Pc by making a least-squares linear fit to the data, a better description would take into account the curvature.
In order to estimate the reproducibility of the permeability data, a determination of the standard error was made about a polynomial fit to the 10 MPa pore pressure data (after the first pressure cycle) for each rock type. For Bowland shale it is ± 0.22 log10k units, for Haynesville shale it is ± 0.19 log10k units, and for Pennant sandstone it is ± 0.10 log10k units.
4.1.2 Influence of confining (Pc) and pore pressures (Pp) on permeability
Figure 3 shows the influence of effective pressure on matrix permeability over a range of pore pressures, for Haynesville and Bowland shales for flow parallel to layering, and for Pennant sandstone normal to bedding after the first pressure cycle. They are expressed as log10k versus effective pressure (Pc−nPp), where n is the empirical pore pressure parameter describing the influence of pore pressure on permeability. Fit parameters, including n, were obtained by non-linear least-squares fitting using Microsoft Excel®, from which n=0.86 for Pennant sandstone and 0.99 for Haynesville shale. For the Bowland shale the data showed that permeability varied over almost 4 orders of magnitude, much greater than for the other two rock types, and as a result it was evident that parameter n tended to increase with the value of Terzaghi effective pressure (Pc−Pp), varying from unity at low pressures to 1.6 at high effective pressures. The least-squares best-fit curve to each of these data sets is shown in Fig. 3. For all three rocks the form of the behaviour is similar, each showing a decreasing slope at higher effective pressures, as would be expected from pressure-induced constriction of pore spaces. The permeability of Pennant sandstone showed the least sensitivity to effective pressure variations, whilst the Bowland shale displays a far greater sensitivity of permeability to effective pressure. The Haynesville shale takes an intermediate position that is closely comparable to the data for Whitby shale (sample RA6 taken from the data reported by Mckernan et al., 2017, for pressure cycles 2, 3, 4, and 5).
Whilst these rocks display relatively small differences in permeability at low effective pressures, an increase in pressure results in markedly divergent trends, resulting in large differences in permeability developing over the range of effective pressures expected to be encountered under reservoir conditions. This observation emphasizes the importance of understanding the pressure sensitivity of shales that are to be exploited for engineering purposes.
4.1.3 Influence of flow direction at constant pore pressure
Flow normal to layering in shales is often much slower than flow parallel to layering but not always. Layer-normal flow was therefore measured for these rocks using shorter samples than for flow along the layering and only at 10 MPa argon pore pressure (Fig. 4). However, for Haynesville shale the direction of flow makes little difference except that pressure sensitivity is reduced for layer-normal flow, as would be expected if flow parallel to the layering is dominated by low-aspect-ratio, crack-like pores that are relatively compressible. The different pressure sensitivities of permeability mean that (after the first pressure cycle) flow along the layering becomes faster at low effective pressures but slower at higher effective pressures. Bowland shale shows a small reduction in permeability for flow normal to layering relative to parallel to layering (post the first pressure cycle), and there is also some indication of a reduced pressure sensitivity, although the data set is small.
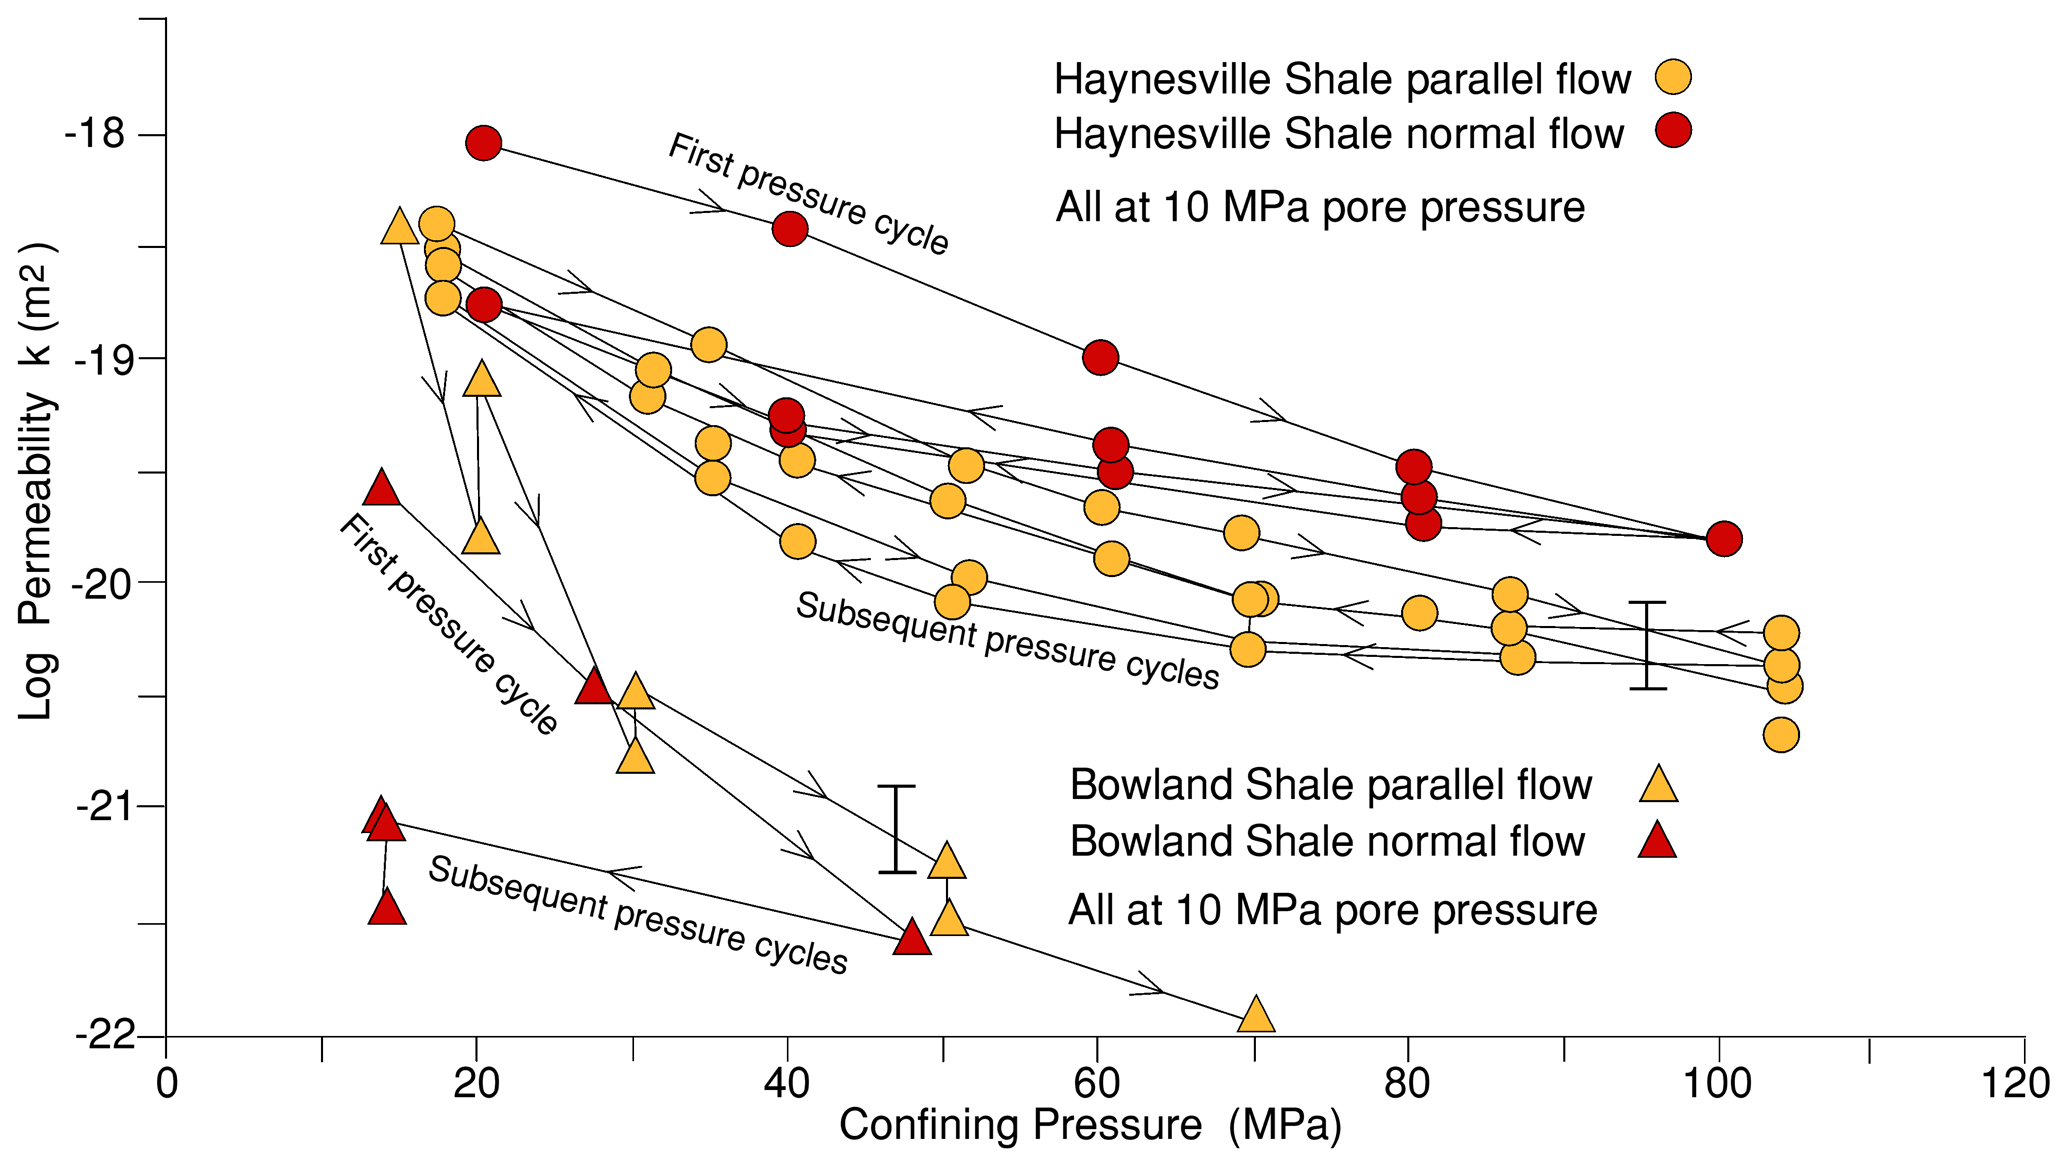
Figure 4Comparison of data at 10 MPa pore pressure for flow parallel and normal to layering in the two shales. Parallel flow data are shown without the first pressure cycle, during which some pores become permanently closed. Normal-to-layering flow data are shown including the first pressure cycle. For Bowland shale, flow normal to layering is slower, but for Haynesville shale there is little effect, except that pressure sensitivity is less for flow normal to layering.
4.1.4 Storativity of the rocks
Oscillating pore pressure permeametry yields a dimensionless permeability parameter η and a dimensionless storativity parameter ξ (Eq. 1), which is the ratio of the accessible pore volume in the rock to the downstream reservoir volume. A plot of experimentally measured log gain vs. signal phase shift angle lies along a line of constant ξ if the sample storativity is constant (Fig. 5). Thus the effective (conductive) porosity of the sample during the course of the experiment can be calculated. The conductive porosity of many rocks is smaller than the total porosity.
The total porosity also corresponds to a particular value of ξ. If all of the porosity were to be involved in the flow, these ξ values will be equal. Note that a value of ξ=1 corresponds to the downstream volume of the apparatus being equal to the pore volume of the rock sample. A storativity can also be calculated from data from elastic pore compressibility measurements. Hasanov et al. (2019) calculated storativity in these two ways.
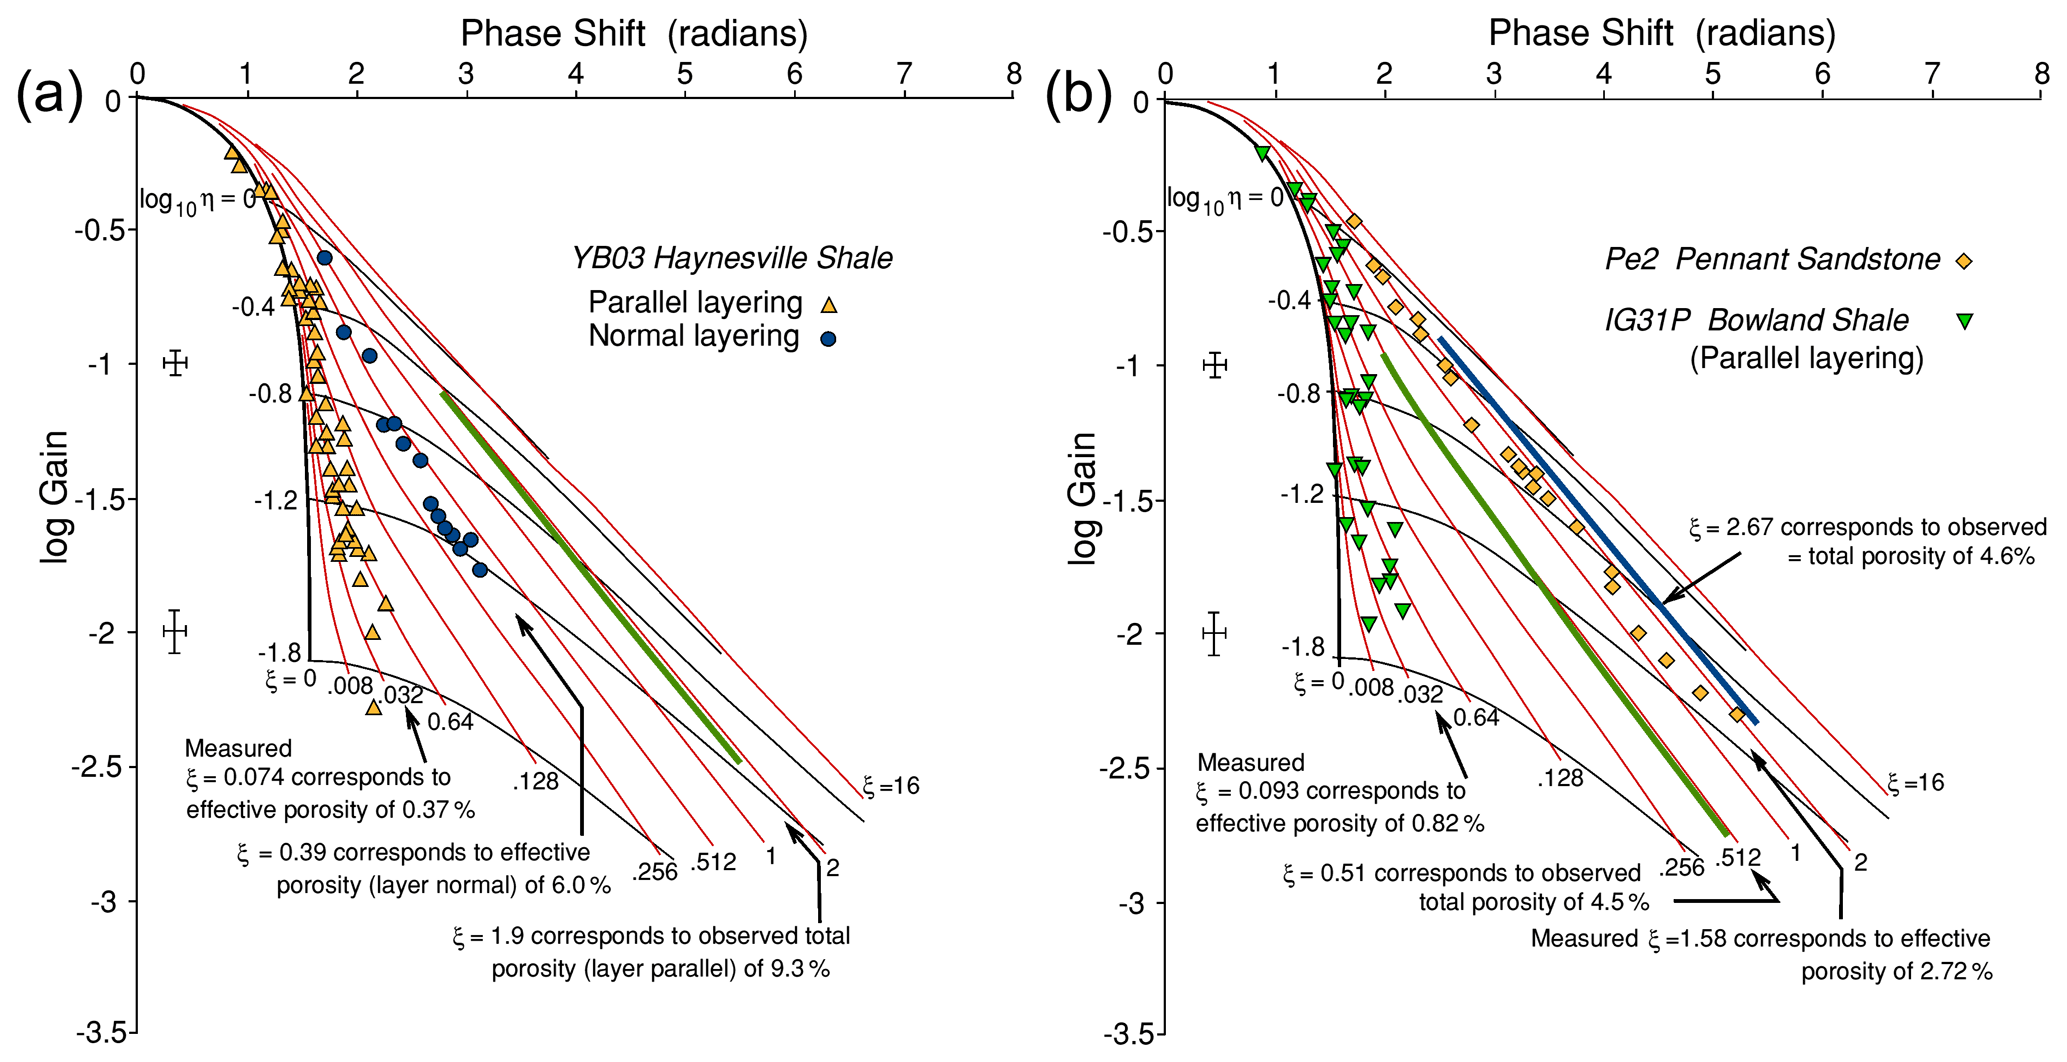
Figure 5Log gain vs. phase angle data from oscillating pore pressure measurements on (a) Haynesville shale. ξ=1.9 would correspond to total porosity 9.3 % for flow in the sample parallel to layering if all porosity participates in the flow. Observed ξ=0.39 normal to layering is much greater than parallel to layering ξ=0.074, but both are substantially less than that corresponding to total porosity. Flow parallel to layering only “sees” or “uses” about 4 % of the total pore space and normal to layering about 42 % of the total pore space. (b) Bowland shale. ξ=0.51 would correspond to total porosity 9.3 % for flow in the sample parallel to layering if all porosity participates in the flow. Observed ξ=0.093 for flow parallel to the layering corresponds to a conductive porosity (0.82 %) much less than total porosity. In contrast, data for Pennant sandstone show observed ξ=1.58 to be closer to that ξ=2.67, which corresponds to the total porosity of the rock.
Figure 5a shows log gain vs. phase angle data for Haynesville shale for flows both parallel and normal to layering. Figure 5b shows corresponding data for Bowland shale and Pennant sandstone, but insufficient data were obtained for Bowland shale normal to layering, given its much lower permeability. For flow along the layering, both of the shale types show ξ<0.1, corresponding to the conductive porosity being much smaller (<1 %) than the total porosity of the rocks (4.5 % and 9.3 %). Thus whilst the bulk of the pore space can contribute to gas storage, only a very small fraction of well-connected porosity contributes to gas flow along the layering in the shales.
The log gain vs. phase angle data were non-linear least-squares fitted to obtain an average value for ξ for each rock type, subject to the constraint that ξ is constant. For Haynesville shale for flow across the layering ξ lies along the trend ξ=0.39, corresponding to a conductive porosity of ∼ 6.0 %. Thus flow across the layering “sees” more of the total porosity than flow along the layering though still substantially less than the amount of total porosity. Whitby shale (Mckernan et al., 2017) displays the same effect. In marked contrast, for the Pennant sandstone ξ=2.72. This is close to the value of ξ=2.67 corresponding to the total porosity (4.6 %) of the rock, implying a high degree of connectivity between the pore spaces in Pennant sandstone.
4.2 Bulk moduli measurements
4.2.1 Bulk moduli of compressibility for Pennant sandstone
Bulk modulus of porosity Kϕ (defined in Eq. 2) and its effective pressure sensitivity can be measured from the volume of argon expelled from the rock during increments of confining pressure at constant pore pressure, and Kdry can be calculated using Eq. (4) (Fig. 6a). Ko is the mineral bulk compressibility estimated as the VRH average at zero porosity (given for these rocks in Table 1). is the value of the pore bulk modulus referred to the total volume of the rock rather than to the pore space volume. and Kdry versus Terzaghi effective confining pressure are shown in Fig. 6 for Pennant sandstone. Kdry is asymptotic to Ko (41.5 GPa) at high pressure.
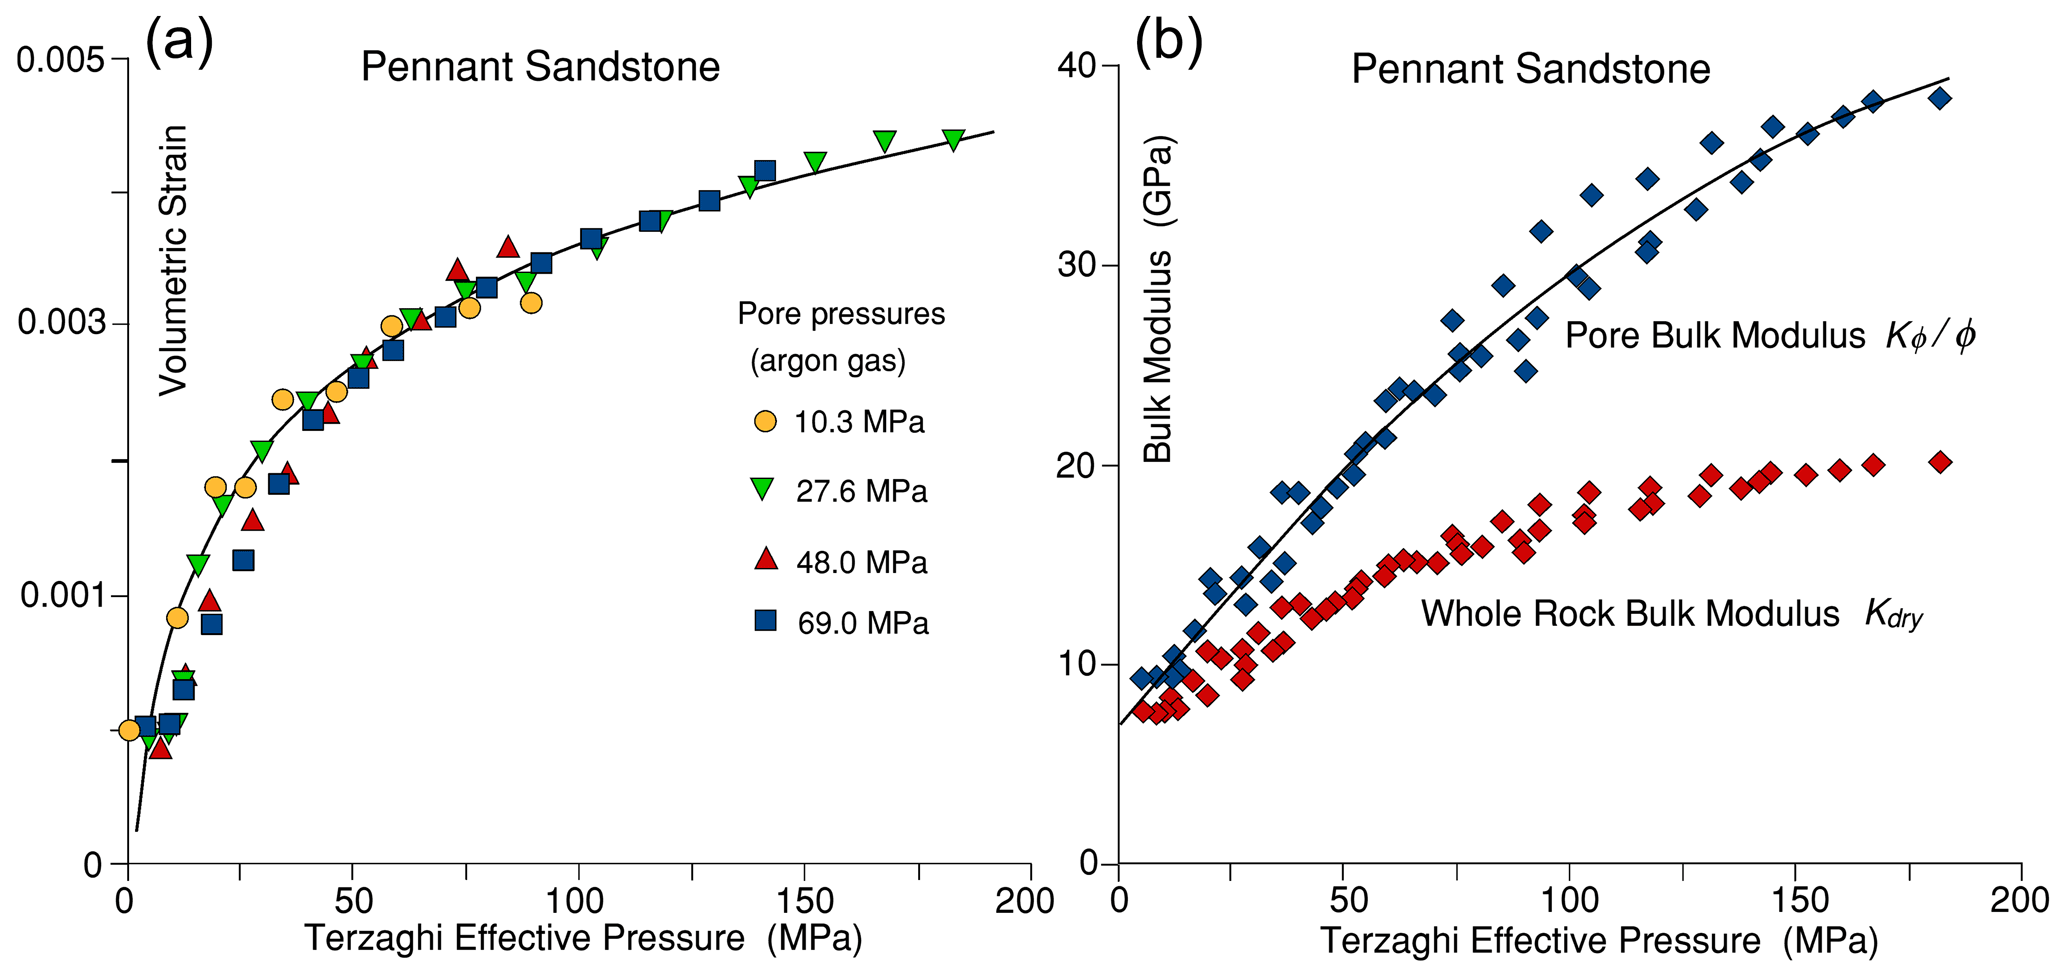
Figure 6(a) Volumetric strain (with respect to whole sample volume) for Pennant sandstone at four different constant gas pore pressures. There is no significant effect of magnitude of pore pressure. About 20 % of the total pore volume is elastically reduced over a range of 200 MPa effective pressure. (b) Pore bulk modulus from gas expulsion data in (a) for Pennant sandstone and whole-rock bulk modulus calculated from and Ko (41.5 GPa). Pore spaces become rapidly less compliant as effective pressure increases.
The pore pressure coefficient m, describing the effects of pore pressures on elastic distortions of a porous rock and defined in , is given in terms of the bulk moduli Kdry and Ko in Eq. (7). In Fig. 7 the resultant m versus effective pressure curves are shown for both Pennant sandstone and Haynesville shale. Bulk moduli are isotropic properties with values unaffected even when the aggregate displays preferred orientation (shape and crystallographic) of constituent grains (Andrews, 1978; Mendelson, 1981).
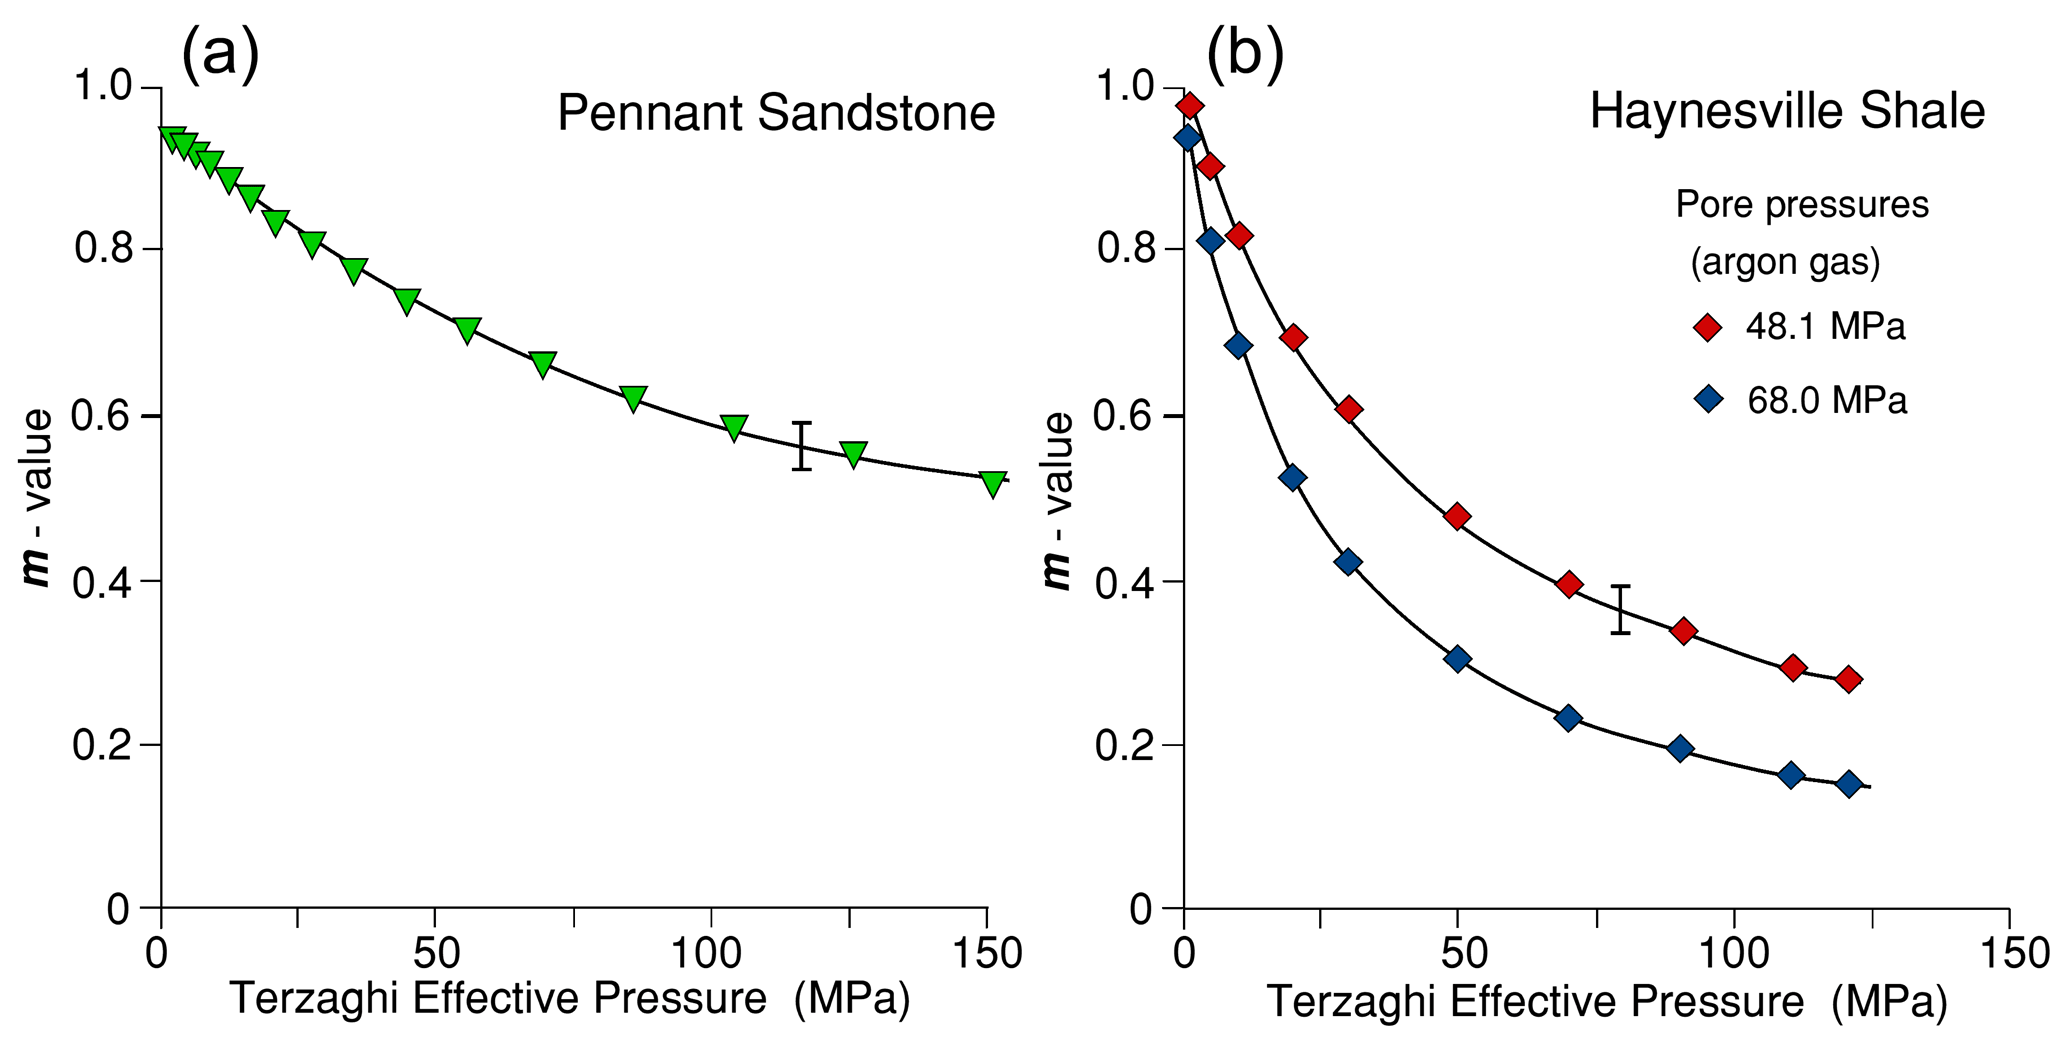
Figure 7m from bulk modulus data and Eq. (7) for (a) Pennant sandstone and (b) Haynesville shale. The decrease in m with Peff arises from the stiffening of the pore spaces with effective pressure, and the effect is greater for the shale than for the sandstone.
At low pressure Kdry is much less than Ko; hence m approaches 1. As Kdry increases with pressure it approaches Ko; hence m decreases with pressure and will eventually reach zero when all pore space has collapsed. Any small increase in Ko with pressure has been ignored (e.g. Calderón et al., 2007). The variation in m with pressure forms the basis for describing the decrease in permeability observed as effective pressure increases.
4.2.2 Bulk moduli of compressibility for Haynesville shale
Pore volumometry by the expelled gas volume method during progressive increase in confining pressure was carried out on the two shale samples used (Fig. 8). The resolution of the pore volume change data is poor because the specimen size was rather small (1.9 cm long). The rapid increase in slope translates to a rapid rise in calculated Kdry compared to Pennant sandstone, until it is a substantial fraction of Ko (61 GPa). However, the total amount of gas expelled corresponds to a closure of about 2 % of the initial porosity (0.15 % of the whole sample volume). Figure 7b shows pore pressure coefficient m calculated from the pore volumometry. m decreases rapidly because the Kdry value rises rapidly to become a substantial fraction of Ko. It is not clear why the measurements at two different pore pressures are so different, but it is thought to be attributable to different degrees of gas trapping in poorly connected pore spaces.
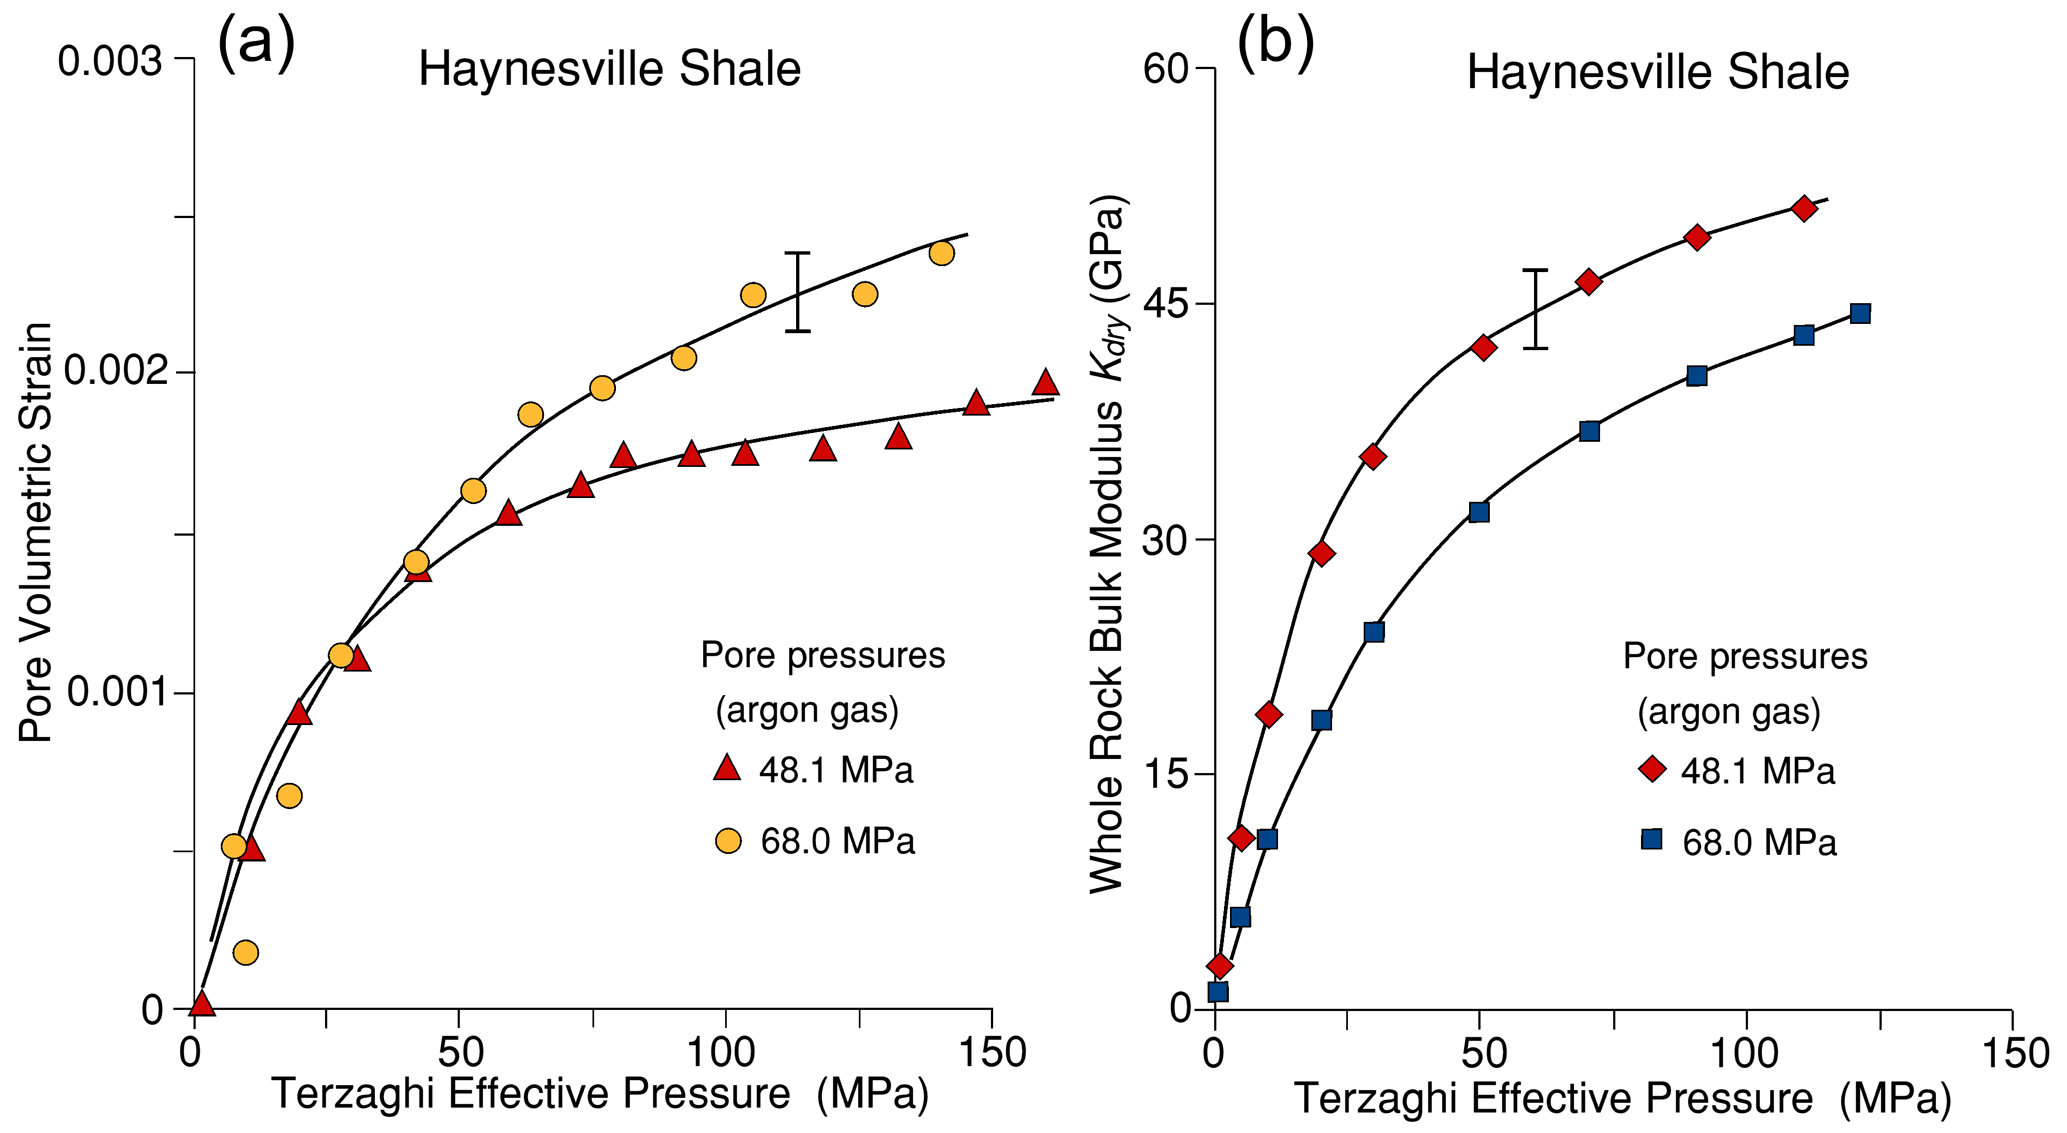
Figure 8(a) Pore volumetric strain (as fraction of total specimen volume) vs. Terzaghi effective pressure for Haynesville shale at the pore pressures indicated. Pore volume loss is approx. only 2 % of the initial pore volume of the rock. Logarithmic fits to two of the data sets are shown. (b) The gradients of the fitted lines in (a) correspond to the pore compressibility and were used to obtain Kdry vs. Peff, as shown in (b) for the two pore pressures used. Ko=61 GPa.
4.2.3 Bulk moduli of compressibility for Bowland shale
A large specimen (25 mm diameter and 50 mm long) was used for these measurements on Bowland shale, cored parallel to the layering. Because this is a low-permeability rock, a 2 mm thick longitudinal slab of porous sintered stainless steel was deployed as described earlier, to facilitate gas flow between the rock pores and the pore pressure system. During pressure cycling it was necessary to correct data for the storativity of this plate. Figure 9 shows pore volumometry at 34.5, 48.1, and 69 MPa argon gas pore pressure and Kdry data for Bowland shale. Measurements were very reproducible, and, unlike the Haynesville shale sample, there was no significant effect of the magnitude of the pore pressure used. The amount of gas expelled during an effective confining pressure cycle of 150 MPa corresponds to closure of ∼ 8.4 % of the initial (4.5 % porosity) pore space or about 0.04 % of the total rock volume. As also observed for Haynesville shale, this represents a very small fraction of the total porosity.
The poroelastic coefficient m calculated from the volumometry data is shown in Fig. 9b. Like the Haynesville shale, the poroelastic coefficient obtained from pore volumometry decreases substantially with Terzaghi effective pressure but does so at a similar rate to the Haynesville shale.
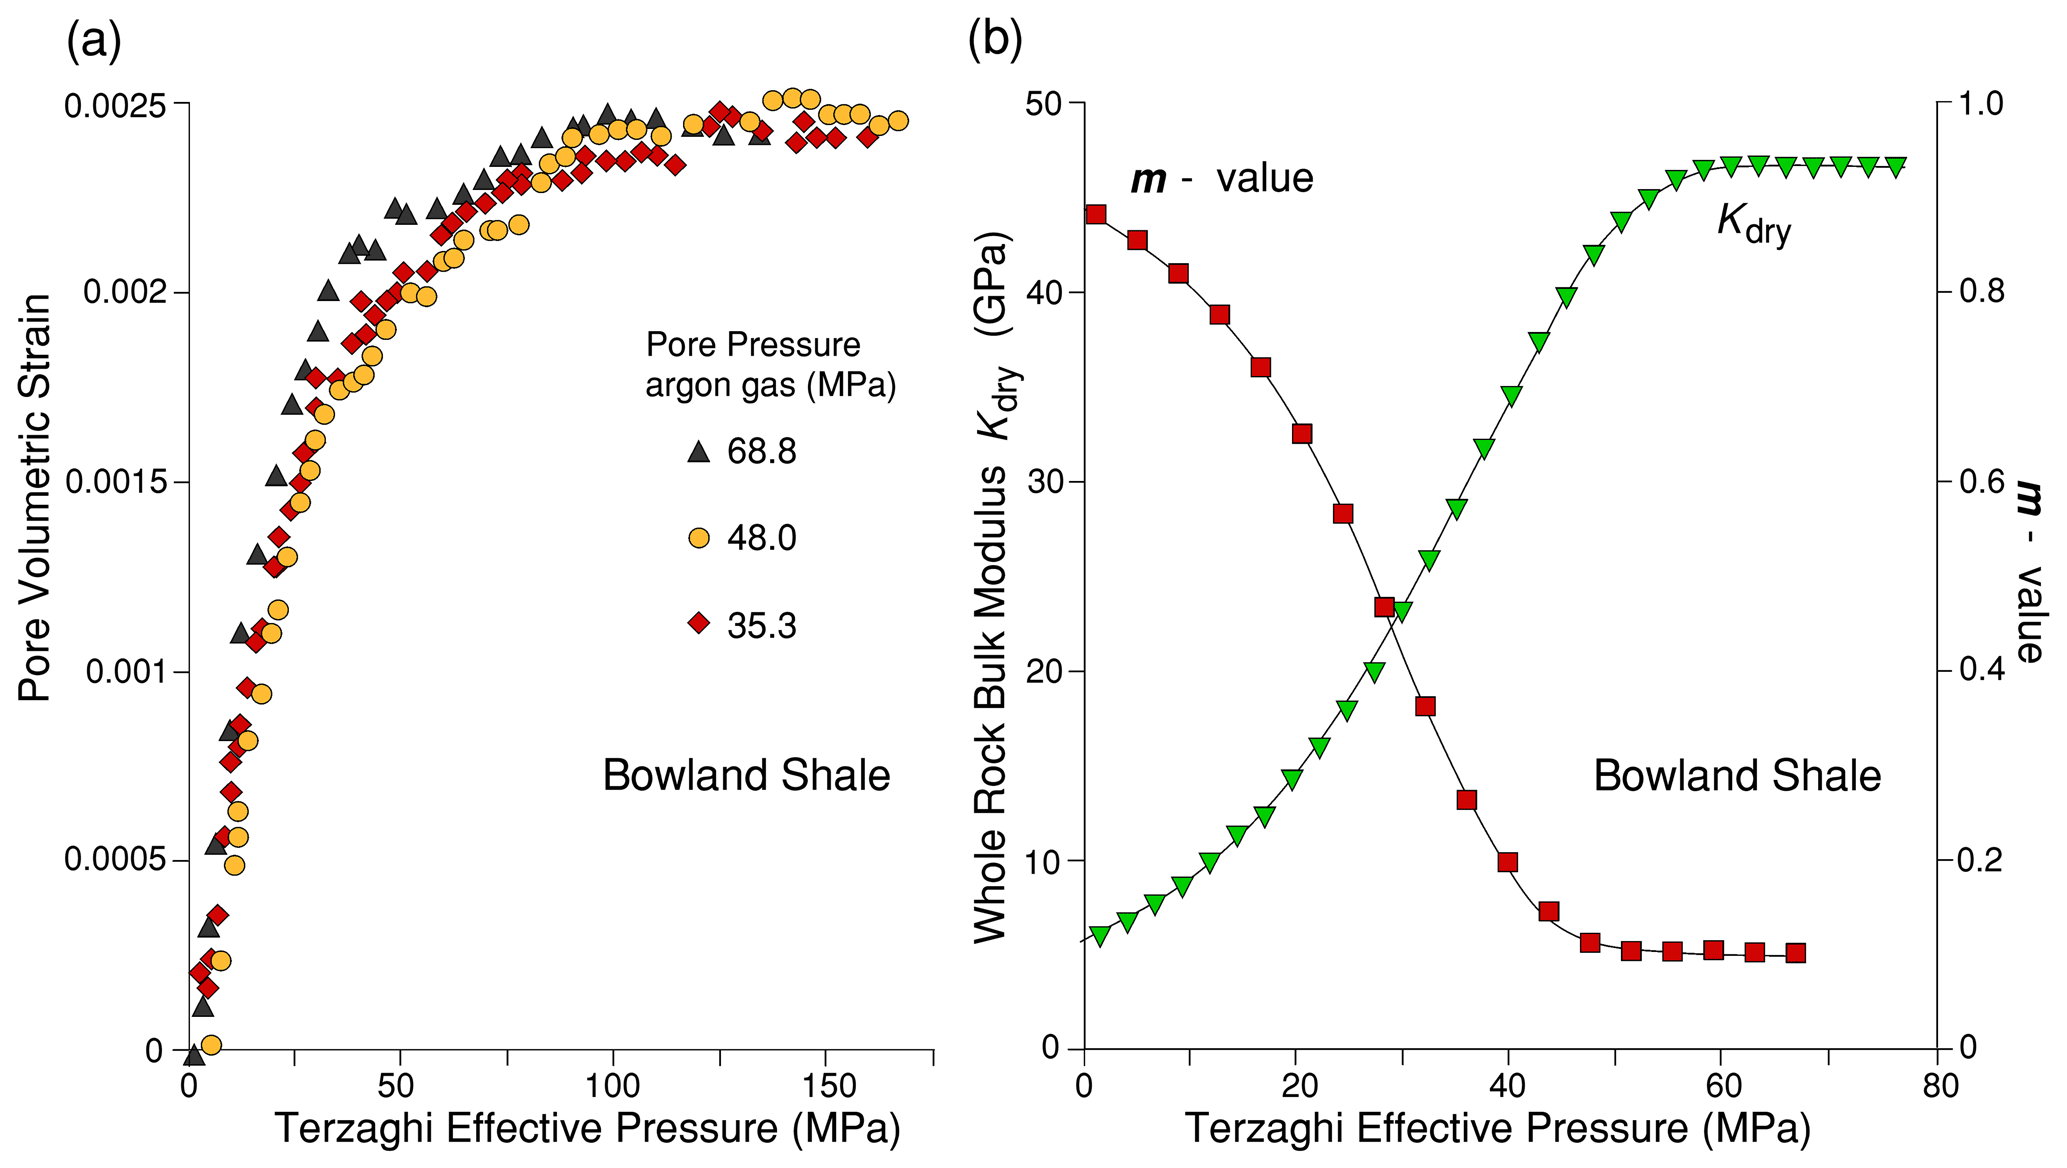
Figure 9(a) Pore volumometry of Bowland shale at 34.5, 48, and 69 MPa gas pore pressure. There is no significant difference at the three pore pressures, so that a single polynomial function can be fitted to all the data. The slope of the curves corresponds to the pore compressibility, which decreases markedly with increasing effective pressure. (b) Calculated Kdry bulk modulus of the sample (pore pressure = 69 MPa) from pore volumometry measurements (inverted triangle symbols). Ko=52.8 MPa. Also plotted is the m value from pore volumometry (square symbols) for Bowland shale at 69 MPa pore pressure.
5.1 Generation of pore pressure during undrained loading
If drainage channel ways become constricted during the application of increments of Pc whilst Pp is also high, the rock might become effectively undrained and hence pore pressure increments can arise. The magnitude of an induced pore pressure under undrained conditions can be estimated from the Skempton parameter B, where
B is the Skempton parameter of soil mechanics (Lockner and Stanchits, 2002). Cpp is the compressibility of the pore space arising from a change in pore pressure and is usually much less than the compressibility of the pore fluid Cf. Thus B will lie between 0 and 1.0. Because usually Cpp≫Co (where ),
For a gas saturated rock Cf>Cpp, hence B→0, and a gas-saturated rock will therefore never develop appreciable pore pressures, especially at high porosities and from low initial gas pressures even when undrained; hence it was not considered to be an issue in the present experiments.
For a liquid-saturated rock however, this will not be true. B will approach 1 when Cpp≫Cf. For liquid-saturated porous sandstones under hydrostatic loading, Green and Wang (1986) found that under undrained conditions, induced pore pressures were close to the applied confining pressures over a range of 60 MPa confining pressure; thus the mean externally applied stress is almost totally transferred to the pore fluid via the compressibility of the pore spaces.
The time constant for the dissipation of excess pore pressure in a region of characteristic dimension L in a material of permeability k is on the order of
t is the time required for pressure to decay by factor e−1 at distance L. The ratio (Cf+Cpp) is the hydraulic diffusivity κ(dimensions m2 s−1) (Zimmerman, 1991). For water, viscosity μ is 0.001 Pa s. Taking the bulk modulus Kf () to be 2 GPa and the permeability to be 10−18.5 m2 for Haynesville shale at about 5 MPa effective pressure (this is the highest permeability measured, which would apply after an excess fluid pressure had been generated by compaction), κ ∼ m2 s−1. This leads to t ∼ 60 s for L=2 cm. This assumes water and gas permeabilities are the same at the same pressure conditions, but permeability to water may be about 1 order of magnitude lower (Faulkner and Rutter, 2001) in foliated clay-bearing rocks. Time t is shorter by a factor when the pore fluid is gas, owing to its lower viscosity (Gosman et al., 1969). This equation is for constant k, but when k is a strong function of Peff, decreasing perhaps 300-fold at high effective pressures, up to 5 min may be required for small pore pressure transients to decay.
5.2 Simple model for pressure dependence of permeability
The simplest approach to describing the influence of pore space geometry and connectivity on permeability is to regard the pores as a bundle of circular capillary tubes, so that the equation for viscous Poiseuille flow can be applied and permeability calculated as a function of capillary tube radius. The circular capillary tube is a special case of flow through tubes of elliptical cross section. In this case the flow rate then becomes acutely sensitive to the short radial dimension of the tube, and the more eccentric the tube cross section the greater will be the sensitivity of its shape to externally applied effective pressure (Seeburger and Nur, 1984). Ma et al. (2018) imaged connected pore spaces in shales, including Haynesville shale, as thin, crack-like shapes lying parallel to bedding and of nanometric widths. Such pores in shales are not identical to straight capillary tubes of elliptical cross section, but we can explore the extent to which the pressure sensitivity of observed permeability can be modelled as such (Mckernan et al., 2017).
For a single tube cross section of long axis 2c and short axis 2b the volume flow rate q of a fluid of viscosity μ along a hydraulic pressure gradient dPp dx is well known to be
and for N parallel tubes embedded in an elastic matrix of volume V and intersecting a 1 m2 area normal to their length the total flux Q=Nq. Separating out the viscosity and pressure gradient, the permeability ko of the array is ko= () (b3c3 (b2+c2)). Dimension c does not change with externally applied pressure for the elliptical crack, whereas for the tapered crack it does so that the aspect ratio of the crack is kept approximately constant (Mavko and Nur, 1978), and Seeburger and Nur (1984) found that there is little difference in the effect of hydrostatic pressure on flow rate when the tube cross section is elliptical or tapered. In terms of aspect ratio of an assumed elliptical cross section , thus
The porosity ϕ=Nπbc. Parameters α, c, and N that satisfy Eq. (4) are non-unique. N can be increased whilst pore aperture is decreased, keeping k unchanged. A further constraint is therefore required, and this is provided by the porosity ϕ, which is already known as a property of the material. Porosity is given by ϕ=Nc2 απ. Thus Eq. (14) becomes
Applying a hydrostatic pressure P to a solid bearing elliptical cracks reduces the b dimensions of all pore spaces and hence reduces the hydraulic transmissivity. The spatial density of the ellipses is assumed to be sufficiently small that the elastic strain fields of each do not interact significantly. From Seeburger and Nur (1984), following Walsh (1965) and Mavko and Nur (1978), the bulk modulus Kdry of a solid of volume V containing N tubular cracks of elliptical cross section and semi-major axis c is given by
Thus
d is the elliptical section tube length in the third dimension ().
Taking m= (), the left-hand side is m (1−m), and the expression can be rearranged with c2 on the left side:
This can replace c2 in Eq. (15), to give
m is measured by pore volumometry as a function of Terzaghi effective pressure; hence k is a function of effective pressure. For b≪c it is primarily the reduction in the b dimension with increasing pressure that reduces permeability. However, Mavko and Nur (1978) and Seeburger and Nur (1984) showed that the bulk modulus of a porous solid of a given porosity is not affected by the shape (eccentricity) of the pores. All pores change volume by the same fractional amount. Only the distortion under pressure of the more eccentric ones is likely to affect the permeability, although all pores will affect the storativity, according to how well connected they are. The “connected” porosity estimated from the log gain versus phase shift plot that is much smaller than the total porosity is used in Eq. (19). Its small value implies that most of the porosity is not being inflated during the passage of the pore pressure wave; hence during the timescale of the pressure oscillation the greater part of the porosity is closed off by the action of the effective pressure.
Equation (19) can be fitted to the permeability data log k=f(Peff) measured for rock types studied using the non-linear least-squares fitting routine Solver in MS Excel®, to estimate the parameters N, ν, and α. Via the inferred effective porosity the conductive pore width can also be estimated. The results of the fitting exercise provide the parameters for a bundle of capillary tubes that behaves in the same way as the measured rocks. This is not to say that the geometric arrangement of a simple capillary tube bundle corresponds to the pore space configurations in these rocks nor that a solution can be found for all rocks. The pressure sensitivity lies in the function that describes m as a function of pressure, obtained from pore volumometry, and incorporating the effective pressure coefficient n. Figure 10 shows the fit to the data for the Pennant sandstone; fit parameters are in Table 3.
Table 3Fit parameters for the capillary tubes bundle model applied to describe the permeability of Haynesville shale and Pennant sandstone at low effective pressures, when the permeabilities are not strikingly different. n is the pore pressure multiplier for the permeability data, N is the number of pores intersecting a 1 m2 area normal to the flow path, a is the pore shape aspect ratio, and ν is the Poisson ratio; 2b is the mean short dimension (nm) of the elliptical cross section, and s is the average pore spacing (µm).
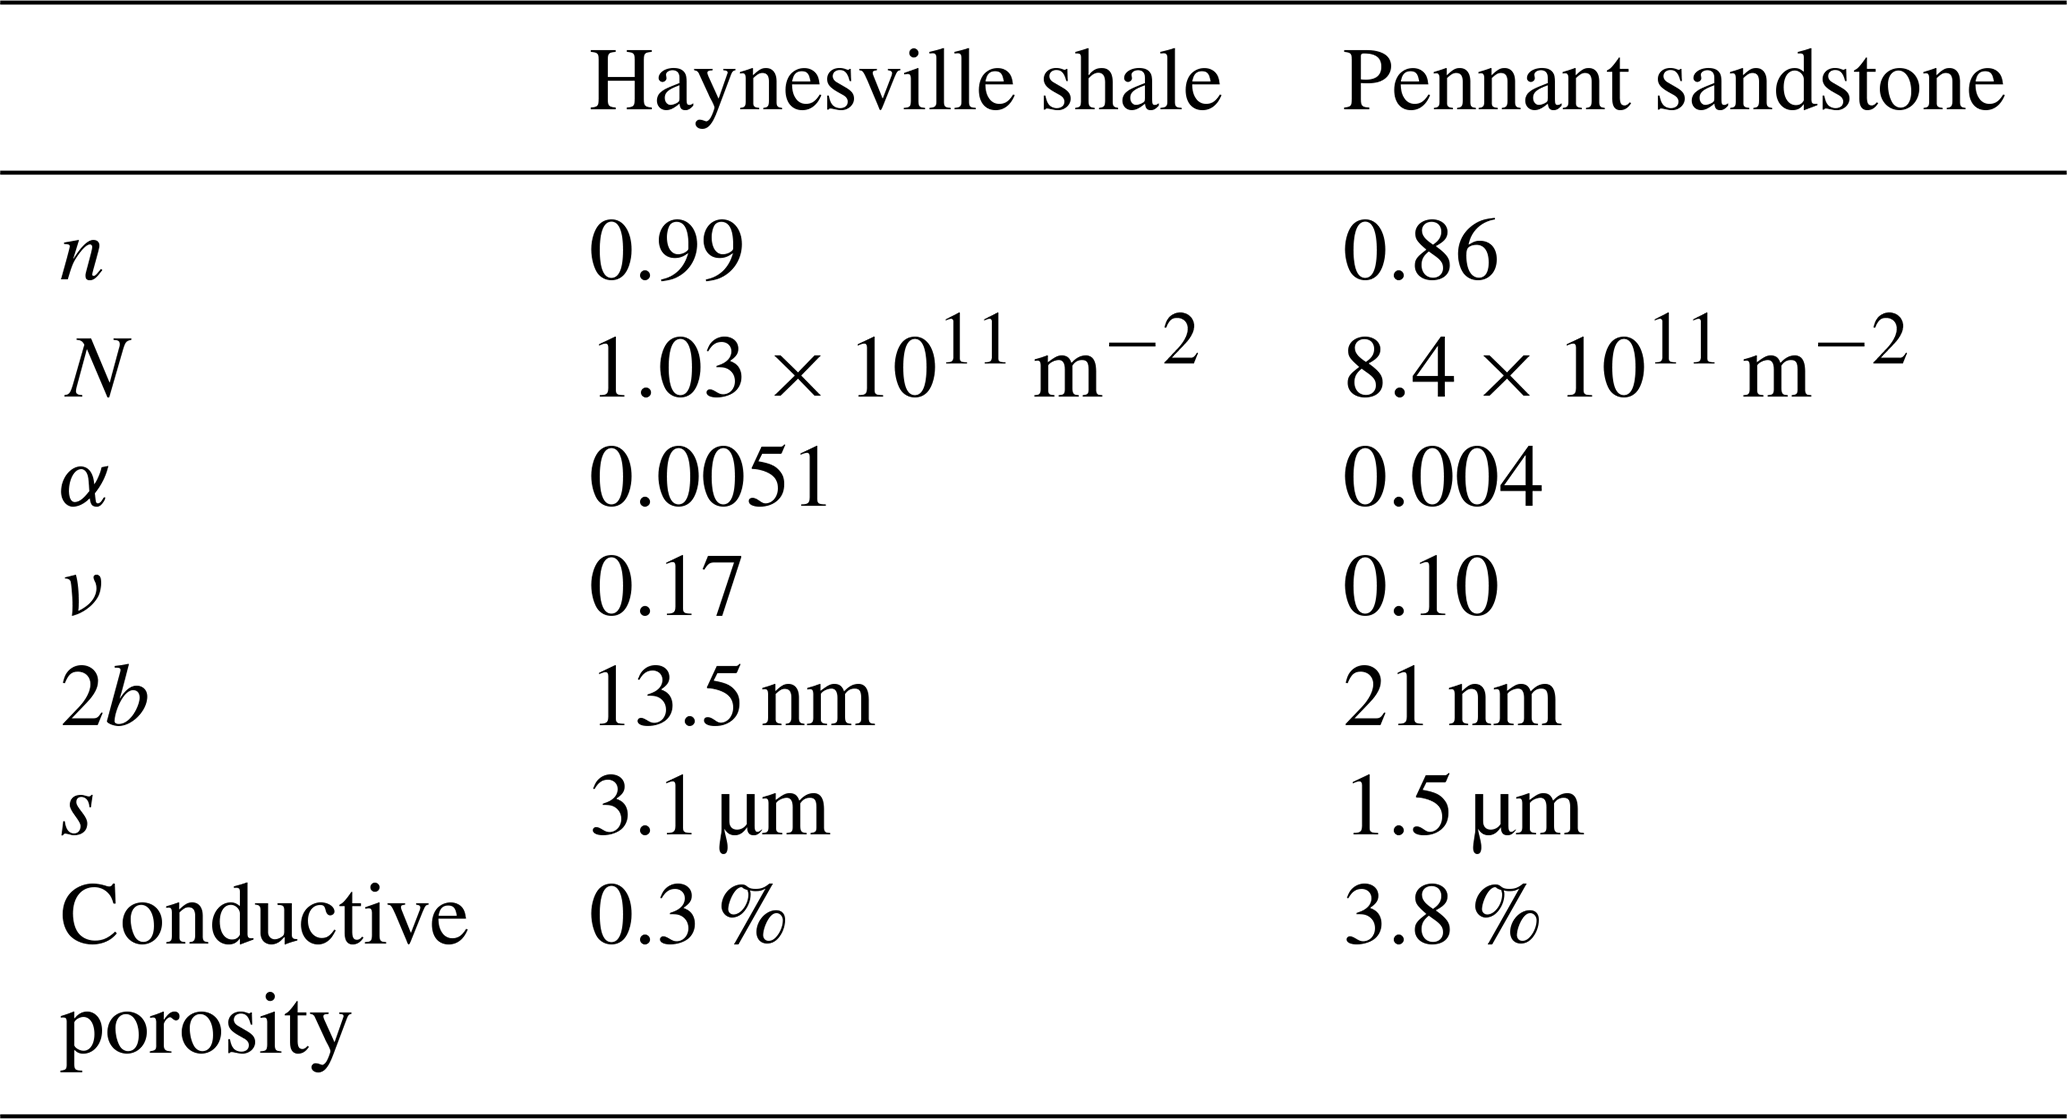
Unlike the relatively homogeneous distribution of pore channels in the shales down to the micrometre scale, in the Pennant sandstone the greater part of the rock volume is not porous, as it comprises large quartz and feldspar grains. The 4.6 % porosity is contained mostly in the spaces originally between these grains that are now largely filled with phyllosilicate and oxide phases, i.e. about 26 % of the total rock volume, and is microstructurally in some ways comparable to a shale. Therefore in Table 3 the estimated conductive channel dimensions are based on flow through this reduced volume fraction.
Figure 11 shows the fits to the permeability data for Haynesville shale. The cross section shape of the elliptical tubes is extremely eccentric and the shorter width of the tubes is measured in nanometres. This is consistent with the observations of the dimensions of connected bedding-parallel porosity in the high-resolution tomography (CT) observations of Ma et al. (2018) for Haynesville shale from the same core section as sampled here.
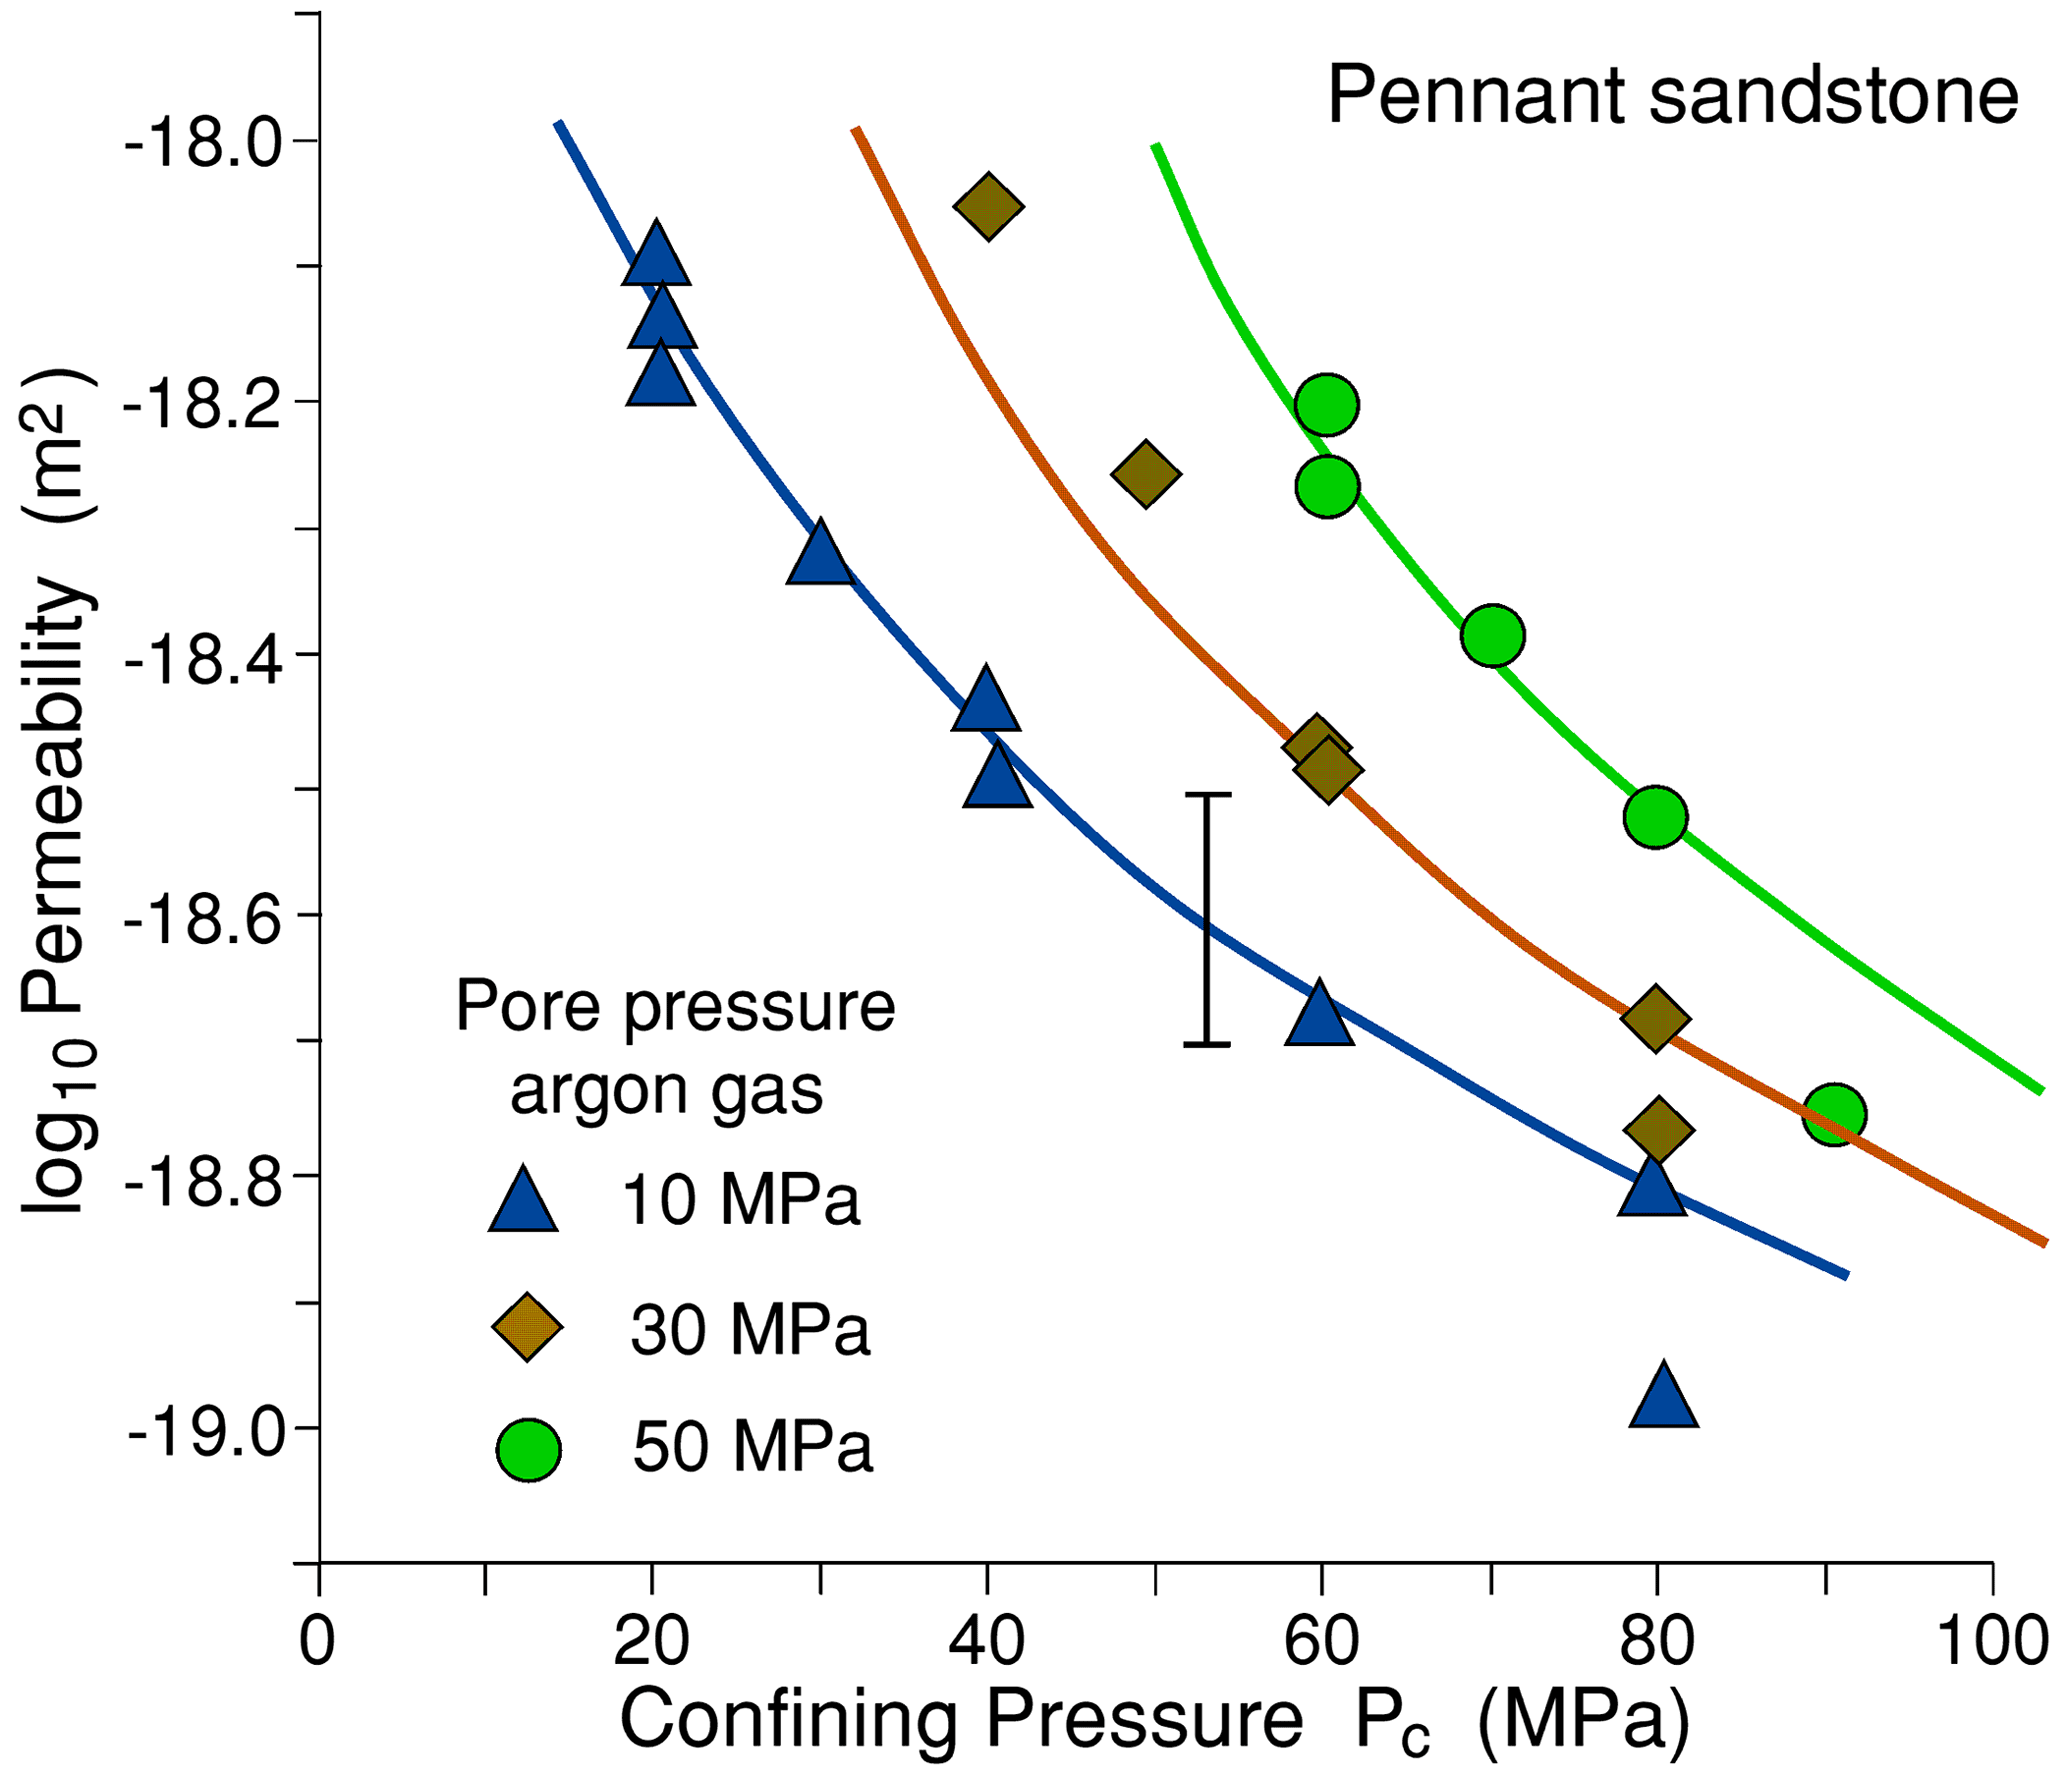
Figure 10Gas permeability data for Pennant sandstone normal to layering, for three constant pore pressures. The three continuous curves are for Eq. (19) non-linear least-squares fits to the data.
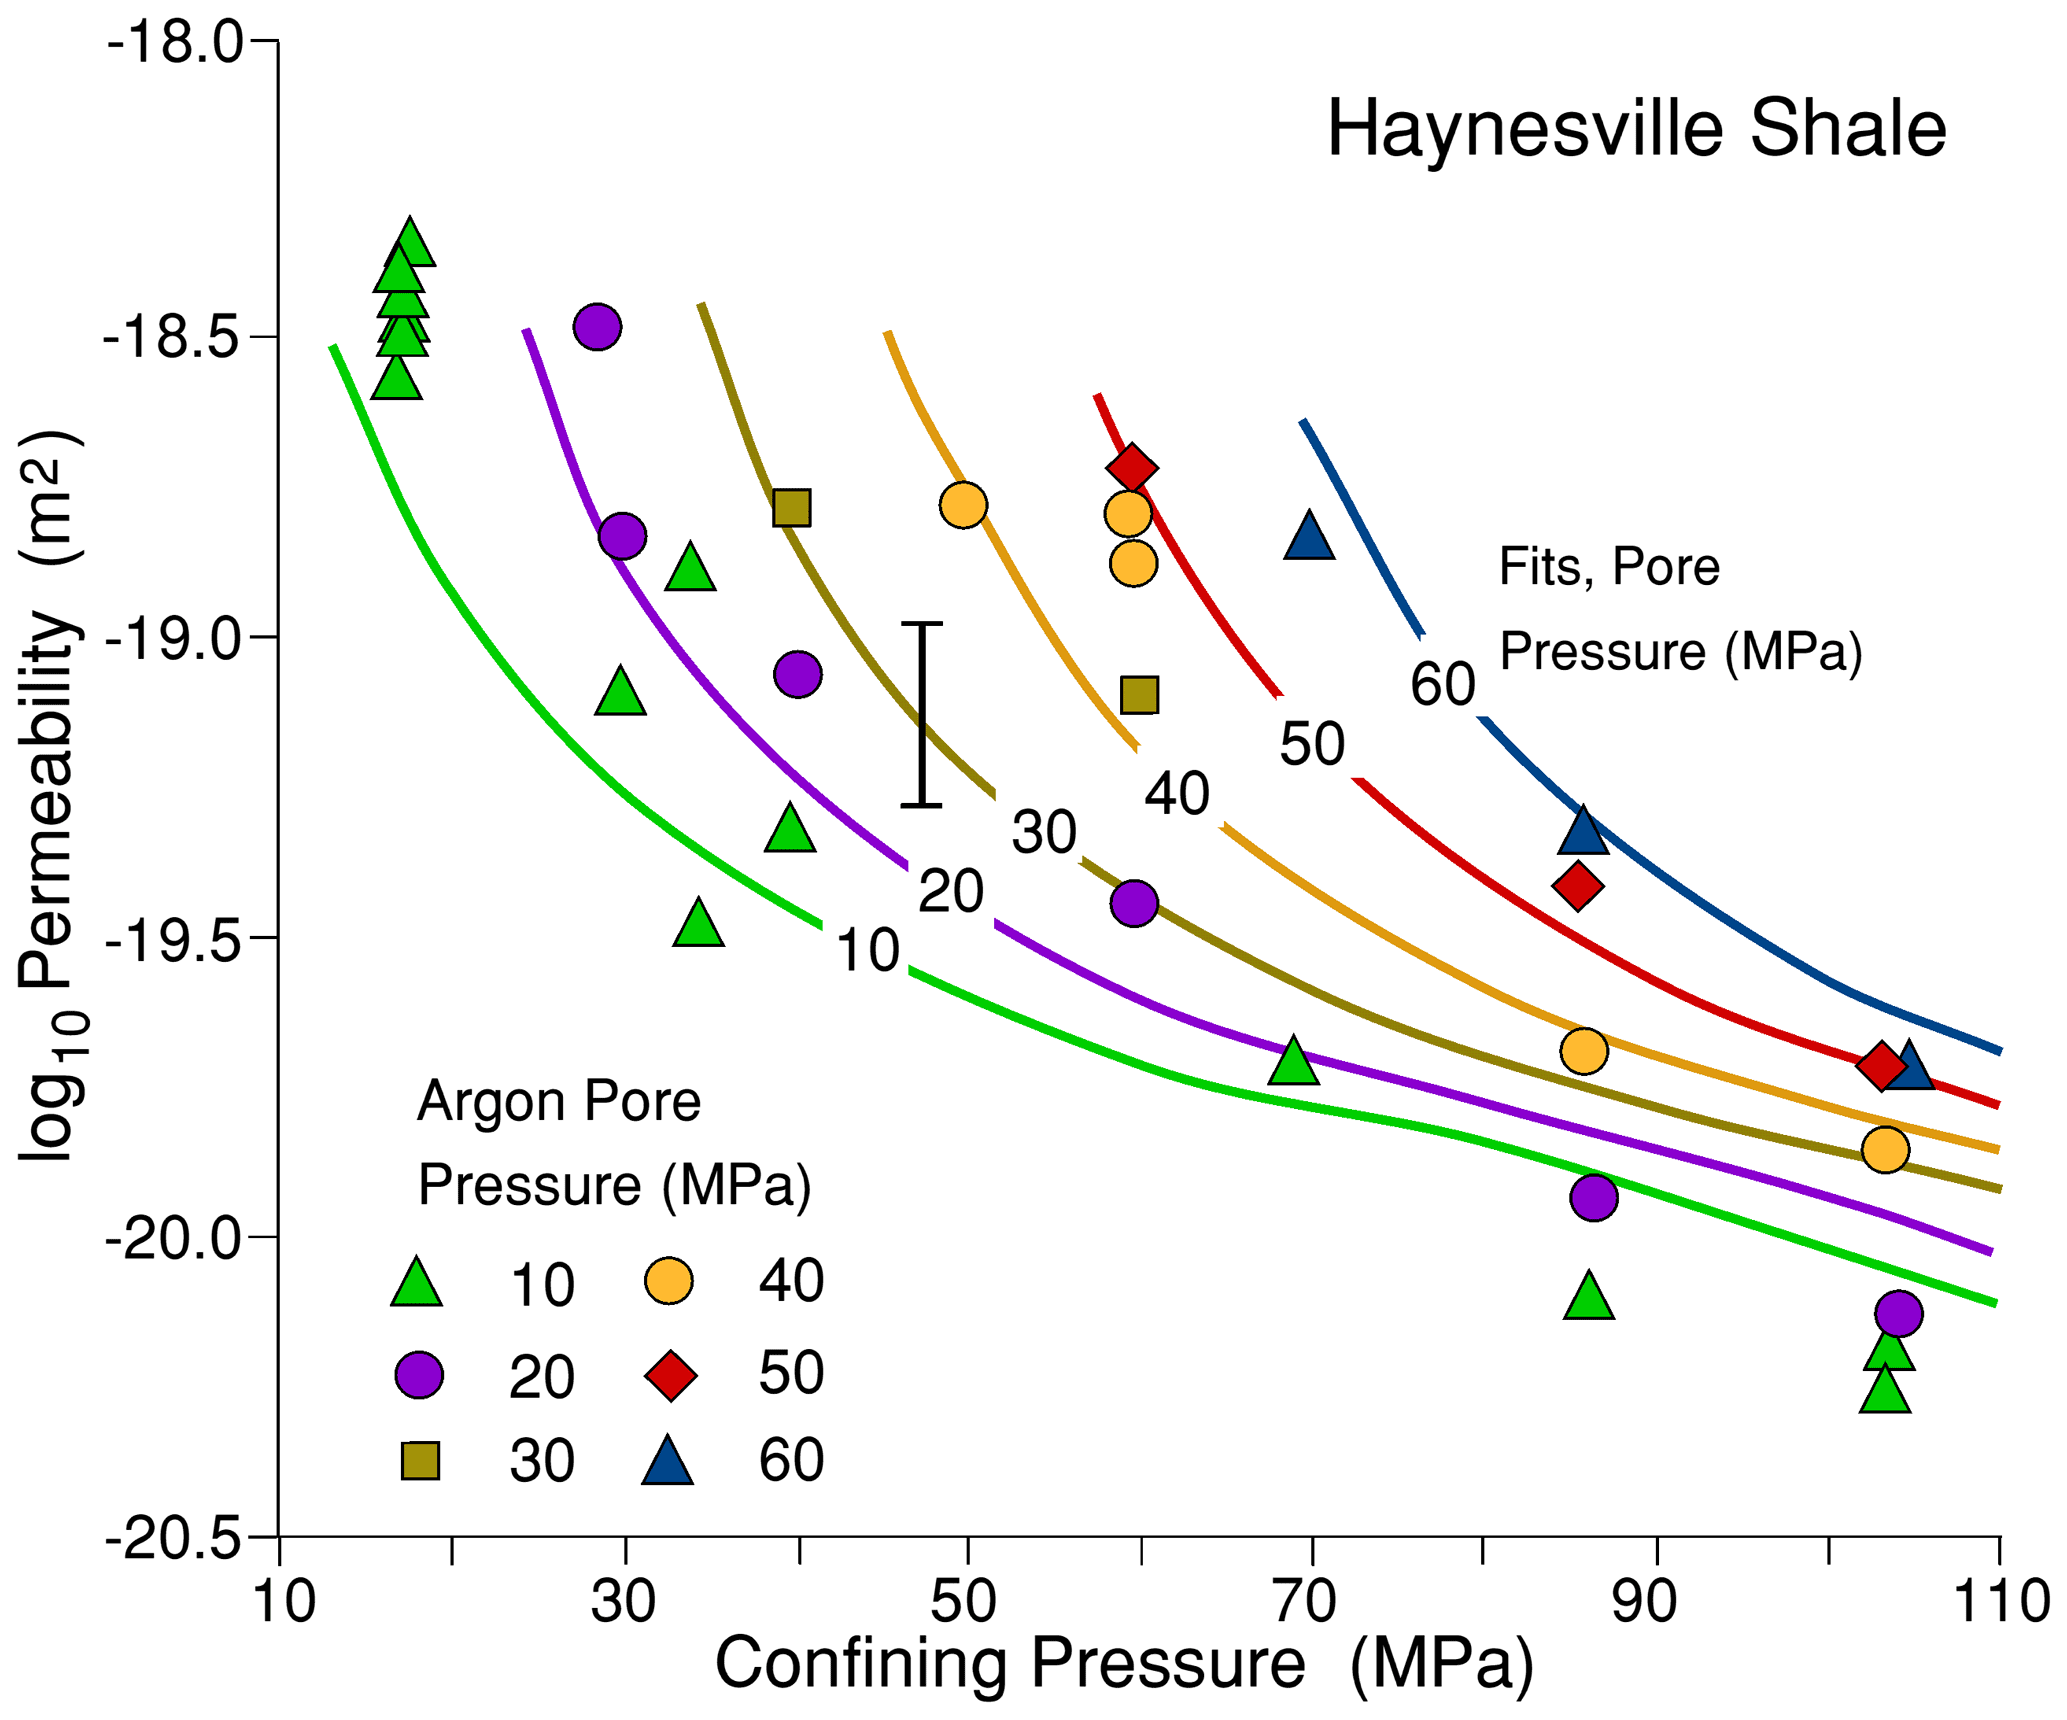
Figure 11Permeability of Haynesville shale versus total confining pressure for various values of constant gas pore pressure. The curves shown are the permeabilities calculated using the elliptical section pore channel model (Eq. 19).
The form of the curve of Kdry vs. Terzaghi effective pressure does not permit the simple elliptical section capillary tube model to be fitted to Bowland shale because the observed rate of decrease in m with effective pressure is insufficiently rapid to explain the 3 orders of magnitude decrease in permeability observed over this pressure range (see Fig. 12). Figure 13a compares the observed variation with effective pressure of pore compressibility factor m to the variation that would be required to be able to make such a fit. It is inferred that pressure must be able to act in this rock to close down pore connectivity in one or more additional ways to the elastic compression of elliptical channel cross sections. These could involve development of increased tortuosity of channel ways or the existence of a more complex distribution of connected pores of different sizes and shapes. The simple model of a set of similarly sized and shaped channels that can behave in a comparable way to a real pore network is clearly inapplicable to this rock.
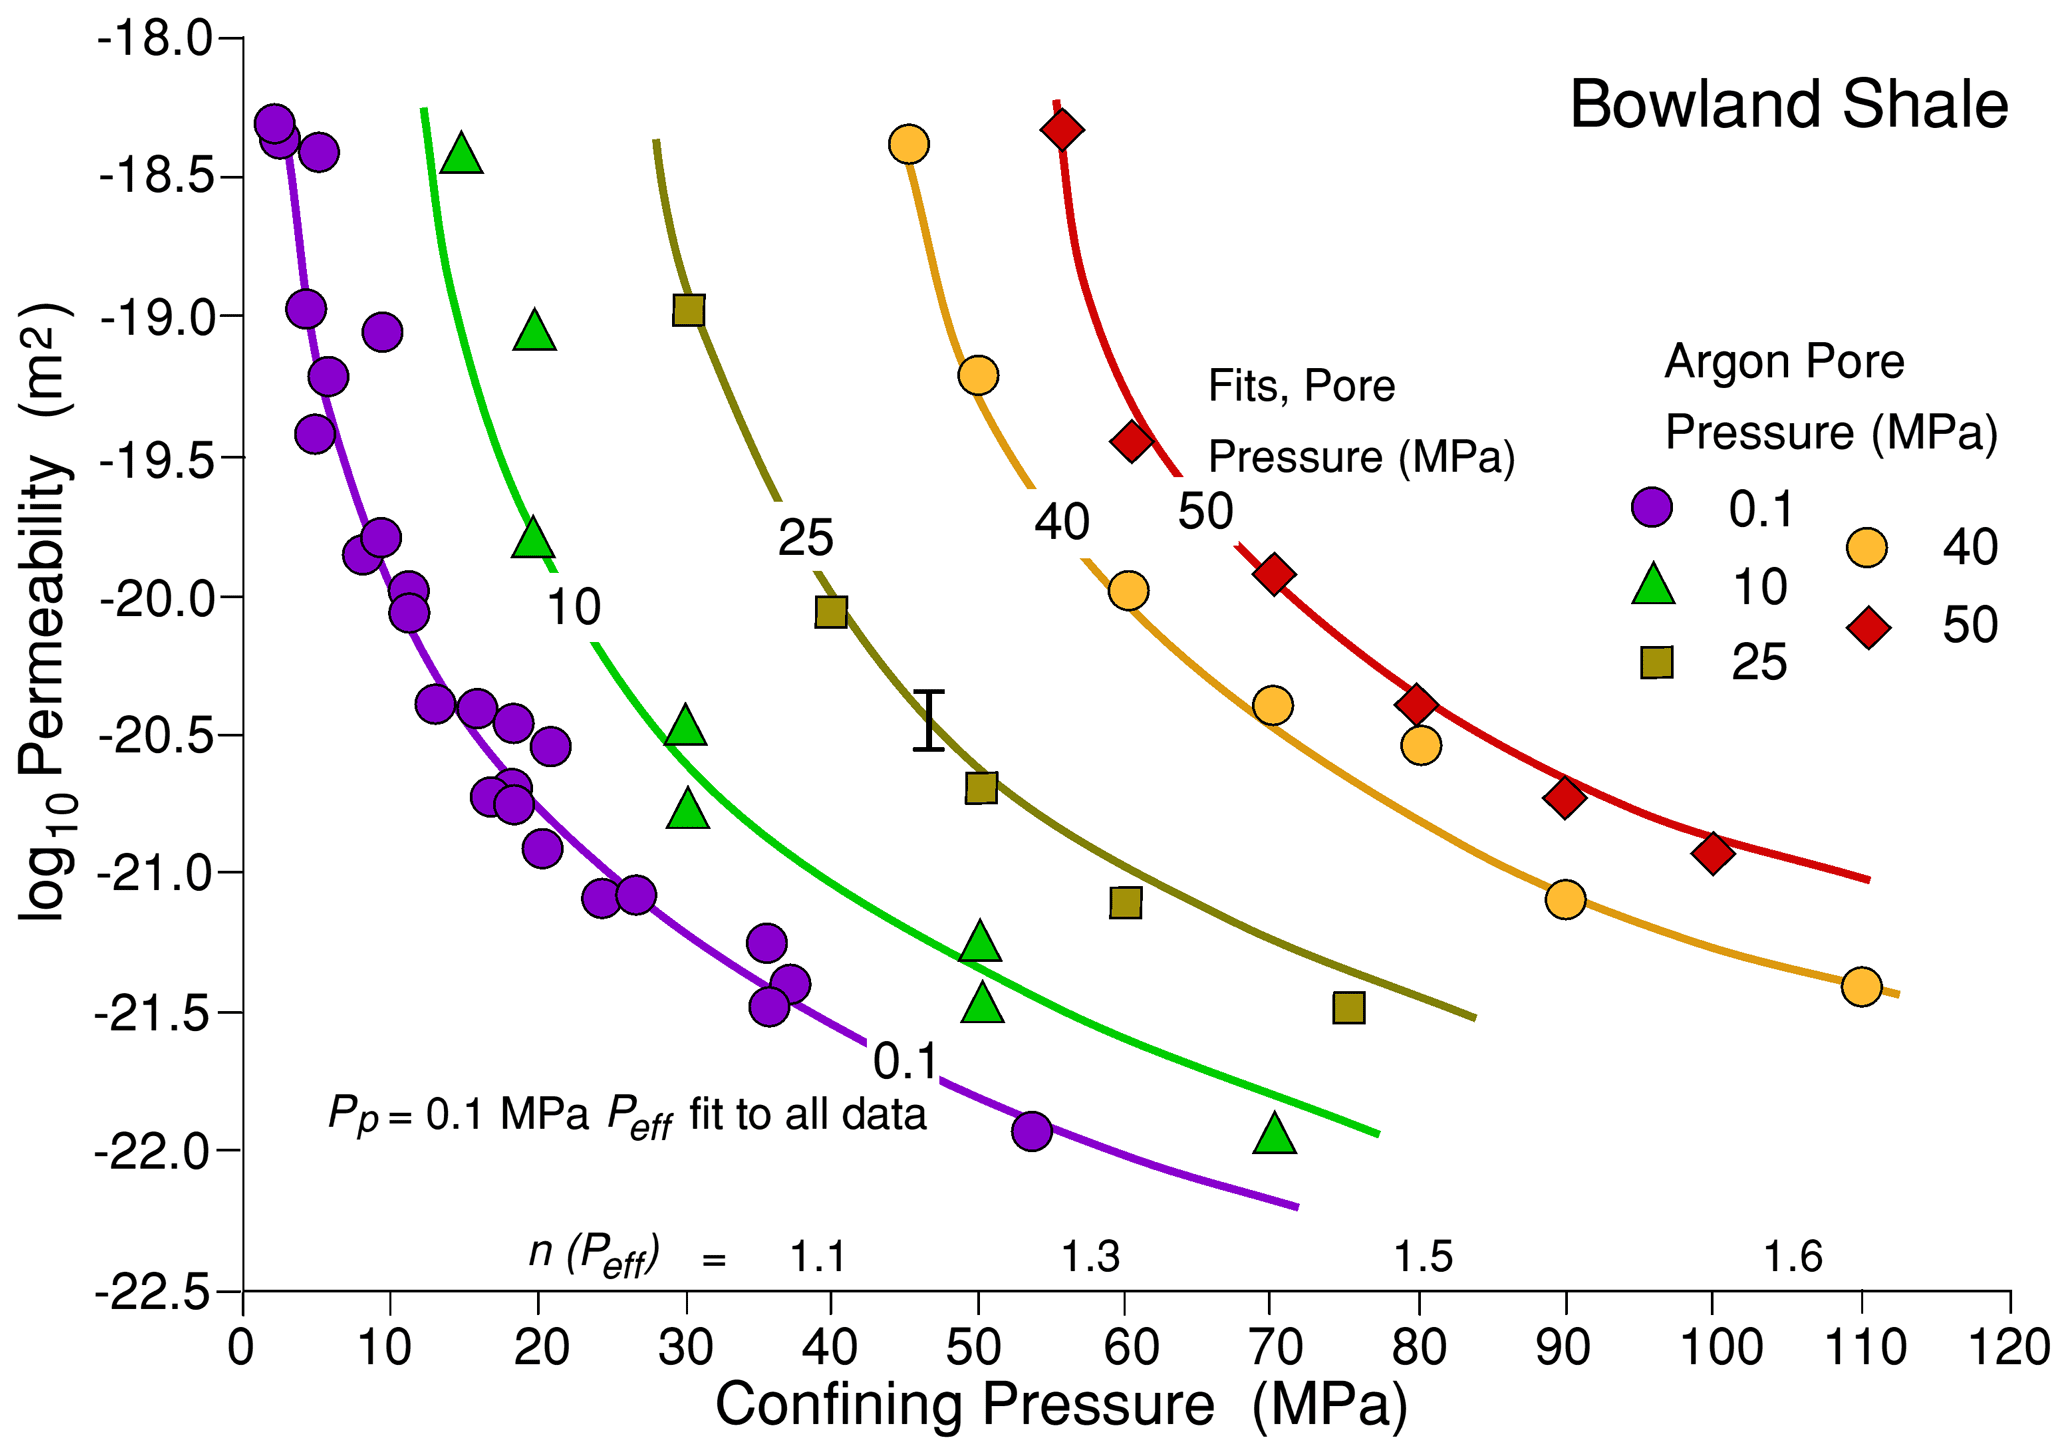
Figure 12Permeability of Bowland shale versus total confining pressure for various values of constant gas pore pressure. The curve and data shown for Pp=0.1 are the effective pressure fit to all the data as shown in Fig. 3, collapsed onto a single least-squares best-fit curve (log log10Peff−17.26) for a pore pressure coefficient made to vary linearly with Terzaghi effective pressure according to n= (1+Peff (MPa) 85). Measured data for the separate pore pressures are shown, with best-fit curves with the variable pore pressure coefficient. n values are shown to indicate how they increase from left to right.
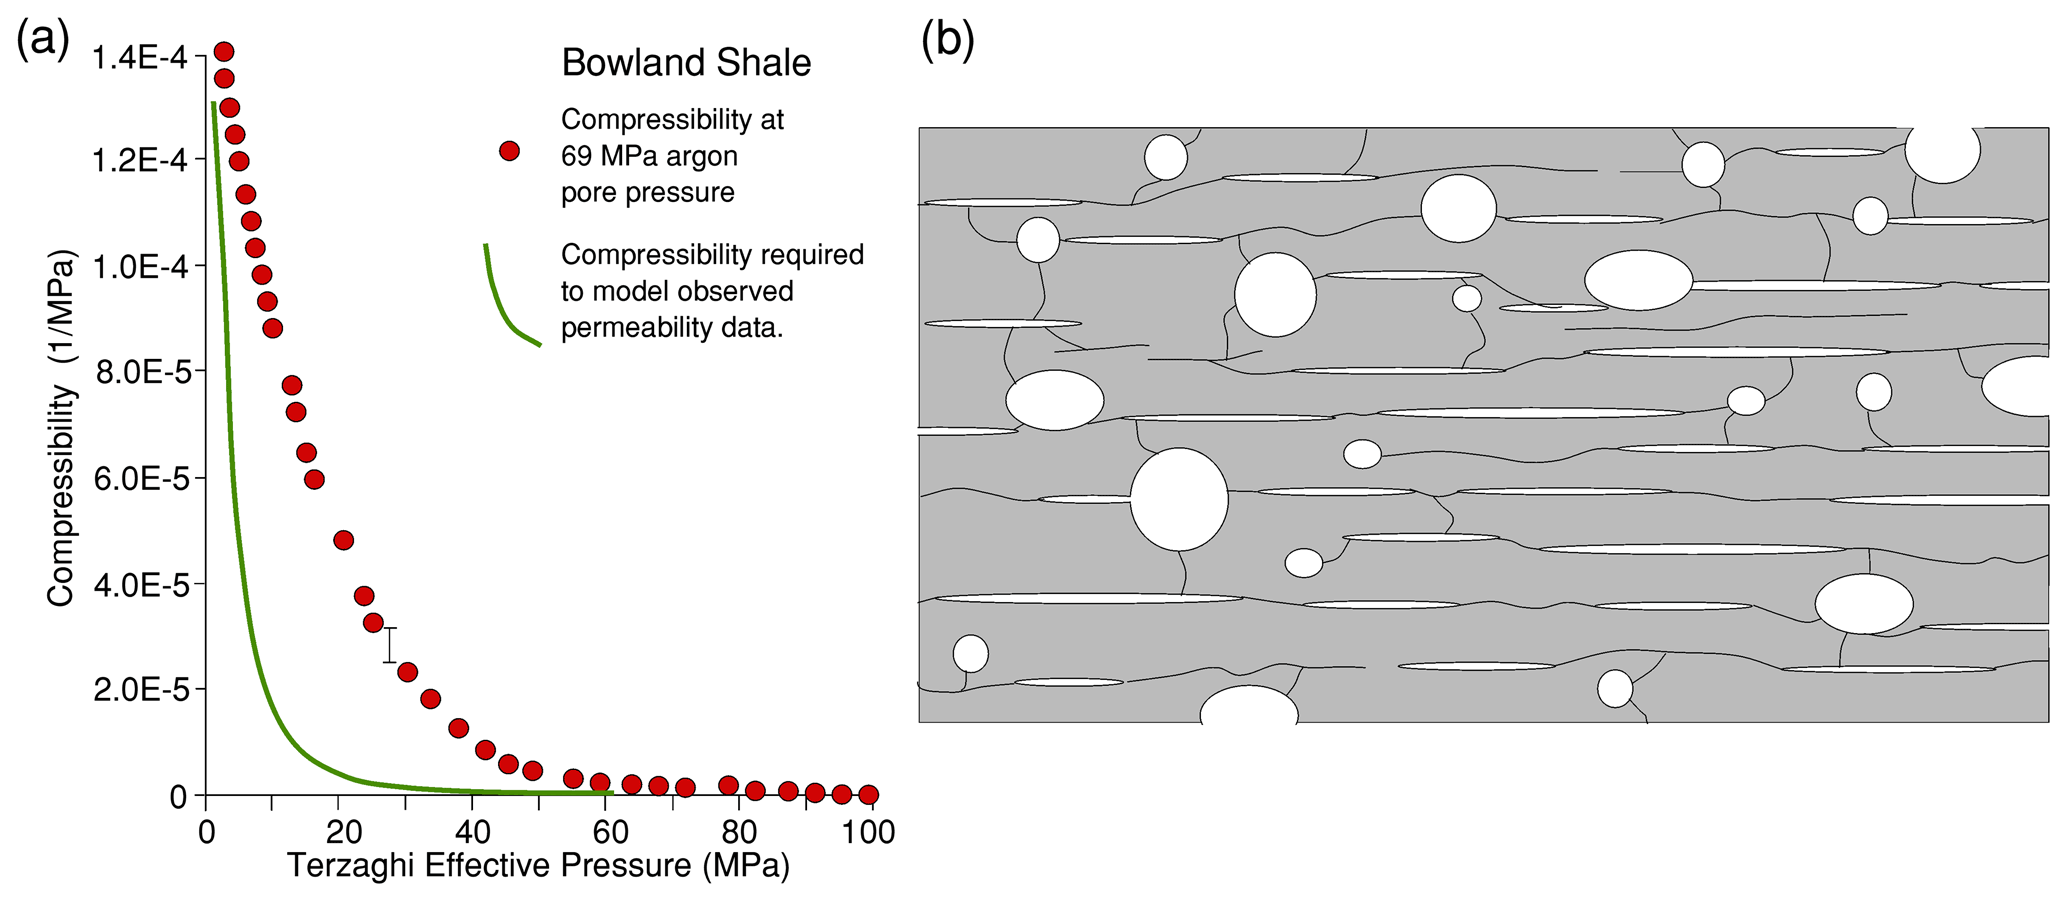
Figure 13(a) The experimentally observed variation in pore compressibility at 69 MPa pore pressure (filled circles) vs. Terzaghi effective pressure for Bowland shale, derived from the data in Fig. 9. The reciprocal of this compressibility is . This rate of reduction in compressibility with effective pressure cannot predict the observed pressure sensitivity of permeability that is observed experimentally. The continuous curve shows what the trend would have to be like in order that the single capillary tube model can behave in the same way as the rock. (b) Schematic illustration of the porosity model best able to explain the permeability and bulk modulus data in the shales. Highly eccentric pores and cracks lie parallel to layering but are well-connected, accounting for easy gas transport yet using only a small fraction of the porosity. These narrow pores are easily constricted by hydrostatic pressure. Most of the storage capacity resides in the larger, equant pores of dimensions of about 1 µm that are poorly linked and not easily closed down by hydrostatic pressure.
5.3 The effective pressure coefficients, m and n
In the context of permeability, n is the multiplier of pore pressure in the definition of the modification of Terzaghi effective pressure that brings observed permeability data at different constant pore pressures onto a common curve (e.g. Fig. 12); thus . n takes a value close to unity in the case of the experimental data on Haynesville shale and Whitby shale and 0.86 in the case of Pennant sandstone. In other studies, observed departures from unity have been attributed to, for example, differences in the roles of elastically stiff and elastically soft mineral components surrounding the pore spaces in responses to changes in Pc relative to changes in Pp (e.g. Zoback and Byerlee, 1975; Kwon et al., 2001; Ma and Zoback, 2017), resulting in different rates of change in pore volume with Pc and Pp.
On the other hand, in Eq. (4), for a homogeneous, isotropic elastic matrix, it is the value of Kdry, the bulk modulus of the porous rock that determines the change in geometry of pore spaces, and hence permeability, in response to effective pressure change. The theoretical expression for the effective pressure coefficient m for elastic deformations of a mechanically linear, homogeneous, and isotropic rock is given by Eq. (7), and this parameter appears in the expression for the permeability according to the bundle of capillary tubes model (Eq. 19). Using the pore fluid displacement method (Figs. 6, 8, and 9) we have found that in all cases m decreases from near unity with Terzaghi effective pressure according to the pressure dependence of Kdry, whereas for Pennant sandstone and Haynesville shale, observed n remains close to unity for permeability data and exceeds unity for Bowland shale over Terzaghi effective pressures from 0 to ca. 80 MPa; thus m≠n. Nur and Byerlee (1971) took care to point out that m as defined in Eq. (7) cannot generally be used as a predictor of the effective pressure coefficient for particular processes, like permeability, mechanical strength, and elastic wave velocities, even though all involve elastic distortions.
As was pointed out earlier, the pressure sensitivity of permeability according to the simple capillary bundle model cannot behave in the same way as was observed experimentally for Bowland shale. Also, a single value of n cannot reconcile permeabilities at different pore pressures for this rock. Figure 12 shows the permeability data for Bowland shale separated into measurements at different pore pressures. By extending the collective fit between log permeability and effective pressure shown in Fig. 12 to the data at each pore pressure, the downward divergence of the curves becomes apparent. This can be described empirically by fitting a linear variation in n with Terzaghi effective pressure, such that n= 1 at low effective pressures, rising to n=1.6 at the upper end of the pressure range used. This is interpreted as a further manifestation of the pore structure complexities that mean that this Bowland shale cannot be described by a simple capillary tube bundle model.
5.4 Relationship between observed pressure-dependent permeability and mineralogy
Several studies have reported the relationships between mineralogy of shales and related rocks and their petrophysical properties (e.g. Kwon et al., 2004; Ma and Zoback, 2017). The rocks used in this study display a spectrum of mineralogy that is reflected in their permeabilities, both in terms of absolute values and their sensitivity to effective pressure.
Pennant sandstone is typical of tight gas sands in which the load bearing framework is of continuous quartz and feldspar grains with what would otherwise be a large porosity that is mostly filled with some detrital muscovite plus diagenetically introduced clay and oxide phases (Wilson and Pittman, 1977; Howard, 1992). Prior to the pore filling there was a degree of intergranular pressure solution and formation of quartz overgrowths around quartz grains. The protective armour around the filled pore spaces afforded by the quartz framework is thought to have limited the degree of compaction of the pore filling, in which most of the present porosity resides. Relative to the volume of the inter-quartz spaces, the porosity of the filling would be ∼ 20 %, and it is thought that this contributes to the relatively high overall permeability and reduced pressure sensitivity of Pennant sandstone.
The Bowland and Haynesville shales are mineralogically and microstructurally strikingly different. It is important to remember that these are particular samples taken from their respective sequences and may not be especially representative of their host sequences at all. The Bowland shale sample is a phyllosilicate-rich, carbonate-poor siliceous mudstone with sufficient phyllosilicate to form a contiguous matrix, and this is likely to be responsible for the relatively low bulk modulus (53 GPa) of the rock and hence low permeability. The Haynesville shale is a carbonate-rich (>50 vol %), phyllosilicate-poor siliceous mudstone with a higher bulk modulus (61 GPa). The carbonate grains (fossil fragments and diagenetic carbonate) provide a stiff framework of contiguous grains, helping to maintain open porosity and to resist its elastic compaction. Despite these qualitative observations that can be made about how mineralogy and microstructure impacts upon permeability, the present results do not form a basis for making any quantitative correlations.
5.5 Inference of key characteristics of pore space geometry in shales
Much has been written on pore space geometry based on SEM (scanning electron microscopy), TEM (transmission electron microscopy), and X-ray CT imaging of shales, but important characteristics can be inferred from observations of bulk petrophysical properties. Key points noted in the present study are as follows:
-
The storativities for both shales are extremely small for flow paths lying parallel to the layering, such that over 90 % of the available pore space is not participating in the flow.
-
At low effective pressures, the permeabilities of all three rocks are similar, but with increasing effective pressures they diverge at markedly different rates. Marked sensitivity of permeability to effective confining pressure implies that conductive (well-connected) pores are flat and crack-like. This is supported by permeability modelling that suggests that for a bundle of elliptical-section capillary tubes of equivalent permeability behaviour, their aspect ratios are extremely small and the narrow dimension is expected to be in the nanometric range (Table 3).
-
For flow normal to layering, at least in Haynesville shale, storativity is much greater than for flow across the layering but still implies that over half of the pore space is not participating in the flow.
-
Permeability in both shales is very low under elevated effective pressures compared to Pennant sandstone, which is of similar overall porosity, implying that connected pore spaces are narrow and/or poorly connected/tortuous.
The above observations suggest that the effective configuration of pore spaces corresponds to the sketch shown in Fig. 13b, with a population of highly oriented, crack-like pores parallel to layering that account for only a small fraction of the total porosity but dominate the hydraulic transmissivity through the rock mass parallel to the layering and also account for the low storativity associated with flow along the layering. These are poorly connected to larger, probably more equant pores by conduction channels trending across the layering, which contain most of the gas storage space in the rock. The equant pores are seen more easily for flow across the layering, so that this flow is characterized by higher storativity, as demonstrated for Haynesville shale. Such storage pores are likely to be much slower to drain (or to fill) in response to an applied pore pressure gradient than implicit in the laboratory-measured permeability data. This suggests that permeabilities measured by transient flow methods in the laboratory may lead to an over-conservative estimate of the potential for drainage of a gas reservoir in shale and perhaps help partially to explain the long-term persistence of flows from some shale gas reservoirs (e.g. Guo et al., 2017; Wang, 2017).
Permeabilities as functions of effective pressure were measured using the oscillating pore pressure method at 20 ∘C for three rocks (Haynesville and Bowland shales and Pennant sandstone) of low permeabilities and comparable porosities. Tests were at effective pressures ranging up to 90 MPa with argon gas as permeant. From exhibiting comparable permeabilities at low pressures they diverged markedly with increasing pressure. Pennant sandstone showed a permeability reduction with pressure of less than 10-fold, and Haynesville shale became less permeable by almost 2 orders of magnitude, whereas Bowland shale was reduced in permeability by more than 3 orders of magnitude. The different pressure sensitivities of permeability correlated inversely with their (pressure sensitive) bulk moduli and qualitatively with mineralogical differences, going from a continuous framework of stiff quartz grains (sandstone) through a carbonate-rich framework (Haynesville shale) to a contiguous matrix of phyllosilicate grains (Bowland shale).
High storativity of the sandstone implied that most of the available pore space was involved in the gas flow, but in the shales, for flow parallel to the layering, less than 10 % of the available pore space was involved in the flow. For flow in the Haynesville shale across the layering a larger pore space fraction was involved but still much less than all the available pore space. Thus only a small fraction of the total pore space can be inferred to be well connected in the shales. This implies that whilst the permeability we measure in the oscillating pore pressure experiment is that associated with gas transport through the rock mass, a lower effective permeability applies to the ability of the gas to flow into and out of the storage pores.
A simple model of permeability was developed based upon connected pore space behaving in a way similar to a bundle of capillary tubes of highly eccentric cross section. By fitting the model to the experimental data, it was possible to demonstrate that this model behaved in a similar way to the rocks for the case of Pennant sandstone and Haynesville shale, but the model could not behave in a way compatible with the marked pressure sensitivity of permeability for the Bowland shale. It was inferred that a more complex distribution of connected pore spaces of varying dimension and tortuosity would be required to behave like the Bowland shale sample.
All of the experimental data acquired in this research are freely accessible and collated in supporting data files DF1.csv and Matlab scripts that describe the finite-element simulations and permeability data processing. In compliance with UK Research Council requirements the files are deposited in the UK National Geoscience Data Centre (Rutter and Mecklenburgh, 2022; https://doi.org/10.5285/7dca47c4-1542-4b14-9505-72666b78938b). The files are also downloadable from https://doi.org/10.5281/zenodo.5914205 (Rutter et al., 2021).
ER was responsible for the conceptualization and methodology of the study, carrying out the bulk of the experiments, compilation and analysis of data, and writing the paper. JM was responsible for the acquisition and management of financial support, carrying out the FEM analysis, contribution to experimental design and data presentation, and preparation of the paper. YB carried out the experiments on Haynesville shale under the supervision of JM and ER as part of his doctoral research.
The contact author has declared that neither they nor their co-authors have any competing interests.
Publisher’s note: Copernicus Publications remains neutral with regard to jurisdictional claims in published maps and institutional affiliations.
This work was supported by UK Natural Environment Research Council grant NE/R017883/1 and was part of the Challenge 2 NERC Unconventional Hydrocarbons programme. Yusuf Bashir was supported by a postgraduate research studentship from the Petroleum Technology Development Fund – Nigeria.
Sections of borehole core of Bowland shale were kindly provided by Igas and those of Haynesville shale by BG International, now Shell. X-ray diffraction characterization of test materials was carried out by John Waters (University of Manchester). Total organic carbon measurements of Haynesville shale were carried out by Geir Hansen of Applied Petroleum Technology AS (Norway). GKN sinter metal filters GmbH kindly donated the 2 mm thick SIKA R1AX porous stainless-steel plates used in this work. Experimental Officers Stephen May and Lee Paul contributed to equipment maintenance. Mike Chandler and Rochelle Taylor provided helpful discussions. Christian David (University of Cergy-Pontoise) and an anonymous referee are thanked for helpful and constructive reviews.
This research has been supported by the Research Councils UK (grant no. NE/R017883/1).
This paper was edited by Florian Fusseis and reviewed by one anonymous referee.
Anderson, D. L.: Theory of the Earth. Cambridge University Press, Cambridge, England, 384 pp., https://resolver.caltech.edu/CaltechBOOK:1989.001 (last access: 14 March 2022), 2007.
Andrews, K. W.: Elastic moduli of polycrystalline cubic metals, J. Phys. D, 11, 2527–2534, 1978.
Bernabé, Y., Mok, U., and Evans, B.: A note on the oscillating flow method for measuring rock permeability, Int. J. Rock Mech. Min. Sci., 43, 311–316, https://doi.org/10.1016/j.ijrmms.2005.04.013, 2006.
Biot, M. A. and Willis, D. G.: The Elastic Coefficients of the Theory of Consolidation, J. Appl. Mech., 24, 594–601, 1957.
Brace, W. F., Walsh, J. B., and Frangos, W. T.: Permeability of granite under high pressure, J. Geophys. Res., 73, 2225–2236, https://doi.org/10.1029/JB073i006p02225, 1968.
Bustin, R. M., Bustin, A. M. M., Cui, A., Ross, D., and Pathi, V. M.: Impact of shale properties on pore structure and storage characteristics. Paper presented at the SPE Shale Gas Production Conference, 16–18 November 2008, Fort Worth, Texas, USA, SPE-119892-MS, https://doi.org/10.2118/119892-MS, 2008.
Calderón, E., Gauthier, M., Decremps, F., Hamel, G., Syfosse, G., and Polian, A.: Complete determination of the elastic moduli of α-quartz under hydrostatic pressure up to 1 GPa: an ultrasonic study, J. Phys. Condens. Matter, 19, 436228, https://doi.org/10.1088/0953-8984/19/43/436228, 2007.
Cui, X., Bustin, A. M. M., and Bustin, R. M.: Measurements of gas permeability and diffusivity of tight reservoir rocks: different approaches and their applications, Geofluids, 9, 208–223, https://doi.org/10.1111/j.1468-8123.2009.00244.x, 2009.
Diaz, H. G., Fuentes, C. C., Calvin, C., Yang, Y., MacPhail, K., and Lewis, R.: Evaluating the impact of mineralogy on reservoir quality and completion quality of organic shale plays, in: AAPG Rocky Mountain Section Meeting, Salt Lake City, Utah, https://www.searchanddiscovery.com/ (last access: 14 March 2022), 2013.
Dowey, P. J. and Taylor, K. G.: Diagenetic mineral development within the Upper Jurassic Haynesville-Bossier Shale, USA, Sedimentology 67, 47–77, https://doi.org/10.1111/sed.12624, 2020.
Faulkner, D. R. and Rutter, E. H.: Comparisons of water and argon permeability in natural clay-bearing fault gouge under high pressure at 20 ∘C, J. Geophys. Res.-Sol. Ea., 105, 16415–16426, https://doi.org/10.1029/2000jb900134, 2000.
Fischer, G. J. and Paterson, M. S.: Measurement of permeability and storage capacity in rocks during deformation at high temperature and pressure, in: Fault Mechanics and Transport Properties of Rocks, edited by: Evans, B. and Wong, T.-F., Academic Press, San Diego, California, 213–251, ISBN 978-0-12-243780-9, 1992.
Gosman, A. L., McCarty, R. D., and Hust, J. G.: Thermodynamic properties of argon from the triple point to 300 K at pressures to 1000 atmospheres, in: National Standard Reference Data Series, National Bureau of Standards, 27, Washington, DC, US Department of Commerce, National Bureau of Standards, Washington DC, https://nvlpubs.nist.gov/nistpubs/Legacy/NSRDS/nbsnsrds27.pdf (last access: 14 March 2022), 1969.
Green, D. H. and Wang, H. F.: Fluid pressure response to undrained compression in saturated sedimentary rock, Geophysics, 51, 948–956, 1986.
Guo, K., Zhang, B., Wachtmeister, H., Aleklettb, K., and Höök, M.: Characteristic Production Decline Patterns for Shale Gas Wells in Barnett. International Journal of Sustainable Future for Human Security, J. Sustain., 5, 12–21, https://doi.org/10.24910/jsustain/5.1/1221, 2017.
Hammes, U., Hamlin, H. S., and Ewing, T. E.: Geologic analysis of the Upper Jurassic Haynesville Shale in east Texas and west Louisiana, AAPG Bull., 95, 1643–1666, 2011.
Hackston, A. and Rutter, E.: The Mohr–Coulomb criterion for intact rock strength and friction – a re-evaluation and consideration of failure under polyaxial stresses, Solid Earth, 7, 493–508, https://doi.org/10.5194/se-7-493-2016, 2016.
Hasanov, A. K., Dugan, B., Batzle, M. L., and Prasad, M.: Hydraulic and poroelastic rock properties from oscillating pore pressure experiments, J. Geophys. Res.-Sol. Ea., 124, 4473–4491, https://doi.org/10.1029/2018JB017276, 2019.
Hasanov, A. K., Dugan, B., and Batzle, M. L.: Numerical simulation of oscillating pore pressure experiments and inversion for permeability, Water Resour. Res., 56, e2019WR025681, https://doi.org/10.1029/2019WR025681, 2020.
Heller, R., Vermylen, J., and Zoback, M.: Experimental investigation of matrix permeability of gas shales, AAPG Bull., 98, 975–995, 2014.
Howard, J. J.: Influence of authigenic clay minerals on permeability, in: Origin, Diagenesis, and Petrophysics of Clay Minerals in Sandstones, edited by: Houseknecht, D. W. and Pittman, E. D., SEPM Special Publication, 47, 257–264, https://doi.org/10.2110/pec.92.47.0257, 1992.
Kelling, G.: Upper Carboniferous sedimentation in South Wales, in: The Upper Palaeozoic and post-Palaeozoic rocks of Wales, edited by: Owen, T. R., Cardiff, UK, University of Wales Press, 185–224, ISBN 9780708305553, 1974.
Kranz, R. L., Saltzman, J. S., and Blacic, J. D.: Hydraulic diffusivity measurements on laboratory rock samples using an oscillating pore pressure method, Int. J. Rock Mech. Min. Sci., 27, 345–352, https://doi.org/10.1016/0148-9062(90)92709-N, 1990.
Kwon, O., Kronenberg, A. K., Gangi, A. F., and Johnson, B.: Permeability of Wilcox shale and its effective pressure law, J. Geophys. Res., 106, 19339–19353, https://doi.org/10.1029/2001JB000273, 2001.
Kwon, O., Kronenberg, A. K., Gangi, A. F., Johnson, B., and Herbert, B. E.: Permeability of illite-bearing shale: 1. Anisotropy and effects of clay content and loading, J. Geophys. Res., 109, B10205, https://doi.org/10.1029/2004JB003052, 2004.
Lazar, O. R., Bohacs, K. M., Macquaker, J. H. S., Schieber, J., and Demko, T. M.: Capturing key attributes of finegrained sedimentary rocks in outcrops, cores, and thin sections: nomenclature and description guidelines, J. Sed. Res., 85, 230–246, 2015.
Lockner, D. A. and Stanchits, S. A.: Undrained Poroelastic Response of Sandstones to Deviatoric Stress Change, J. Geophys. Res., 107, 2353, https://doi.org/10.1029/2001JB001460, 2002.
Ma, L., Slater, T., Dowey, P. J., Yue, S., Rutter E. H., Taylor, K. G., and Lee, P. D.: Hierarchical integration of porosity in shales, Sci. Rep., 8, 11683, https://doi.org/10.1038/s41598-018-30153-x, 2018.
Ma, X. and Zoback, M. D.: Laboratory experiments simulating poroelastic stress changes associated with depletion and injection in low porosity sedimentary rocks, J. Geophys. Res.-Sol. Ea., 122, 2478–2503, https://doi.org/10.1002/2016JB013668, 2017.
Mavko, G., Mukerji, T., and Dvorkin, J., The rock physics handbook: tools for seismic analysis of porous media, Cambridge, Cambridge University Press, Cambridge, UK, Vol. 112, 483, https://doi.org/10.1192/bjp.112.483.211-a, 2009.
Mavko, G. M. and Nur, A.: The effect of nonelliptical cracks on the compressibility of rocks, J. Geophys. Res., 83, 4459–4468, 1978.
McKernan, R., Mecklenburgh, J., Rutter, E. H., and Taylor, K. G.: Microstructural controls on the pressure-dependent permeability of Whitby mudstone, in: Geomechanical and Petrophysical Properties of Mudrocks, edited by: Rutter, E. H., Mecklenburgh, J., and Taylor, K. G., Geological Society, London, Special Publications, 454, 39–66, doi.org/10.1144/SP454.15, 2017.
Mendelson, K. S.: Bulk modulus of a polycrystal, J. Phys. D: Appl. Phys., 14 1307–1309, 1981.
Michels, S., Botzen, A., and Schuurman, W.: The viscosity of argon at pressures up to 2000 atmospheres, Physica, 20, 1141–1148, https://doi.org/10.1016/S0031-8914(54)80257-6, 1954.
Mondol, N. H., Jahren, J., and Bjørlykke, K.: Elastic properties of clay minerals, The Leading Edge, 27, 758–770, 2008.
Nur, A. and Byerlee, J. D.: An exact effective stress law for elastic deformation of rocks with fluids, J. Geophys. Res., 76, 6414–6419, 1971.
Rutter E. H. and Hackston, A.: On the effective stress law for rock-on-rock frictional sliding, and fault slip triggered by means of fluid injection, Phil. Trans. R. Soc. A, 375, 20160001, https://doi.org/10.1098/rsta.2016.0001, 2017.
Rutter E. H. and Mecklenburgh J.: Hydraulic conductivity of bedding-parallel cracks in shale as a function of shear and normal stress, in: Geomechanical and petrophysical properties of mudrocks, edited by: Rutter, E., Mecklenburgh, J., and Taylor, K., Geological Society of London Special Publication, Vol. 454, London, UK, Geological Society of London, https://doi.org/10.1144/SP454.9, 2017.
Rutter, E. H. and Mecklenburgh, J.: Influence of Normal and Shear Stress on the Hydraulic Transmissivity of Thin Cracks in a Tight Quartz Sandstone, a Granite, and a Shale, J. Geophys. Res.-Sol. Ea., 123, 1262–1285, 2018.
Rutter, E. H. and Mecklenburgh, J.: Experimental data on tight rock permeability, NERC EDS National Geoscience Data Centre [data set and code], https://doi.org/10.5285/7dca47c4-1542-4b14-9505-72666b78938b, 2022.
Rutter, E., Mecklenburgh, J., and Bashir, Y.: Datafile DF1 + Matlab Scripts, Zenodo [data set and code], https://doi.org/10.5281/zenodo.5914205, 2021.
Seeburger, D. A. and Nur, A.: A pore space model for rock permeability and bulk modulus, J. Geophys. Res., 89, 527–536, https://doi.org/10.1029/JB089iB01p00527, 1984.
Skempton, A. W.: The pore pressure coefficient in saturated soils, Géotechnique, 10, 186–187, 1960.
Terzaghi, K. V.: Die Berechnung der Durchassigkeitsziffer des Tones aus dem Verlauf der hydrodynamischen Spannungserscheinungen, Sitzungsber. Akad. Wiss. Wien Math Naturwiss. Kl. Abt. 2A, 132, 125–138, 1923.
Walsh, J.: The effect of cracks on the compressibility of rock, J. Geophys. Res., 70, 381–389, https://doi.org/10.1029/jz070i002p00381, 1965.
Wang, H.: What Factors Control Shale Gas Production and Production Decline Trend in Fractured Systems: A Comprehensive Analysis and Investigation, SPE J., 22, 562–581, https://doi.org/10.2118/179967-PA, 2017.
Wilson, M. D. and Pittman, E. D.: Authigenic clays in sandstones; recognition and influence on reservoir properties and paleoenvironmental analysis, J. Sediment. Res., 47, 3–31, doi.org/10.1306/212F70E5-2B24-11D7-8648000102C1865D, 1977.
Zanazzi, P. F. and Pavese, A.: Behavior of micas at high pressures and temperatures, in: Reviews in Mineralogy and Geochemistry, 46, edited by: Mottana, A., Sassi, F. P., Thompson, J. B., and Guggenheim, S., Mineralogical society of America, Washington D.C., 99–106, https://doi.org/10.2138/rmg.2002.46.02, 2002.
Zee Ma, Y., Moore, W. R., Gomez, E., Clark, W. J., and Zhang, Y.: Tight Gas Sandstone Reservoirs, Part 1: Overview and Lithofacies, Unconventional Oil and Gas Resources Handbook; Evaluation and Development, chap. 14, Elsevier, Amsterdam, 405–427, https://doi.org/10.1016/B978-0-12-802238-2.00014-6, 2016.
Zimmerman, R. W.: Compressibility of sandstones, Elsevier, Amsterdam, the Netherlands, 173 pp., ISBN 9780080868875, 1991.
Zoback, M. D. and Byerlee, J. D.: Permeability and effective stress, Bull. Am. Assoc. Petr. Geol., 59, 154–158, 1975.