the Creative Commons Attribution 4.0 License.
the Creative Commons Attribution 4.0 License.
 | 06 Jan 2023
A contribution to the quantification of crustal shortening and kinematics of deformation across the Western Andes ( ∼ 20–22° S)
Tania Habel
Robin Lacassin
Daniel Carrizo
German Aguilar
The Andes are an emblematic active Cordilleran orogen. Mountain building in the Central Andes (∼20∘ S) started by the Late Cretaceous to early Cenozoic along the subduction margin and propagated eastward. In general, the structures sustaining the uplift of the western flank of the Andes are dismissed, and their contribution to mountain building remains poorly constrained. Here, we focus on two sites along the Western Andes at ∼20–22∘ S in the Atacama desert, where structures are well exposed. We combine mapping from high-resolution satellite images with field observations and numerical trishear forward modeling to provide quantitative constraints on the kinematic evolution of the investigated field sites. When upscaling our local field interpretations to the regional scale, we identify two main structures: (1) the Andean Basement Thrust, a west-vergent thrust system placing Andean Paleozoic basement over Mesozoic strata, and (2) a series of west-vergent thrusts pertaining to the West Andean Thrust System, deforming primarily Mesozoic units. From our interpreted sections, we estimate that both structures together accommodate at least ∼6–9 km of shortening across the sole investigated ∼7–17 km wide field sites. This multi-kilometric shortening represents only a fraction of the total shortening accommodated across the whole Western Andes. The timing of the main deformation recorded in the folded Mesozoic series can be bracketed between ∼68 and ∼29 Ma – and possibly between ∼68 and ∼44 Ma – from dated deformed geological layers, with a subsequent significant slowing-down of shortening rates. Even though the structures forming the Western Andes only absorbed a small fraction of the total shortening across the whole orogen, their contribution was relatively significant at the earliest stages of Andean mountain building before deformation proceeded eastward.
- Article
(28252 KB) - Full-text XML
-
Supplement
(17820 KB) - BibTeX
- EndNote


Along the western margin of South America (Fig. 1), the oceanic Nazca plate plunges beneath the South American continent, with a present-day convergence rate of ∼8 cm yr−1 at ∼20∘ S according to the NUVEL-1A model (Demets et al., 1994). The subduction megathrust absorbs most of this convergence in the form of large earthquakes (magnitude Mw≥8). A small fraction of it – presently ∼1 cm yr−1 at 20∘ S (e.g., Norabuena et al., 1998; Brooks et al., 2011) – has contributed to the deformation of the upper plate over millions of years and to the formation of one of the largest reliefs at the Earth's surface: the Andean Cordilleras and the Altiplano–Puna Plateau in between.
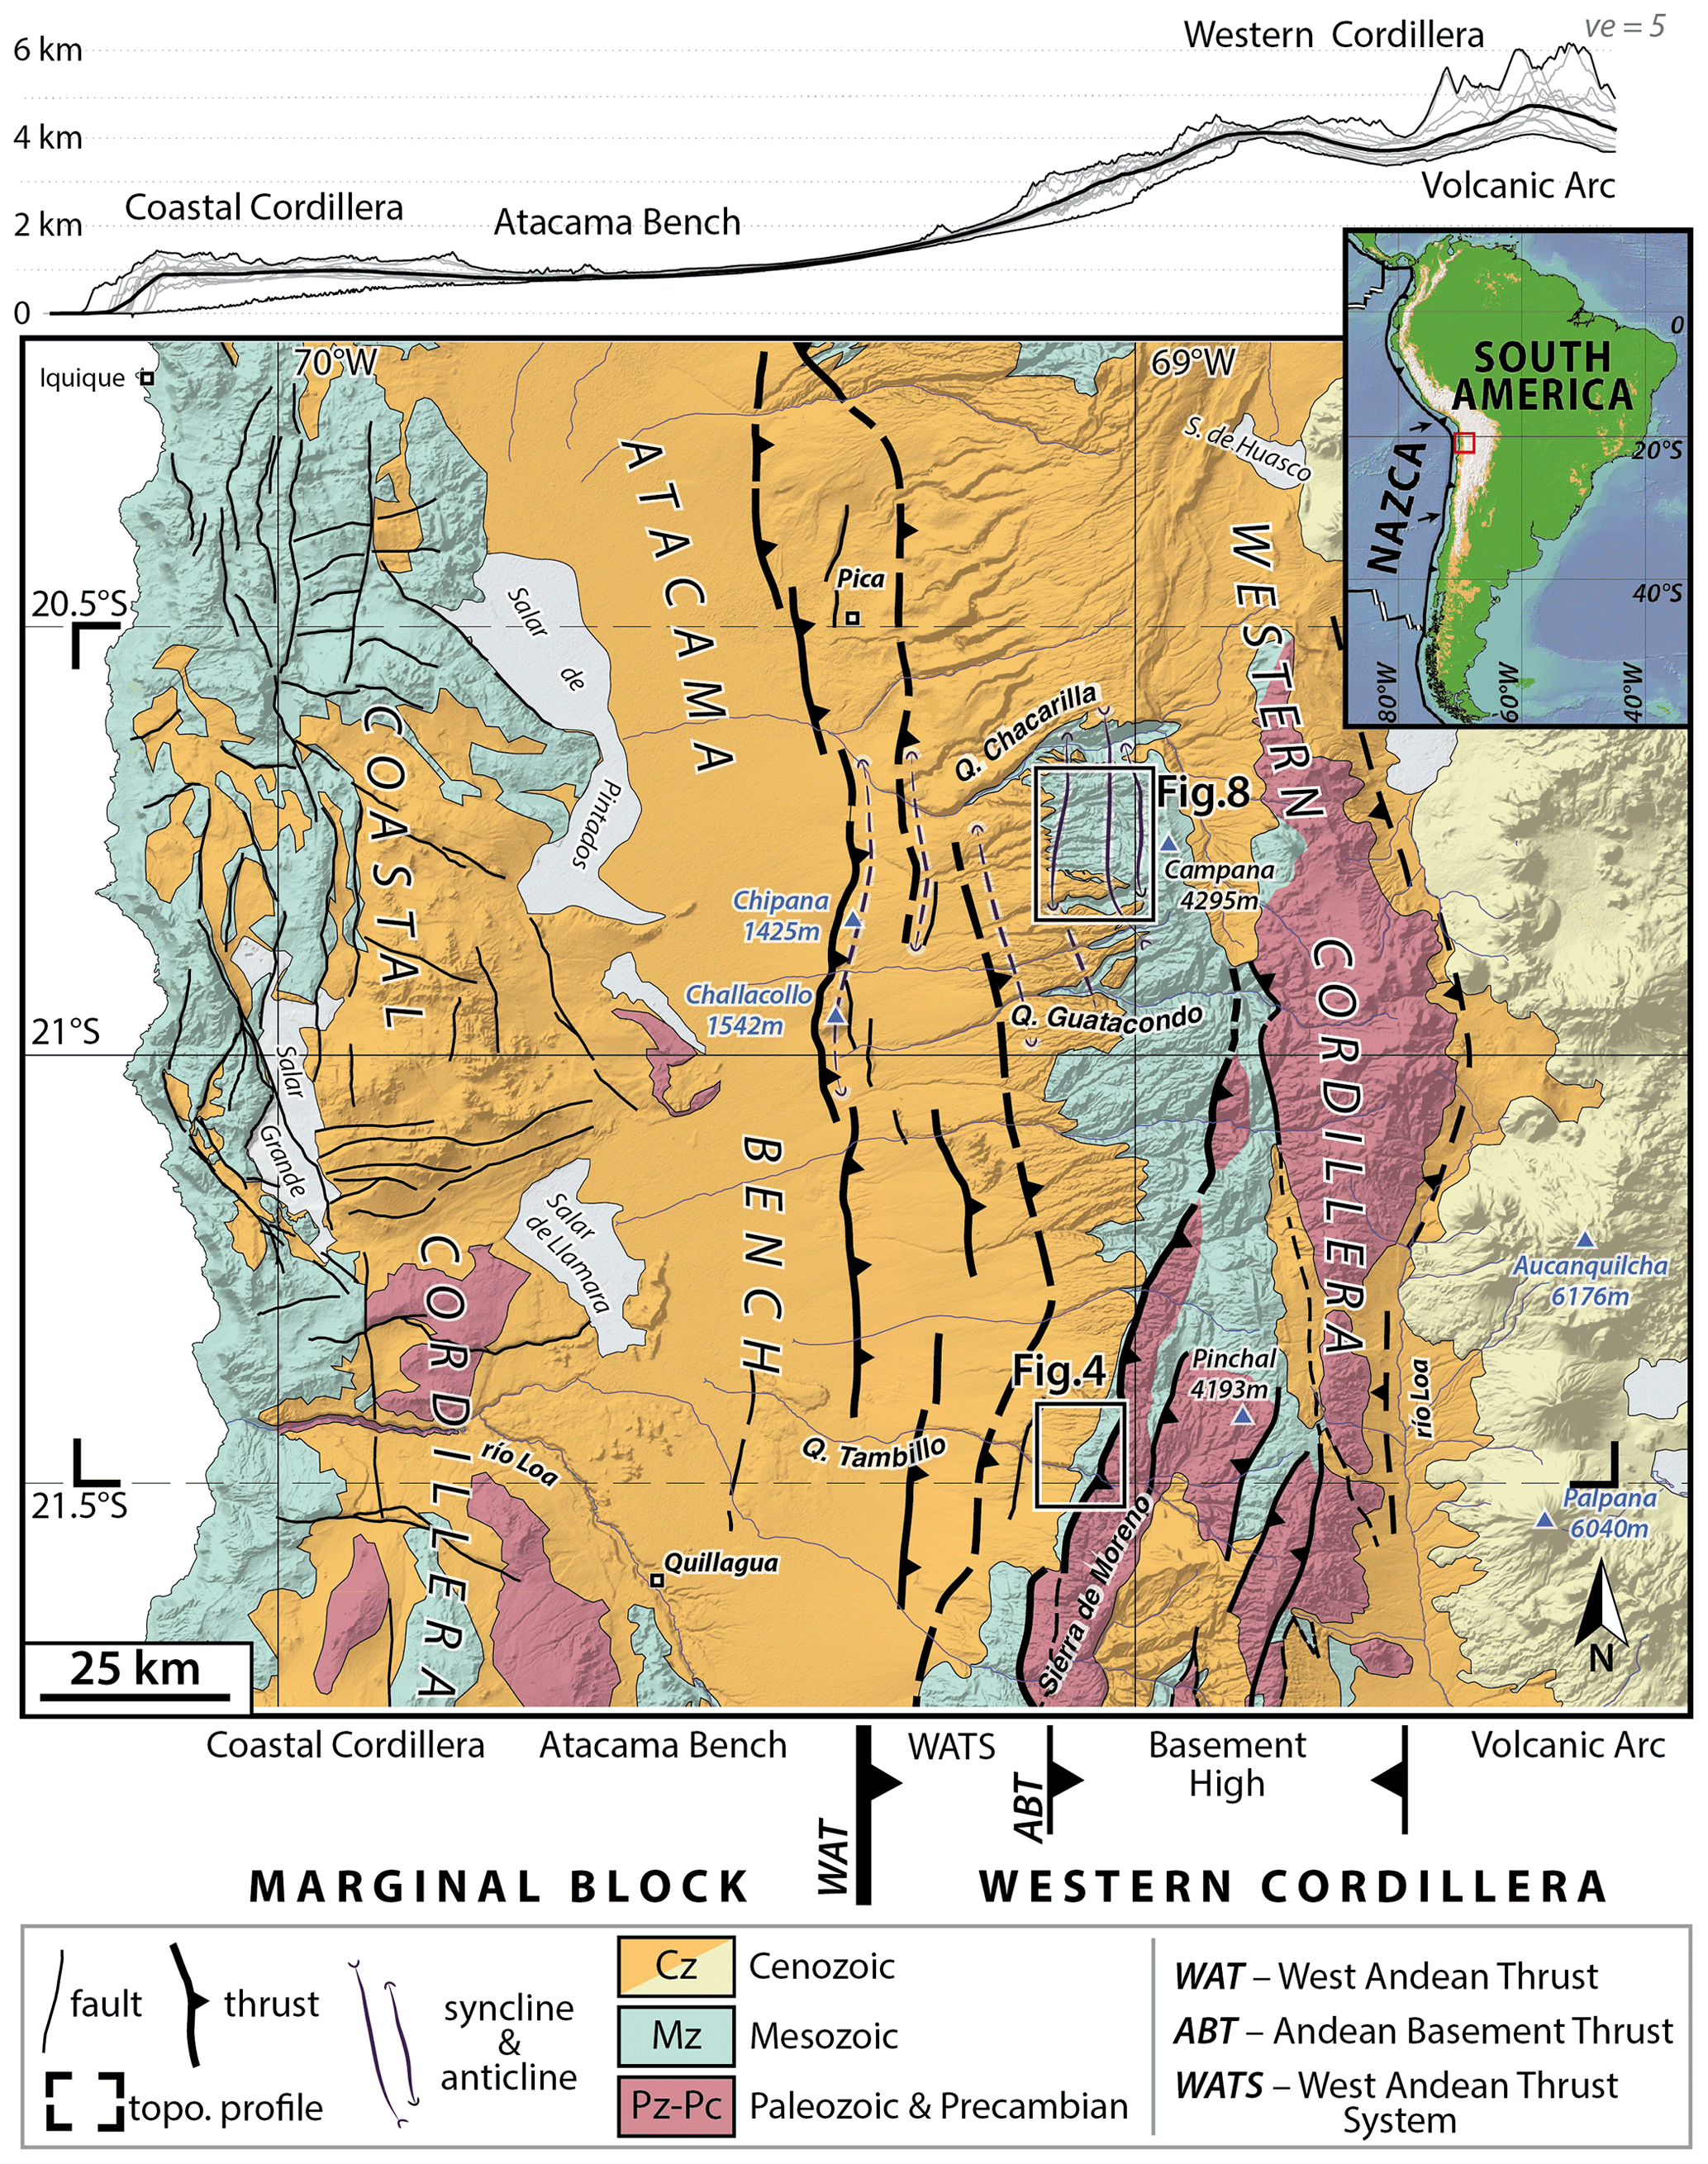
Figure 1Simplified geological and structural map of the western Central Andes at ∼20–22∘ S (northern Chile) and average topographic profile. Map modified from Armijo et al. (2015); vertical exaggeration (ve) of 5 for topographic profile. The Marginal Block and the Western Cordillera constitute the two main structural ensembles. The Western Cordillera includes the West Andean Thrust System (WATS), a basement high (Cordillera Domeyko), and the modern volcanic arc. The structures forming the WATS are mostly hidden beneath blanketing Cenozoic deposits and only outcrop in a few places. The Andean Basement Thrust separates the basement high of the Western Cordillera from the WATS. The locations of Figs. 4 (Pinchal area) and 8 (Quebrada Blanca area) are reported. Inset: location of the map (red box) within the South American continent.
Andean mountain building initiated by Late Cretaceous–early Cenozoic along the Western Andes of the Bolivian Orocline (between 16–22∘ S) and has proceeded since then with the progressive eastward propagation of deformation onto the South American continent (e.g., Armijo et al., 2015; Charrier et al., 2007; Decelles et al., 2014; Eichelberger et al., 2013; Oncken et al., 2006; Jaillard et al., 2000; and references therein). Most local and mountain-wide studies have essentially focused on the Altiplano–Puna Plateau and on the various cordilleras to the east. In comparison, the structures located along the western flank of the orogen have remained relatively understudied up to now.
In most classical models of Andean mountain building, the western flank is described as a passive monoclinal-like crustal-scale flexure (e.g., Isacks, 1988; Lamb, 2011, 2016; Mcquarrie, 2002). However, in the late 1980s, Mpodozis et al. (1989) described west-vergent thrusting along the Western Andean margin. Later, other authors also described various thrusts, mostly west-vergent (but not only) (e.g., Charrier et al., 2007; Farías et al., 2005; Fuentes et al., 2018; Garcia and Hérail, 2005; Martinez et al., 2021; Muñoz and Charrier, 1996; Victor et al., 2004), but they generally gave these thrusts a minor role in the building of the western flank of the orogen. Only further south, at the latitude of Santiago de Chile (∼33∘30′ S), has a clear west-vergent fold-and-thrust belt been documented along the Western Andes (Armijo et al., 2010; Riesner et al., 2017, 2018). This thrust belt emerges at the active San Ramon Fault in front of the capital city of Santiago de Chile and has absorbed a relatively significant amount of crustal shortening (Riesner et al., 2017, 2018).
At 33∘30′ S, the orogen is relatively young and narrow. In contrast, ∼1300 km further north, at ∼20–22∘ S where the Andes–Altiplano system is much wider and structurally more complex, the contribution of structures along the Western Andes is probably small compared to the >300 km total shortening (e.g., Anderson et al., 2017; Barnes and Ehlers, 2009; Eichelberger et al., 2013; Elger et al., 2005; Kley and Monaldi, 1998; Mcquarrie et al., 2005; Sheffels, 1990) across the entire >650 km wide orogen, but their role at the onset of orogenic building may have been significant (Armijo et al., 2015). One of the difficulties in better quantifying the contribution of these structures is that a large part of the deformation is hidden under blanketing middle to upper Cenozoic deposits and volcanics (Fig. 1) (Armijo et al., 2015; Farías et al., 2005; Sernageomin, 2003; Victor et al., 2004). A quantitative analysis of this deformation and its kinematics is only possible at the few sites along the western flank where deformed Mesozoic series crop out and which are accessible despite the hostile desert conditions in northern Chile.
In this study, we provide quantitative structural data to better constrain the geometry of structures, the shortening they accommodated, and their kinematics of deformation over time in two of the few areas along the Western Andean flank where the underlying deformed Mesozoic layers are exposed (Fig. 1). The Pinchal area, at ∼21∘30′ S, exhibits a west-vergent thrust that brings the Paleozoic basement of the Cordillera Domeyko over folded Mesozoic units. In the Quebrada Blanca zone, ∼80 km further north, the excellent exposure of folded Mesozoic series allows for a more quantitative estimate of the shortening and of the timing of the main deformation episode. These two study areas only give a limited view of the deformation of the whole Western Andean flank (Fig. 1). Despite these limitations, we find that the shortening of these structures is multi-kilometric, revealing that the contribution of the Western Andean flank to Andean mountain building is not negligible. Additionally, we show that the main deformation recorded by the folded Mesozoic units occurred sometime between ∼68 and ∼29 Ma (and possibly between ∼68 and ∼44 Ma), further emphasizing that these structures mostly participated in the early stages of mountain building.
2.1 General geological framework
At ∼20–22∘ S, from west to east, the Andean margin (Fig. 1) is constituted of (1) the subduction margin, including the Peru–Chile Trench, the oceanward forearc, and the Coastal Cordillera that reaches elevations >1 km and that corresponds to the former Mesozoic volcanic arc; (2) the Atacama Bench or Central Depression, at an altitude of ∼1 km, corresponding to a modern continental forearc basin well expressed in the morphology and topography of northern Chile; and (3) the strictly speaking Andean orogen (e.g., Charrier et al., 2007; Mcquarrie et al., 2005; Oncken et al., 2006). The morpho-tectonic units located west of the Andean orogen constitute the Marginal Block (i.e., the oceanward forearc, the Coastal Cordillera, and the Atacama Bench; Fig. 1) (Armijo et al., 2015, 2010).
At ∼20–22∘ S latitude, the Andes are characterized by their largest width (>650 km), highest average elevation (∼4–4.5 km above sea level, hereafter a.s.l., Fig. 1), thickest crust (70–80 km, e.g., Heit et al., 2007; Tassara et al., 2006; Wölbern et al., 2009; Yuan et al., 2000; Zandt et al., 1994), and greatest total shortening (>300 km, e.g., Anderson et al., 2017; Barnes and Ehlers, 2009; Eichelberger et al., 2013; Elger et al., 2005; Kley and Monaldi, 1998; Mcquarrie et al., 2005; Sheffels, 1990). Here, the Andean orogen is composed, from west to east, of (1) the Western Cordillera, including the Cordillera Domeyko and the modern volcanic arc (Fig. 1) (e.g., Armijo et al., 2015; Eichelberger et al., 2013; Garzione et al., 2017; Mcquarrie, 2002; Oncken et al., 2006); (2) the Altiplano Plateau, a high-elevation internally drained low-relief basin; (3) the Eastern Cordillera (or Cordillera Oriental); (4) the Interandean zone; and (5) the Subandean ranges, east of which the South American craton underthrusts the Andes (e.g., Armijo et al., 2015; Isacks, 1988; Mcquarrie et al., 2005; Oncken et al., 2006).
The building of the Andean mountain belt stricto sensu proceeded since the Late Cretaceous–early Cenozoic at ∼20–22∘ S and was associated with crustal shortening and thickening (e.g., Armijo et al., 2015; Charrier et al., 2007; Decelles et al., 2014; Eichelberger et al., 2013; Oncken et al., 2006; Jaillard et al., 2000; and references therein). Based on regional syntheses (e.g., Armijo et al., 2015; Charrier et al., 2007; Garzione et al., 2017; Horton, 2018; Mcquarrie et al., 2005; Oncken et al., 2006), the across-strike growth of the orogen is summarized as follows: (1) by the Late Cretaceous, the Mesozoic arc and back-arc basin (formed during the early Andean cycle) were located at the position of the present-day forearc, and most of the Andes showed mainly flat topography; (2) by the Late Cretaceous–early Cenozoic, orogenic growth initiated primarily along the western margin of the present-day Altiplano; (3) by ∼45–30 Ma, shortening vanished along the western flank of the Andes and was transferred to the Eastern Cordillera; (4) by ∼25 Ma, deformation ended in the Eastern Cordillera and migrated to the Interandean Belt; (5) from ∼10 Ma until present, deformation within the Subandean Belt proceeded with the underthrusting of the Brazilian Craton beneath the Andes. It is therefore clear that the Andean shortening started along the Western Andes and subsequently propagated eastward, progressively enlarging the orogen to form the different cordilleras and the Altiplano Plateau in between.
2.2 Geological setting of the western flank of the Andes at ∼20–22∘ S
The Andean western flank is formed of three tectono-stratigraphic units at ∼20–22∘ S, aside from the present-day volcanic arc. These units are hereafter described following a stratigraphic logic, starting from the oldest and deepest units exposed to the east at higher altitudes and following to the youngest units observed mostly to the west at lower altitudes (Fig. 1). These units are (1) the Andean basement consisting of metamorphic rocks of Precambrian and Paleozoic ages and (2) the folded volcano-sedimentary deposits of Mesozoic age (Triassic–Cretaceous), unconformably overlain by (3) less-deformed middle to upper Cenozoic (Oligocene–Quaternary) volcanics and sedimentary cover (Sernageomin, 2003). Magmatic intrusions locally alter these different units and are mostly Cenozoic. This only pictures the first-order structuration of the Western Andean flank, as Mesozoic strata may be locally trapped between two basement units, and Cenozoic layers may be unconformably overlying older strata even to the east (Fig. 1). Laterally, in particular further south (i.e., south of the city of Calama, ∼22∘27′), the structural organization of the western flank of the Andes is more complex, most probably because of the variable lateral structuration of the earlier Mesozoic Andean basins, and the description proposed here does not directly apply.
2.2.1 Stratigraphic and geologic background
The pre-Andean basement rocks formed during the late Proterozoic and Paleozoic, when the Amazonian craton was progressively assembled from various terranes (e.g., Charrier et al., 2007; Lucassen et al., 2000; Ramos, 1988; Rapela et al., 1998). At the end of this period of subduction and continental accretion, intense magmatic activity (volcanism and major granite intrusions) welded together the basement during the late Carboniferous to early Permian (Charrier et al., 2007; Ramos, 1988; Vergara and Thomas, 1984).
The Mesozoic deposits (Triassic to Cretaceous), found today along the Western Andean flank, formed in a proto-Andean arc and back-arc basin system during the early period of the Andean cycle (e.g., Charrier et al., 2007; Mpodozis et al., 1989). Marine and continental sediments are interbedded with volcano-magmatic rocks (Aguilef et al., 2019; Sernageomin, 2003). These Mesozoic units locally attain thicknesses up to ≥10 km (e.g., Buchelt and Cancino, 1988; Charrier et al., 2007; Mpodozis et al., 1989).
A regional erosional surface called the Choja Pediplain (Galli-Olivier, 1967) developed during the Eocene to early Oligocene (∼50–30 Ma) (e.g., Armijo et al., 2015; Victor et al., 2004; and references therein). Above this angular unconformity, the up to ∼1600 m thick (Labbé et al., 2019) Cenozoic deposits of the Altos de Pica Formation are composed of continental clastic sediments, interbedded with volcanic layers (Victor et al., 2004). The oldest documented age within the Altos de Pica Formation is ∼24–26 Ma from dated ignimbrites (Farías et al., 2005; Victor et al., 2004). From there, an age of ∼27–29 Ma for the base of the formation is inferred regionally when extrapolated to the basal erosional surface. The youngest ignimbrites within the Altos de Pica Formation are dated at ∼14–17 Ma (Middle Miocene) (Vergara and Thomas, 1984; Victor et al., 2004). From there and from other younger dated ignimbrites (Baker, 1977; Vergara and Thomas, 1984), Victor et al. (2004) deduced from stratigraphic correlations that the development of the Altos de Pica Formation finished by ∼5–7 Ma (late Miocene) at ∼20–22∘ S.
2.2.2 Structural and kinematic context
The Paleozoic basement of the Western Cordillera is disrupted at places in the form of various basement highs boarded by reverse faults (e.g., Haschke and Gunther, 2003; Henriquez et al., 2019; Puigdomenech et al., 2020; Tomlinson et al., 2001) (Fig. 1) – not to be confused with the north–south-trending strike-slip Domeyko Fault System, also called the West Fissure System (e.g., Charrier et al., 2007; Reutter et al., 1996; Tomlinson and Blanco, 1997b, a), which is east and out of our field study area. At ∼20–22∘ S, various maps describe west-vergent thrusts in overall structural continuity, bringing the Paleozoic basement westward over folded Mesozoic units (Aguilef et al., 2019; Haschke and Gunther, 2003; Sernageomin, 2003; Skarmeta and Marinovic, 1981). Using apatite fission-track dating, Maksaev and Zentilli (1999) proposed significant exhumation of the basement units between 50 Ma and 30 Ma, possibly related to basement overthrusting. Older exhumation ages (Late Cretaceous to early Cenozoic (U–Th) He zircon and apatite ages) are, however, provided by Reiners et al. (2015) for the Western Andean basement at ∼21∘42′ S, but from only one sample and without modeling. Together, these ages indicate that data remain missing to better quantify the exhumation, uplift, and timing of deformation of the basement thrusts reported along this part of the Western Andean flank.
Further west, a series of mostly west-vergent thrusts has been inferred, essentially from seismic profiles. These thrusts result from the tectonic inversion of the previous Mesozoic basins and affect the Mesozoic to Cenozoic series (Fuentes et al., 2018; Martinez et al., 2021; Victor et al., 2004; Armijo et al., 2015). Victor et al. (2004) determined ∼3 km of shortening of the syntectonic Altos de Pica Formation layers, but they did not take into account the deformation of the underlying more deformed Mesozoic units. Other authors propose limited shortening on these older deeper layers (Fuentes et al., 2018; Martinez et al., 2021), but the poor quality of the seismic profiles at these depths renders these interpretations quite tenuous and disputable. Haschke and Gunther (2003) estimated that >9 km of shortening across the western flank in the outcropping Sierra de Moreno area (∼21∘45′ S) occurred since the Late Cretaceous to Eocene on a west- and east-verging thrust system. Whether these various faults are connected at depth to an east-dipping master fault (Armijo et al., 2015; Haschke and Gunther, 2003; Victor et al., 2004) or whether they are steeply dipping single planar faults (Fuentes et al., 2018; Martinez et al., 2021) remains debated: these considerations are documented nowhere by data and only rely on a priori concepts or structural reasonings at a larger regional scale. It follows that even if published data document the existence of various faults along the Western Andean front at ∼20–22∘ S, their geometry, kinematics, and total amount of shortening have not yet been satisfactorily evaluated.
Unconformable slightly deformed middle to upper Cenozoic clastic sediments and ignimbrites commonly hide the folded Mesozoic layers and their contact with the basement (Fig. 1). Field investigations are limited to the few sparse areas where the erosion of the Cenozoic cover has exposed the underlying structures (Aguilef et al., 2019; Sernageomin, 2003). In this study, we focus on two relatively accessible outcrop sites (Fig. 1): (1) one is at ∼21∘30′ S, where the Paleozoic basement overthrusts Mesozoic units (Skarmeta and Marinovic, 1981). This zone will be referred to as the Pinchal area (next to Cerro Pinchal, 4193 m a.s.l.). (2) The other is at ∼20∘45′ S, where folded Mesozoic units can be observed. This zone is hereafter named the Quebrada Blanca area after its largest canyon.
3.1 Available data
The most detailed – even though large-scale – existing geological map for the Pinchal area is the 1:250 000 Quillagua map (Skarmeta and Marinovic, 1981). For the Quebrada Blanca area, the recent 1:100 000 Guatacondo map (Blanco and Tomlinson, 2013) provides detailed and updated information on the stratigraphy and structure. There, the structure of the folded Mesozoic rocks has been preliminarily mapped and qualitatively described by other authors (Armijo et al., 2015; Blanco and Tomlinson, 2013; Fuentes et al., 2018).
Enhanced cartographic details can be deduced from high-resolution satellite imagery. We use Google Earth imagery (Landsat 7, DigitalGlobe) whose resolution varies from a few meters to a few tens of meters depending on the zones. In addition, this work benefits from very high-resolution imagery from the European Pléiades satellites. Using the MicMac software suite (Rosu et al., 2014; Rupnik et al., 2016), we calculate high-resolution digital elevation models (DEMs) from tri-stereo Pléiades imagery with a 0.5 m resolution. These DEMs are down-sampled to a resolution of 2 m to enhance data treatment and calculations (e.g., stratigraphic projection and image processing). Relative vertical accuracy may reach ∼1 m, depending on local slope. Field observations were acquired during two field surveys in March 2018 and January 2019. Difficult accessibility and field logistics in the remote and desert Pinchal area only allow detailed complementary field observations of a relatively limited area. Observation points and the off-road track followed to reach our field site in the Pinchal area are provided in the Supplement.
3.2 Structural maps
To establish structural maps, we conducted 3D mapping of stratigraphic layers after Armijo et al. (2010) and Riesner et al. (2017). Layers are traced and correlated on Google Earth satellite images. The so-obtained georeferenced traces are projected on the DEM-derived topographic map to obtain their altitude and on geological maps for stratigraphic referencing. Field observations allow ground verifications and provide supplementary details, such as minor thrusts and folds, as well as the observation of polarity criteria or local dip angles.
The approach used here is mainly limited by local geological complications. Continuous mapping of Mesozoic strata is locally complicated where incision of Cenozoic strata is limited, where magmatic intrusions and associated hydrothermalism alter the structural geometries, where layers with no well-expressed bedding such as marls are present (ex: Pinchal area), or where landslides or recent sediment deposits hide the underlying deformation pattern. Therefore, geometrical observations and detailed mapping of the structures may be locally difficult and in some zones impossible. These difficulties cause some uncertainties in precisely correlating mapped layers but only result in limited metric to decametric errors and do not modify our large-scale (km) results and interpretations.
3.3 Structural cross-sections
We use structural measurements, field observations, and the obtained structural map to propose surface cross-sections across the two investigated areas.
In the Pinchal area, because of limited canyon incision, marls, and frequent blanketing of the structures by Cenozoic cover, we build our structural surface cross-sections mainly from field observations (strike and dip angles, polarity criteria, first-order stratigraphic column), with additional information taken from satellite imagery.
In contrast, in the Quebrada Blanca area, we build our surface cross-section mostly from mapping on satellite imagery. Here, we follow the approach proposed in Armijo et al. (2010) and described in detail in Riesner et al. (2017). The mapped georeferenced horizons are projected on the high-resolution Pléiades DEMs. Using a 3D modeler, we project these layers along swath profiles chosen where Mesozoic strata crop out the best, where folds appear cylindrical, and where topographic relief is most significant. This approach allows for more precise large-scale structural geometries by averaging the usual local minor variations in strikes and dips that derive from multiple field measurements. From there, we successfully obtain the overall sectional geometry of folded layers, and by comparing with the structural map, we determine the approximate locations of the major synclinal and anticlinal axes. By respecting the classical rule of constant layer thickness, we derive fold geometries.
We recognize the difficulty of unambiguously correlating stratigraphic layers in some cases and the fact that layers may not keep constant thicknesses. As local topographic relief is reduced to a few hundred meters at most, the construction of surface cross-sections is mostly restricted to extrapolating derived average surface dip angles at depth. However, the main limitation relies on the fact that we can only draw the subsurface sectional geometry of folds from surface geology. Indeed, we do not have any constraints from field observations on the geometry of the associated thrusts at depth, nor on the footwall structure of these thrusts. We propose a possible structural interpretation at depth and discuss its implications.
3.4 Crustal shortening and kinematic modeling
We apply a line-length balancing approach to the obtained surface cross-sections to determine shortening related to folding only. This result is independent of the geometry of the associated faults at depth, does not account for penetrative deformation or for slip on underlying faults, and stands as a conservative minimum here.
From surface geology, we have no precise indication about the structure and geometry of faults and layers at depth, in particular within the footwall of the inferred faults. To make a step forward in our estimates of crustal shortening, we consider the simplest structural geometries where underlying thrusts are parallel to the anticlinal backlimbs and root at least at the base of the folded series. From there, we model anticlinal geometries using a numerical trishear approach (e.g., Allmendinger, 1998; Erslev, 1991). We use the code FaultFold Forward (version 6) (Allmendinger, 1998) in order to jointly model thrust displacement and anticlinal folding. Trishear models the deformation distributed within a triangular zone located at the tip of a propagating fault (Erslev, 1991). This forward modeling relies on testing a set of parameters, namely the position of the fault tip, the angle of the propagating fault ramp, the slip on the fault, the propagation-to-slip ratio (P S) of the fault, the angle of the triangular zone at the tip of the fault where distributed deformation occurs (i.e., the trishear angle), and the inclined shear angle controlling the backlimb kinematics. We assume here the case of linear symmetric trishear to keep models as simple as possible, meaning that folding of the backlimb occurs parallel to the fault. Initial layers are assumed to be sub-horizontal, with a slight eastward tilt (3∘ E at Quebrada Tambillo, 2∘ E at Quebrada Blanca) as expected in the initial Andean basin. We tested various combinations of parameters within the range considered in the literature (e.g., Allmendinger, 1998; Allmendinger and Shaw, 2000; Cristallini and Allmendinger, 2002; Hardy and Ford, 1997; Zehnder and Allmendinger, 2000) and with regards to our field observations such as the possible geometry of faults at depth as constrained from surface geology. Parameters are adjusted by trial and error to visually fit observed and interpreted structural geometries. By adding sedimentary layers at various steps during ongoing deformation, with initial geometries similar to the present-day regional topographic slope, we model syntectonic deposition and subsequent deformation in order to reproduce deformation of Cenozoic layers. Additional information on trishear modeling (initial conditions, values of tested parameters, etc.) is provided later and in the Supplement (Text S1, Tables S1–S3). We recognize that parameters of our preferred model may not be unique. This is not expected to significantly impact estimated total shortening, as this result depends mostly on the modeled cross-sections (and therefore on the structural interpretation to be modeled) rather than on the preferred set of parameters. For instance, we cannot discard the possibility that faults are steeper and root deeper. If this were the case, crustal shortening would be lower.
Deformation is expressed in terms of shortening (in kilometers) and of relative shortening at the scale of the investigated sites (in percent). Relative shortening is hereafter defined as the ratio of the estimated shortening by the initial length of the undeformed section.
Because our observations are in contradiction with previous stratigraphic and structural interpretations of the folded Mesozoic series, we hereafter describe our field observations in detail. We subsequently discuss and compare them to previous interpretations and propose a solution reconciling these observations with regional stratigraphic knowledge.
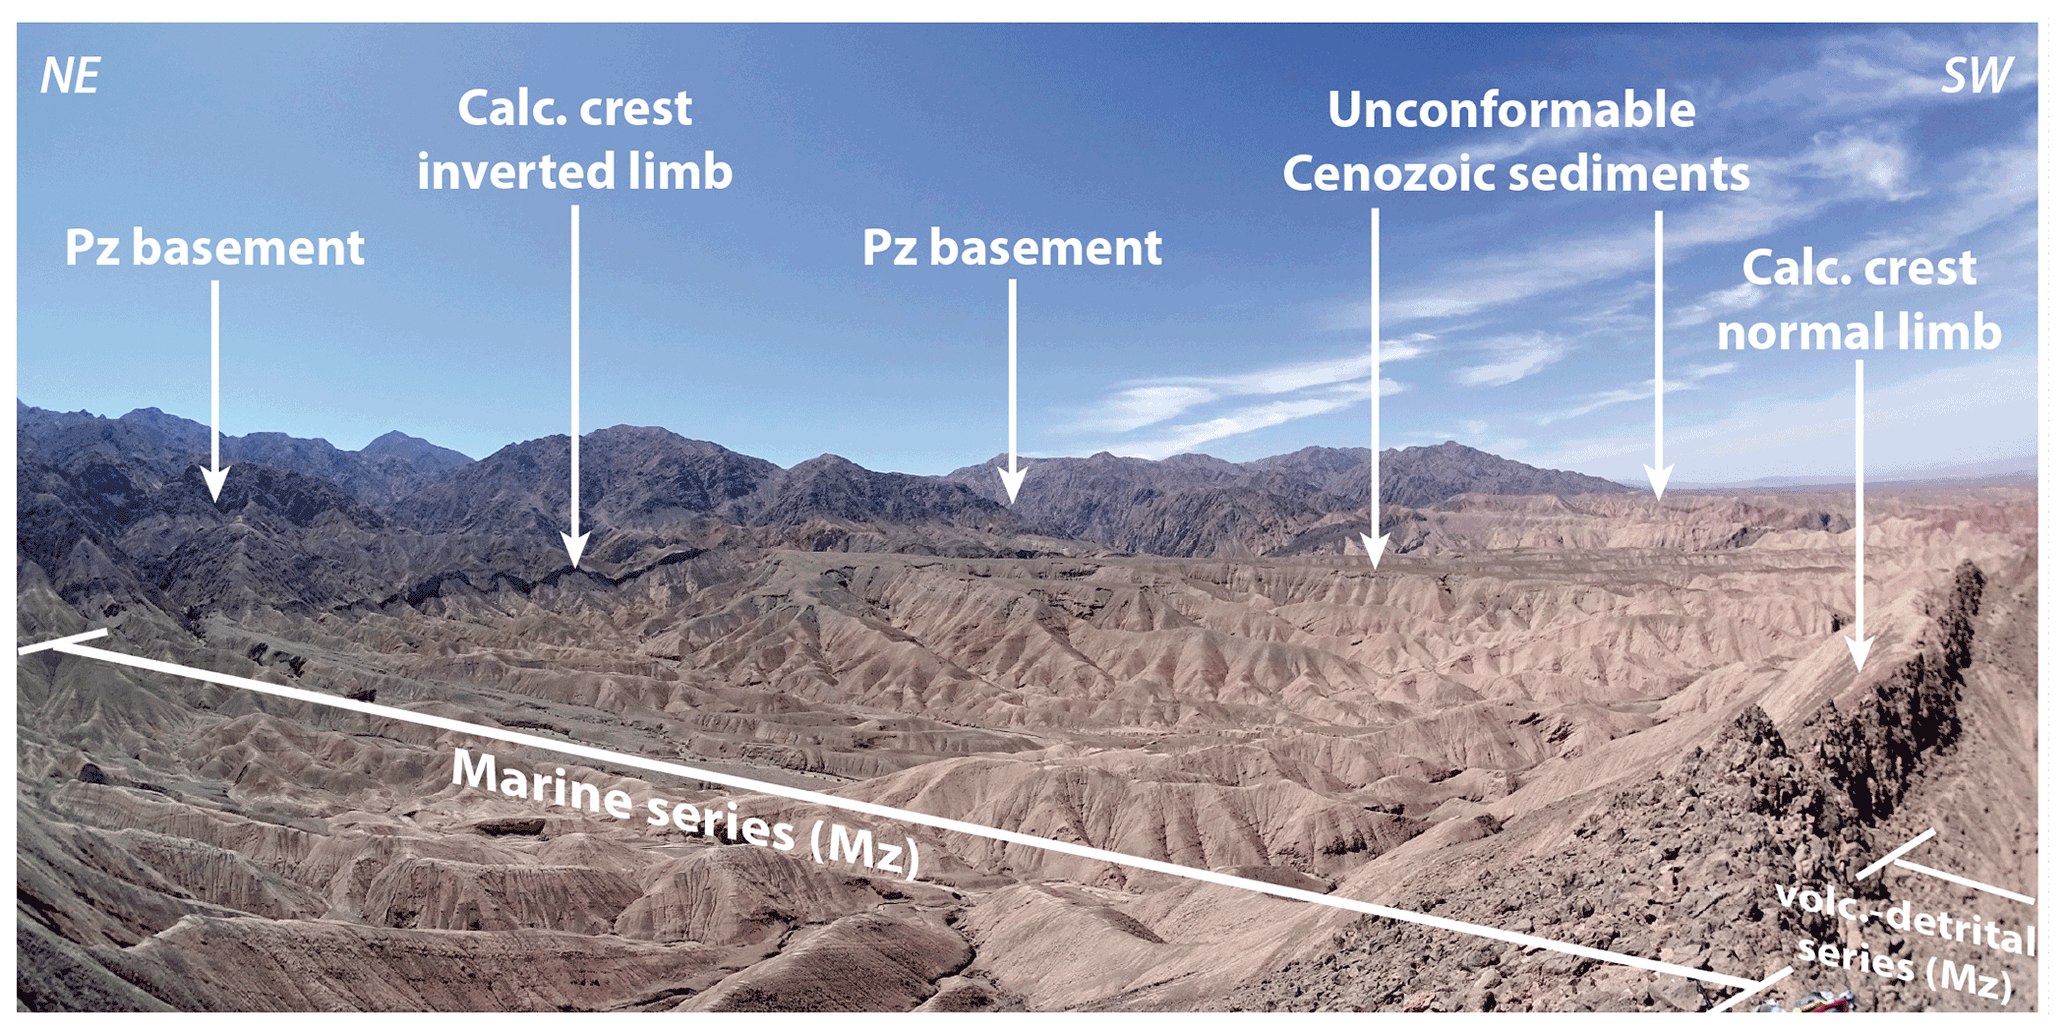
Figure 2Landscape field view of the Pinchal area depicting the main tectono-stratigraphic units. The Paleozoic (Pz) basement clearly stands out in the background, characterized by its darker color and higher elevations. The Mesozoic (Mz) series in the central part and in the foreground bear a marine part and a volcano-detrital part, respectively, separated by an outstanding calcareous (Calc.) crest. Unconformable Cenozoic erosional surfaces, with limited fluvial deposits, can also be observed.
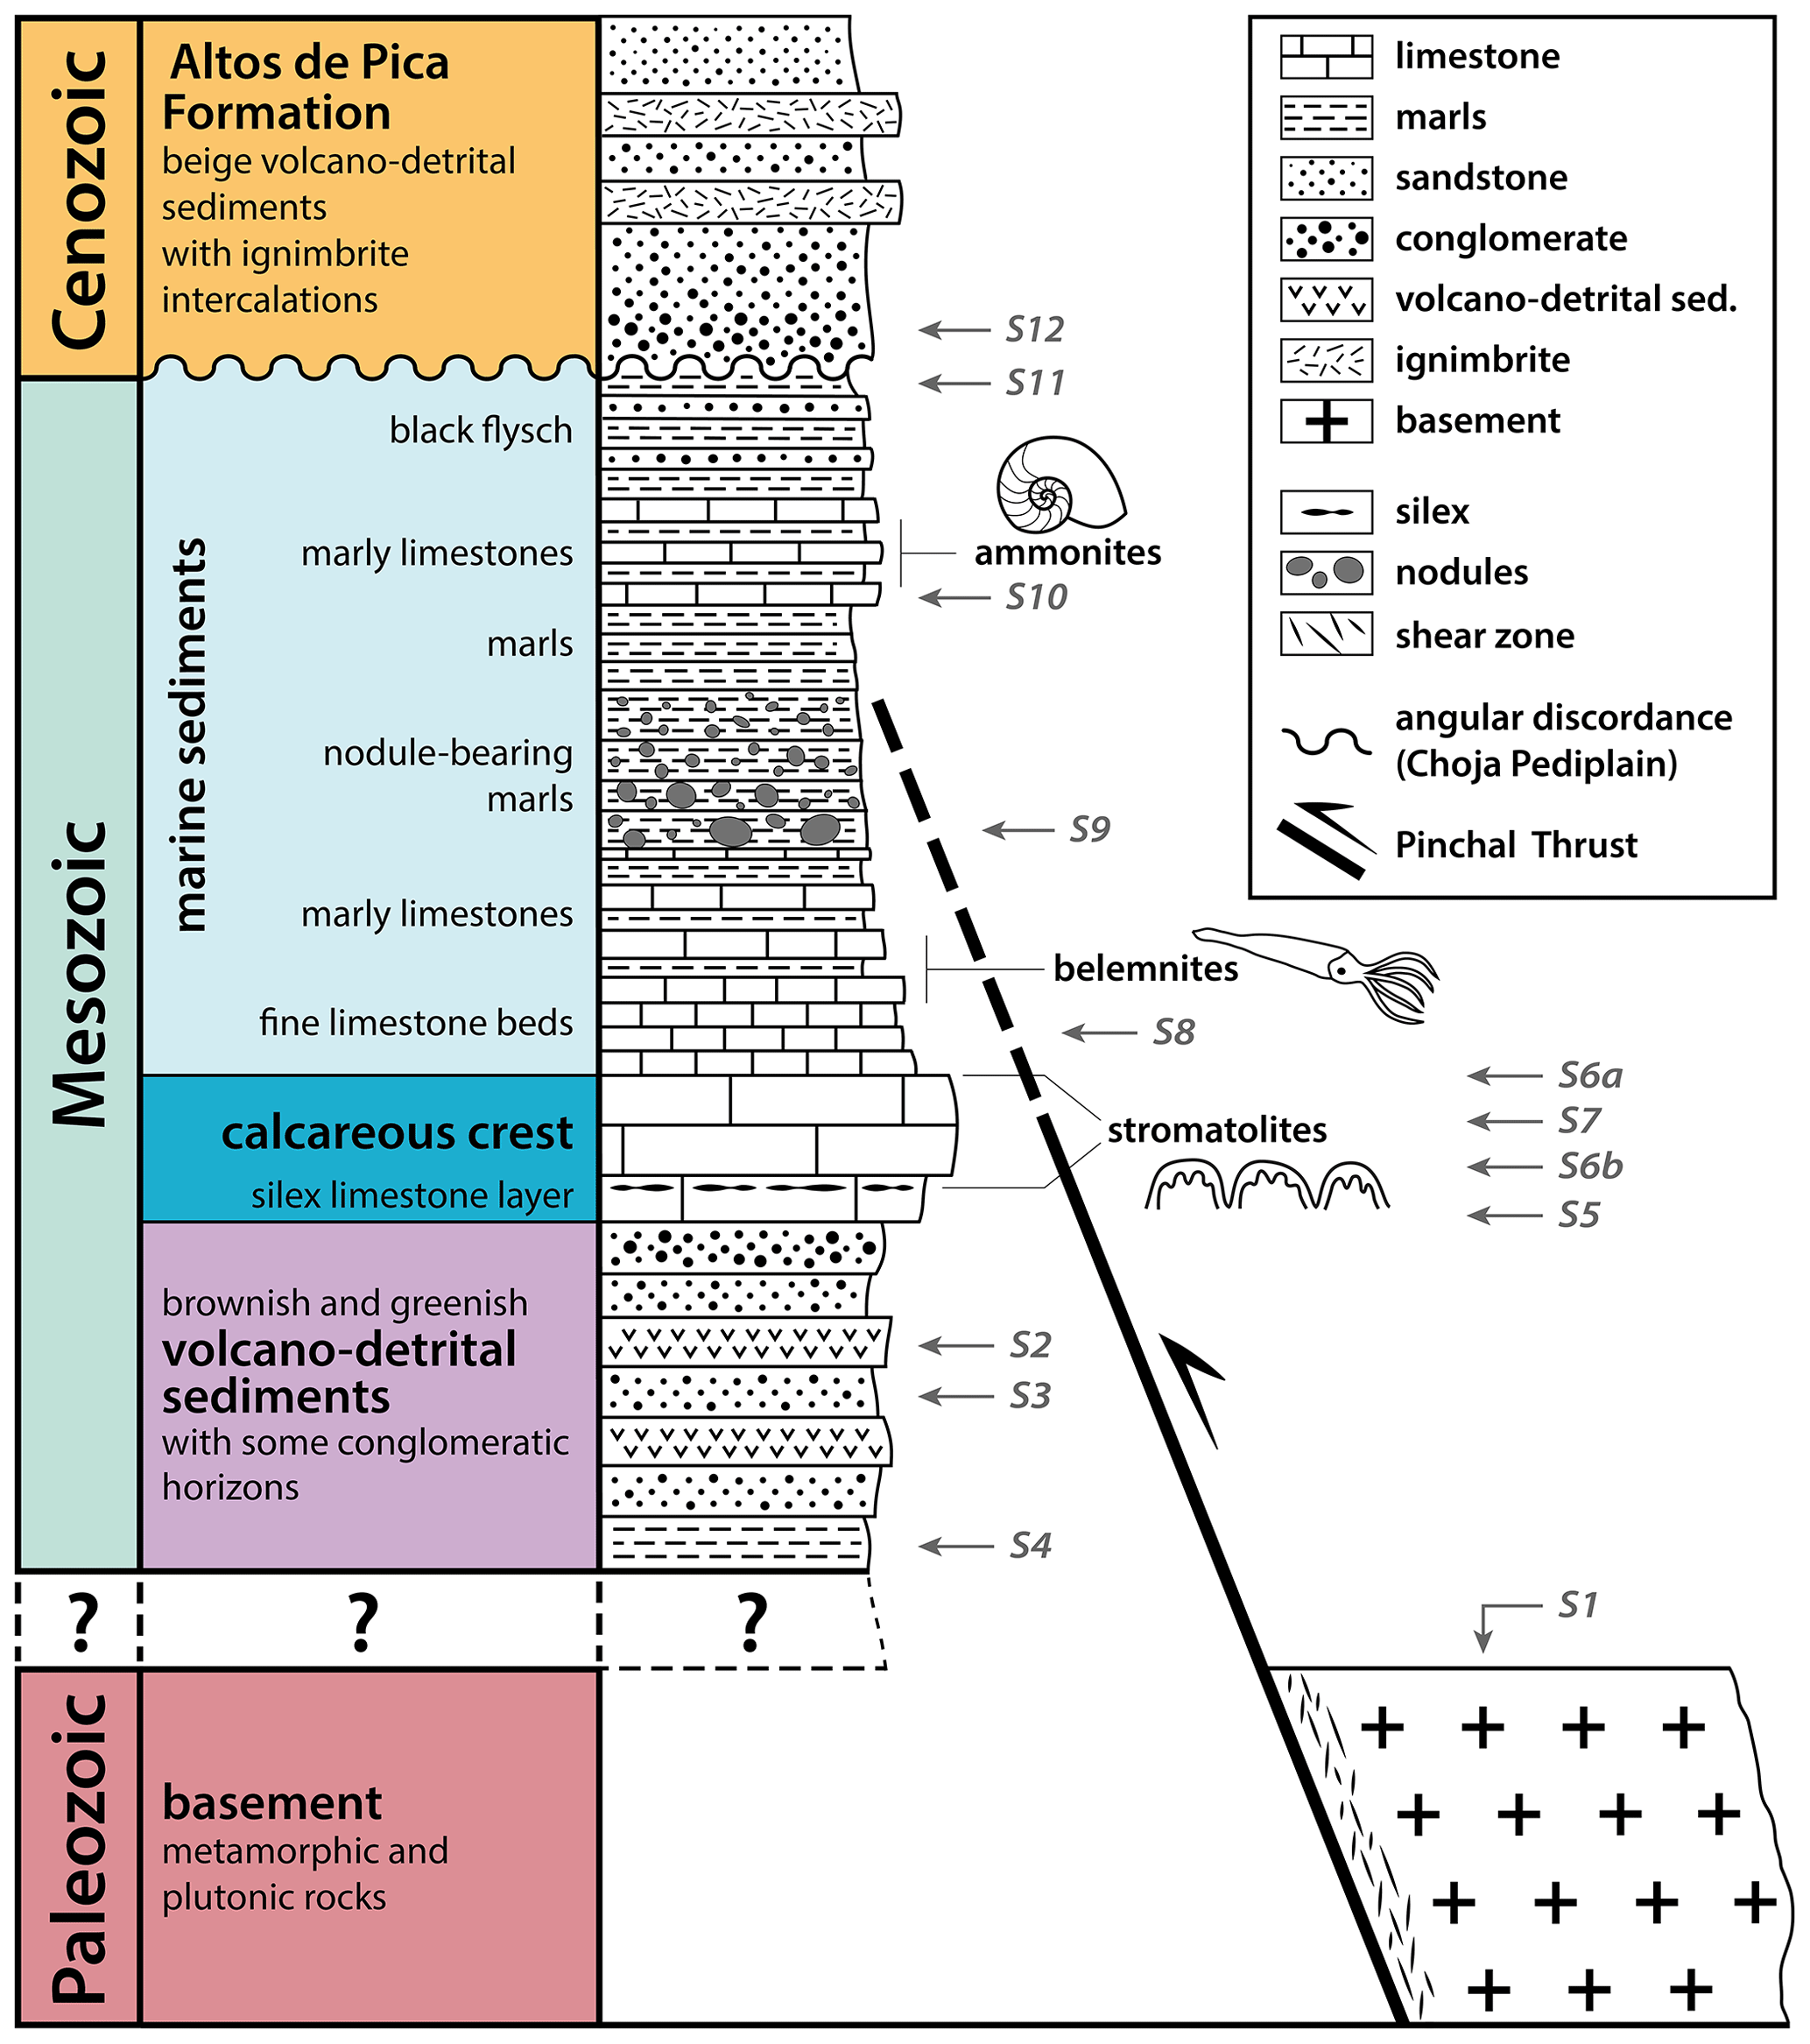
Figure 3First-order stratigraphic column of the Pinchal area. Data are derived from field observations, mainly obtained along Quebrada Tania (Figs. 4 and 5a). The column only depicts the stratigraphic succession, and thicknesses are not to scale (see text for information on thicknesses). The description of Cenozoic units is completed here based on the work of Victor et al. (2004). The color code is in line with maps (Figs. 1, 4, and S14) and cross-sections (Fig. 5). The Paleozoic basement overthrusts folded Mesozoic series along the Pinchal Thrust so that part of the deeper and older Mesozoic series may be missing here. See main text and Figs. S1–S12 for detailed sedimentological descriptions.
4.1 Stratigraphic observations
In the landscape (Fig. 2), the three main tectono-stratigraphic units are (1) the metamorphic basement, (2) the Mesozoic sedimentary series (with a continuum from continental upward to marine facies), and (3) the continental Cenozoic cover. From field observations, we propose a first-order stratigraphic column (Fig. 3). Field pictures of sedimentary formations are provided in the Supplement (Figs. S1–S12) to complement the forthcoming descriptions. We acknowledge that we do not have any constraint on the absolute ages of these series, but the relative stratigraphic ages are deduced from the kilometer-scale structural geometry and from clear sedimentary or structural polarity criteria observed in the field. Thicknesses are inferred only locally, and thickness variations cannot be excluded.
The Paleozoic basement (Fig. S1) dominates the eastern part of the Pinchal area and is composed of mainly coarse-grain granodiorites and diorites, as well as metamorphic rocks comprising gneisses, migmatites, and mica–schists, consistent with previous descriptions in the area (Skarmeta and Marinovic, 1981).
The older part of the outcropping Mesozoic series consists of continental deposits, with a high content of Paleozoic lithics and volcano-clastic and tuffitic low-rounded conglomerates, of greenish, beige, and brownish colors (Fig. S2). Clast sizes vary from a few millimeters to a few decimeters. At places, these rocks bear sedimentary polarity criteria such as grain sorting, cross-bedding, and tangential beds (Fig. S3). In the eastern part of the Pinchal area, we locally observe below this series dark green detrital pelites (lutites) (Fig. S4). On the basis of petrographic and sedimentological correlations, these detrital Mesozoic sediments recall units mapped as Triassic north of the Pinchal zone (between 21–21∘30′ S) in the Quehuita area (Aguilef et al., 2019). In paraconformity, a characteristic limestone layer marks the beginning of a marine sequence, evidencing a marine transgression. We refer to this layer as the “calcareous crest” as it is prominent in the landscape (Fig. 2) and can be easily used as a reference layer in the field or on satellite images. The base of the calcareous crest is characterized by silex layers or nodules (Fig. S5). Up-section, numerous stromatolites (Fig. S6) and bivalves (Fig. S7) are found. Its thickness varies from a few meters (less than 10 m) in the eastern part to ∼10–20 m to the west.
The calcareous crest is overlain by thin-bedded (centimeters–decimeters) limestone layers of rose–beige color (Fig. S8) over a thickness of ∼50–100 m. Going up-section, the marine series becomes more marly, more beige, and with fewer limestone layers, evidencing a deeper marine paleo-environment. Belemnite fossils were encountered in the lower part of this limestone-to-marl sequence. Characteristic calcareous oval concretions of variable diameter (centimeters to meters) (Fig. S9) are pervasive at the transition from marly limestones to marls. The marls bear ammonites, which we have not precisely identified. These ammonites could be Perisphinctes, Euaspidoceras, Mirosphinctes, and Gregoryceras, according to the notice of the Quillagua geological map (Skarmeta and Marinovic, 1981) if applicable here. In this case they would be of Middle Jurassic age (Bajocian to Callovian). The series from the thin-bedded limestones to the top of the beige marls is ∼200 m thick along one of the canyons (Quebrada Tania).
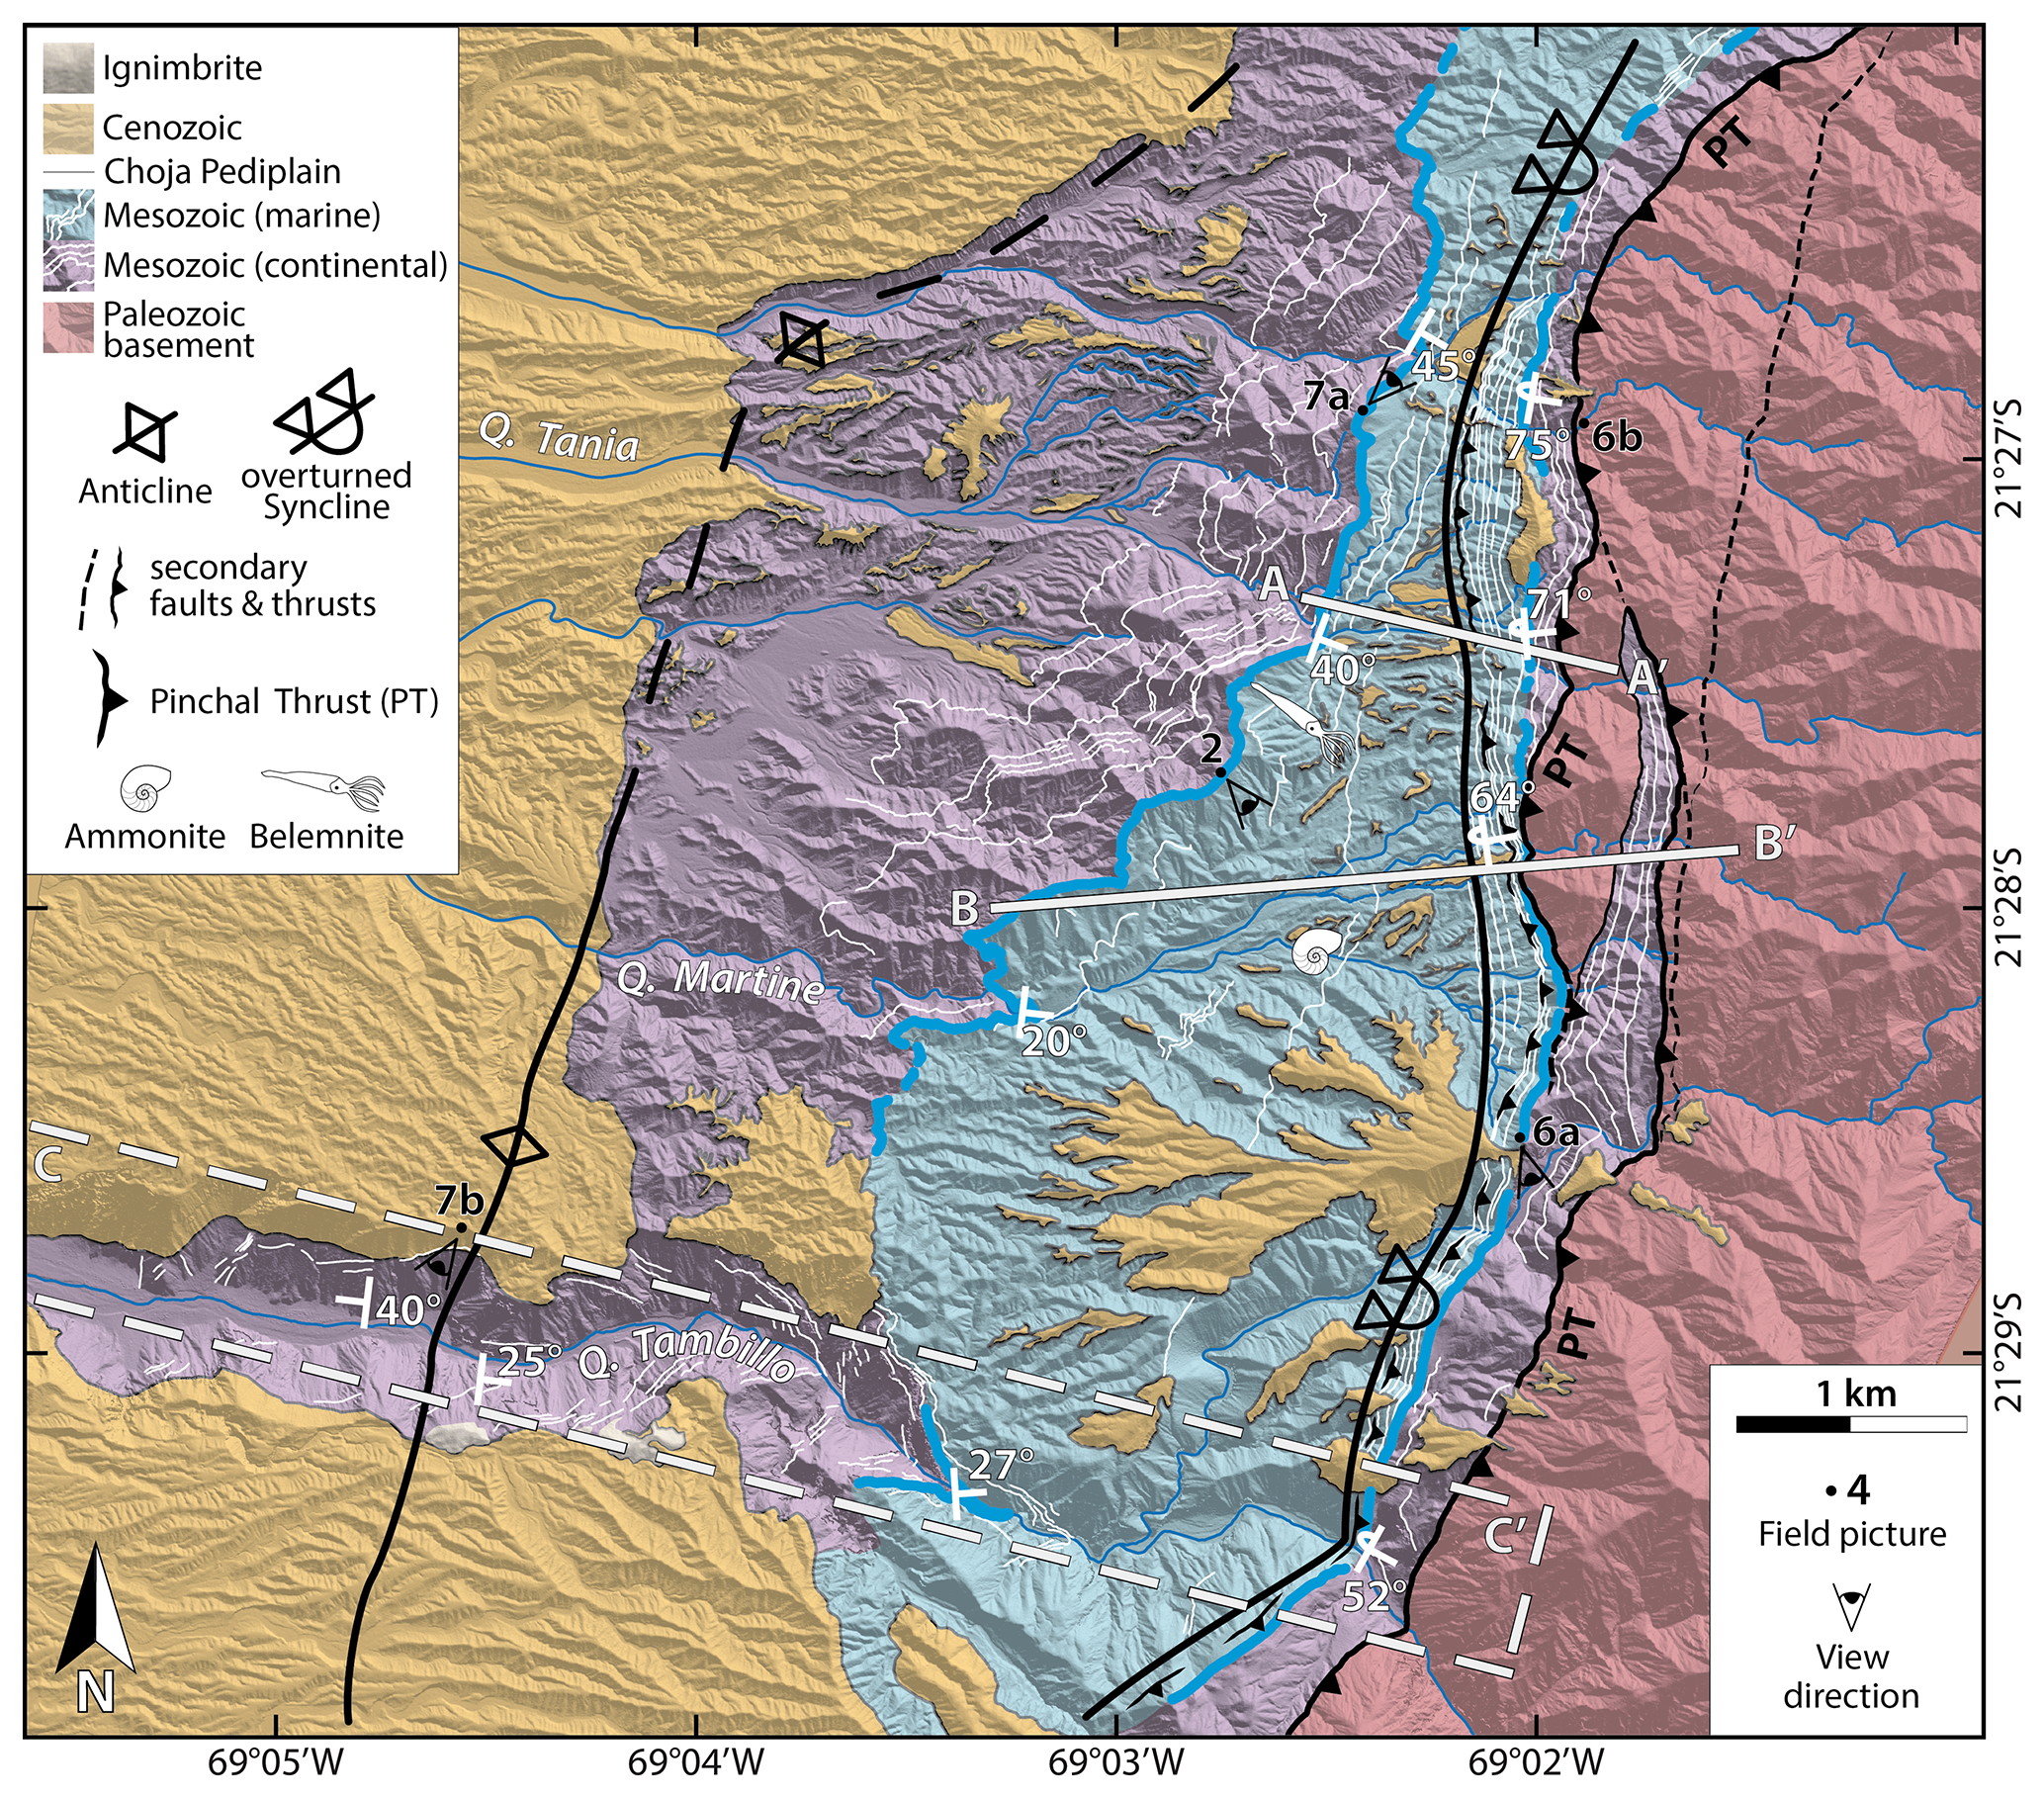
Figure 4Structural map of the Pinchal area (location on Fig. 1). White thin lines highlight Mesozoic layers mappable on satellite images. The thick blue line depicts the calcareous crest, which is used as a marker layer (Fig. 2). A–A' and B–B' segments locate the surface cross-sections of Quebrada Tania and Quebrada Martine, respectively (Fig. 5a–b). In the case of the Quebrada Tambillo cross-section, a topographic swath profile was used along C–C' (dashed box). The fold axes are relatively well defined for the synclinal fold but less well constrained for the anticlinal fold because the latter is only observable along Quebrada Tambillo. Field pictures are numbered according to the corresponding figures. Background hillshaded DEM produced from tri-stereo Pléiades imagery. Q: Quebrada (Spanish word for “canyon”).
Up-section, the beige marls become more calcareous again, with thin limestone layers (Fig. S10). Finally, this marine sequence ends with black marls containing layers of beige sandstones (millimeters to a few centimeters – rarely decimeters – thick) (Fig. S11), indicative of a detrital component in a probable deep-seated basin, comparable to the “flysch” series of the Alpine basins (Homewood and Lateltin, 1988). This unit is hereafter called “black flysch” and has a minimum thickness of ∼50 m.
Continental-clastic Cenozoic deposits (Altos de Pica Formation) unconformably overlie this folded Mesozoic series over the Choja erosional surface (Galli-Olivier, 1967; Victor et al., 2004) (Figs. 2 and 3). They are mainly composed of alluvial fan deposits sourced from the mountain front immediately to the east, locally interlayered or covered by ignimbrites. We encountered red arenites at the base of the Cenozoic series in the western part of the Pinchal area (Fig. S12). The age of the oldest sedimentary deposits above this erosional surface is regionally inferred to be ∼27–29 Ma (Victor et al., 2004) (see also Sect. 2.2).
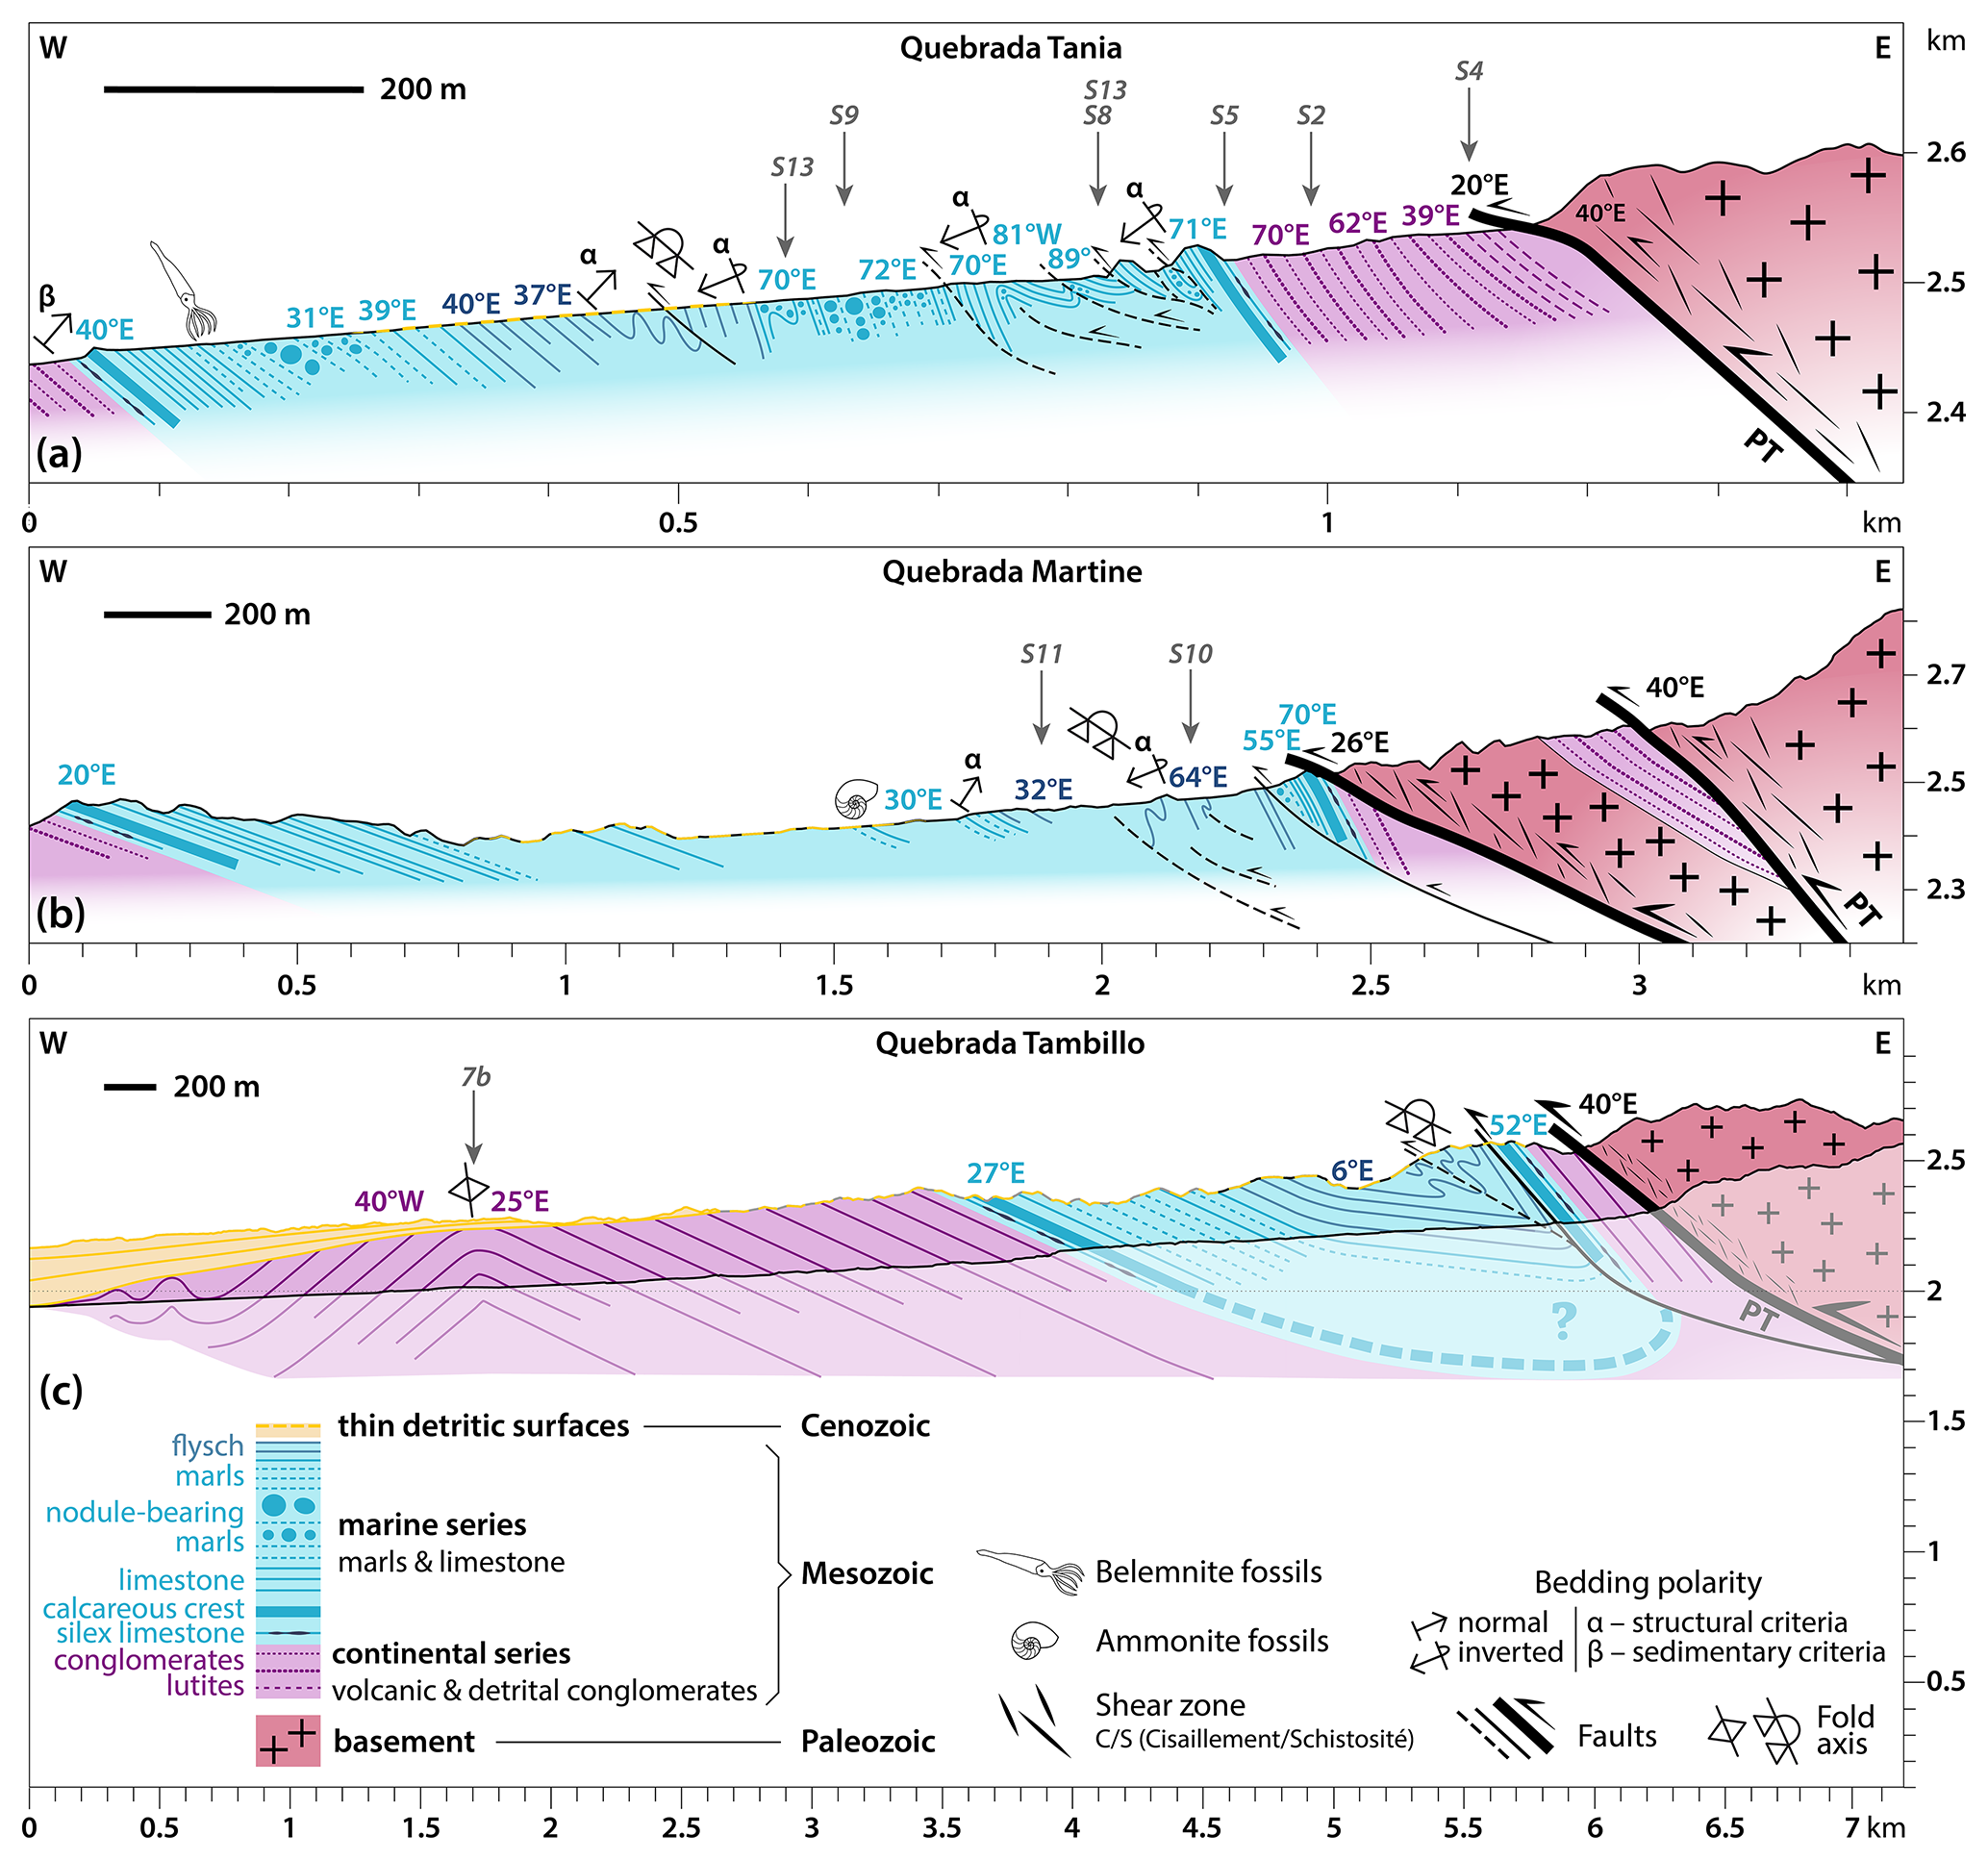
Figure 5Surface cross-sections along (a) Quebrada Tania, (b) Quebrada Martine, and (c) Quebrada Tambillo (sections A–A', B–B', and C–C' in Fig. 4, respectively). Reported dip angles have been measured in the field or deduced from 3D mapping. Faults are outlined in black and dashed when they are only observable at a local spatial scale. Only larger faults (continuous lines) are mapped in Fig. 4. Fold axes are depicted above their surface trace based on our field observations, and their orientation illustrates the deduced orientation of the corresponding axial plane. Gray numbers with arrows point to field pictures and indicate the associated figure. In the case of Quebrada Tania (a), the sedimentary polarity criterion (β) indicated to the west of the section has been observed ∼1 km further downstream than reported here. For Quebrada Martine (b), note the stripe of continental Mesozoic rocks trapped between two strands of the Pinchal Thrust. The subsurface interpretation from surface observations is reported with transparent colors in the case of Quebrada Tambillo (c). Note the different spatial scales of the three sections. PT: Pinchal Thrust.
4.2 Structural observations
A structural map of the area is built after satellite and field observations (Fig. 4). Two approximately east–west cross-sections show detailed surface observations along two accessible representative canyons: Quebrada Tania and Quebrada Martine (Fig. 5a, b). The Quebrada Tambillo incises deeper into folded units so that surface structural observations can be further extrapolated at depth (Fig. 5c).
The easternmost part of our study area is marked by a west-vergent thrust bringing the metamorphic basement over folded Mesozoic units (Figs. 2, 4, and 6a). This basement thrust is hereafter named the Pinchal Thrust. The C–S fabric (Cisaillement–Schistosité) observed within the thrust shear zone indicates top-to-the-west thrusting (Fig. 6b). The Pinchal Thrust roughly follows a north–south direction (Fig. 4). This contact often resumes to a single basement thrust (Fig. 5a, c), but may also show local geometrical complexities, with secondary thrusts and branches, eventually involving basement with stripes of trapped Mesozoic units, as along Quebrada Martine (Fig. 5b).
Folded Mesozoic units are observable west of the Pinchal Thrust (Figs. 2 and 4). From east to west, an asymmetric and overturned syncline (Fig. 7a) is followed by a relatively symmetric anticline (Fig. 7b).

Figure 6Field characteristics of the Pinchal Thrust. (a) Field view of the Pinchal Thrust (PT), with dark grayish Paleozoic basement thrusting over the greenish folded Mesozoic units. Reddish rocks on the hanging wall to the east-northeast correspond to the thrust shear zone (hatched area in picture). Location in Fig. 4; note that the scale here is only approximative. The non-interpreted photograph can be found in the Supplement (Fig. S15). (b) Shear band with characteristic C–S fabric (for Cisaillement–Schistosité) indicative of top-to-the-west thrusting. Observation within the shear zone in the hanging wall of the Pinchal Thrust (deformed metamorphic basement).
The eastern limb of the syncline is inverted and locally highly faulted and folded (Figs. 5 and S13). Within this inverted limb, the series goes westward (and up-section) from sheared lutites beneath the Pinchal Thrust, followed by Mesozoic detrital series with conglomerates, to the Mesozoic marine series from the calcareous crest up-section to the marly limestones. The overturned strata dip steeply (50–70∘ E). Penetrative small-scale deformation is observed pervasively within the marine Mesozoic series in the form of numerous local small folds, kinematically indicative of an inverted fold limb (used here as a structural polarity criterion) (Fig. S13a), and local secondary shear zones and thrusts (Fig. S13b). Going westward, as observed in detail along Quebrada Tania (Fig. 5a), the eastern part of the black flysch bears small-scale folds characteristic of an inverted fold limb, whereas normal limb folds (also used here as structural polarity criteria) are observed slightly further west: the axis of the overturned west-vergent syncline therefore passes through the black flysch. Part of the Mesozoic series is missing, as overthrusting within the flysch and (marly) limestones is observed frequently along Quebrada Tania (Fig. 5a). The overturned syncline is therefore broken by a secondary thrust fault striking approximately parallel to the Pinchal Thrust and roughly coinciding with the synclinal fold axis (Figs. 4–5). Westward, the normal western limb of the syncline encompasses the whole Mesozoic series from the black flysch down-section to the Mesozoic volcano-detrital series, with more gentle dip angles (20–40∘ E) (Figs. 2 and 5). Penetrative deformation is observed to be limited here.
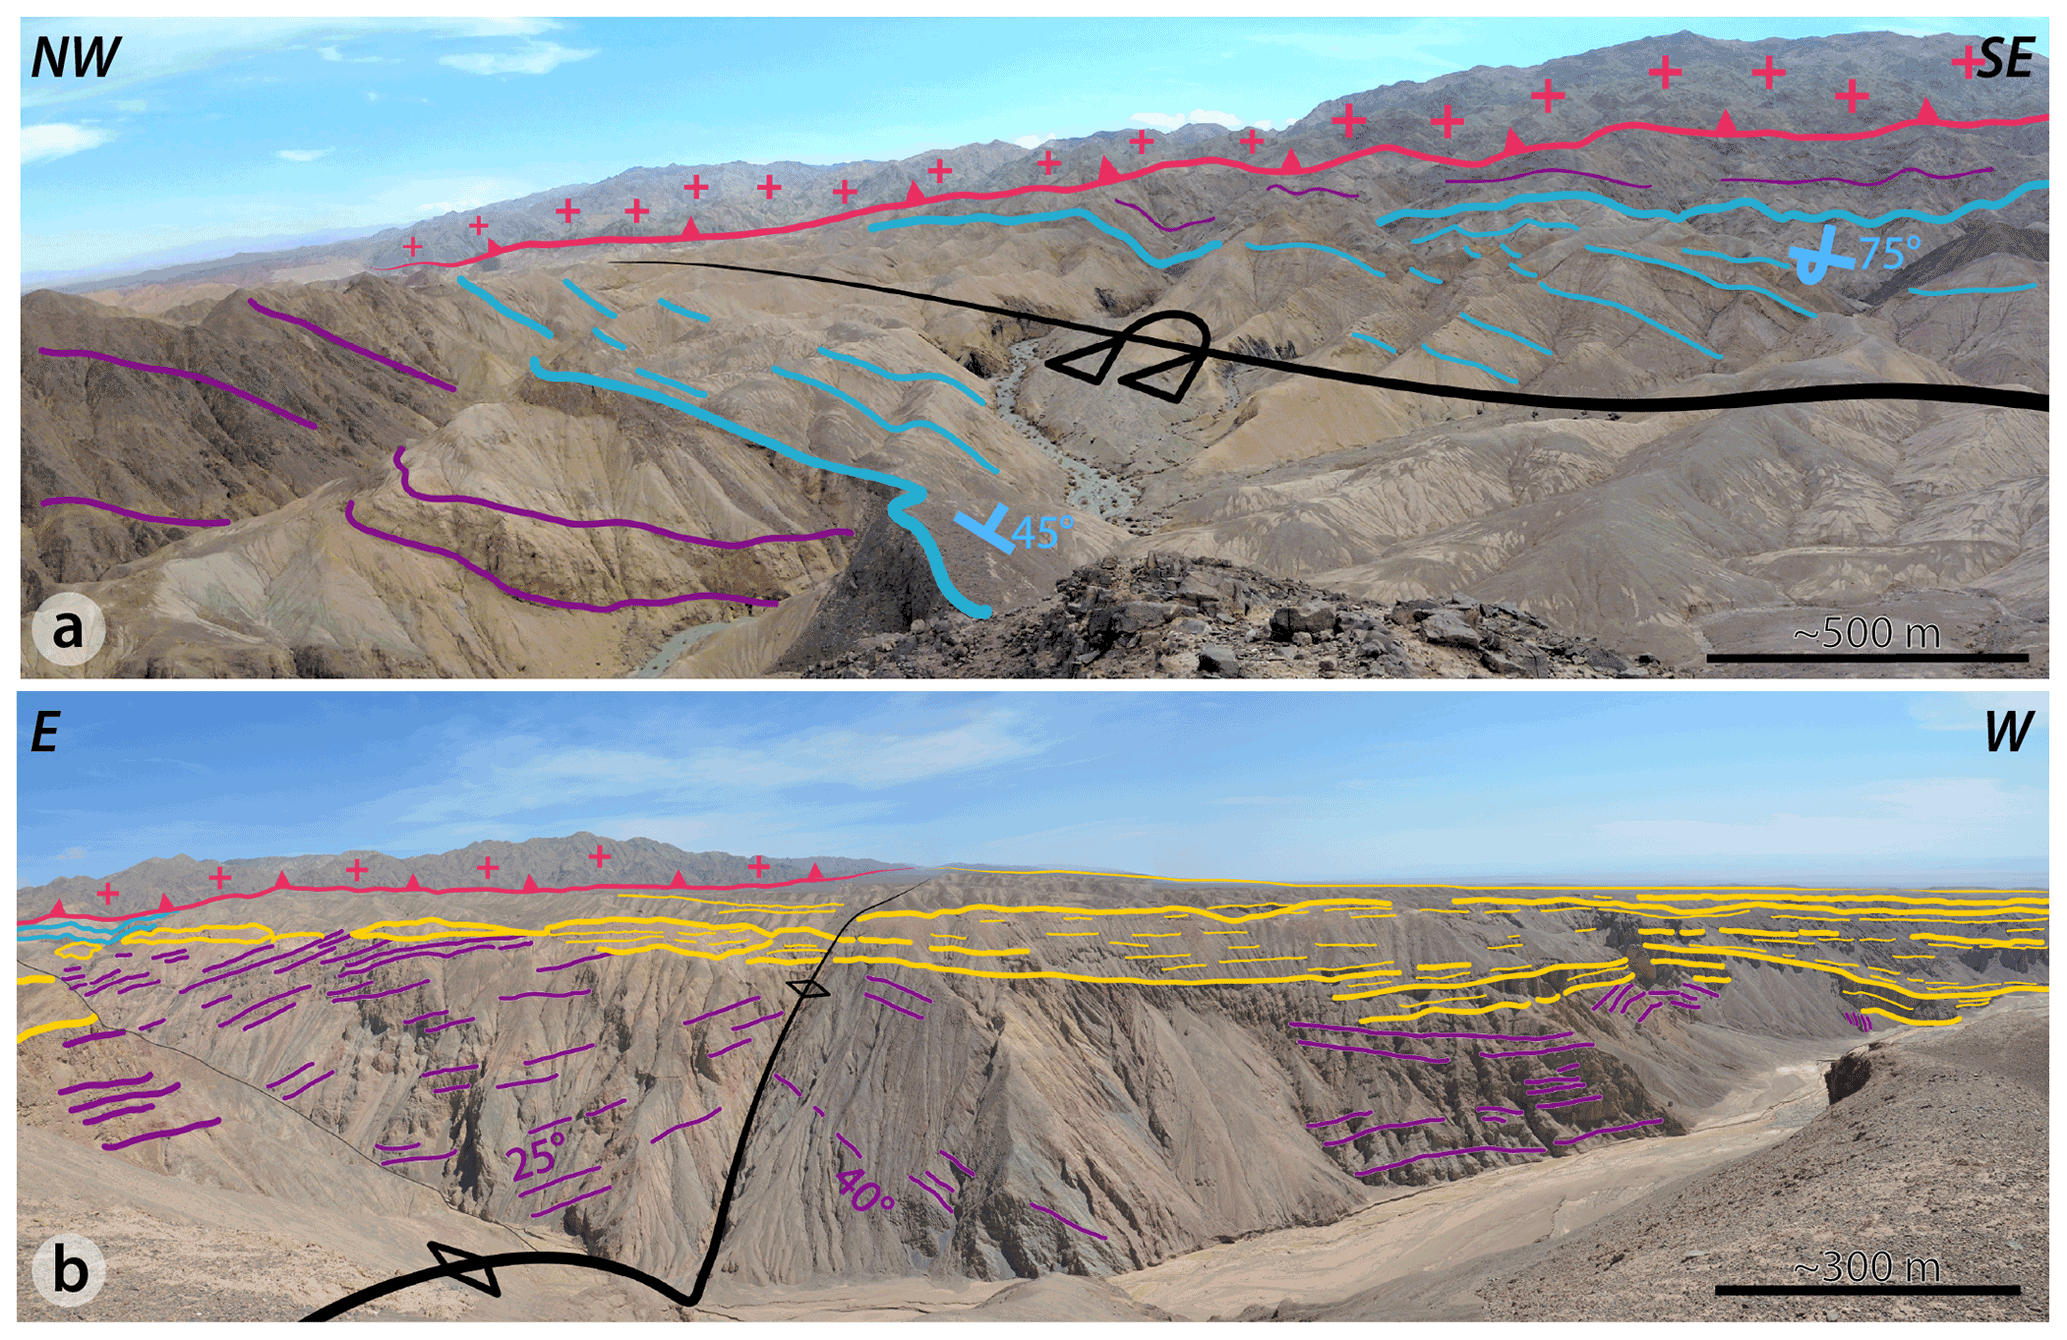
Figure 7Field pictures of the two major folds within the Pinchal area (location on Fig. 4). Non-interpreted photos can be found in the Supplement (Fig. S16). Scales are only approximative because of perspective. (a) Panoramic view over the northeastern part of the Pinchal area. The Paleozoic basement (red crosses) overthrusts the Mesozoic units (blue and purple horizons) along the Pinchal Thrust (red line with triangles). The topographic low locates the synclinal axis. The calcareous crest on both sides is highlighted by the thick blue lines. (b) Panoramic view along Quebrada Tambillo in the southern part of the Pinchal area. The ∼200 m deep incised canyon reveals the geometry of the large western anticline affecting Mesozoic layers (purple) underneath the unconformable Cenozoic strata (yellow). The fold axis (black line) probably coincides with an approximately vertical fault that is clearly observable on satellite imagery. Note also the repetition of smaller folds with westward-decreasing amplitude and wavelength discernable beneath the westward-thickening Cenozoic growth strata to the right of the picture. The Mesozoic calcareous crest (blue) and the Paleozoic basement (red crosses) over the Pinchal Thrust (red) appear in the far eastern background.
The continental Mesozoic layers of the normal limb of the syncline flatten toward the west. The section along Quebrada Tambillo (Fig. 5c) shows a broad, overall symmetrical, anticlinal fold (Fig. 7b). Its axial plane is steep, dipping ∼80∘ E. Smaller, secondary folds with westward-decreasing wavelength and amplitude are found at the western front of this large anticline. Field logistics did not permit further detailed structural observations.
The folded Mesozoic units are unconformably covered by sheet-like, river-incised Cenozoic fluvial deposits, forming aggradational terraces deposited above erosional surfaces at different elevations, of varying spatial extent and probably of different ages (Fig. 2). The majority of these erosional surfaces show a westward tilt (Fig. 5c). Further west, the Cenozoic deposits become thicker and bury the westward extent of the folded Mesozoic units. Westward thickening of the Cenozoic layers is observed along Quebrada Tambillo and indicates growth strata at the front of the western anticline (Figs. 5c and 7b).
4.3 Comparison to previous stratigraphic and structural interpretations
In the Pinchal area, a basement thrust was reported in the 1:250 000 Quillagua geological map (Skarmeta and Marinovic, 1981). In this map, the Mesozoic units are interpreted as pertaining to the Jurassic Quinchamale formation, deposited in a back-arc basin context and composed of an Oxfordian (∼157–163 Ma) and a younger Kimmeridgian (∼152–157 Ma) sub-unit. Based on this age interpretation and relying on a regionally established Mesozoic stratigraphy where marine sequences are followed upward by younger clastic deposits, Skarmeta and Marinovic (1981) interpreted the main structure of the Pinchal zone as an anticline.
Our field investigations confirm the existence of a basement thrust but contradict the earlier interpretation of the folded Mesozoic series and of the local Mesozoic stratigraphy. Even though we do not know the absolute ages of the folded sedimentary series, our structural and sedimentary field observations allow for clearly constraining the relative stratigraphic ages of the folded Mesozoic units, from either structural or sedimentary polarity criteria, and unambiguously indicate that detrital continental units are stratigraphically below a marine sequence here (Fig. 3). In the case that the marine strata are Jurassic in age from their likely fossiliferous content, the older continental clastic units could be Triassic by comparison to recent observations not far from the Pinchal area (Aguilef et al., 2019).
Given this, even though the Pinchal stratigraphic sequence may look in contradiction with the regionally known stratigraphy, it may rather be viewed as complementary: the detrital component observed below marine series may be older than the Jurassic and Cretaceous marine-to-continental upward succession that has been well described regionally. In this sense, the Pinchal area may provide a key outcrop to refine our knowledge of older series, possibly Triassic.
Detailed field pictures of the various stratigraphic and sedimentological observations are provided in the Supplement for reference. In any case, we recall that relative ages are only needed here for the scope of this study to decipher the general structure and deformation pattern.
5.1 Stratigraphy of the Quebrada Blanca area
The stratigraphy at ∼20∘45′ S is well described in the Guatacondo geological map (Blanco and Tomlinson, 2013). Unlike in Pinchal, basement rocks do not crop out in the investigated zone (Fig. 8), but larger-scale maps (e.g., Sernageomin, 2003) show Paleozoic basement units further east and higher in the topography (Fig. 1).
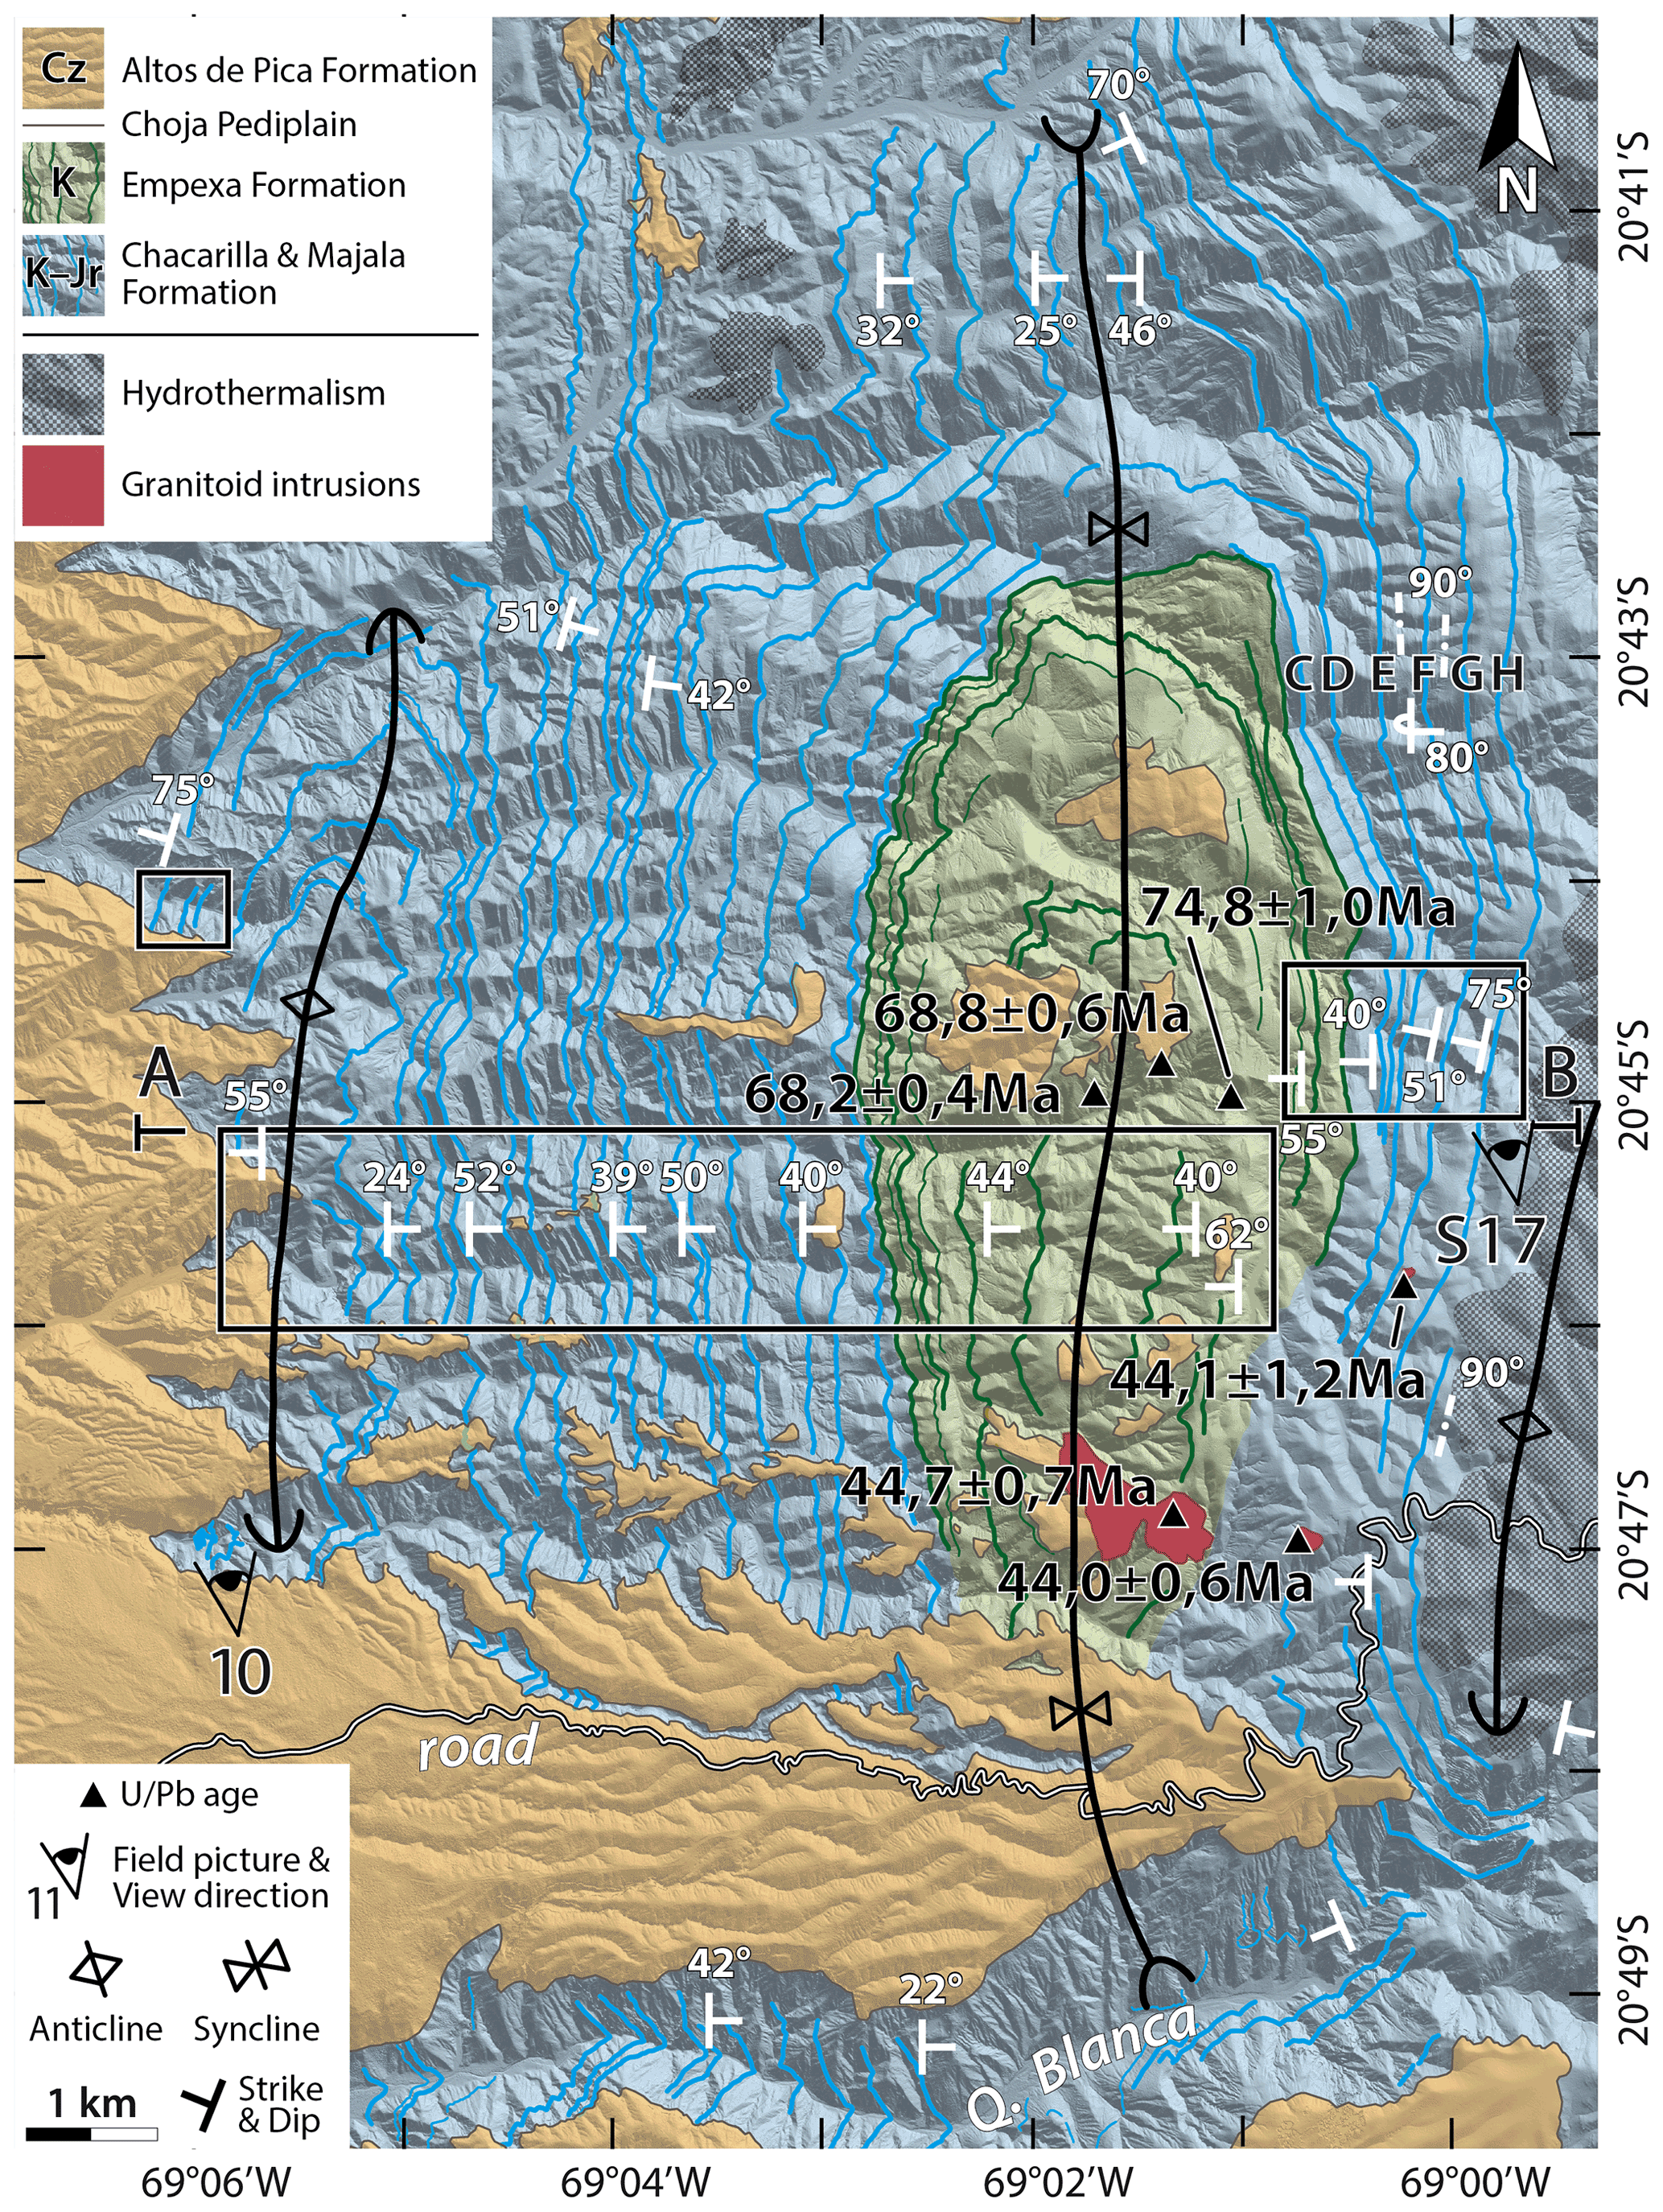
Figure 8Structural map of the Quebrada Blanca zone, refined from Armijo et al. (2015) (location on Fig. 1). Colored lines report mappable layers. For visibility, only major, well-correlated layer traces are represented here. Black boxes locate where mapped layers were considered and projected for the construction of the structural east–west surface cross-section (Fig. 9). The A–B section corresponds to the topographic profile used for this cross-section. Strike and dip measurements are extracted from 3D mapping (see Sect. 3.3) or observed in the field. Strike symbols without dip value are derived from satellite imagery. Field pictures are located (with view direction) and numbered according to the associated figure. Ages from uranium–lead (U Pb) radioisotope dating on zircon are taken from the Guatacondo geological map (Blanco and Tomlinson, 2013). Letters C, D, E, F, G, and H to the northeast (within the folded Chacarilla and Majala formations) report the layers illustrated on Fig. S17 in the Supplement. Background hillshaded DEM produced from tri-stereo Pléiades imagery. Cz: Cenozoic; K: Cretaceous; Jr: Jurassic; Q: Quebrada.
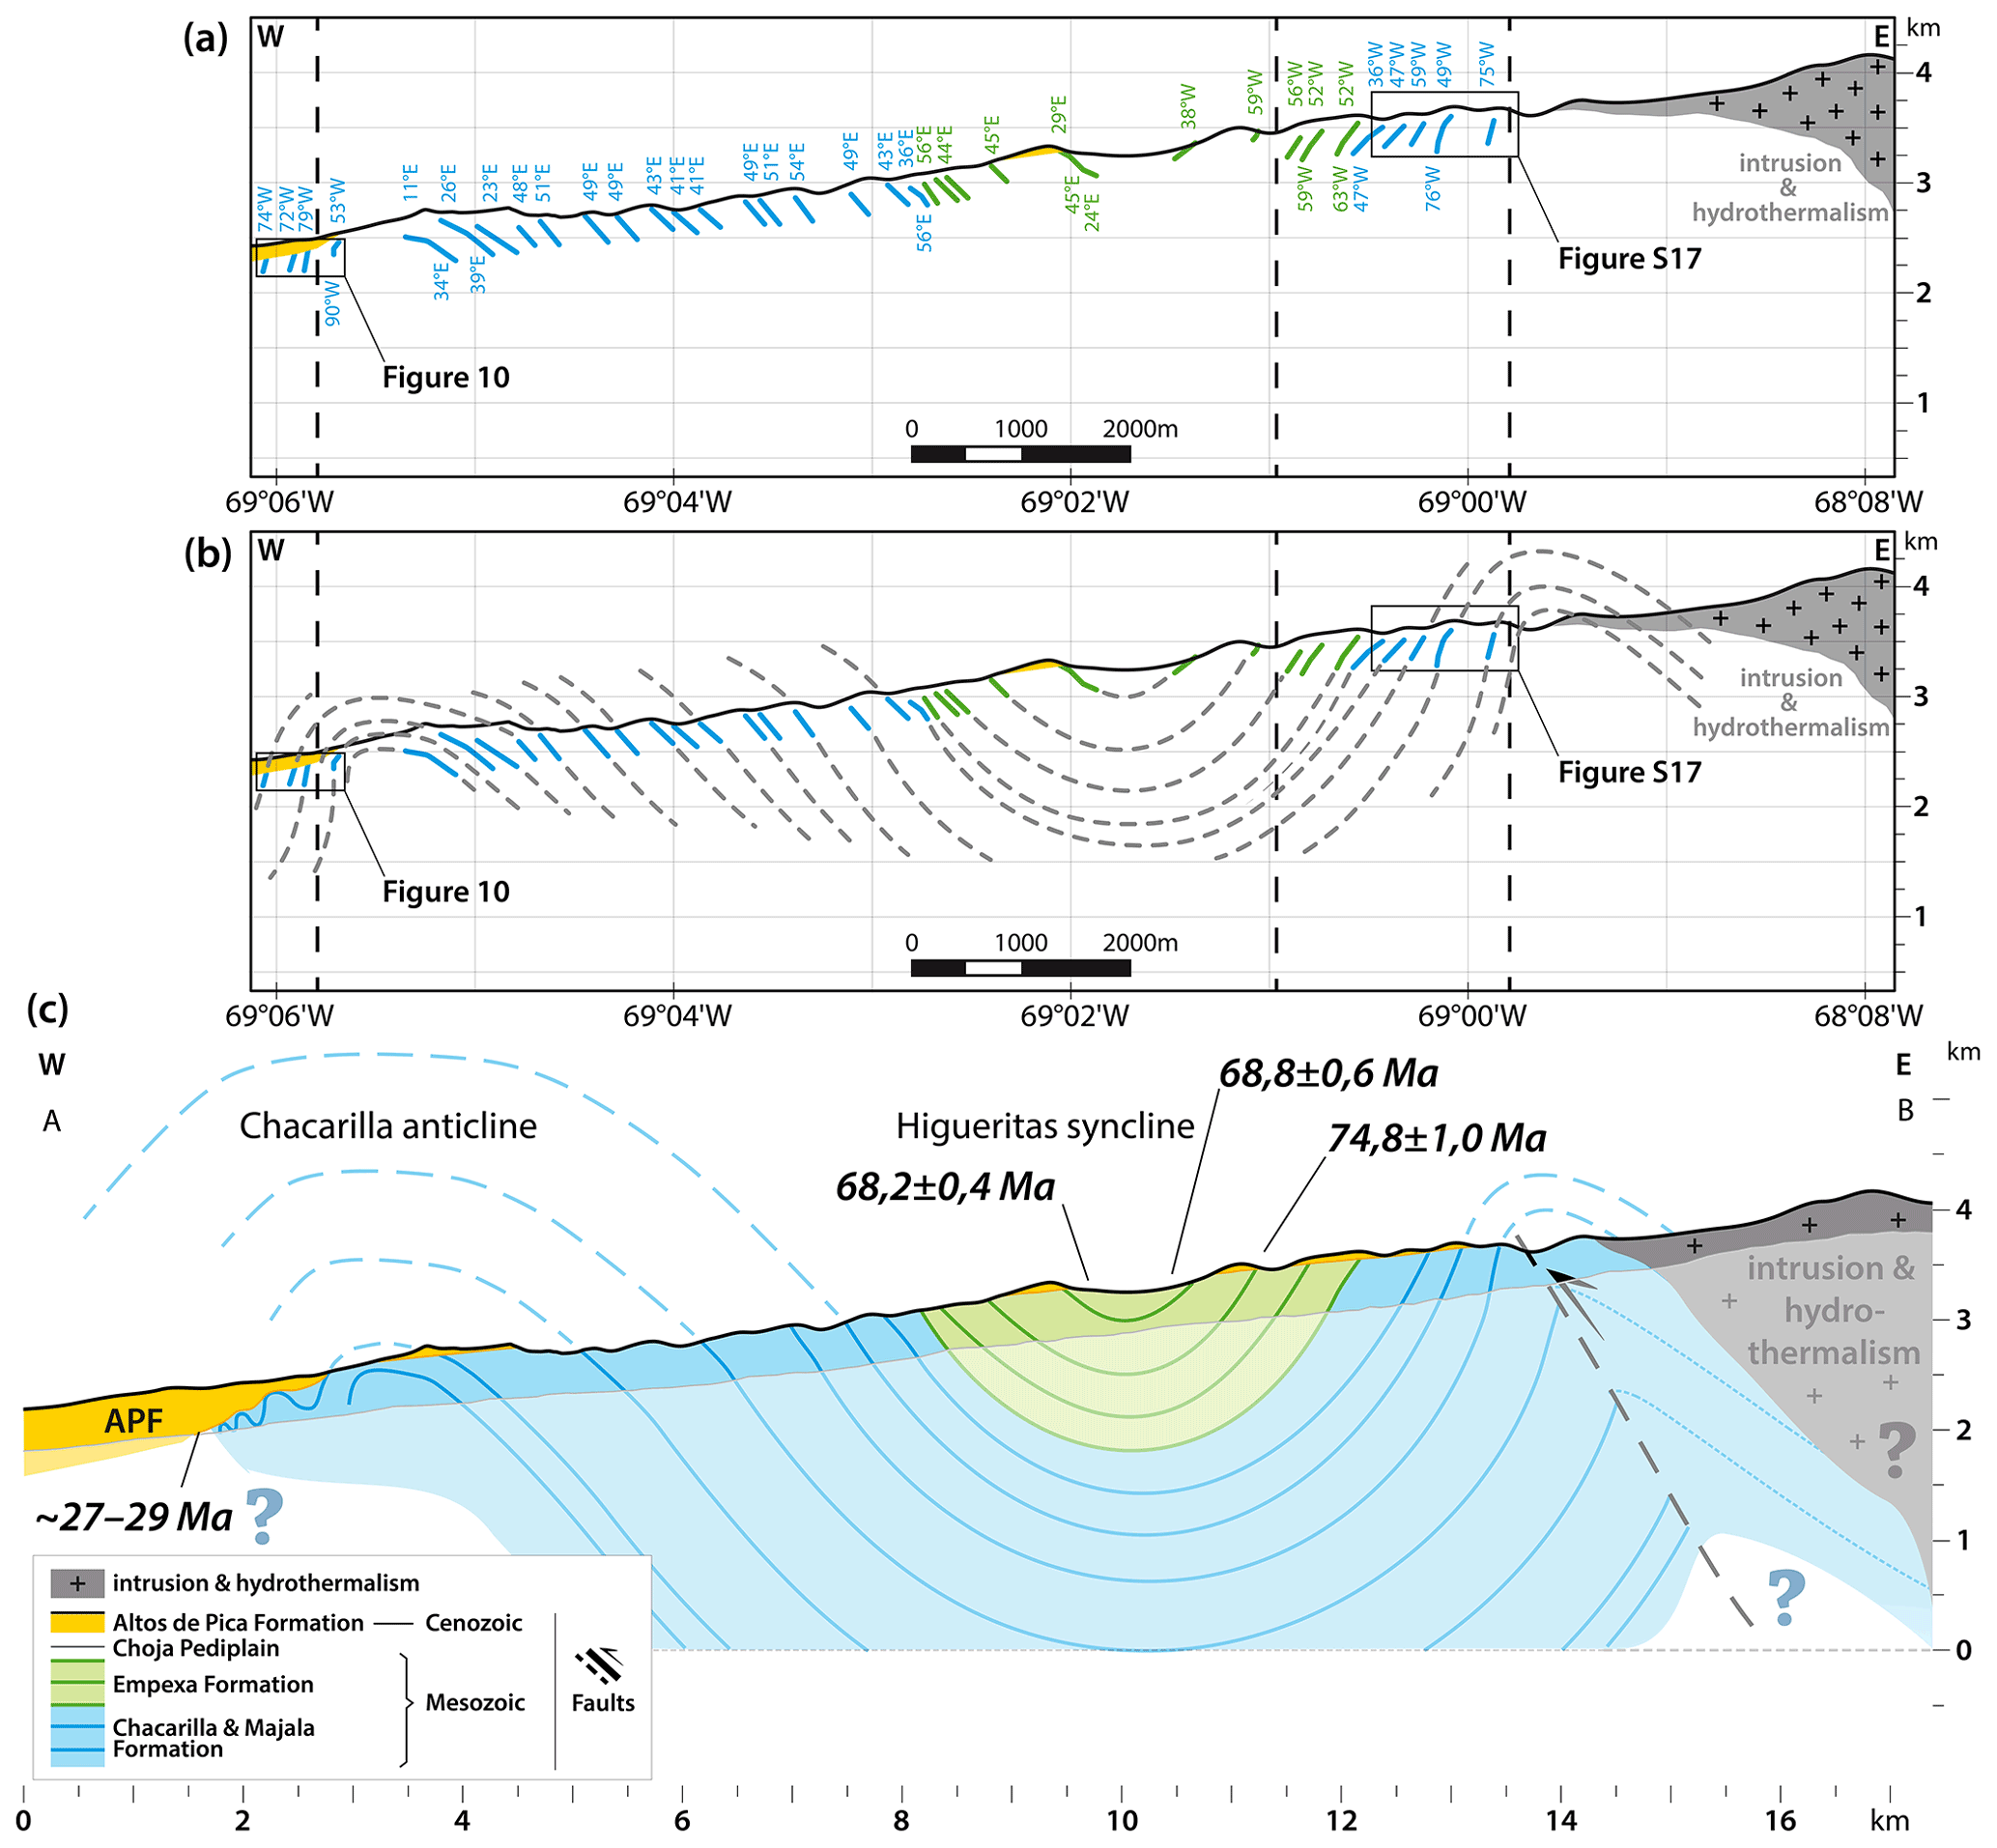
Figure 9East–west surface cross-section of the Quebrada Blanca site, established from the projection of selected well-expressed layers mapped on satellite imagery. APF: Altos de Pica Formation. (a) Observations reporting the geometry of projected layers and associated dip angles, together with their stratigraphic ages (color code). (b) Subsurface interpretation and extrapolation of observations. (c) East–west subsurface section A–B based on (a) and (b). Interpretation at depth is indicated with transparent colors, in contrast to surface observations. Extrapolation above the topographic surface is drawn with dashed lines. Ages from uranium–lead (U Pb) radioisotope dating on zircon are taken from the Guatacondo geological map (Blanco and Tomlinson, 2013). The ∼27–29 Ma age of the basal deposits of the Altos de Pica Formation is derived from regional considerations (Victor et al., 2004).
The Mesozoic units of the Quebrada Blanca are of Jurassic to Cretaceous age (Blanco and Tomlinson, 2013). They were deposited in a back-arc basin context in successive transgression–regression sequences (Charrier et al., 2007) and are subdivided into three formations: (1) the late Oxfordian Majala Formation, a clastic unit of sandstones, shales, and stromatolitic limestones of transitional marine origin; (2) the Late Jurassic–Early Cretaceous Chacarilla Formation, a fluvial clastic sequence; and (3) the Late Cretaceous Cerro Empexa Formation, an andesitic volcanic and continental sedimentary unit (Blanco and Tomlinson, 2013; Blanco et al., 2000, 2012; Dingman and Galli, 1965; Dingman and Galli Olivier, 1962; Tomlinson et al., 2001). The Majala and Chacarilla formations both bear detritic reddish and beige sediments. The Cerro Empexa Formation appears grayish and massive in the field. In the Quebrada Blanca area, uranium–lead (U Pb) dated zircons from this formation bear ages between ∼75 and ∼68 Ma (Blanco and Tomlinson, 2013; Blanco et al., 2012; Tomlinson et al., 2015) (Fig. 8).
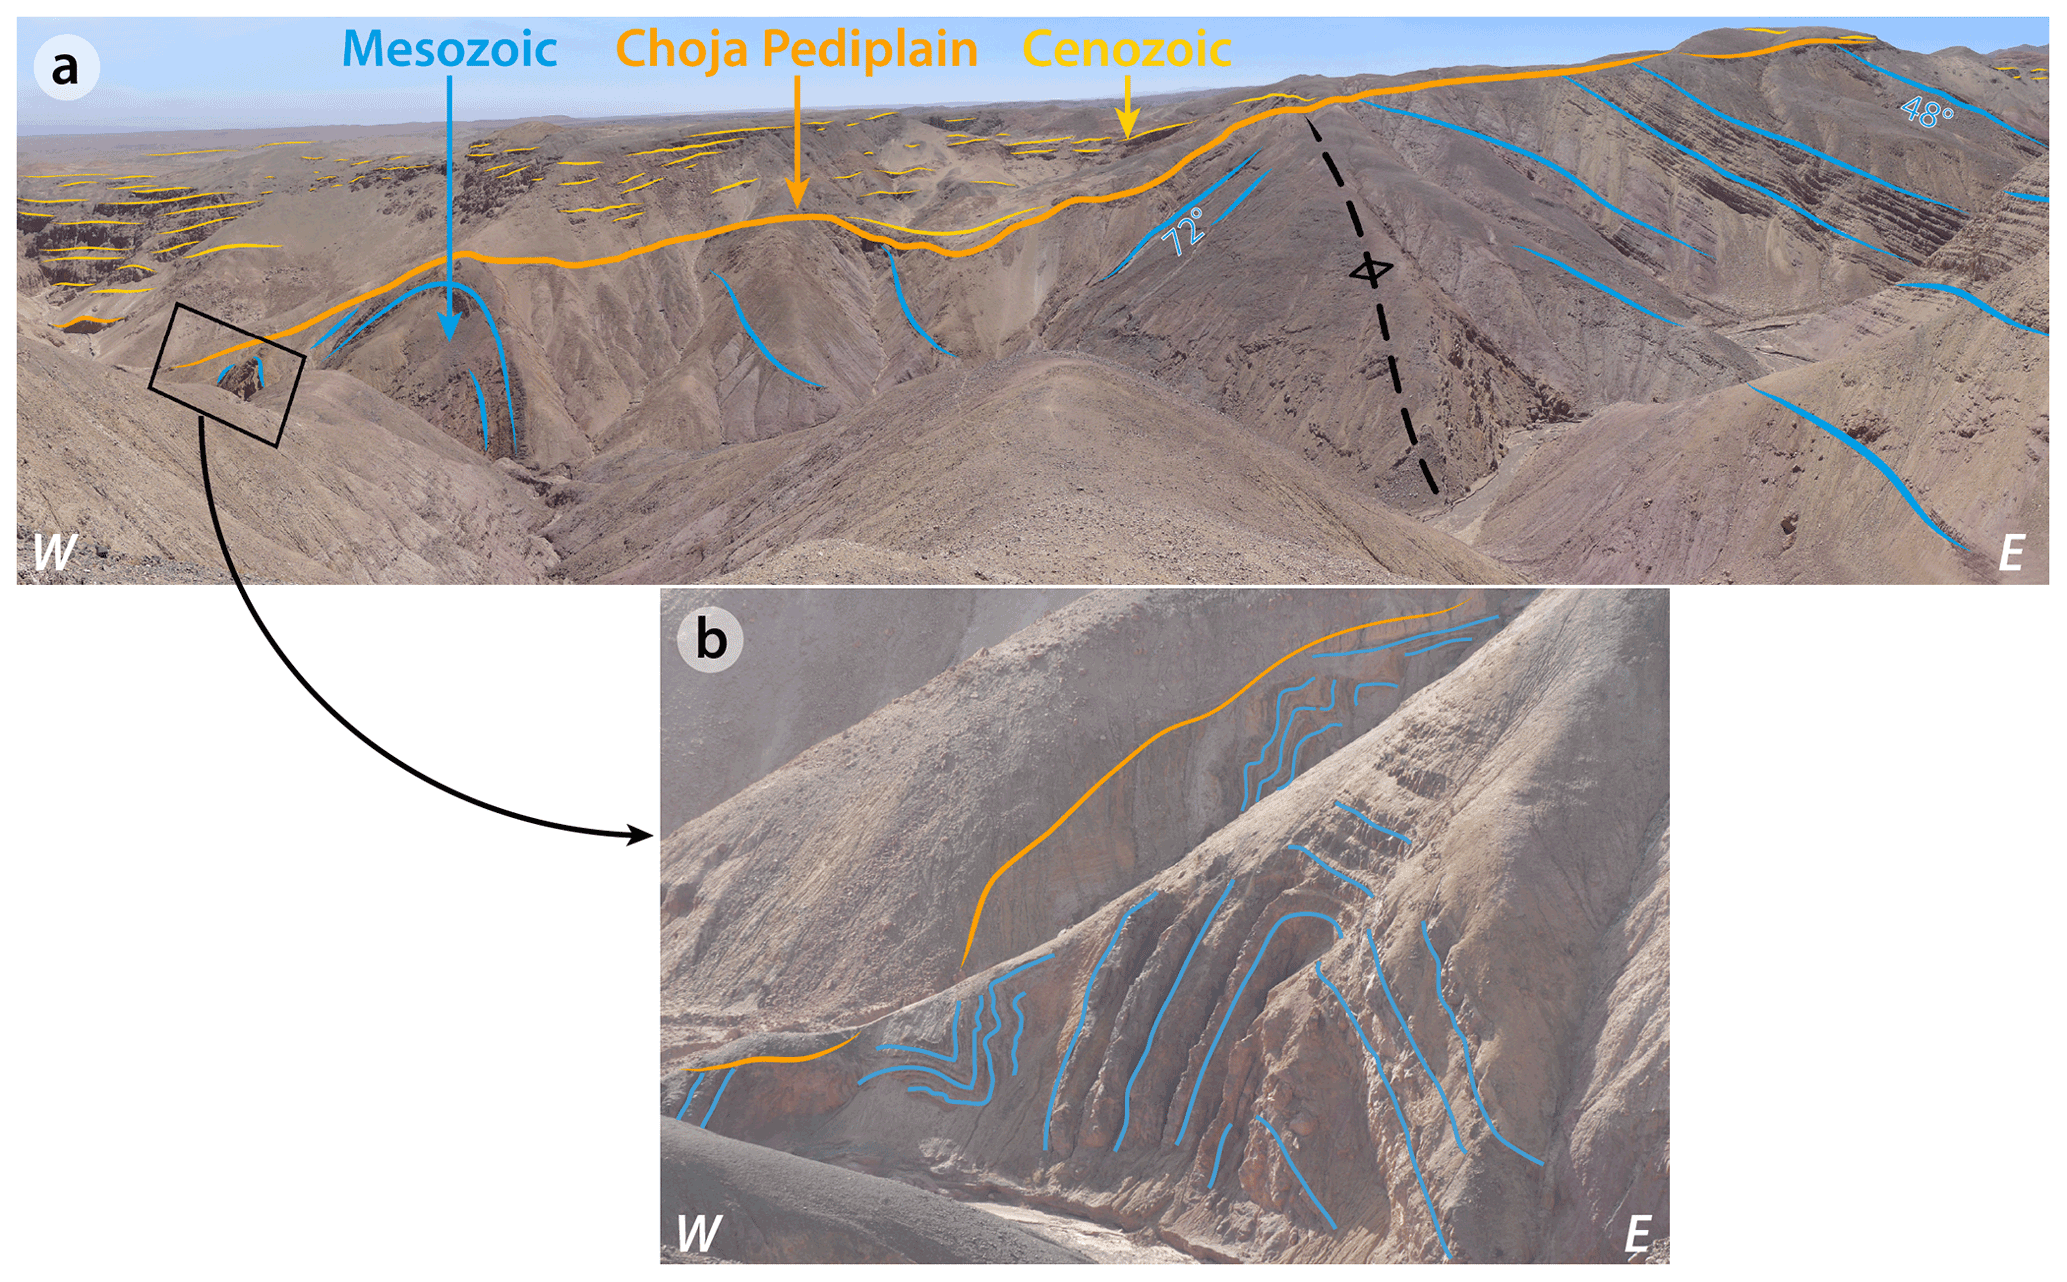
Figure 10Field picture of the western limb of the western anticline in the Quebrada Blanca area. Non-interpreted photographs are provided in the Supplement (Fig. S18). Location in Figs. 8 and 9. (a) Series of folds with westward-decreasing amplitude and wavelength (hundreds to tens of meters) observed at the front of the western anticline. (b) Detailed view of the westernmost outcropping small-scale anticlines, located in (a) by the black box.
Magmatic intrusions and hydrothermalism occur locally and hide the eastern continuation of the folded Mesozoic series. Some of these intrusions are dated by uranium–lead (U Pb) on zircons at ∼44 Ma (Blanco and Tomlinson, 2013) (Fig. 8).
The Cenozoic deposits of the Altos de Pica Formation here also overlie the Mesozoic series, over the Choja Pediplain angular unconformity (see also Sect. 2.2). The age of the basal deposits of the Altos de Pica Formation is regionally estimated to be ∼27–29 Ma (e.g., Victor et al., 2004).
5.2 Structural observations
Although the cartography of the folds is complicated by the blanketing Cenozoic cover (notably in the west and south) and by magmatic intrusions and hydrothermalism (particularly to the east) (Fig. 8), three large-scale folds are observable: a wide syncline in the center (Higueritas syncline) bounded by two anticlines to the west (Chacarilla anticline) and east (fold names from Blanco and Tomlinson, 2013; Fuentes et al., 2018). The scale of these folds is multi-kilometric (Fig. 8). Both anticlines are asymmetric: they have steeper western limbs (dip angles vary between ∼50 and 80∘ W), whereas their eastern limbs have more gentle dip angles (varying between ∼20 and 50∘ E) (Fig. 9). Despite the fact that the eastern flank of the eastern anticline is widely hidden by magmatic intrusions and hydrothermalism, its southern part is clearly observable in the field (Fig. 8). The central Higueritas syncline is wider and more symmetric, with dip angles of ∼40–50∘ on both limbs. The anticlines involve the Majala and Chacarilla formations, while the core of the syncline bears the Cerro Empexa Formation. Overall, the documented folds show a clear west vergence (Fig. 9c).
In the field, we observe small-scale deformation within both anticlines (Fig. 9). A series of anticlines with westward-decreasing amplitude and wavelength (of a few tens to a few hundreds of meters – to be compared to the ∼4 km wavelength of the main anticline) is observable on the western edge of the Chacarilla anticline (Figs. 9c and 10). In the field, at least one of these small-scale folds is affected by a minor thrust. Additionally, within the eastern large-scale anticline, a thrust-affected small-scale fold is observed (Figs. 9c and S17) and confirms the west vergence at this smaller scale.
The Cenozoic detrital units are unconformably deposited above the folded Mesozoic series. Thin sheet-like river-incised Cenozoic surfaces remain in the central part, becoming more dominant to the south and west (Fig. 8). These superficial erosional surfaces show an overall westward tilt (Fig. 9). Westward thickening of the Cenozoic layers deposited above the erosional Choja surface is clearly observed at the front of the western anticline (Fig. 10) and reveals the presence of growth strata.
6.1 Timing of deformation
The projection of mapped strata indicates that the Mesozoic series is overall concordant in Quebrada Blanca (Fig. 9). The cross-section of the Guatacondo map (Blanco and Tomlinson, 2013), however, suggests the presence of a minor angular unconformity () at the base of the Cerro Empexa Formation, not observed here from our large-scale high-resolution mapping. As this local unconformity does not produce any major change in the geometry of layers from Jurassic to Cretaceous, we consider it to be minor, in particular with respect to the main large-scale folding documented here. Folding therefore mostly postdates the deposition of all these series. In the Quebrada Blanca area, the youngest folded layers of the Cerro Empexa Formation bear U–Pb ages of 68.9±0.6 and 68±0.4 Ma (Blanco and Tomlinson, 2013) (Figs. 8 and 9c). We can therefore conclude that the main deformation episode postdates ∼68 Ma, even though we cannot exclude earlier but minor deformation when compared to the observed large-scale folding (Fig. 9c).
Magmatic intrusions dated at ∼44 Ma intrude the folded Mesozoic units and appear cartographically unaffected by folding (Blanco and Tomlinson, 2013) (Fig. 8). This suggests that the major part of the folding occurred during the ∼68–44 Ma time interval. However, without additional observations of the deformation – or not – of these intrusions (geometry of the contact with surrounding host units, mineral deformation, etc.), we cannot unequivocally draw conclusions from this simple cartographic observation.
Even though we suspect that the deformed series of the Pinchal zone are Triassic to Jurassic, we do not have any absolute ages of the folded units. Therefore, we postulate that the main deformation here also postdates ∼68 Ma by analogy to our observations at the Quebrada Blanca.
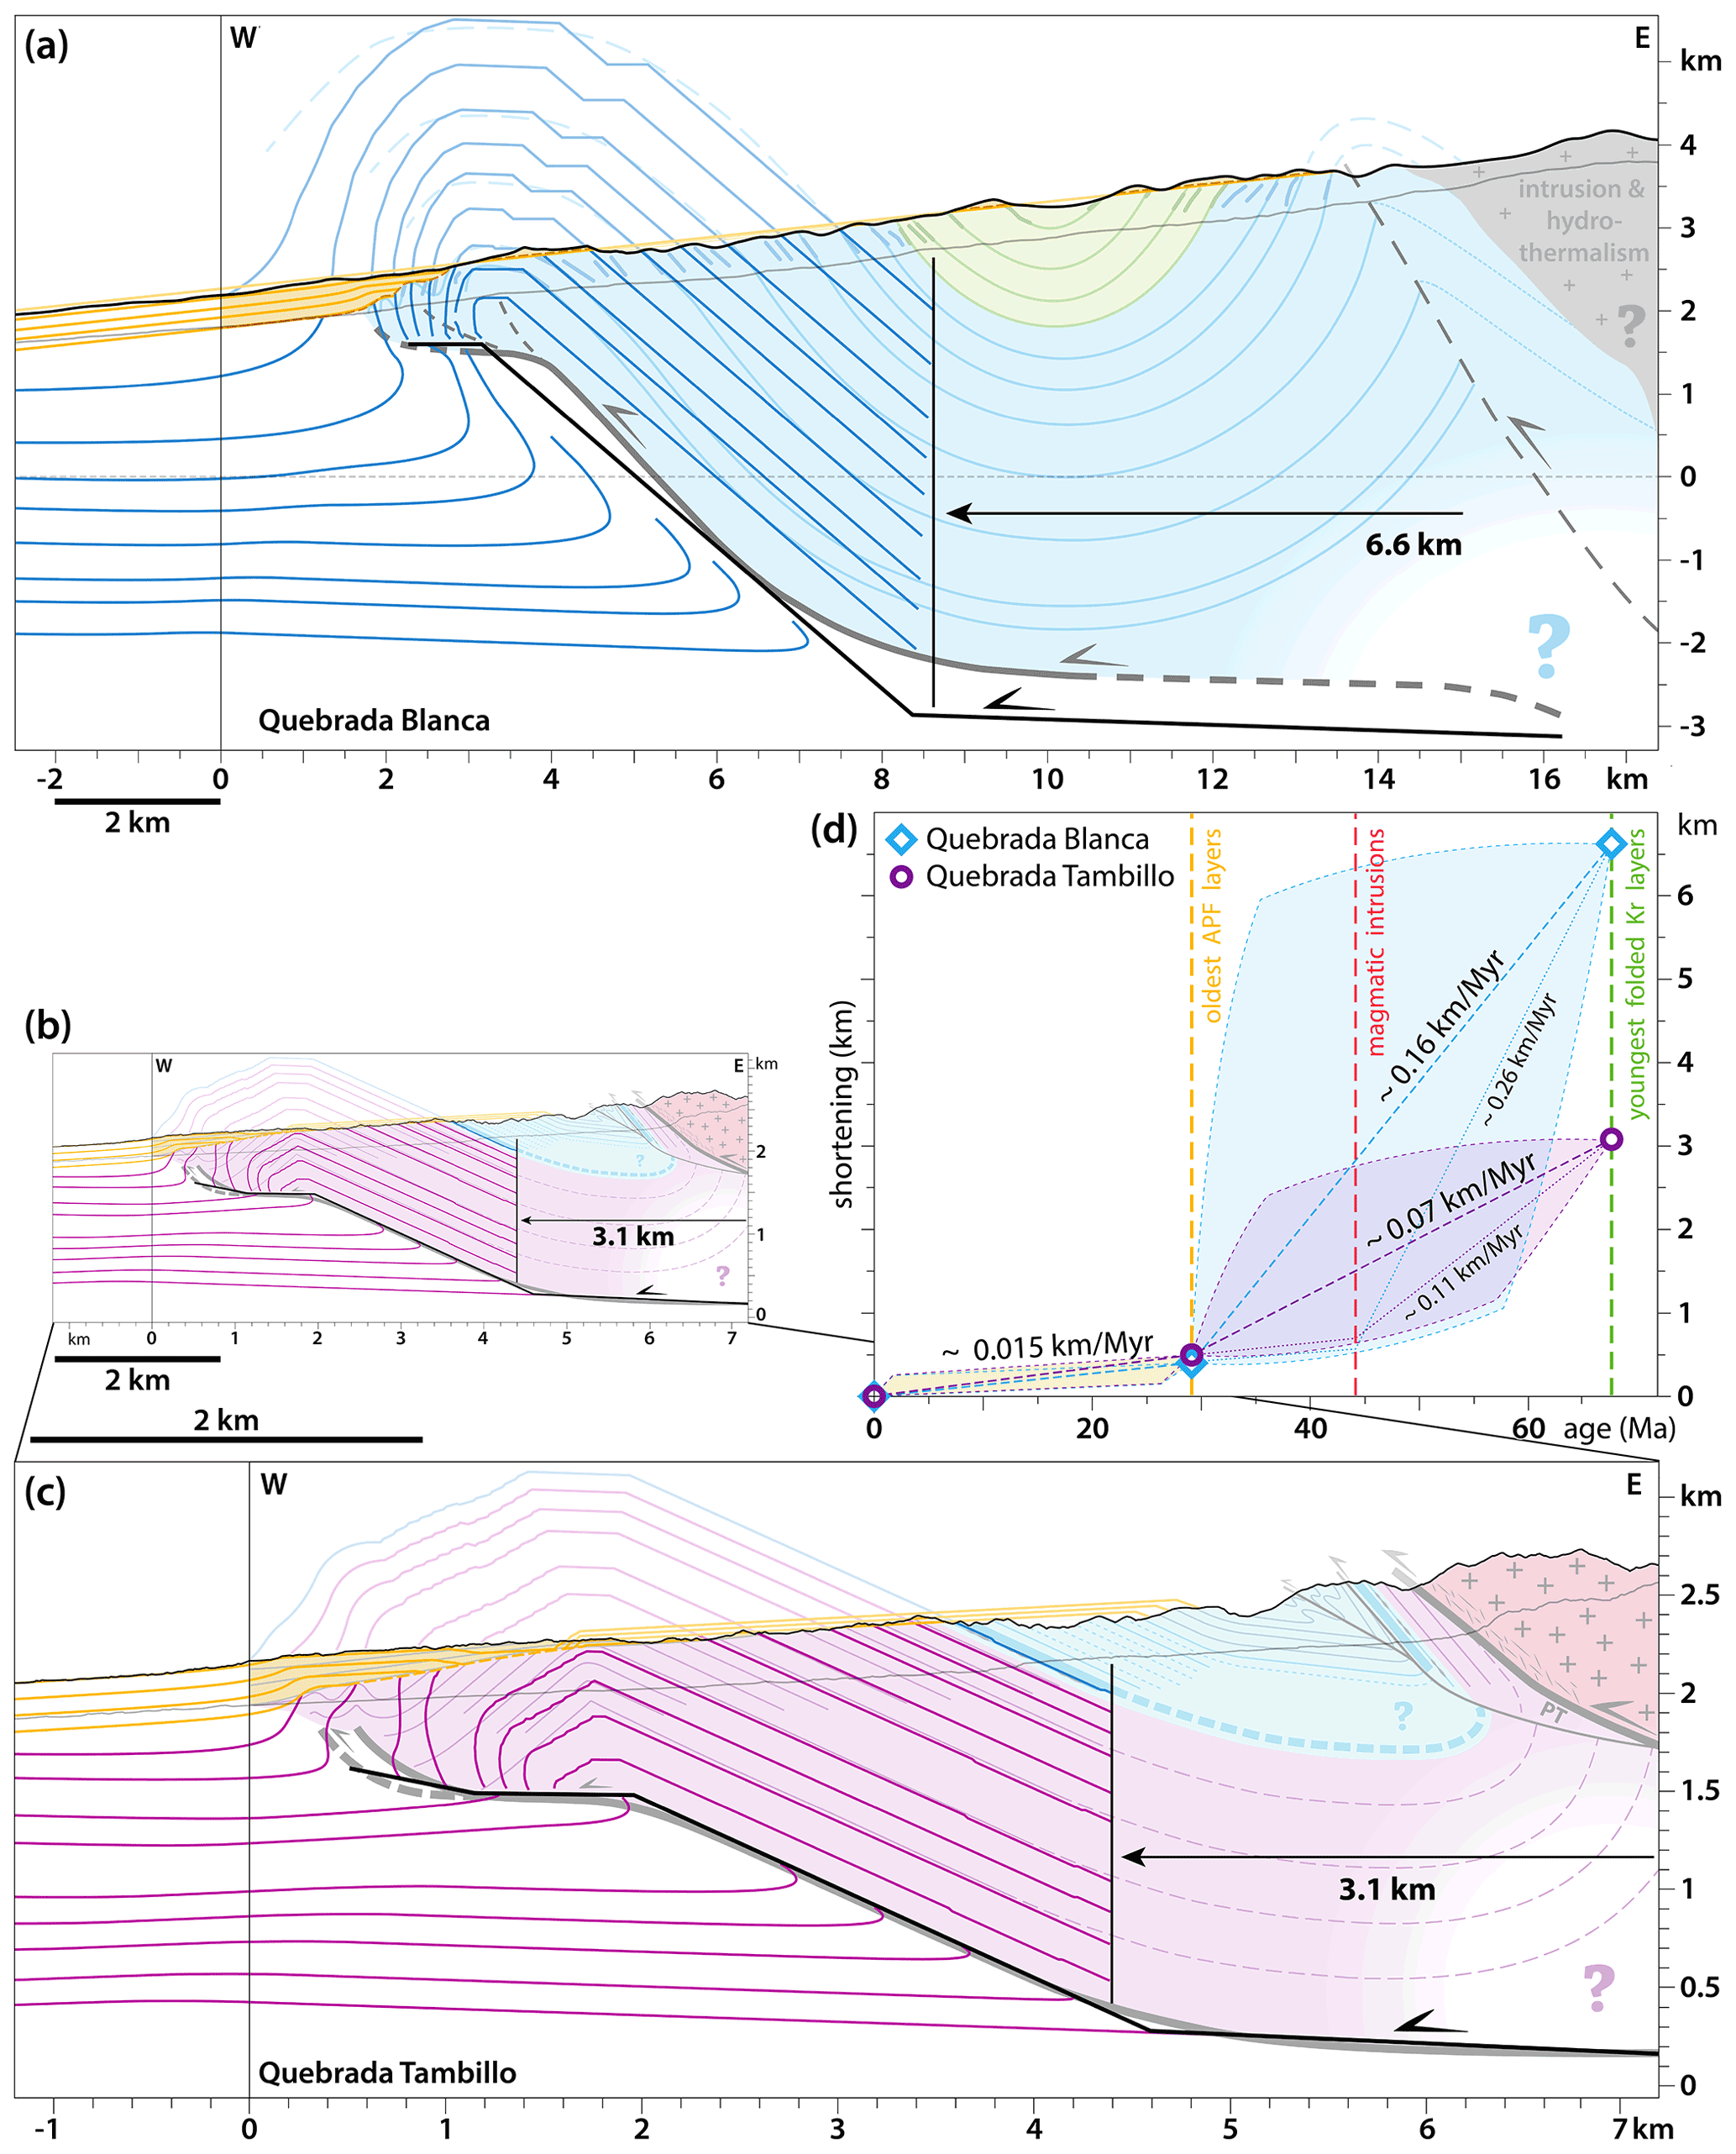
Figure 11Cross-sections and kinematics of folding of the Quebrada Blanca and Pinchal zones. Cross-sections are built from field observations considering that faults root at the base of the folded series. Modeling was performed with FaultFold Forward v.6 (Allmendinger, 1998). Intermediate stages of the trishear modeling are reported in Figs. S19 and S20 for the cross-sections of Quebrada Tambillo and Quebrada Blanca, respectively. Model parameters are reported in Tables S2–S3. (a–c) Proposed cross-sections and final stages of our preferred trishear models in the case of (a) the Quebrada Blanca area and (b) the Quebrada Tambillo (Pinchal area) shown here at the same scale as (a). (c) Detailed and enlarged view of our results for the Quebrada Tambillo. Note the large scale difference between the sections of the two investigated sites (a, b). Thicker lines outline model results, while transparent lines and colors refer to the proposed cross-sections. Black lines report the modeled thrusts, and horizontal arrows report the modeled total shortening. PT: Pinchal Thrust. (d) Shortening vs. time, as deduced from trishear modeling of the western anticlines of the Quebrada Blanca and Pinchal areas, and the ages of deformed layers. The three temporal benchmarks correspond to the age of the youngest folded Cretaceous (Kr) unit (∼68 Ma), to the age of magmatic intrusions possibly postdating folding (∼44 Ma), both derived from the Guatacondo geological map (Blanco and Tomlinson, 2013), and to the ∼29 Ma age of the oldest Cenozoic layer of the Altos de Pica Formation (APF) (Victor et al., 2004). It is possible that most deformation occurred prior to ∼44 Ma (steeper lines). Our results underline two phases of deformation, with a slowing-down of deformation since ∼29 Ma at least, possibly even before.
The folded Mesozoic units are unconformably covered by the Cenozoic Altos de Pica Formation at both investigated sites. This is also the case for the Pinchal Thrust and secondary thrusts at a few places in the Pinchal zone (Fig. 4). The presence of growth strata at the front of the westernmost anticlines in both study areas, over the erosional Choja Pediplain, suggests that some deformation proceeded after ∼29 Ma during deposition of the Altos de Pica Formation. However, the deformation recorded by folded Mesozoic units appears of greater intensity than that of the Cenozoic growth layers (Figs. 5c and 9c).
Given this, we propose that the main folding of the Mesozoic layers documented here can be bracketed to a maximum time span of ∼40 Myr, sometime between ∼68 and ∼29 Ma, with additional relatively minor deformation after ∼29 Ma. Possibly, the main deformation period could be shorter (∼24 Myr at most), sometime between ∼68 and ∼44 Ma, with minor shortening after the Eocene intrusions. In the case of the Pinchal Thrust, we can only propose from our observations that thrusting took place prior to ∼29 Ma.
6.2 Structural interpretations
6.2.1 Section across the Pinchal zone
The cross-section proposed along Quebrada Tambillo (Figs. 11b–c) summarizes our preferred interpretation of the subsurface structural geometry of the Pinchal area.
Considering that the folds west of the Pinchal Thrust developed above underlying thrusts is a reasonable and classical assumption (Davis et al., 1983; Suppe, 1983). These thrusts have dip angles parallel to the layers forming the backlimb of the overlying anticlines (as proposed in Fig. 11b–c) or can be steeper. They are expected to root at least at the base of the outcropping folded Mesozoic series (as proposed in Fig. 11b–c) or deeper. From there, it can be extrapolated that the thrusts root at least 2 km beneath the topographic surface (i.e., at ∼0.2 km a.s.l.), assuming that the layer thickness is constant over our study area. We cannot discard the possibility that the thrusts root deeper and are steeper from surface geology alone. To the west of our field area, at the front of the anticline, the small-scale folds with westward-decreasing wavelength and amplitude (Fig. 7b) are interpreted as the possible expression of disharmonic folding within the forelimb of the anticline and/or of a thrust ramping up toward the subsurface (Fig. 11b–c).
Using the simplified geometry of layers along Quebrada Tambillo (Figs. 5c and 11c), line-length balancing results in a minimum of ∼1 km of shortening absorbed by folding only, from the Pinchal Thrust to the front of the anticline (Table 1). Because of the pervasive presence of small-scale folding and thrusting (Figs. 5a–b and S13), in particular within the inverted limb of the overthrusted syncline, this estimate represents a minimum value. A significant – but unconstrained – amount of shortening by folding is surely to be added. In addition to folding, the offsets on the interpreted underlying thrusts are to be considered when quantifying shortening. However, the thrust offsets largely depend on the interpreted thrust geometry and on the structure of the footwall, which cannot be precisely determined from surface geology.
Based on the dip angle of the C–S fabric of the shear zone (Fig. 6b) and on the mapping of the thrust on satellite imagery, we estimate that the Pinchal Thrust dips ∼40∘ E in the near surface, locally less, such as along Quebradas Tania and Martine (Fig. 5a–b). All secondary strands of the Pinchal Thrust are expected to root at depth to the main shear zone. The secondary thrust breaking the core of the syncline, roughly parallel to the Pinchal Thrust (Fig. 4), may be described as an out-of-the-syncline thrust (Mitra, 2002) and probably also connects onto it at depth. Similar reasoning is proposed for all small-scale thrusts and décollements observed within the inverted synclinal limb. The minimum thickness of the Mesozoic series is estimated to be ∼2.2 km from the normal limb of the syncline along Quebrada Tambillo. Thus, the strict minimum exhumation of the basement can be considered to equally be ∼2.2 km. Assuming a constant 40∘ E dip angle and taking exhumation as a proxy for structural uplift, this yields a minimum displacement of ∼2.6 km on the Pinchal thrust only.
6.2.2 Section across the Quebrada Blanca
As for the Pinchal area, we interpret the Quebrada Blanca folds as related to ramp thrusts rooting at least at the base of the folded Mesozoic units – i.e., at the base of the Late Jurassic series – or deeper. Assuming constant layer thicknesses, it can be deduced that the thrusts root at least 4 km beneath the current topographic surface (i.e., at least at −2 km a.s.l.) (Fig. 11a). In our cross-section of Fig. 11a, the interpreted thrust needs to deepen eastward to balance the proposed section. From surface geology alone, we cannot discard the possibility that the thrust is steeper below the documented anticlines and roots deeper.
The secondary frontal folds with westward-decreasing wavelength (Figs. 10 and 11a) can be explained as disharmonic folds within the forelimb of the large western anticline and/or be interpreted as reflecting the existence of a shallow blind thrust (Fig. 11a). Such a feature is also in good agreement with secondary (steeper) thrusts affecting these anticlines (Fig. 9).
Line-length balancing of the cross-section of Fig. 11a results in ∼3.8 km of shortening solely related to folding (Table 1). This value is only a minimum as it does not account for the observed small-scale deformation or for slip on the related thrusts at depth. As for Pinchal, the fault geometries and the structure of the footwall of the thrusts are not constrained from surface geology to provide a complete cross-section and the associated shortening.
6.3 Additional constraints on shortening: a possible structural interpretation modeled by trishear
The underlying thrusts have not reached the surface and remain blind (Figs. 5c and 9c). They are also associated with disharmonic folding at their probable tip, with small-scale folds at the front of major anticlines. Because of these observations, we assume fault propagation folding to be the dominant mode of deformation in both study areas. To estimate the amount of shortening that is taken by thrusting at depth, some assumptions for the footwall and thrust geometries are needed.
One possible interpretation is to consider a thrust ramp parallel to the layers of the backlimb of the anticlines, rooting at the base of the series involved in folding, as in the sections of Fig. 11. Disharmonic folding at the front of the anticlines is likely related to the local thickening of layers at the front of a shallow upward-propagating ramp, as in the frontal triangular zone of trishear folds. To further quantify the shortening associated with this chosen structural interpretation, we conduct kinematic trishear modeling (e.g., Allmendinger, 1998; Erslev, 1991) of the westernmost anticlines documented at the Quebrada Tambillo (Pinchal area) and Quebrada Blanca. This approach accounts for folding and slip on propagating thrust faults, and it models the deformation distributed at the tip of these evolving faults. The trishear formalism relies on a set of parameters that are adjusted here by trial and error so as to visually fit the proposed structural geometries of the anticlines. The values of these parameters are within the range considered in previous studies (Tables S1–S3) (e.g., Allmendinger, 1998; Allmendinger and Shaw, 2000; Cristallini and Allmendinger, 2002; Erslev, 1991; Hardy and Ford, 1997; Zehnder and Allmendinger, 2000), and 65–100 combinations of these parameters have been tested here. Further details are provided in the Supplement (Text S1).
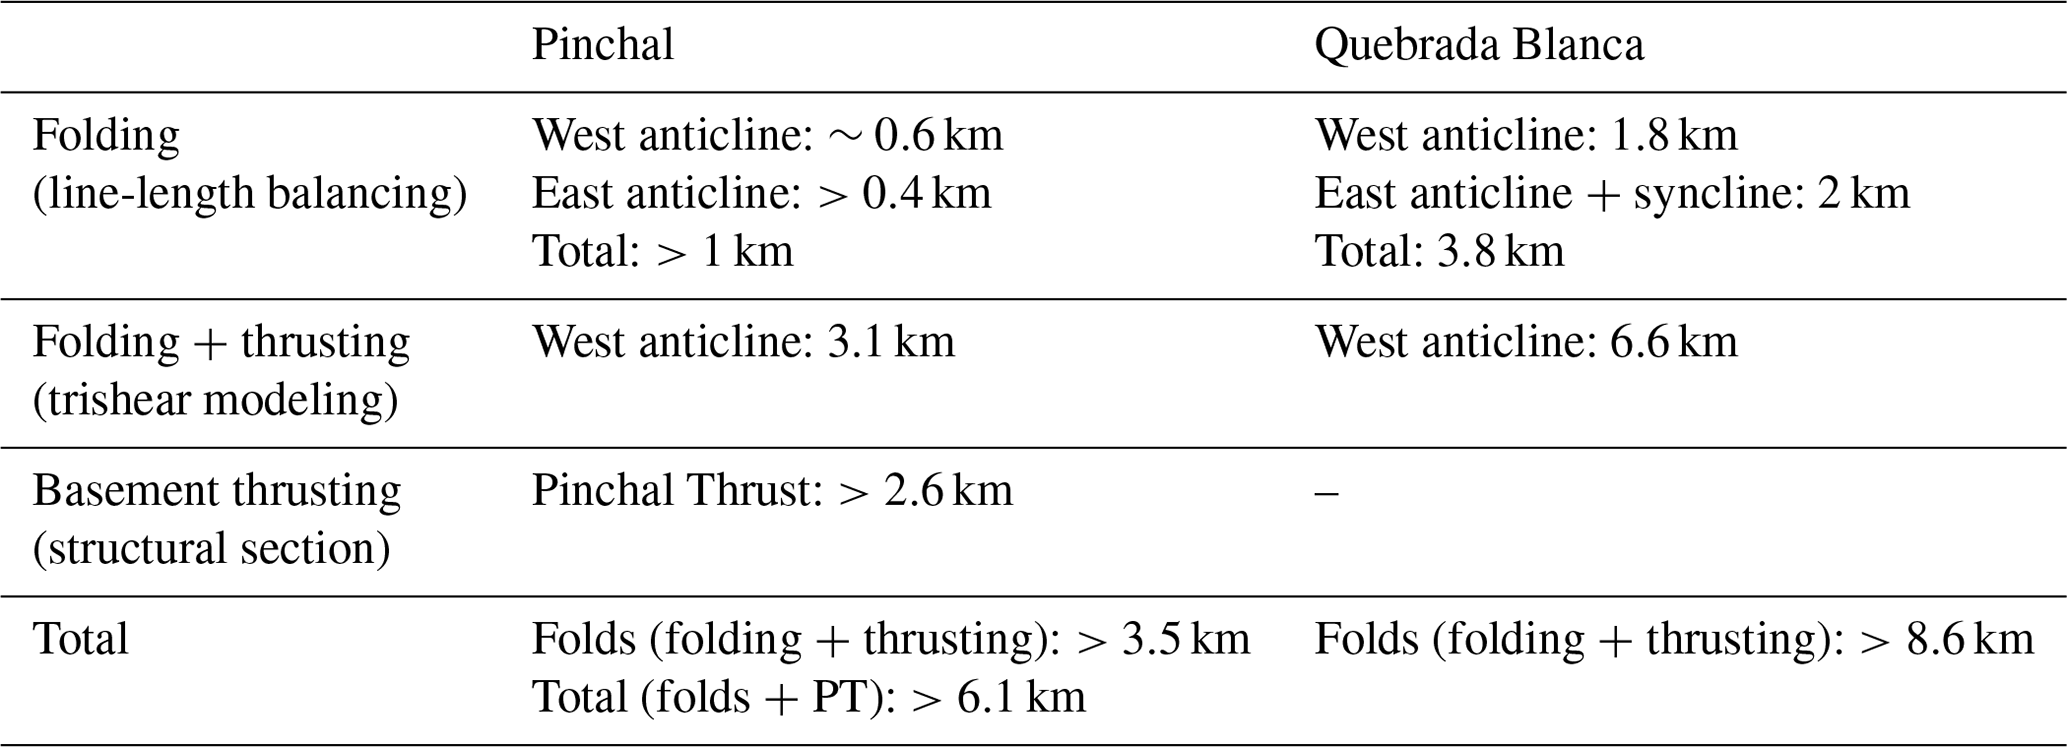
Table 1Shortening values on the various structures documented in this study. Shortening associated with folding is estimated from line-length balancing on the various folds of the two investigated sites. Additional constraints on shortening are provided for the western anticlines from trishear modeling; these include folding of these anticlines and thrusting on the associated ramp. Thrusting on the Pinchal Thrust (PT) is deduced from its subsurface geometry and the minimum thickness of the folded Mesozoic series. See text for additional details.
Here we present our preferred models, which allow for satisfactorily reproducing the proposed structural geometries, acknowledging that these solutions are not unique. The structural geometries of the westernmost anticlines of the two study sites are reproduced (Fig. 11), and the evolution of deformation is modeled over time taking into account the Cenozoic growth strata. The various stages of deformation are shown in Figs. S19 and S20. We find that the geometries of the western anticlines can be reproduced with a cumulative shortening of 3.1 km for Quebrada Tambillo (Pinchal area) and 6.6 km for Quebrada Blanca (Fig. 11). Based on the range of tested acceptable models, we estimate that these shortening values are determined here with an uncertainty of ∼0.2 km.
The above shortening values only account for the deformation (folding and thrusting) absorbed across the modeled westernmost anticlines. Synclinal folding accounts for an additional minimum shortening of ∼0.4 km as deduced by line-length balancing in the Pinchal area, leading to a total of >3.5 km of shortening across the Mesozoic units along the Quebrada Tambillo section. This includes folding, as well as slip on the detachment and western thrust ramp (Table 1). When adding the minimum ∼2.6 km of thrusting deduced on the Pinchal Thrust, we get >6.1 km of total shortening across the whole Pinchal area. Similarly, in the Quebrada Blanca area, the easternmost anticline and syncline take up ∼2 km of shortening by folding deduced by line-length balancing, leading to a minimum amount of shortening of ∼8.6 km across the whole Quebrada Blanca section, including folding and slip on the underlying detachment and western ramp (Table 1).
The two investigated sites take up different amounts of shortening. This may relate to the fact that the across-strike extents of the two sections are significantly different (∼7 km long section for the Quebrada Tambillo vs. ∼17 km long section for the Quebrada Blanca) (Fig. 11). The calculated shortenings similarly represent ∼47 % and ∼34 % of shortening when scaled to the extent of the Quebradas Tambillo and Blanca sections, respectively. Differences between these sections may also relate to the depth at which the interpreted thrusts root (elevation of ∼0.2 km for Quebrada Tambillo vs. depth of ∼2 km for Quebrada Blanca relative to sea level) (Fig. 11), which is a probable result of the varying structural and stratigraphic inheritance from the earlier Andean basins. Lateral variations in deformation also cannot be excluded.
The shortening values estimated above depend on the proposed subsurface structural interpretations, more specifically on the thrust geometries – much more than on the detailed model parameters. They are to be considered lower bounds, but only within the considered structural framework. We favored the simplest geometry where the thrusts root at the base of the folded series and connect at depth but cannot discard from local field observations alone the possibility that they are steeper and root deeper. If this were the case, shortening related to thrusting would be lower than proposed here. Folding estimated from line-length balancing only and our favored structural interpretation (Fig. 11) therefore provide a lower and upper bound on shortening estimates, respectively.
6.4 Kinematics of shortening
Within the structural framework proposed in the sections of Fig. 11, trishear modeling allows for simulating the evolution of thrust slip and folding in the case of the westernmost anticlines of the two investigated sites. By adding syntectonic layers while deformation proceeds, we also reproduce the overall geometry of the base of the Cenozoic Altos de Pica Formation deposits and of the subsequent growth strata (Figs. S19 and S20). Syntectonic surfaces and layers are prescribed an initial 3–6∘ W dipping angle, similar to the present-day regional topographic slope (Fig. 1). From there, we find that ∼0.5 and ∼0.4 km of shortening is needed to reproduce the first-order geometry of the base of the Altos de Pica Formation at the front of the Quebrada Tambillo (Pinchal area) and Quebrada Blanca sections, respectively, using the previous trishear models adjusted to our final cross-sections. When compared to the minimum 3.1 and 6.6 km of total shortening accumulated since ∼68 Ma across the westernmost anticlines of these two sections, this indicates that the ∼29 Ma old basal Cenozoic layers above the Choja surface record at most only 16 % and 6 % of this total shortening, respectively. We have tested the possibility of initial horizontal Cenozoic syntectonic layers. In this case, a post-∼29 Ma shortening of 0.8 km at most is needed to best adjust the observed geometry of the basal Altos de Pica Formation layers, even though a good fit to both the geometry of the growth strata and of the finite fold structure cannot be satisfactorily found.
These results are then used to quantitatively describe the evolution of shortening over time across the westernmost anticlines of the two interpreted sections, with account of the timing of deformation discussed in Sect. 6.1 (Fig. 11d). We find that shortening rates were on average ∼0.07–0.16 km Myr−1 over the time span ∼68–29 Ma. They could have even been as high as ∼0.11–0.26 km Myr−1 if considering that the main deformation phase is confined to ∼68–44 Ma. Subsequently, deformation rates decreased to an average value of ∼0.015 km Myr−1 after ∼29 Ma, possibly starting earlier.
These average values are most probably minimum values within the framework of our modeled structural interpretations. Indeed, thrusting and folding are only modeled here for the westernmost anticlines of our study sites and do not account for the shortening cumulated across the other structures or on the Pinchal Thrust. Also, the main phase of deformation prior to ∼29 Ma could have lasted less than the ∼68–29 or ∼68–44 Ma considered time intervals (Fig. 11d). In the case that the underlying faults are steeper and root deeper, these minimum values would both be similarly lower.
Our results therefore quantitatively emphasize our former qualitative conclusion that the major phase of deformation occurred sometime between ∼68 and ∼29 Ma, with a significant subsequent slowing-down of deformation rates afterwards, possibly as soon as ∼44 Ma or earlier (Fig. 11d), a general conclusion that is not dependent on the proposed subsurface thrust geometries.
7.1 The Andean Basement Thrust
7.1.1 Evidencing a major basement thrust system along the Western Andean flank (∼20–22∘ S)
Here, we have further documented the Pinchal Thrust, which brings basement units of the Sierra de Moreno westward over folded Mesozoic units. Our study in the Pinchal area suggests that this thrust bears local complexities with several strands and minor splays, most probably related to the reactivation of structures in the initial pre-Andean back-arc basins. Laterally, the geological map of Skarmeta and Marinovic (1981) clearly documents this structure from ∼21∘15′ S to 21∘35′ S and possibly down to ∼22∘ S with some structural complexities by ∼21∘35′ S with the junction of two possible strands of this basement thrust.
Similar basement thrusts have been described all along the Cordillera Domeyko between ∼20 and ∼22∘ S. North of the map by Skarmeta and Marinovic (1981), the Quehuita (up to ∼21∘11′ S) and Choja (between ∼21∘08′ S–21∘01′ S) faults are west-vergent thrusts bringing basement over folded Mesozoic sediments (Aguilef et al., 2019). North of ∼21∘ S, intrusions, hydrothermalism, and surface volcanics hamper clear observation of similar basement thrusts. Such basement thrusts, if existent, would, however, provide a reasonable mechanism for the exhumation and exposure of basement rocks east of the folded Mesozoic units and at higher elevations, at the latitude of Quebrada Blanca (∼20∘45′ S) (Fig. 1). For these reasons, we cannot tell with any certainty whether a thrust contact similar to that described in Pinchal (this study) and further north (Aguilef et al., 2019) exists at this latitude, but such structure is to be suspected.
South of the map by Skarmeta and Marinovic (1981), in the Sierra de Moreno at ∼21∘45′ S, Haschke and Gunther (2003) report in their section a basement thrust over folded Mesozoic units, in agreement with the style of deformation documented here, but with a relatively minor displacement compared to our results in Pinchal. This thrust is called the Sierra de Moreno Thrust here. Together with the 1:1 000 000 geological map of Chile (Sernageomin, 2003), the Haschke and Gunther (2003) map suggests that this basement thrust is cartographically continuous southward to the southern end of the Sierra de Moreno, at ∼22∘05′ S. This possibly documents its lateral termination.
As a conclusion, a series of west-vergent basement thrusts exists all along the Western Andean flank, with various strands mapped as local basement faults, as in our study (Fig. 4) or on other maps (Aguilef et al., 2019; Haschke and Gunther, 2003; Sernageomin, 2003; Skarmeta and Marinovic, 1981; Tomlinson et al., 2001). Altogether, these thrusts appear as a major structural boundary all along the Western Andean flank, bringing the basement of the Cordillera Domeyko westward over folded Mesozoic units of the earlier Andean basins (Figs. 1 and 12) – and therefore contributing to the uplift of the western margin of the Altiplano. They form a segmented thrust system extending laterally over at least ∼120 km north–south (Fig. 1) that we propose naming the Andean Basement Thrust (hereafter ABT) system.

Figure 12Schematic section across the Western Cordillera (20–22∘ S), modified after Armijo et al. (2015). This section is only meant to be illustrative of the general structural framework of the Western Andes at the investigated latitudes. Colored rectangular frames locate the structures equivalent to the Quebrada Blanca folds (blue) and to the Pinchal Thrust (red) studied here. Shortenings estimated at these sites are reported. Shortening values in gray are tentatively estimated by upscaling our local findings to the whole West Andean Thrust System. The various thrusts need to root at depth onto an east-dipping décollement (West Andean Thrust), whose depth is not constrained. See text for further details.
We interpret the ABT to dip eastward beneath the Western Cordillera, at least >2 km (Pinchal area) or >4 km (Quebrada Blanca area) beneath the present-day topographic surface. Deeper and eastward, this thrust probably connects to a crustal-scale ramp, as needed to sustain the large-scale uplift and topographic rise of the Western Andes (Figs. 1 and 12), following the earlier ideas by Victor et al. (2004) and Armijo et al. (2015). Such a crustal-scale structure has been termed the West Andean Thrust (or WAT) by Armijo et al. (2015).
7.1.2 Shortening and timing of deformation of the Andean Basement Thrust
We estimated that the Pinchal Thrust (as part of the ABT system) accommodated a minimum of ∼2.6 km of shortening over a horizontal distance of ∼1 km in Pinchal. This estimate is deduced from the geometry of the thrust and from the minimum ∼2.2 km of exhumation needed to erode Mesozoic series and expose basement at the surface, considering that exhumation is a proxy for structural uplift here. Thermochronological data are too limited to evaluate the amount of basement exhumation more precisely, as well as its timing. These data are presently absent locally in Pinchal but sparsely exist at the regional scale when considering the ABT system over its whole extent. From apatite fission-track dating in basement samples taken ∼20 km east and southeast of our two study sites, Maksaev and Zentilli (1999) inferred at least 4–5 km of basement exhumation occurring between ∼50 and 30 Ma. Such exhumation is consistent with our results when considering the exhumation that may have accompanied the uplift expected from overthrusting on the ABT and on the WAT further east. Older thermochronological ages – (U–Th) He zircon and apatite ages of ∼91 and ∼57 Ma, respectively – were found by Reiners et al. (2015) from the basement of the Quebrada Arcas, ∼30 km south of Pinchal, in a structural setting equivalent to that documented here. These ages do not contradict the previous estimates of total exhumation by Maksaev and Zentilli (1999), even though modeling would be needed here to precisely test this. However, they question the exact timing of basement exhumation and, from there, of thrusting over the ABT. In the absence of properly analyzed and modeled samples closer to the ABT, it is difficult to more precisely assess its timing or amount of exhumation, uplift, and thrusting.
At a few places, the Pinchal segment of the ABT is covered by Cenozoic deposits. Given this observation and with existing thermochronological ages, we postulate that the ABT was most probably active sometime by the Late Cretaceous to early Cenozoic – and that its activity had ceased by the early Miocene. This suggests it may have been coeval with folding of the Mesozoic units documented immediately further west – or starting slightly before.
7.2 The West Andean Thrust System at ∼20–22∘ S
7.2.1 Evidencing a west-vergent thrust system along the Western Andean flank (∼20–22∘ S)
The west-vergent folds described here as deforming Mesozoic units at ∼20–22∘ S are interpreted to form above faults. A similar system of folds and faults affecting Mesozoic units is expected to extend further north and south than just the two sites described here, most probably over the entire zone of ∼20–22∘ S (Fig. 1), even though a large part north of Quebrada Blanca is covered by Cenozoic strata. This is deduced from existing maps and previous works (e.g., Aguilef et al., 2019; Haschke and Gunther, 2003; Sernageomin, 2003; Skarmeta and Marinovic, 1981). It therefore probably spreads out over a north–south distance of at least ∼200 km – and possibly more as folded Mesozoic sediments are mapped on the 1:1 000 000 geological map of Chile (Sernageomin, 2003) in the northward and southward continuation of the two zones investigated here.
Further west, structures at depth are hidden beneath Cenozoic deposits (Fig. 1). Seismic profiles from the Chilean Empresa Nacional del Petroleo (ENAP), as re-interpreted by various authors (Victor et al., 2004; Fuentes et al., 2018; Labbé et al., 2019; Martinez et al., 2021), also show a series of several blind mostly west-vergent thrust faults. The faults and folds documented here across two ∼7–17 km wide sites therefore most probably pertain to a thrust system that extends across-strike over a much wider region (∼50 km, maybe locally more).
West-verging thrust faults along the Western Andes at ∼20–22∘ S most probably derive from the inversion of the normal faults that bounded the earlier Andean basins. Fuentes et al. (2018) and Martinez et al. (2021) interpreted these faults as single planar deep-reaching thrusts, possibly rooting into basement. However, even though such geometries cannot be discarded from local poorly resolved seismic data or from scarce field observations, they cannot satisfactorily explain the large-scale geometry of the Western Andean flank, as noted earlier by Victor et al. (2004). Indeed, only a ramp–flat–ramp geometry of a basal master fault deepening eastward beneath the Western Cordillera, whatever its rooting depth, can account for the overall large-scale continuous topographic rise of the entire western plateau margin (Figs. 1 and 12) (Armijo et al., 2015; Victor et al., 2004). The blind west-vergent thrust faults found all along the western flank at ∼20–22∘ S can therefore reasonably be interpreted as connecting to such an east-dipping master fault (or detachment). By integrating our local observations into these regional large-scale considerations, we favor the earlier interpretations of Victor et al. (2004) and Armijo et al. (2015).
Altogether, these data suggest that all these thrust faults, either hidden below Cenozoic deposits or deduced from outcropping folds, most possibly pertain to a common west-vergent thrust system found all along the Western Cordillera of northern Chile (20–22∘ S). We propose naming this thrust system the West Andean Thrust System (or WATS). The WATS at ∼20–22∘ S therefore extends laterally over at least ∼200 km and across-strike over a much wider region (∼50 km, maybe locally more) than the two ∼7–17 km wide sites investigated in this study (Figs. 1 and 12).
7.2.2 Shortening across the West Andean Thrust System (∼20–22∘ S)
By excluding the possibility of steep deep-rooting single faults from the above large-scale considerations, we favor our local structural interpretations of Fig. 11 – and from there the associated shortening estimates – where the faults possibly root at the base of the folded series, at least locally. The WATS of northern Chile (∼20–22∘ S) therefore probably accommodates a minimum shortening of ∼3–9 km, as quantified from the ∼7–17 km wide investigated areas (not including the contribution of the ABT in Pinchal). At ∼21∘45′ S, ∼30 km south of the Pinchal area, Haschke and Gunther (2003) report a minimum shortening of >9 km from a ∼50 km wide cross-section in the Sierra de Moreno area and further east. Within the ∼8–10 km wide area encompassing an equivalent of the WATS and ABT, they estimate a minimum shortening of ∼4 km (i.e., a minimum of ∼30 % of shortening), a value consistent and at scale with our results. This study of Haschke and Gunther (2003) is to our knowledge the only other work attempting to estimate the minimum total shortening absorbed by the WATS. It becomes obvious that the various structures of the WATS in northern Chile, wherever they are (Quebrada Blanca, Pinchal, or Sierra Moreno areas), all absorb multi-kilometric shortening at the scale of only one to three major folds and thrusts.
This conclusion further emphasizes that the ∼3–9 km of shortening proposed here from the folds of the Quebrada Blanca and Pinchal areas (when excluding the contribution of the ABT in Pinchal) are in any case underestimates of the total shortening across the whole WATS. When applying the minimum ∼34 %–47 % shortening estimated across our two investigated sites to the ∼50 km across-strike extent of the whole WATS, we tentatively propose a possible crustal shortening of ∼26–44 km (Fig. 12), a value consistent – even though in the high range – with the ∼20–30 km qualitatively estimated by Armijo et al. (2015) by scaling with structural relief and crustal thickness. These estimates should, however, be taken with caution and only as possible upper bounds, as deformation is localized on thrust faults (e.g., Fuentes et al., 2018; Haschke and Gunther, 2003; Martinez et al., 2021; Victor et al., 2004; this study) and not homogeneously distributed. The precise geometry of faults at depth, in particular their rooting depth, is also in no case constrained. A precise quantification of the deformation recorded by buried folded Mesozoic units west of our study sites is at the moment not possible from available seismic profiles.
7.3 Temporal evolution of deformation along the Western Andes (∼20–22∘ S)
Our investigations underline the fact that the deformation of the Quebrada Blanca and Pinchal areas is not linearly distributed over time and can be assigned to two main periods: (1) a period of major deformation sometime between ∼68 and 29 Ma (possibly ∼68–44 Ma) and (2) a subsequent period of moderate deformation from ∼29–0 Ma (starting possibly earlier) (Fig. 11d). This is deduced for the westernmost anticline of both study sites from trishear modeling, but the reduction in deformation rates is expected at the scale of the whole investigated sites as the difference in the deformation cumulated by Mesozoic units and by post-∼29 Ma Cenozoic layers can be qualitatively – but clearly – intuited from our field observations and cross-sections (Figs. 5, 9, and 11). Westward, deformation is mostly well imaged on seismic profiles for Cenozoic post-∼29 Ma growth strata and remains less well resolved for underlying Mesozoic units (Fuentes et al., 2018; Labbé et al., 2019; Martinez et al., 2021; Victor et al., 2004), reflecting the fact that Mesozoic units could also be much more deformed here than Cenozoic layers.
In this study, we find ∼0.4–0.5 km of post-∼29 Ma shortening on one single most frontal fault and fold in the case of our two investigated sections (Figs. S19, S20): that is, over a distance of ∼5–8 km. Based on the ENAP seismic profiles in the westward prolongation of our study areas, Victor et al. (2004) determined a post-∼29 Ma shortening of ∼3 km, accommodated by several west-vergent thrusts within the ∼40 km wide Atacama Bench. All these values are in overall good agreement when setting them to the same spatial scale, as they consistently represent ∼6 %–8 % of shortening. Compared to the minimum ∼3–6 km of ante-∼29 Ma shortening (or ∼34 %–47 % of shortening) quantified on one single structure in this study (Figs. S19, S20), the post-∼29 Ma shortening is clearly of limited importance.
The deformation slowdown, starting by ∼29 Ma at the latest and possibly earlier by ∼44 Ma, could therefore be regional across the entire WATS. This reasoning applies to the WATS but may also hold for the ABT. If the age of basement thrusting is not precisely known, it most probably occurred by the early Cenozoic (Maksaev and Zentilli, 1999) or even Late Cretaceous–early Cenozoic (deduced after Reiners et al., 2015) and had ceased by ∼29 Ma (see discussion in Sect. 7.1).
This proposed time window for major folding and possibly for thrusting over the ABT is generally consistent with the main Incaic phase of deformation inferred by various authors as the main period of Andean mountain building stricto sensu (e.g., Charrier et al., 2007; Cornejo et al., 2003; Pardo-Casas and Molnar, 1987; Steinmann, 1930). The simplest interpretation of the post-∼29 Ma decline of the shortening rate is that it results from the slowdown of the same protracted regional compressional event which caused the formation of the west-vergent WATS and ABT. With the presently available data at 20–22∘ S, we cannot exclude the possibility that this slowdown may have started before ∼29 Ma – possibly as soon as ∼44 Ma or even before (Sect. 6.4) – but definitely not afterwards.
7.4 Regional implications
Even though multi-kilometric, the shortening accommodated by the west-vergent structures of the Western Andes outlined in this study represents a modest contribution to the total crustal shortening of >300 km across the entire Central Andes at ∼20∘ S (e.g., Anderson et al., 2017; Barnes and Ehlers, 2009; Eichelberger et al., 2013; Elger et al., 2005; Kley and Monaldi, 1998; Mcquarrie et al., 2005; Sheffels, 1990). It should, however, be recalled that the deformation absorbed across the Western Andes took place mostly in the early stages of the Andean orogeny, sometime between ∼68 and 29 Ma (possibly ∼68–44 Ma) in the case of the WATS, possibly starting earlier for the ABT – in any case during the Incaic phase. In fact, when replaced within the temporal evolution of Andean mountain building at these latitudes (e.g., Armijo et al., 2015; Charrier et al., 2007; Mcquarrie et al., 2005; Oncken et al., 2006) (see sect. 2.1), the early multi-kilometric shortening evidenced here represents a major contribution to initial Andean deformation, which has most often been neglected in orogen-wide studies. The slowing-down of deformation across the Western Andean flank by ∼29 Ma – and possibly starting after ∼44 Ma – may have accompanied the jumping and transfer of deformation towards the east, i.e., towards the eastern Altiplano and further east (e.g., Isacks, 1988; Mcquarrie et al., 2005; Oncken et al., 2006).
In this study, we investigate and explore from two outcropping sites two major structural features within the western flank of the Chilean Andes at ∼20–22∘ S: (1) the Andean Basement Thrust (ABT) system, which stands as a system of west-vergent thrusts bringing Paleozoic basement over folded Mesozoic series, and (2) the West Andean Thrust System (WATS), which is a west-vergent thrust system deforming Mesozoic and Cenozoic sediments. The WATS is mostly hidden by the Cenozoic Altos de Pica Formation, but structures crop out in few (up to ∼10–20 km wide) places along the mountain flank. Even though our investigations only rely on two limited outcropping sites, our deductions have regional implications when compared and upscaled with previous results.
Using field and satellite observations, we build structural cross-sections and quantify the recorded shortening at two key sites along the western mountain flank. We estimated a minimum shortening of >2.6 km on the ABT and >3–9 km on the few exposed structures of the WATS. This shortening – derived from outcrop areas of limited extent – corresponds only to a fraction of the entire deformation at the scale of the whole Western Cordillera at ∼20–22∘ S. When set on scale with the extent of the investigated structures, it implies the possibility of multi-kilometric shortening across the western flank of the Andes, possibly up to 26–44 km.
We further exploit the differential deformation recorded by folded Mesozoic layers and Cenozoic growth strata of the post-∼29 Ma Altos de Pica Formation. We show that the outcropping WATS was mainly active between ∼68 and 29 Ma (possibly ∼68–44 Ma) and that its deformation rates significantly decreased after ∼29 Ma (a decrease that may have started earlier, e.g., by ∼44 Ma). By comparison to previous studies of the blind portions of the WATS west of our study sites, we propose that such slowing-down of deformation rates was regional rather than local. In addition, field observations and published thermochronological results of basement exhumation suggest that this temporal evolution of deformation rates may also hold for the ABT. We therefore propose that the post-∼29 Ma (or post-∼44 Ma) decline in shortening rates resulted from the regional slowing-down of the same protracted compressional event that caused the formation of the west-vergent WATS and ABT, most probably accompanying the transfer of Andean deformation towards the Altiplano Plateau, Eastern Cordillera, and further eastward.
Pléiades satellite imagery (https://earth.esa.int/eogateway/missions/pleiades, last access: March 2018) was obtained through the ISIS program of the CNES under an academic license and is not available for open distribution. On request, the DEMs calculated from this imagery can be provided to any academic researcher, but only after approval from the CNES (contact: isis-pleiades@cnes.fr, with copy to lacassin@ipgp.fr and simoes@ipgp.fr referring to this paper). Numerical computations for the DEMs were performed using the free and open-source MicMac software suite (Rosu et al., 2014; Rupnik et al., 2016) freely available at https://micmac.ensg.eu/index.php (last access: April 2018). For cartographic mapping, we also used Google Earth imagery (Landsat 7, DigitalGlobe) freely accessible at https://earth.google.com (last access: July 2021). All geological maps used in this work are cited in the main text and in the reference section. Our own maps are provided in the main text. All field measurements and observations have been collected by us during our field missions (March 2018, January 2019) and are provided in the main text, in the figures, and in the Supplement. The trishear kinematic modeling was conducted using FoldFault Forward version 6 (Allmendinger, 1998), freely available at http://www.geo.cornell.edu/geology/faculty/RWA/programs/faultfoldforward.html (last access: October 2020).
The supplement related to this article is available online at: https://doi.org/10.5194/se-14-17-2023-supplement.
RL and MS designed the study, and TH carried it out. TH designed all figures. The paper was prepared by TH, MS, and RL and revised by MS and RL – with the contribution of all co-authors. All authors participated in fieldwork and in the various scientific discussions.
The contact author has declared that none of the authors has any competing interests.
Publisher's note: Copernicus Publications remains neutral with regard to jurisdictional claims in published maps and institutional affiliations.
This study was supported by grants from the CNRS-INSU (program TELLUS-SYSTER) and from the Institut de physique du globe de Paris (IPGP) (PI: Robin Lacassin). Fieldwork was also funded by the Andean Tectonics Laboratory of the Advanced Mining Technology Center, University of Chile (PI: Daniel Carrizo). Earlier work on this zone by Robin Lacassin and Daniel Carrizo was supported by ANR project MegaChile (grant ANR-12-BS06-0004-02) and the LABEX UnivEarthS project. Tania Habel benefited from a PhD grant provided by the French Ministry of Higher Education and Research. Pléiades satellite imagery was obtained through the ISIS program of the CNES under an academic license. The authors thank Arthur Delorme for his technical assistance in producing the DEMs using the free and open-source MicMac software. Numerical computations for the DEMs were performed on the S-CAPAD platform, Institut de physique du globe de Paris (IPGP). The kinematic modeling was made using FoldFault Forward version 6. Rolando Armijo and the late Ricardo Thiele are warmly thanked for the fruitful discussions that led over the years to this work and paper. We also benefited from discussions with Christian Creixell, Nicolas Blanco, Andrew Tomlinson, and Fernando Sepulveda (SERNAGEOMIN), from the valuable help of Magali Riesner for the 3D mapping, and that of Laurie Barrier for facies and polarity identifications. Laurie Barrier and Nicolas Bellhasen are also thanked for inspiring discussions. Comments by Laura Giambiagi, Constantino Mpodozis, and Rick Allmendinger on an earlier version of this paper are acknowledged. Constructive reviews by Benjamin Gérard and Patrice Baby helped improve this paper. This study was partly supported by IdEx Université de Paris ANR-18-IDEX-0001.
This research has been supported by the Institut national des sciences de l'Univers (TELLUS-SYSTER), the Institut de Physique du Globe de Paris (Projet Lacassin), the Centro Avanzado de Tecnología para la Minería (Projecto Carrizo), the Agence Nationale de la Recherche (grant no. ANR-12-BS06-0004-02), and IdEx Université de Paris (ANR-18-IDEX- 0001).
This paper was edited by Federico Rossetti and reviewed by Patrice Baby and Benjamin Gérard.
Aguilef, S., Franco, C., Tomlinson, A., Blanco, N., Álvarez, J., Montecino, D., Gardeweg, M., Campos, V., Rodríguez, C., and Maksaev, V.: Geología Del Área Quehuita-Chela, Regiones De Tarapacá Y Antofagasta, 1:100.000, 2019.
Allmendinger, R. W.: Inverse and forward numerical modeling of trishear fault-propagation folds, Tectonics, 17, 640–656, https://doi.org/10.1029/98TC01907, 1998.
Allmendinger, R. W. and Shaw, J. H.: Estimation of fault propagation distance from fold shape: Implications for earthquake hazard assessment, Geology, 28, 1099–1102, https://doi.org/10.1130/0091-7613(2000)28<1099:EOFPDF>2.0.CO;2, 2000.
Anderson, R. B., Long, S. P., Horton, B. K., Calle, A. Z., and Ramirez, V.: Shortening and structural architecture of the Andean fold-thrust belt of southern Bolivia (21 S): Implications for kinematic development and crustal thickening of the central Andes, Geosphere, 13, 538–558, https://doi.org/10.1130/GES01433.1, 2017.
Armijo, R., Rauld, R., Thiele, R., Vargas, G., Campos, J., Lacassin, R., and Kausel, E.: The West Andean thrust, the San Ramon Fault, and the seismic hazard for Santiago, Chile, Tectonics, 29, TC2007, https://doi.org/10.1029/2008TC002427, 2010.
Armijo, R., Lacassin, R., Coudurier-Curveur, A., and Carrizo, D.: Coupled tectonic evolution of Andean orogeny and global climate, Earth-Sci. Rev., 143, 1–35, 2015.
Baker, M.: Geochronology of Upper Tertiary volcanic activity in the Andes of North Chile, Geol. Rundsch., 66, 455–465, https://doi.org/10.1007/BF01989588, 1977.
Barnes, J. B. and Ehlers, T. A.: End member models for Andean Plateau uplift, Earth-Sci. Rev., 97, 105–132, https://doi.org/10.1016/j.earscirev.2009.08.003, 2009.
Blanco, N. and Tomlinson, A.: Carta Guatacondo, Región de Tarapacá, Servicio Nacional de Geología y Minería, Carta Geológica de Chile, Serie Geología Básica, 2013.
Blanco, N., Tomlinson, A. J., Moreno, K., and Rubilar, D.: Importancia estratigráfica de las icnitas de dinosaurios presentes en la Formación Chacarilla (Jurásico-Cretácico Inferior), Región de Tarapacá, Chile, 9e Congreso geológico chileno, Servicio Nacional de Geología y Minería, 2000.
Blanco, N., Vásquez, P., Sepúlveda, F., Tomlinson, A., Quezada, A., and Ladino, M.: Levantamiento geológico para el fomento de la exploración de recursos minerales e hídricos de la Cordillera de la Costa, Depresión Central y Precordillera de la Región de Tarapacá (20–21 S), Servicio Nacional de Geología y Minería, Santiago, Chile, 2012.
Brooks, B. A., Bevis, M., Whipple, K., Ramon Arrowsmith, J., Foster, J., Zapata, T., Kendrick, E., Minaya, E., Echalar, A., and Blanco, M.: Orogenic-wedge deformation and potential for great earthquakes in the central Andean backarc, Nat. Geosci., 4, 380–383, https://doi.org/10.1038/ngeo1143, 2011.
Buchelt, M. and Cancino, C. T.: The Jurassic La Negra Formation in the area of Antofagasta, northern Chile (lithology, petrography, geochemistry), in: The Southern Central Andes, edited by: Bahlburg, H., Breitkreuz, C., and Giese, P., Lecture Notes in Earth Sciences, Springer, Berlin, 169–182, https://doi.org/10.1007/BFb0045181, 1988.
Charrier, R., Pinto, L., and Rodrigues, M.P., Tectonostatigraphic evolution of the Andean Orogen in Chile, in: The Geology of Chile, edited by: Moreno, T. and Gibbons, W., The Geological Society, London, 21–114, https://doi.org/10.1144/GOCH.3, 2007.
Cornejo, P., Matthews, S., and Perez, C.: The “K-T” compresive deformation event in northern Chile (24∘–27∘ S), 10th Congreso Geologico Chileno, Concepcion, Chile, 6–10 October 2003.
Cristallini, E. O. and Allmendinger, R. W.: Backlimb trishear: a kinematic model for curved folds developed over angular fault bends, J. Struct. Geol., 24, 289–295, https://doi.org/10.1016/S0191-8141(01)00063-3, 2002.
Davis, D., Suppe, J., and Dahlen, F.: Mechanics of fold-and-thrust belts and accretionary wedges, J. Geophys. Res.-Sol. Ea., 88, 1153–1172, 1983.
DeCelles, P., Zandt, G., Beck, S., Currie, C., Ducea, M., Kapp, P., Gehrels, G., Carrapa, B., Quade, J., and Schoenbohm, L.: Cyclical orogenic processes in the Cenozoic central Andes, Geological Society of America Memoirs, 212, MWR212–222, https://doi.org/10.1130/2015.1212(22), 2014.
DeMets, C., Gordon, R. G., Argus, D. F., and Stein, S.: Effect of recent revisions to the geomagnetic reversal time scale on estimates of current plate motions, Geophys. Res. Lett., 21, 2191–2194, https://doi.org/10.1029/94GL02118, 1994.
Dingman, R. J. and Galli, O. C.: Geology and ground-water resources of the Pica area, Tarapaca Province, Chile, Geological Survey Bulletin, 1188–1189, US Department of Interior, https://doi.org/10.3133/b1189, 1965.
Dingman, R. J. and Galli Olivier, C.: Cuadrángulos Pica, Alca, Matilla y Chacarilla, con un estudio sobre los recursos de agua subterránea: Provincia de Tarapacá, Escala 1:50.000, Instituto de Investigaciones Geologicas, Carta Geologica de Chile, 1962.
Eichelberger, N., McQuarrie, N., Ehlers, T. A., Enkelmann, E., Barnes, J. B., and Lease, R. O.: New constraints on the chronology, magnitude, and distribution of deformation within the central Andean orocline, Tectonics, 32, 1432–1453, https://doi.org/10.1002/tect.20073, 2013.
Elger, K., Oncken, O., and Glodny, J.: Plateau-style accumulation of deformation: Southern Altiplano, Tectonics, 24, TC4020, https://doi.org/10.1029/2004TC001675, 2005.
Erslev, E. A.: Trishear fault-propagation folding, Geology, 19, 617–620, https://doi.org/10.1130/0091-7613(1991)019<0617:TFPF>2.3.CO;2, 1991.
Farías, M., Charrier, R., Comte, D., Martinod, J., and Hérail, G.: Late Cenozoic deformation and uplift of the western flank of the Altiplano: Evidence from the depositional, tectonic, and geomorphologic evolution and shallow seismic activity (northern Chile at 19 30' S), Tectonics, 24, TC4001, https://doi.org/10.1029/2004TC001667, 2005.
Fuentes, G., Martínez, F., Bascuñan, S., Arriagada, C., and Muñoz, R.: Tectonic architecture of the Tarapacá Basin in the northern Central Andes: New constraints from field and 2D seismic data, Geosphere, 14, 2430–2446, https://doi.org/10.1130/GES01697.1, 2018.
Galli-Olivier, C.: Pediplain in northern Chile and the Andean uplift, Science, 158, 653–655, https://doi.org/10.1126/science.158.3801.653, 1967.
Garcia, M. and Hérail, G.: Fault-related folding, drainage network evolution and valley incision during the Neogene in the Andean Precordillera of Northern Chile, Geomorphology, 65, 279–300, https://doi.org/10.1016/j.geomorph.2004.09.007, 2005.
Garzione, C. N., McQuarrie, N., Perez, N. D., Ehlers, T. A., Beck, S. L., Kar, N., Eichelberger, N., Chapman, A. D., Ward, K. M., and Ducea, M. N.: Tectonic evolution of the Central Andean plateau and implications for the growth of plateaus, Annu. Rev. Earth Pl. Sc., 45, 529–559, https://doi.org/10.1146/annurev-earth-063016-020612, 2017.
Hardy, S. and Ford, M.: Numerical modeling of trishear fault propagation folding, Tectonics, 16, 841–854, https://doi.org/10.1029/97TC01171, 1997.
Haschke, M. and Gunther, A.: Balancing crustal thickening in arcs by tectonic vs. magmatic means, Geology, 31, 933–936, https://doi.org/10.1130/G19945.1, 2003.
Heit, B., Sodoudi, F., Yuan, X., Bianchi, M., and Kind, R.: An S receiver function analysis of the lithospheric structure in South America, Geophys. Res. Lett., 34, L14307, https://doi.org/10.1029/2007GL030317, 2007.
Henriquez, S., DeCelles, P. G., and Carrapa, B.: Cretaceous to middle Cenozoic exhumation history of the Cordillera de Domeyko and Salar de Atacama basin, northern Chile, Tectonics, 38, 395–416, https://doi.org/10.1029/2018TC005203, 2019.
Homewood, P. and Lateltin, O.: Classic swiss clastics (flysch and molasse) The alpine connection, Geodin. Acta, 2, 1–11, https://doi.org/10.1080/09853111.1988.11105150, 1988.
Horton, B. K.: Sedimentary record of Andean mountain building, Earth-Sci. Rev., 178, 279–309, https://doi.org/10.1016/j.earscirev.2017.11.025, 2018.
Isacks, B. L.: Uplift of the central Andean plateau and bending of the Bolivian orocline, J. Geophys. Res.-Sol. Ea., 93, 3211–3231, https://doi.org/10.1029/JB093iB04p03211, 1988.
Jaillard, E., Hérail, G., Monfret, T., Diaz-Martinez, E., Baby, P., Lavenu, A., and Dumont, J. F.: Tectonic evolution of the Andes of Ecuador, Peru, Bolivia and northern Chile, in: Tectonic evolution of South America, edited by: Cordani, U. G., Milani, E. J., Thomaz Filho, A., and Campos, D. A., Rio de Janeiro, Brazil, 481–559, 2000.
Kley, J. and Monaldi, C. R.: Tectonic shortening and crustal thickness in the Central Andes: How good is the correlation?, Geology, 26, 723–726, https://doi.org/10.1130/0091-7613(1998)026<0723:TSACTI>2.3.CO;2, 1998.
Labbé, N., García, M., Simicic, Y., Contreras-Reyes, E., Charrier, R., De Pascale, G., and Arriagada, C.: Sediment fill geometry and structural control of the Pampa del Tamarugal basin, northern Chile, GSA Bulletin, 131, 155–174, https://doi.org/10.1130/B31722.1, 2019.
Lamb, S.: Did shortening in thick crust cause rapid Late Cenozoic uplift in the northern Bolivian Andes?, J. Geol. Soc., 168, 1079–1092, https://doi.org/10.1144/0016-76492011-008, 2011.
Lamb, S.: Cenozoic uplift of the Central Andes in northern Chile and Bolivia–reconciling paleoaltimetry with the geological evolution, Can. J. Earth Sci., 53, 1227–1245, https://doi.org/10.1139/cjes-2015-0071, 2016.
Lucassen, F., Becchio, R., Wilke, H., Franz, G., Thirlwall, M., Viramonte, J., and Wemmer, K.: Proterozoic–Paleozoic development of the basement of the Central Andes (18–26∘ S)–a mobile belt of the South American craton, J. S. Am. Earth Sci., 13, 697–715, https://doi.org/10.1016/S0895-9811(00)00057-2, 2000.
Maksaev, V. and Zentilli, M.: Fission track thermochronology of the Domeyko Cordillera, Northern Chile: implications for Andean tectonics and porphyry copper metallogenesis, Explor. Min. Geol., 8, 65–89, 1999.
Martinez, F., Fuentes, G., Perroud, S., and Bascuñan, S.: Buried thrust belt front of the western Central Andes of northern Chile: Style, age, and relationship with basement heterogeneities, J. Struct. Geol., 147, 104337, https://doi.org/10.1016/j.jsg.2021.104337, 2021.
McQuarrie, N.: The kinematic history of the central Andean fold-thrust belt, Bolivia: Implications for building a high plateau, Geological Society of America Bulletin, 114, 950–963, https://doi.org/10.1130/0016-7606(2002)114<0950:TKHOTC>2.0.CO;2, 2002.
McQuarrie, N., Horton, B. K., Zandt, G., Beck, S., and DeCelles, P. G.: Lithospheric evolution of the Andean fold–thrust belt, Bolivia, and the origin of the central Andean plateau, Tectonophysics, 399, 15–37, https://doi.org/10.1016/j.tecto.2004.12.013, 2005.
Mitra, S.: Structural models of faulted detachment folds, AAPG Bull., 86, 1673–1694, https://doi.org/10.1306/61EEDD3C-173E-11D7-8645000102C1865D, 2002.
Mpodozis, C., Ramos, V., Ericksen, G., Cañas Pinochet, M., and Reinemund, J.: The Andes of Chile and Argentina, in: Geology of the Andes and its Relation to Hydrocarbon and Mineral Resources, edited by: Ericksen, G. E., Canas Pinochet, M. T., and Reinemund, J. A., Earth Sciences Series, Circum-Pacific Council for Energy and Mineral Resources Houston, Texas, 59–90, 1989.
Muñoz, N. and Charrier, R.: Uplift of the western border of the Altiplano on a west-vergent thrust system, northern Chile, J. S. Am. Earth Sci., 9, 171–181, https://doi.org/10.1016/0895-9811(96)00004-1, 1996.
Norabuena, E., Leffler-Griffin, L., Mao, A., Dixon, T., Stein, S., Sacks, I. S., Ocola, L., and Ellis, M.: Space geodetic observations of Nazca-South America convergence across the central Andes, Science, 279, 358–362, https://doi.org/10.1126/science.279.5349.358, 1998.
Oncken, O., Hindle, D., Kley, J., Elger, K., Victor, P., and Schemmann, K.: Deformation of the central Andean upper plate system–Facts, fiction, and constraints for plateau models, in: The Andes – Active subduction orogeny, edited by: Oncken, O., Chong, G., Franz, G., Giese, P., Götze, H.-J., Ramos, V. A., Strecker, M. R., and Wigger, P., Frontiers in Earth Sciences, Springer, Berlin, Germany, 3–27, https://doi.org/10.1007/978-3-540-48684-8_1, 2006.
Pardo-Casas, F. and Molnar, P.: Relative motion of the Nazca (Farallon) and South American plates since Late Cretaceous time, Tectonics, 6, 233–248, https://doi.org/10.1029/TC006i003p00233, 1987.
Puigdomenech, C., Somoza, R., Tomlinson, A., and Renda, E.: Paleomagnetic data from the Precordillera of northern Chile: A multiphase rotation history related to a multiphase deformational history, Tectonophysics, 791, 228569, https://doi.org/10.1016/j.tecto.2020.228569, 2020.
Ramos, V. A.: Late Proterozoic-early Paleozoic of South America-a collisional history, Episodes Journal of International Geoscience, 11, 168–174, 1988.
Rapela, C., Pankhurst, R. J., Casquet, C., Baldo, E., Saavedra, J., and Galindo, C.: Early evolution of the Proto-Andean margin of South America, Geology, 26, 707–710, https://doi.org/10.1130/0091-7613(1998)026<0707:EEOTPA>2.3.CO;2, 1998.
Reiners, P. W., Thomson, S. N., Vernon, A., Willett, S. D., Zattin, M., Einhorn, J., Gehrels, G., Quade, J., Pearson, D., and Murray, K. E.: Low-temperature thermochronologic trends across the central Andes, 21 S–28 S, in: Geodynamics of a Cordilleran Orogenic System: The Central Andes of Argentina and Northern Chile, edited by: DeCelles, P. G., Ducea, M. N., Carrapa, B., and Kapp, P. A., Memoir, Geological Society of America, 212, 215–249, https://doi.org/10.1130/2015.1212(12), 2015.
Reutter, K.-J., Scheuber, E., and Chong, G.: The Precordilleran fault system of Chuquicamata, northern Chile: Evidence for reversals along arc-parallel strike-slip faults, Tectonophysics, 259, 213–228, https://doi.org/10.1016/0040-1951(95)00109-3, 1996.
Riesner, M., Lacassin, R., Simoes, M., Armijo, R., Rauld, R., and Vargas, G.: Kinematics of the active West Andean fold-and-thrust belt (Central Chile): structure and long-term shortening rate, Tectonics, 36, 287–303, https://doi.org/10.1002/2016TC004269, 2017.
Riesner, M., Lacassin, R., Simoes, M., Carrizo, D., and Armijo, R.: Revisiting the crustal structure and kinematics of the Central Andes at 33.5∘ S: implications for the mechanics of Andean mountain-building, Tectonics, 1347–1375, https://doi.org/10.1002/2017TC004513, 2018.
Rosu, A.-M., Pierrot-Deseilligny, M., Delorme, A., Binet, R., and Klinger, Y.: Measurement of ground displacement from optical satellite image correlation using the free open-source software MicMac, ISPRS J. Photogramm., 100, 48–59, https://doi.org/10.1016/j.isprsjprs.2014.03.002, 2014.
Rupnik, E., Pierrot-Deseilligny, M., Delorme, A., and Klinger, Y.: Refined satellite image orientation in the free open-source photogrammetric tools Apero/Micmac, ISPRS Annals of Photogrammetry, Remote Sensing and Spatial Information Sciences, 3, 83–90, https://doi.org/10.5194/isprs-annals-III-1-83-2016, 2016.
SERNAGEOMIN: Mapa Geológico de Chile: versión digital, Servicio Nacional de Geología y Minería, Publicación Geológica Digital, Santiago, Chile, 2003.
Sheffels, B. M.: Lower bound on the amount of crustal shortening, in the central Bolivian Andes, Geology, 18, 812–815, https://doi.org/10.1130/0091-7613(1990)018<0812:LBOTAO>2.3.CO;2, 1990.
Skarmeta, M. J. and Marinovic, S. N.: Geologia de la hoja Quillagua: Region de Antofagasta, escala 1:250.000, Instituto de Investigaciones Geologicas (Chile), Carta Geologica de Chile, 1981.
Steinmann, G.: Geologie von Peru, J. Geol., 38, 190, https://doi.org/10.1086/623704, 1930.
Suppe, J.: Geometry and kinematics of fault-bend folding, Am. J. Sci., 283, 684–721, 1983.
Tassara, A., Götze, H.-J., Schmidt, S., and Hackney, R.: Three-dimensional density model of the Nazca plate and the Andean continental margin, J. Geophys. Res.-Sol. Ea., 111, B09404, https://doi.org/10.1029/2005JB003976, 2006.
Tomlinson, A. J. and Blanco, N.: Structural evolution and displacement history of the West Fault System, Precordillera, Chile: Part 2, postmineral history, VIII Congreso Geoloìgico Chileno, Antofagasta, Chile, 13–17 October 1997, 1878–1882,, 1997a.
Tomlinson, A. J. and Blanco, N.: Structural evolution and displacement history of the West Fault system, Precordillera, Chile: Part 1, synmineral history, VIII Congreso Geoloìgico Chileno, Antofagasta, Chile, 13–17 October 1997, 1873–1877,, 1997b.
Tomlinson, A. J., Blanco, N., Maksaev, V., Dilles, J., Grunder, A. L., and Ladino, M.: Geología de la Precordillera Andina de Quebrada Blanca e Chuquicamata, Regiones I y II (20∘ 30' – 22∘ 30'S), Servicio Nacional de Geología y Minería, Santiago, Chile, 444, 2001.
Tomlinson, A. J., Blanco, N., and Ladino, M.: Carta Mamiña, Región de Tarapacá, Servicio Nacional de Geología y Minería, Serie Geología Básica, 2015.
Vergara, H. and Thomas, A.: Hoja Collacagua: región de Tarapaca: carta geológica de Chile 1: 250.000, Servicio Nacional de Geología y Minería, 1984.
Victor, P., Oncken, O., and Glodny, J.: Uplift of the western Altiplano plateau: Evidence from the Precordillera between 20∘ and 21∘ S (northern Chile), Tectonics, 23, TC4004, https://doi.org/10.1029/2003TC001519, 2004.
Wölbern, I., Heit, B., Yuan, X., Asch, G., Kind, R., Viramonte, J., Tawackoli, S., and Wilke, H.: Receiver function images from the Moho and the slab beneath the Altiplano and Puna plateaus in the Central Andes, Geophys. J. Int., 177, 296–308, https://doi.org/10.1111/j.1365-246X.2008.04075.x, 2009.
Yuan, X., Sobolev, S. V., Kind, R., Oncken, O., Bock, G., Asch, G., Schurr, B., Graeber, F., Rudloff, A., Hanka, W., Wylegalla, K., Tibi, R., Haberland, C., Rietbrock, A., Giese, P., Wigger, P., Röwer, P., Zandt, G., Beck, S., Wallace, T., Pardo, M., and Comte, D.: Subduction and collision processes in the Central Andes constrained by converted seismic phases, Nature, 408, 958–961, https://doi.org/10.1038/35050073, 2000.
Zandt, G., Velasco, A. A., and Beck, S. L.: Composition and thickness of the southern Altiplano crust, Bolivia, Geology, 22, 1003–1006, https://doi.org/10.1130/0091-7613(1994)022<1003:Catots>2.3.Co;2, 1994.
Zehnder, A. T. and Allmendinger, R. W.: Velocity field for the trishear model, J. Struct. Geol., 22, 1009–1014, https://doi.org/10.1016/S0191-8141(00)00037-7, 2000.
- Abstract
- Introduction
- Geological context of the Central Andes (∼20–22∘ S)
- Data and methods
- Basement thrust and deformed Mesozoic series at Pinchal (∼21∘30′ S)
- Structure of the folded Mesozoic series at the Quebrada Blanca (∼20∘45′ S)
- Kinematics of shortening of the Pinchal and Quebrada Blanca areas
- Discussion
- Conclusions
- Data availability
- Author contributions
- Competing interests
- Disclaimer
- Acknowledgements
- Financial support
- Review statement
- References
- Supplement