the Creative Commons Attribution 4.0 License.
the Creative Commons Attribution 4.0 License.
 | 13 Apr 2023
Tectonic interactions during rift linkage: insights from analog and numerical experiments
Timothy Chris Schmid
Sascha Brune
Anne Glerum
Guido Schreurs
Continental rifts evolve by linkage and interaction of adjacent individual segments. As rift segments propagate, they can cause notable re-orientation of the local stress field so that stress orientations deviate from the regional trend. In return, this stress re-orientation can feed back on progressive deformation and may ultimately deflect propagating rift segments in an unexpected way. Here, we employ numerical and analog experiments of continental rifting to investigate the interaction between stress re-orientation and segment linkage. Both model types employ crustal-scale two-layer setups wherein pre-existing linear heterogeneities are introduced by mechanical weak seeds. We test various seed configurations to investigate the effect of (i) two competing rift segments that propagate unilaterally, (ii) linkage of two opposingly propagating rift segments, and (iii) the combination of these configurations on stress re-orientation and rift linkage. Both the analog and numerical models show counterintuitive rift deflection of two sub-parallel propagating rift segments competing for linkage with an opposingly propagating segment. The deflection pattern can be explained by means of stress analysis in numerical experiments wherein stress re-orientation occurs locally and propagates across the model domain as rift segments propagate. Major stress re-orientations may occur locally, which means that faults and rift segment trends do not necessarily align perpendicularly to far-field extension directions. Our results show that strain localization and stress re-orientation are closely linked, mutually influence each other, and may be an important factor for rift deflection among competing rift segments as observed in nature.
- Article
(13222 KB) - Full-text XML
-
Supplement
(10179 KB) - BibTeX
- EndNote


Continental rifting involves brittle faulting and the formation of subsiding rift basins. In places where individual rift segments are in proximity, they may interact and link when segments propagate and the rift system matures (Morley et al., 1990; Nelson et al., 1992; Rosendahl, 1987). The propagation and linkage of formerly isolated rift segments resemble the propagation and interaction of extension fractures on a micro-scale (e.g., Childs et al., 1995; Willemse, 1997; Willemse et al., 1996; Fig. 1a). Indeed, analytical solutions and models have been used to describe crack growth and to predict its direction (e.g., Macdonald and Fox, 1983; Mills, 1981). Such cracks occur in a variety of materials over a vast order of magnitude in length scale from micro-scale cracks in glass to kilometer-scale ridge interaction structures in oceanic crust (Pollard and Aydin, 1984; Fig. 1a).
Propagation and interaction of individual rift segments occur in continental rift systems at various styles and scales (Fig. 1b) and have been intensively studied over the years. The East African Rift System (EARS) constitutes a narrow rift with an eastern branch and western branch that propagate southward and northward, respectively (EARS; e.g., Ebinger et al., 2000; Morley et al., 1990; Nelson et al., 1992; Bonini et al., 2005; Bosworth, 1985; Brune et al., 2017; Corti et al., 2019; Glerum et al., 2020; Heilman et al., 2019; Koehn et al., 2008; Kolawole et al., 2018), comprising different sub-parallel deformed regions (inset Fig. 1c). On a smaller scale, interaction of segmented grabens has been studied, for example, in the Canyonlands National Park, Utah, a part of the Basin and Range wide rift (Allken et al., 2013; Trudgill, 2002; Schultz-Ela and Walsh, 2002), where various styles of graben interaction are attributed to the underlying strata (e.g., salt layer) or pre-existing weaknesses (Fig. 1d).

Figure 1Similar linkage structures occurring at a vast range of spatial scales. (a) Propagation and linkage of segments at different scales from micro-cracks in glass to linkage of oceanic ridge segments. Redrawn after Pollard and Aydin (1984). (b) Rift interaction types investigated in this study. (c) Rukwa Rift and Malawi Rift along the western branch of the East African Rift System (EARS; inset). The two basins link obliquely via the Karonga Basin and form an i-type interaction zone. Rift axis redrawn after Kolawole et al. (2021). WB: western branch; EB: eastern branch of the EARS. (d) Rift-related linked graben structures in the Canyonlands National Park, USA. Red rectangles mark areas with distinct interaction geometries (v, i, and y geometries; see b and text for detail). Redrawn after Allken et al. (2013).
Structural inheritance is thought to control nucleation and strain distribution along newly formed normal faults, as weak fabrics can precondition and weaken a heterogenous upper crust (e.g., Collanega et al., 2018; Heilman et al., 2019; Kolawole et al., 2018; Morley, 2010, 1999; Kolawole et al., 2021; Morley et al., 2004). Pre-existing weak fabrics may appear as large shear zones (Daly et al., 1989), suture zones along adjacent basement terranes (Corti, 2012; Corti et al., 2007), or upper crustal fabrics. Resulting rift structures may form as initially isolated segments that propagate along-strike, interact, and evolve into continuous zones of deformation as they link (Nelson et al., 1992). Rift segments link through previously un-rifted interaction zones, resulting in a characteristic geometry that persists during later rift stages (Nelson et al., 1992).
Recent strain accommodation in the Rukwa–northern Malawi segment of the western branch of the EARS (Fig. 1c) shows dominant dip-slip faulting parallel to the border faults (Kolawole et al., 2018; Morley, 2010) driven by the reactivation of pre-existing basement fabrics (Heilman et al., 2019). There, the concentration of seismicity in the SE and NW of the Rukwa and northern Malawi Rift, respectively, suggests subsequent propagation and linkage of the rift segments with a flip in the boundary fault polarity near the interaction zone (Heilman et al., 2019, and references therein).
Pre-existing structures as well as fault interaction across multiple scales disturb the regional stress orientation (Morley, 2010; Oliva et al., 2022). In return, stress re-orientations within and adjacent to rift segments influence the style of progressive deformation. Ultimately, stress re-orientation may even favor pure dip-slip behavior even for extensional faults with an oblique orientation to the regional extension (e.g., Morley, 2010; Corti et al., 2013; Morley, 2017; Philippon et al., 2015). This interplay between pre-existing structures and local re-orientation of the regional stress field affects how propagating rift segments interact. Under favorable conditions, it may even cause deflection of propagating rift segments (Nelson et al., 1992).
Rift propagation and segment interaction have been investigated by analog modeling studies that examined linkage of two segments across a transfer zone (e.g., Zwaan et al., 2016; Zwaan and Schreurs, 2017; Corti, 2012; Acocella et al., 1999; Bellahsen and Daniel, 2005). Bellahsen and Daniel (2005) studied the control of existing faults on new fault growth under multiphase extension. They suggested that pre-existing faults may disturb the local stress field and impede linkage of newly forming faults, which also occurs in natural examples of multiphase extension (Duffy et al., 2015). Such stress deflections due to the vicinity of pre-existing faults have been reported and studied in natural settings such as the northern Malay Basin, Thailand, (Tingay et al., 2006, 2010). While analog experiments are an effective tool to simulate mechanical (brittle and ductile) deformation processes, accessing information about stresses is challenging. In contrast, numerical modeling experiments provide direct access to element-wise stress tensors that can be interpreted in terms of stress regimes and orientations under extension (Brune and Autin, 2013; Duclaux et al., 2020). Despite the impact of stress distribution on faulting and rift segment interaction, only recently have numerical studies made use of it to gain further insights into rift evolution and continental break-up (e.g., Glerum et al., 2020; Mondy et al., 2018). However, these studies mostly focus on larger-scale deformation to evaluate stresses over the entire time span of rifting up to continental break-up.
Here we use crustal-scale analog and numerical models to investigate rift propagation and strain localization in early rifting stages when rift segments interact. Both types of models document enigmatic rift segment deflection when two sub-parallel rift segments propagate approximately in the same direction and compete for linkage with an opposingly propagating segment. To understand the reason for rift segment deflection, we analyze the stress distribution in early rifting stages and its interplay with strain localization that initiates above pre-existing structures. Our experiments show that relatively simple rift segment interactions can cause locally complex stress patterns that deviate from the regional stress field. Such stress re-orientations occur in transient stages and can change over time and with progressive deformation due to changes in material strengths.
The presented analog modeling experiment shows unexpected features such as rift deflection. It motivates our numerical study, and we use the analog model as a reference for examining strain and stress distribution in numerical experiments.
2.1 Analog model setup
For the analog reference model, we use a simplified two-layer crustal-scale setup with a brittle and a viscous material to simulate upper crustal brittle faulting and lower crustal viscous deformation, respectively. The base of the model consists of a set of alternating plexiglass and foam bars which are compressed prior to the model preparation by two mobile sidewalls (Fig. 2a). During the experiment the computer-controlled sidewalls extend and provide a symmetric velocity gradient as the model base expands and the model vertically thins. For monitoring the surface deformation evolution, we use a stereoscopic camera setup to take top-view photos and stereo image pairs every 60 s for quantitative deformation analysis by means of 3D stereo digital image correlation (DIC) (Adam et al., 2005). The model was scanned every 20 min in a medical X-ray computed tomography scanner to gain insights on internal model evolution.

Figure 2Analog modeling setup. (a) Top view of the experimental apparatus with two mobile sidewalls that extend orthogonally. The entire model comprises an area of 80×30 cm, and three viscous seeds are placed on top of the viscous layer before sieving in the brittle sand layer. The central model part where propagating rift segments interact contains no seeds. (b) Zoom-in of the seed configuration in the analyzed model area (i.e., 30×30 cm). The two competing seed segments form an intermediate angle of 50∘. The model center contains an area with a radius of 10 cm wherein weak seeds are absent. (c) Sketch of the model cross section. The model setup consists of a brittle sand layer representing the upper brittle crust on top of a viscous mixture of polydimethylsiloxane and corundum sand imitating the lower ductile crust.
2.2 Model geometry, rheological layering, and material properties
For simulating upper crustal deformation, we use dry quartz sand with a bulk density of 1560 kg m−3 and an internal friction coefficient of 0.72 (Schmid et al., 2020a). For the lower viscous model part, we use a quasi-Newtonian polydimethylsiloxane–corundum sand mixture (weight ratio 1:1) with bulk density of 1600 kg m−3 and a viscosity of ∼ 1×10⁵ Pa s (Zwaan et al., 2018). Hence, the brittle–viscous setup has a density gradient that avoids density instabilities and spontaneous upwelling of the viscous layer. The model features viscous rods placed on top of the viscous model layer before sieving in the quartz sand (Fig. 2). These rods act as mechanically weak seeds and localize faulting in the upper brittle model domain. The seed configuration used includes three individual seed segments. The model includes a y-seed configuration with one seed segment perpendicular to the extension direction on one side (hereafter called frontal segment), whereas on the opposing side two obliquely placed seeds (hereafter called rear segments) form an intermediate angle of 50∘ (Fig. 2; see also Fig. 1b, d). The three seed segments hypothetically merge at the model center. However, we exclude weak seeds in an area with a radius r=10 cm around the model center to allow free interaction of the propagating rift structures (Fig. 2b). The analog model comprises an initial area of 80 cm by 30 cm and has a total thickness of 6 cm (each layer 3 cm), which represents a 30 km thick continental crust. In accordance with the numerical setup, the effectively analyzed model area is restricted to 30×30 cm. The mobile sidewalls move with an extension velocity of 5 mm h−1 each (totaling 10 mm h−1), which results in a maximum extension of 40 mm at the final model stage after 4 h (Fig. 2c).
2.3 Analog model results
In the analog model three different rift segments initiate above the weak seeds and propagate toward each other. Thereby, the two rear segments compete for linkage with the frontal segment. After 30 min (i.e., 5 mm extension; Fig. 3(i)), brittle deformation localizes along two rift boundary faults forming the frontal rift segment. Rifting in the rear segments localizes first along right-dipping rift boundary faults, and after 60 min (i.e., 10 mm extension; Fig. 3(ii)) both rear segments develop a set of two conjugate rift boundary faults (Fig. 3a, b (ii)). Interestingly, instead of advancing straight forward, the fault tips deflect and propagate away from each other (Fig. 3b, d (ii)). This is partially due to the rift propagation over the area where no seeds are present where rifting perpendicular to the extension direction is favored. However, after 120 min (i.e., 20 mm extension; Fig. 3(iii)) rift tips deflect and turn away from one another. Rift tips deflect from an initially oblique orientation and rotate into an inverted oblique direction (with respect to the extension direction). The frontal and rear left rift segments propagate further and, as they approach one another, form an en echelon basin that convergently overlaps with the frontal rift segment (Morley et al., 1990; Fig. 3b, d (iii)). After 180 min (i.e., 30 mm extension; Fig. 3(iv)), intra-rift faults develop in the frontal and left rear rift segments. Note that strain rate is successively localized in the two fully linked rift segments, whereas the right rear segment experiences minor strain rate values (Fig. 3d (iv)). At the final model stage (i.e., after 240 min and 40 mm extension; Fig. 3(v)), the right rear segment propagated minimally with a rift tip turned away from the linked segments (Fig. 3b, d (v)). The fully linked frontal and left rear segments continuously accommodated displacement, resulting in deeper rift structures compared to the abandoned right rear segment (Fig. 3c, e (v)).
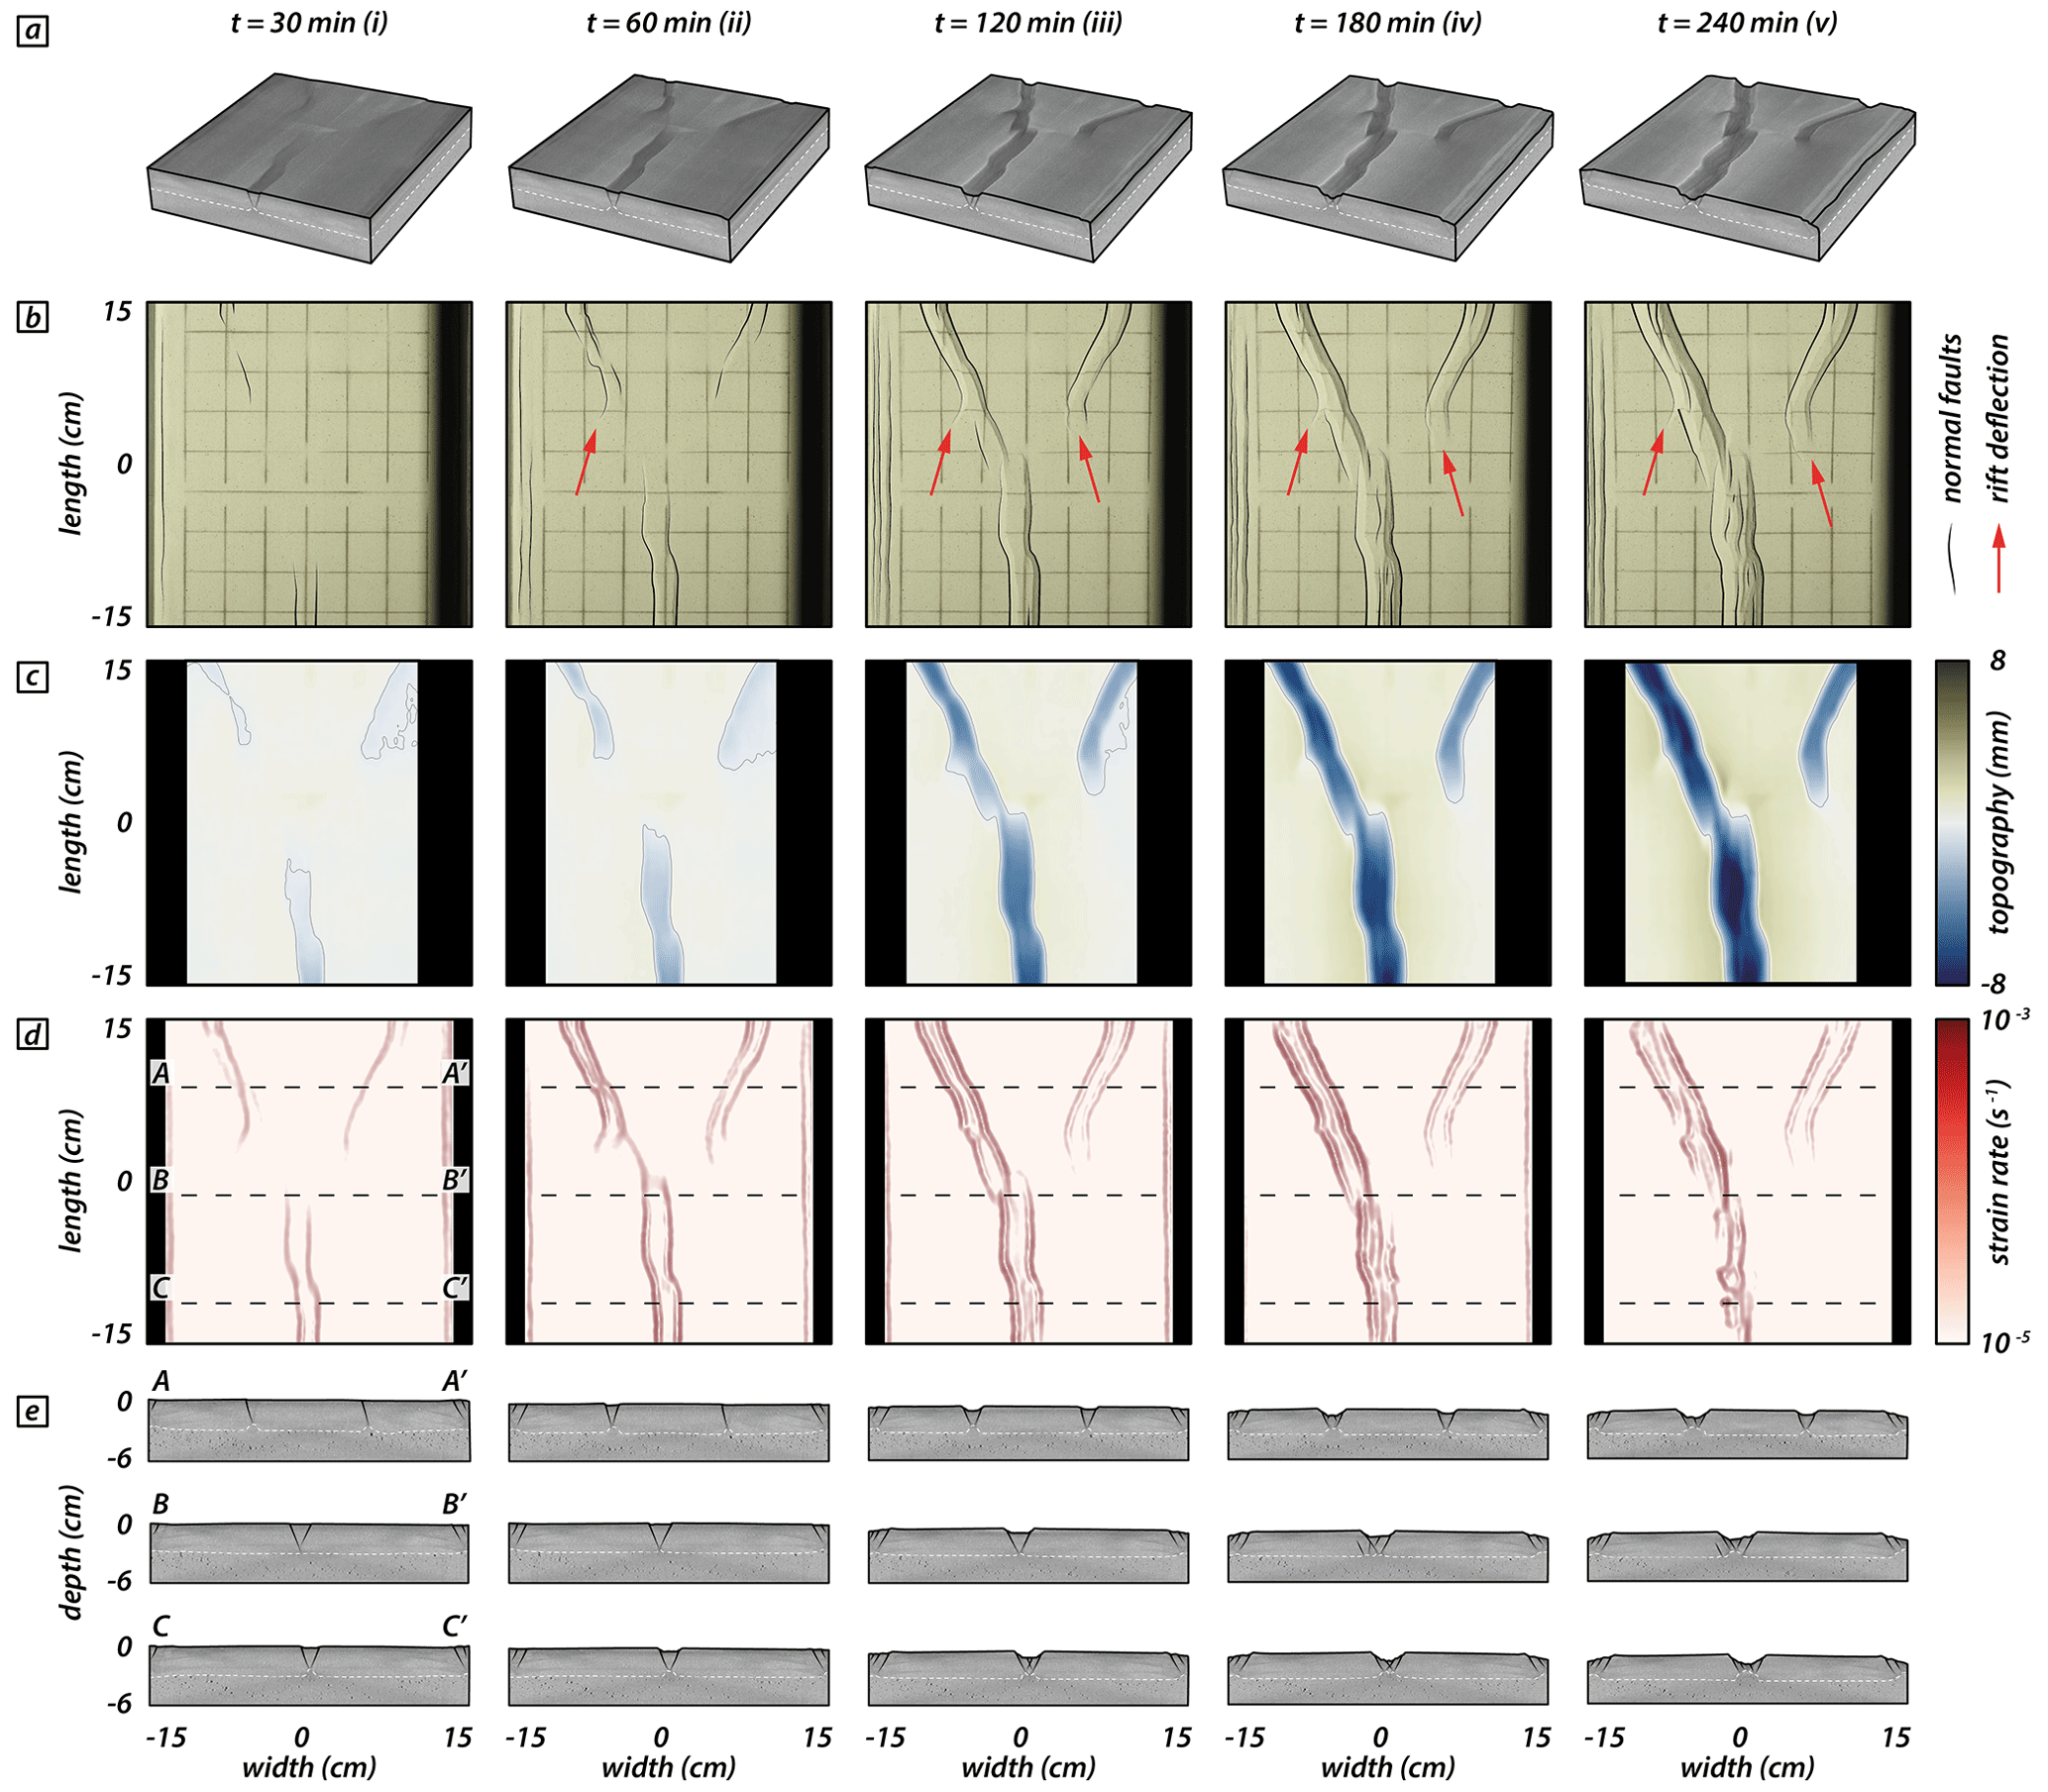
Figure 3Analog modeling results documenting deflection of the right rear segment and cessation of faulting activity. Distinct time steps (i.e., after 30 min and after every hour) show the model evolution. (a) X-ray computed tomography volumes of the investigated model domain at distinct time steps. White dashed lines indicate the brittle–viscous interface. (b) Top views and line drawings indicating observable normal faults at the model surface. Red arrows indicate rift tips that deflect and turn away from one another. (c) Topography from digital elevation models of the model surface. Color map from Crameri et al. (2020). (d) Strain rates obtained from 3D stereo DIC. Black dashed lines indicate positions of three transects through the X-ray computed tomography volume. (e) Rift transects A-A′, B-B′, and C-C′. White dashed lines indicate the brittle–viscous interface.
We perform a series of numerical models to investigate rift linkage interaction and to analyze occurring surface stresses. Similar to the analog experiment, the numerical model consists of a two-layer crustal setup with laterally homogenous material layers where boundary-orthogonal extension with constant velocity is applied.
3.1 Numerical model setup
We use the open-source, finite-element code ASPECT to solve the extended Boussinesq equations of momentum, mass, and energy in combination with advection equations for each compositional field (Gassmöller et al., 2018; Glerum et al., 2018; Heister et al., 2017; Kronbichler et al., 2012; Rose et al., 2017; Glerum et al., 2020). Since the numerical models are motivated by the analog model, the two setups are designed in a similar way. To this aim, we employ a numerical setup wherein the rheologies of upper and lower crust are brittle and ductile, respectively, and independent of temperature just like in the analog model. However, the numerical models operate on the true scales of the continental crust over tens of kilometers and millions of years, while the analog model is a scaled, centimeter-sized representation that evolves on an hour scale. Additionally, the numerical setup applies maximum extension velocities at the sidewalls and extension velocities at the base that linearly increase from the center towards the model boundaries. In contrast, maximum extension velocities at the sidewalls in the analog model are achieved via compression of a basal foam plexiglass setup (prior to the model run) that extends homogeneously during the model run.
The presented numerical experiments cover a rectangular cuboid domain of 150 km width and length in the horizontal x and y direction, respectively, and 30 km in depth along the vertical z axis (Fig. 4a). The entire model domain is divided into 1.53 million hexahedral, second-order elements. For the upper 15 km of the model, we use a cell resolution of 750 m, with an additional refinement at the uppermost kilometer, which yields near-surface elements with a resolution of 375 m. The grid resolution for the lower 15 km of the model is 1500 m. At the left and right model sides, we apply a symmetrically distributed outflow velocity of mm yr−1, resulting in a total extension velocity of 10 mm yr−1 (Fig. 4a, b). After a total model time of 4 Myr, the model has therefore experienced a total extension of 40 km. While Vx is prescribed at the left and right model sides, Vy and Vz are left free. We compensate for material loss through the side boundaries by compensational inflow at the model base (Fig. 4b). The front and back lateral boundaries allow for free slip, and the top of the model features a free surface boundary condition (Rose et al., 2017).
The model includes two rheological layers represented by compositional fields, namely a 15 km thick viscoplastic upper crust with a density of 2700 kg m−3 and a 15 km thick isoviscous lower crust with a density of 2900 kg m−3 and a constant viscosity of 1×10²⁰ Pa s. For the upper crust, the viscous viscosity is fixed to 2×1028 Pa s such that plastic deformation is always enabled. We introduce initial and dynamic mechanical weaknesses in the upper crust in two ways. (i) Mechanically weak seeds: at distinct positions near the brittle–ductile interface, the upper model layer is locally 10 % thinned and the lower model layer is elevated like the viscous weak seeds in the analog model setup. These mechanical seeds weaken the upper crustal strength and localize brittle faulting. Our experiments include three different seed configurations: v, i, and y (Fig. 4c; see also Fig. 1b, d); seeds within a central model area (i.e., r=100 km) are absent. For each configuration, the rear seeds form an intermediate angle of 10∘, 30∘, or 50∘. (ii) Friction softening: for each element, an initial plastic strain value of 0 (resulting in strong material) to 0.1 (weaker) is randomly assigned and reduces the maximum friction angle of 26.56∘ by a maximum of 10 %. This reflects the structural heterogeneity of natural settings and allows for more randomized strain patterns in the central model domain where the mechanical seeds are absent. The initial plastic strain noise is distributed over the entire model width with an amplitude following a Gaussian curve parallel to the extension direction that is repeated along the model length (y direction, Fig. 4d). During continuous extension, the effective friction angle is linearly reduced to 25 % of the maximum friction angle (i.e., to 6.64∘) for plastic strain between 0 and 1, while it remains constant at 6.64∘ for plastic strains >1 (Fig. 4e). This corresponds to a reduction of the effective friction coefficient from 0.5 to 0.12. The cohesion of the upper crust remains constant at 5×10⁶ Pa for all conducted experiments.
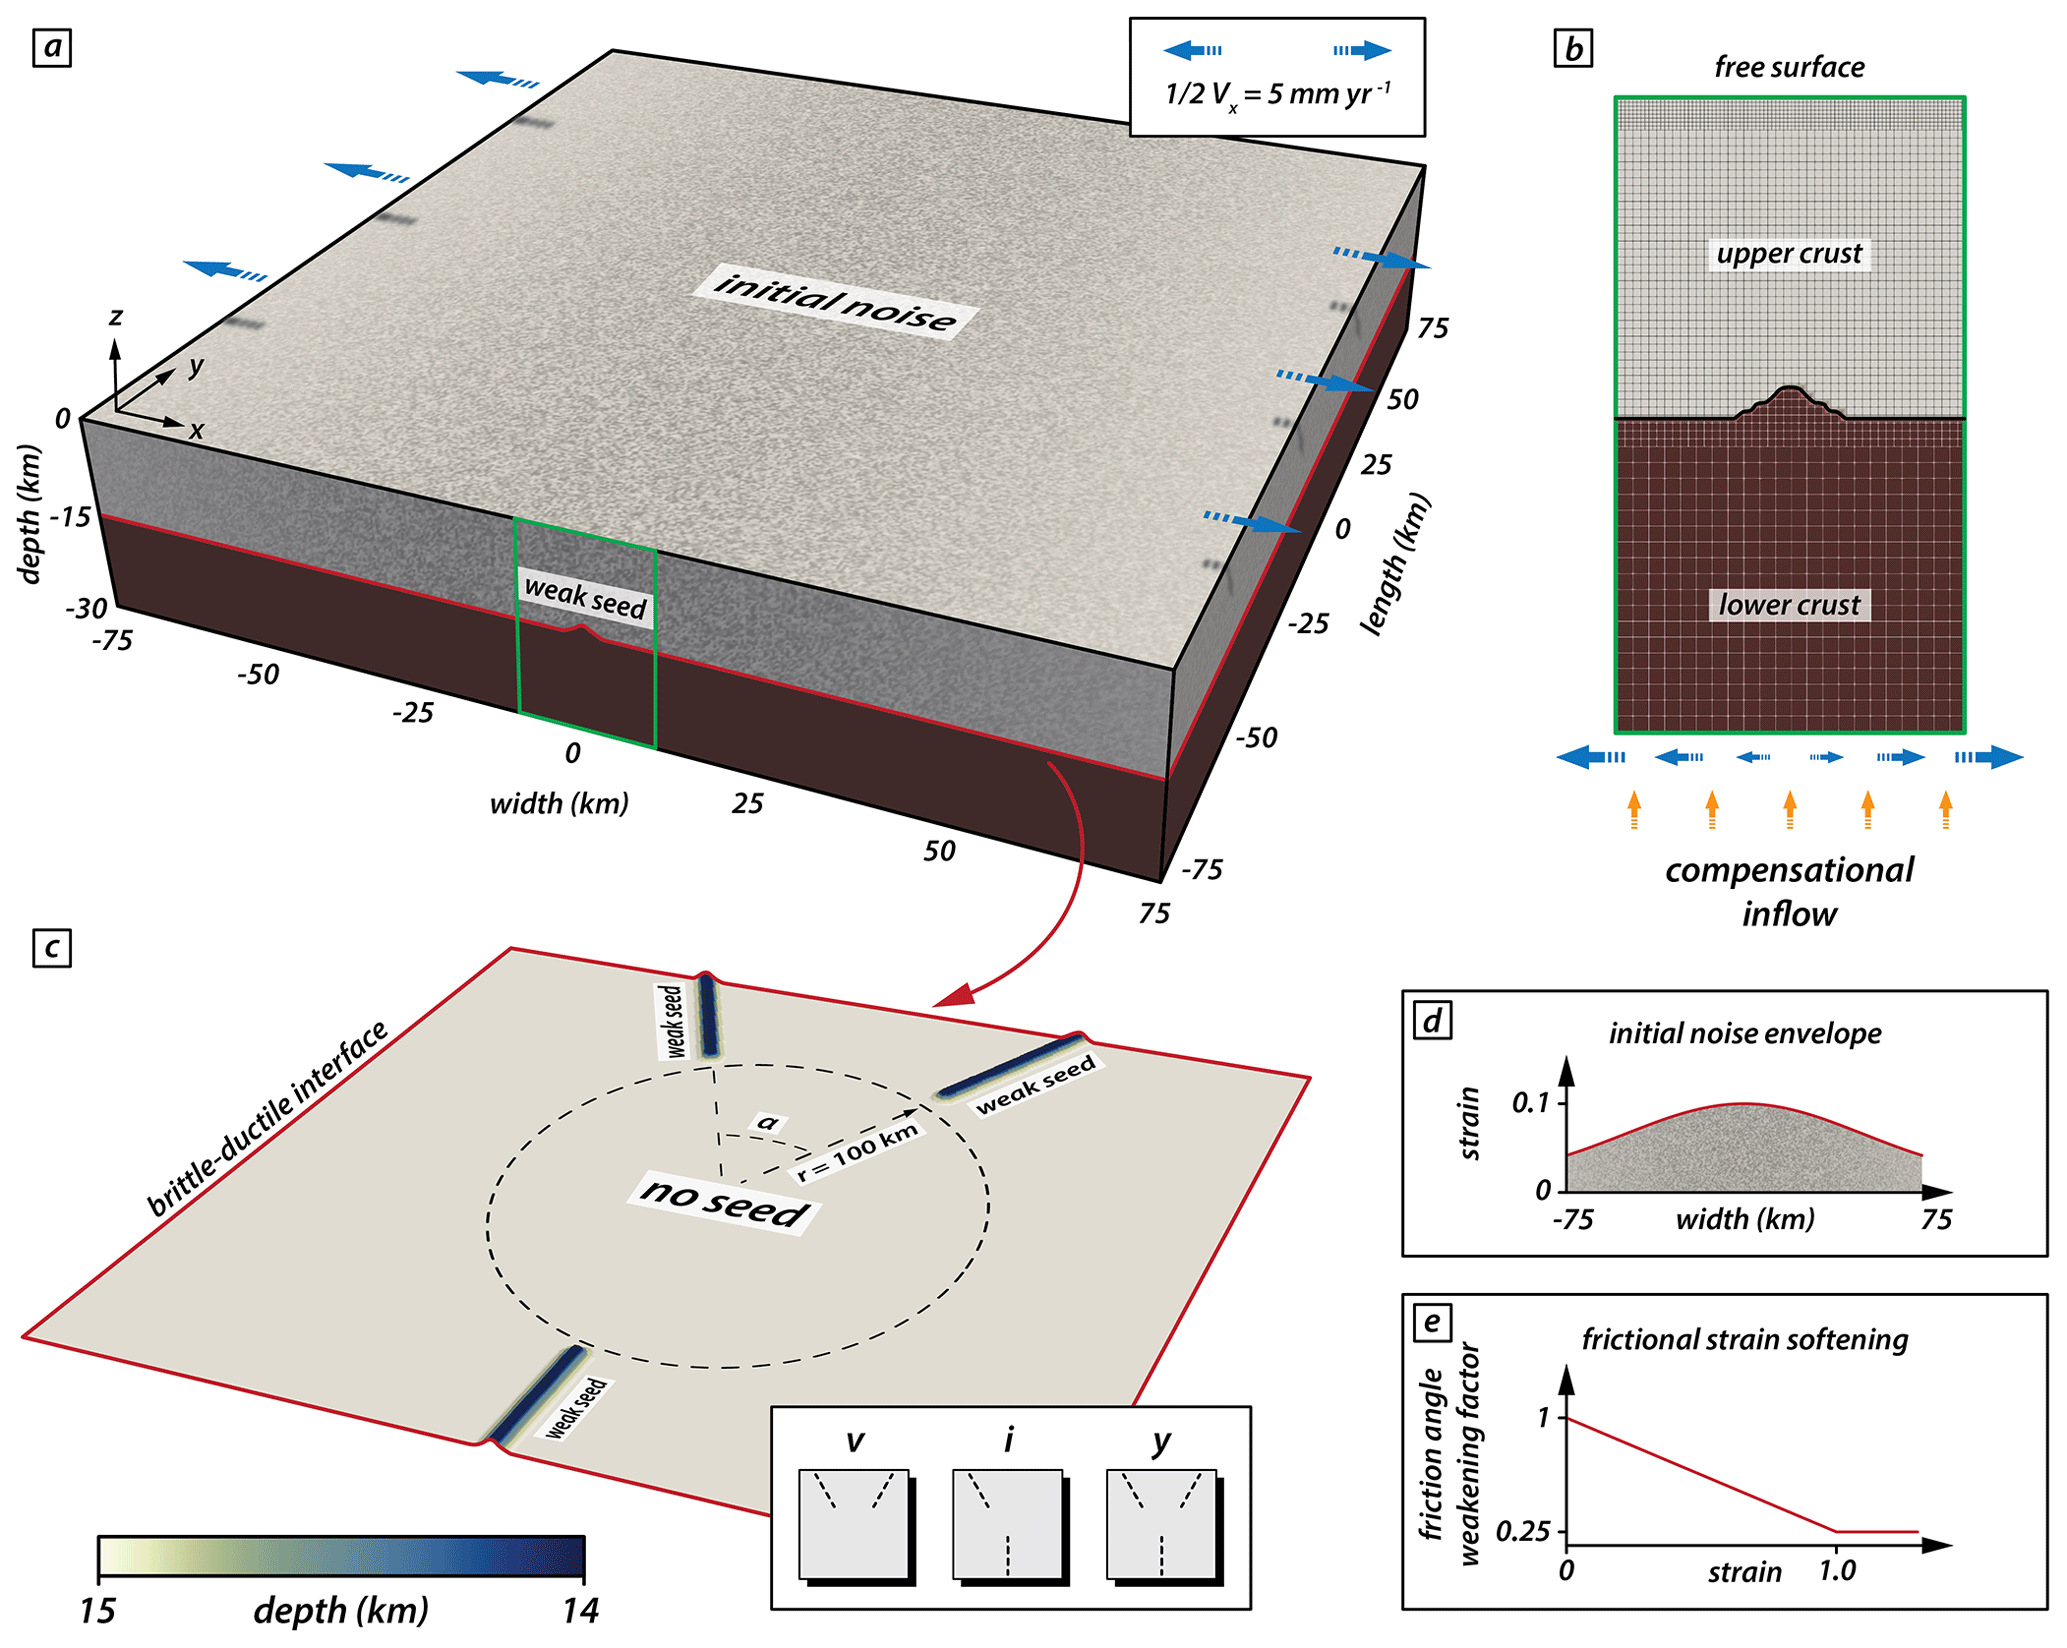
Figure 4Numerical model setup for isoviscous models. (a) The model domain comprises a volume of km. Blue arrows indicate the applied boundary-orthogonal extension. The green rectangle indicates the position of the zoom-in in panel (b). The red line indicates the initial depth of the brittle–ductile interface (as defined by the interface between the two rheological layers) indicated in (c). (b) Initial conditions and mesh refinement (arrows not to scale). (c) Position and configuration of the mechanical weak seeds at the brittle–ductile interface. The setup comprises an area with radius r=100 km wherein no weak seeds are present. Three different seed configurations refer to y, i, and v models (see text for details). Color map from Crameri et al. (2020). (d) Initial amplitude of strain along the x axis. The Gaussian distribution is constant along the y axis; also see the grey shading in (a). Note that while the strain amplitude follows a Gaussian distribution, the location of the initial strain is random. (e) Linear weakening with strain applied to the friction angle.
3.2 Model limitations
Just like the analog model (Sect. 2), our crustal-scale two-layer numerical setup does not comprise a lithospheric mantle layer and has no asthenosphere. Further, the isoviscous setup does not account for a temperature-dependent viscosity. However, we focus on an early rifting phase during which the influence of the deforming mantle lithosphere can be neglected. The crustal-scale setup strongly limits the computational effort for calculating deformation in 3D (Allken et al., 2011, 2012; Katzman et al., 1995; Zwaan et al., 2016), and hence our simplifications allow for a higher model resolution, which is a necessity to depict early stages of rifting and the coalescence of brittle deformation. Several alternative model runs have been performed including a temperature- and pressure-dependent viscosity. Those tests reproduced first-order features (i.e., strain rates, rift geometry, and stress distribution) of the presented models in this study, which further justified the choice of a simplified isoviscous setup. Note that we apply frictional softening as a function of strain within each cell. For simplicity, we do not include normalization accounting for cell size (Lavier et al., 2000) or viscoplastic regularization techniques (Duretz et al., 2019; Jacquey and Cacace, 2020). Moreover, our model does not include the influence of melting or magma intrusions or sedimentation and erosion.
3.3 Post-processing
Numerical models pose the advantage that they grant direct access to stress tensors of each individual cell. We exploit this opportunity by investigating surface stresses to deduct the stress regime and the effect of different seed configurations on stress distribution. ASPECT provides post-processors that calculate the magnitude and orientation of the maximum horizontal stresses and the regime stress ratio (RSR) (Glerum et al., 2020). This stress regime characterization is calculated according to the scheme of the World Stress Map (Zoback, 1992). The RSR value maps possible stress regimes to an interval between 0 and 3. For isotropic and homogenous materials, the standard rules of Andersonian faulting are applied (Anderson, 1905). For RSR values < 1, faulting occurs in an extensional stress regime, whereas for RSR values > 2 compressive stress regimes generate thrust faults. Strike-slip faults occur for values 1 ≥ RSR ≤ 2. We extract data for maximum horizontal compressive stress together with the stress regime and investigate them in areas where the strain rate exceeds a threshold of 10−16 s−1 and deformation occurs. For visualization, surface stresses from an originally unstructured grid are resampled on an equidistant grid.
3.4 General model evolution of the reference model
In this section we describe the numerical modeling results focusing particularly on the general evolution of our reference model with a y-seed configuration and an intermediate seed angle of 50∘ (Fig. 5). At the early stage (i.e., after 0.5 million years), three distinct rift segments develop above the initial seed positions bounded by a pair of conjugate rift boundary faults (Fig. 5a (i)). This early stage is characterized by a symmetric evolution of the two competing rear segments, which results in a symmetric subsidence inside the graben structures (Fig. 5b (i)). For each rift segment, faulting activity is localized along the rift boundary faults. In the central model domain, however, strain rates depict a more distributed deformation pattern with multiple minor faults (Fig. 5c (i)). Note that the two rear segments propagate and show curved fault segments that initially deflect and turn away from each other, resulting in rift segments with a curved geometry expressed in the topography (Fig. 5b (i)), similar to the rift evolution in the analog model. Once they overlap with the propagating frontal segment, faults symmetrically curve inwards and towards the frontal segment. The change from localized strain rates above the seeds to distributed strain rate patterns in the central model domain is best seen in transects (Fig. 5d (i)).
After the first million years, deformation has prominently localized along the left of the two rear segments and along the frontal segment (Fig. 5a, c, (ii)). While deformation in the frontal segment is localized along the rift boundary faults, inward migration occurred in the left rear segment with developing intra-rift faults and only the left-dipping rift boundary fault active. Similarly, the right rear segment shows faulting along the right-dipping rift boundary fault, but activity along intra-rift faults is lacking. In the central model domain, formerly distributed deformation localized between the frontal and left rear rift segment (Fig. 5d (ii)). While strain rates indicate a shift from a symmetric to an asymmetric deformation phase, topography is still symmetric, which implies that the shift is imminent and has not affected the topography after the first million years (Fig. 5b (ii)).
After 2 million years, deformation is entirely localized along the frontal and left rear segment. Only the right-dipping rift boundary fault of the frontal segment is active and inward migration led to a set of pervasive intra-rift faults (Fig. 5a, c (iii)). The left rear segment depicts a similar deformation pattern as in the previous step, but strain mainly accumulates along the left-dipping rift boundary fault, causing an asymmetric graben geometry (Fig. 5d (iii)). Note that, after 2 million years, fault activity along the right rear segment completely ceased with no further strain accumulation visible (Fig. 5a, c, d (iii)). The topography reflects this completed switch from a symmetric to an asymmetric deformation stage with enhanced subsidence along the frontal and left rear segments and their linkage throughout the central model domain (Fig. 5b (iii)).
With ongoing extension, deformation subsequently localizes along the axial rift zone that links the frontal and left rear segments (Fig. 5a, c, d (iv, v)), and faulting activity along rift boundary faults ceases. The linked structure reaches maximum depth inside the rift after 3 million years. After 4 million years, however, the basin experiences minor uplift due to increased upward motion of the underlying viscous material (Fig. 5d (iv, v)). Note that the basin depth of the right rear rift segment remains stable after 2 million years and does not experience further subsidence nor uplift.

Figure 5Modeling results of the reference model documenting cessation of fault activity along the right rear segment, while the left rear and frontal segments link. Distinct time steps show the model evolution. (a) Model box showing logarithmic strain rates (red) and plastic strain (black) in the brittle and viscous model domain. White dashed lines indicate the brittle–viscous interface. (b) Top views showing the model topography. Red arrows indicate rift tips that deflect and turn away from one another. Black lines refer to the zero-elevation height. Color map from Crameri et al. (2020). (c) Top views of the model showing strain rates (red) and corresponding plastic strain (black) at distinct model run times. White dashed lines correspond to the three rift transects A-A′, B-B′, and C-C′ in panel (d). (d) Rift axis perpendicular transects A-A′, B-B′, and C-C′ parallel to the extension direction.
3.5 Early localization patterns for v, i, and y seeds
To investigate the influence of different seed configurations, we compare v- (Fig. 6a–c), i- (Fig. 6d–f), and y-seed (Fig. 6g–i) configurations for different intermediate angles (i.e., 10, 30, and 50∘) at an early stage after 0.5 million years. The y- and i-seed configurations provide a setup wherein rift structures opposingly propagate towards the model center where rift linkage eventually occurs. In contrast, rift structures in the v-seed configuration propagate approximately in the same direction, which has a consequence for the overall strain rate distribution.
The early stage in v-seed experiments (Fig. 6a–c) is characterized by a zone of localized and distributed deformation in the rear and frontal part of the experiments, respectively. The transition from localized to distributed deformation occurs where the two competing rift segments deflect and rotate away from one another. Note that the fault deflection successively decreases towards the left and right model sides, where faults strike perpendicular to the extension direction. This is consistent with observations for experiments with a y-seed configuration. However, the two competing rear segments rotate back and eventually bend towards the propagating frontal segment (Fig. 6g–i).
For experiment with an i-seed configuration (Fig. 6d–f) two opposingly propagating rift branches form. Since the right rear segment is absent, both opposingly propagating rift segments link in the model center where deformation is distributed onto intra-rift faults. The overall strain rate field is localized, and no strain rate deflection occurs.
Models with a y-seed configuration (Fig. 6g–i) depict a strain rate pattern wherein deformation is localized along rift boundary faults at the model margins where seeds are present and a distributed en echelon strain rate pattern in the model center. Note that for the model with an intermediate angle of 10∘ the two competing rear segments are close enough, resulting in a zone wherein strain is localized along only one rift boundary fault per rift segment (i.e., outward-dipping faults with respect to the model box); these overlap and form a central graben with minor intra-rift faults. For larger intermediate angles, two individual rift segments (bounded by two rift boundary faults) form that propagate towards the model center. While the strain rate pattern due to the competing rear segments is identical for experiments with a y- and v-seed configuration, the additional frontal segment in experiments with a y-seed configuration causes localization of strain rates in a single rift branch bounded by two rift boundary faults. This contrasts with the v-seed configuration wherein strain rates in the frontal model domain occur that are distributed over the entire model domain (Fig. 6a–c).
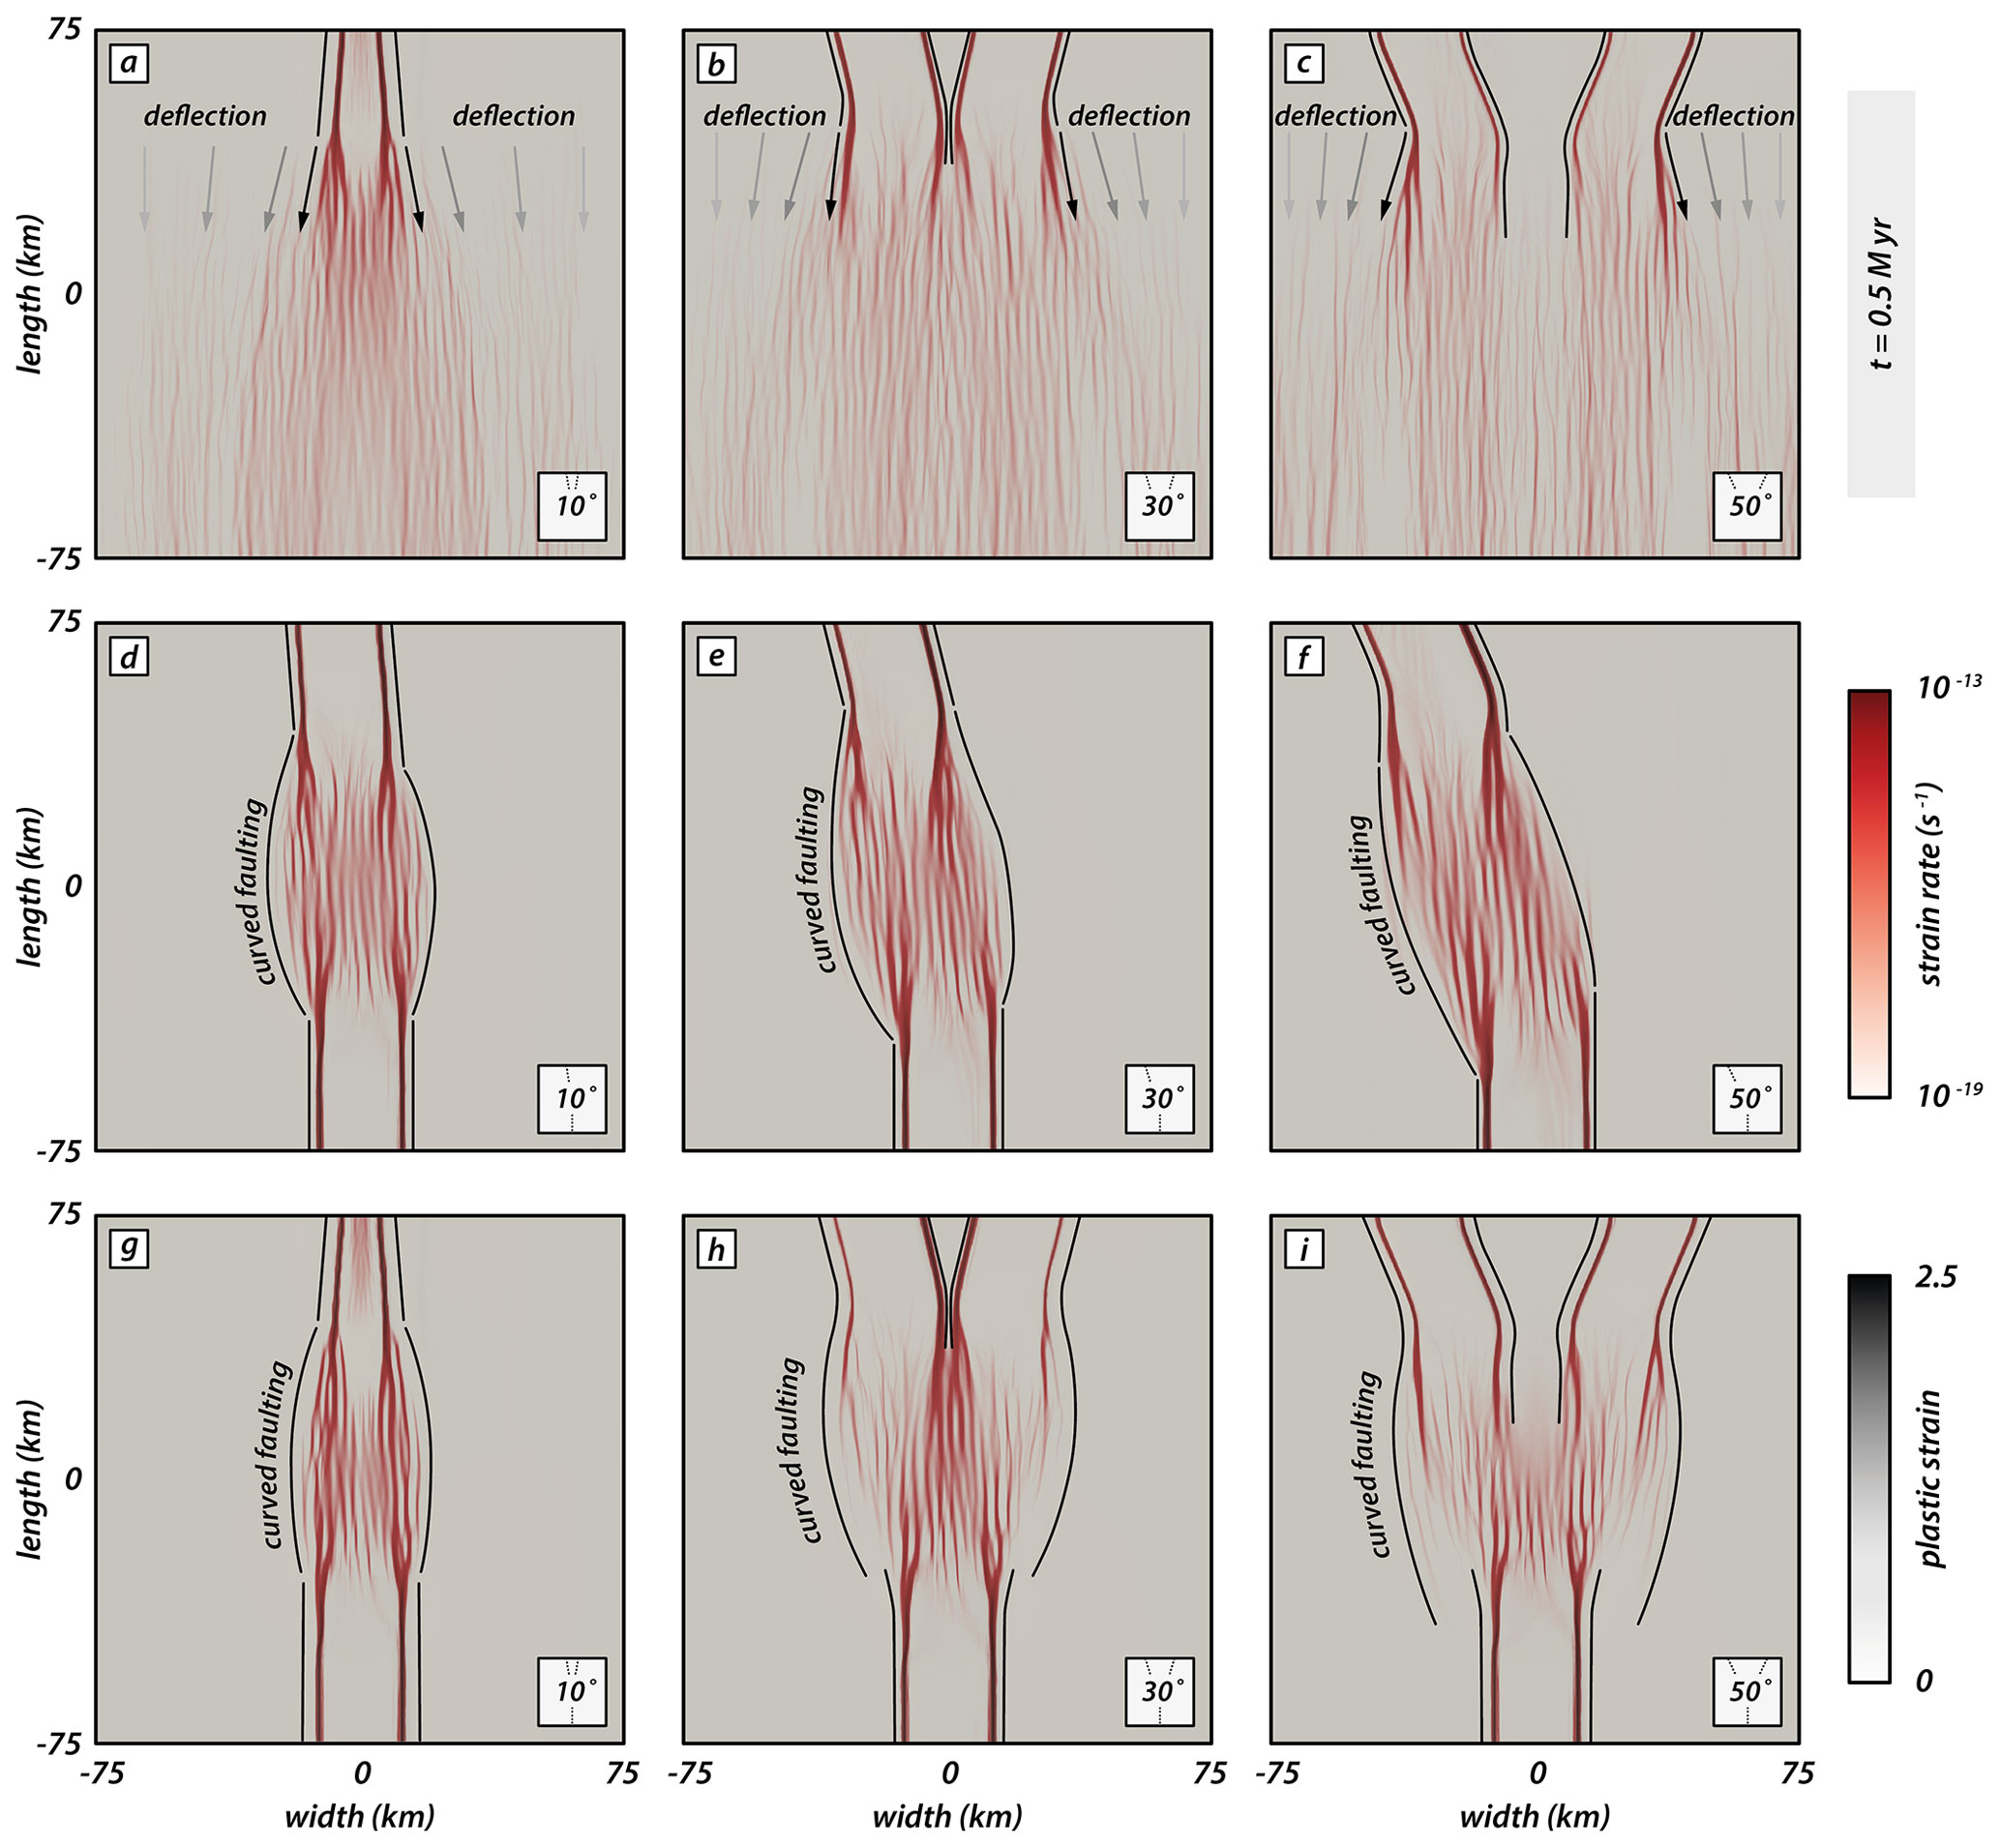
Figure 6Types of rift segment linkages depending on the seed configuration at an early phase after 0.5 million years. Model top views show strain rates (logarithmic) and plastic strain in red and black, respectively. (a–c) The v-seed configuration for intermediate angles of 10, 30, and 50∘. (d–f) The i-seed configuration for intermediate angles of 10, 30, and 50∘. (g–i) The y-seed configuration for intermediate angles of 10, 30, and 50∘ (reference model). Black lines confine deformed areas. For models with a v-seed configuration (a–c), competing rift segments deflect away from each other, resulting in a fan-shaped geometry. Note that fault strike successively re-orients into an orientation perpendicular to the extension direction towards the left and right model sides. Curved faulting occurs in models with an i- and y-seed configuration (d–j) wherein rift segments interact.
3.6 Final rift geometry and localization patterns for v, i, and y seeds
The final model stage after 4 million years best illustrates differences in rift geometry between the models with different seed geometry and an intermediate angle (Fig. 7). Rift deflection is clearly visible in v-seed models (Fig. 7a–c) and most prominent in experiments with a larger intermediate angle (Fig. 7b, c). Above the seeds, two short individual rift segments form bounded by a pair of conjugate rift boundary faults. However, as the rifts propagate towards the model center, strain is mainly accommodated along the boundary faults that dip towards the model center. Hence, the larger part of the model subsides uniformly and builds a broad rift zone confined by two large boundary faults. When the two rift segments propagate, they deflect and turn away from one another, resulting in a gradually wider rift. For intermediate angles of 30 and 50∘, both competing rift segments show active faulting along intra-rift faults in the rear model part, but a zone of continuous faulting activity has developed along the right side of the rift.
Models with an i-seed configuration show a continuous and straight rift geometry for all intermediate angles (Fig. 7d–f). For an intermediate angle of 10∘, the rift structure is nearly orthogonal with respect to the extension direction. Note that most plastic strain is accommodated along the left-dipping rift boundary fault (Fig. 7d). For larger intermediate angles, the rift subsequently experiences more segmentation with small left-stepping segments towards the rear model part (Fig. 7e, f). Strain accommodation occurs mainly on the right-dipping rift boundary fault for the frontal model part and switches to the left-dipping boundary fault in the rear model part.
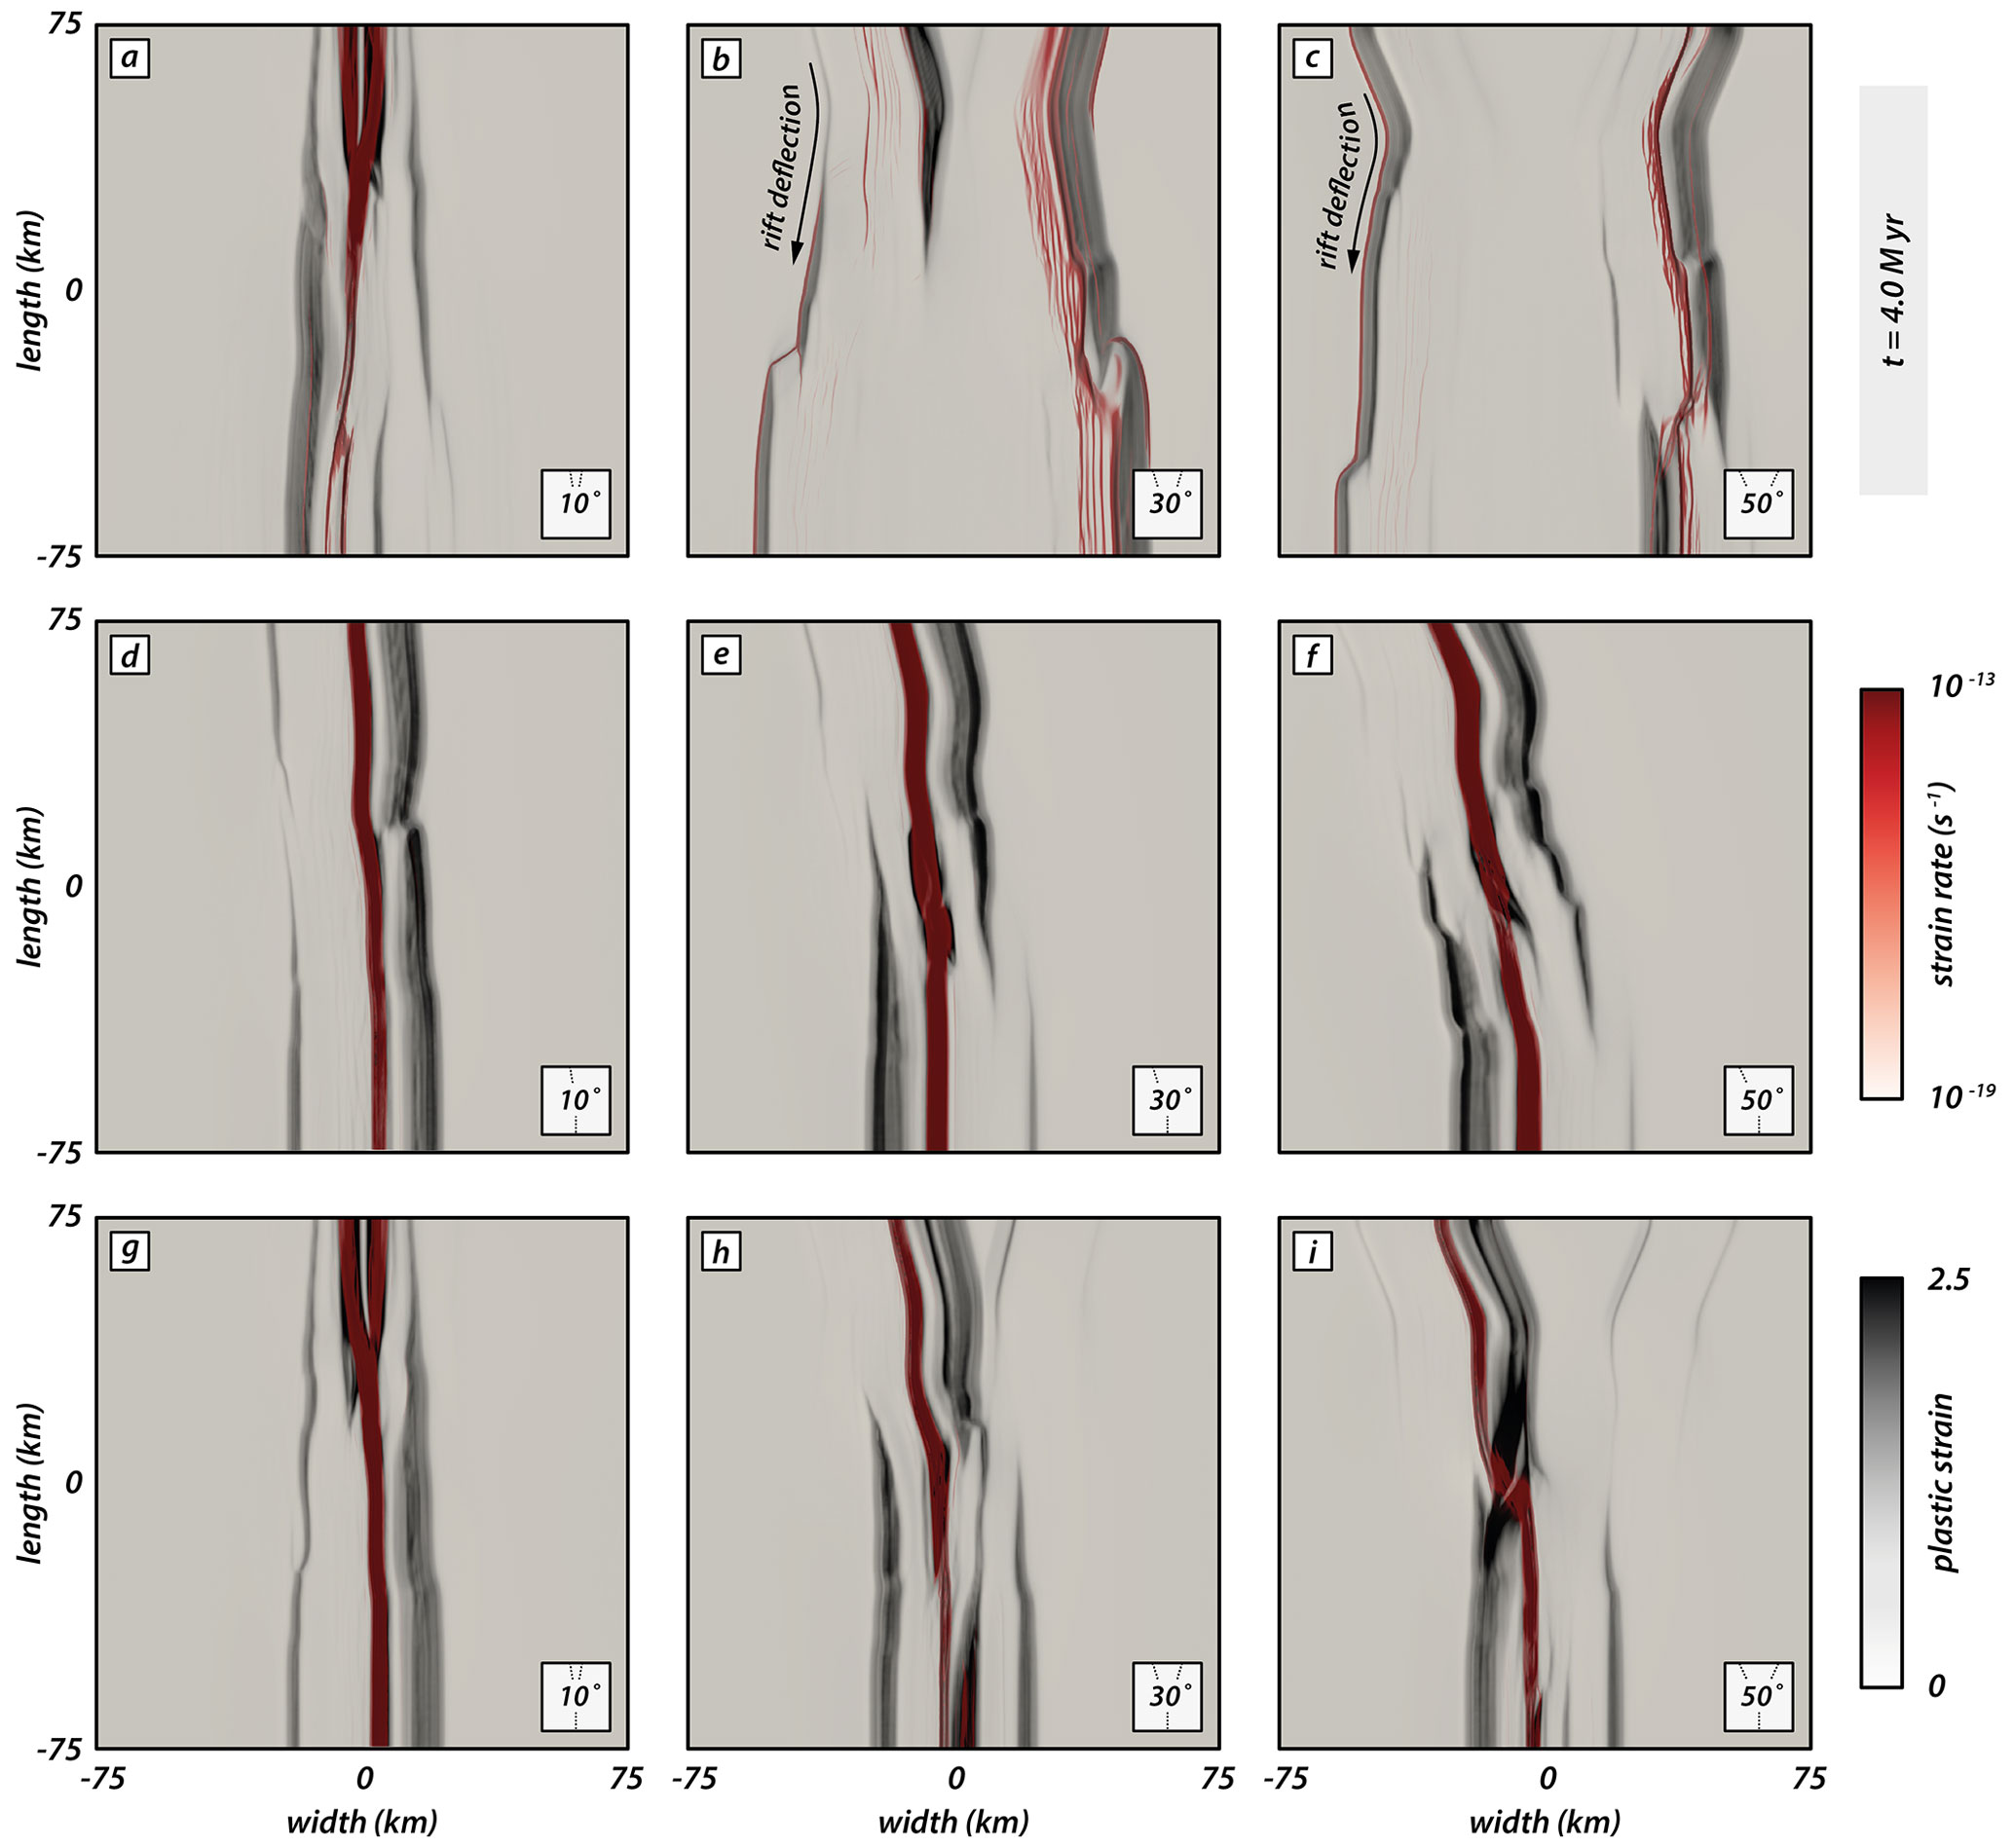
Figure 7Influence of seed configuration on the final rift geometry after 4 million years. Strain rates (logarithmic) and plastic strain are indicated by red and black, respectively. (a–c) The v-seed configuration for intermediate angles of 10, 30, and 50∘. (d–f) The i-seed configuration for intermediate angles of 10, 30, and 50∘. (g–i) The y-seed configuration for intermediate angles of 10, 30, and 50∘ (reference model).
The most prominent difference occurs in models with a y-seed configuration and various intermediate angles. For an intermediate angle of 10∘, the final rift geometry resembles that of a continuous straight rift segment (Fig. 7g). Both competing rear seeds are close enough such that they build one rift system rather than two distinct branches. For y-seed models with a larger intermediate angle (Fig. 7h, i), two individual rear rift segments form and compete for linkage with the frontal rift segment. Plastic strain clearly illustrates the asymmetric strain accommodation focused along the left-dipping rift boundary fault of the left rear segment, whereas the right rear segment only experienced minor strain accommodation (Fig. 7h, i). In both cases, high strain rates are localized in the axial rift zone and witness activity along the linked frontal and left rear segments.
Note that all experiments with an intermediate angle of 10∘ (Fig. 7a, d, g) form continuous straight rift segments, regardless of the seed configuration. Additionally, the final rift geometry for y- and v-seed configurations for an intermediate angle of 10∘ is similar with a gently wider rift in the frontal model part (Fig. 7a, g). In contrast, for i-seed configurations the rift width is similar along the entire length with a minor lateral offset (Fig. 7d). Strain rates are localized in the axial rift zone throughout the entire model length, forking into two close zones in the rear end where the competing seeds are located.
3.7 SHmax evolution with progressive deformation
In this section we present the distribution and orientation of the maximal horizontal compressive stress component SHmax with progressive rift evolution and segment linkage. We focus on models with v-, i-, and y-seed configurations and an intermediate angle of 50∘ (Fig. 8; see also Supplement Figs. S1–S3), distinguishing between model zones with pre-existing structures (i.e., weak seeds) and a central zone where material strength is isotropic.
Our models depict two distinct phases within the first 2 million years: early strain accommodation over a wider model domain followed by strain localization and linkage of propagating rift segments (see also Supplement Figs. S4–S6). Consequently, we focus on SHmax in the first 2 million years of deformation and its effect on rift propagation. Figure 8 shows the orientation of SHmax and the stress regime based on the common color scheme of the World Stress Map (Heidbach et al., 2018). Note that SHmax orientation and the stress regime alone do not suffice to discriminate between locations where stresses exceed crustal strength and faulting occurs. Strain rate values provide further necessary information, and we use a threshold of 10−16 s−1 that splits the model into locations of active deformation (i.e., ≥ 10−16 s−1) and tectonically inactive domains (i.e., < 10−16 s−1).
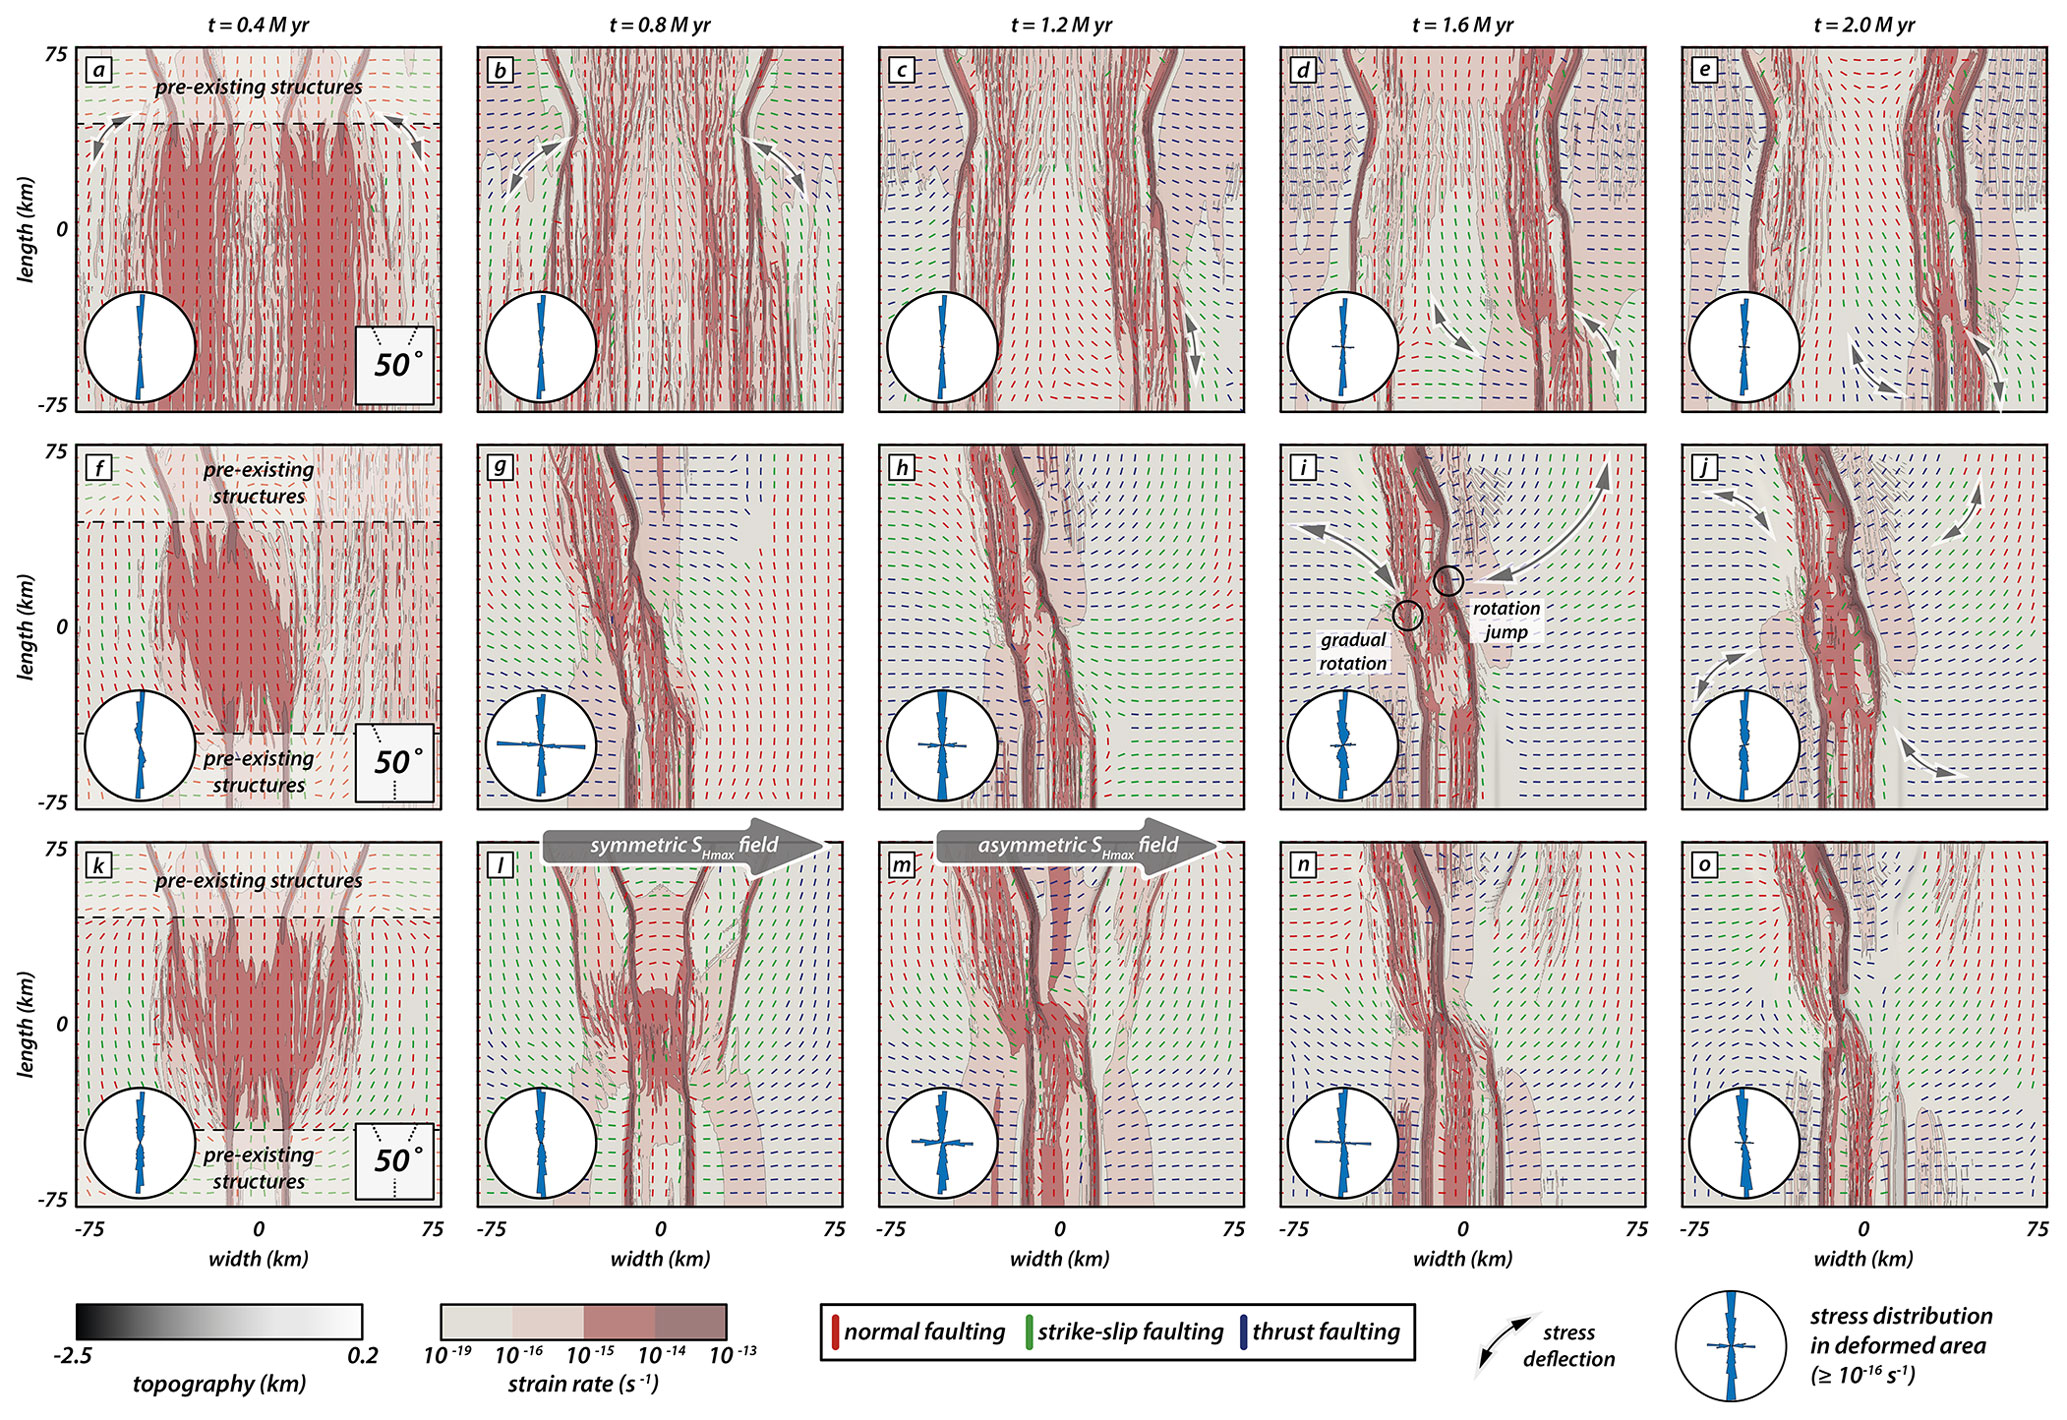
Figure 8Interplay of rift localization and surface stresses. Top views show the distribution of the maximum horizontal compressive stress component SHmax (not scaled to the magnitude) in models with an intermediate angle of 50∘ at early deformation stages (i.e., until 2 million years). (a–e) The v-seed configuration. (f–j) The i-seed configuration. (k–o) The y-seed configuration. Black refers to topographic elevation and red marks zones wherein strain rates exceed a threshold of 10−16 s−1. Color coding for the stress regime marks normal, strike-slip, and thrust faulting in red, green, and blue, respectively, using the common color scheme of the World Stress Map (Heidbach et al., 2018). Black arrows highlight stress deflection of SHmax. Rose diagrams show the distribution of SHmax orientation in zones wherein active faulting occurs (i.e., strain rate ≥ 10−16 s−1). Large grey arrows for the y-seed configuration mark the change from a symmetric to an asymmetric SHmax distribution.
3.7.1 Effect of SHmax re-orientation on rift propagation of competing rift segments (v-seed models)
Early stages in our numerical experiments are characterized by rift deflection and curved fault traces in the model center where rift segments interact (see Fig. 6). Hereafter, we refer to that phenomenon as arcuate faulting. Arcuate faulting mainly occurs in experiments with larger intermediate angles (> 10∘) in early stages (Fig. 6), especially if two competing rift segments are present (v- and y-seed configurations). Moreover, we have shown that deflection of propagating rifts occurs when deformation is symmetrically distributed along both competing rift branches. This is clearly visible for the v-seed configuration (Fig. 8a–e). Assuming orthogonal extension and isotropic material properties, SHmax is expected to align perpendicular to the extension direction, producing pure dip-slip normal faults (Anderson, 1905). However, the model shows an immediate SHmax re-orientation at early deformation stages (i.e., after 0.4 million years; Fig. 8a) from a N–S to E–W orientation in the vicinity of the underlying weak seeds such that dip-slip faults are favored over oblique-slip faults with a strike-slip component. With progressive extension (Fig. 8b–e), SHmax re-orientations successively propagate into the isotropic zone without pre-existing structures, concomitant with the rift propagation. Consequently, the position of the front where stress rotation occurs propagates over time, resulting in the deflection of the propagating rift arms away from each other.
There is a distinct difference between stress deflection along weak structures and E–W deflections of SHmax in zones wherein strain rates are below the set threshold of 10−16 s−1. The v-seed configuration shows localized strain accumulation along one rift boundary fault per segment (i.e., the outer one), resulting in a rift zone with a broad graben system that subsides (Fig. 8e). SHmax re-orientation inside the graben is in parts identical to the E–W orientation of SHmax outside the graben. While local SHmax rotations may be explained by small differences in the maximum and intermediate principal stress components, such E–W stress re-orientation in our model occurs systematically and suggests that this feature reflects the influence of the strength anisotropy (Morley, 2010). The initial SHmax deflection near weak structures locally favors dip-slip faulting but also has regional influence on the overall stress regime.
3.7.2 SHmax evolution in sub-parallel rift segments (i-seed models)
During the early stage (i.e., after 0.4 million years, Fig. 8f), the distribution of SHmax resembles the distribution from the v-seed configuration described in the previous section. Stress deflection mainly occurs in zones wherein a weak fabric is present. SHmax values in the central zone rotate by a small amount and reflect arcuate faulting (see Fig. 6). Since the two rift segments propagate in opposing directions, linkage is efficient and localizes in a short time (Fig. 8f–j). SHmax values deflect accordingly along propagating faults, which affects the entire model domain. This deflection does not occur symmetrically on both sides of each rift segment. Rather, it shows two distinct zones: (1) E–W orientations outside the rift deflect into a parallel orientation near the rift boarder or (2) N–S orientations outside the rift deflect into E–W orientations near faults (Fig. 8j).
We find that SHmax orientations deflect gradually from E–W to N–S along abandoned rift boundary faults where activity ceased (Fig. 8h–j; upper left and lower right model domain). In contrast, SHmax re-orientations from N–S to nearly E–W towards active rift boundary faults are followed by a rapid flip back to N–S along the faults (Fig. 8h–j; lower left and upper right model domain). The two types of re-orientation seem to correspond to two types of deformed zones. Where deformation is strongly localized along rift boundary faults, jumps in the SHmax orientation occur. In contrast, in zones wherein inward migration of fault activity activates intra-rift faults, SHmax re-orientation occurs gradually.
3.7.3 Rift arm competition and deflection (y-seed models)
A prominent feature in our models with two competing rift segments is the deflection of rift branches and arcuate strain rate patterns (Fig. 8a–e) in the model with a v-seed configuration. Moreover, the i-seed configuration demonstrates a gradual SHmax re-orientation over a broader pre-weakened zone due to formerly active boundary faults. One could therefore expect that both features should occur in the model with y-seed configuration (Fig. 8k–o).
Indeed, early stages (i.e., after 0.4 million years; Fig. 8k) are characterized by a symmetric stress field with re-oriented SHmax values near the two rear rift segments. However, in contrast to the v-seed configuration, SHmax re-orientation also occurs near the frontal pre-existing weak fabric along developing rift boundary faults. In the isotropic zone, SHmax values dominantly show a N–S direction. The general N–S orientation reflects the regional stress field due to an E–W extension as predicted by Anderson (1905) in isotropic areas, into which rift segments have yet to propagate. With ongoing extension, all three rift segments propagate into the isotropic zone and cause a re-orientation of SHmax (Fig. 8l). Note that after 0.8 million years the stress re-orientation occurs symmetrically. This contrasts with the i-seed configuration wherein SHmax values either deflect into an E–W orientation along active rift boundary faults or gradually turn in a fault-parallel direction over a broader weakened zone (see Sect. 3.7.2). The early symmetric stress distribution in the y-seed configuration model is unarguably due to the symmetric seed configuration (see also Fig. 8a–e). At this stage, dip-slip faulting along the competing sub-parallel rift segments is favored over oblique-slip faults as in models with a v-seed configuration. It is only after 1.2 million years, when fault activity along the right rear segment ceases, that deformation localizes along the left rear and frontal segments and linkage intensifies (Fig. 8m). Successively, localization and linkage occur coevally with a switch from a symmetric to an asymmetric stress distribution and resemble the stress distribution in the i-seed configuration model (Fig. 8f–j). The model state after 1.2 million years (Fig. 8m) also marks the switch from a symmetric to an asymmetric stress distribution that was formerly dominated by the competing rear rift segments with dip-slip faulting favored along the two competing rift segments (see also v-seed configuration; Fig. 8a–e). After 1.2 million years the system is dominated by the linkage of two obliquely oriented segments (i.e., i-seed configuration). Note that after 1.2 million years dip-slip faulting mostly occurs along the competing rift segment that links with the opposingly propagating segment, whereas dominantly oblique-slip faults occur along the abandoned rift segment where activity ceases.
The symmetry switch is also visible in rose diagrams of stress orientations within the active faulting zone (i.e., strain rate ≥ 10−16 s−1). A dominantly N–S-oriented SHmax distribution changes to a bimodal distribution with a second E–W orientation (Fig. 8l–n). Similarly, bimodal SHmax distribution is also visible in the experiment with an i-seed configuration but occurs earlier. Since the experiment with an i-seed configuration is never in the state of an early symmetric stress distribution, linkage is facilitated and occurs earlier (Fig. 8g–i).
Despite the relatively simple setup of our experiments, the interaction of individual weak seeds generates a complex evolution of linkage patterns. In the following we discuss the effect of pre-existing structures on SHmax re-orientations and how, in return, stress re-orientation influences rift propagation and rift segment linkage.
4.1 Effect of pre-existing structures on rift segment propagation, interaction, and SHmax
Previous modeling studies demonstrated that pre-existing weaknesses may cause local re-orientations of SHmax, resulting in extensional faults with an oblique orientation to the regional extension direction which exhibit pure dip-slip behavior (e.g., Morley, 2010; Corti et al., 2013; Morley, 2017; Philippon et al., 2015). This contrasts with the expected (assuming Andersonian faulting theory) occurrence of faults with an oblique-slip component above pre-existing structures that are obliquely oriented with respect to the extension direction (Tron and Brun, 1991; Withjack and Jamison, 1986). Our SHmax analysis documents two types of stress re-orientation, either gradually or by a jump along faults (Fig. 8i). A potential explanation for the two types of stress deflection is that cessation of boundary fault activity (and subsequent faulting activity along intra-rift faults) creates a broad zone of reduced crustal strength. Hence, SHmax orientations successively re-orient along those formerly active faults and eventually rotate into a N–S orientation along active intra-rift faults. In contrast, where faulting activity is strongly localized along rift boundary faults, re-orientation occurs rapidly by a jump from E–W to N–S orientation. This suggests that formerly active faults act as a wider zone of pre-weakened material, where stresses deflect sequentially rather than with a rapid jump. Similar observations have been made in previous studies of numerical models (Gudmundsson et al., 2010; Kattenhorn et al., 2000). These experiments suggest that earlier fractures lead to subzones (within a broader damage zone), wherein stresses subsequently rotate away from the regional stress field. Although our analog and numerical models do not feature elastic deformation, they indicate that stress deflection is an ongoing process, even after elastic material failure. Such a stress deflection further implies that stress orientations in rocks with pre-existing weaknesses can substantially deviate from predicted orientations in isotropic media (Anderson, 1905).
It has been proposed that early faulting and propagation in the Rukwa and northern Malawi rifts (Fig. 1c) were guided by pre-existing basement fabrics (Heilman et al., 2019). This region is further shaped by a flip in the boundary fault polarity in the present-day geometry within the interaction zone between the Rukwa Rift and northern Malawi Rift (Bosworth, 1985). Our i-seed models show identical geometries for increasing intermediate angles (Figs. 7e, f and S5), with plastic strain near pre-existing structures being mostly accommodated along prominent rift boundary faults that flip fault polarity from the frontal to the rear rift segment. This flip in fault polarity occurs prominently in models with an intermediate angle ≥ 10∘. We speculate that the increasing obliquity of the southward-propagating rift segment favors asymmetric graben evolution with one dominant boundary fault accommodating a larger amount of strain. In contrast to small intermediate angles (i.e., 10∘), seed configurations with a higher obliquity provoke local rotation of SHmax within the interaction zone into a strike-slip regime near the subordinate boundary fault (Fig. S5). Hence, strain accommodation along incipient faults within the dip-slip regime is favored. This facilitates propagation along those dominant rift boundary faults and eventually defines the final rift geometry.
Kolawole et al. (2018) further propose two different types of strain accommodation at early rift phases: prominent strain accommodation localized onto a discrete and narrow zone along large rift boundary faults (Style 1; sensu Kolawole et al., 2018) and faulting distributed over a broader zone, wherein fault clusters may reflect pre-conditioning of the material (Style 2; sensu Kolawole et al., 2018). With this perspective, jumps and gradual rotation of SHmax orientations are comparable to Style 1 and Style 2 strain localization, respectively, as proposed by Kolawole et al. (2018). Hence, the type of weakness (narrow discrete zone or distributed cluster zone) should also be reflected by the stress re-orientation distribution (Morley, 2010).
4.2 Local SHmax re-orientation and its influence on rift segment interaction and rift deflection
A particular observation in our experiments with a v-, and y-seed configuration is that two sub-parallel rift segments, which propagate approximately in the same direction, deflect away from each other at early stages. This is somewhat surprising as one would expect the two rift segments to cut towards each other by minimizing fault length. The occurrence of rift deflection in both analog and numerical experiments validates the results as robust and requires discussing the role of SHmax re-orientation and how it influences rift segment interaction.
We speculate that, while both rear rift segments in our y-seed models equivalently accommodate strain in the early stages (i.e., when the overall stress distribution is symmetric; Fig. 8), SHmax orientations are dominated by the influence of the two competing rear rift segments that accommodate strain in equal parts. It is only after fault activity along one rear segment ceases that deformation localizes along the active rear and frontal segments and linkage intensifies. Strain localization and linkage occur coevally with a switch from a symmetric to an asymmetric stress distribution resembling the stress distributions in v-, and i-seed configuration models, respectively. The switch from a symmetric to an asymmetric stress distribution in y-seed models also marks the switch from a system that was formerly dominated by the competing rear rift segments (i.e., v-seed configuration) to a system that is dominated by the linkage of two obliquely oriented segments (i.e., i-seed configuration).
In models with a v-seed configuration, however, the symmetric phase prevails and causes coeval SHmax re-orientations and rift deflection that cause divergence of the two propagating rift segments. A similar process of extensional segment interaction via stress rotation is known from mid-ocean ridge settings: Pollard and Aydin (1984) argue that paths of two opposingly propagating oceanic ridges weakly diverge due to shear stresses that divert propagating ridges as they approach each other. Once the two ridges overlap, the stress field changes, causing convergence and intersection. Similarly, Nelson et al. (1992) describe interference of compressional zones of propagating cracks diverting their tips before they overlap and turn back toward another. In this respect, our models with a v-seed configuration suggest that stresses also cause divergence of two rift segments that propagate approximately in the same direction. However, overlap never occurs (as they propagate approximately in the same direction), and hence the two segments remain in a stress field that further diverts their paths.
Only in models with a y-seed configuration can compressional zones and rift deflection be overcome once the opposingly propagating rift segment links with one of the competing rift segments. Linkage occurs after about the first million years, concurrently with rift deflection and abandonment of the right rear segment (Figs. 9 and S6). Moreover, remaining activity in the right rear segment depicts low strain rates along numerous arcuate intra-rift faults (Figs. 9b and S6). This suggests that linkage and rift abandonment are closely coupled and faulting along the linked segments intensifies when the activity along the remaining rift segment ceases. In addition, the left rear segment displays a rather asymmetric half-graben geometry (Figs. 5c, d, 7i and S5) with one prominent rift boundary fault accommodating a larger part of plastic strain, similar to our models with an i-seed configuration (see also Figs. 7e, f and S5). Dominant strain accommodation occurs along the west-dipping rift boundary fault of the left rear segment coinciding with jumps in the SHmax orientation (Fig. 8m–o). Our modeling results show that stress deflection along rift segment tips is a mechanical consequence of the interaction between weak zones and far-field stresses, offering a potential explanation for naturally occurring rift deflection. However, we must emphasize that complexities in natural rift settings pose additional difficulties that require further investigations of stress orientations.
An example of rift deflection in nature has been described in the Main Ethiopian Rift. Geophysical and geologic studies evidence that pre-existing structures controlled the approximately 11 Ma southward propagation of the northern Main Ethiopian Rift and its contemporaneous westward deflection along the Yerer–Tullu Wellel Volcanotectonic Lineament (YTVL; Abebe et al., 1998; Keranen and Klemperer, 2008; Muhabaw et al., 2022). Only after the rotation of the principal stress direction at about 5–6 Ma (Bonini et al., 2005) did extension along the YTVL cease, and deformation localization along the central Main Ethiopian Rift became more favorable. Our models document similar rift deflections and moreover indicate that, even in the absence of changing plate motions, rift segments deflect and may cease, while competing rift segments prevail and strain further localizes.
For the Canyonlands National Park, it has been proposed that it is mainly the lateral offset between pre-existing structures that explains the diversity of structures (Allken et al., 2013; Fig. 1d). With larger offsets, interaction between adjacent rift segments is limited and competing grabens persist and endure ongoing propagation coevally. We find that stresses, in combination with the geometry of pre-existing structures, play an important role and that they have a mutual effect on one another. Hence, stress distribution must be considered an important factor, especially in early rifting stages when segments link and predetermine strain localization during subsequent progressive rifting.
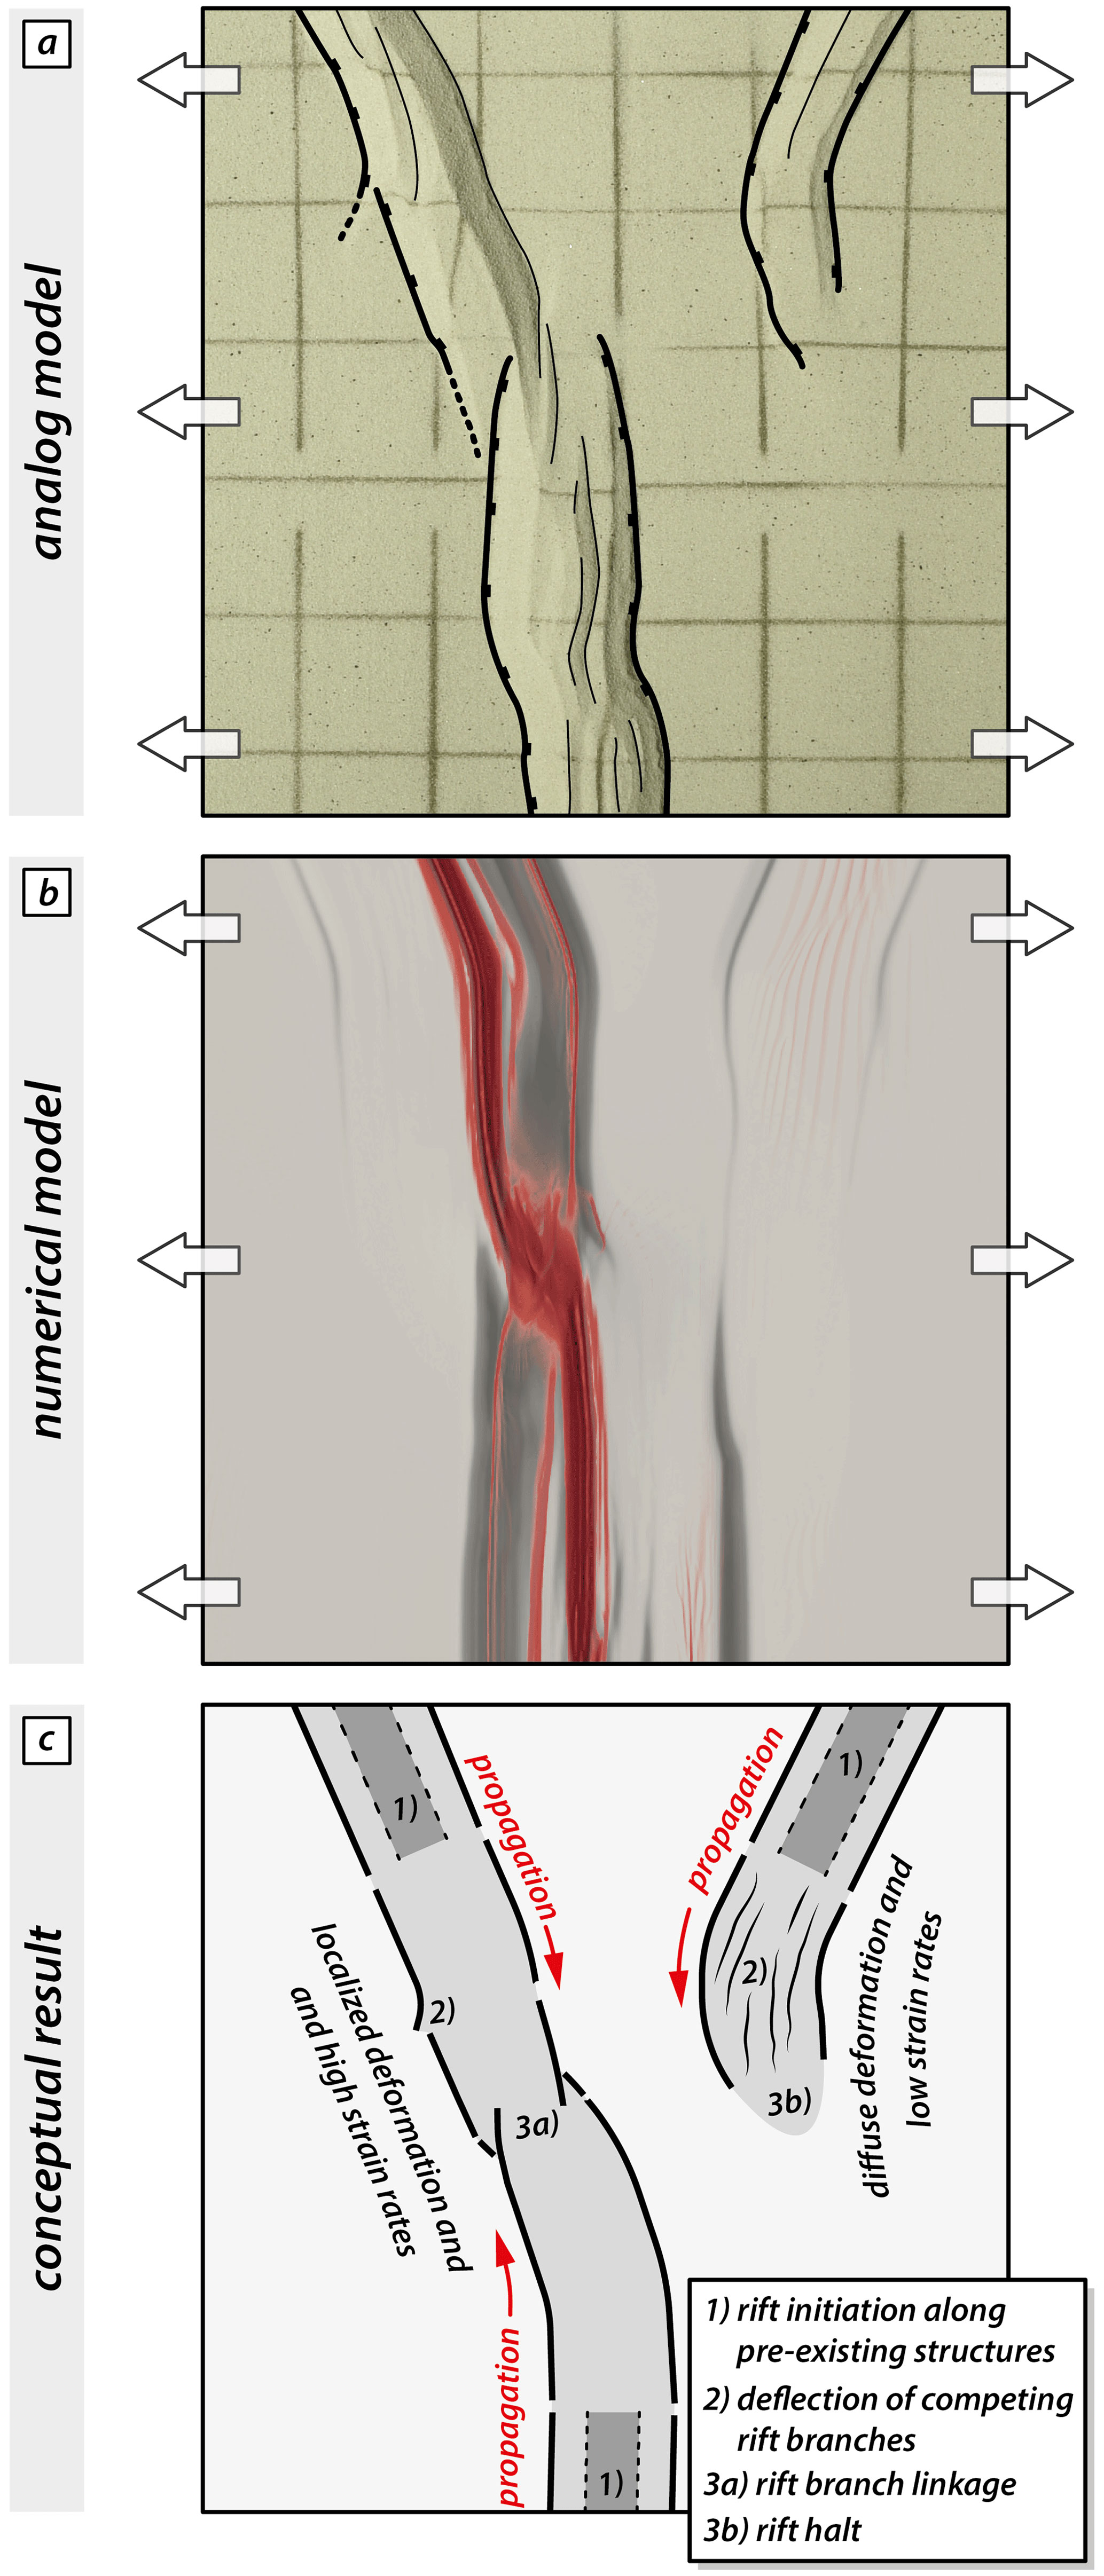
Figure 9Summary plot showing the geometric similarity of rift segment linkage, deflection of competing branches, and abandonment in analog and numerical models. (a) Observed key features at the final stage of the analog model. (b) Final strain and strain rate pattern in the numerical reference model. (c) Conceptual interpretation of rift deflection and linkage based on our analog and numerical results (for details see text).
We present a series of analog and numerical rifting experiments. Our results suggest that, even in a relatively simple isoviscous two-layer crustal setup, pre-existing weaknesses substantially disturb the regional stress pattern, which impacts rift propagation and the overall rift evolution. The complex stress re-orientation is distinct for different seed configurations (i.e., v seed, i seed, and y seed) and closely interacts with the final rift geometry. The most important findings of our study can be summarized as follows.
-
Our numerical experiments reproduce rift segment deflection seen in our analog models. This highlights the robustness of our results and their applicability to interpreting rift segment propagation, interaction, and linkage in natural settings of continental rifting.
-
Pre-existing structures may control localization of rift segments that successively propagate into previously undeformed areas. Consequently, stress re-orientation initially occurs along pre-conditioned zones and propagates, coevally with rift segment propagation and strain accrual, into formerly undeformed areas.
-
Interacting stresses between two competing rift segments may cause outward deflection of the propagating rift tips, resulting in a successively broader rift geometry along-strike.
-
Outward deflection of competing rift segments is less prominent if an opposingly propagating rift segment is present. With progressive extensional deformation, strain accrual along one of the competing rift segments prevails, whilst faulting activity along the other segment ceases. Coevally, the general stress orientation changes from a symmetric to an asymmetric distribution, indicating the onset of rift linkage.
-
Our modeling results reproduce first-order structures of natural examples from the East African Rift System and, on a smaller scale, graben structures in the Canyonlands National Park. The combined investigation of surface stresses and strain localization provides an explanation for distinct rift deflection among competing rift segments and rift linkage structures wherein ongoing deformation and stresses mutually affect each other.
While changes in rift orientation are often used to infer changes in plate motion, we demonstrate that local stress field re-orientations can occur under constant plate motions. Although on a smaller scale, implications from our observations corroborate findings from previous studies (Brune, 2014; Duclaux et al., 2020; Gapais et al., 2000). Locally, stress and strain can largely deviate from a regional, far-field pattern and instead represent local deformation interference. In addition, the observed stress re-orientations change over time, indicating that stresses measured in natural examples may depict transient stages that change with progressive deformation due to subsequent changes in material strengths (Morley et al., 2004). This implication must be considered in processing local fault-slip data when interpreting the evolution of rifts at any scale.
Rheological measurements of the analog materials used are available in the form of open-access data publications provided by the GFZ Data Service (brittle materials: https://doi.org/10.5880/fidgeo.2020.006, Schmid et al., 2020a, https://doi.org/10.5880/fidgeo.2020.005, Schmid et al., 2020b; viscous materials: https://doi.org/10.5880/fidgeo.2018.023, Zwaan et al., 2018). The input files, custom ASPECT plug-ins, and post-processing scripts used in this publication can be found in the Zenodo repository at https://doi.org/10.5281/zenodo.7701374 (Glerum, 2023).
The supplement related to this article is available online at: https://doi.org/10.5194/se-14-389-2023-supplement.
TCS: conceptualization, methodology, investigation, formal analysis, writing – original draft, visualization, data curation. SB: conceptualization, methodology, HPC funding acquisition, supervision, project administration, writing – review and editing. AG: methodology, software, HPC funding acquisition, writing – review and editing. GS: writing – review and editing, supervision, project administration, funding acquisitions, resources.
The contact author has declared that none of the authors has any competing interests.
Publisher's note: Copernicus Publications remains neutral with regard to jurisdictional claims in published maps and institutional affiliations.
We thank Esther Heckenbach for helpful assistance with post-processing and visualization. The work was supported by the North-German Supercomputing Alliance (HLRN). We thank the Swiss National Science Foundation for providing financial support. Finally, we thank the two referees, Guillaume Duclaux and Chris Morley, as well as the topical editor Patrice Rey, for their detailed, constructive, and motivating comments that significantly helped to improve this paper.
This research has been supported by the Schweizerischer Nationalfonds zur Förderung der Wissenschaftlichen Forschung (grant no. 200021_178731).
This paper was edited by Patrice Rey and reviewed by Chris Morley and Guillaume Duclaux.
Abebe, T., Mazzarini, F., Innocenti, F., and Manetti, P.: The Yerer-Tullu Wellel volcanotectonic lineament: A transtensional structure in central Ethiopia and the associated magmatic activity, J. Afr. Earth Sci., 26, 135–150, https://doi.org/10.1016/S0899-5362(97)00141-3, 1998.
Acocella, V., Faccenna, C., Funiciello, R., and Rossetti, F.: Sand-box modelling of basement-controlled transfer zones in extensional domains, Terra Nova-Oxford, 11, 149–156, 1999.
Adam, J., Urai, J., Wieneke, B., Oncken, O., Pfeiffer, K., Kukowski, N., Lohrmann, J., Hoth, S., Van Der Zee, W., and Schmatz, J.: Shear localisation and strain distribution during tectonic faulting—New insights from granular-flow experiments and high-resolution optical image correlation techniques, J. Struct. Geol., 27, 283–301, https://doi.org/10.1016/j.jsg.2004.08.008, 2005.
Allken, V., Huismans, R. S., and Thieulot, C.: Three-dimensional numerical modeling of upper crustal extensional systems, J. Geophys. Res.-Sol. Ea., 116, B10409, https://doi.org/10.1029/2011JB008319, 2011.
Allken, V., Huismans, R. S., and Thieulot, C.: Factors controlling the mode of rift interaction in brittle-ductile coupled systems: A 3D numerical study, Geochem. Geophy. Geosy., 13, Q05010, https://doi.org/10.1029/2012GC004077, 2012.
Allken, V., Huismans, R. S., Fossen, H., and Thieulot, C.: 3D numerical modelling of graben interaction and linkage: a case study of the Canyonlands grabens, Utah, Basin Res., 25, 436–449, https://doi.org/10.1111/bre.12010, 2013.
Anderson, E. M.: The dynamics of faulting, Transactions of the Edinburgh Geological Society, 8, 387–402, https://doi.org/10.1144/transed.8.3.387, 1905.
Bellahsen, N. and Daniel, J. M.: Fault reactivation control on normal fault growth: an experimental study, J. Struct. Geol., 27, 769–780, https://doi.org/10.1016/j.jsg.2004.12.003, 2005.
Bonini, M., Corti, G., Innocenti, F., Manetti, P., Mazzarini, F., Abebe, T., and Pecskay, Z.: Evolution of the Main Ethiopian Rift in the frame of Afar and Kenya rifts propagation, Tectonics, 24, TC1007, https://doi.org/10.1029/2004TC001680, 2005.
Bosworth, W.: Geometry of propagating continental rifts, Nature, 316, 625–627, https://doi.org/10.1038/316625a0, 1985.
Brune, S.: Evolution of stress and fault patterns in oblique rift systems: 3-D numerical lithospheric-scale experiments from rift to breakup, Geochem. Geophy. Geosy., 15, 3392–3415, https://doi.org/10.1002/2014GC005446, 2014.
Brune, S. and Autin, J.: The rift to break-up evolution of the Gulf of Aden: Insights from 3D numerical lithospheric-scale modelling, Tectonophysics, 607, 65–79, https://doi.org/10.1016/j.tecto.2013.06.029, 2013.
Brune, S., Corti, G., and Ranalli, G.: Controls of inherited lithospheric heterogeneity on rift linkage: Numerical and analog models of interaction between the Kenyan and Ethiopian rifts across the Turkana depression, Tectonics, 36, 1767–1786, https://doi.org/10.1002/2017TC004739, 2017.
Childs, C., Watterson, J., and Walsh, J.: Fault overlap zones within developing normal fault systems, J. Geol. Soc., 152, 535–549, https://doi.org/10.1144/gsjgs.152.3.0535, 1995.
Collanega, L., Jackson, C. A.-L., Bell, R., Coleman, A. J., Lenhart, A., and Breda, A.: How do intra-basement fabrics influence normal fault growth? Insights from the Taranaki Basin, offshore New Zealand, Earth ArXiv [preprint], https://doi.org/10.31223/osf.io/8rn9u, 2018.
Corti, G.: Evolution and characteristics of continental rifting: Analog modeling-inspired view and comparison with examples from the East African Rift System, Tectonophysics, 522–523, 1–33, https://doi.org/10.1016/j.tecto.2011.06.010, 2012.
Corti, G., van Wijk, J., Cloetingh, S., and Morley, C. K.: Tectonic inheritance and continental rift architecture: Numerical and analogue models of the East African Rift system, Tectonics, 26, TC6006, https://doi.org/10.1029/2006TC002086, 2007.
Corti, G., Philippon, M., Sani, F., Keir, D., and Kidane, T.: Re-orientation of the extension direction and pure extensional faulting at oblique rift margins: Comparison between the Main Ethiopian Rift and laboratory experiments, Terra Nova, 25, 396–404, https://doi.org/10.1111/ter.12049, 2013.
Corti, G., Cioni, R., Franceschini, Z., Sani, F., Scaillet, S., Molin, P., Isola, I., Mazzarini, F., Brune, S., and Keir, D.: Aborted propagation of the Ethiopian rift caused by linkage with the Kenyan rift, Nat. Commun., 10, 1–11, https://doi.org/10.1038/s41467-019-09335-2, 2019.
Crameri, F., Shephard, G. E., and Heron, P. J.: The misuse of colour in science communication, Nat. Commun., 11, 1–10, https://doi.org/10.1038/s41467-020-19160-7, 2020.
Daly, M., Chorowicz, J., and Fairhead, J.: Rift basin evolution in Africa: the influence of reactivated steep basement shear zones, Geol. Soc. Spec. Publ., 44, 309–334, https://doi.org/10.1144/GSL.SP.1989.044.01.17, 1989.
Duclaux, G., Huismans, R. S., and May, D. A.: Rotation, narrowing, and preferential reactivation of brittle structures during oblique rifting, Earth Planet. Sc. Lett., 531, 115952, https://doi.org/10.1016/j.epsl.2019.115952, 2020.
Duffy, O. B., Bell, R. E., Jackson, C. A.-L., Gawthorpe, R. L., and Whipp, P. S.: Fault growth and interactions in a multiphase rift fault network: Horda Platform, Norwegian North Sea, J. Struct. Geol., 80, 99–119, https://doi.org/10.1016/j.jsg.2015.08.015, 2015.
Duretz, T., de Borst, R., and Le Pourhiet, L.: Finite thickness of shear bands in frictional viscoplasticity and implications for lithosphere dynamics, Geochem. Geophy. Geosy., 20, 5598–5616, https://doi.org/10.1029/2019GC008531, 2019.
Ebinger, C., Yemane, T., Harding, D., Tesfaye, S., Kelley, S., and Rex, D.: Rift deflection, migration, and propagation: Linkage of the Ethiopian and Eastern rifts, Africa, Geol. Soc. Am. Bull., 112, 163–176, https://doi.org/10.1130/0016-7606(2000)112<163:RDMAPL>2.0.CO;2, 2000.
Gapais, D., Cobbold, P. R., Bourgeois, O., Rouby, D., and de Urreiztieta, M.: Tectonic significance of fault-slip data, J. Struct. Geol., 22, 881–888, https://doi.org/10.1016/S0191-8141(00)00015-8, 2000.
Gassmöller, R., Lokavarapu, H., Heien, E., Puckett, E. G., and Bangerth, W.: Flexible and scalable particle-in-cell methods with adaptive mesh refinement for geodynamic computations, Geochem. Geophy., Geosy., 19, 3596–3604, https://doi.org/10.1029/2018GC007508, 2018.
Glerum, A., Brune, S., Stamps, D. S., and Strecker, M. R.: Victoria continental microplate dynamics controlled by the lithospheric strength distribution of the East African Rift, Nat. Commun., 11, 1–15, https://doi.org/10.1038/s41467-020-16176-x, 2020.
Glerum, A.: anne-glerum/paper-Schmid-Tectonic-interactions-during-rift-linkage: Update ASPECT branch (v.2.0.0), Zenodo [code], https://doi.org/10.5281/zenodo.7701374, 2023.
Glerum, A., Thieulot, C., Fraters, M., Blom, C., and Spakman, W.: Nonlinear viscoplasticity in ASPECT: benchmarking and applications to subduction, Solid Earth, 9, 267–294, https://doi.org/10.5194/se-9-267-2018, 2018.
Gudmundsson, A., Simmenes, T. H., Larsen, B., and Philipp, S. L.: Effects of internal structure and local stresses on fracture propagation, deflection, and arrest in fault zones, J. Struct. Geol., 32, 1643–1655, https://doi.org/10.1016/j.jsg.2009.08.013, 2010.
Heidbach, O., Rajabi, M., Cui, X., Fuchs, K., Müller, B., Reinecker, J., Reiter, K., Tingay, M., Wenzel, F., and Xie, F.: The World Stress Map database release 2016: Crustal stress pattern across scales, Tectonophysics, 744, 484–498, https://doi.org/10.1016/j.tecto.2018.07.007, 2018.
Heilman, E., Kolawole, F., Atekwana, E. A., and Mayle, M.: Controls of Basement Fabric on the Linkage of Rift Segments, Tectonics, 38, 1337–1366, https://doi.org/10.1029/2018TC005362, 2019.
Heister, T., Dannberg, J., Gassmöller, R., and Bangerth, W.: High accuracy mantle convection simulation through modern numerical methods–II: realistic models and problems, Geophys. J. Int., 210, 833–851, https://doi.org/10.1029/2018TC005362, 2017.
Jacquey, A. B. and Cacace, M.: Multiphysics modeling of a brittle-ductile lithosphere: 2. Semi-brittle, semi-ductile deformation and damage rheology, J. Geophys. Res.-Sol. Ea., 125, e2019JB018475, https://doi.org/10.1029/2019JB018475, 2020.
Kattenhorn, S. A., Aydin, A., and Pollard, D. D.: Joints at high angles to normal fault strike: an explanation using 3-D numerical models of fault-perturbed stress fields, J. Struct. Geol., 22, 1–23, https://doi.org/10.1016/S0191-8141(99)00130-3, 2000.
Katzman, R., ten Brink, U. S., and Lin, J.: Three-dimensional modeling of pull-apart basins: Implications for the tectonics of the Dead Sea Basin, J. Geophys. Res.-Sol. Ea., 100, 6295–6312, https://doi.org/10.1029/94JB03101, 1995.
Keranen, K. and Klemperer, S.: Discontinuous and diachronous evolution of the Main Ethiopian Rift: Implications for development of continental rifts, Earth Planet. Sc. Lett., 265, 96–111, https://doi.org/10.1016/j.epsl.2007.09.038, 2008.
Koehn, D., Aanyu, K., Haines, S., and Sachau, T.: Rift nucleation, rift propagation and the creation of basement micro-plates within active rifts, Tectonophysics, 458, 105–116, https://doi.org/10.1016/j.tecto.2007.10.003, 2008.
Kolawole, F., Phillips, T. B., Atekwana, E. A., and Jackson, C. A.-L.: Structural inheritance controls strain distribution during early continental rifting, rukwa rift, Front. Earth Sci., 670, 707869, https://doi.org/10.3389/feart.2021.707869, 2021.
Kolawole, F., Atekwana, E. A., Laó-Dávila, D. A., Abdelsalam, M. G., Chindandali, P. R., Salima, J., and Kalindekafe, L.: Active Deformation of Malawi Rift's North Basin Hinge Zone Modulated by Reactivation of Preexisting Precambrian Shear Zone Fabric, Tectonics, 37, 683–704, https://doi.org/10.1002/2017TC004628, 2018.
Kronbichler, M., Heister, T., and Bangerth, W.: High accuracy mantle convection simulation through modern numerical methods, Geophys. J. Int., 191, 12–29, https://doi.org/10.1111/j.1365-246X.2012.05609.x, 2012.
Lavier, L. L., Buck, W. R., and Poliakov, A. N.: Factors controlling normal fault offset in an ideal brittle layer, J. Geophys. Res.-Sol. Ea., 105, 23431–23442, https://doi.org/10.1029/2000JB900108, 2000.
Macdonald, K. C. and Fox, P.: Overlapping spreading centres: New accretion geometry on the East Pacific Rise, Nature, 302, 55–58, https://doi.org/10.1038/302055a0, 1983.
Mills, N.: Dislocation array elements for the analysis of crack and yielded zone growth, J. Mater. Sci., 16, 1317–1331, https://doi.org/10.1007/BF01033848, 1981.
Mondy, L. S., Rey, P. F., Duclaux, G., and Moresi, L.: The role of asthenospheric flow during rift propagation and breakup, Geology, 46, 103–106, https://doi.org/10.1130/G39674.1, 2018.
Morley, C.: Stress re-orientation along zones of weak fabrics in rifts: An explanation for pure extension in “oblique” rift segments?, Earth Planet. Sc. Lett., 297, 667–673, https://doi.org/10.1016/j.epsl.2010.07.022, 2010.
Morley, C.: The impact of multiple extension events, stress rotation and inherited fabrics on normal fault geometries and evolution in the Cenozoic rift basins of Thailand, Geol. Soc. Spec. Publ., 439, 413–445, https://doi.org/10.1144/SP439.3, 2017.
Morley, C., Nelson, R., Patton, T., and Munn, S.: Transfer zones in the East African rift system and their relevance to hydrocarbon exploration in rifts, AAPG Bull., 74, 1234–1253, https://doi.org/10.1306/0C9B2475-1710-11D7-8645000102C1865D, 1990.
Morley, C., Haranya, C., Phoosongsee, W., Pongwapee, S., Kornsawan, A., and Wonganan, N.: Activation of rift oblique and rift parallel pre-existing fabrics during extension and their effect on deformation style: examples from the rifts of Thailand, J. Struct. Geol., 26, 1803–1829, https://doi.org/10.1016/j.jsg.2004.02.014, 2004.
Morley, C. K.: Patterns of displacement along large normal faults: implications for basin evolution and fault propagation, based on examples from East Africa, AAPG Bull., 83, 613–634, https://doi.org/10.1306/00AA9C0A-1730-11D7-8645000102C1865D, 1999.
Muhabaw, Y., Muluneh, A. A., Nugsse, K., Gebru, E. F., and Kidane, T.: Paleomagnetism of Gedemsa magmatic segment, Main Ethiopian Rift: Implication for clockwise rotation of the segment in the Early Pleistocene, Tectonophysics, 838, 229475, https://doi.org/10.1016/j.tecto.2022.229475, 2022.
Nelson, R., Patton, T., and Morley, C.: Rift-segment interaction and its relation to hydrocarbon exploration in continental rift systems, AAPG Bull., 76, 1153–1169, https://doi.org/10.1306/BDFF898E-1718-11D7-8645000102C1865D, 1992.
Oliva, S. J., Ebinger, C. J., Rivalta, E., Williams, C. A., Wauthier, C., and Currie, C. A.: State of stress and stress rotations: Quantifying the role of surface topography and subsurface density contrasts in magmatic rift zones (Eastern Rift, Africa), Earth Planet. Sc. Lett., 584, 117478, https://doi.org/10.1016/j.epsl.2022.117478, 2022.
Philippon, M., Willingshofer, E., Sokoutis, D., Corti, G., Sani, F., Bonini, M., and Cloetingh, S.: Slip re-orientation in oblique rifts, Geology, 43, 147–150, https://doi.org/10.1130/G36208.1, 2015.
Pollard, D. D. and Aydin, A.: Propagation and linkage of oceanic ridge segments, J. Geophys. Res.-Sol. Ea., 89, 10017–10028, https://doi.org/10.1029/JB089iB12p10017, 1984.
Rose, I., Buffett, B., and Heister, T.: Stability and accuracy of free surface time integration in viscous flows, Phys. Earth Planet. Int., 262, 90–100, https://doi.org/10.1016/j.pepi.2016.11.007, 2017.
Rosendahl, B. R.: Architecture of continental rifts with special reference to East Africa, Annu. Rev. Earth Pl. Sc., 15, 445, https://doi.org/10.1146/annurev.ea.15.050187.002305, 1987.
Schmid, T., Schreurs, G., Warsitzka, M., and Rosenau, M.: Effect of sieving height on density and friction of brittle analogue material: ring-shear test data of quarz sand used for analogue experiments in the Tectonic Modelling Lab of the University of Bern, GFZ Data Services [data set], https://doi.org/10.5880/fidgeo.2020.006, 2020a.
Schmid, T., Schreurs, G., Warsitzka, M., and Rosenau, M.: Effect of sieving height on density and friction of brittle analogue material: Ring-shear test data of corundum sand used for analogue experiments in the Tectonic Modelling Lab of the University of Bern (CH), GFZ Data Services [data set], https://doi.org/10.5880/fidgeo.2020.005, 2020b.
Schultz-Ela, D. and Walsh, P.: Modeling of grabens extending above evaporites in Canyonlands National Park, Utah, J. Struct. Geol., 24, 247–275, https://doi.org/10.1016/S0191-8141(01)00066-9, 2002.
Tingay, M., Muller, B., Reinecker, J., and Heidbach, O.: State and origin of the present-day stress field in sedimentary basins: New results from the World Stress Map Project, Golden Rocks 2006, The 41st US Symposium on Rock Mechanics (USRMS), 14 pp., ISBN 1604236221, 2006.
Tingay, M. R., Morley, C. K., Hillis, R. R., and Meyer, J.: Present-day stress orientation in Thailand's basins, J. Struct. Geol., 32, 235–248, https://doi.org/10.1016/j.jsg.2009.11.008, 2010.
Tron, V. and Brun, J.-P.: Experiments on oblique rifting in brittle-ductile systems, Tectonophysics, 188, 71–84, https://doi.org/10.1016/0040-1951(91)90315-J, 1991.
Trudgill, B. D.: Structural controls on drainage development in the Canyonlands grabens of southeast Utah, AAPG Bull., 86, 1095–1112, https://doi.org/10.1306/61EEDC2E-173E-11D7-8645000102C1865D, 2002.
Willemse, E. J.: Segmented normal faults: Correspondence between three-dimensional mechanical models and field data, J. Geophys. Res.-Sol. Ea., 102, 675–692, https://doi.org/10.1029/96JB01651, 1997.
Willemse, E. J., Pollard, D. D., and Aydin, A.: Three-dimensional analyses of slip distributions on normal fault arrays with consequences for fault scaling, J. Struct. Geol., 18, 295–309, https://doi.org/10.1016/S0191-8141(96)80051-4, 1996.
Withjack, M. O. and Jamison, W. R.: Deformation produced by oblique rifting, Tectonophysics, 126, 99–124, https://doi.org/10.1016/0040-1951(86)90222-2, 1986.
Zoback, M. L.: First-and second-order patterns of stress in the lithosphere: The World Stress Map Project, J. Geophys. Res.-Sol. Ea., 97, 11703–11728, https://doi.org/10.1029/92JB00132, 1992.
Zwaan, F. and Schreurs, G.: How oblique extension and structural inheritance influence rift segment interaction: Insights from 4D analog models, Interpretation, 5, SD119–SD138, https://doi.org/10.1190/INT-2016-0063.1, 2017.
Zwaan, F., Schreurs, G., Naliboff, J., and Buiter, S. J. H.: Insights into the effects of oblique extension on continental rift interaction from 3D analogue and numerical models, Tectonophysics, 693, 239–260, https://doi.org/10.1016/j.tecto.2016.02.036, 2016.
Zwaan, F., Schreurs, G., Ritter, M., Santimano, T., and Rosenau, M.: Rheology of PDMS-corundum sand mixtures from the Tectonic Modelling Lab of the University of Bern (CH), GFZ Data Services [data set], https://doi.org/10.5880/fidgeo.2018.023, 2018.