the Creative Commons Attribution 4.0 License.
the Creative Commons Attribution 4.0 License.
 | 27 Apr 2023
Spectral characterisation of hydrothermal alteration associated with sediment-hosted Cu–Ag mineralisation in the central European Kupferschiefer
Léa Géring
Moritz Kirsch
Samuel Thiele
Andréa De Lima Ribeiro
Richard Gloaguen
Jens Gutzmer
The analysis of hydrothermal alteration in exploration drill cores allows for fluid–rock interaction processes to be traced, for fluid flow paths to be identified, and thus for vectors in mineral systems to be determined. Hyperspectral imaging techniques are increasingly being employed to fill the scale gap between lab-based petrographic or geochemical analyses and the typical size of exploration targets. Hyperspectral imaging permits the rapid, cost-efficient, and continuous characterisation of alteration mineralogy and texture along entire drill cores, with a spatial sampling of a few millimetres. In this contribution, we present the results of an exploratory study on three mineralised drill cores from the Spremberg–Graustein Kupferschiefer-type Cu–Ag deposit in the Lusatia region of Germany. We demonstrate that hyperspectral imaging is well-suited to recognising and tracking the effects of hydrothermal alteration associated with strata-bound hydrothermal mineralisation. Micro X-ray fluorescence spectrometry was used to corroborate the alteration mineral assemblages identified in hyperspectral data acquired in the visible, near- (400 to 970 nm), shortwave (970 to 2500 nm), mid-wave (2700 to 5300 nm), and longwave infrared (7700 to 12 300 nm). We identified two main shortcomings of the technique, namely the overlapping of some mineral features (e.g. carbonate and illite absorption in the shortwave infrared) and the darkness of the organic-matter-rich dolostones and shales that results in low reflectance.
Nevertheless, spectral features associated with iron oxide, kaolinite, sulfate, and carbonates were successfully identified and mapped. We identified different markers of hydrothermal alteration spatially associated with or stratigraphically adjacent to Cu–Ag mineralisation. Importantly, we can clearly distinguish two mineralogically distinct styles of alteration (hematite and ferroan carbonate) that bracket high-grade Cu–Ag mineralisation. Intensive hydrothermal alteration is characterised by the occurrence of well-crystallised kaolinite in the sandstone units immediately below the Kupferschiefer horizon sensu stricto. Proximal Fe-carbonate and kaolinite alteration have not previously been documented for the high-grade Cu–Ag deposits of the central European Kupferschiefer, whereas hematite alteration is well-known in Kupferschiefer-type ore deposits. The latter marks the flow path of oxidising, metal-bearing hydrothermal fluids towards the site of hydrothermal sulfide mineralisation. In contrast, ferroan carbonate alteration in carbonate rocks located above the main mineralised zone is interpreted as a mark of hydrothermal fluid discharge from the mineralising system. Although this study is limited to a small number of drill cores, our results suggest that hyperspectral imaging techniques may be used to identify vectors towards high-grade Cu–Ag mineralisation in Kupferschiefer-type mineral systems.
- Article
(16990 KB) - Full-text XML
-
Supplement
(397 KB) - BibTeX
- EndNote


The central European Kupferschiefer is one of the largest and most prolific sediment-hosted copper districts globally (Borg et al., 2012). Economically important strata-bound Cu–Ag mineralisation occurs along the Permian-aged central European basin's southern margin in Poland and Germany. Whereas production in the Mansfeld–Sangerhausen region of central Germany ceased in 1990, the company KGHM Polska Miedz currently produces 0.5 Mt of Cu, 1000 t of Ag, and significant quantities of precious metals and molybdenum annually in the Lubin region of SW Poland. Current mining operations in Poland are the single most important source of Cu in Europe and the second most important source of Ag in global markets. Average copper grades in the Kupferschiefer deposits in Poland and Germany range between 1.5 wt % and 2 wt %, whereas average Ag grades are between 30 and 100 g t−1.
The Spremberg–Graustein deposit is located ca. 100 km west of the Lubin mining region in the Lusatia region of Germany. The deposit was discovered in 1953 and intensively explored between 1953 and 1974 (Kopp et al., 2012). The Kupferschiefer-type orebody at Spremberg–Graustein is located at a depth of ca. 900–1500 m and hosts at least 100 Mt of Cu–Ag ore, with average grades of 1.5 wt % Cu and 34 g t−1 of Ag (Kopp et al. (2012) note that these are mainly historical resource figures and that they do not comply with current international reporting regulations, e.g. according to the JORC or NI43-101 codes). Renewed exploration activity commenced in 2007. The Kupferschiefer Lausitz GmbH drilled a number of new exploration cores for resource confirmation purposes. These drill cores have been the subject of several mineralogical and petrographic studies (Minz, 2011; Lehmann, 2012; Stoll, 2014; Kehrer, 2016) that have provided valuable insight into the ore and gangue mineralogy of the Spremberg–Graustein deposit. However, mineralogical characterisation, especially of the fine-grained gangue mineralogy, has proven difficult using traditional methods. Moreover, studies at the decimetre scale only provide sparse and discontinuous information, making it difficult to assess the spatial distribution of hydrothermal alteration and mineralisation.
In this study, hyperspectral drill core imaging (HSI) is used to characterise the effect of the hydrothermal alteration on the gangue mineralogy within and adjacent to strata-bound Cu–Ag mineralisation in the Spremberg–Graustein deposit. We applied visible to near-infrared (VNIR), shortwave infrared (SWIR), mid-wave infrared (MWIR), and longwave infrared (LWIR) hyperspectral techniques to constrain the distribution of alteration mineral assemblages along three exploration drill cores. Infrared spectroscopy is based on the interactions of infrared light with molecules. The signals can be analysed by measuring absorptions, emissions, and reflections (Burns, 1993; Harraden et al., 2013). Infrared spectrometers measure light at wavelengths covering the infrared domains reflected by or radiating from the sample surface. In the SWIR and MWIR domains, certain minerals have diagnostic absorption features (Thompson et al., 1999; GMEX, 2008; Laukamp et al., 2021). In the case of LWIR, it is possible to either measure reflected or emitted radiation. Mineral identification is accomplished by combining characteristic spectral features and their distinctions using subtle shifts in position, depth, or shape (Thompson et al., 1999; van der Meer, 2004; Jones et al., 2005; Harraden et al., 2013).
Hyperspectral mapping has been widely applied in mining and mineral exploration (e.g. Bedini, 2017). Extensive studies have highlighted the relevance of HSI and the support it can provide in characterising alteration mineral assemblages associated with hydrothermal ore deposits in magmatic (e.g. Herrmann et al., 2001; Jones et al., 2005; Zamuido, 2009; Riley et al., 2008; Ngcofe et al., 2013; Swayze et al., 2014; Kruse, 2015), orogenic (e.g. Bierwirth et al., 2002; Mateer, 2010; Laukamp et al., 2011; Arne et al., 2016; Wang et al., 2017), and sedimentary environments (e.g. Taylor et al., 2005; Jakob et al., 2016). The benefits of this technology still need to be explored for hydrothermal ore deposits in sedimentary environments, such as Kupferschiefer-type deposits. The present contribution builds on previous work on the hyperspectral characterisation of similar deposits (e.g. Bedini, 2017; Lampinen et al., 2017) to (1) characterise the hyperspectral response of host rock and alteration mineral assemblages associated with Kupferschiefer-type mineralisation and (2) demonstrate the complementary nature of data collected over an extended hyperspectral range (VNIR, SWIR, MWIR, and LWIR). The study places particular focus on the following three spectrally active mineral groups: the kaolinite, carbonate, and iron-oxide groups. All three mineral groups have been previously associated with hydrothermal alteration in the Kupferschiefer (Schmidt, 1987; Minz, 2011; Borg et al., 2012) and so have the potential to help map fluid pathways associated with strata-bound Cu–Ag mineralisation.
2.1 The central European Permian Basin
The Kupferschiefer is a thin but laterally persistent carbonaceous shale unit that is interpreted as a mark of rapid marine transgression into the central European Southern Permian Basin (CESB) at 257.3 ± 1.6 Ma. The CESB constitutes a network of aborted rift basins extending into the arid continental interior of the supercontinent Pangea (McKie, 2017). It originated as an intracratonic foreland basin formed as a successor basin to the Variscan foredeep in the immediate aftermath of the Variscan orogeny at the end of the Carboniferous period (ca. 300 Ma; Coward, 1995; Borg et al., 2012).
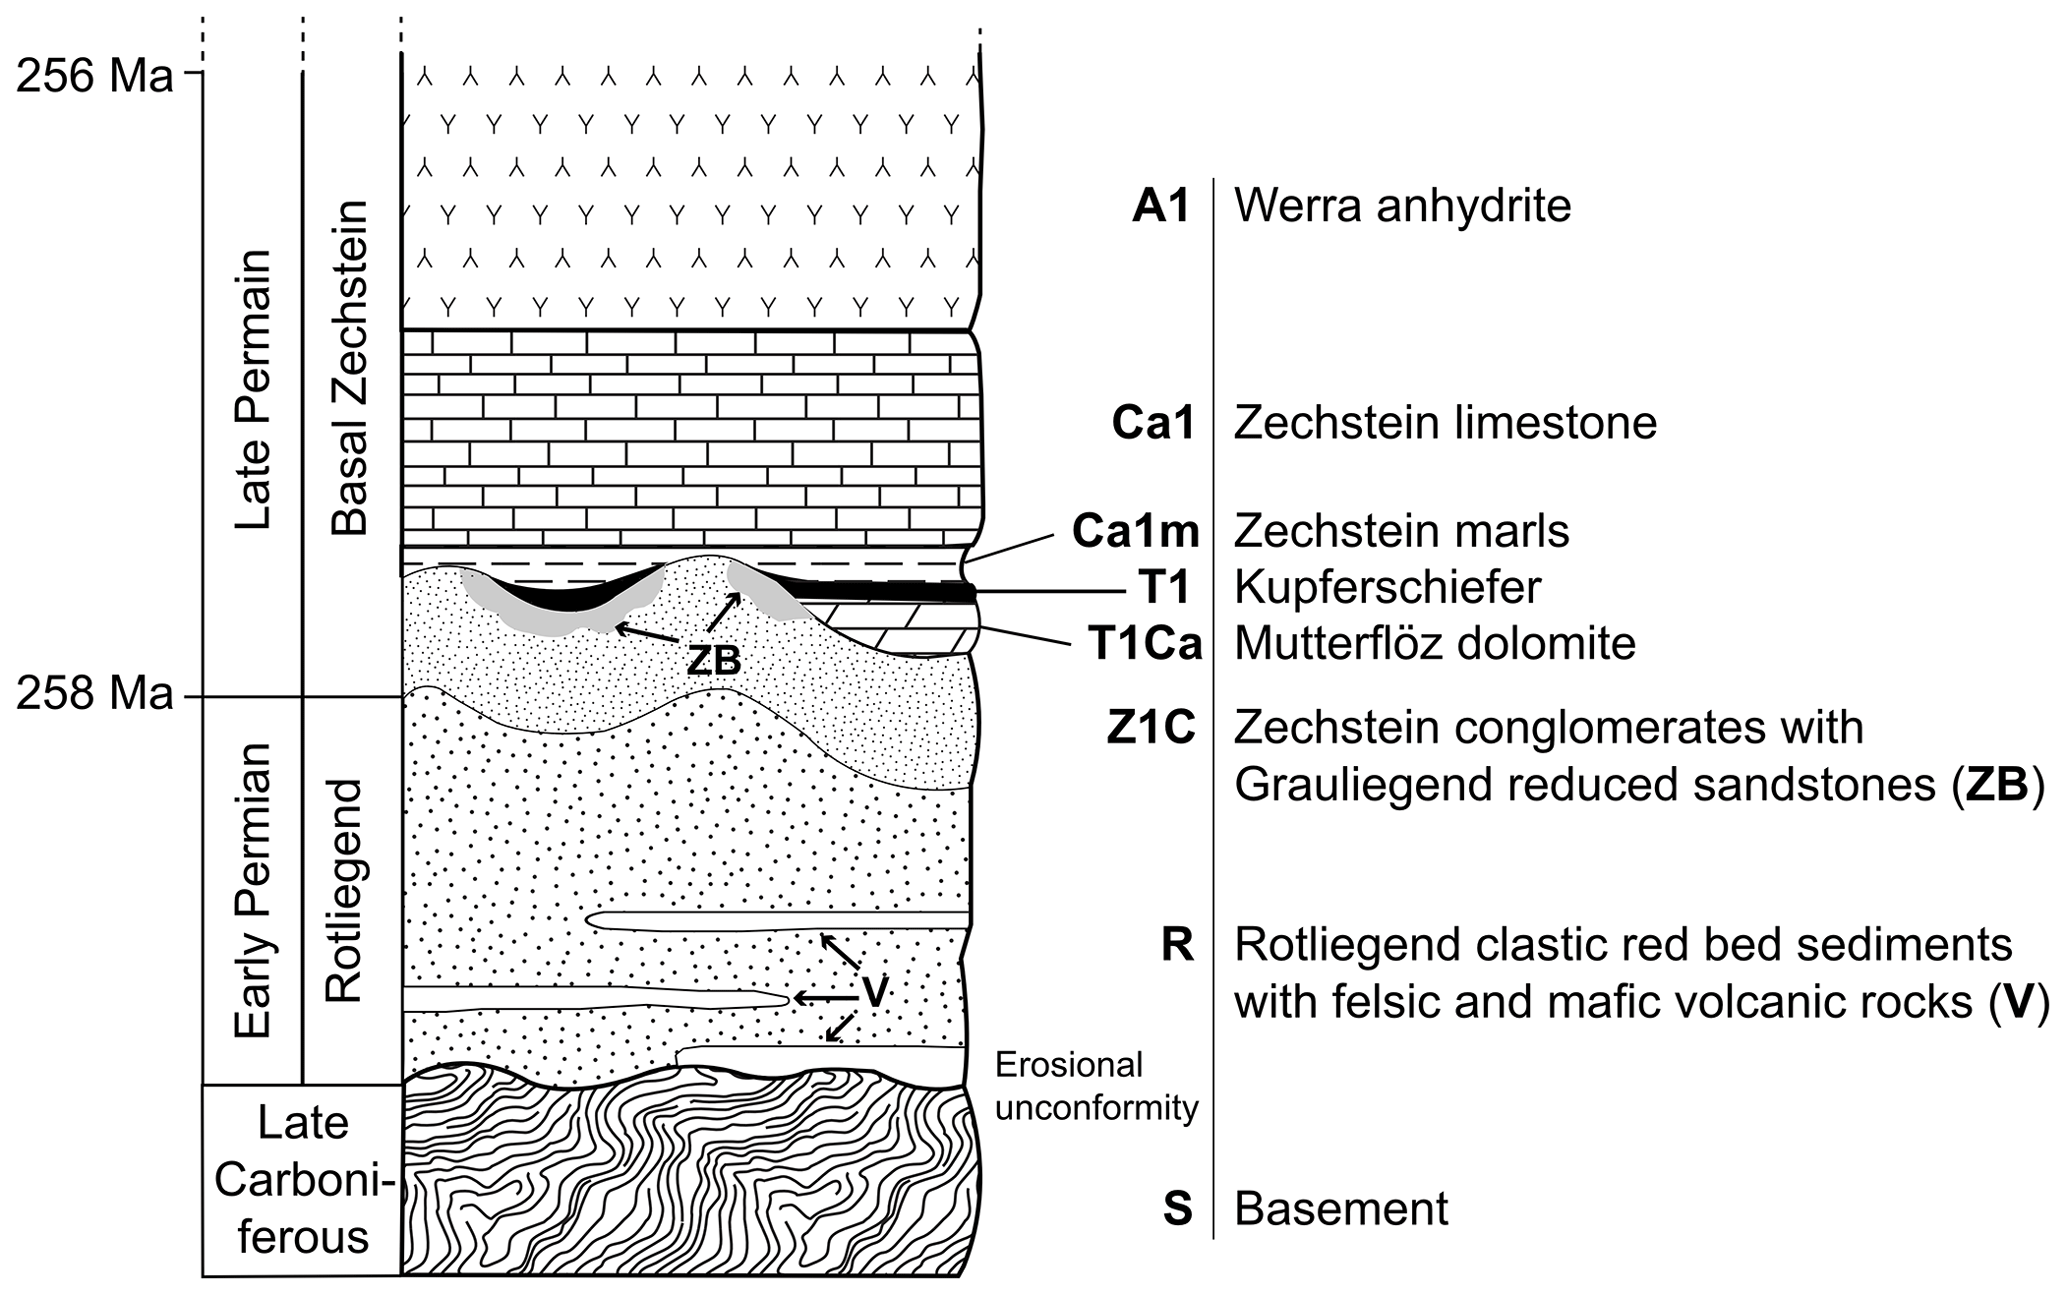
Figure 1Stratigraphic units in the southern part of the CESB – modified after Kopp et al. (2010).
The general stratigraphy of the basal infill in the southern part of the CESB (Fig. 1), which is relevant for this study, can be described as follows: the CESB infill overlies, with a marked erosional unconformity, basement lithotypes that have been variably deformed and metamorphosed during the Variscan orogeny. The immediately overlying succession is of very variable thickness and architecture; it comprises immature continental red beds and distinctly bimodal volcanic rocks of Lower Permian (Rotliegend) age. The top of the Rotliegend succession is typically represented by white to grey sandstones (Borg et al., 2012). The deposition of the Kupferschiefer, a thin (usually less than a metre thick) but highly carbonaceous shale unit, occurred in response to rapid marine transgression across the CESB and marks the contact between the terrestrial Rotliegend succession and the conformably overlying marine Zechstein succession. From base to top, the Zechstein succession comprises the Kupferschiefer sensu stricto, followed by several cycles of marine sedimentary rocks, including dolostone and limestones, anhydrite and gypsum, and evaporites (McKie, 2017).
2.2 The Kupferschiefer: mineralisation and metallogenic model
The Kupferschiefer-type ore deposits in the CESB are classic examples of strata-bound polyphase and polymetallic mineral systems in sedimentary basins (Borg et al., 2012). Hydrothermal Cu–Ag mineralisation essentially centres around the Kupferschiefer shale unit. The Kupferschiefer itself, the underlying sandstone, and the Zechstein limestone overlying the Kupferschiefer sensu stricto may all be host to hydrothermal sulfide mineralisation, with the total thickness of the mineralised interval ranging from less than 30 cm to more than 50 m. The Kupferschiefer-type Cu–Ag ores are certainly of polyphase origin (Borg et al., 2012), yet, the bulk of mineralisation is recognised to be mostly of dia- to epigenetic origin. High-grade Cu–Ag and subeconomic Pb–Zn sulfide ores occur at increasing distances from a redox front that marks oxidative alteration caused by metal-bearing hydrothermal basinal brines. The latter likely derived their metal content from the Rotliegend volcano-sedimentary basin infill and possibly from sheared and faulted basement rocks, i.e. the mid-European Crystalline High below the Kupferschiefer (Kucha, 1990; Borg et al., 2012). The hematite-bearing oxidised rocks, colloquially known as Rote Fäule, mark the flow path of the metal-bearing brine towards the redox front as the site of ore formation. The Kupferschiefer, with its high organic carbon content, acted as a geochemical trap and physical barrier (Kucha, 1990; Borg et al., 2012; Speczik and Puttman, 1987). Metal sulfides precipitated from the brines wherever reducing conditions prevailed beyond the extent of the redox front. Sulfide textures are exceptionally variable, ranging from dissemination, impregnation, replacement, and veinlet-hosted to semi-massive textured ores (Borg et al., 2012). The sulfide ores show a distinct zonation, with local Au enrichment observed on the oxidised side of the redox front and Cu–Ag-rich ores occurring immediately adjacent but on the reducing side of the redox front. With increasing distance to the redox front, ores become more Pb- and Zn-rich (Wodzicki and Piestrzyński, 1994; Schmidt, 1987; Borg et al., 2012).
An Upper Jurassic extensional tectonic event that caused the reactivation of Variscan basement faults may have allowed hydrothermal fluids from the basement to ascend into the overlying sedimentary basin (Symons et al., 2010). The hematitic redox front in the mineralised shales was dated at 149 ± 3 and 53 ± 3 Ma using palaeomagnetic techniques. Nonetheless, the exact chronology of hydrothermal fluid flow and Cu–Ag ore formation remains uncertain.
The diagenetic to epigenetic model presumes large-scale and multi-stage mass transfer through fluid systems active during different stages of the basin evolution (Bechtel et al., 2001), e.g. fluid convection in permeable sedimentary units during basin subsidence, progressive devolatilisation of the basin sequence, and later fluid percolation during Cretaceous tectonic reactivation (Wodzicki and Piestrzyński, 1994; Schmidt-Mumm and Wolfgramm, 2004; Symons et al., 2010; Borg et al. 2012).
2.3 The Spremberg–Graustein deposit
The Spremberg–Graustein deposit is situated near the southeastern margin of the CESB in Lusatia in the states of Brandenburg and Saxony, Germany (Fig. 2). The known deposit covers an area of ca. 14 km in length and 3 km in width and can be subdivided into two distinct portions, namely Spremberg and Graustein. These are separated by the so-called Türkendorf Graben that is of Cretaceous age (Kopp et al., 2006, 2008). The ore-bearing succession occurs 800 to 1500 m below the present-day surface and dips gently towards the NE (Kopp et al., 2006, 2008). The well-mineralised zone is 2.4 m thick on average but locally reaches 8.2 m in thickness (Kopp et al., 2006). Cu–Ag resources are almost equally distributed between sandstones (ca. 31 %), carbonaceous shale and marl (ca. 46 %), and Zechstein carbonate rocks (ca. 23 %); the total metal content is estimated to be 1.5 Mt of Cu, with considerable quantities of Ag, Pb, and Zn (Kopp et al., 2012).
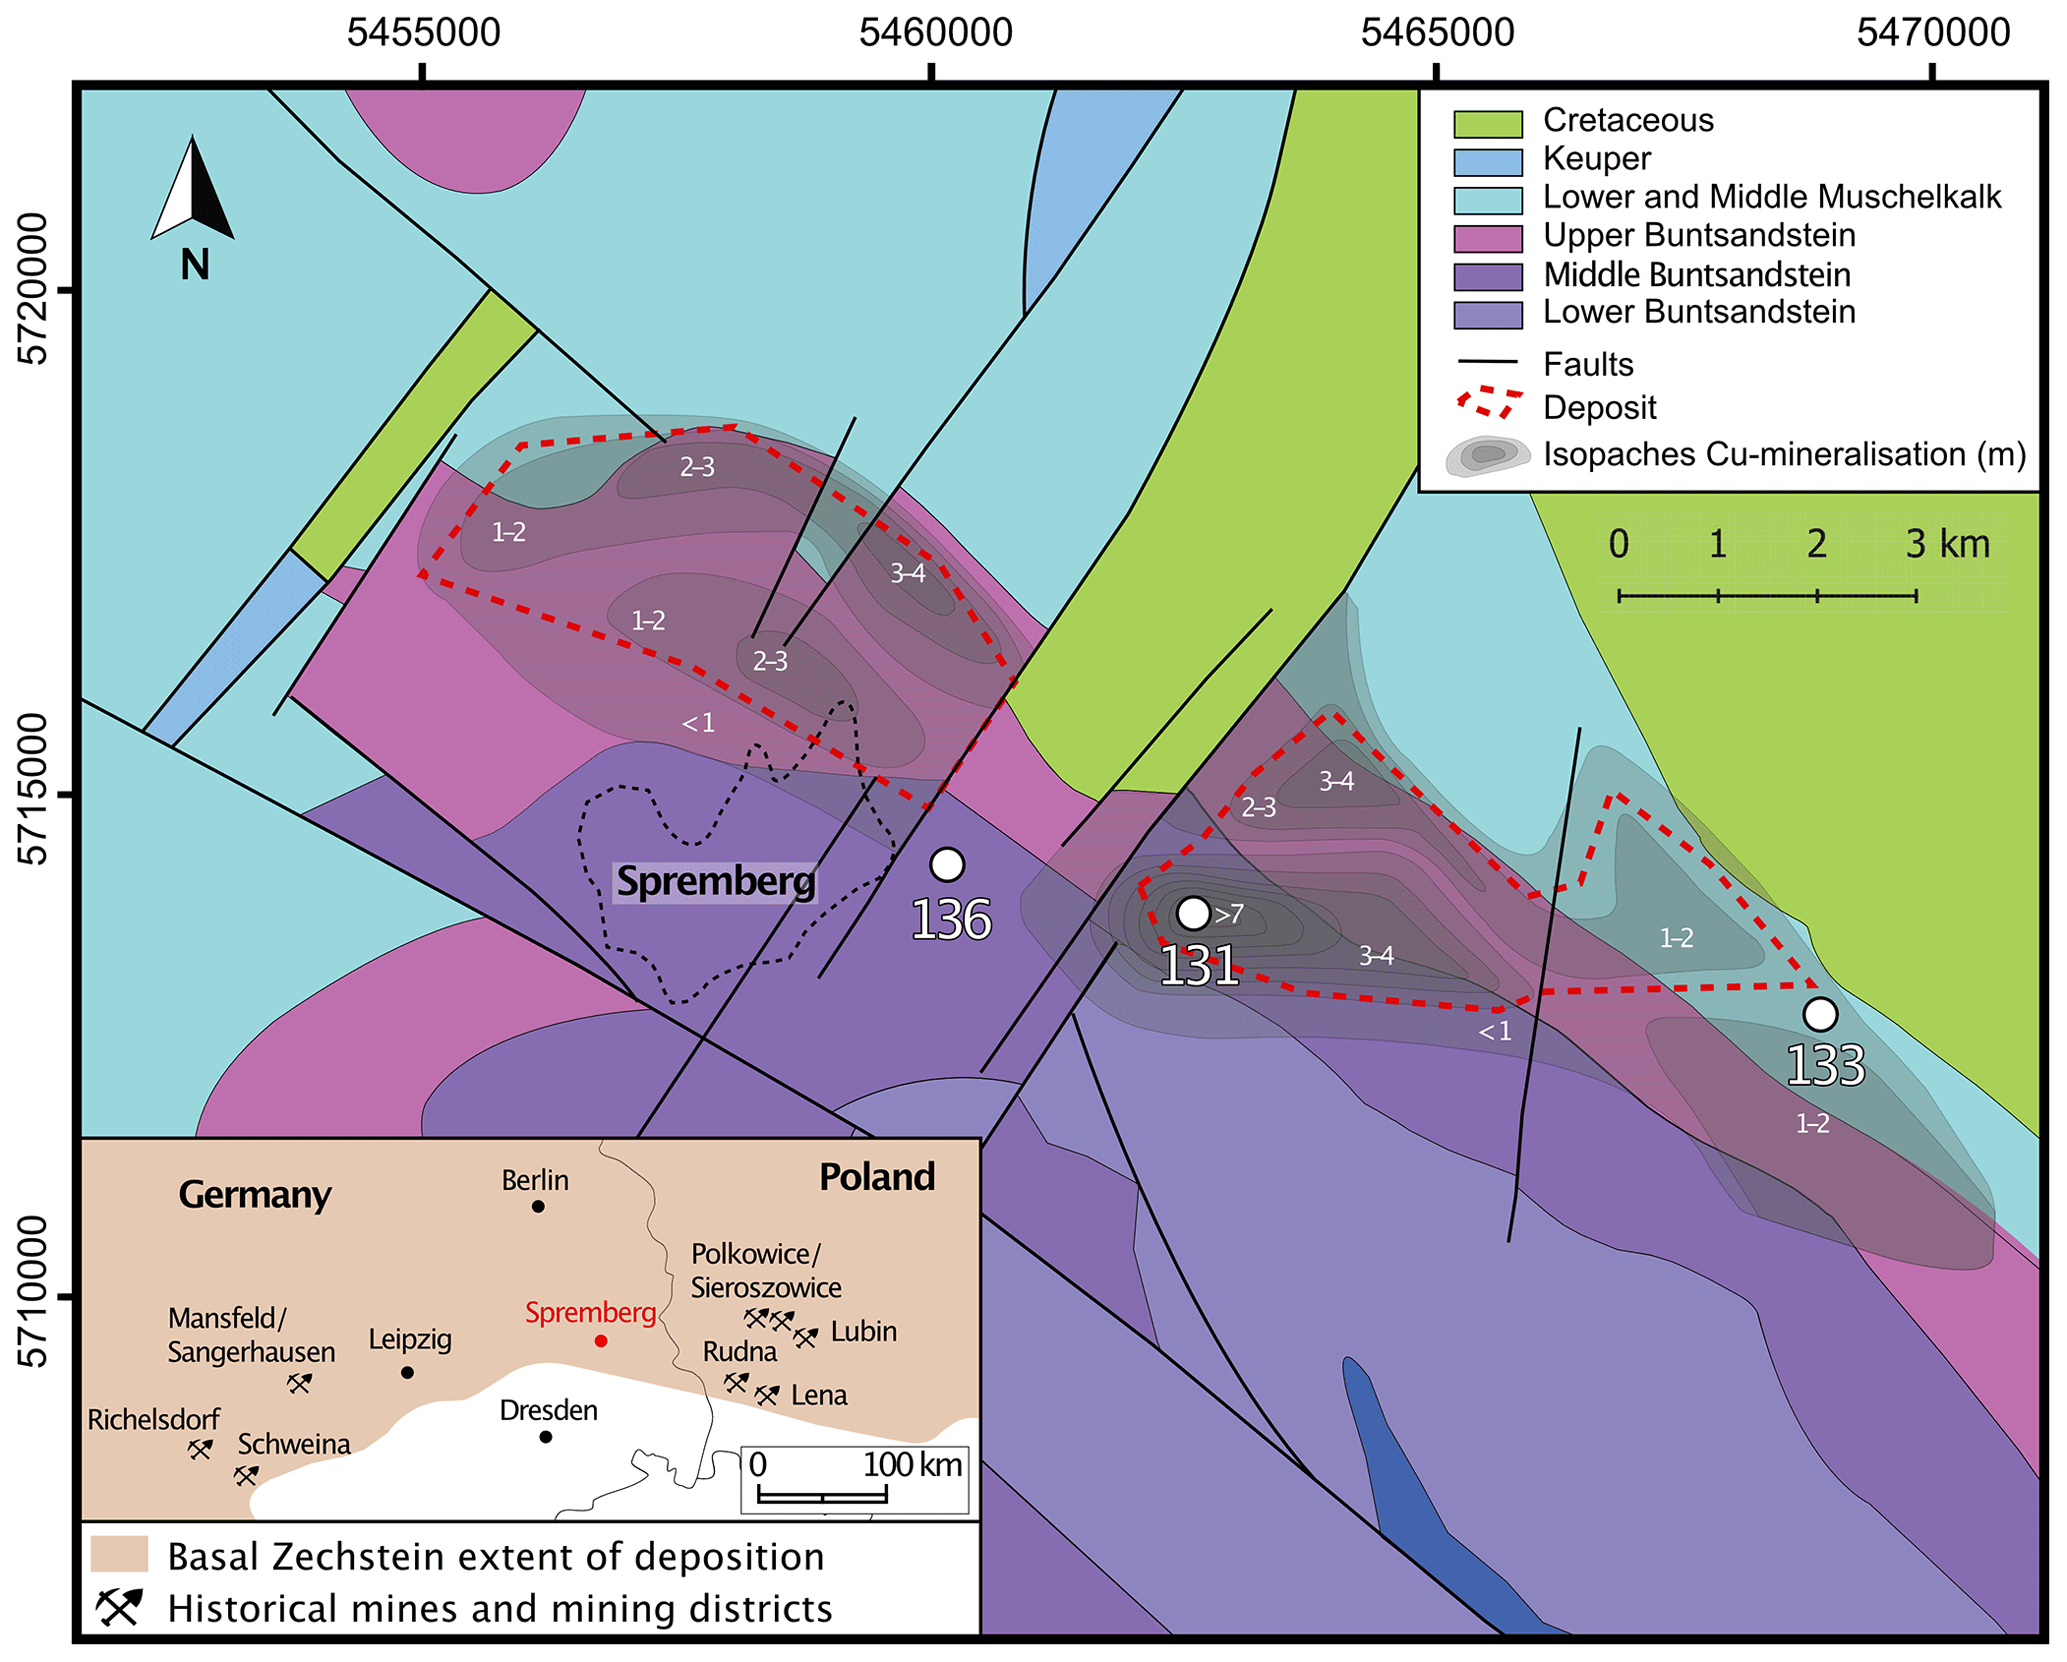
Figure 2Geological map of the Spremberg–Graustein area showing the thickness of the economic Kupferschiefer-type mineralisation (after Kopp et al., 2006) and the location of the three drill holes that were the subject of this study. Coordinate system: RD/83 Gauss–Krüger zone 5.
The mineralised succession is overlain by the Werra Anhydrite succession that has a thickness of 200 m in total, followed by a 300 m thick Buntsandstein succession. The Muschelkalk and the Cretaceous successions are only preserved in the Cretaceous Türkendorf graben structure, with the remainder having been removed by erosion. The Cretaceous-aged erosional unconformity is covered by a blanket of Cenozoic sediments approximately 100 m thick (Kopp et al., 2006).
The Spremberg–Graustein deposit is located on the northern flank of the Mulkwitz structure, a horst developed during Cretaceous SW–NE compression (Hartsch, 2015). The structure is bordered by NW–SE trending faults and subdivided by numerous NE–SW trending faults (Kopp et al., 2012). The faults forming the Türkendorf Graben are synthetic NE–SW downthrown faults (Franz et al., 1967) that were active during the Lower Zechstein and from the Cretaceous to the Tertiary (Hartsch, 2015).
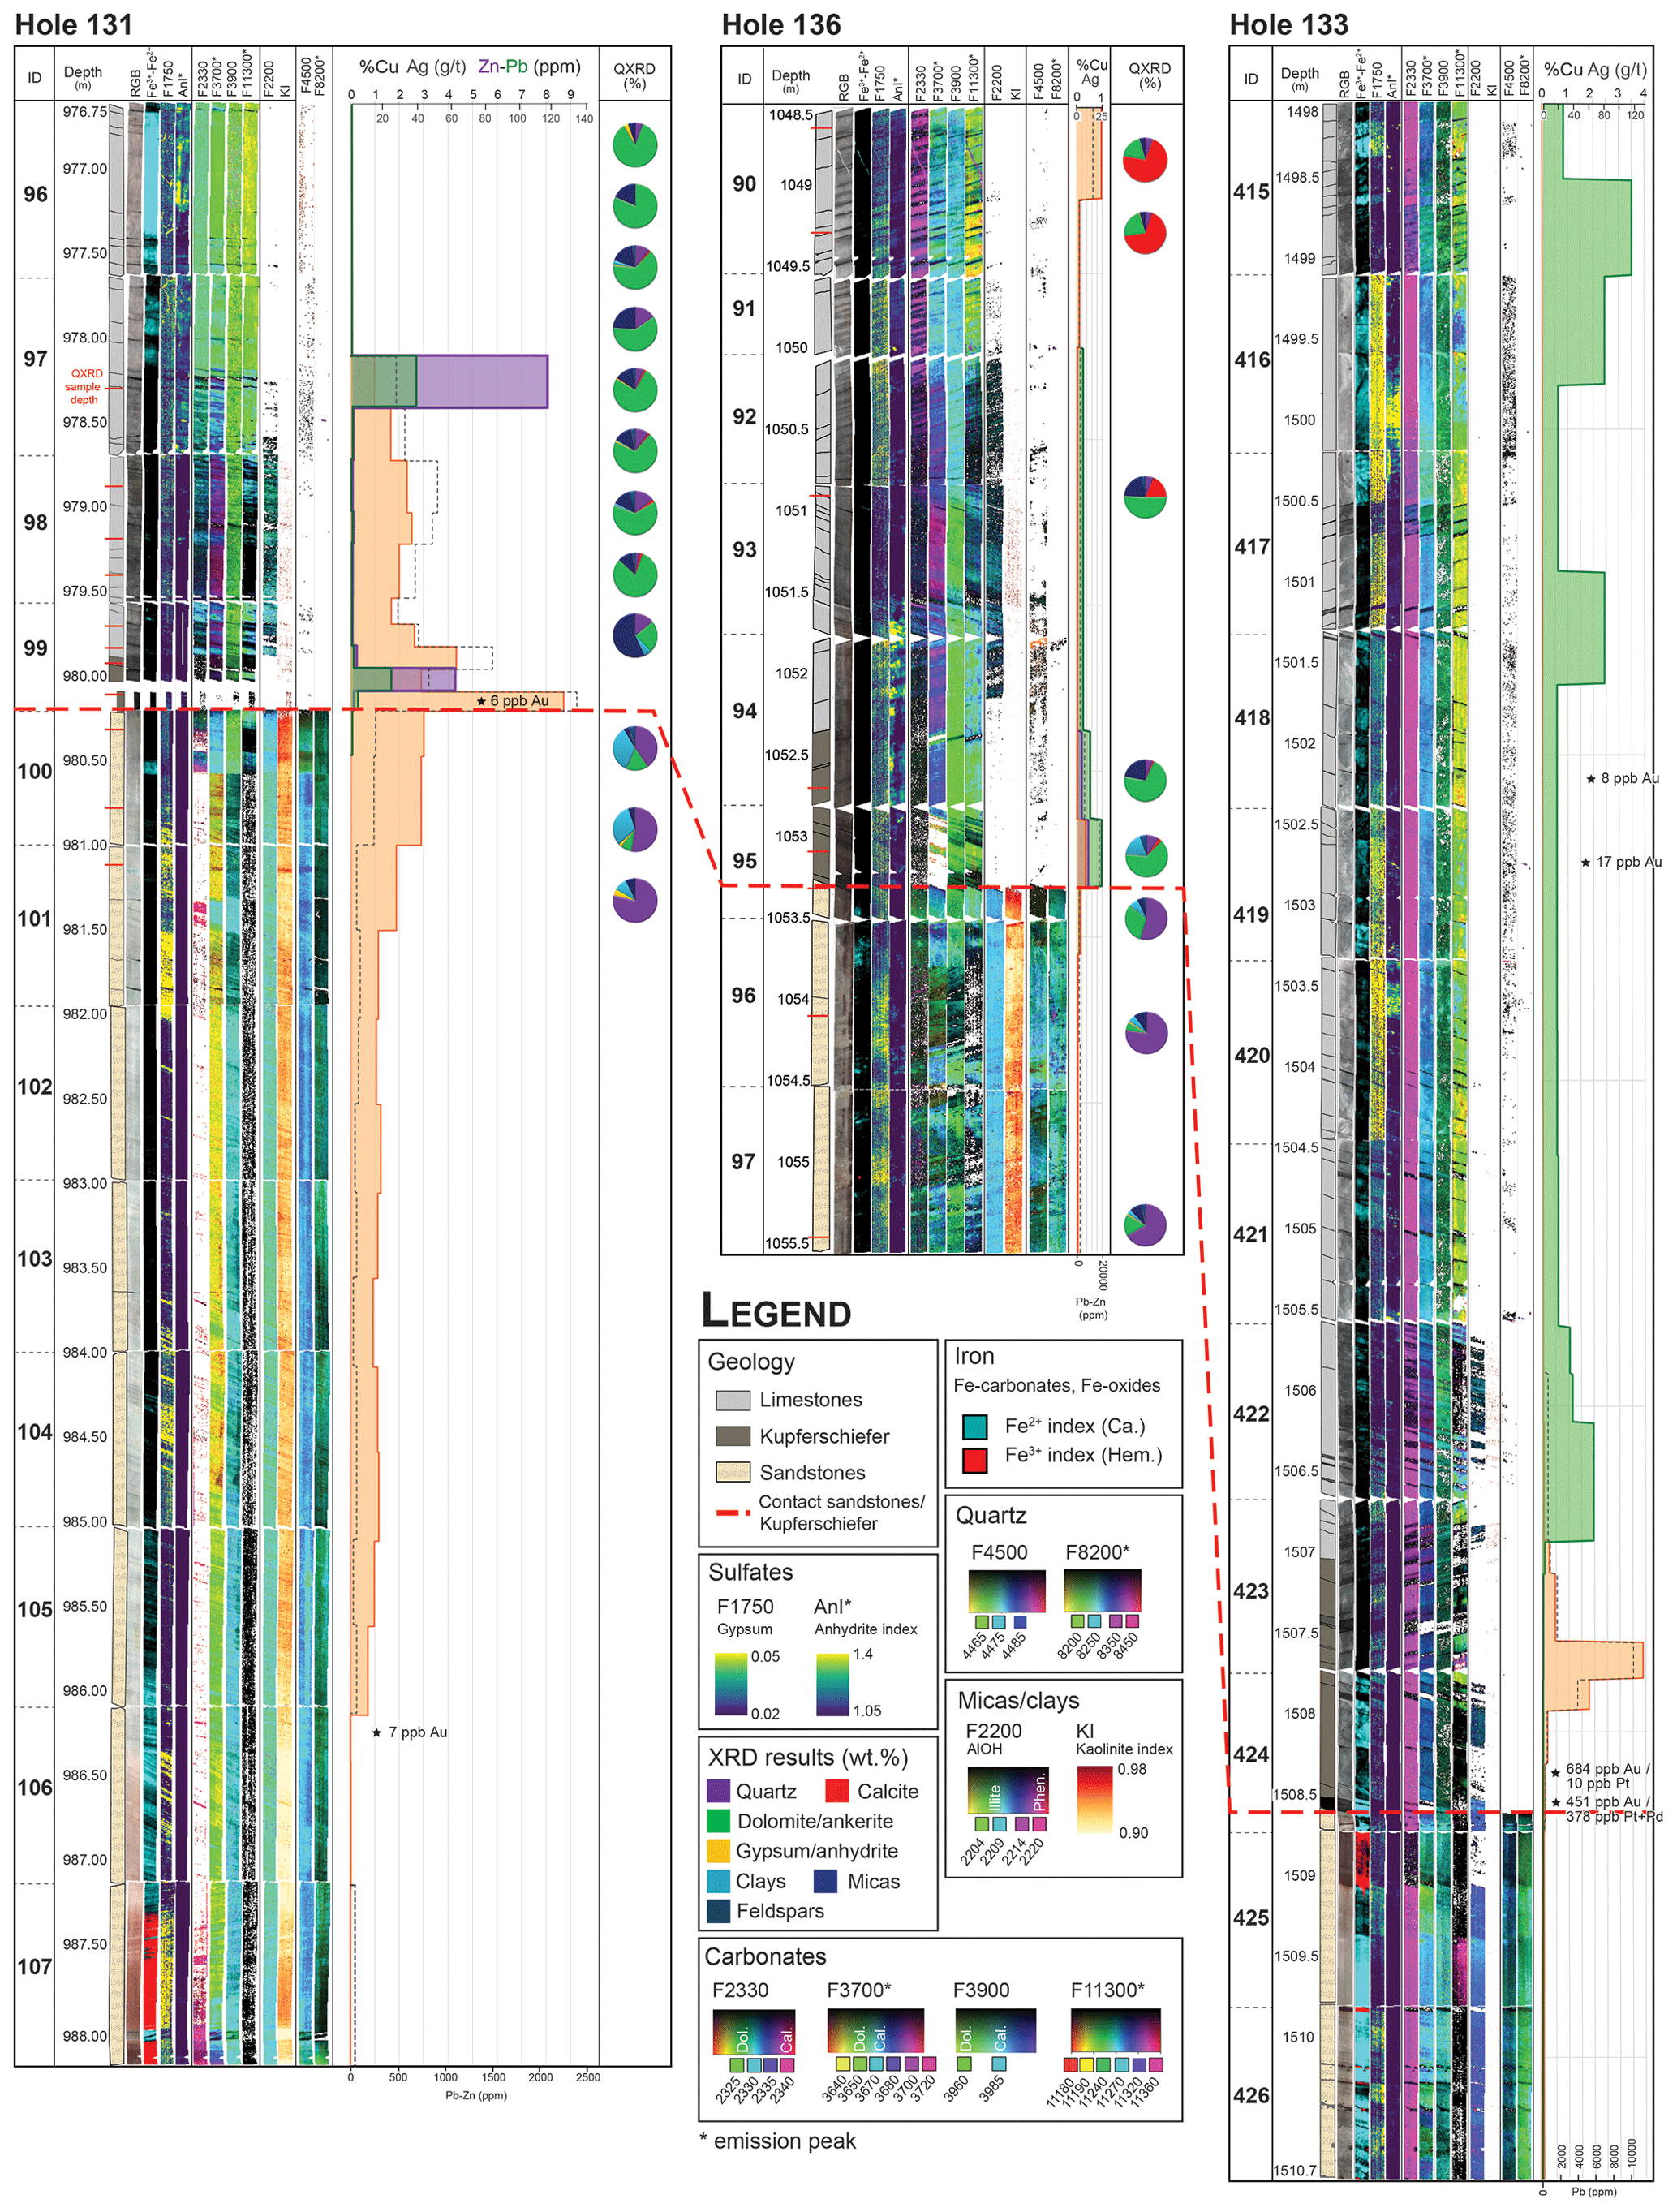
This study focuses on mineralised intervals in diamond drill holes intersecting the Kupferschiefer near the town of Spremberg (131, 133, 136 – Fig. 2). Sandstone, shale (Kupferschiefer sensu stricto), and dolostone of the basal Zechstein succession are intersected in all three drill cores. Drill core 131 is well-mineralised, with grades above 0.8 % Cu in an 8 m long section and a Cu grade of 8.7 wt % in the Kupferschiefer sensu stricto. Drill core 133 exhibits economic copper grades only in the Kupferschiefer sensu stricto, reaching a maximum of 3.9 wt % half a metre above the sandstone–shale contact. Drill core 136 is less well-mineralised. It contains two spatially distinct sections of mineralisation with grades of 0.33 wt % and 1 wt % Cu, respectively: one at the contact between shales and sandstone and another 4 m above in limestones (Fig. 3). Cu mineralisation comprises Cu and Cu–Fe sulfides, including chalcocite (Cu2S), digenite (Cu1.75S5), covellite (CuS), bornite (Cu5FeS4), and chalcopyrite (CuFeS2; Kopp et al., 2006; Spieth, 2019).
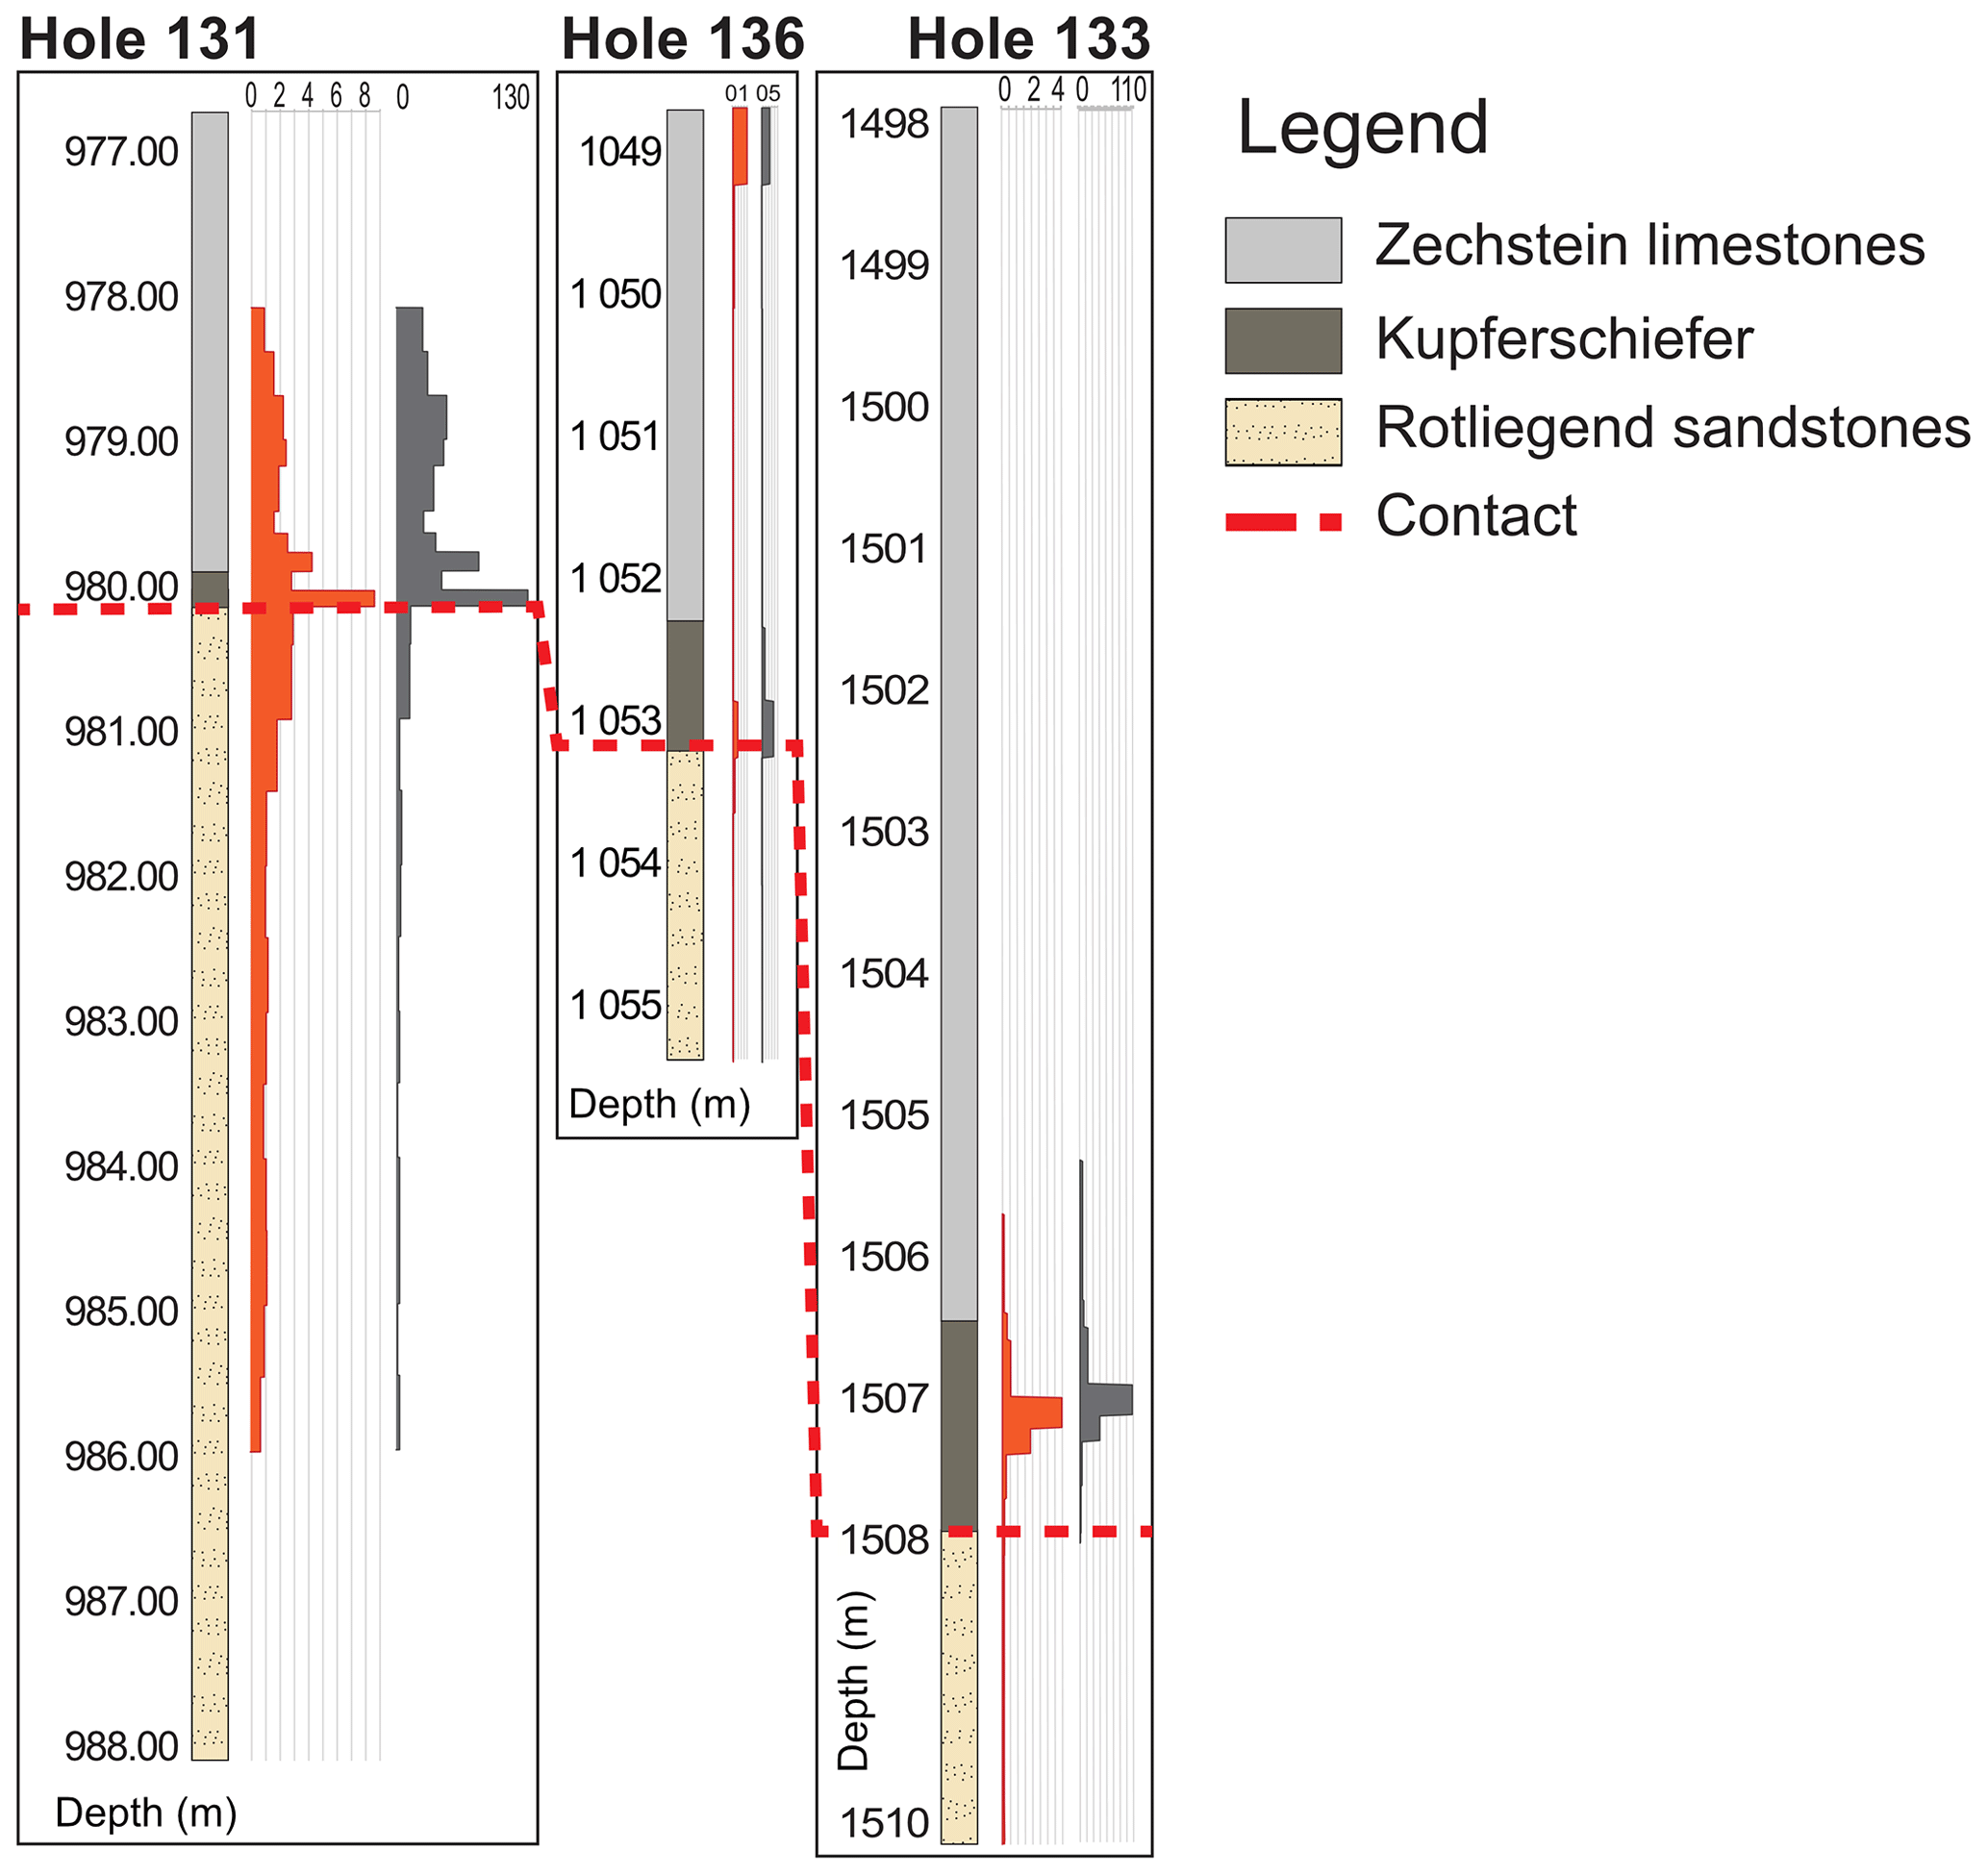
Figure 3Lithology, copper (red in wt %), and silver (grey in g t−1) grades in the drill cores available for this study.
3.1 Data acquisition
Hyperspectral data were acquired for the three drill cores using a SisuROCK drill core scanner (Fig. 4) equipped with Specim AisaFENIX, FX50, and AisaOWL hyperspectral push-broom sensors (Spectral Imaging Ltd., Oulu, Finland; Table 1). The scanner is equipped with internal lighting and a moving tray that moves under the scan line of each sensor. Dark current corrections are used to remove hot pixels and other fixed-pattern noise. For VNIR and SWIR acquisition, we used a grey panel (Spectralon R50) as a reference instead of a conventional white panel, as longer integration times were required to improve the signal-to-noise ratio of the overall dark shales and carbonates. For MWIR and LWIR acquisitions, a diffuse aluminium panel was used for reference and for subsequent conversion to reflectance.
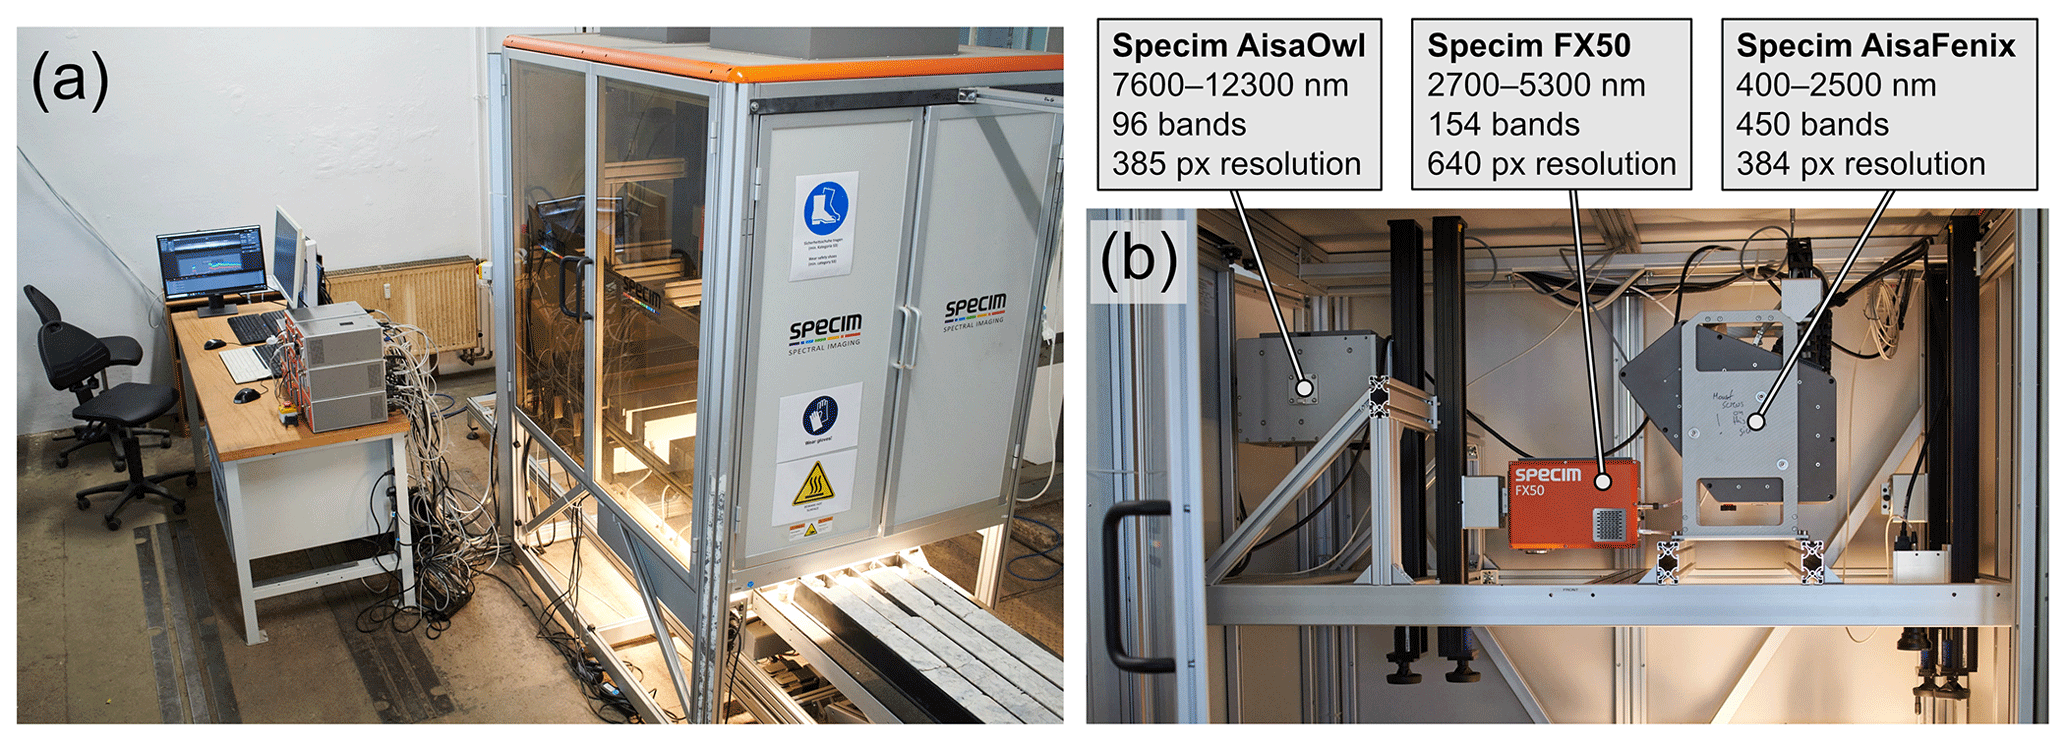
Figure 4(a) Specim SisuROCK hyperspectral drill core scanner with (b) mounted sensors in the visible to near-infrared and shortwave infrared (VNIR and SWIR), mid-wave infrared (MWIR), and longwave infrared (LWIR) range.
Table 1Acquisition parameters of the SisuROCK drill core scanner.

3.2 Image processing
The acquired hyperspectral data were preprocessed using hylite (Thiele et al., 2021) to (1) convert from radiance to reflectance, (2) apply geometric correction to remove lens distortions, and (3) co-register the data from different sensors. After co-registration, background pixels were manually masked from each tray, and the images were mosaicked (per sensor and drill hole) for subsequent analyses.
Hyperspectral data can be used to derive quantitative mineral maps where appropriate training data are available (Tusa et al., 2020; De La Rosa et al., 2021), but the preparation of training samples usually takes days or weeks. This study focuses on spectral tools that can be rapidly applied for qualitative mapping and interpretation. In this study, we identify and map the position or depth of specific absorption or emission features, which are known to correspond to relevant minerals or elements. Key minerals that can be spectrally identified in the Kupferschiefer are outlined in Tables 2 and 3. We used band ratios and minimum wavelength mapping, implemented in hylite (Thiele et al., 2021) to identify minerals characteristic of a lithological unit or the products of hydrothermal alteration. For simplicity reasons, we refer to these diagnostic minerals as proxies. Band ratios are a simple and robust technique for identifying spectral features. In its simplest form, the reflectance measured at the wavelength corresponding to the shoulder of an absorption feature is divided by the reflectance measured at its minimum, giving values equal to 1 if no absorption is present and larger values as absorption depth increases. For example, with iron indices, such as 600570 nm for Fe3+ and (920 nm + 1650 nm)(1230 nm + 1035 nm) for Fe2+ (Cudahy et al., 2008), we can quantify the depth of two broad but characteristic absorption features in the VNIR and SWIR range, present respectively in the 500–750 nm range and the 750–1400 nm range (GMEX, 2008; Laukamp et al., 2021). The band ratios we applied to characterise the Kupferschiefer cores are listed in Table 2.
Table 2Spectral indices for relevant proxies in the Kupferschiefer and its host rock succession at the Spremberg–Graustein deposit.

Minimum wavelength (MWL) mapping fits spectral absorption features using one or more simple mathematical functions, in our case asymmetric Gaussian functions (Thiele et al., 2021), to resolve a measured (and hull-corrected) spectrum into specific absorption positions and depths (Van der Meer, 2004; Van Ruitenbeek et al., 2014). For example, three Gaussian functions can be fitted to hull-corrected reflectance spectra in the 2100–2400 nm range. The relative depths and positions of these functions are used to constrain the likely mineral mixtures present. As the combined depth and position (wavelength) of these features is informative, minimum wavelength maps are commonly visualised using hue to represent feature position and brightness to represent feature depth. Minerals with diagnostic absorption features (e.g. gypsum, which has a diagnostic absorption at 1750 nm) can be qualitatively identified using feature depth alone. Minerals with overlapping spectral features (e.g. calcite and dolomite) can only be discriminated by combining absorption depth and position information. The main spectral ranges that were mapped using the MWL technique, and our interpretation of the resulting features, are listed in Table 3.
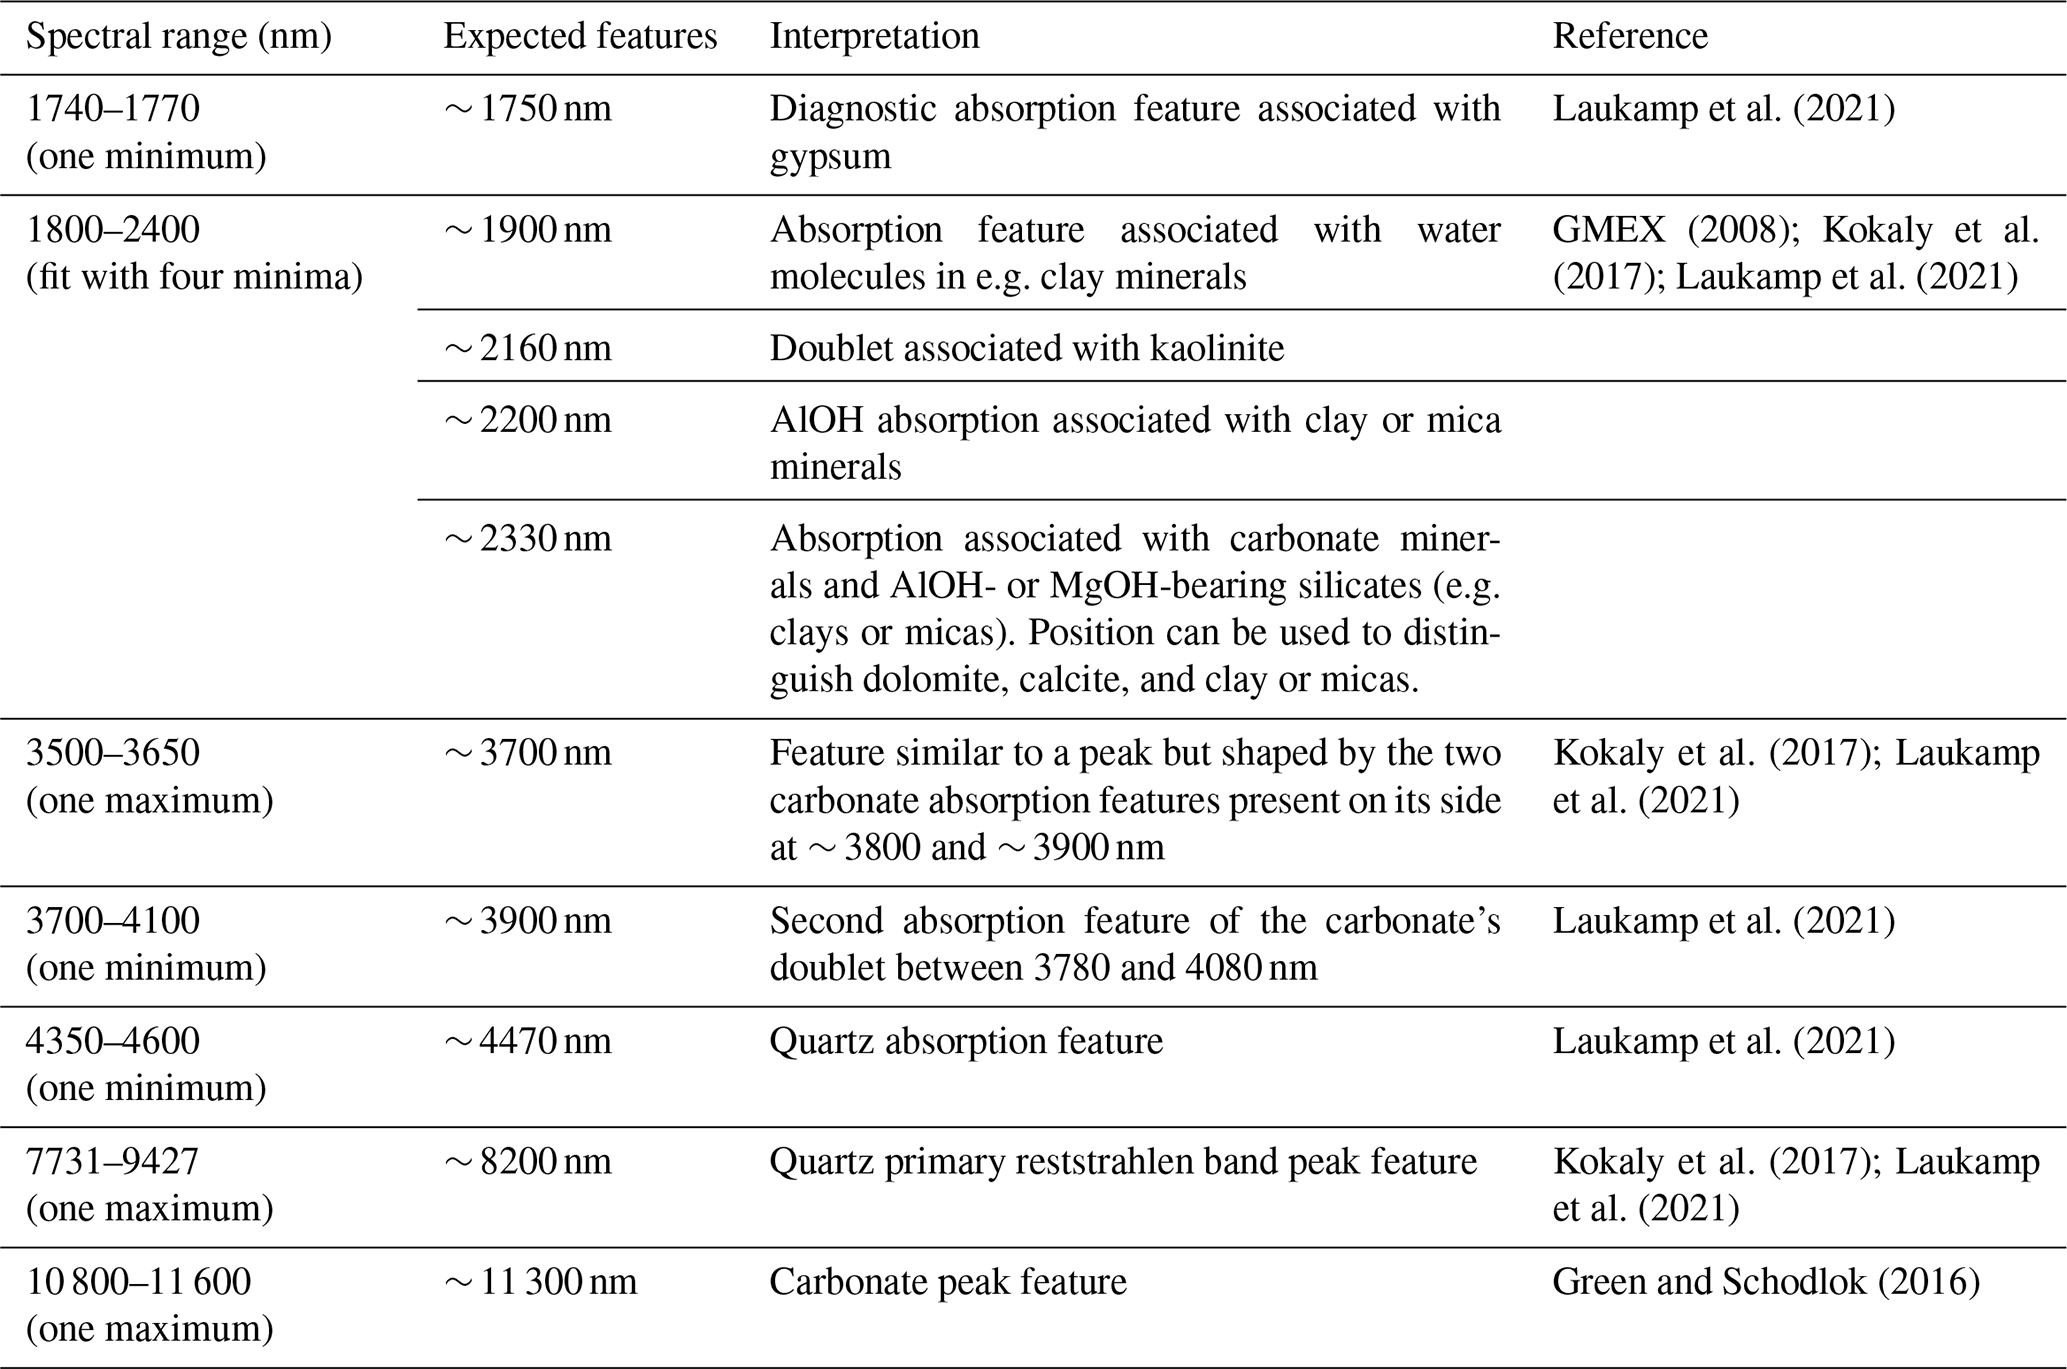
Table 3Spectral ranges used to extract the positions and depths of specific absorption and emission features using minimum wavelength mapping techniques.
3.3 Micro XRF validation
Micro X-ray fluorescence (XRF) is a spatially resolved, non-destructive technique for the elemental analysis of geological samples (Tagle et al., 2019). It benefits from the combination of element-specific X-ray fluorescence detection and rasterised data acquisition. The generated elemental maps can be used as training data to derive mineral abundance from HSI (Barker et al., 2021). In this study, we use XRF elemental maps for the qualitative and quantitative geochemical validation of hyperspectral mineral maps. Data acquisition and processing were performed using a Bruker M4 Tornado XRF spectrometer at the Helmholtz Institute Freiberg for Resource Technology. An excitation beam of 20 µm was generated by applying a high voltage (50 kV) to a rhodium anode and was focussed on the sample surfaces by polycapillary lenses. XRF signals emitted by the samples were collected for 70 ms by two detectors (count rate of 275×103 counts per second each) at a spatial resolution of 300 µm per pixel, obtaining distribution maps for elements heavier than Na. We obtained quantitative estimates for element concentrations using the Bruker M4 Qmap tool, which relies on fundamental parameter (FP) models for standardless quantification of elements and compounds present in XRF elemental maps. FP models are particularly useful when certain elements cannot be directly measured due to limitations inherent to the equipment (e.g. elements lighter than Na) and are dependent on the sample's elemental composition, instrument-specific information, mathematical constants, and known stoichiometric ratios (Bruker Nano GmbH, 2019). For this study, we did assume that all elements considered (Al, Ca, Cu, Fe, K, Mg, Mn, O, Pb, S, Si, and Zn) are present as oxides and hence generate oxide abundance maps. This is despite the fact that it is safe to assume that Cu, Pb, and Zn are all present as sulfides and that sulfur may be present as sulfide or sulfate.
The spectral proxies described in the previous section (Sect. 2.2) characterise the distribution of the main rock-forming and alteration minerals in the three studied drill cores. The drill cores have been assembled and plotted on a graphic log (Appendix A) and an averaged 10 cm resolution downhole log (see the Supplement) to allow for easy comparison and interpretation. Previous studies have revealed that the mineralised Kupferschiefer sensu stricto in Lusatia and SE Poland comprises a very fine-grained mixture of clay-sized (< 2 µm) sheet silicates (illite, kaolinite, chlorite, and dickite), carbonate minerals (ankerite, minor calcite, and prominent dolomite), organic matter, and sulfides (chalcocite, bornite, covellite, digenite, chalcopyrite, and djurleite; Rahfeld et al., 2018; Kehrer, 2016). Due to the abundance of organic matter, the Kupferschiefer sensu stricto is dark grey to almost black; its response to HSI is thus relatively flat, with very low reflectance, and unspecific. The same limitation does not apply to the sandstone and the Zechstein carbonate rock. Critical observations regarding these two lithologies are summarised below.
4.1 Quartz
Quartz was mapped using the following two features: the widely applied emission peak at ∼ 8200 nm in the LWIR range and a less-well-known feature at F4500 nm in the MWIR (Fig. 5). The latter, present more precisely at ∼ 4470 nm, has not been extensively studied so far, but it is likely related to the presence of quartz (Laukamp et al., 2021). This is in good agreement with the results in this study, as this feature is detected mainly in the quartz-rich sandstones. This absorption feature is locally also present in the dolostones and may allow the detection of minor quartz in this carbonate rock. However, the signal seems too weak and sparse to be reliable.

Figure 5Distribution of the quartz-related spectral features in the Kupferschiefer cores. (a) Band ratio for F4500; (b) band ratio for F8200; (c) RGB, F8200, and F4500 maps for drill hole 136 (depth from right to left is 1053.5–1055.5 m, sandstones).
Both band ratio and MWL techniques were used to quantify these two features. The quartz emission peak occurs in all the sandstones of the three studied boreholes. However, this feature is absent in the Zechstein limestones because quartz abundance is minor and mostly restricted to stylolites (Lehmann, 2012; Stoll, 2014). The band ratio approach provides more reliable results, with the MWL method showing strong sensitivity to overlapping features. The band ratio for 8200 nm on the first slope of the primary reststrahlen band shows a good correlation with the band ratio implemented on the second slope of the 4500 nm absorption (Fig. 5). In the sandstones of hole 136, the F8200 emission peak is locally shifted towards higher wavelengths, having a maximum at 8350 nm or 8450 nm. However, in the two other boreholes, the F8200 position is always between 8200 and 8250 nm. This difference may be due to the contrasting crystallographic orientation of the quartz in the respective drill cores (Tappert et al., 2013). Alternatively, based on the correlation of F8200 with the anhydrite map (Sect. 3.3), the feature shift in hole 136 could result from interference with the 8350 nm sulfate emission peak (Kokaly et al., 2017) in anhydrite-rich areas. The F4500 feature is a reliable quartz indicator in sandstones, but it is more cryptic in the carbonate rocks. Quartz features in the mid-wave domain (i.e. F4500) and the longwave domain (i.e. F8200) are present all along the sandstone sections of the three holes, suggesting that both are persistent even in mineral mixture cases. However, if dolomite is present (with an MWIR absorption at 4430 nm; Kokaly et al., 2017), the position of the F4500 quartz feature is shifted towards shorter wavelengths (see Appendix A). In a 10 cm long region at the contact of 131 and 136, the F4500 quartz feature is less prominent due to lower reflectance, possibly due to high sulfide content.
4.2 Carbonate minerals
The SWIR, MWIR, and LWIR ranges all contain spectral features that can be used to characterise carbonate mineralogy. The most well-established of these is the 2320 (dolomite) to 2345 nm (calcite) absorption feature in the SWIR range (Gaffey, 1986; Laukamp et al., 2021). This SWIR-based index shows that the basal Zechstein carbonate rocks are dominantly calcitic in drill cores 136 and 133 and dolomitic in drill core 131 (Appendix A). It is interesting to note (but possibly coincidental) that hole 131 is also the most mineralised of the three holes. This carbonate feature shows that carbonate forms the dominant cement in some parts of the sandstones, as has been previously described in these rocks and elsewhere (Wodzicki and Piestrzynski, 1994; Minz, 2011), and that this cement appears to be calcitic in hole 131 and 133 and more dolomitic in 136. However, note that the interpretation of carbonate and clay cement mixtures is complicated by the presence of an overlapping absorption feature of many clay minerals with the main spectral feature of carbonate at ∼ 2340–2350 nm.
The carbonate absorption features in the MWIR and LWIR range are less well studied, though they have previously been identified as complementary to those in the SWIR (Laukamp et al., 2021). To explore this potential, 10 cm averaged depths and positions for each of the four carbonate absorptions were computed and compared (Fig. 6).
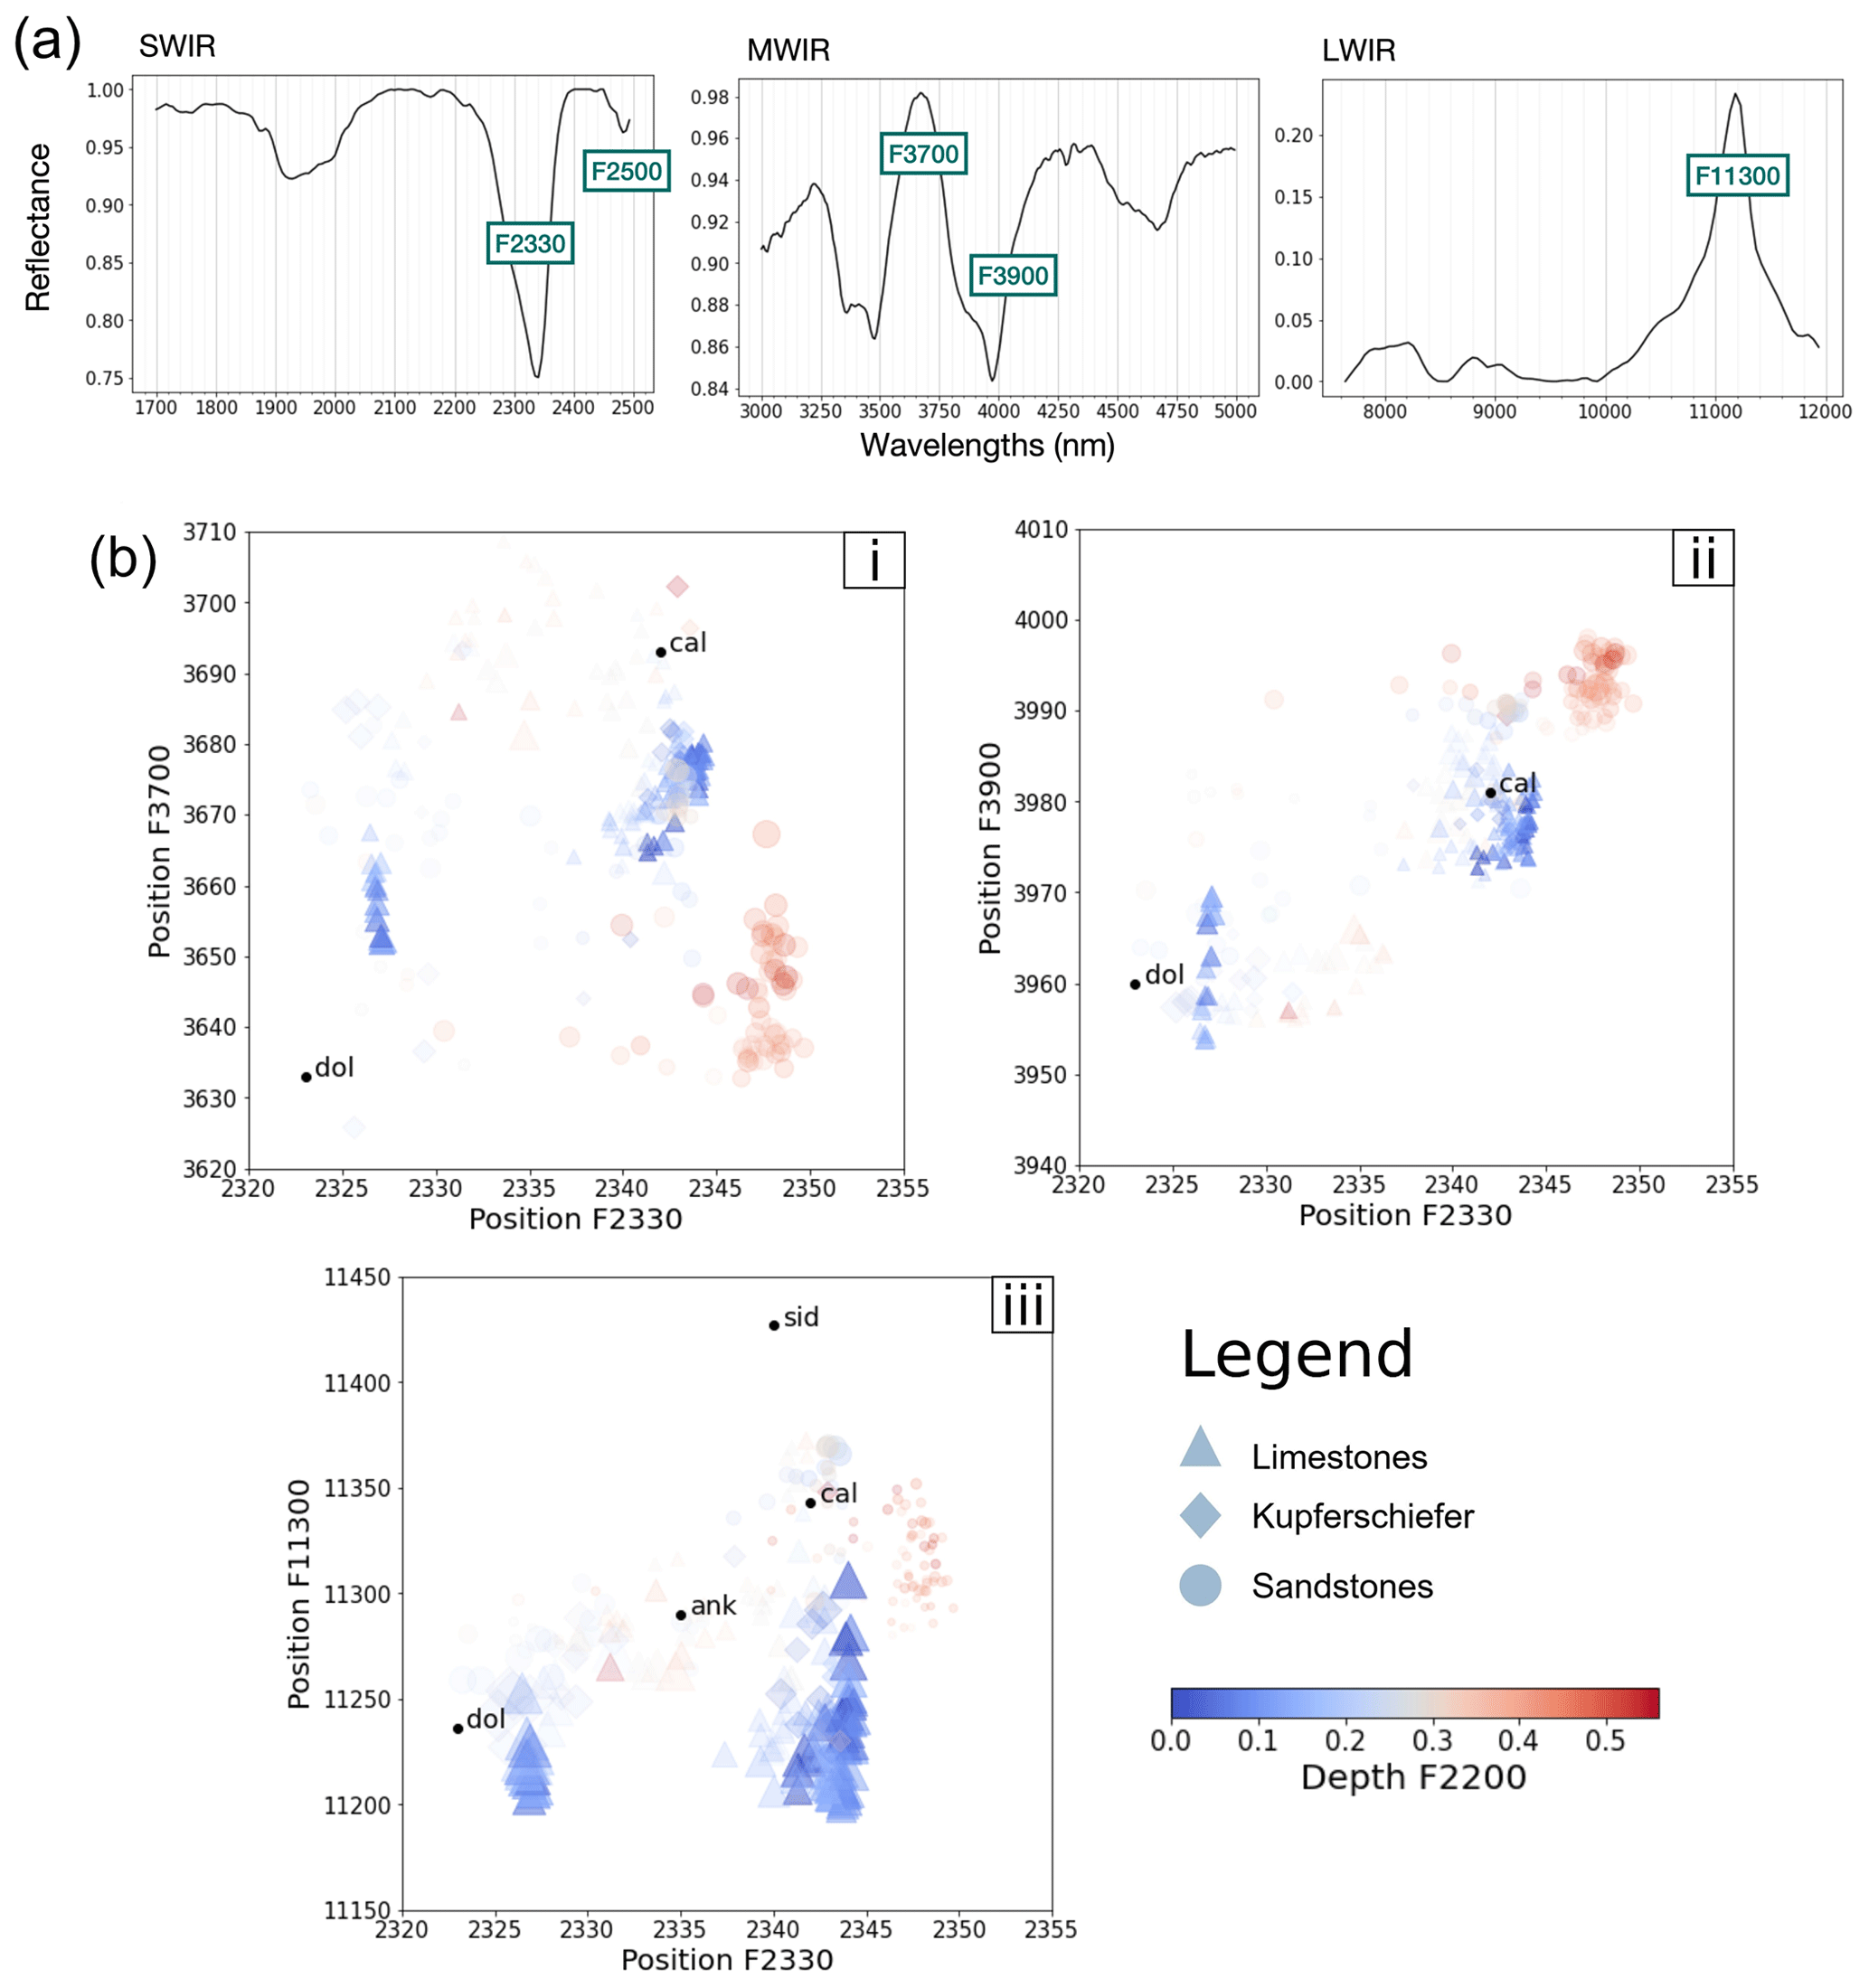
Figure 6Example spectra (a) showing the dominant carbonate absorption positions in the SWIR–MWIR–LWIR spectral range. The 10 cm averaged positions of these features (i. F3700; ii. F3900; iii. F11300) are plotted in (b) using the F2330 feature as a reference. Size is proportional to the depth of the feature on the y axis, and transparency is proportional to the depth of the F2330 feature. The colour indicates the depth of the F2200 feature and serves as a proxy for clay mineral abundance. Black points (cal refers to calcite; dol refers to dolomite; sid refers to siderite; ank refers to ankerite) show reference positions from the USGS spectral library (Kokaly et al., 2017) and from Green and Schodlok (2016) for F11300.
The precise positions of these vary, but for simplicity, they are referred to as F2330, F3700, F3900, and F11300. The SWIR-based index clusters the carbonate-bearing lithologies into the following three main groups: dolomitic (2325 nm), calcitic (2340 nm), and clay-rich (2350 nm), with the latter showing a deep AlOH feature. It becomes increasingly difficult to distinguish these clusters using higher wavelength features. However, this suggests that the combination of features could be used to identify distinct subpopulations within these three clusters and hence to provide complementary information. In the MWIR range, the dolomite spectra show significant variation, ranging from 3650 to 3680 nm for the F3700 feature and 3950 to 3970 nm for the F3900 feature. The cause of this variation is unclear but could reflect a sensitivity to e.g. grain size and crystallinity and, potentially, different dolomite generations documented in the mineralised sandstones (Minz, 2011) and Zechstein carbonate rocks (Lehmann, 2012). The LWIR spectra show even more variation, especially in the calcitic group, which spans 11 200 to 11 375 nm, where dolomite and calcite are no longer distinguishable without other information. It has been well-established that longwave spectra can be sensitive to confounding factors such as grain size and orientation (Zaini et al., 2012).
Significant variations in the iron content of these carbonates, as indicated by the iron Fe2+ index in this study, can also contribute to the variation in the MWIR and LWIR ranges (Fig. 7). The position of the MWIR carbonate feature F3900 is shifted towards higher wavelengths when the Fe2+ index indicates high ferrous iron abundance (Fig. 7).
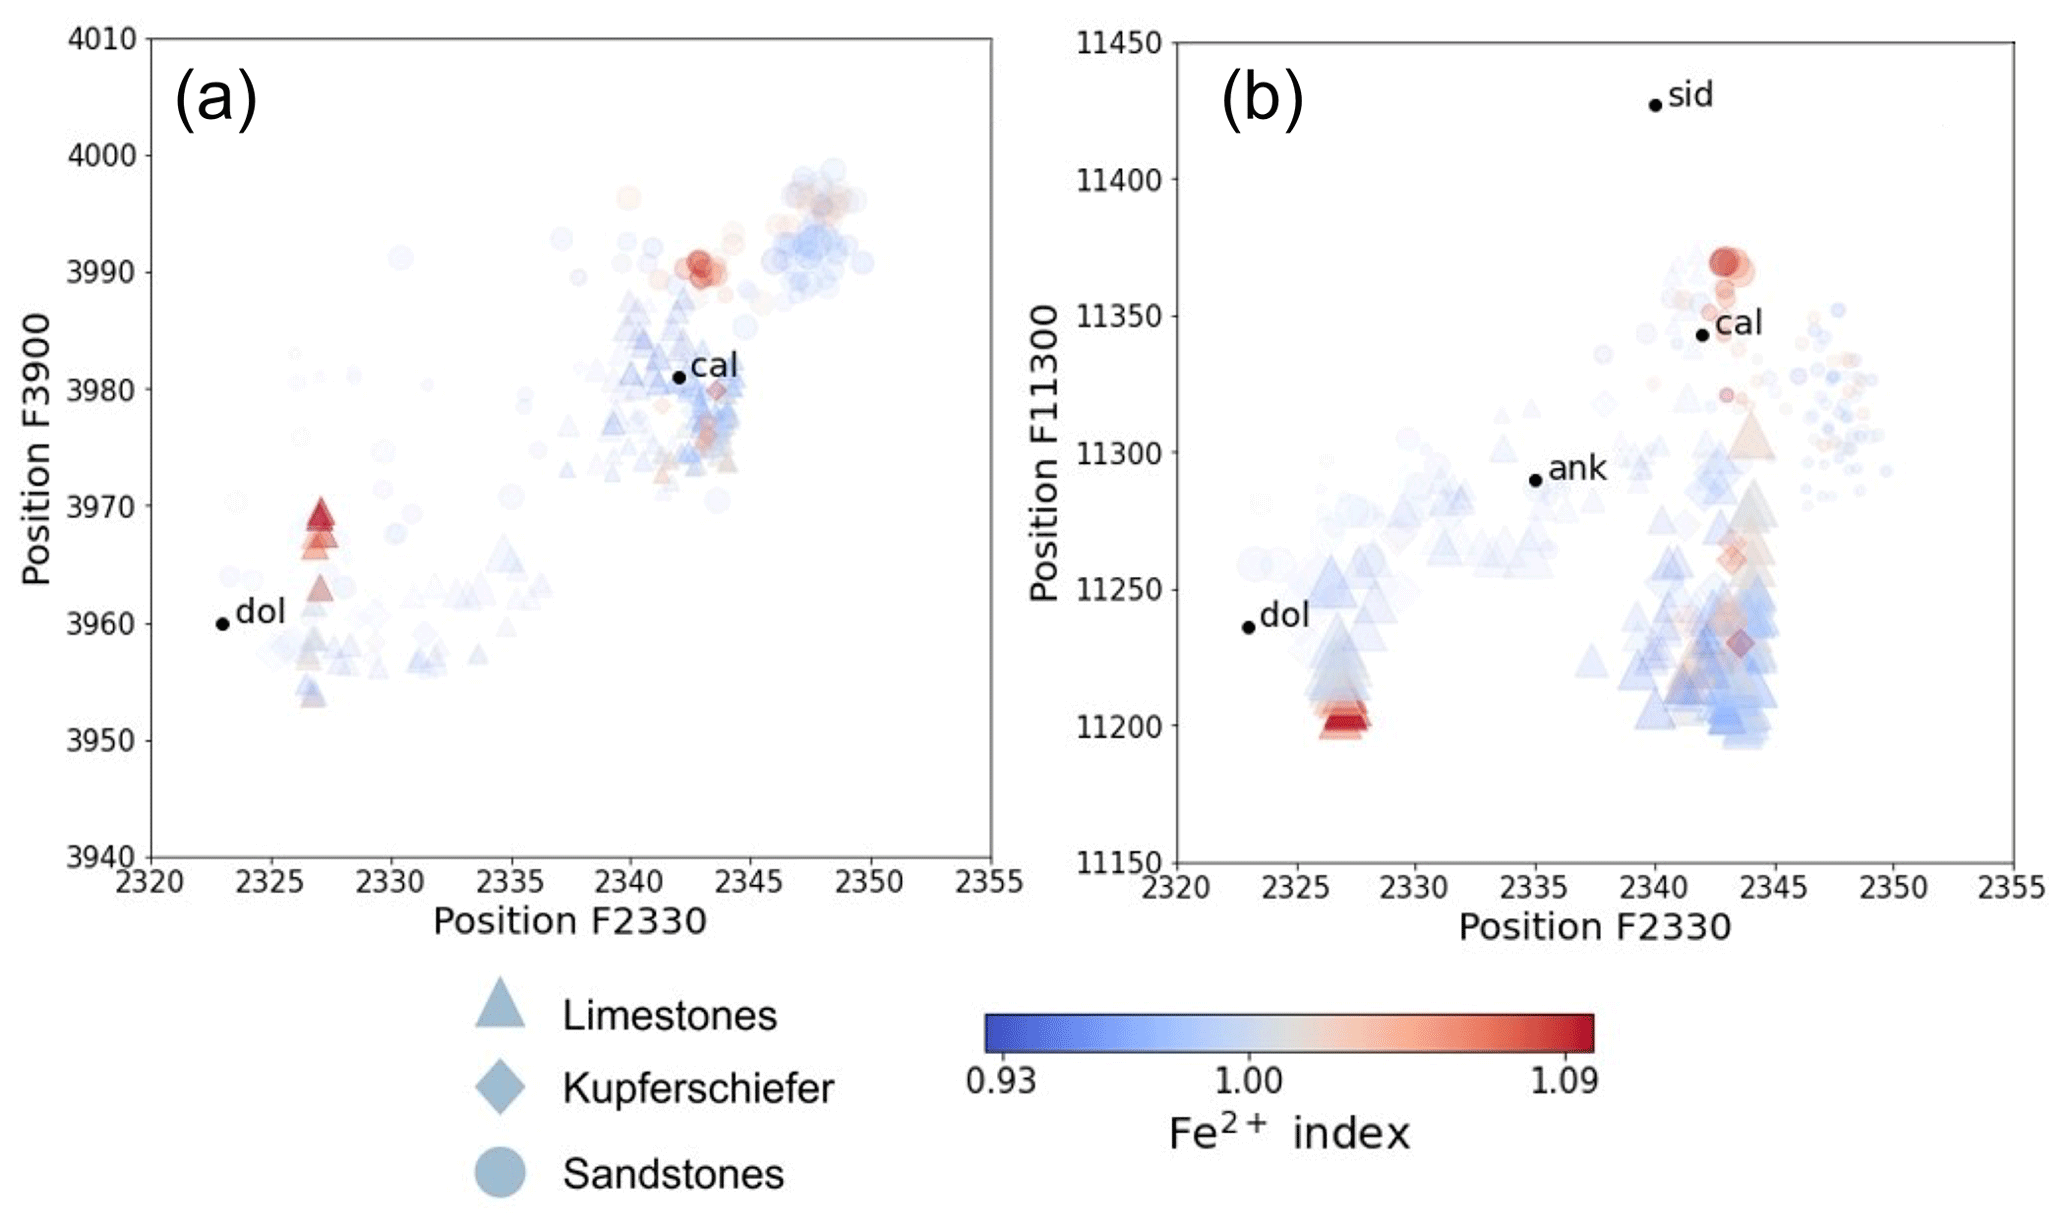
Figure 7The 10 cm averaged position of carbonate-related spectral absorption features (a) F3900 and (b) F11300 plotted using the F2330 feature as a reference. Size is proportional to the depth of the feature in the y axis, and transparency is proportional to the depth of the F2330 feature. Colour indicates the value of the ferrous iron feature (Cudahy et al., 2008) and appears to account for some of the variation observed in the MWIR and LWIR.
Interestingly, the position of the carbonate features (especially in the MWIR and LWIR range) appears to change near well-developed stylolites. These changes are particularly pronounced in hole 136. The shift of the carbonate feature in the LWIR (at ∼ 11 300 nm) reveals zoned halos around stylolite joints where the feature is shifted towards higher wavelengths. The same trend is observed for the carbonate feature in the MWIR domain at ∼ 3700 nm. Generally, these shifts occur where limestones are mineralised. µ-XRF maps of two samples were produced to better understand these features.
µ-XRF results (Fig. 8) show that the iron and silicon content are spatially correlated.
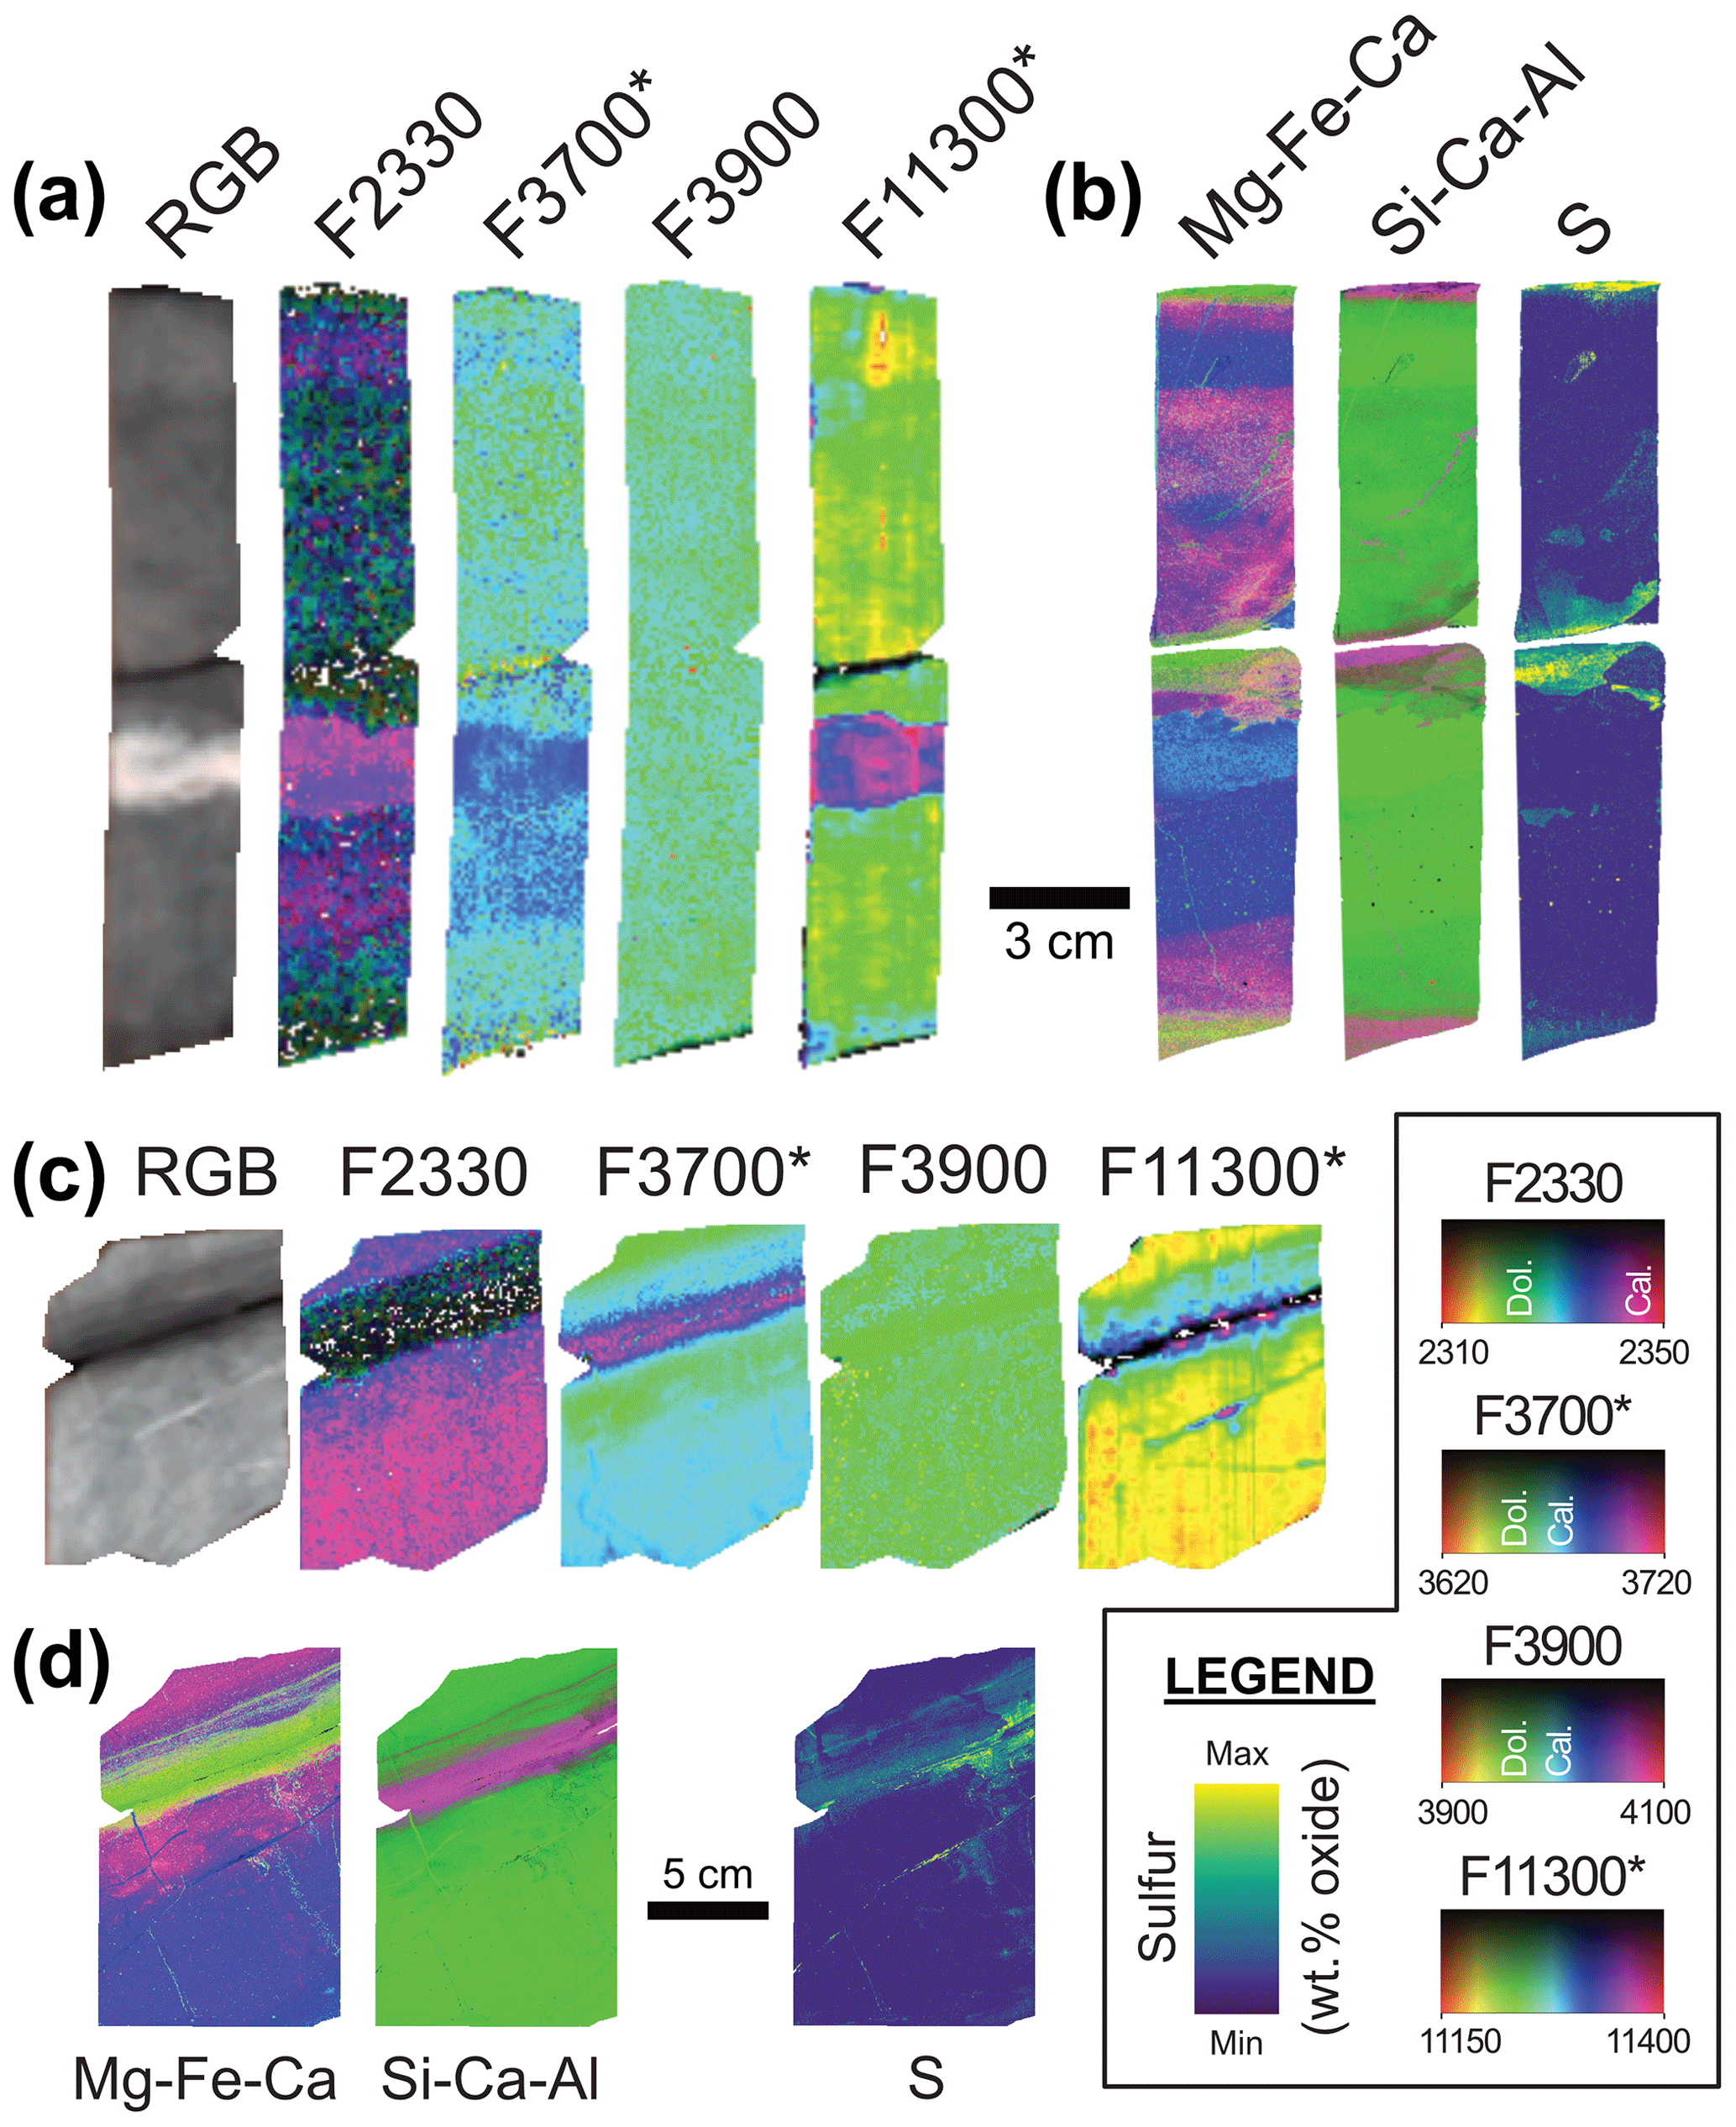
Figure 8Comparison of hyperspectral imaging (HSI) data and spatially resolved chemical (µXRF) data for validation. (a) HSI data for sample 1 from drill core 136, 1048.7–1048.85 m depth, and (b) corresponding µXRF data displayed as false-colour RGB images. (c) HSI data for sample 2 from drill core 136, 1049.4–1049.5 m depth, and (d) corresponding µXRF data.
Where iron and silicon are detected by µ-XRF in sample 2, the positions of the F3700 and F11300 features are shifted towards higher wavelengths. However, in sample 1, this trend is poorly pronounced for F11300 and not observed for F3700. Based on the comparison with F2330 and µ-XRF, the F3700 position seems to correspond to carbonate composition. However, it may be influenced by silicate occurrence at stylolite joints, as suggested by elevated Si contents in sample 2, causing F3700 to shift to higher wavelengths. Si in stylolite joints occurs as quartz, micas, and feldspar (Lehmann, 2012). We observe a larger variation of F11300 along veins, stylolite joints, and concretions, with no apparent correlation with a given element, indicating that this feature might be texture-related (e.g. grain size and orientation) in this context.
Quantitative X-ray powder diffraction (QXRD) results published by Kehrer (2016) and shown in Appendix A corroborate the hyperspectral observations by showing that dolomite is dominant in hole 131 (65.7 wt % dolomite vs. 1.75 wt % calcite). In contrast, calcite dominates samples from the top of hole 136, with dolomite becoming significant (51.5 wt %) towards the contact with the Kupferschiefer. No QXRD analysis was carried out on drill core 133.
Kucha (1990) describes the mineralised top part of the sandstones immediately below the Kupferschiefer in the Polish deposits as being cemented by sulfides and carbonates. Carbonate cement is identified in holes 131 and 136, where F2330, F3900, and F11300* are present in the same regions close to the contact with shales. In the sandstones section of 133, F2330 overlaps with the illite absorption doublet. Hence, it cannot be attributed to carbonates unequivocally. However, the two carbonate features in the MWIR, F3700* and F3900, are present throughout the three sandstone sections. For F3700*, we locally observe a shift towards shorter wavelengths that may indicate the presence of dolomite and calcite cement (Fig. 6). In 131 and 136 sandstones, F3700* shifts to higher wavelengths in regions where F1750 is present. This suggests that a mixture with sulfate minerals may affect this carbonate absorption position. This effect requires further investigation. Furthermore, the F3700* peak feature is shaped by the two carbonate absorptions. The shift of F3900 exhibits only two different positions in the sandstones (and also in the two other lithologies) and, in 131, QXRD and mineral liberation analysis (MLA) confirms (Kehrer, 2016) that the position 3960 and 3985 nm are for dolomitic and calcitic cement respectively.
4.3 Sulfate minerals
Spectral proxies for gypsum (1750 nm absorption feature) and anhydrite (8661 nm emission peak) show isolated pockets of nodule-like sulfate minerals within the footwall sandstones and overlying carbonate rocks. While these two spectral indices allow gypsum to be distinguished from anhydrite, we suspect that surficial anhydrite is converted to gypsum during core storage, so we consider them to be representative of equivalent sulfate minerals. That said, the 1750 nm (gypsum) absorption feature appears more widely distributed (and is often relatively disseminated) compared to the distinct anhydrite nodules mapped by the 8661 nm emission peak in the Zechstein limestone units (Fig. 9b). Anhydrite detection in sandstones is not possible because of an overlap with the quartz feature. The band ratio may highlight the presence of diagenetic sulfate nodules. Kucha (2003) described these nodules as anhydrite ± gypsum ± calcite nests.
Gypsum absorption is very short (0.02 to 0.05 reflectance contrast), but maps show patterns such as layers or veins, ensuring that this feature has trustworthy geological significance. However, gypsum occurs in the studied material with a low concentration of about less than 1 wt % in the dolostones and the Kupferschiefer and of about 5 wt % in the sandstones according to XRD (Kehrer, 2016). This indicates that gypsum has a strong spectral signal and that it can be detected in the mineral mixture even with low concentrations.
Within the sandstones, sulfates occur as cement (Kucha, 1990), and the F1750 absorption mapping potentially allows the detection of such sulfate minerals. The F1750 map shows small nodules (close to the mm resolution of the scanner) concentrated along distinct bedding horizons within cross-bedded portions of hole 131 (Fig. 9). The correlation between the 1750 nm absorption feature and gypsum in hole 131 has been validated by comparison with QXRD results from Kehrer (2016; Fig. 9c and d). Sulfates appear to be comparatively disseminated within the sandstones of holes 136 and 133 but are still present at detectable levels. The spatial extent of F1750 in sandstones of drill core 136 inversely correlates with the occurrence of carbonate spectral features, suggesting that HSI allows the distinction of sulfate-rich cement and carbonate-rich cement.
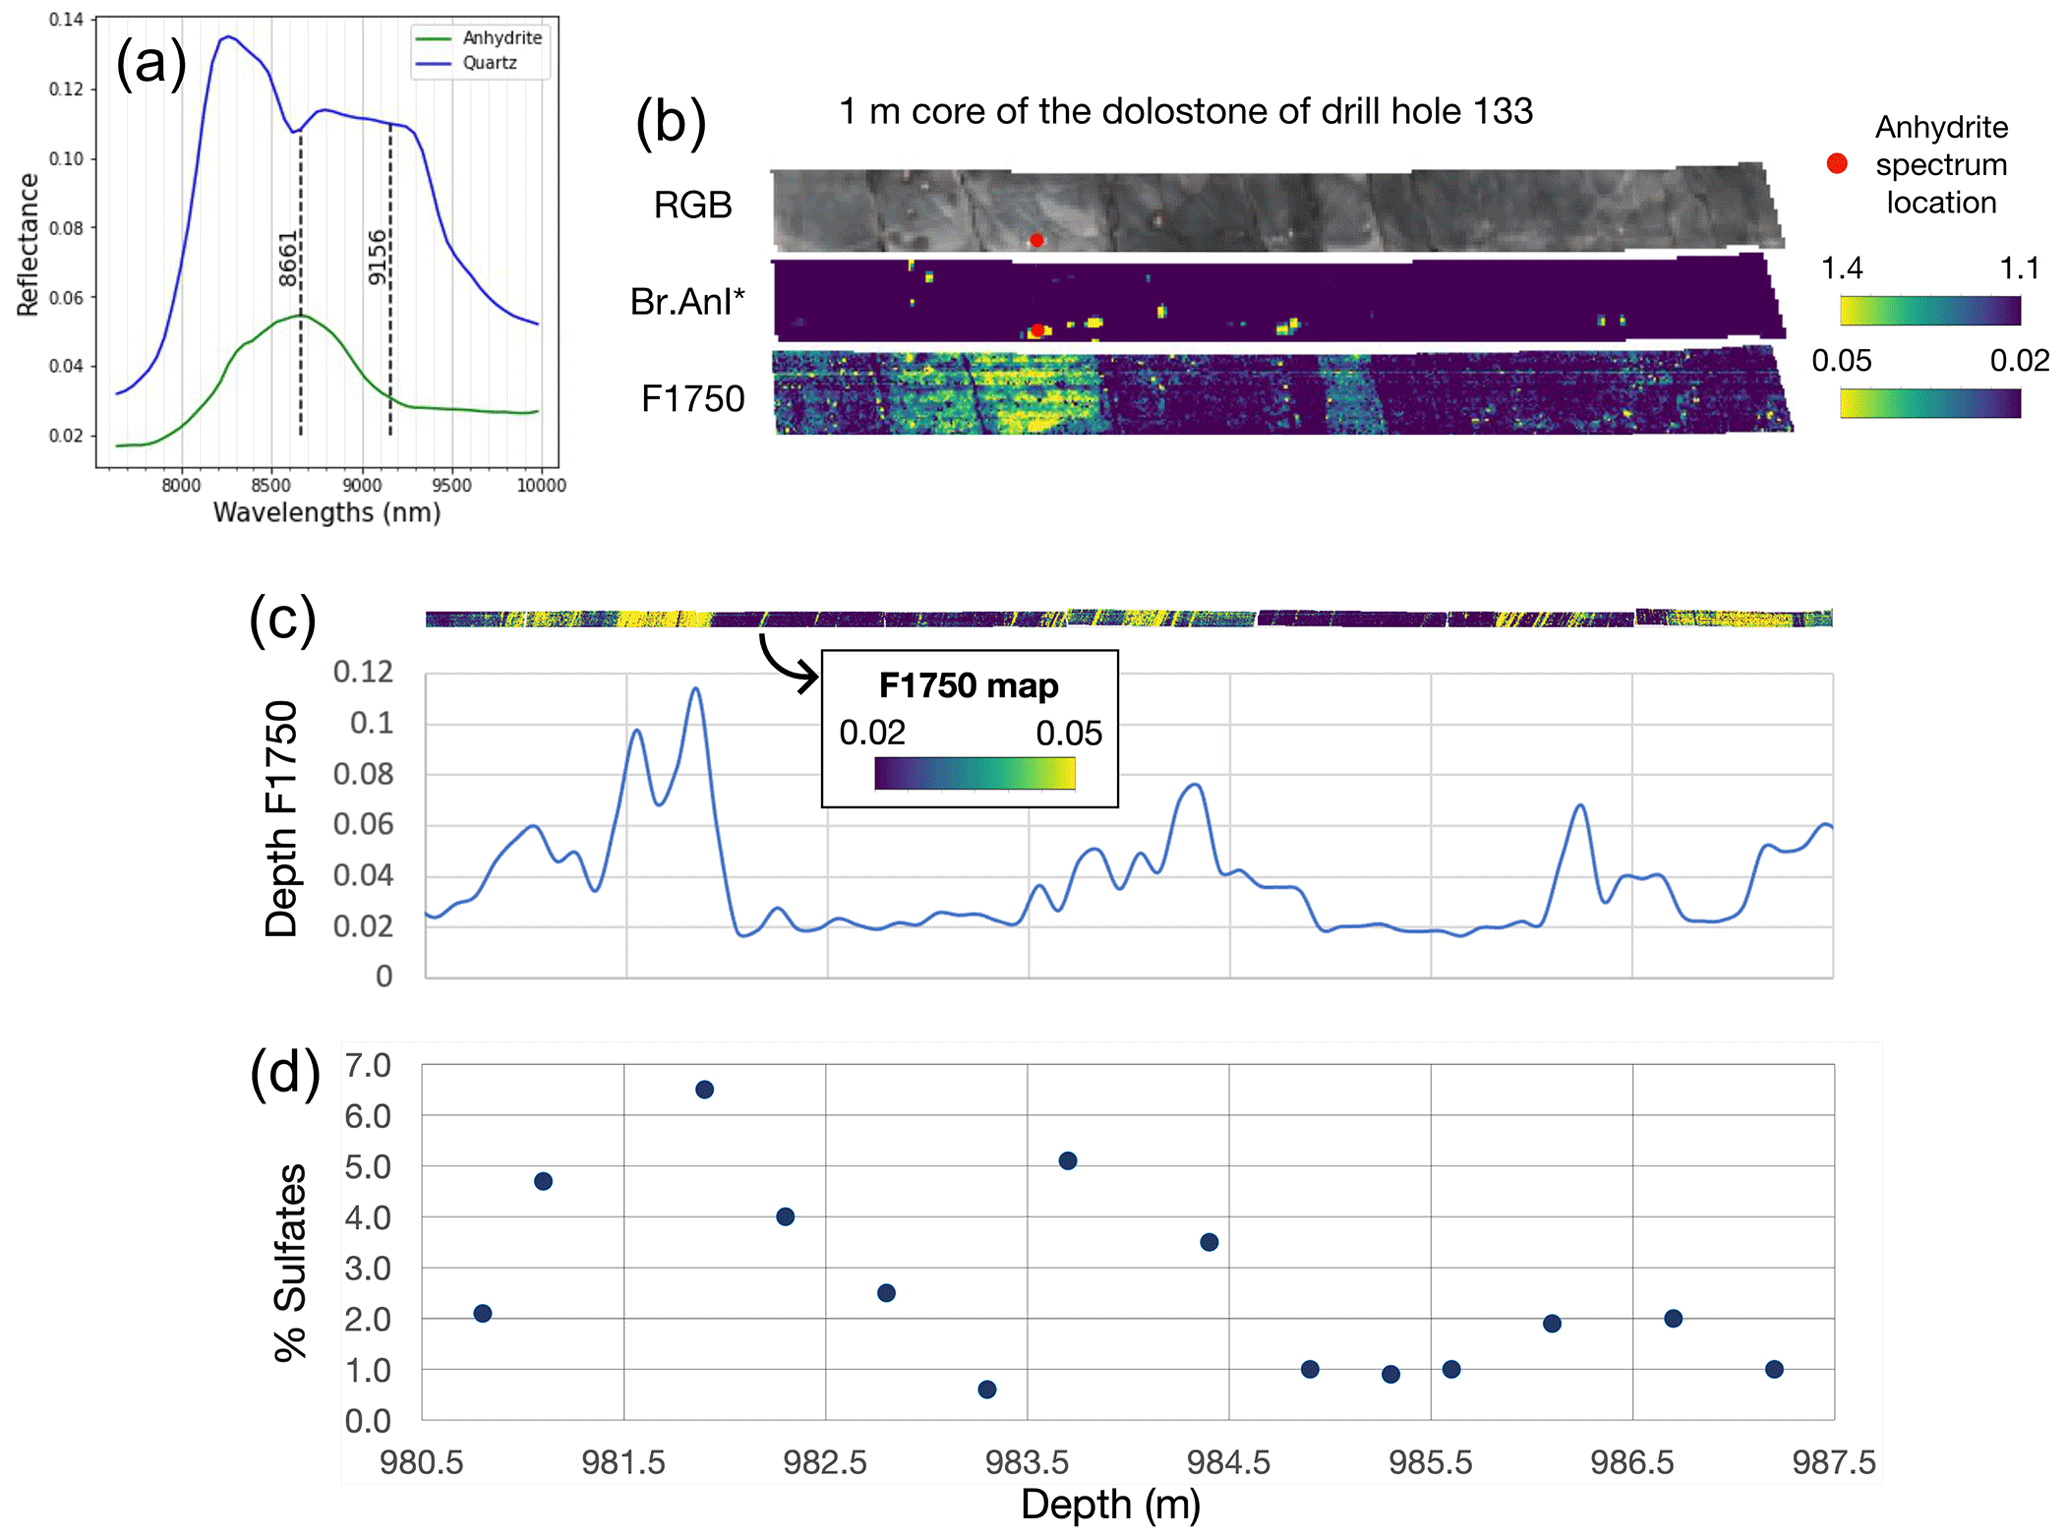
Figure 9(a) Anhydrite spectrum at a pixel in an anhydrite nodule within the Zechstein limestone and bands involved in the band ratio anhydrite index (dashed black lines) in a section of 133 at a depth of ∼ 1498 m (b). (c) F1750 map and plot of the averaged depth of F1750 every 10 cm in 131 sandstones and (d) QXRD wt % sulfate results (Kehrer, 2016).
4.4 Micas and clays
The general abundance of mica and clay minerals is mapped by the depth of the 2200 nm absorption associated with the Al–OH complex (Laukamp et al., 2021; GMEX, 2008). Unsurprisingly, these show that mica and clay minerals are far more abundant in the sandstone than in the limestones. Locally, bands of darker-coloured limestone in drill cores 133 and 136 contain detectable amounts of clay. The presence of clay and mica minerals in these bands (Fig. 10) is corroborated by the QXRD results of Kehrer (2016). Similarly, local enrichment of mica in the dolostone, found directly above the mineralised zone in drill core 131, has been identified by QXRD analysis (Kehrer, 2016). This is confirmed by the F2200 absorption feature (Fig. 10a).
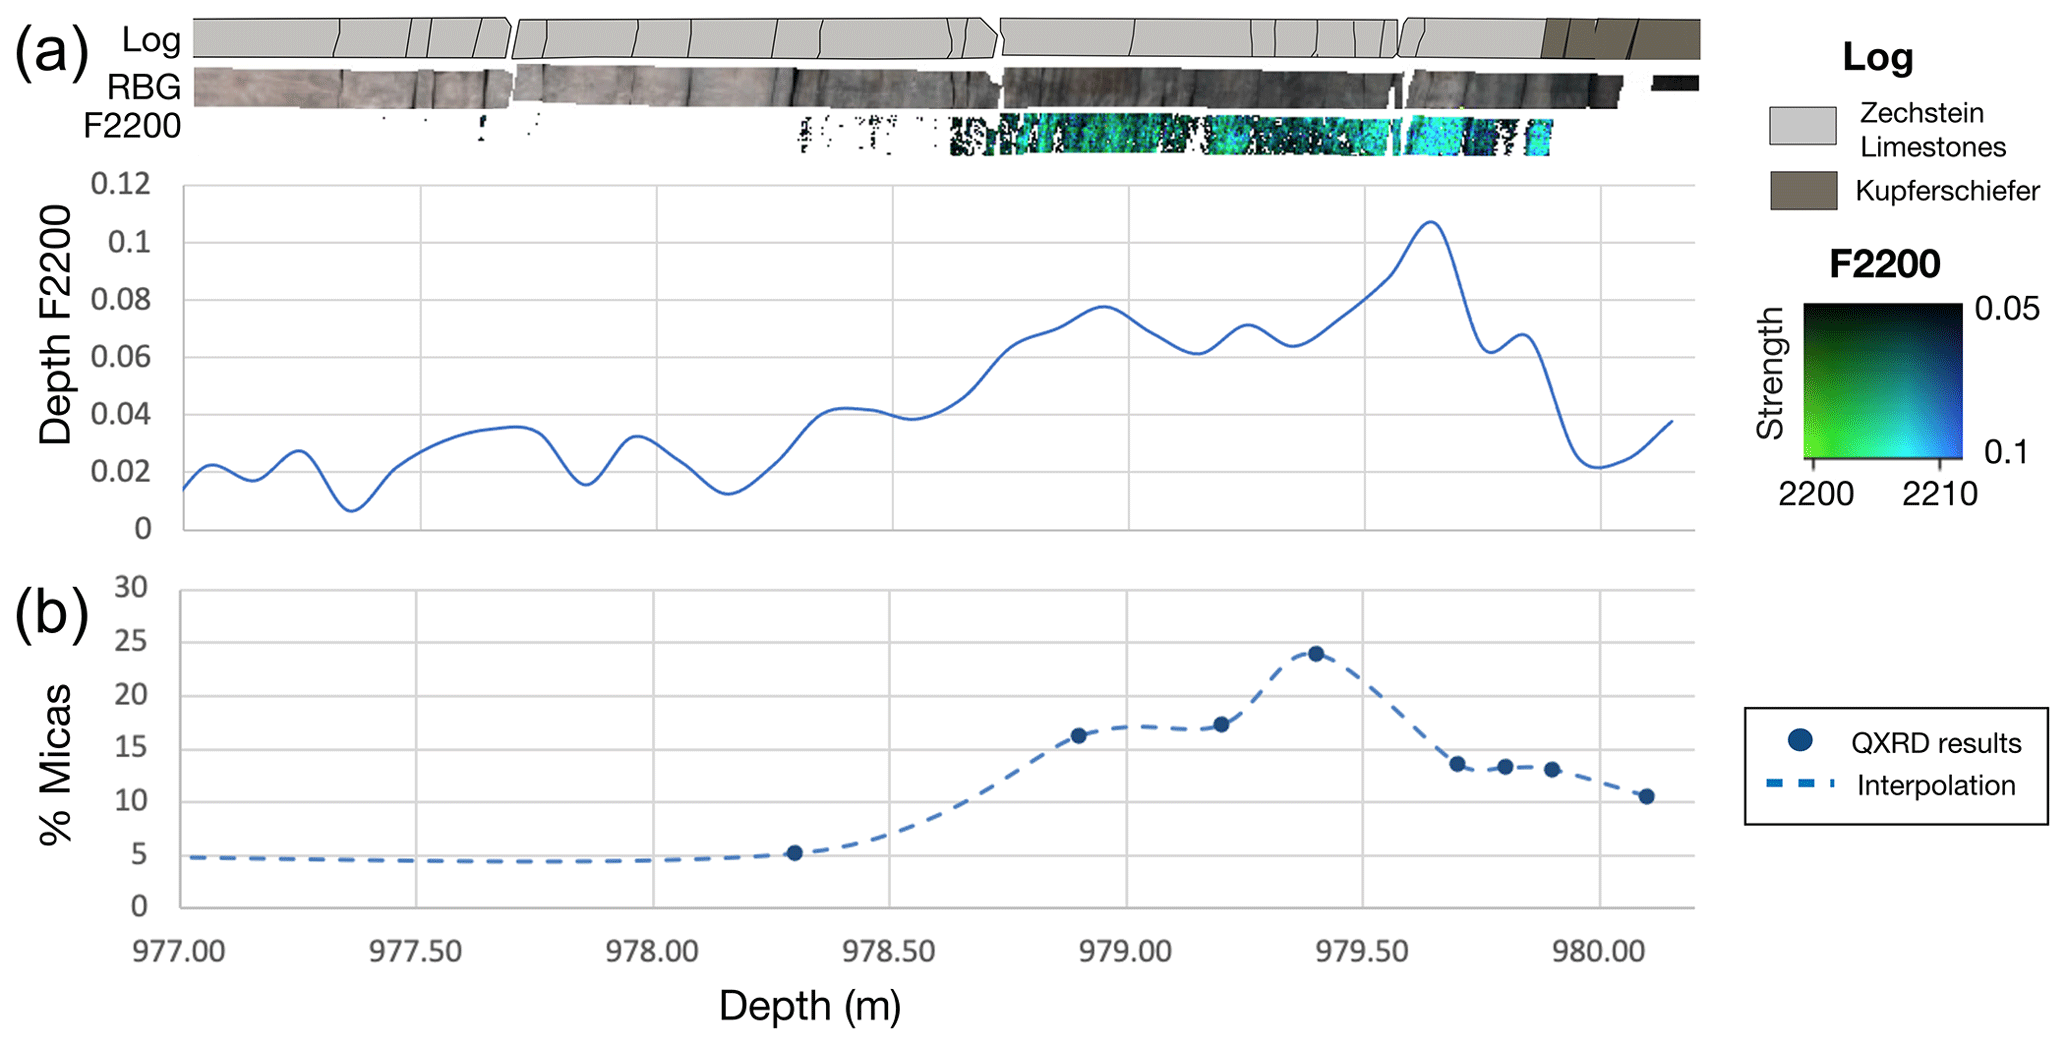
Figure 10Distribution of the mica- and clay-related absorption feature in the Kupferschiefer cores. (a) Log, RGB, and F2200 map in the limestone and Kupferschiefer of drill core 131 and (b) results of QXRD for micas (from Kehrer, 2016).
In the sandstones, the kaolinite spectral index indicates the presence of relatively crystalline (and hence likely hydrothermal) kaolinite in distinct zones close to the base of the Kupferschiefer. This is especially pronounced in hole 131 (Fig. 11) and correlates with petrographic measurements made by Minz (2011). The kaolinite index suggests a similar trend in hole 136, crosscut by distinct kaolinite-rich veinlets or fracture zones, which provides further evidence that the origin of high-crystallinity kaolinite postdates diagenetic lithification. Kaolinite is almost absent in hole 133, where mineralisation is confined to a copper zone within the Kupferschiefer horizon and a lead-rich zone in the overlying carbonates.
The barren sandstones in drill core 133 are spectrally different from the two other drill cores because they exhibit phengite-type spectra in the SWIR domain. Well-mineralised sandstones of the two other drill cores (131 and 136) display spectral characteristics for illite and kaolinite mixtures. In this drill hole, the sandstone occurs at an interval about 500 m deeper than the other two. Therefore, conversion of kaolinite to illite may have occurred during deep-burial diagenesis associated with elevated temperatures, compaction, and dewatering of shales (Hancock and Taylor, 1978; Mantovani et al., 2010).

Figure 11(a) QXRD results (Kehrer, 2016) for three samples at various depths in drill core 131 (1, 2, and 3); (b) KI map of sandstones and organic-rich shales; average spectra in a 10-pixels-wide band (≈ 1 cm) at QXRD samples location; KI average along the core, and (c) the copper grade.
The dominance of kaolinite vs. illite–kaolinite mixtures can be assessed using the kaolinite index (KI). Based on a careful petrographic study, Minz (2011) suggested kaolinite in the mineralised sandstones of the Spremberg–Graustein deposit to be the product of the decomposition and replacement of feldspar. This reaction yielded well-crystallised kaolinite filling intergranular pore spaces in paragenesis with Cu sulfides, carbonates, and euhedral quartz. Minz (2011), therefore, regarded the kaolinite to be cogenetic with Cu–Ag mineralisation (Minz, 2011; Schmidt, 1987). HSI imaging reveals that the KI increases towards the mineralised contacts of sandstone and Kupferschiefer sensu stricto in drill cores 131 and 136. Previous MLA and QXRD results (Kehrer, 2016) also report a relative increase of clay minerals in sandstones towards the contact with the Kupferschiefer sensu stricto in both drill cores. However, the relationship between KI and clay and micas abundance is not linear. The KI appears to reflect clay occurrence, and to a lesser extent, it may indicate the relative amount of clay vs. mica. Our results also show that the KI may be influenced by kaolinite crystallinity (GMEX, 2008).
4.5 Iron
Both the Fe3+ and the Fe2+ indices may indicate the effects of hydrothermal alteration in the Kupferschiefer mineral system. The Fe3+ index ( nm) identifies the transition from bleached and/or sulfide-mineralised sandstones into sandstones reddened by hematite near the bottom of all three drill cores (see core 131 in Fig. 12 as an example). This is consistent with previous core-logging results, as the presence of hematite is easily identified by its distinct reddish colour. In drill core 136, the presence of hematite is patchy rather than pervasive. Interestingly, in drill core 131, the transition from hematite-bearing to hematite-absent sandstones is gradational, with a transition over ∼ 2 m. In contrast, more patchy hematite alteration is developed in drill cores 136 and 133, showing remarkably sharp top and bottom contacts. It is important to note here that the mere presence of hematite in the sandstones is not regarded here as unequivocal evidence of hydrothermal alteration. The observations made during this study regarding only three drill cores make it impossible to distinguish clearly between hematite that is a product of sedimentation and of diagenesis of the Rotliegend red bed sediment succession from hematite that may have formed as a product of hydrothermal alteration (e.g. the Rote Fäule).

Figure 12(b) Average (5×5 pixels) spectrum at locations a and b in (a) of hematite-bearing sandstones in drill core 131 (987.2–988.2 m depth). (d) Average (5×5 pixels) spectrum at locations c and d in (c) of dolomite in drill core 131 (976.75–978.20 m depth from left to right). Vertical lines in (b) and (d) highlight the bands used to calculate the Fe3+ index and the Fe2+ index respectively.
The Fe2+ index highlights the presence of distinct zones of elevated ferrous iron content that appear to crosscut stratigraphy. It is particularly high above and adjacent to the mineralised dolostone of 131 (Fig. 12). Unlike the hematite alteration, these zones are not apparent during visual inspection and have thus not been logged and/or recognised previously. Ferroan calcite or dolomite (Gaffey, 1986) are identified as minerals that may give rise to the Fe2+ absorption feature in the three drill cores. Based on the observation of Minz (2011) and Lehmann (2012) that Fe-bearing carbonates are closely associated with Cu-sulfide minerals, as well as the highlighting of the fluids' flow-like path by the Fe2+ index (e.g. veins in hole 136 first core associated with higher copper grade; see Appendix A), it is suggested here that the Fe2+ index may provide evidence for hydrothermal alteration.
We use the ferric and ferrous indices as proxies for the following two different mineral species: iron oxides (hematite) and Fe-bearing carbonates. These indices are particularly relevant in this deposit, partly controlled by redox conditions (Speczik and Püttman, 1987; Kucha, 1990; Kopp, 2008). In borehole 131, the Fe3+ index indicates the presence of the Rote Fäule at the bottom of the core. In contrast, the Fe2+ index indicates an abundant occurrence of ferrous iron within the sandstones right above this Rote Fäule alteration zone which decreases gradually towards shallower levels. Contrary to hole 133, alteration in 131 shows a gradual change of the redox state of the sandstones, which may be indicative of high permeability and intense rock–fluid interaction. This observation is consistent with the copper grade of these drill cores, which is economical over an interval of 8 m in 131 vs. only 1.5 m in 133.
The results presented in this study indicate that most of the rock-forming and alteration minerals associated with the Kupferschiefer mineral system can be mapped, at least qualitatively, using extended-range (VNIR–SWIR–MWIR–LWIR) hyperspectral drill core scanning. This includes the recognition of mineralogical changes that are not visible to the naked eye but may be important for deciphering the mineralisation history of the Kupferschiefer and for vectoring towards mineralisation.
While spectral methods worked well on the Zechstein limestone and on the Grauliegend and Rotliegend sandstones, the Kupferschiefer sensu stricto proved to be largely unresponsive to HSI due to its fine grain size and its high organic carbon content. Regardless, we propose several alteration indicators that could help to characterise the Kupferschiefer mineral system, although we cannot draw significant conclusions regarding the ore-forming processes due to the limited number of drill cores included in this study.
Finally, the data collected for this study allow us to compare mineral spectra in both the widely applied VNIR–SWIR and LWIR ranges and in the generally unused MWIR domain. This allows a brief discussion of the potential of MWIR sensors for hyperspectral drill core logging.
5.1 Spectral lithofacies characterisation and alteration mapping
5.1.1 Footwall sandstones
HSI covering the sandstone below the Kupferschiefer characterises the distribution of quartz, sulfate, carbonates, and clay and mica minerals. The carbonates that feature in the SWIR and the LWIR are only locally present and indicate the formation of patchy carbonate cement, as was also identified previously using QXRD (Kehrer, 2016). Interestingly, the abundance of carbonate cement appears to be negatively correlated with sulfate abundance (noting that anhydrite cannot be mapped in the sandstones, as its emission peak overlaps with the quartz feature). In cores 131 and 133, gypsum appears to be concentrated along distinct cross-bedding planes, while in 136, it is more widely disseminated. This gypsum does not appear to correlate with mineralisation, though it could provide an important sulfur source during sulfide formation (Oszczepalski, 1999).
Mica and clay minerals are widely distributed within the sandstones, presumably both as diagenetic minerals (such as illite) and also as hydrothermal alteration minerals (e.g. well-crystallised kaolinite; Fig. 11). As shown in Fig. 6, this complicates the mapping of the carbonate feature (due to overlapping absorptions in the SWIR range). Differences in the AlOH absorption position suggest a more phengitic cement in hole 133 than in 131 and 136. However, the potential relationship between this variation and mineralisation cannot be determined from three drill holes. That said, a wide body of literature demonstrates that white-mica composition can be a useful alteration index in many mineral systems (e.g. Laukamp et al., 2011; Van Ruitenbeek et al., 2012; Portela et al., 2021).
5.1.2 Footwall alteration
In every Kupferschiefer deposit, the economic Cu–Ag mineralisation is proximal to a geochemical redox gradient with a highly oxidised region in sharp contact with a still-reduced interval (Speczik and Püttman, 1987; Borg et al., 2012; Oszczepalski et al., 2002, 2019). This sudden change in redox state is thought to be the main reason for metal deposition, so identifying and characterising the Rote Fäule is essential for exploration and mineral system analysis (Oszczepalski et al., 2019, 2002). While it is generally easy to identify visually, the VNIR iron indices described in Sect. 3.5. allow both the intensity of the oxidation and the position and abrupt nature of the redox front to be quantified.
Above this redox front, the pooling (and periodic escape) of the metalliferous fluid below the generally impermeable Kupferschiefer horizon is also thought to control the degree of mineralisation that occurred (Kucha, 1990; Speczik and Püttman, 1987; Kopp, 2008; Borg et al., 2012). Our results show that both boreholes containing mineralisation at the base of the Kupferschiefer also showed a distinctive increase in the kaolinite crystallinity index (KI). This observation is consistent with an interpretation of the kaolinite as a hydrothermal alteration mineral possibly formed at the expense of feldspar that have been locally decomposed and suggests that KI could also be used to track high-temperature fluid flow within the sandstone units. Petrographic observations from Minz (2011) support this interpretation.
5.1.3 Kupferschiefer
Due to its fine grain size and low reflectivity, the Kupferschiefer itself is difficult to characterise using spectral methods. This low reflectivity is partly caused by abundant organic matter, which is also thought to have played a fundamental role in metal concentration through catalytic auto-oxidation and dehydrogenation (Kucha, 1990). Quantification of the abundance of this organic matter remains a significant challenge using both conventional and spectral techniques. Rahfeld et al. (2018) state that mineralogical analysis with MLA and XRD is complicated in Kupferschiefer-type deposits because of the extremely fine-grained matrix and the extremely variable Cu-sulfide content within the organic-matter-rich material.
Many studies have attempted to map organic carbon in cores and outcrops using hyperspectral methods (e.g. Greenberger et al., 2016) with varying success. While we tried several of these techniques, we found that the low reflectance of the organic-rich shales made it difficult to confidently identify and map spectral features associated with organic molecules. However, more advanced (and properly calibrated) approaches could achieve this, which would be significant, as it would allow quantitative mapping of another key part of the Kupferschiefer mineral system.
5.1.4 Zechstein limestones
Petrographic studies revealed that the Zechstein limestones above the Kupferschiefer have various compositions and textures due to diagenetic and hydrothermal processes (Minz, 2011; Lehmann, 2011). The HSI reflects this complexity, with carbonate absorption positions suggesting a wide range of carbonate mineralogy and complex spatial variation (e.g. zoned halos around stylolites). Centimetre-sized anhydrite nodules are also identified in the Zechstein carbonates (Sect. 3.3), although the formation and potential significance of these need to be clarified. At a larger scale, we note that the Zechstein limestones are dominantly dolomitic in hole 131 and calcitic in 133 and 136. However, the significance of this variation (and of the genesis of the dolomite) also remains unclear.
5.1.5 Hanging-wall alteration
After precipitating a Cu-rich mineralisation zone at or immediately below the Kupferschiefer, mineralising fluids appear to have leaked upwards into the Zechstein carbonates to form generally more Pb- and Zn-rich ore zones (Rentzsch, 1974; Borg et al., 2012). While our analysis of three drill holes is insufficient to draw robust conclusions, the iron indices described in Sect. 3.5 indicate patchy ferroan calcite and dolomite associated with mineralised zones above the Kupferschiefer. We suggest that these could have formed due to alteration by mineralised fluids in outflow zones above the Kupferschiefer, a process previously inferred at other sediment-hosted hydrothermal systems (Essalhi et al., 2009; Blomme et al., 2017). Observations by Minz (2011) of cogenetic copper sulfides and iron-enriched carbonate cement within the footwall sandstones are consistent with this hypothesis.
Unlike the sandstone units, permeability within the Zechstein carbonates appears to have been significantly more variable. Relatively abundant calcite veins and veinlets, often associated with mineralisation, indicate periodically elevated fluid pressures (Fig. 8). It is also interesting that the anastomosing stylolites developed in the Zechstein carbonates have ∼ 5 cm thick alteration halos enriched in Mg, Si, and, locally, Cu and S (Fig. 8). We suggest that these styolites could counterintuitively represent preferential fluid pathways, focusing mineralising fluids as they ascend above the main mineralised zones. If this were the case, hyperspectral mapping of these alteration halos could provide an additional proxy for past fluid flow, guiding exploration towards more mineralised areas. The LWIR-range spectra appear to be especially sensitive to these halos: the carbonate emission peak at 11 300 nm shows a progressive increase towards higher wavelengths in these alteration halos and appears to correlate with regions of higher Pb and Zn grade.
5.2 Full-range HSI for mineral system mapping
Exploration typically involves manual drill core logging and metre-scale interval sampling for geochemical analysis. For mineralogical analysis, a discrete sampling scheme is commonly applied where small samples are extracted for detailed analysis using, e.g. transmitted-light microscopy (Minz, 2011; Lehmann, 2012), MLA, or XRD (Kehrer, 2016; Rahfeld et al., 2018). Sample numbers are limited by practical considerations and are selected based on previous (and potentially biased) interpretations of the lithology and styles of the mineralisation present.
HSI data thus have significant potential to complement this approach by (1) providing continuous mineralogical information, (2) objectively capturing relevant geological information for e.g. later re-analysis or re-interpretation, and (3) providing important extra information when selecting sample locations or performing geological logging. These advantages are well documented in other mineral systems (e.g. Tusa et al., 2018), and we suggest that they are equally applicable to Kupferschiefer-type sediment-hosted Cu–Ag deposits.
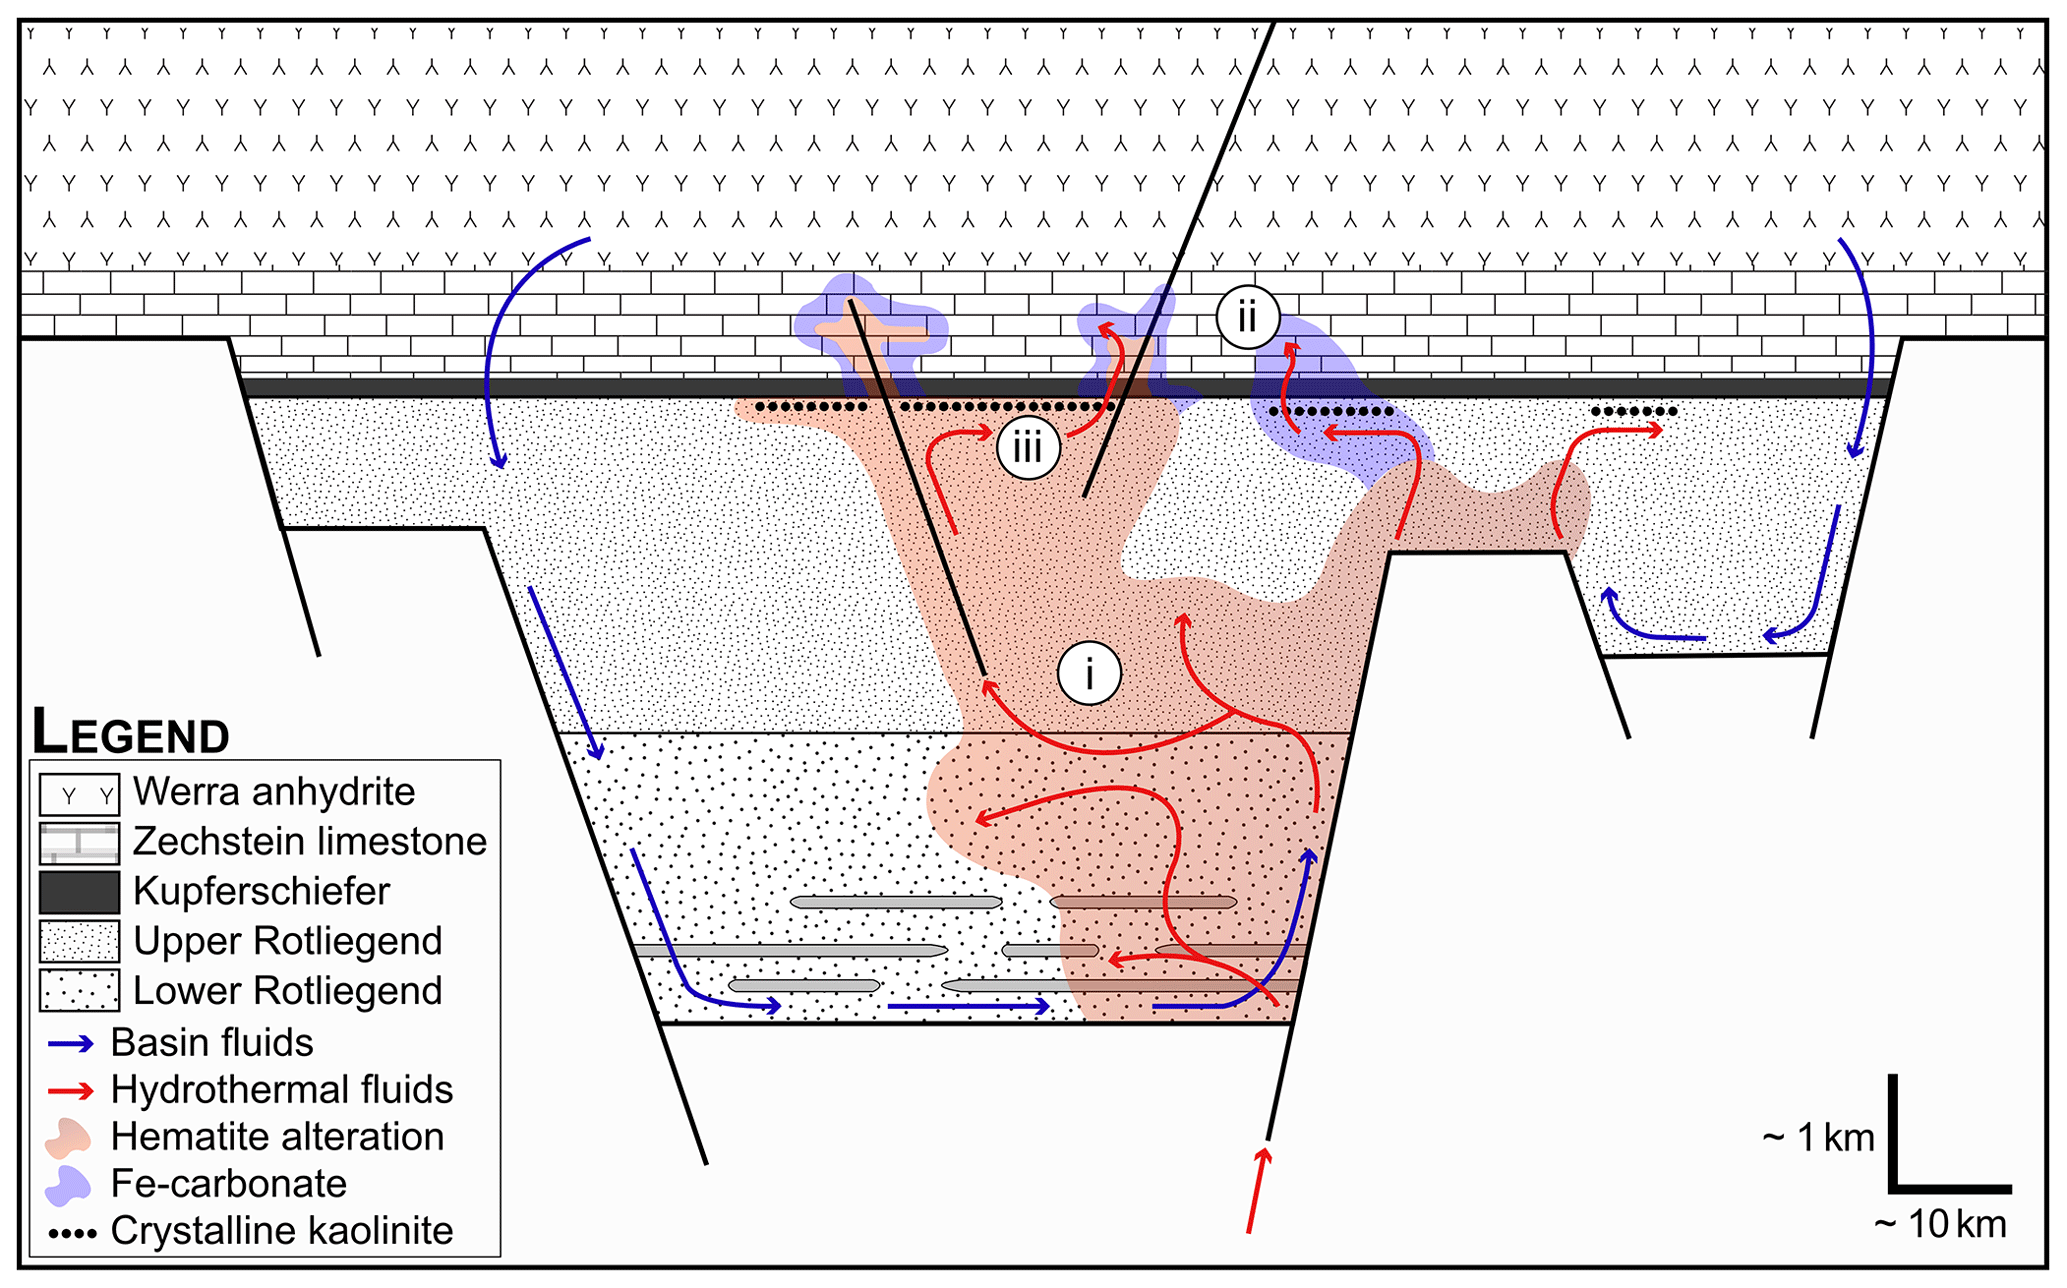
Figure 13Schematic cross-section through the CESB with fluid migration paths and alterations footprint, i.e. hematite alteration (Rote Fäule), Fe-carbonate alteration, and the occurrence of well-crystallised kaolinite. The distribution and relative intensity of these hydrothermal alteration processes are measurable through HSI indices referred to in this study respectively as (i) Fe3+ index, (ii) Fe2+ index, and (iii) KI. Grey layers in the Lower Rotliegend are thick volcanic piles (modified after Borg, 1991, and Borg et al., 2012).
Specifically, the results of this pilot study demonstrate that HSI can detect and quantify the intensity and gradient of crucial redox boundaries (e.g. Rote Fäule alteration; Figs. 12 and 13) and potentially important alteration minerals (e.g. high-crystallinity kaolinite, Fe carbonates; Fig. 13). These latter features can be especially difficult to detect visually and show significant small-scale variation, preventing accurate characterisation based on averaged or visually guided sampling schemes. HSI thus has the potential to fill a significant scale gap and to more thoroughly quantify potential alteration indicators in sediment-hosted copper systems, facilitating exploration vectoring and large-scale and mineral system characterisation.
As well as testing HSI methods for Kupferschiefer-type mineralisation, this study deployed a full suite of hyperspectral sensors covering the VNIR–SWIR–MWIR–LWIR range, unlike more established approaches (e.g. data collection limited to the VNIR–SWIR range). Despite containing absorption features associated with many minerals, including tourmaline, amphibole, micas, carbonates, quartz, and sulfates (Laukamp et al., 2021), the MWIR is a poorly understood spectral range for geological applications. Our results suggest that it is suitable for mapping carbonates and quartz in the various lithologies of the Kupferschiefer and that it provides important complementary absorption features for SWIR-active minerals that help disentangle complex mixtures. For instance, in the sandstone units, the doublet of carbonate absorption in the MWIR range (Kokaly et al., 2017; Laukamp et al., 2021) was very persistent, while SWIR overtones and LWIR emission peaks were often absent or overprinted by other mineral signatures (e.g. from illite cement). Furthermore, while carbonate absorptions in both the SWIR and MWIR range were found to be sensitive to carbonate composition, the position of the LWIR emission peak appears to be influenced by a variety of other factors (e.g. Fe content – Green and Schodlok, 2016; grain size – Zaini et al., 2012; mixture with sulfates), making it difficult to confidently distinguish calcite from dolomite based on LWIR spectra alone (Figs. 6, 7). This sensitivity of the LWIR reveals interesting (but more cryptic) variations around, e.g. veins and stylolites, adding crucial complementary information.
The MWIR range also proved to be helpful for cross-validating absorption features observed in the SWIR and LWIR ranges, building confidence in our spectral interpretations. For example, quartz emission peaks detected in the LWIR range could be validated against quartz-related absorption features in the MWIR range, allowing confident mapping of quartz even at relatively low concentrations.
Finally, it is important to note that care must be taken regarding the storage conditions of the cores. In this study, the borehole material was drilled more than 10 years ago and, at certain locations, shows evidence of strong recent oxidation that has nothing to do with the core's oxide content but that can increase the Fe3+ index signal. Similarly, we could theoretically distinguish anhydrite from gypsum in fresh cores, but we suspect that weathering during storage has replaced many anhydrite zones with gypsum. Integration of hyperspectral scanning techniques (and real-time data processing) during exploration would mitigate this issue while providing valuable additional data to enhance conventional logging activities.
This exploratory study demonstrates that full-range VNIR–SWIR–MWIR–LWIR hyperspectral drill core scanning can provide essential constraints on host rock and alteration mineralogy associated with sediment-hosted copper mineralisation. Iron indices sensitive to the redox state map the redox front thought to have triggered metal deposition in the Kupferschiefer and possibly also track the inflow and outflow paths of hydrothermal fluids on a local and regional scale. The kaolinite crystallinity index supports previous work indicating the formation of hydrothermal kaolinite in physical traps below the Kupferschiefer. In addition, alteration halos around stylolites provide evidence for localised fluid flow in the overlying Zechstein limestone. Although there are certain limitations to the approach, such as the overlapping of certain mineral features and the low reflectance of lithologies that are rich in organic matter, we suggest that full-range hyperspectral drill core scanning could provide a valuable tool for exploration companies searching for sedimentary-hosted copper deposits. This method enhances geological logging, enables data-driven sampling strategies, and allows objective and consistent measures of lithology or alteration that can be used in three-dimensional modelling workflows, as demonstrated by e.g. De La Rosa et al. (2022). However, to place these observations within the larger mineral system, a thorough analysis of multiple drill holes is necessary.
The processed data that support the findings of this study are available from the corresponding author upon reasonable request.
The supplement related to this article is available online at: https://doi.org/10.5194/se-14-463-2023-supplement.
LG participated in data acquisition, conducted the spectral analysis, and was the main contributor to the original draft of the paper. MK co-developed the concept, helped obtain the funding and material for this project, assisted with figure preparation, and contributed to the writing and editing of the paper. ST developed the software, guided the experiments, and provided assistance in the spectral analysis and its validation; ST also contributed substantially to the writing and editing of the paper. ADLR performed and supervised the µXRF analytical work for validation and helped visualise these data. RG helped edit the paper and contributed to funding acquisition, project administration, and supervision, as well as to the provision of core material and instrumentation. JG co-defined the concept and research goals of this study and helped acquire the funding; JG also provided guidance in the interpretation of the data and contributed greatly to the original paper preparation.
The contact author has declared that none of the authors has any competing interests.
Publisher's note: Copernicus Publications remains neutral with regard to jurisdictional claims in published maps and institutional affiliations.
The authors thank KSL Kupferschiefer Lausitz GmbH (Spremberg, Germany) and its parent company Minera S.A. for generously providing funding, drill core material, and analytical data. We are grateful to Yuleika Madriz and Erik Hermann for their help with hyperspectral data acquisition, to Sandra Lorenz for the help with pre-processing, and to Laura Tusa for her input regarding spectral interpretation. The reviews of Gregor Borg and Andrea Di Muro, as well as of an anonymous reviewer, helped to improve the paper.
The article processing charges for this open-access publication were covered by the Helmholtz-Zentrum Dresden-Rossendorf (HZDR).
This paper was edited by Andrea Di Muro and reviewed by Gregor Borg and one anonymous referee.
Arne, D., House, E., Pontual, S., and Huntington, J.: Hyperspectral interpretation of selected drill cores from orogenic gold deposits in central Victoria, Australia, Austr. J. Earth Sci. 63, 1003–1025, https://doi.org/10.1080/08120099.2016.1223171, 2016.
Barker, R. D., Barker, S. L. L., Cracknell, M. J., Stock, E. D., and Holmes, G.: Quantitative Mineral Mapping of Drill Core Surfaces II: Long-Wave Infrared Mineral Characterization Using µ XRF and Machine Learning, Econ. Geol., 116, 821–836, https://doi.org/10.5382/econgeo.4804, 2021.
Bechtel, A., Sun, Y., Püttmann, W., Hoernes, S., and Hoefs, J.: Isotopic evidence for multi-stage base metal enrichment in the Kupferschiefer from the Sangerhausen Basin, Germany, Chem. Geol., 176, 31–49, 10.1016/S0009-2541(00)00336-3, 2001.
Bedini, E.: The use of hyperspectral remote sensing for mineral exploration: a review, Journal of Hyperspectral Remote Sensing, 7, 189–211, https://doi.org/10.29150/jhrs.v7.4.p189-211, 2017.
Bierwirth, P., Huston, D., and Blewett, R.: Hyperspectral mapping of mineral assemblages associated with gold mineralization in the Central Pilbara, Western Australia, Econ. Geol. 97, 819–826, 2002.
Blomme, K., Fowler, S. J., Bachaud, P., Nader, F. H., Michel, A. and Swennen, R.: Ferroan Dolomitization by Seawater Interaction with Mafic Igneous Dikes and Carbonate Host Rock at the Latemar Platform, Dolomites, Italy: Numerical Modeling of Spatial, Temporal, and Temperature Data, Geofluids, 2017, 6590672, https://doi.org/10.1155/2017/6590672, 2017.
Borg, G.: The significance of Rotliegend volcanics for the metal provinces of the Kupferschiefer basin, Zbl. Geo. Pal., 1991, 929–943, 1991.
Borg, G., Piestrzyński, A., and Barchmann Heinz, G.: An overview of the European Kupferschiefer deposits, Economic Geology Special Publication, 455–486, https://doi.org/10.5382/SP.16.18, 2012.
Bruker Nano GmbH: M4 Tornado/M4+ Tornado High Performance Micro-XRF spectrometer: User manual (V4), Berlin, Germany, 2019.
Burns, R. G.: Mineralogical applications of crystal field theory, Cambridge University Press, New York, United States of America, 551 pp., https://doi.org/10.1017/CBO9780511524899, 1993.
Coward, M. P.: Structural and Tectonic Setting of the Permo-Triassic Basins of Northwest Europe, Geol. Soc. Spec. Publ., 91, 7–39, https://doi.org/10.1144/GSL.SP.1995.091.01.02, 1995.
Cudahy, T., Jones, M., Thomas, M., Laukamp, C., Caccetta, M., Hewson, R., Rodger, A., and Verrall, M.: Next Generation Mineral Mapping: Queensland airborne HyMap and satellite ASTER surveys 2006–2008, CSIRO report P2007/364, https://doi.org/10.13140/RG.2.1.2828.1844, 2008.
De La Rosa, R., Khodadadzadeh M., Tusa, L., Kirsch, M., Gisbert, G., Tornos, F., Tolosana-Delgado R., and Gloaguen, R.: Mineral quantification at deposit scale using drill-core hyperspectral data: A case study in the Iberian Pyrite Belt, Ore Geol. Rev., 139, 104514, https://doi.org/10.1016/j.oregeorev.2021.104514, 2021.
De La Rosa, R., Tolosana-Delgado, R., Kirsch, M., and Gloaguen, R.: Automated Multi-Scale and Multivariate Geological Logging from Drill-Core Hyperspectral Data, Remote Sensing, 14, 2676, https://doi.org/10.3390/rs14112676, 2022.
Essalhi, M., Sizaret, S., Barbanson, L., Chen, Y., Branquet, Y., Panis, D., Camps, P., Rochette, P., and Canals, A.: Track of fluid paleocirculation in dolomite host rock at regional scale by the Anisotropy of Magnetic Susceptibility (AMS): An example from Aptian carbonates of La Florida, Northern Spain, Earth Planet. Sc. Lett., 277, 501–513, https://doi.org/10.1016/j.epsl.2008.11.011, 2009.
Franz, R., Dette, K., Rusitzka, D., Richter, G., Gerasch, A., Rentzsch, J. and Siegert, C.: Ergebnisbericht mit Massenberechnung über die geologische Erkundung auf Kupferschiefer im Raum Spremberg – Weißwasser/Bez. Cottbus vom 01.11.1958 bis Oktober 1964, unpublished, VEB Geologische Erkundung Süd, Freiberg, 1967.
Gaffey, S. J.: Spectral Reflectance of Carbonate Minerals in the Visible and near Infrared (0.35–2.55 Microns); Calcite, Aragonite, and Dolomite, Am. Miner., 71, 151–162, 1986.
GMEX: Spectral interpretation field manual, 3rd Edn., AuSpec International Ltd., v. I, II, III, 2008.
Green, D. and Schodlok, M.: Characterisation of carbonate minerals from hyperspectral TIR scanning using features at 14 000 and 11 300 nm, Austr. J. Earth Sci., 63, 8, https://doi.org/10.1080/08120099.2016.1225601, 2016.
Greenberger, R., Ehlmann, B., Jewell, P., Birgenheier, L., and Green, R.: Detection of Organic-Rich Oil Shales of the Green River Formation, Utah, with Ground-Based Imaging Spectroscopy, 8th Workshop on Hyperspectral Image and Signal Processing: Evolution in Remote Sensing (WHISPERS), Los Angeles, CA, USA, 1–5, https://doi.org/10.1109/WHISPERS.2016.8071807, 2016.
Hancock, N. J. and Taylor, A. M.: Clay mineral diagenesis and oil migration in the Middle Jurassic Brent Sand Formation, J. Geol. Soc., 135, 69–72, https://doi.org/10.1144/gsjgs.135.1.0069, 1978.
Harraden, C. L., Mcnulty, B. A., Gregory, M. J., and Lang, J. R.: Shortwave Infrared Spectral Analysis of Hydrothermal Alteration Associated with the Pebble Porphyry Copper-Gold Molybdenum Deposit, Iliamna, Alaska, Soc. Eco. Geo., 108, 483–494, https://doi.org/10.2113/econgeo.108.3.483, 2013.
Hartsch, J.: New Aspects of Copper Deposits at the Base of the Zechstein in Central Europe, 3D, 4D and Predictive Modelling of Major Mineral Belts in Europe, edited by: Weihed, P., Springer, 147–161, https://doi.org/10.1007/978-3-319-17428-0_7, 2015.
Herrmann, W., Blake, M., Doyle, M., Huston, D., Kamprad, J., Merry, N., and Pontual, P.: Short Wavelength Infrared (SWIR) Spectral Analysis of Hydrothermal Alteration Zones Associated with Base Metal Sulfide Deposits at Rosebery and Western Tharsis, Tasmania, and Highway-Reward, Queensland, Econ. Geol., 96, 939–955, https://doi.org/10.2113/gsecongeo.96.5.939, 2001.
Jakob, S., Gloaguen, R., and Laukamp, C.: Remote Sensing-Based Exploration of Structurally-Related Mineralizations around Mount Isa, Queensland, Australia, Remote Sens., 8, 358, https://doi.org/10.3390/rs8050358, 2016.
Jones, S., Herrmann, W., and Bruce, G.: Short Wavelength Infrared Spectral Characteristics of the HW Horizon: Implications for Exploration in the Myra Falls Volcanic-Hosted Massive Sulfide Camp, Vancouver Island, British Columbia, Canada, Soc. Eco. Geo., 100, 273–294, https://doi.org/10.2113/gsecongeo.100.2.273, 2005.
Kehrer, C.: Geometallurgical assessment of the Kupferschiefer-type base metal deposit Spremberg-Graustein, Lusatia, Germany, PhD thesis, Technical University Bergakademie, Freiberg, Germany, 2016.
Kokaly, R. F., Clark, R. N., Swayze, G. A., Livo, K. E., Hoefen, T. M., Pearson, N. C., Wise, R. A., Benzel, W. M., Lowers, H. A., Driscoll, R. L., and Klein, A. J.: USGS Spectral Library Version 7. U.S. Geological Survey Data Series, 1035, https://doi.org/10.3133/ds1035, 2017.
Kopp, J., Simon, A., and Göthel, M.: Die Kupfer-Lagerstätte Spremberg-Graustein in Südbrandenburg, Brandenburg, Geowiss. Beitr., Kleinmachnow 13, 117–132, 2006.
Kopp, J., Hermann, S., Hoding, T., Andreas, S., and Bernd, U.: The Copper-Silver Deposit Spremberg-Graustein (Lusatia. F. R. Germany) – (Enrichment of non-ferrous metals at the Zechstein-base between Spremberg and Weißwasser), Z. Geol. Wiss., 36, 75–114, 2008.
Kopp, J., Spieth, V., and Höding, T.: The Return of the Copper Mining in Germany (Die Rückkehr des Kupferschieferbergbaus nach Deutschland), Glückauf, 146, 353–363, 2010.
Kopp, J. C., Spieth, V., and Bernhardt, H.-J.: Precious metals and selenides mineralisation in the copper-silver deposit Spremberg-Graustein, Niederlausitz, SE-Germany, Z. Dtsch. Ges. Geowiss., 163, 361–384, https://doi.org/10.1127/1860-1804/2012/0163-0361, 2012.
Kruse, F. A.: Integrated visible and near infrared, shortwave infrared, and longwave infrared (VNIR-SWIR-LWIR), full-range hyperspectral data analysis for geologic mapping, J. Appl. Remote Sens., 9, 096005-096005, https://doi.org/10.1117/1.Jrs.9.096005, 2015.
Kucha, H.: Geochemistry of the Kupferschiefer, Poland, Geol. Rundsch., 79, 387–399, https://doi.org/10.1007/BF01830634, 1990.
Kucha, H.: Geology, mineralogy and geochemistry of the Kupferschiefer Poland, Eurtope's Major Base Metal Deposits, edited by: Kelly, C. J., Andrew, J. H., Ashton, M. B., Boland, G., Earls, L., and Fuscardi, G., Stanley, Irish Association for Economic Geol., 215–238, 2003.
Lampinen, H. M., Laukamp, C., Occhipinti, S. A., Metelka, V., and Spinks, S. C.: Delineating alteration footprints from field and ASTER SWIR spectra, geochemistry, and gamma-ray spectrometry above Regolith-covered base metal deposits – An example from abra, Western Australia, Econ. Geol., 112, 1977–2003, https://doi.org/10.5382/econgeo.2017.4537, 2017.
Laukamp, C., Cudahy, T., Thomas, M., Jones, M., Cleverley, J. S., and Oliver, N. H. S.: Hydrothermal mineral alteration patterns in the Mount Isa Inlier revealed by airborne hyperspectral data, Austr. J. Earth Sci., 58, 917–936, https://doi.org/10.1080/08120099.2011.571287, 2011.
Laukamp, C., Rodger, A., LeGras, M., Lampinen, H., Lau, I. C., Pejcic, B., Stromberg, J., Francis, N., and Ramanaidou, E.: Mineral physicochemistry underlying feature-based extraction of mineral abundance and composition from shortwave, mid and thermal infrared reflectance spectra, Minerals, 11, 347, https://doi.org/10.3390/min11040347, 2021.
Lehmann, C.: Cement stratigraphy of mineralized Zechstein carbonate rocks of the Cu-Ag deposit Spremberg-Graustein, Lusatia, Germany, BSc thesis, Technical University Bergakademie, Freiberg, Germany, 2012.
Mantovani, M., Escudero, A., and Becerro, A. I.: Effect of pressure on kaolinite illitization, Appl. Clay Sci., 50, 342–347, https://doi.org/10.1016/j.clay.2010.08.024, 2010.
Mateer, M.: Ammonium Illite at the Jerritt Canyon District and Gold strike Property, Nevada: its spatial distribution and significance in the exploration of Carlin-type deposits, MS thesis, University of Wyoming, 230 pp., ISBN 9781124293417, 2010.
McKie, T.: Paleogeographic Evolution of Latest Permian and Triassic Salt Basins in Northwest Europe, in: Permo-Triassic Salt Provinces of Europe, North Africa and the Atlantic Margins, edited by: Soto, J., Flinch, J., and Tari, G., Elsevier, 159–173, 2017.
Minz, F.: Cement Stratigraphy of the Siliciclastic Sedimentary Footwall Rocks below the Kupferschiefer from the Cu-Ag Deposit Spremberg, Lusatia, Germany, MSc Technical University Bergakademie, Freiberg, Germany, 2011.
Ngcofe, L., Minaar, H., Halenyane, K., and Chevallier, L.: Multispectral and hyperspectral remote sensing: target area generation for porphyry copper exploration in the Namaqua Metamorphic province, South Africa. South African Journal of Geology, 259–272, https://doi.org/10.2113/gssajg.116.2259, 2013
Oszczepalski, S.: Origin of the Kupferschiefer polymetallic mineralization in Poland, Miner. Deposita, 34, 599–613, https://doi.org/10.1007/s001260050222, 1999.
Oszczepalski, S., Nowak, G. J., Bechtel, A., and Zák, K.: Evidence of oxidation of the Kupferschiefer in the Lubin-Sieroszowice deposit, Poland: implications for Cu-Ag and Au-Pt-Pd mineralisation, Geol. Q., 46, 1–23, 2002.
Oszczepalski, S., Speczik, S., Zieliński, K., and Chmielewski, A.: The Kupferschiefer Deposits and Prospects in SW Poland: Past, Present and Future, Minerals, 9, 592, https://doi.org/10.3390/min9100592, 2019.
Portela, B., Sepp, M., van Ruitenbeek, F., Christoph Hecker, C., and Dilles, J. H.: Using hyperspectral imagery for identification of pyrophyllite-muscovite intergrowths and alunite in the shallow epithermal environment of the Yerington porphyry copper district, Ore Geol. Rev., 131, 104012, https://doi.org/10.1016/j.oregeorev.2021.104012, 2021.
Rahfeld, A., Kleeberg, R., Möckel, R., and Gutzmer, J.: Quantitative mineralogical analysis of European Kupferschiefer ore, Miner. Eng., 115, 21–32, https://doi.org/10.1016/j.mineng.2017.10.007, 2018.
Rentzsch, J.: The Kupferschiefer in comparison with the deposits of the Zambian Copperbelt, Annales de la Société géologique de Belgique, Special Publications, Gisements stratiformes et provinces cuprifères – Centenaire de la Société Géologique de Belgique, 1974, 395–418, https://popups.uliege.be/0037-9395/index.php?id=3595 (last access: June 2022), 1974.
Riley, D., Mars, J., Cudahy, T., and Hewson, R.: Mineral mapping for copper porphyry exploration using multispectral satellite and airborne hyperspectral airborne sensors, Arizona Geological Society Digest., 22, 111–125, 2008.
Schmidt, F. P.: Alteration zones around Kupferschiefer-type base metal mineralization in West Germany, Miner. Deposita, 22, https://doi.org/10.1007/BF00206606, 1987.
Schmidt Mumm, A. and Wolfgramm, M.: Fluid systems and mineralization in the north German and Polish basin, Geofluids, 4, 315–328, https://doi.org/10.1111/j.1468-8123.2004.00090.x, 2004.
Speczik, S. and Püttman, W.: Origin of Kupferschiefer mineralisation as suggested by coal petrology and organic geochemical studies, Acta Geol. Pol., 37, 1987.
Spieth, V.: Zechstein Kupferschiefer at Spremberg and Related Sites: Hot Hydrothermal Origin of the Polymetallic Cu-Ag-Au Deposit, PhD thesis, University of Stuttgart, https://doi.org/10.18419/opus-10530, 2019.
Stoll, M.: Deportment of critical metals and process mineralogy of Kupferschiefer ores from the Polkowice-Sieroszowice mine, SW Poland, BSc thesis, Faculty of Geology and Petrology, Institute of Mineralogy, Technical University Bergakademie, Freiberg, Germany, 2014.
Swayze, G. A., Clark, R. N., Goetz, A. F. H., Livo, K. E., Breit, G. N., Kruse, F. A., Sutley, S. J., Snee, L. W., Lowers, H. A., and Post, J. L.: Mapping Advanced Argillic Alteration at Cuprite, Nevada, Using Imaging Spectroscopy, Econ. Geol., 109, 1179–1221, 2014.
Symons, D., Kawasaki, K., Walther, S., and Borg, G.: Paleomagnetism of the Cu–Zn–Pb-Bearing Kupferschiefer Black Shale (Upper Permian) at Sangerhausen, Germany, Miner. Deposita, 46, 37–52, https://doi.org/10.1007/s00126-010-0319-2, 2011.
Tagle, R. A., Reinhardt, F., Waldschläger, U., Hill, T., and Wolff, T.: A deeper insight into materials: potentials and limitations of μ-XRF, European Microbeam Analysis Society (EMAS), in: EMAS 2019 Workshop, Book of Tutorials and Abstracts, Trondheim, Norway, 19–23 May 2019, ISBN 978 90 8227 695 4, 2019.
Tappert, M. C., Rivard, B., Tappert, R., and Feng, J.: Using Reflectance Spectroscopy to Estimate the Orientation of Quartz Crystals in Rocks, Can. Mineral., 51, 405–413, https://doi.org/10.3749/canmin.51.3.405, 2013.
Taylor, G. R., Hansford, P., Stevens, B. P. J., and Robson, D.: HyMap™ of Broken Hill – imaging spectrometry for rock and mineral abundance mapping, Explor. Geophys., 36, 397–400, https://doi.org/10.1071/EG05397, 2005.
Thiele, S., Lorenz, S., Kirsch, M., Contreras Acosta, C., Tusa, L., Hermann, E., Mockel, R., and Gloaguen, R.: Multi-Scale, Multi-Sensor Data Integration for Automated 3-D Geological Mapping, Ore Geol. Rev., 136, 104252, https://doi.org/10.1016/j.oregeorev.2021.104252, 2021.
Thompson, A. J. B., Phoebe, L. H., and Audrey, J. R.: Alteration Mapping in Exploration: Application of Short-Wave Infrared (SWIR) Spectroscopy, Society of Economic Geologists, Newsletter, 39, 1–27, https://doi.org/10.5382/SEGnews.1999-39.fea, 1999.
Tusa, L., Andreani, L., Pohl, E., Contreras, I. C., Khodadadzadeh, M. I., Gloaguen, R., and Gutzmer, J.: Extraction of Structural and Mineralogical Features from Hyperspectral Drill-Core Scans, IGARSS 2018 – 2018 IEEE International Geoscience and Remote Sensing Symposium, Valencia, Spain, 2018, 4070–4073, https://doi.org/10.1109/IGARSS.2018.8517786, 2018.
Tusa, L., Khodadadzadeh, M., Contreras, C., Rafiezadeh Shahi, K., Fuchs, M., Gloaguen, R., and Gutzmer, J.: Drill-Core Mineral Abundance Estimation Using Hyperspectral and High-Resolution Mineralogical Data, Remote Sensing, 12, 1218, https://doi.org/10.3390/rs12071218, 2020.
Van der Meer, F.: Analysis of spectral absorption features in hyperspectral imagery, Int. J. Appl. Earth Obs., 5, 55–68, https://doi.org/10.1016/j.jag.2003.09.001, 2004.
Van Ruitenbeek, F., Cudahy, T.-J., Van der Meer, F.-D., and Hale, M.: Characterization of the hydrothermal systems associated with Archean VMS-mineralization at Panorama, Western Australia, using hyperspectral, geochemical and geothermometric data, Ore Geol. Rev., 45, 33–46, https://doi.org/10.1016/j.oregeorev.2011.07.001, 2012.
Van Ruitenbeek, F., Bakker, W. H., van der Werff, H., Zegers, T. E., Oosthoek, J. H., Omer, Z. A., Marsh, S., van der Meer, F. D.: Mapping the wavelength position of deepest absorption features to explore mineral diversity in hyperspectral images, Planet. Space Sci., 101, 108–117, https://doi.org/10.1016/j.pss.2014.06.009, 2014.
Wang, R., Cudahy, T. J., Laukamp, C., Walshe, J. L., Bath, A., Mei, Y., Young, C., Roache, T. J., Jenkins, A., Roberts, M., Barker, A., and Laird J.: White mica as a hyperspectral tool in exploration for Sunrise Dam and Kanowna Belle gold deposits, Western Australia, Econ. Geol. 112, 1153–1176, https://doi.org/econgeo.2017.4505, 2017.
Wodzicki, A. and Piestrzyński, A.: An Ore Genetic Model for the Lubin – Sieroszowice Mining District, Poland, Miner. Deposita, 29, 30–43, https://doi.org/10.1007/BF03326394, 1994.
Zaini, N., Meer, F., and van der Werff, H.: Effect of Grain Size and Mineral Mixing on Carbonate Absorption Features in the SWIR and TIR Wavelength Regions, Remote Sensing, 4, 987–1003, https://doi.org/10.3390/rs4040987, 2012.
Zamudio, J. A.: Focusing Field Exploration Efforts, Using Results from Hyperspectral Data Analysis of the El Capitan Gold-Platinum Group Metals-Iron Deposit, New Mexico, Remote Sensing and Spectral Geology, edited by: Bedell, R., Crósta, A. P., and Grunsky, E., Society of Economic Geologists, Inc., 169–176, https://doi.org/10.5382/Rev.16.13, 2009