the Creative Commons Attribution 4.0 License.
the Creative Commons Attribution 4.0 License.
 | 05 Jul 2024
Propagating rifts: the roles of crustal damage and ascending mantle fluids
Rasheed Ajala
We investigate the upper-crustal structure of the Rukwa–Tanganyika rift zone in East Africa, where the Tanganyika rift interacts with the Rukwa and Mweru-Wantipa rift tips, evidenced by prominent fault scarps and seismicity across the rift interaction zones. We invert earthquake P-wave and S-wave travel times to produce 3D upper-crustal velocity models for the region and perform seismicity cluster analysis to understand strain accommodation in rift interaction zones and at the propagating rift tips. The resulting models reveal the occurrence of anomalously high (primary-to-secondary wave velocity) ratios in the upper crust beneath the Rukwa and Mweru-Wantipa rift tips – regions with basement exposures and sparse rift sedimentation. We detect distinct earthquake families within the deeper clusters which exhibit a temporal evolution pattern characterized by an upward linear trend that suggests triggering caused by upward fluid migration and creep failure. A spatial transition from proximal tip zones dominated by a thinned crust and through-going crustal and upper-mantle seismicity to distal tip zones with a thick crust and dominantly upper-crustal seismicity indicates an along-axis variation in the controls on rift tip deformation. Overall, the collocation of basement faulting, crustal and upper-mantle seismicity, and high upper-crustal ratios suggests a mechanically weakened crust at the rift tips, likely accommodated by brittle damage from crustal-bending strain and thermomechanical alteration via ascending fluids (mantle-sourced volatiles and hydrothermal fluids). These findings provide new insights into the physics of the propagation, linkage, and coalescence of continental rift tips – a necessary ingredient for initiating continental-breakup axes.
- Article
(9887 KB) - Full-text XML
-
Supplement
(21723 KB) - BibTeX
- EndNote


The mechanism of segmentation, lateral propagation, and linkage of continental rifts, first introduced by Bosworth (1985), has received significant attention from the scientific community as it influences the structure and temporal progression of the evolving breakup axis (e.g., Ebinger et al., 1989, 1999; Nelson et al., 1992; Acocella et al., 1999; Aanyu and Koehn, 2011; Allken et al., 2012; Corti, 2004; Zwaan et al., 2016; Neuharth et al., 2021; Kolawole et al., 2021a; Brune et al., 2023). Previous studies have established that continental rift systems grow through the initial nucleation of isolated segments that propagate laterally, interact, link up, and coalesce to form longer composite rift basins with a continuous rift floor. Prior to linkage, the propagating rift segments are separated by an “unrifted” crustal block, and the lateral propagation of the rift deformation into the intervening block is essential for advancing the rift system towards breakup (e.g., Nelson et al., 1992; Kolawole et al., 2021a; Brune et al., 2023).
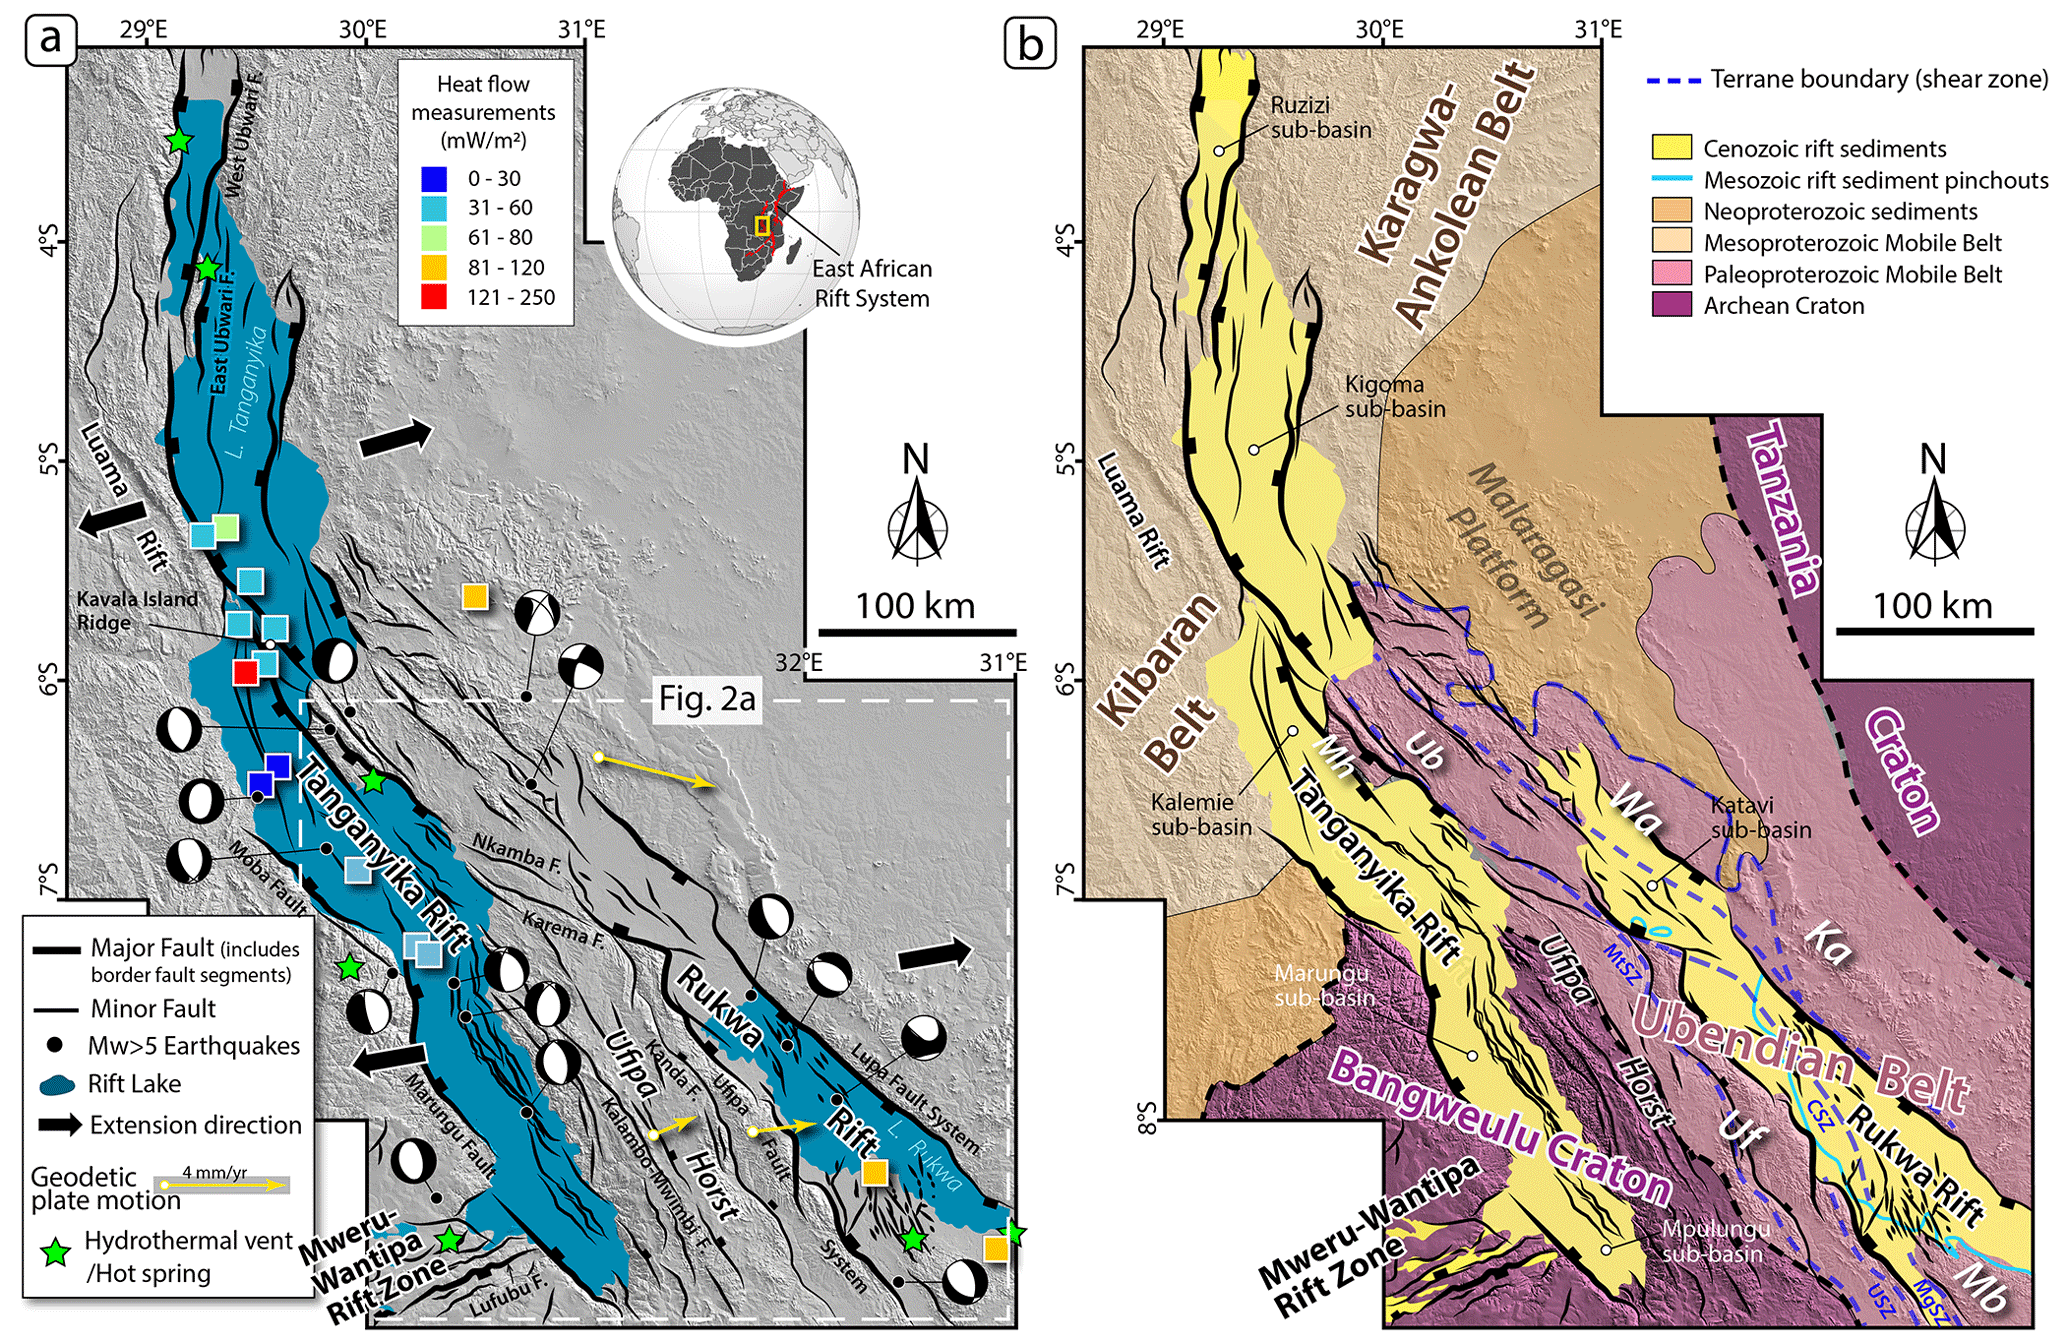
Figure 1(a) Tectonic map of the Rukwa–Tanganyika rift zone showing the rift faults (Morley et al., 1999; Muirhead et al., 2019; Kolawole et al., 2021a). Focal mechanisms and epicenters of earthquakes with Mw>5 are from the National Earthquake Information Center (NEIC) catalog (1976–2018), obtained through the United States Geological Survey website (https://earthquake.usgs.gov/earthquakes/search/, last access: 1 February 2023). Geodetic plate motion vectors are from Stamps et al. (2008). Regional extension directions are from Delvaux and Barth (2010) for the northern Tanganyika rift and from Lavayssière et al. (2019) for the southern Tanganyika and Rukwa rift basins. Heat flow measurements and their locations are from Jones (2020). Sites of hot springs and hydrothermal vents are from Tiercelin et al. (1993), Lavayssière et al. (2019), Jones (2020), and Mulaya et al. (2022). (b) Geological map of the region showing the cratons, mobile belts, terranes of the Ubendian belt and shear zones, and Cenozoic syn-rift sediments (modified after Daly, 1988; Hanson, 2003; Delvaux et al., 2012; Kolawole et al., 2021a, b; Ganbat et al., 2021). The Ubendian belt terranes are as follows: Ka (Katuma), Mb (Mbozi), Mh (Mahale), Ub (Ubende), Uf (Ufipa), and Wa (Wakole). The exhumed Precambrian shear zones (Delvaux et al., 2012; Heilman et al., 2019) are as follows: CSZ (Chisi shear zone), MgSZ (Mughese shear zone), MtSZ (Mtose shear zone), and USZ (Ufipa shear zone). L. Tanganyika and L. Rukwa stand for Lake Tanganyika and Lake Rukwa, respectively. F.: fault.
In regions of active tectonic extension, inelastic deformation manifests through tectonic and magmatic deformation of the crystalline crust and its overlying sedimentary sequences in the rift basins (e.g., Brune et al., 2023; Pérez-Gussinyé et al., 2023). However, in magma-poor (i.e., nonvolcanic) active-rift settings, tectonic deformation is commonly accommodated by widespread brittle deformation of the crust through faulting and fracturing that accompany earthquakes (e.g., Muirhead et al., 2019; Kolawole et al., 2018a; Gaherty et al., 2019; Zheng et al., 2020; Stevens et al., 2021). Nevertheless, little is known about how this deformation is transferred to the propagating rift tips, and long-standing questions remain on how the Earth's crystalline crust accommodates and localizes tectonic strain during continental rift propagation.
In this study, we use recently acquired seismic data to explore the upper-crustal structure of the Rukwa–Tanganyika rift zone (Fig. 1a), an active nonvolcanic rift zone along the East African Rift System, where previous studies have suggested the existence of a thick strong lithosphere (Craig et al., 2011; Foster and Jackson, 1998; Yang and Chen, 2010; Hodgson et al., 2017; Lavayssière et al., 2019) and ongoing unilateral propagation of the Rukwa rift tip (Kolawole et al., 2021a). A previous study (Hodgson et al., 2017) utilized the receiver function technique to map the spatial distribution of crustal-averaged ratios but lacked constraints on the shallowest structure. Our results provide insight into the fundamental mechanisms of strain distribution and localization along actively propagating rift segments. Ultimately, this approach may advance our understanding of how incipient divergent plate boundaries mature within active continental environments.
2.1 Pre-rift crystalline basement
The crystalline crust of the Rukwa–Tanganyika rift zone (Fig. 1a) is mainly composed of metamorphic and igneous rocks from the Paleoproterozoic (1.85–1.95 Ga) Ubendian mobile belt (Fig. 1b). These rocks are flanked by Archean crystalline rocks from the Bangweulu and Tanzania cratons, along with their overlying Neoproterozoic sedimentary sequences, to the southwest and northeast, respectively (Fig. 1b). The Ubendian belt consists of several amalgamated NW-trending terranes that define the orogenic belt that accommodated the Paleoproterozoic collision events (2.025–2.1 Ga) between the Tanzania Craton and the Bangweulu Block. The terranes, comprising Ufipa, Katuma, Wakole, Lupa, Mbozi, Ubende, and Upangwa (Fig. 1b; Daly, 1988; Lenoir et al., 1994), have been exhumed due to long-term erosion and are bounded by steeply dipping, ductile strike-slip shear zones characterized by amphibolite facies (Fig. 1b; Daly, 1988; Lenoir et al., 1994; Theunissen et al., 1996; Kolawole et al., 2021b; Lemna et al., 2019; Heilman et al., 2019; Ganbat et al., 2021). The associated ductile fabrics are thought to have influenced the development of post-Precambrian rift basins in the region (Wheeler and Karson, 1994; Theunissen et al., 1996; Klerkx et al., 1998; Boven et al., 1999; Heilman et al., 2019; Lemna et al., 2019; Kolawole et al., 2018b, 2021a, b).
2.2 Phanerozoic rifting history
The Rukwa–Tanganyika rift zone is defined by a system of NNW–NW-trending, overlapping rift segments, which consist of the Tanganyika rift, the Rukwa rift to its southeast, and the ENE-trending Mweru-Wantipa rift located just southwest of the southernmost sub-basin of Tanganyika (Fig. 1a and b). The rift zone records multiple phases of Phanerozoic tectonic extension. The first phase occurred in the Late Permian to Triassic, the second phase began in the Late Jurassic but peaked in the Cretaceous, and the third phase began in the late Oligocene and persists to the present (e.g., Delvaux, 1989; Roberts et al., 2012). Studies show that all three rift segments are currently active (e.g., Daly et al., 2020; Hodgson et al., 2017; Lavayssière et al., 2019; Heilman et al., 2019; Kolawole et al., 2021a); however, not all of the basins record all three phases of Phanerozoic rifting (Delvaux, 1989; Morley et al., 1992, 1999; Muirhead et al., 2019; Shaban et al., 2023). Within the rift zone, the Rukwa rift is the only basin with basement-penetrating borehole logs that constrain the interpretation of seismic reflection, providing detailed mapping of the lateral extents of the Mesozoic and Cenozoic syn-rift sequences (Morley et al., 1992) and their relationships with rift-faulting patterns (Morley et al., 1992, 1999; Heilman et al., 2019; Kolawole et al., 2021b). The distribution of the syn-rift deposits and faulting patterns shows that the Rukwa rift progressively elongated northwestward and southeastward throughout its polyphase extensional tectonic history (Morley et al., 1999; Heilman et al., 2019; Kolawole et al., 2021b).
The Cretaceous rifting event included reactivated faulting, tectonic subsidence, and sedimentation in the Rukwa and Luama rifts (e.g., Veatch, 1935; Delvaux, 2001; Roberts et al., 2012). Cenozoic rifting initiated the development of rift basins as segments of the East African Rift System, including the reactivation of the Rukwa rift and the development of the Tanganyika and the Mweru-Wantipa rift segments (e.g., Morley et al., 1999; Delvaux, 2001; Chorowicz, 2005; Daly et al., 2020). Crustal thickness across the rift zones ranges from 31.6 to 42 km (Hodgson et al., 2017; Njinju et al., 2019), and lithosphere thickness ranges from 130 to 170 km (Njinju et al., 2019). The current minimum orientation of regional compressive stress is 74° in the northern Tanganyika rift (Delvaux and Barth, 2010) and 80° in the southern Tanganyika and Rukwa rifts (Lavayssière et al., 2019) (Fig. 1a). Although the current level of regional stress in the Mweru-Wantipa rift is unknown, the Mweru rift, which is its southwestern continuation, exhibits a minimum orientation of regional compressive stress at 118° (Delavaux and Barth, 2010).
2.3 Rift-faulting and seismicity patterns
The Tanganyika rift basin is bounded by a system of large border faults that alternate in polarity along the trend of the basin (Versfelt and Rosendahl, 1989). These faults include the Marungu fault, the Kavala Island Ridge faults, the West and East Ubwari faults, and the Moba fault (Fig. 1a). In contrast, the large graben of the Rukwa rift basin is bounded by the laterally continuous border fault systems of the Lupa fault (to the northeast) and Ufipa fault (to the southwest) (Heilman et al., 2019). The Ufipa horst represents the intervening basement block between the southern Tanganyika rift and the Rukwa rift and accommodates active deformation, as evidenced by the ∼100 km long scarps of the Kanda and Kalambo–Mwimbi faults (Fig. 1a; Delvaux et al., 2012; Kolawole et al., 2021). Moreover, two prominent fault scarps extend WNW from the Rukwa rift tip across a basement region to the eastern margins of the central Tanganyika rift (Nkamba and Karema faults; Fig. 1a). To the southwest, the deformation zone of the Mweru-Wantipa rift hosts a parallel 50 km wide fault cluster that defines its southeastern margin, within which the Lufuba fault appears to exhibit the greatest escarpment height (Fig. 1a).
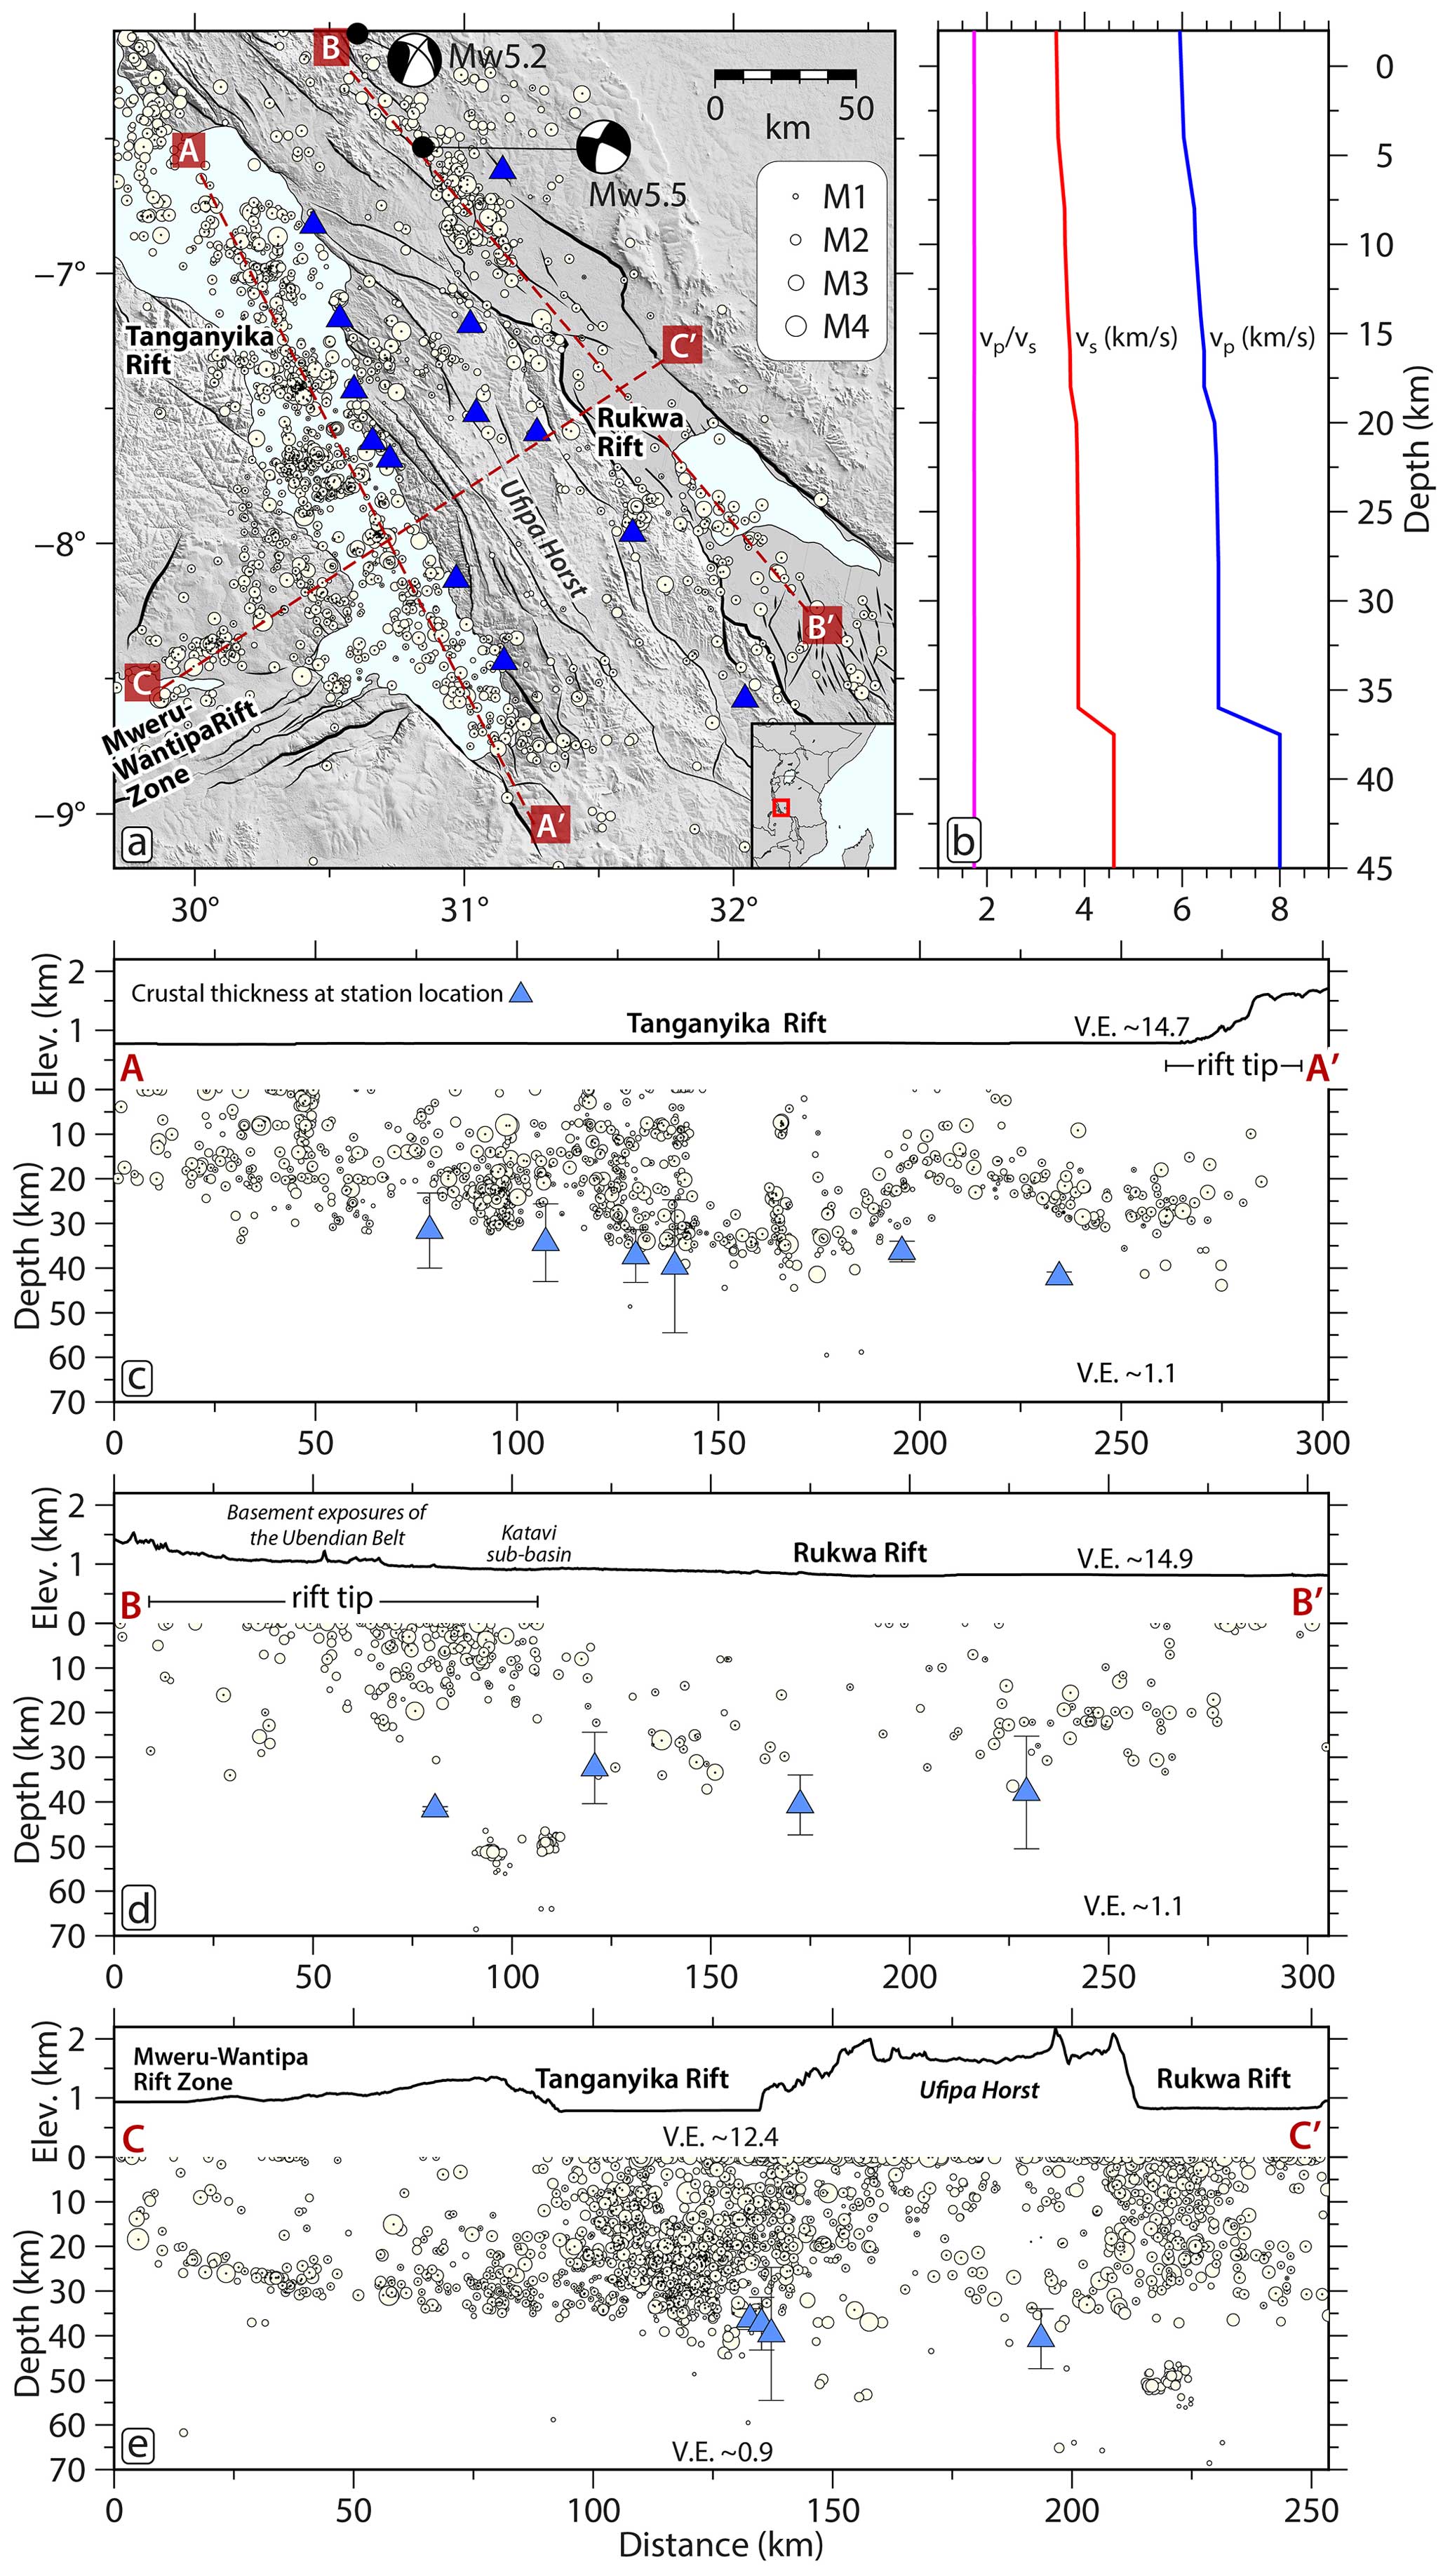
Figure 2(a) Map of the southern Tanganyika and Rukwa rift zone illustrating local seismicity using white circles (from the TANGA14 array as part of the network ZV; Lavayssière et al., 2019) scaled by magnitude. The circles with black dots represent the events used in the inversion. The blue triangles represent the locations of the TANGA14 broadband seismometers. The black lines denote the faults. The thicker black lines denote the border faults. The dashed red lines indicate the locations of the seismicity profiles in panels (c)–(e). The inset map shows the relative location in East Africa. (b) The starting model used in the seismic tomographic inversion (from Lavayssière et al., 2019). (c–e) Elevation and depth profiles showing the projected seismicity (from Lavayssière et al., 2019) and estimated Moho depths (from Hodgson et al., 2017) along and across the rifts. Two cross-sectional profiles, A–A' and B–B', only show earthquakes occurring within 25 km on both sides of the cross-section traces, and all Moho depth plots are projected from stations located within 50 km of the profiles. Elev.: elevation. V.E.: vertical exaggeration.
The entire Rukwa–Tanganyika rift zone experiences widespread seismicity (Fig. 2a and c–d) that extends beyond 42 km depth, indicating that the seismogenic layer of the rift includes the uppermost mantle (Fig. 2c–e; Lavayssière et al., 2019). The events define clusters with focal-mechanism solutions that indicate large, steep, and deep-rooted normal faults (Lavayssière et al., 2019) and highlight localized active crustal-deformation zones beneath the Tanganyika rift, Rukwa rift, Ufipa horst, and Mweru-Wantipa rift (Fig. 1a). Across the rift zone, earthquakes commonly continue down into the lower crust; however, beneath the northwestern tip of the Rukwa rift (Katavi sub-basin; Fig. 2a and d), earthquakes occur in both the upper crust and upper mantle (Lavayssière et al., 2019). More interestingly, the axis of the Rukwa rift exhibits sparse seismicity. Seismicity clusters at the Rukwa rift tip extend beyond the margins of the basin sediments, continuing into the regions of the exposed pre-rift basement (Fig. 2a and d). In the southern Tanganyika rift, earthquakes mostly cluster within and along the rift axis (Fig. 2a and c). Previous studies on seismic receiver function and crustal anisotropy show evidence indicating the presence of partial melt/volatiles in the lower crust (Hodgson et al., 2017; Ajala et al., 2024) and demonstrate how lower-crustal fluids promote strain localization (Ajala et al., 2024). Heat flow measurements in the rift zone show thermal anomalies in the central Tanganyika rift (<30–250 mW m−2), in the south-central region of the Rukwa rift (81–120 mW m−2), and within the basement region ahead of the northwestern tip of the Rukwa rift (81–120 mW m−2) (Fig. 1a; Jones, 2020). The thermal anomaly north of the Rukwa rift tip occurs near NW-trending fault splays and earthquake epicenters with Mw>5 within the basement region. Furthermore, hydrothermal-vent and hot-spring locations coincide with the border fault zones of the Tanganyika rift and the south-central part of the Rukwa rift (Fig. 1a; Tiercelin et al., 1993; Lavayssière et al., 2019; Jones, 2020).
2.4 Active deformation across the rift interaction zones
At a regional scale, the Rukwa and Tanganyika rift basins are separated by an elevated region of pre-rift basement with widespread exposures of Precambrian metamorphic rocks (Fig. 1a and b; Kolawole et al., 2021a). This elevated region of rift overlap includes the Ufipa horst to its south and the region between the northern tip of the Rukwa rift and the eastern flank of the central Tanganyika rift to its north. In a geodynamic context, the geometry of the overlap region defines an overlapping parallel to oblique “rift interaction zone” (Kolawole et al., 2021a) and is characterized by historical seismicity and active faults that deform the modern surface (Delvaux et al., 2001; Lavayssière et al., 2019; Kolawole et al., 2021a). The faults include the WNW-trending Karema and Nkamba faults, which splay westward from the Rukwa rift tip (Fig. 1a; Fernandez-Alonso et al., 2001; Kolawole et al., 2021a) and NW-trending faults that extend northward towards the margin of the northern Tanganyika rift (Kolawole et al., 2021a). The longitudinal surface relief morphology of the southern Tanganyika rift shows a significantly steeper gradient than that of the Rukwa rift tip (“rift tip” in Fig. 2c versus that in Fig. 2d). Overall, the current stage of evolution of the rift interaction zone, based on the relief profile, streamflow patterns, and drainage morphologies, is inferred to be partially breached (Kolawole et al., 2021a). To the southwest, the Mweru-Wantipa rift extends eastward and appears to be closely linked with the border fault of the western flank of the southern tip of the Tanganyika rift. The region between the two rifts defines an overlapping orthogonal rift interaction zone, and the continuation of Lake Tanganyika into the Mweru-Wantipa basin, along with the apparent coalescence of the rift floors of the two basins, suggests a breached rift interaction zone between them (Kolawole et al., 2021a).
3.1 Seismic data
We focus on waveform data recorded by the TANGA14 array, comprising 13 broadband seismographs that were deployed along the Ufipa plateau for 15 months from June 2014 through September 2015 (Fig. 2a; Hodgson et al., 2017). Using the origin times from the local earthquake catalog developed by Lavayssière et al. (2019), which comprises 2213 events (Fig. 2a), we downloaded the associated waveforms using the facilities of the EarthScope Consortium. The waveforms were then filtered with a Butterworth filter to accentuate the earthquake signal in the same frequency band as that used in Lavayssière et al. (2019), i.e., 2–15 Hz. The arrival times for both P waves and S waves were manually picked using filtered seismograms, resulting in 3187 P-wave times from 1277 earthquakes (and 3121 S-wave times from 1261 earthquakes). We only made the travel time picks when the phases were clear and impulsive. We do not record uncertainty in arrival times during picking, nor do we pick multiple times to estimate the data variance.
3.2 Crustal imaging
3.2.1 Back-projection tomography
Using our manually picked P-wave and S-wave arrival times, we develop 3D P-wave and S-wave velocity models for the Rukwa–Tanganyika region via nonlinear back-projection travel time inversion (Hole, 1992; Hole et al., 2000). For the study area, we use the 1D P-wave and S-wave velocity model developed by Lavayssière et al. (2019) as our initial velocity model. We parameterize the model space using a fixed 5 km grid spacing with dimensions of 425 km × 435 km × 50 km. The bottom-right corner of the model is located at −9.6764° and 29.1651° and extends from 7 km a.s.l. (above sea level) to 43 km depth. Therefore, we use the actual station elevations without needing static corrections. The travel time predictions in the model are calculated using a finite-difference solution for the Eikonal equation (Vidale, 1990), which allows travel times to be computed for all grid points in the model. Ray paths are then simultaneously traced for any number of source–receiver pairs using the gradient of the travel time field. Due to the reciprocity in the travel time computation, we treat the receivers as sources, thus requiring only 13 forward computations in each iteration. Following the forward calculation, we iteratively update each model, k, at each grid point, j, as follows:
where the slowness perturbation, δu, is calculated using simple back projection as the average of the neighborhood ray paths, i.e.,
where δt and l represent the associated travel time residual and ray path length for the corresponding ray. We further smooth the perturbations once they are determined for all grid points in the model using a 3D moving-average filter to control the spatial resolution and stabilize the inversion. This procedure resembles higher-order Tikhonov regularization in the nonlinear least-squares inversion. We gradually reduce the size of the smoothing dimension after every five iterations to increase the spatial resolution of the model. The final smoothing size of our model, based on the 26th iteration, amounts to grid points. Finally, the ratio is obtained by dividing the P-wave and S-wave velocity models.
3.2.2 Model reliability assessment
To assess the model uncertainty, we employ a combination of ray coverage maps, classical checkerboard reconstruction tests, a reconstruction test for a custom synthetic model (targeted resolution test (e.g., Saeidi et al., 2024)), and real data inversion using different starting models to determine the areas of the model that are reliable enough for interpretation (Figs. 3–5 and S2–S18). We generate the checkerboard models by adding 3D sinusoidal functions to the initial velocity model (Fig. 2b), using amplitudes with similar magnitudes to those of the real inverted model (Fig. 3). The observed travel time data set is computed in the checkerboard model and then inverted using the unperturbed starting model. We do not add noise to the synthetic data sets. We also test different sizes of anomalies (Figs. S4–S15). Based on the results from the artificial reconstructions, we define a polygon (e.g., Figs. 3 and S16) in the model space where the model parameters are reasonably resolved. Also, we develop and invert a custom synthetic model (Figs. S16 and S17) based on the critical features interpreted in our final preferred model (Fig. 3), focusing on the edge of the polygon where ray coverage is sparse or lacking (Fig. S2).
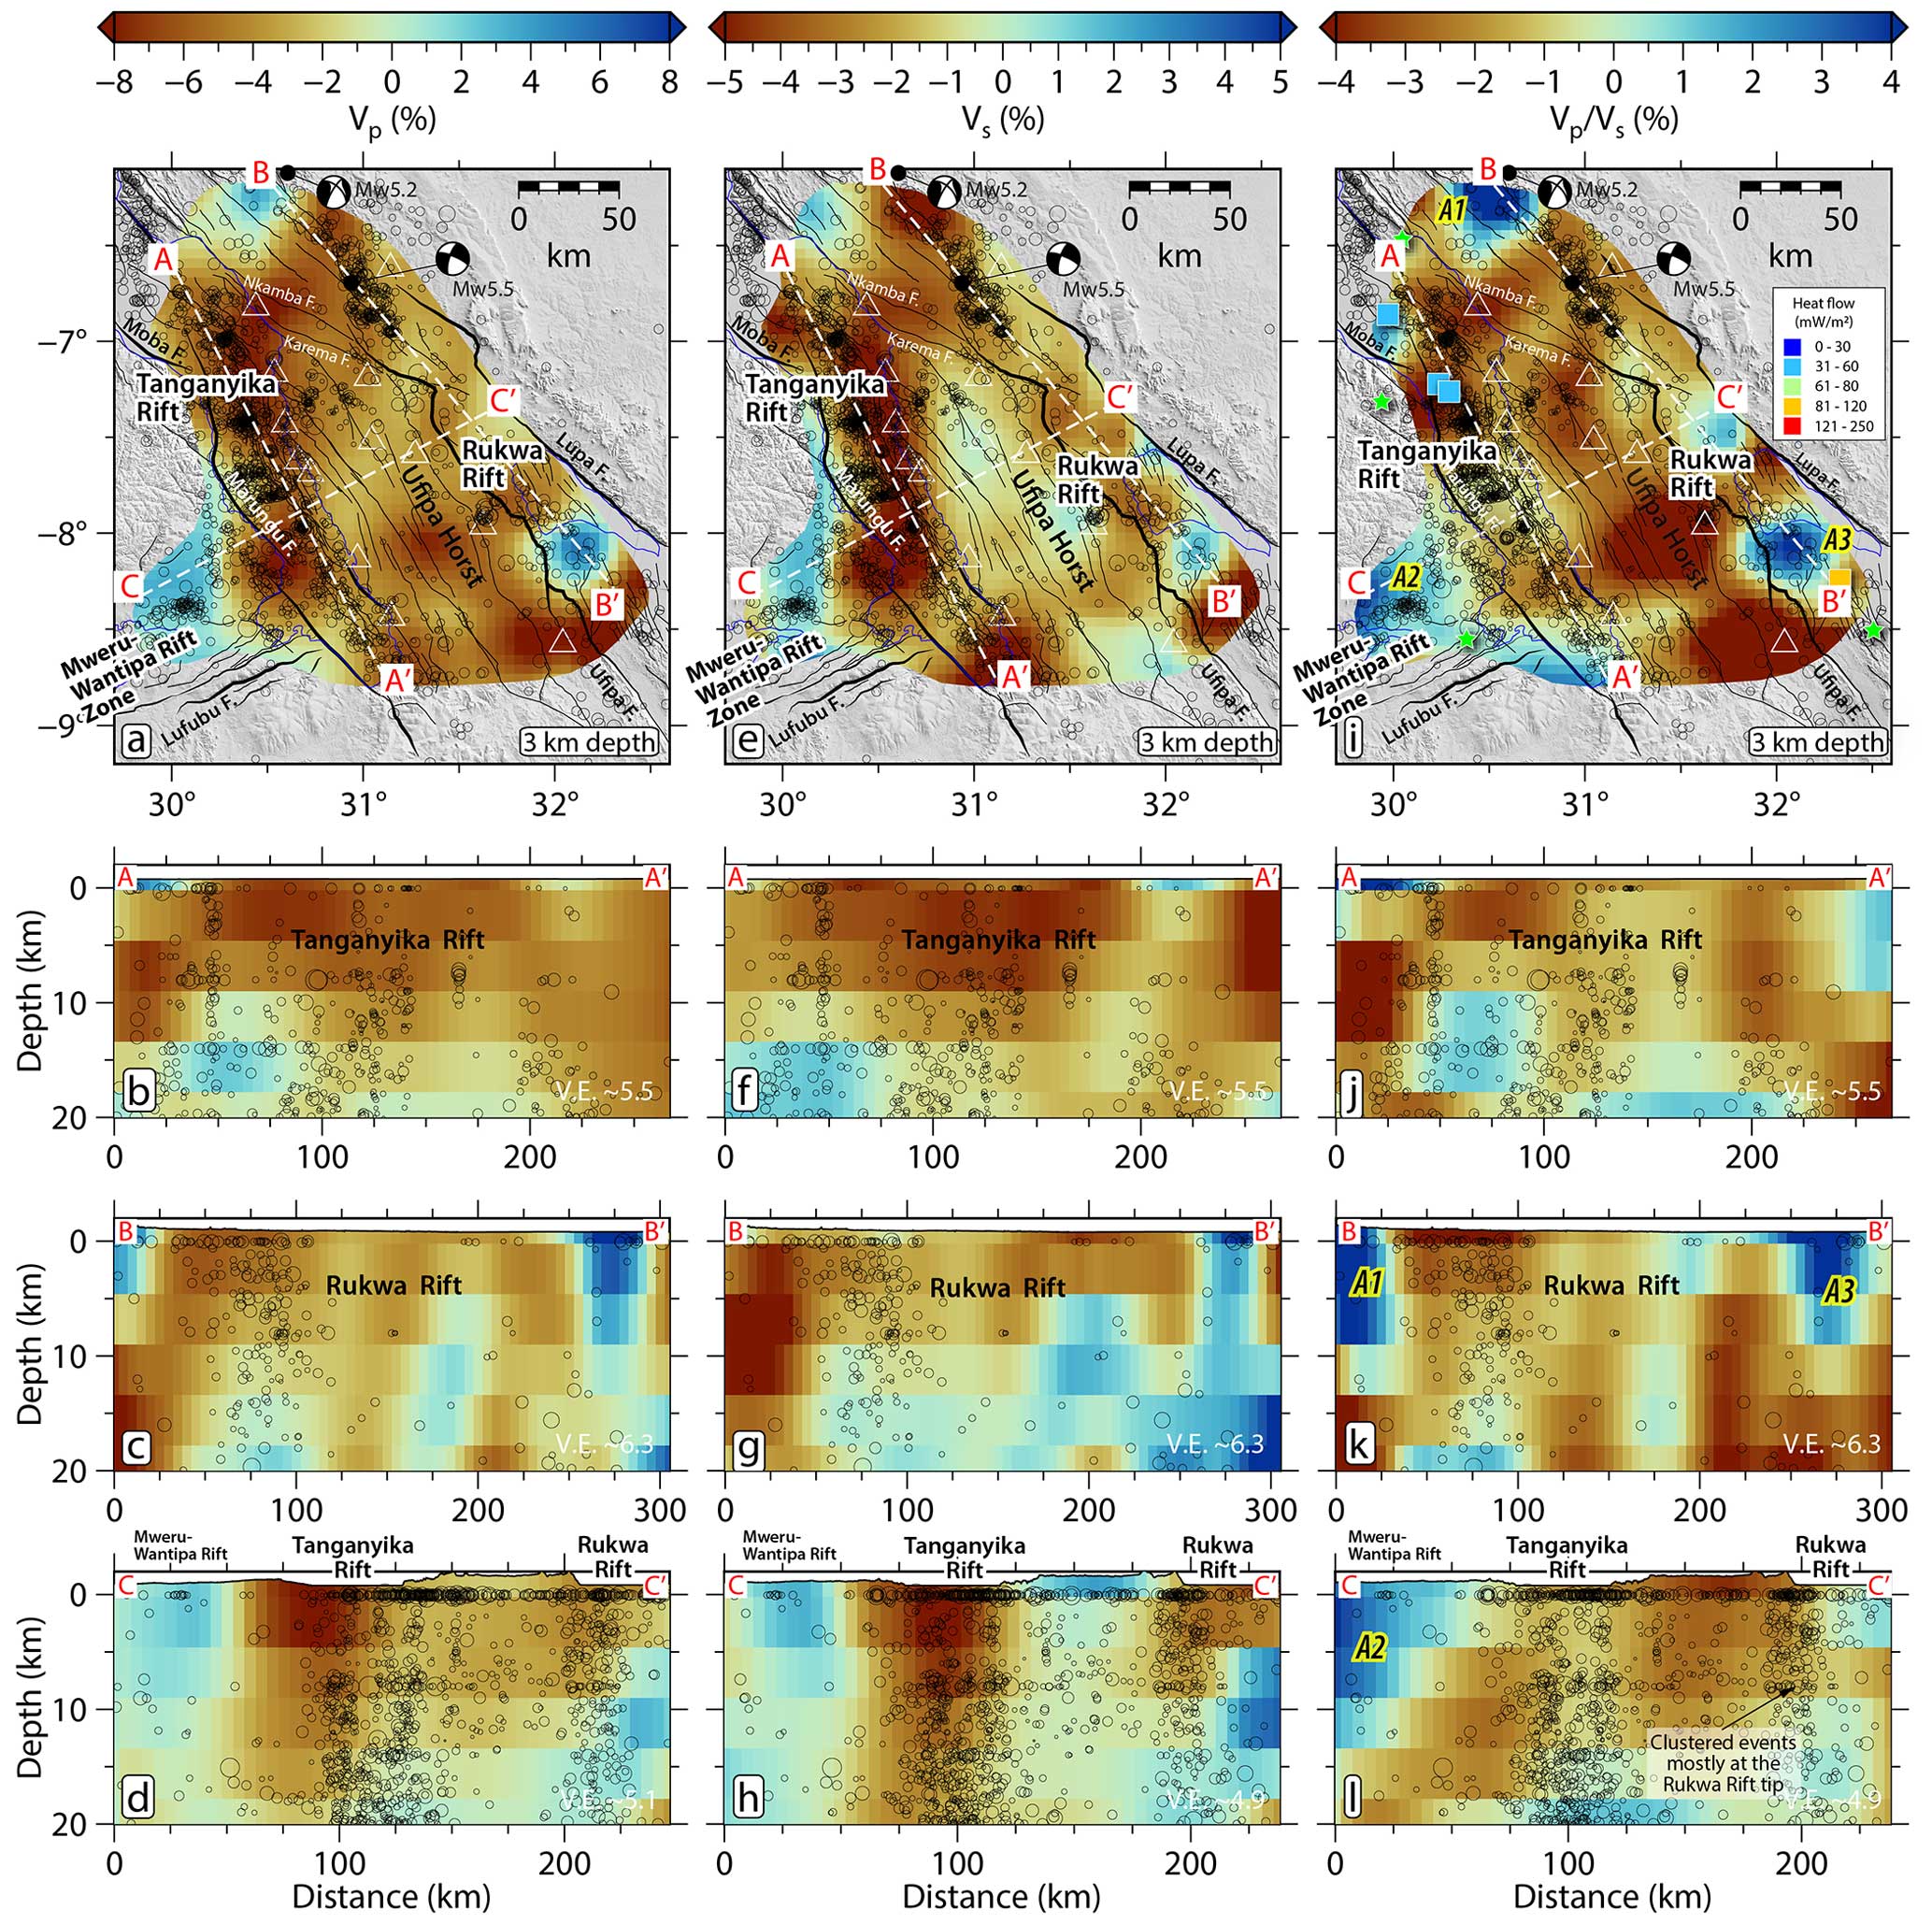
Figure 3Maps and profiles of the tomographic models showing perturbations relative to the starting models in Fig. 2b. (a) 3 km depth slice through the P-wave velocity model. Unreliable areas of the model are not shown. Dashed white lines indicate the profile locations in panels (b)–(d). (b–d) Profiles of the P-wave velocity model. Panels (e–h) show the same as that illustrated in panels (a)–(d) but for the S-wave velocity model. Panels (i–l) show the same as that illustrated in panels (a)–(d) but for the ratios. Absolute values of the model parameters are shown in Fig. S16. Note that the geothermal center near anomaly A1 is located north of latitude 6° S, which is outside of the map coverage (see Fig. 1a).
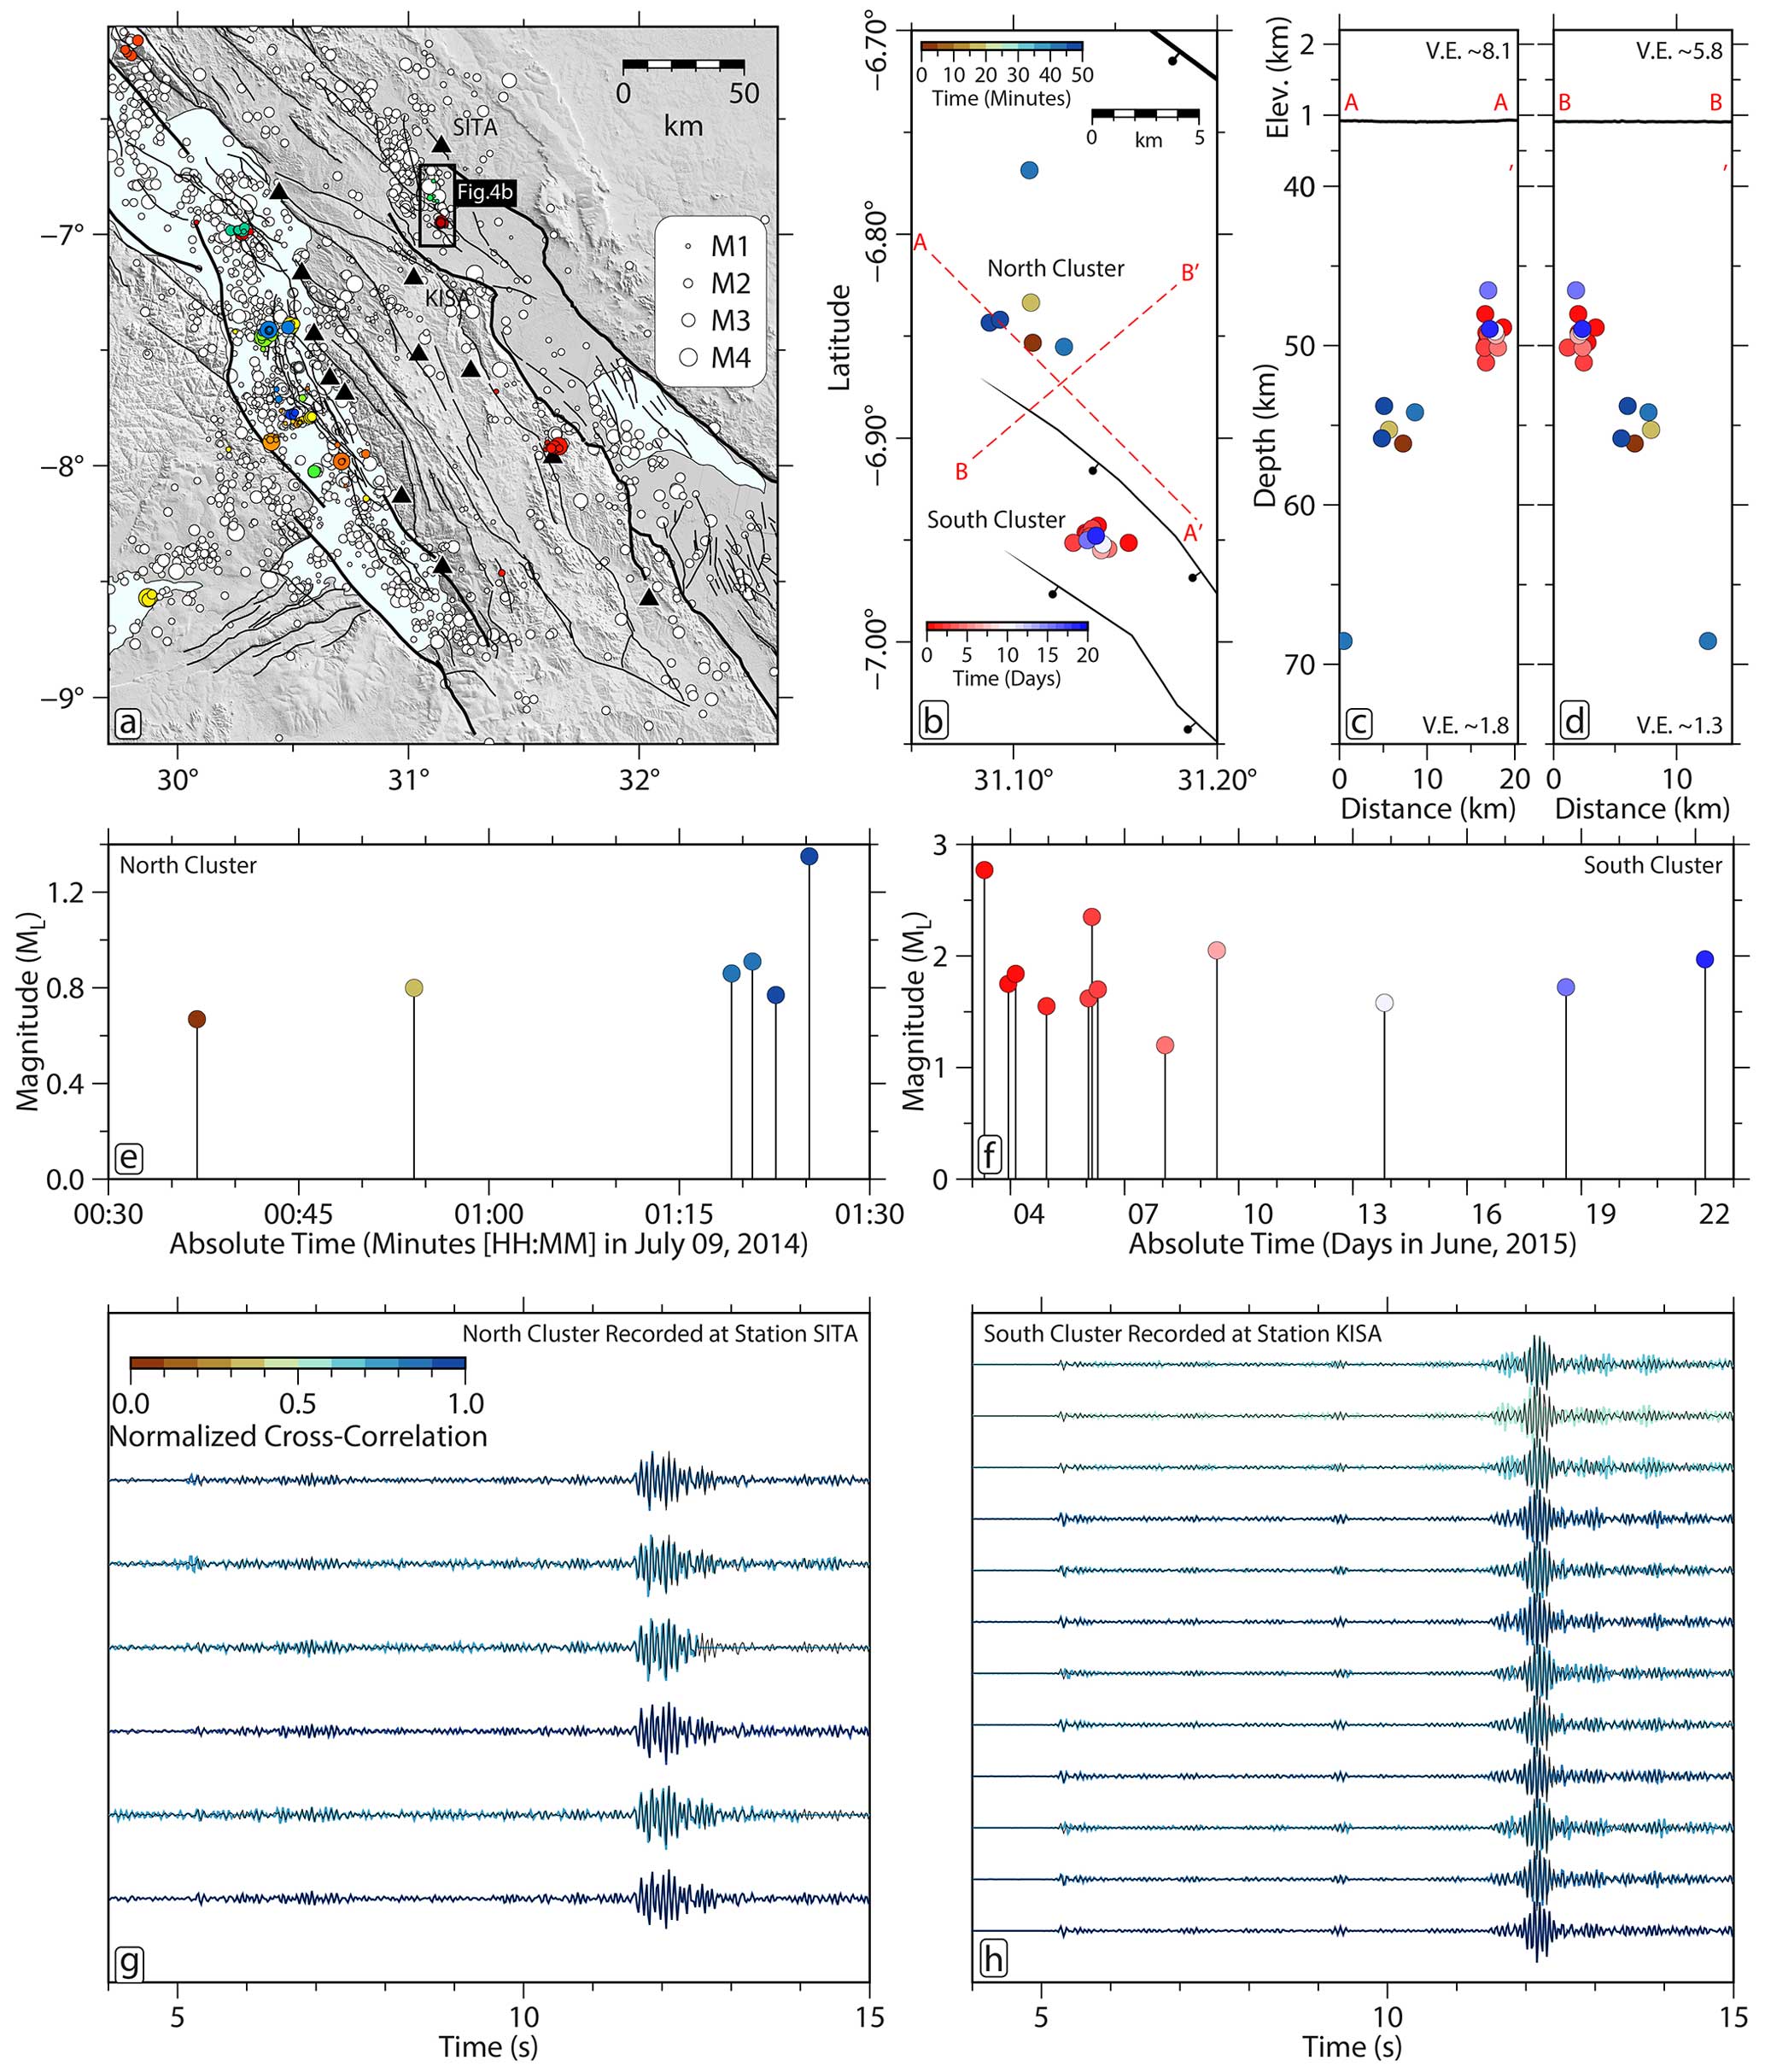
Figure 4Delineation of spatiotemporal seismicity clusters with a focus on the Rukwa rift tip swarms. (a) Map of the study area showing the broad seismicity distribution and detected spatiotemporal clusters (colored circles). The black polygon indicates the frame for the clusters shown in panel (b). M1 to M4 stand for the local earthquake magnitudes 1 to 4. (b) A zoomed-in view of a map of the two clusters at the Rukwa tip, which are color-coded according to their occurrence in time relative to the parent event (i.e., the first event) in each group. The dashed red lines indicate the locations of the cross-sectional profiles in panels (c) and (d). (c) Rift-parallel and (d) rift-perpendicular profiles showing the projected clusters. (e) Magnitude–time plot for the northern-cluster events. (f) Magnitude–time plot for the southern-cluster events. (g) Waveform records (2–15 Hz) for the northern-cluster events recorded at the SITA station, highlighted in panel (a). Each waveform is colored based on the normalized cross-correlation coefficient, computed by comparing the similarity of each waveform in the sequence to the waveform of the parent event. The parent event waveform is plotted as a black line on all the waveforms for visual comparison. All traces have been shifted in time to maximize the correlation. The maximum cross-correlation value occurs for the first trace since it represents the autocorrelation (correlation of the parent waveform with itself). (h) Similar to panel (g) but for the southern cluster recorded at the KISA station.
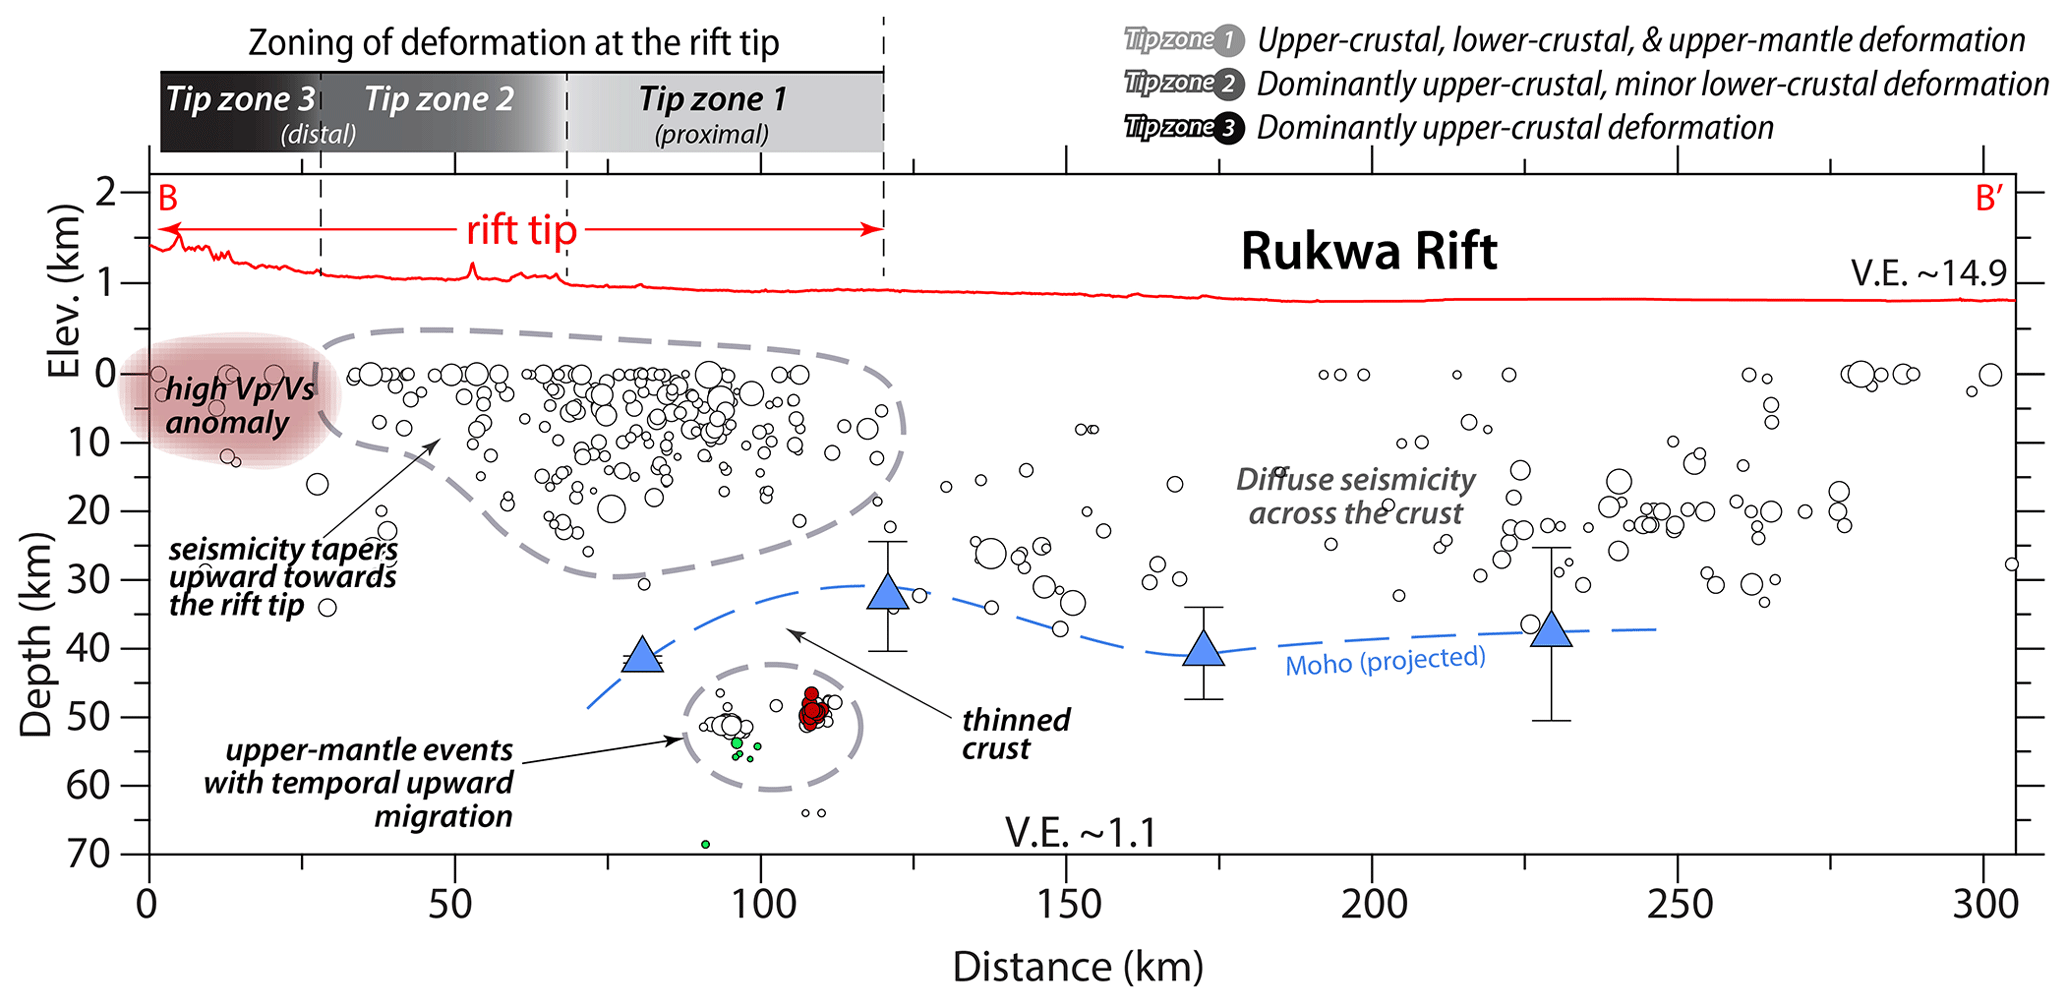
Figure 5Interpretation of the longitudinal cross-sectional profile B–B' for the Rukwa rift (same as in Figs. 2d and S24d), highlighting the spatial relationships between the broad seismicity distribution, detected fluid-related clustered events (colored upper-mantle events), low-velocity upper-crustal anomalies, Moho depth distribution, and zones of active deformation at the rift tip.
The synthetic model comprises three high ratio anomalies (∼4 % increase), generated by perturbing the P-wave (1 % increase) and S-wave (3 % decrease) velocity model, extending from 2 km above sea level to 13 km depth in the model space, using the following horizontal dimensions: 80 km by 60 km in the north, 80 km by 60 km in the southeast, and 65 km by 85 km in the southwest. The inversion results show good recovery of the anomalies with some smearing outside our predefined polygon (Fig. S17). To further assess the reliability of these features in the real model (Fig. 3), we perform two additional inversions of the real data using two different initial 3D velocity models from Celli et al. (2020) and van Herwaarden et al. (2023). A comparison of the results from all three starting models (Figs. S18–S20) shows that the ratio anomalies are robust.
3.3 Seismicity cluster analysis
Visual inspection of the seismicity (Fig. 2) reveals apparent spatial clusters. However, we must perform an analysis with respect to spatiotemporal seismicity clustering to determine which earthquakes are also close in terms of time (Fig. S21). While a complete statistical study of the earthquake catalog is beyond the scope of the current research, we perform a simple clustering analysis (Fig. S22) to highlight potential earthquake groups that could indicate fluid activity at the rift tips. First, we attempt catalog declustering using the approach from Reasenberg (1985), implemented in the CLUSTER2000 program, to remove any aftershock sequences. However, no significant aftershock sequences can be found, with most aftershock clusters (17 in total) containing only two events (Ajala and Kolawole, 2023). This is despite the earthquake frequency distribution (Fig. S23e) showing a decreasing amount of seismicity over time, which would seemingly indicate the presence of aftershock sequences. The lack of correlation between the data availability periods when the seismic stations were operational (Fig. S23a) and the seismicity frequency (Fig. S23e) shows that there was indeed increased seismic activity during the earlier deployment times, particularly in August 2014. An enhanced earthquake catalog with a lower magnitude of completeness may be required in the region for declustering. Therefore, we decided to use the entire catalog as is for the clustering analysis. We analyze the earthquake catalog for clusters using the algorithm from Zaliapin et al. (2008) and Zaliapin and Ben-Zion (2013), as implemented by Goebel et al. (2019). For each event j in the catalog, except the earliest one, we identify the parent event, which is an earlier event that is defined using the smallest nearest-neighbor distance ηij computed among all other instances of event i and is defined as
where tij is the time separation in years, rij is the Haversine distance between the epicenters of the earthquake pairs, df is the fractal dimension of the epicenters (assumed to be 1.6; Zaliapin et al., 2008), b is the Gutenberg–Richter b value (set to 1), and mi is the magnitude of the potential parent event i. To separate the nearest-neighbor distances into space Rij and time Tij components, we use the following relations:
where we assume an interpolation factor q of 0.5.
Finally, to split the catalog into background and cluster events, we estimate a separation threshold η0 using the average of estimates of the first percentile of nearest-neighbor distances computed from 100 randomized catalogs that have a similar range of space–time–magnitude parameters but follow a Poissonian distribution representative of background seismicity (Fig. S22). At the estimated η0, we see the probability distribution of the nearest-neighbor distances deviate from the Weibull probability distribution, known to represent Poisson background seismicity (Fig. S22c; Zaliapin and Ben-Zion, 2013). Event pairs with nearest-neighbor distances less than η0 that have similar parents are then recursively grouped to generate the clustered catalog (Figs. 4, S23b–d, and S24). For clusters at the Rukwa rift tip, we compute the normalized cross-correlation coefficients of the vertical component of the waveforms of events relative to the waveform of the parent event (Fig. 4g and h). We note that the lack of uncertainties in the earthquake catalog (Lavayssière et al., 2019) and relative earthquake locations may introduce spatiotemporal errors in the above analysis. In presenting our results, we use the time–magnitude plots as a guide to help distinguish between the mechanisms of the two swarms as either slow slip (creep) or fluid flow (Roland and McGuire, 2009).
4.1 Crustal seismic velocity models of the Rukwa–Tanganyika rift zone
We present the velocity models as perturbations (Fig. 3) relative to the starting models used in the inversion (Fig. 2b). The 5 km model grid spacing makes our selection of the 3 km depth maps (Figs. 3e and i; 4e and i; and 5a, e, and i) representative of the average uppermost crustal structure of the model in the region, which can be verified in the cross-sectional profiles of Fig. 5. The overall distribution of upper-crustal velocities generally reflects the near-surface geology, which serves as a primary constraint for assessing the quality of the models. Our results show that lower Vp and Vs are collocated with the sedimentary basins of the southern Tanganyika and Rukwa rifts. Relatively lower velocities continue along a narrow ESE-trending zone from the Tanganyika rift to the northern end of the Rukwa rift, following the Nkamba and Karema faults. The Ufipa horst, separating the Tanganyika and Rukwa rifts, also shows localized zones of lower Vp, collocated with areas of prominent surface faulting (Fig. 3a). However, unlike the Vp distribution, the Ufipa horst is better defined in the Vs model, demonstrated by the relatively higher values and structural continuity (Fig. 3e and h). Within the eastern section of the Mweru-Wantipa rift and further east towards the southern Tanganyika rift, we observe moderate Vp anomalies collocated with moderate to low Vs anomalies (Fig. 3a–b and e–f). Overall, the rift flanks and zones of widespread exposure of the pre-rift basement exhibit relatively higher Vp and Vs.
The ratio map (Fig. 3i) and cross sections (Fig. 3j–l) show zones of anomalously high values that are restricted to upper-crustal depths, the most prominent of which are A1 (an anomaly at the northwestern end of the Rukwa rift, an area dominated by basement exposures and distributed faulting), A2 (a broad anomaly extending across the eastern end of the Mweru-Wantipa rift through the transfer zone into the Tanganyika rift), and A3 (an anomaly in the southeastern interior of the Rukwa rift, collocated with the Ufipa fault and the intra-basement Chisi shear zone) (Fig. 1b). These highest ratio anomalies commonly continue downward to 10 km or deeper (Fig. 3k and l), but our investigation focuses on the upper crust.
4.2 Spatiotemporal clustering of rift tip seismicity
Our cluster analysis yielded 115 clusters, but we only retained clusters with a minimum of 5 events, resulting in a filtered number of 18 clusters. The distribution of these clusters is depicted using colored circles in map and cross-sectional views in Figs. 4a–d and S24 and represented as functions of latitude, longitude, and depth in Fig. S23b–d. We identify clusters throughout the crust and in the upper mantle, with most of the clusters occurring along the intra-rift faults within the Tanganyika rift. Some clusters are located at the tips of the Mweru-Wantipa and Rukwa rifts and in faults within the Ufipa horst. Since the focus of the current study is on investigating rift tip processes, we only discuss the detected seismicity clusters at the Rukwa rift tip; the three spatially clustered events occurring in the middle-to-lower crust of the Mweru-Wantipa rift tip and the absence of clean waveform records for these events preclude further analysis on these clusters.
There are two main clusters at the Rukwa rift tip (Fig. 4a–d), both occurring in the upper mantle at depths between 40–70 km. The northern cluster comprises six events with local magnitudes between 0.67 and 1.35 that occurred within a period of ∼50 min on 9 July 2014 (Fig. 4e). In contrast, the southern cluster has 12 events with magnitudes between 1.2 and 2.8 that occurred within a period of ∼19 d in June 2015 (Fig. 4f). We note a high degree of waveform similarity among the events recorded at nearby stations (Fig. 4g and h). In general, both clusters exhibit a generally linear trend, with the shallower events occurring later, indicating a generally upward migration (Fig. 4c and d). Although the relative timing of the largest-magnitude event in a cluster is often used as a proxy for defining aftershock sequences, in the southern cluster, the magnitudes of the events are low and primarily similar. Furthermore, the seismicity distribution does not follow Omori's decay law since our declustering analysis would otherwise have detected it (Ajala and Kolawole, 2023).
5.1 Crustal softening in the Rukwa–Tanganyika rift zone
Brittle deformation in the crystalline crust, including fault- and folding-related damage, commonly creates zones of decreased bulk-crustal density, manifested as zones of anomalously low Vs values and high ratios (Allam et al., 2014; Fang et al., 2019). Similarly, regions where brittle damage hosts melts/volatiles and/or upwelling hydrothermal fluids are associated with relatively higher ratio values (e.g., Chatterjee et al., 1985; Nakajima et al., 2001; Hua et al., 2019). In active-rift settings with absent surface volcanism, understanding the spatial distribution of upper-crustal seismic velocities allows for the identification of mechanically weakened zones where tectonic strain may be preferentially localized. Delineating these near-surface structures will help to better understand how the crust accommodates tectonic strain along actively propagating rift basins and predict ground motion amplification during large earthquakes (e.g., Cormier and Spudich, 1984; Ajala and Persaud, 2021).
In the Rukwa–Tanganyika rift zone, two of the three areas of the highest upper-crustal ratios (A1 and A2) occur at rift tips where syn-rift sedimentary cover is at its thinnest, and basement exposures dominate the surface geology (Figs. 1b and 3i). These anomalies occur at or near geothermal anomalies (hot springs and high-heat flow sites in Figs. 1a and 3i) and are collocated with earthquake clusters and distributed normal faults. The anomalous seismicity cluster at the tip indicates active brittle deformation of the crystalline crust in a region that is lacking well-developed rift basins. At the Rukwa rift tip and further northwest, the faulting pattern is generally characterized by distributed fault scarps that extend from the border faults into the rift interaction zone (Fig. 1a). At the Mweru-Wantipa rift tip, the rift faults appear to mainly cluster near the southeastern rift margin. Thus, we interpret the occurrence of high upper-crustal ratio anomalies at the modern rift tips as indicative of a zone of mechanically weakened crystalline crust.
5.2 Mechanical weakening of rift tips: the roles of bending strain and crustal fluids
The development of mechanically weakened crust at active rift tips reflects a critical rift process that is relevant for understanding how continental rifts propagate. This is analogous to microfracture propagation driven by high stress concentrations at the crack tips (e.g., Kranz, 1979; Olson, 2004). Similarly, relatively high stress concentrations between interacting microcrack tips (Kranz, 1979) agree with the interpretation of stress concentrations within rift interaction zones that separate propagating rift tips (Kolawole et al., 2023). The northwestern tip of the Rukwa rift is characterized by geomorphic features and tectonic-deformation patterns that suggest ongoing northwestward propagation towards the central and northern Tanganyika rift (Kolawole et al., 2021a). The earthquake clusters at the Rukwa and Mweru-Wantipa rift tips (Fig. 2a) indicate that tectonic stresses and elastic-strain concentrations focus on the rift tip zones. The brittle-deformation field that is manifested by these earthquakes likely accommodates the bending strain along the rift tip's flexural margin (Fig. 6a). Several studies have demonstrated that crustal bending due to accumulated fault displacement, glacial unloading, thermal subsidence, or sediment-load-induced crustal subsidence can lead to significant strain in the upper crust, leading to brittle failure of the crust (e.g., Goetze and Evans, 1979; Stein et al., 1979; Nunn, 1985). Here, long-term accrual of fault displacement and sediment loading along the central hanging walls of the border faults causes downward basement flexure in the rift basin and proximal sections of the rift tip, with contemporaneous basement upwarping at the distal section of the rift tip (Fig. 6a). The crustal bending at the rift tips induces significant strain in the upper part of the brittle lithosphere, which may explain the prominent occurrence of earthquakes at the rift tips, which are best expressed in the northwestern tip zones of the Rukwa rift (Fig. 2a and d). Since there are no data on the border fault displacements or basement depth variations extending from the rift axis into the areas of exposed basement ahead of the rift tip, we cannot provide a detailed analysis of how the changes in basement flexure impose extensional versus contractional strain on the upper crust. Nevertheless, we suggest that damage clustering at a propagating rift tip is a relevant fundamental process that may facilitate mechanical weakening at the tips of active continental rifts.
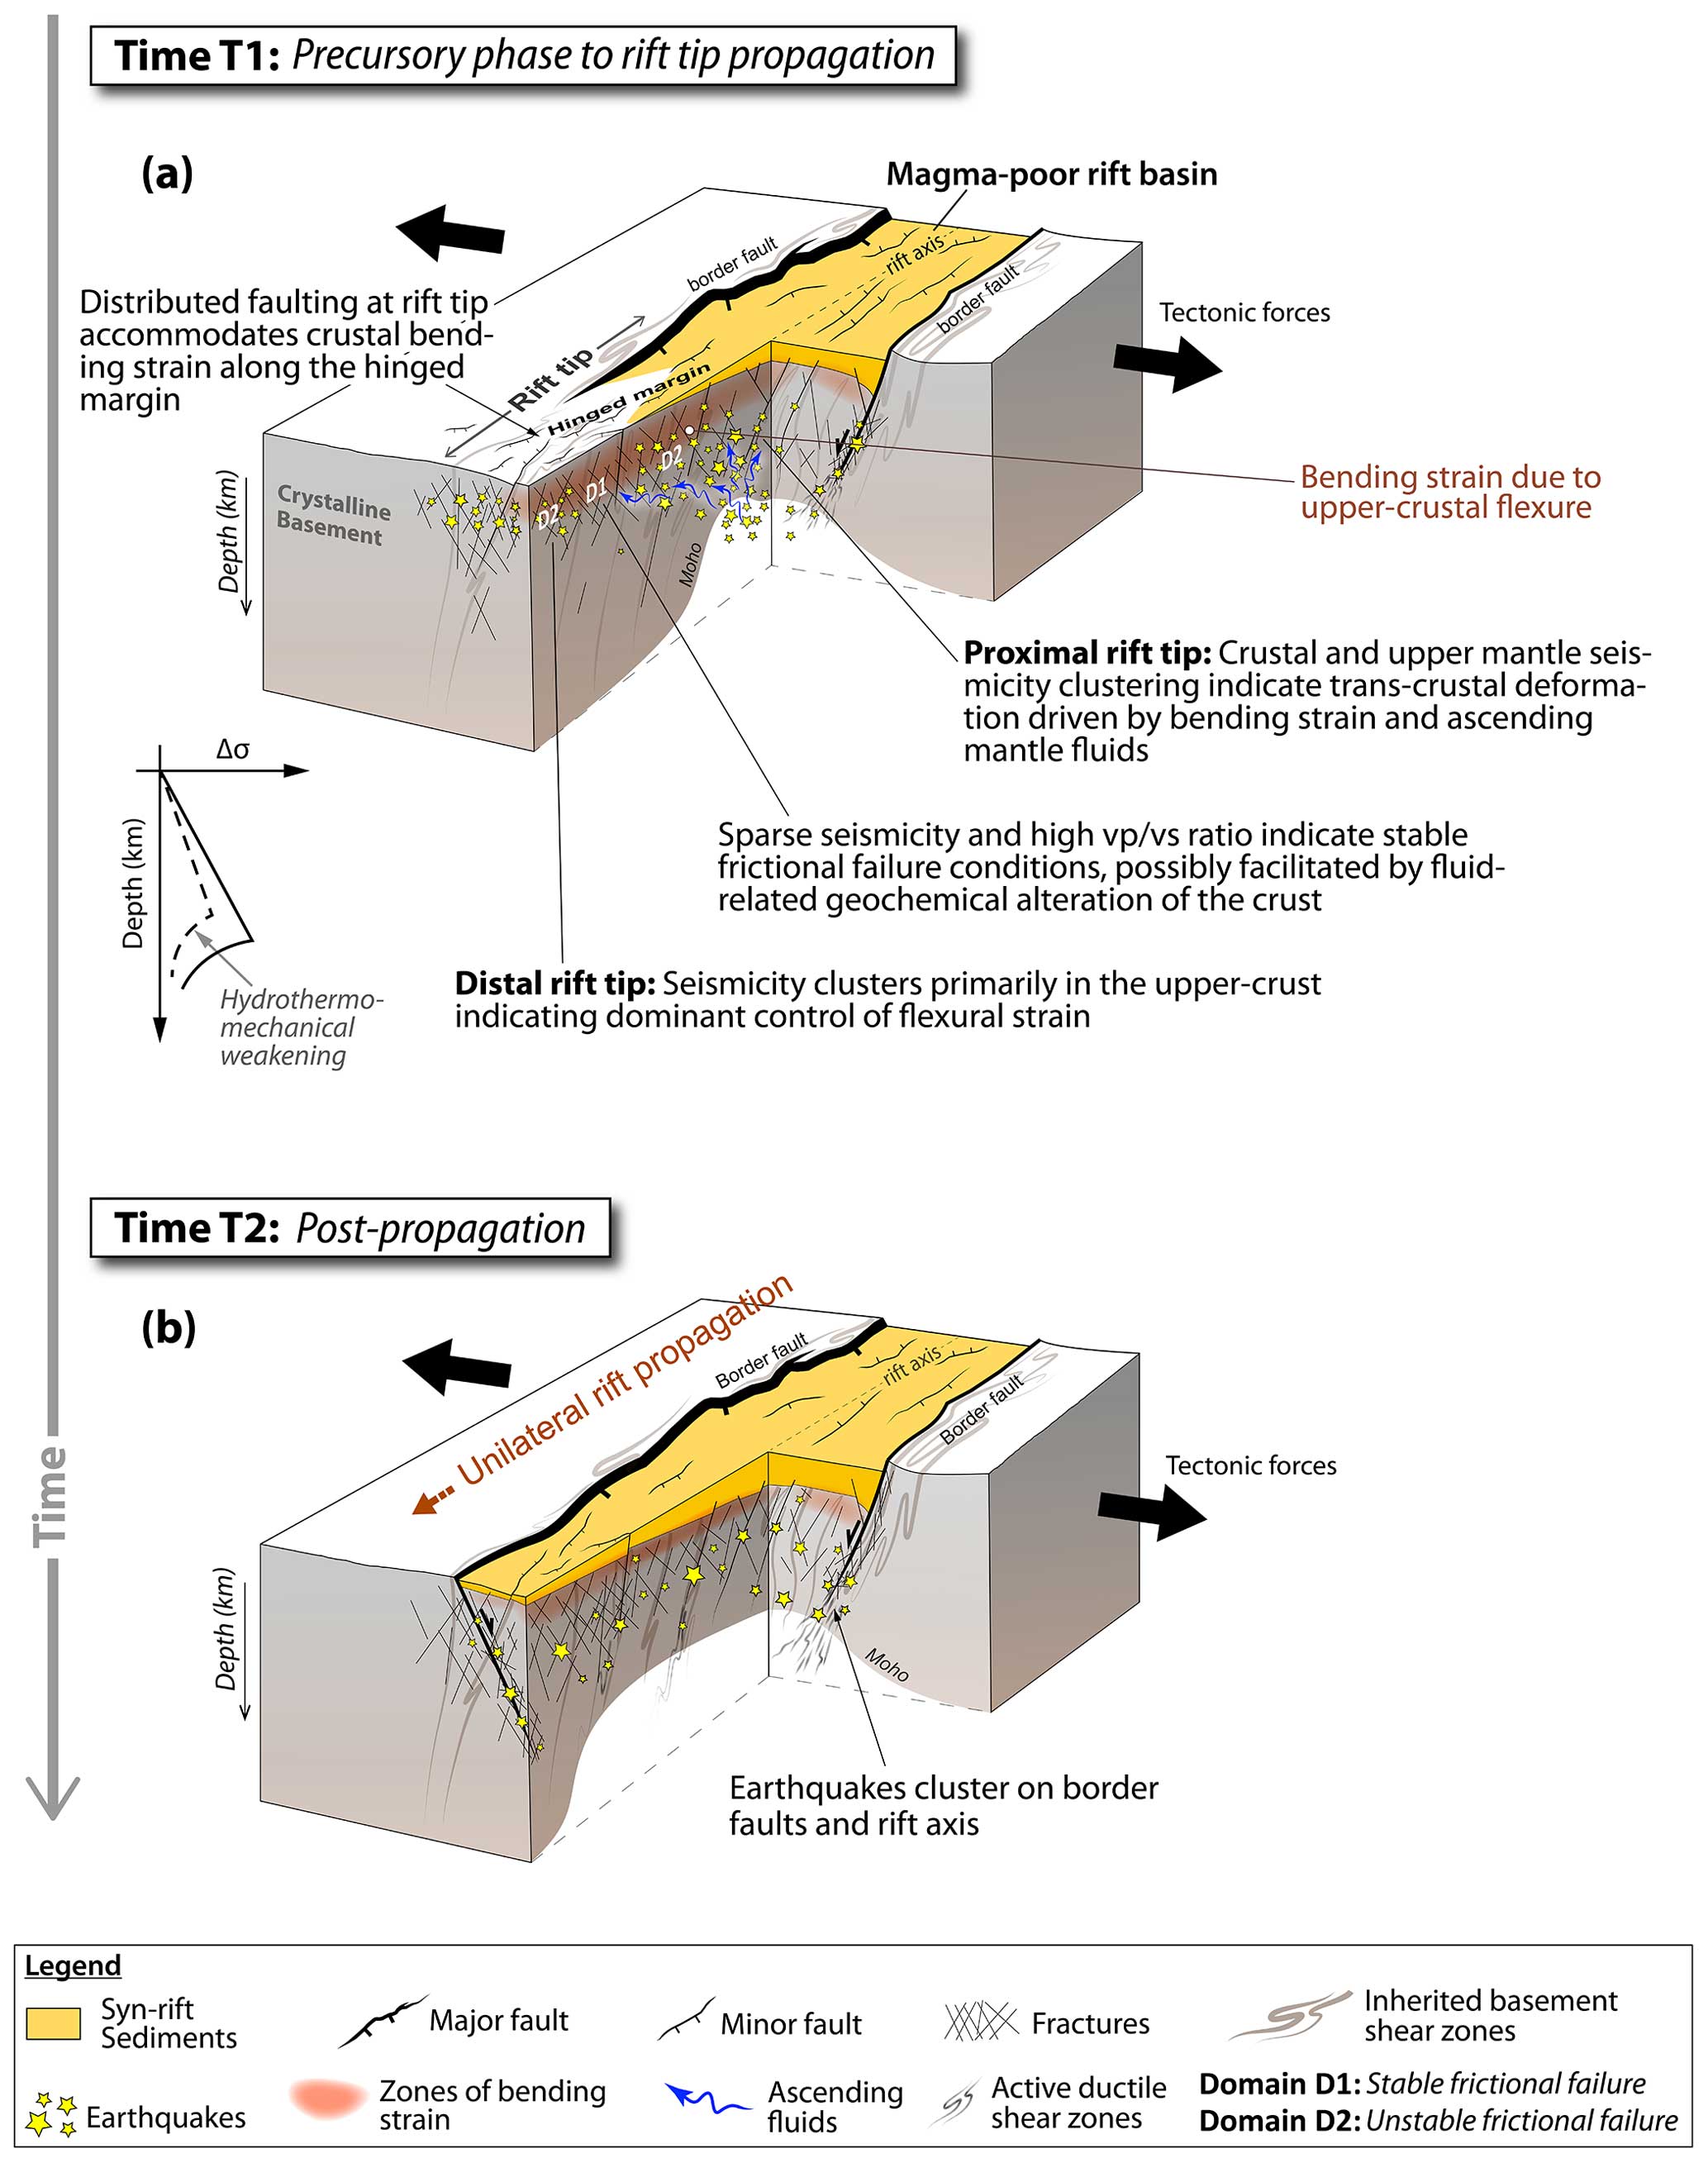
Figure 6Cartoons showing the proposed model of crustal-strain accommodation during the phases of unilateral propagation with respect to active continental rift tips, based on the results of our study. (a) The precursory phase of rift tip propagation, and (b) the post-propagation phase. Note that the diffuse earthquake pattern in panel (b) is idealized to speculate on the likelihood of decreased seismicity at the location of a “paleo-rift tip” after the rift propagation phase has ended and does not include earthquakes occurring due to other tectonic processes within the rift axis. D1 and D2 are frictional stability domains, where D1 represents a stable frictional-failure domain and D2 represents an unstable frictional-failure domain.
In addition to bending-strain-related earthquakes in the crust, the temporal and upward linear trends of low-magnitude seismicity migration in the upper mantle beneath the proximal part of the Rukwa rift tip (Fig. 4b–f) suggest fluid-related earthquake triggering by ascending mantle volatiles. We interpret that the northern cluster likely represents fluid-induced microseismic creep caused by a fast migration velocity (>1 km h−1) (Fig. 4e), while the southern cluster likely indicates fluid flow caused by a much slower linear migration velocity (Fig. 4f) (e.g., Zhang and Shearer, 2016). These results are further corroborated by the high waveform similarity of the events recorded at nearby stations (Fig. 4g and h; Raggiunti et al., 2023). In the Tanganyika rift, the detected spatiotemporally clustered events extend up from the Moho to the upper crust (Fig. S24), and the events are primarily located in the crust beneath the Mweru-Wantipa rift tip (Fig. S24e). Although they are primarily hosted in the crust, we interpret that the detected clustering events in the Tanganyika rift axis and Mweru-Wantipa rift tip are likely also triggered by fluids and that the fluids are potentially related to both mantle and hydrothermal sources. Thus, our cluster analysis results are consistent with previous studies that suggest the presence of partial melt in the crust beneath Tanganyika rift zone (Hodgson et al., 2017; Lavaysseier et al., 2019; Ajala et al., 2024).
The spatial relationship between significant earthquake clustering and the velocity distribution in the upper crust may provide insight into how bulk-rock alterations potentially influence seismicity and strain accommodation at the rift tips. The occurrence of geothermal anomalies in the vicinity of the high ratio anomalies suggests that ascending fluids may advect heat into the upper crust. At both the Rukwa and Mweru-Wantipa rift tips, we observe that the most prominent seismicity clustering occurs near the margins of the high upper-crustal ratio anomalies and not within the anomalies (Fig. 3i, k, and l). We infer that this pattern indicates frictionally stable conditions that promote aseismic failure within the crustal blocks with high ratios and frictionally unstable conditions that promote seismic failure in their surrounding crust. The failure of brittle discontinuities may be aseismic or seismic depending on the confining stress, temperature, and compositional characteristics of the crust and the fault rocks they host (e.g., Blanpied et al., 1991; Carpenter et al., 2011; Kolawole et al., 2019). With the same loading conditions around the rift tips, it is possible that significant fluid–rock alterations of the crust due to the migrating fluids within the areas with the highest ratios resulted in frictionally stable conditions within the zones with the highest ratios (D1 in Fig. 6a); in contrast, surrounding regions that are failing by means of seismogenic deformation (zone D2). Within the central regions of the Rukwa rift, the ratio anomaly A3 is collocated with an area of relatively fewer intra-rift fault occurrences (Fig. 5i); however, it is located in the hanging wall of the Ufipa border fault near a known geothermal anomaly (Jones, 2020). Since A3 is confined to <5 km depth (Fig. 3k), it may also represent a compositionally altered and mechanically weakened section of the border fault and its hanging-wall block, similar to velocity anomalies observed near geothermal fields in active rifts elsewhere (e.g., Hauksson and Unruh, 2007).
Although our results generally indicate active deformation at the propagating rift tips of the Rukwa and Mweru-Wantipa rifts, the relatively greater abundance of data at the Rukwa rift tip allow for a characterization of how the controls on the deformation may vary from the proximal rift tip zones to the distal tip zones. The depth distribution of seismicity and the detected spatiotemporal seismicity clusters, the along-rift variation in crustal thickness, and the relative location of high ratio anomalies suggest that the proximal tip zones (tip zone 1) are dominated by upper-crustal, lower-crustal, and upper-mantle deformation (Fig. 5). However, the crust appears to thicken towards the distal tip zones (tip zones 2 to 3), and the seismicity patterns appear to become shallower, primarily focusing on the upper crust in tip zone 3 (Fig. 5). In general, we infer through-going crustal deformation in the proximal rift tip zones, controlled by crustal thinning and infiltration of volatiles into the crust, with focused (synclinal?) crustal-bending strain. These conditions transition into a dominantly upper-crustal deformation in the distal tip zones, where (anticlinal) bending strain and fluid–rock alterations control the brittle deformation. Published models for rift linkage demonstrate that rift basins can propagate laterally and interact when in proximity (e.g., Allken et al., 2012; Corti, 2012; Molnar et al., 2019; Nelson et al., 1992; Zwaan et al., 2016; Zwaan and Schreurs, 2020; Neuharth et al., 2021; Kolawole et al., 2021a, 2022). Models also show that laterally propagating rift tips may host stress concentration zones (Van Wijk and Blackman, 2005; Le Pourhiet et al., 2018). Our study presents evidence from a natural rift for the first time, revealing the presence of crustal weakening at a laterally propagating continental rift tip. Additionally, it shows how this weakening is likely controlled by a combination of crustal-bending strain and fluids (ascending volatiles and migrating hydrothermal fluids). We propose a model for lateral rift propagation whereby progressive rift tip propagation is marked by the development of localized weakened crust at the rift tip (Time T1 in Fig. 6a), which subsequently leads to a lengthened rift basin (Time T2 in Fig. 6b).
To understand how tectonic strain is accommodated along actively propagating magma-poor continental rifts, we constructed 3D velocity models of the crystalline crust beneath the Rukwa–Tanganyika rift zone, where the Tanganyika rift interacts with the Rukwa and Mweru-Wantipa rifts. The results show anomalously high ratio anomalies at the Rukwa and Mweru-Wantipa rift tips and in their rift interaction zones with the Tanganyika rift. This represents, for the first time, geophysical evidence demonstrating crustal softening of rift tips in a region of active unilateral rift propagation. We detect distinct earthquake families within the deeper seismicity clusters in the rift tips that exhibit upward linear migration patterns and temporal evolution patterns that indicate fluid migration and associated creep failure. We determine that brittle damage due to bending strain and thermomechanical alteration of the crust via ascending fluids (mantle-sourced volatiles and hydrothermal fluids) accommodates the mechanical weakening at the rift tip, facilitating the propagation of the rift tip into unrifted crust within the rift interaction zones. Furthermore, we observe a transition from collocated thinned crust and through-going crustal and upper-mantle seismicity in the proximal tip zones to dominantly upper-crustal seismicity in the distal tip zones, indicating an along-axis variation in the controls on rift tip deformation. The results of this study provide new and compelling insights into how continental rift tips propagate, link, and coalesce to form continuous axial-rift floors – a necessary ingredient for initiating large-scale continental-breakup axes.
Computer programs and files for reproducing our results are available in Zenodo at https://doi.org/10.5281/zenodo.8302196 (Ajala and Kolawole, 2023).
The supplement related to this article is available online at: https://doi.org/10.5194/se-15-747-2024-supplement.
FK and RA conceptualized the project. RA performed the modeling. FK and RA interpreted the results. FK wrote the paper. RA revised the paper.
The contact author has declared that neither of the authors has any competing interests.
Publisher's note: Copernicus Publications remains neutral with regard to jurisdictional claims made in the text, published maps, institutional affiliations, or any other geographical representation in this paper. While Copernicus Publications makes every effort to include appropriate place names, the final responsibility lies with the authors.
This article is part of the special issue “(D)rifting into the future: the relevance of rifts and divergent margins in the 21st century”. It is not associated with a conference.
Some figures were plotted using GMT (Wessel et al., 2019).
This research has been supported by grants from the Columbia Climate School and the G. Unger Vetlesen Foundation, awarded to Folarin Kolawole.
This paper was edited by Frank Zwaan and reviewed by Aude Lavayssière and one anonymous referee.
Aanyu, K. and Koehn, D.: Influence of pre-existing fabrics on fault kinematics and rift geometry of interacting segments: analogue models based on the Albertine Rift (Uganda), Western Branch-East African Rift System, J. Afr. Earth Sci., 59, 168–184, 2011.
Acocella, V., Faccenna, C., Funiciello, R., and Rossetti, F.: Sand-box modelling of basement-controlled transfer zones in extensional domains, Terra Nova, 11, 149–156, 1999.
Ajala, R. and Kolawole, F.: Propagating rifts: the roles of crustal damage and ascending mantle fluids, Zenodo [data set], https://doi.org/10.5281/zenodo.8302196, 2023.
Ajala, R. and Persaud, P.: Effect of Merging Multiscale Models on Seismic Wavefield Predictions Near the Southern San Andreas Fault, J. Geophys. Res.-Solid, 126, 1–23, 2021.
Ajala, R., Kolawole, F., and Menke, W.: Blind magmatism abets nonvolcanic continental rifting, Commun. Earth Environ., 5, 80, https://doi.org/10.1038/s43247-024-01244-7, 2024.
Allam, A. A., Ben-Zion, Y., Kurzon, I., and Vernon, F.: Seismic velocity structure in the Hot Springs and Trifurcation areas of the San Jacinto fault zone, California, from double-difference tomography, Geophys. J. Int., 198, 978–999, 2014.
Allken, V., Huismans, R. S., and Thieulot, C.: Factors controlling the mode of rift interaction in brittle-ductile coupled systems: A 3D numerical study, Geochem. Geophy., Geosy., 13, 1–18, https://doi.org/10.1029/2012GC004077, 2012.
Blanpied, M. L., Lockner, D. A., and Byerlee, J. D.: Fault stability inferred from granite sliding experiments at hydrothermal conditions, Geophys. Res. Lett., 18, 609–612, 1991.
Bosworth, W.: Geometry of propagating continental rifts, Nature, 316, 625–627, https://doi.org/10.1038/316625a0, 1985.
Boven, A., Theunissen, K., Sklyarov, E., Klerkx, J., Melnikov, A., Mruma, A., and Punzalan, L.: Timing of Exhumation of a High-Pressure Mafic Granulite Terrane of the Paleoproterozoic Ubende belt (West Tanzania), Precambrian Res., 93, 119–137, https://doi.org/10.1016/s0301-9268(98)00101-6, 1999.
Brune, S., Kolawole, F., Olive, J. A., Stamps, D. S., Buck, W. R., Buiter, S. J., Furman, T., and Shillington, D. J.: Geodynamics of continental rift initiation and evolution, Nat. Rev. Earth Environ., 4, 235–253, 2023.
Carpenter, B. M., Marone, C., and Saffer, D. M.: Weakness of the San Andreas Fault revealed by samples from the active fault zone, Nat. Geosci., 4, 251–254, 2011.
Celli, N. L., Lebedev, S., Schaeffer, A. J., and Gaina, C.: African cratonic lithosphere carved by mantle plumes, Nat. Commun., 11, 1–10, 2020.
Chatterjee, S. N., Pitt, A. M., and Iyer, H. M.: ratios in the Yellowstone national park region, Wyoming, J. Volcanol. Geoth. Res., 26, 213–230, 1985.
Chorowicz, J.: The East African Rift System, J. Afr. Earth Sci., 43, 379–410, https://doi.org/10.1016/j.jafrearsci.2005.07.019, 2005.
Cormier, V. F. and Spudich, P.: Amplification of ground motion and waveform complexity in fault zones: examples from the San Andreas and Calaveras Faults, Geophys, J. Roy. Astron. Soc., 79, 135–152, 1984.
Corti, G.: Centrifuge modelling of the influence of crustal fabrics on the development of transfer zones: insights into the mechanics of continental rifting architecture, Tectonophysics, 384, 191–208, 2004.
Corti, G.: Evolution and characteristics of continental rifting: Analog modeling-inspired view and comparison with examples from the East African Rift System, Tectonophysics, 522, 1–33, https://doi.org/10.1016/j.tecto.2011.06.010, 2012.
Craig, T. J., Jackson, J. A., Priestley, K., and McKenzie, D.: Earthquake distribution patterns in Africa: Their relationship to variations in lithospheric and geological structure, and their rheological implications, Geophys. J. Int., 185, 403–434, 2011.
Daly, M. C.: Crustal Shear Zones in Central Africa: a Kinematic Approach to Proterozoic Tectonics, Episodes, 11, 5–11, 1988.
Daly, M. C., Green, P., Watts, A. B., Davies, O., Chibesakunda, F., and Walker, R.: Tectonics and Landscape of the Central African Plateau, and their implications for a propagating Southwestern Rift in Africa, Geochem. Geophy. Geosy., 21, e2019GC008746, https://doi.org/10.1029/2019GC008746, 2020.
Delvaux, D.: The Karoo to recent rifting in the western branch of the East-African Rift System: a bibliographical synthesis, in: Mus. Roy. Afr. Centr., Tervuren (Belg.), Dept. Geol. Min., Ra Ann, 1990, 1991, 63–83, https://www.africamuseum.be/publication_docs/1991_Delvaux_Karoo to Recent rifting.pdf (last access: 1 July 2024), 1989.
Delvaux, D.: Karoo Rifting in Western Tanzania: Precursor of Gondwana Breakup. Contributions to Geology and Paleontology of Gondwana in Honor of Helmut Wopfner, Geological Institute, University of Cologne, Cologne, 111–125, https://www.africamuseum.be/publication_docs/2001_Delvaux_Karoo rifting in western Tanzania.pdf (last access: 3 July 2024), 2001.
Delvaux, D. and Barth, A.: African stress pattern from formal inversion of focal mechanism data, Tectonophysics, 482, 105–128, 2010.
Delvaux, D., Kervyn, F., Macheyeki, A. S., and Temu, E. B.: Geodynamic Significance of the TRM Segment in the East African Rift (W-Tanzania): Active Tectonics and Paleostress in the Ufipa Plateau and Rukwa basin, J. Struct. Geol., 37, 161–180, 2012.
Ebinger, C. J., Deino, A. L., Drake, R. E., and Tesha, A. L.: Chronology of volcanism and rift basin propagation: Rungwe volcanic province, East Africa, J. Geophys. Res.-Solid, 94, 15785–15803, https://doi.org/10.1029/JB094iB11p15785, 1989.
Ebinger, C. J., Jackson, J. A., Foster, A. N., and Hayward, N. J.: Extensional basin geometry and the elastic lithosphere, Philos. T. Roy. Soc. Lond. A, 357, 741–765, https://doi.org/10.1098/rsta.1999.0351, 1999.
Fang, H., Yao, H., Zhang, H., Thurber, C., Ben-Zion, Y., and van der Hilst, R. D.: tomography in the southern California plate boundary region using body and surface wave traveltime data, Geophys. J. Int., 216, 609–620, 2019.
Fernandez-Alonso, M., Delvaux, D., Klerkx, J., and Theunissen, K.: Structural link between Tanganyika-and Rukwa-rift basins at Karema-Nkamba (Tanzania): Basement structural control and recent evolution, Annual Report, Royal Museum for Central Africa, Department of Geology and Mineralogy, Tervuren, Belgium, 91–100, https://www.africamuseum.be/publication_docs/2001_Fernandez et al_ Structural link Tanganyika-Rukwa .pdf (last access: 3 July 2024), 2001.
Foster, A. N. and Jackson, J. A.: Source parameters of large African earthquakes: Implications for crustal rheology and regional kinematics, Geophys. J. Int., 134, 422–448, 1998.
Gaherty, J. B., Zheng, W., Shillington, D. J., Pritchard, M. E., Henderson, S. T., Chindandali, P. R. N., Mdala, H., Shuler, A., Lindsey, N., Oliva, S. J., and Nooner, S.: Faulting processes during early-stage rifting: Seismic and geodetic analysis of the 2009–2010 Northern Malawi earthquake sequence, Geophys. J. Int., 217, 1767–1782, 2019.
Ganbat, A., Tsujimori, T., Boniface, N., Pastor-Galán, D., Aoki, S., and Aoki, K.: Crustal evolution of the Paleoproterozoic Ubendian Belt (SW Tanzania) western margin: a Central African Shield amalgamation tale, Gondwana Res., 91, 286–306, 2021.
Goebel, T. H. W., Rosson, Z., Brodsky, E. E., and Walter, J. I.: Aftershock deficiency of induced earthquake sequences during rapid mitigation efforts in Oklahoma, Earth Planet. Sc. Lett., 522, 135–143, 2019.
Goetze, C. and Evans, B.: Stress and temperature in the bending lithosphere as constrained by experimental rock mechanics, Geophys. J. Int., 59, 463–478, 1979.
Hanson, R. E.: Proterozoic geochronology and tectonic evolution of southern Africa, Geol. Soc. Lond. Spec. Publ., 206, 427–463, 2003.
Hauksson, E. and Unruh, J.: Regional tectonics of the Coso geothermal area along the intracontinental plate boundary in central eastern California: three-dimensional Vp and models, spatio-temporal seismicity patterns, and seismogenic deformation, J. Geophys. Res., 112, 1–24, 2007.
Heilman, E., Kolawole, F., Atekwana, E. A., and Mayle, M.: Controls of Basement Fabric on the Linkage of Rift Segments, Tectonics, 38, 1337–1366, 2019.
Hodgson, I., Illsley-Kemp, F., Gallacher, R., Keir, D., Ebinger, C. J., and Mtelela, K.: Crustal Structure at a Young Continental Rift: A Receiver Function Study from the Tanganyika Rift, Tectonics, 36, 1–17, 2017.
Hole, J. A.: Nonlinear high-resolution three-dimensional seismic travel time tomography, J. Geophys. Res.-Solid, 97, 6553–6562, 1992.
Hua, Y., Zhang, S., Li, M., Wu, T., Zou, C., and Liu, L.: Magma system beneath Tengchong volcanic zone inferred from local earthquake seismic tomography, J. Volcanol. Geoth. Rese., 377, 1–16, https://doi.org/10.1016/j.jvolgeores.2019.04.002, 2019.
Jones, D. J. R.: A summary of the East Africa Rift Temperature and Heat flow Model (EARTH), Brit. Geol. Surv. Open Rep. OR/20/006, Brit. Geol. Surv., 1–24, https://www2.bgs.ac.uk/nationalgeosciencedatacentre/citedData/catalogue/e1bc2841-81c2-4b6e-ae5b-301f3bf82b68.html (last access: 1 July 2024), 2020.
Klerkx, J., Theunissen, K., and Delvaux, D.: Persistent Fault Controlled basin Formation since the Proterozoic along the Western Branch of the East African Rift, J. Afr. Earth Sci., 26, 347–361, https://doi.org/10.1016/s0899-5362(98)00020-7, 1998.
Kolawole, F., Atekwana, E. A., Laó-Dávila, D. A., Abdelsalam, M. G., Chindandali, P. R., Salima, J., and Kalindekafe, L.: High-resolution electrical resistivity and aeromagnetic imaging reveal the causative fault of the 2009 Mw 6.0 Karonga, Malawi earthquake, Geophys. J. Int., 213, 1412–1425, https://doi.org/10.1093/gji/ggy066, 2018a.
Kolawole, F., Atekwana, E. A., Laó-Dávila, D. A., Abdelsalam, M. G., Chindandali, P. R., Salima, J., and Kalindekafe, L.: Active Deformation of Malawi Rift's north basin Hinge Zone Modulated by Reactivation of Preexisting Precambrian Shear Zone Fabric, Tectonics, 37, 683–704, https://doi.org/10.1002/2017tc004628, 2018b.
Kolawole, F., Johnston, C. S., Morgan, C. B., Chang, J. C., Marfurt, K. J., Lockner, D. A., Reches, Z., and Carpenter, B. M.: The susceptibility of Oklahoma's basement to seismic reactivation, Nat. Geosci., 12, 839–844, 2019.
Kolawole, F., Firkins, M. C., Al Wahaibi, T. S., Atekwana, E. A., and Soreghan, M. J.: Rift interaction zones and the stages of rift linkage in active segmented continental rift systems, Basin Res., 33, 2984–3020, 2021a.
Kolawole, F., Phillips, T. B., Atekwana, E. A., and Jackson, C. A. L.: Structural inheritance controls strain distribution during early continental rifting, rukwa rift, Front. Earth Sci., 9, 707869, https://doi.org/10.3389/feart.2021.707869, 2021b.
Kolawole, F., Vick, T., Atekwana, E. A., Laó-Dávila, D. A., Costa, A. G., and Carpenter, B. M. Strain Localization and Migration During the Pulsed Lateral Propagation of the Shire Rift Zone, East Africa, Tectonophysics, 839, 229499, https://doi.org/10.1016/j.tecto.2022.229499, 2022.
Kolawole, F., Xue, L., and Dulanya, Z.: Rapid Versus Delayed Linkage and Coalescence of Propagating Rift Tips, Authorea [preprint], https://doi.org/10.22541/essoar.168167202.29986035/v1, 2023.
Kranz, R. L.: Crack-crack and crack-pore interactions in stressed granite, Int. J. Rock Mech. Min. Sci. Geomech. Abs., 16, 37–47, 1979.
Lavayssière, A., Drooff, C., Ebinger, C. J., Gallacher, R., Illsley-Kemp, F., Oliva, S. J., and Keir, D.: Depth Extent and Kinematics of Faulting in the Southern Tanganyika Rift, Africa, Tectonics, 38, 842–862, 2019.
Lemna, O. S., Stephenson, R., and Cornwell, D. G.: The Role of Pre-existing Precambrian Structures in the Development of Rukwa Rift Basin, Southwest Tanzania, J. Afr. Earth Sci., 150, 607–625, 2019.
Lenoir, J. L., Liégeois, J.-P., Theunissen, K., and Klerkx, J.: The Palaeoproterozoic Ubendian Shear belt in Tanzania: Geochronology and Structure, J. Afr. Earth Sci., 19,, 169–184, https://doi.org/10.1016/0899-5362(94)90059-0, 1994.
Le Pourhiet, L., Chamot-Rooke, N., Delescluse, M., May, D. A., Watremez, L., and Pubellier, M.: Continental break-up of the South China Sea stalled by far-field compression, Nat. Geosci., 11, 605–609, 2018.
Molnar, N. E., Cruden, A. R., and Betts, P. G.: Interactions between propagating rifts and linear weaknesses in the lower crust, Geosphere, 15, 1617–1640, 2019.
Morley, C. K., Cunningham, S. M., Harper, R. M., and Wescott, W. A.: Geology and Geophysics of the Rukwa Rift, East Africa, Tectonics, 11, 69–81, 1992.
Morley, C. K., Wescott, W. A., Harper, R. M., and Cunningham, S. M.: Geology and Geophysics of the Rukwa Rift. Geoscience of Rift Systems-Evolution of East Africa, AAPG Stud. Geol., 44, 91–110, 1999.
Muirhead, J. D., Wright, L. J., and Scholz, C. A.: Rift evolution in regions of low magma input in East Africa, Earth Planet. Sc. Lett., 506, 332–346, 2019.
Mulaya, E., Gluyas, J., McCaffrey, K., Phillips, T., and Ballentine, C.: Structural geometry and evolution of the Rukwa Rift Basin, Tanzania: Implications for helium potential, Basin Res., 34, 938–960, 2022.
Nakajima, J., Matsuzawa, T., Hasegawa, A., and Zhao, D.: Three-dimensional structure of Vp, Vs, and beneath northeastern Japan: Implications for arc magmatism and fluids, J. Geophys. Res.-Solid, 106, 21843–21857, 2001.
Nelson, R. A., Patton, T. L., and Morley, C. K.: Rift-segment interaction and its relation to hydrocarbon exploration in continental rift systems, AAPG Bull., 76, 1153–1169, 1992.
Neuharth, D., Brune, S., Glerum, A., Heine, C., and Welford, J. K.: Formation of continental microplates through rift linkage: Numerical modeling and its application to the Flemish Cap and Sao Paulo Plateau, Geochem. Geophy. Geosy., 22, e2020GC009615, https://doi.org/10.1029/2020GC009615, 2021.
Njinju, E. A., Atekwana, E. A., Stamps, D. S., Abdelsalam, M. G., Atekwana, E. A., Mickus, K. L., Fishwick, S., Kolawole, F., Rajaonarison, T. A., and Nyalugwe, V. N.: Lithospheric structure of the Malawi Rift: Implications for magma-poor rifting processes, Tectonics, 38, 3835–3853, 2019.
Nunn, J. A.: State of stress in the northern Gulf Coast, Geology, 13, 429–432, 1985.
Olson, J. E.: Predicting fracture swarms – The influence of subcritical crack growth and the crack-tip process zone on joint spacing in rock, Geol. Soc. Lond. Spec. Publ., 231, 73–88, 2004.
Pérez-Gussinyé, M., Collier, J. S., Armitage, J. J., Hopper, J. R., Sun, Z., and Ranero, C. R.: Towards a process-based understanding of rifted continental margins, Nat Rev. Earth Environ., 4, 166–184, 2023.
Raggiunti, M., Keir, D., Pagli, C., and Lavayssière, A.: Evidence of Fluid Induced Earthquake Swarms From High Resolution Earthquake Relocation in the Main Ethiopian Rift, Geochem. Geophy. Geosy., 24, 1–16, 2023.
Reasenberg, P.: Second-Order Moment of Central California Seismicity, 1969–1982, J. Geophys. Res., 90, 5479–5495, 1985.
Roberts, E. M., Stevens, N. J., O'Connor, P. M., Dirks, P. H. G. M., Gottfried, M. D., Clyde, W. C., Armstrong, R. A., Kemp, A. I. S., and Hemming, S.: Initiation of the western branch of the East African Rift coeval with the eastern branch, Nat. Geosci., 5, 289–294, 2012.
Roland, M. and McGuire, J. J.: Earthquake swarms on transform faults, Geophys. J. Int., 178, 1677–1690, 2009.
Saeidi, H., Hansen, S. E., Nyblade, A. A., and Haag, R.: Mantle structure beneath the Damara Belt in south-central Africa imaged using adaptively parameterized P-wave tomography, J. Geophys. Res.-Solid, 129, e2023JB027965, https://doi.org/10.1029/2023JB027965, 2024.
Shaban, S., Kolawole, F., and Scholz, C. A.: The Deep Basin and Underlying Basement Structure of the Tanganyika Rift, Tectonics, 42, e2022TC007726, https://doi.org/10.1029/2022TC007726, 2023.
Stamps, D. S., Calais, E., Saria, E., Hartnady, C., Nocquet, J. M., Ebinger, C. J., and Fernandes, R. M.: A kinematic model for the East African Rift, Geophy. Res. Lett., 35, L05304, https://doi.org/10.1029/2007GL032781, 2008.
Stein, S., Sleep, N. H., Geller, R. J., Wang, S. C., and Kroeger, G. C.: Earthquakes along the passive margin of eastern Canada, Geophy. Res. Lett., 6, 537–540, 1979.
Stevens, V. L., Sloan, R. A., Chindandali, P. R., Wedmore, L. N., Salomon, G. W., and Muir, R. A.: The entire crust can be seismogenic: evidence from Southern Malawi, Tectonics, 40, 1–17, https://doi.org/10.1029/2020TC006654, 2021.
Theunissen, K., Klerkx, J., Melnikov, A., and Mruma, A.: Mechanisms of Inheritance of Rift Faulting in the Western branch of the East African Rift, Tanzania, Tectonics, 15, 776–790, https://doi.org/10.1029/95tc03685, 1996.
Tiercelin, J. J., Pflumio, C., Castrec, M., Boulégue, J., Gente, P., Rolet, J., Coussement, C., Stetter, K. O., Huber, R., Buku, S., and Mifundu, W.: Hydrothermal vents in Lake Tanganyika, East African, Rift system, Geology, 21, 499–502, 1993.
van Herwaarden, D. P., Thrastarson, S., Hapla, V., Afanasiev, M., Trampert, J., and Fichtner, A.: Full‐waveform tomography of the African Plate using dynamic mini‐batches, J. Geophys. Res.-Solid, 128, e2022JB026023, https://doi.org/10.1029/2022JB026023, 2023.
Van Wijk, J. K. and Blackman, D. K.: Dynamics of continental rift propagation: the endmember modes, Earth Planet. Sc. Lett., 229, 247–258, 2005.
Veatch, A. C.: Evolution of the Congo Basin, GSA Memoir, 3, 1–177, https://doi.org/10.1130/MEM3, 1935.
Versfelt, J. and Rosendahl, B.: Relationship between pre-rift structure and rift architecture in Lakes Tanganyika and Malawi, East Africa, Nature, 337, 354–357, 1989.
Vidale, J. E.: Finite-difference calculation of traveltimes in three dimensions, Geophysics, 55, 521–526, 1990.
Wessel, P., Luis, J. F., Uieda, L., Scharroo, R., Wobbe, F., Smith, W. H. F., and Tian, D.: The generic mapping tools version 6, Geochem. Geophy. Geosy., 20, 1–20, 2019.
Wheeler, W. H. and Karson, J. A.: Extension and Subsidence Adjacent to a “weak” continental Transform: An Example from the Rukwa Rift, East Africa, Geology, 22, 625–628, https://doi.org/10.1130/0091-7613(1994)022<0625:EASATA>2.3.CO;2, 1994.
Yang, Z. and Chen, W. P.: Earthquakes along the East African Rift System: A multiscale, system-wide perspective, J. Geophys. Res., 115, B12309, https://doi.org/10.1029/2009JB006779, 2010.
Zaliapin, I. and Ben-Zion, Y.: Earthquake clusters in southern California I: Identification and stability, J. Geophys. Res.-Solid, 118, 2847–2864, 2013.
Zaliapin, I., Gabrielov, A., Keilis-Borok, V., and Wong, H.: Clustering Analysis of Seismicity and Aftershock Identification, Phys. Rev. Lett., 101, 1–4, 2008.
Zhang, Q. and Shearer, P.: A new method to identify earthquake swarms applied to seismicity near the San Jacinto Fault, California, Geophys. J. Int., 205, 995–1005, 2016.
Zheng, W., Oliva, S. J., Ebinger, C., and Pritchard, M. E.: Aseismic deformation during the 2014 Mw 5.2 Karonga earthquake, Malawi, from satellite interferometry and earthquake source mechanisms, Geophy. Res. Lett., 47, e2020GL090930, https://doi.org/10.1029/2020GL090930, 2020.
Zwaan, F. and Schreurs, G.: Rift segment interaction in orthogonal and rotational extension experiments: Implications for the large-scale development of rift systems, J. Struct. Geol., 140, 104119, https://doi.org/10.1016/j.jsg.2020.104119, 2020.
Zwaan, F., Schreurs, G., Naliboff, J., and Buiter, S. J.: Insights into the effects of oblique extension on continental rift interaction from 3D analogue and numerical models, Tectonophysics, 693, 239–260, 2016.