the Creative Commons Attribution 4.0 License.
the Creative Commons Attribution 4.0 License.
 | 10 Oct 2025
Seismicity and thermal structure of the St. Paul Transform System, equatorial Atlantic: insights from focal depth analysis
Guilherme W. S. de Melo
Ingo Grevemeyer
Sibiao Liu
Marcia Maia
Lars Rüpke
The slow-spreading Mid-Atlantic Ridge is segmented and offset by transform faults. Among these, the St. Paul Transform System (SPTS), located in the equatorial Mid-Atlantic Ridge, is a complex multi-fault system with four transform faults (Transform A, B, C, and D) and three intra-transform spreading segments with a cumulaTed offset of 630 km. The SPTS is seismically active, with strong strike-slip earthquakes reaching moment magnitudes of 6.9. In this study, we have re-analyzed the focal depth of 35 earthquakes of the Global Centroid Moment Tensor (GCMT) catalog with 5.3 6.9 occurring at Transform A, B, and C since 2004, using regional surface waveform modelling. In addition, we derived a 3-dimensional half-space cooling thermal structure along the transform system that relates the focal depths to the temperature structure. Our results of focal depths indicated that the seismogenic zone of both Transform A, B, and C reaches from 5 to 18 km below the seafloor, with the deepest earthquakes located at the center area of the strike-slip segments, and shallower earthquakes occur towards the ridge-transform intersections. The comparison with the half-space cooling indicates that the deepest earthquakes are located in a cooler lithosphere located near the center of the transform segments, with their deformations reaching 600–900 °C. These observations challenge previous viscoplastic mantle geodynamic models that indicated a warm temperature toward the center of a transform fault. The main features found at the SPTS are supported by previous studies of focal depth in other transform faults in the Atlantic Ocean, supporting a global pattern and the occurrence of a cooler mantle at the center of the oceanic transform faults.
- Article
(8938 KB) - Full-text XML
-
Supplement
(12410 KB) - BibTeX
- EndNote


Transform faults in the equatorial Atlantic Ocean are among the largest and most complex in the world's oceans (e.g., Bonatti, 1990). Among them, the St. Paul Transform System (SPTS) is a prominent multi-fault transform zone composed of four transform faults (Fig. 1) separated by short ridge segments. The SPTS is seismically active, as evidenced by the high frequency of recorded events in seismological catalogs (Francis et al., 1978; Wolfe et al., 1993; de Melo and do Nascimento, 2018; de Melo et al., 2021a; Parnell-Turner et al., 2022) with moment magnitude reaching up 6.9 cataloged by the Global Centroid Moment Tensor (GCMT, Ekström et al., 2012), with strike-slip faulting focal mechanism occurring along the transform fault segments of the SPTS. In addition, some thrust faulting earthquakes were observed in the vicinity of the St. Peter and St. Paul islands in the northernmost transform fault (Wolfe et al., 1993). Unfortunately, GCMT solutions are subject to considerable epicentral uncertainties that can reach ∼ 70 km in distance from the appropriate tectonic features (Pan et al., 2002), limiting their reliability in detailed tectonic analyses.
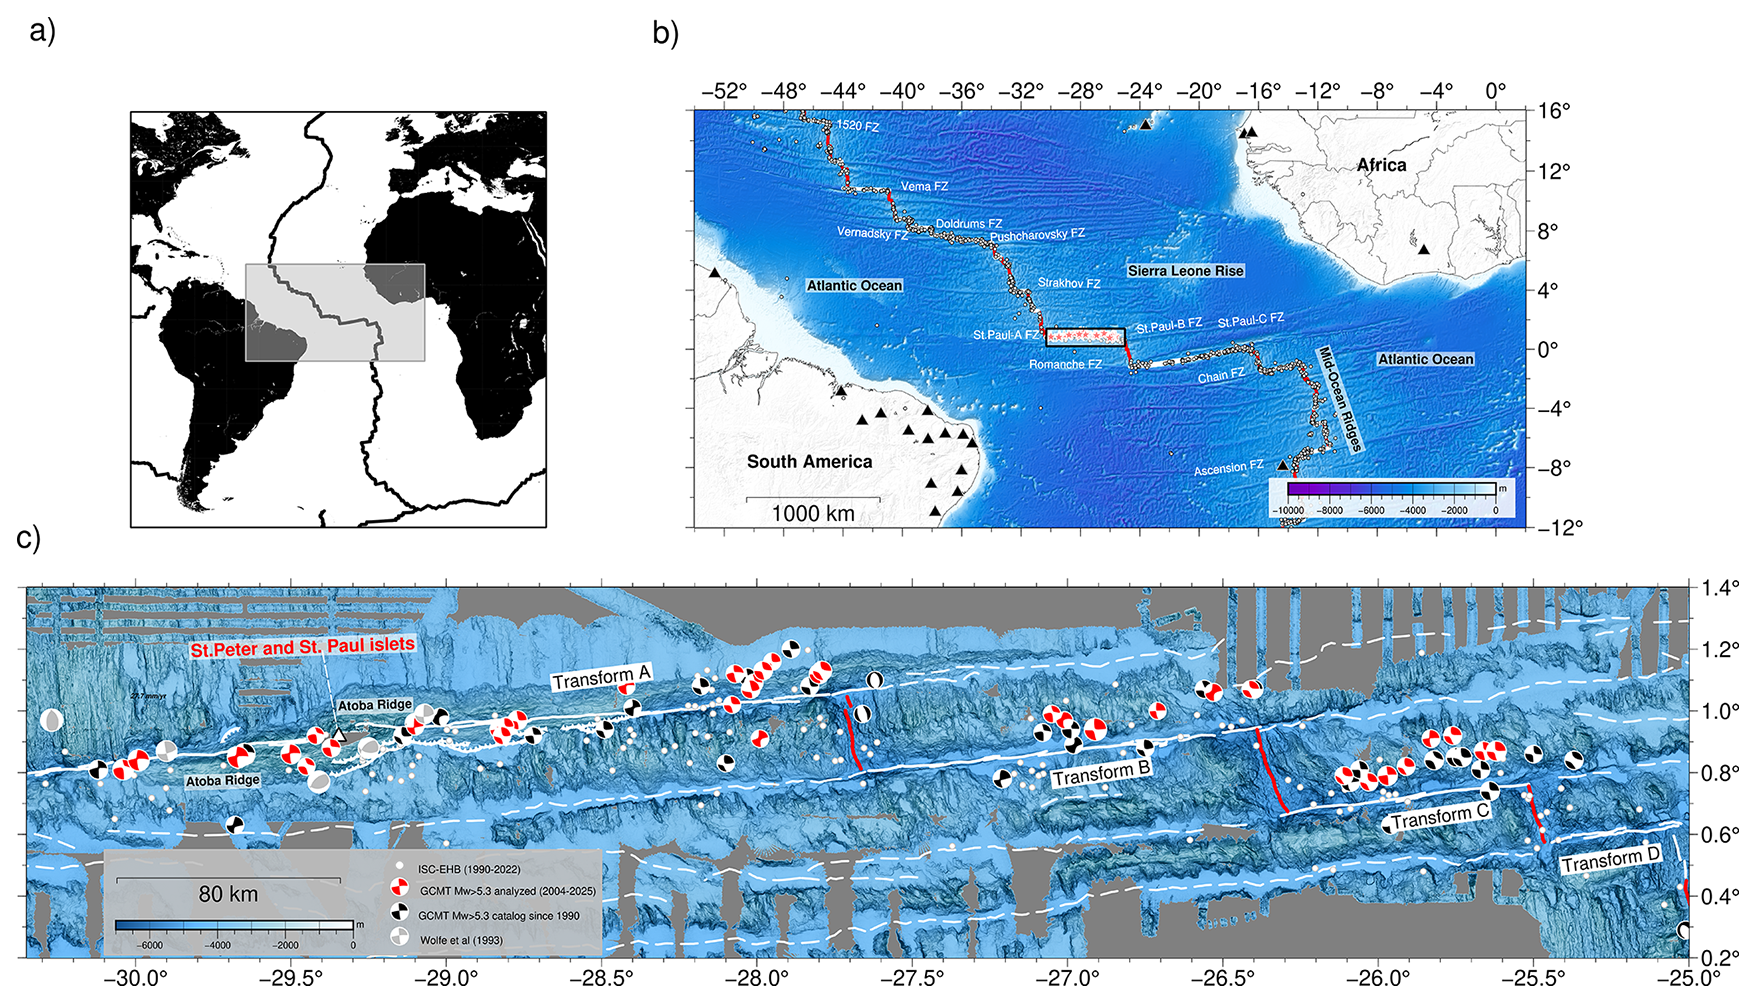
Figure 1(a) Geographical location of the area in study along the equatorial Atlantic Ocean. (b) Regional bathymetric map of the equatorial Atlantic. Oceanic transform faults are presented by red lines, while the mid-ocean ridges are shown in black lines (Sautter et al., 2024). The white box refers to the Saint Paul Transform System (SPTS, Maia et al., 2016), shown in (c). White circles represent the epicentral catalog of the International Seismological Centre between 1990 and 2022 (Weston et al., 2018). Black triangles indicates the seismic stations used in this study (more detail in Data chapter and Fig. S4 in the Supplement). Earthquakes with Mw > 5.3 occurred since 1990 cataloged by the GCMT and analyzed in this study are shown in red stars. (b) Bathymetric map of the St. Paul Transform System. The GCMT events with Mw > 5.3 used in this study are presented by the red beachballs, while the black beach balls refer to the whole GCMT Mw > 5.3 since 1990. Gray beach balls refer to the events analyzed by Wolfe et al. (1993). White lines refer to the transform fault segments along the SPTS, while the red lines refer to the intra-transform ridge axis (Maia et al., 2016). The continuous white dashed lines refer to the fracture zones.
Characterizing the seismicity of oceanic transform faults is critical to understanding the physical properties of the oceanic lithosphere, such as earthquake depths and their distribution along the transform fault segments. Previous seismological studies of focal depth in oceanic transform faults found that the maximum depth of the brittle-ductile transition zone occurs at the center of the transform fault where the cooling is most pronounced, while shallower events are concentrated close to the ridge-transform intersections (e.g. Bergman and Solomon, 1988; Abercrombie and Ekström, 2001). However, it has been suggested that a viscous-plastic rheology approximates the behavior of the oceanic lithosphere best, resulting into warmer temperatures toward the middle of the transform (Behn et al., 2007; Liu et al., 2023). For the Blanco transform fault offsetting the intermediate spreading Juan de Fuca Ridge in the NW Pacific Ocean, Roland et al. (2010) showed the numerical simulation introducing a viscous-plastic rheology are able to yield the spatial distribution of earthquakes. Yet, earthquakes along the Blanco transform did not reveal a profound increase of focal depth near the center of the transform segments (Ren et al., 2023) as found for transform faults in the Atlantic Ocean (Bergman and Solomon, 1988).
In this paper, we report the focal depth of 35 earthquakes of the SPTS cataloged by the GCMT with Mw≥ 5.3, using regional seismic stations at the equatorial Atlantic. We use regional waveform modelling of surface waves to relocate epicenters onto the appropriate surface trace of transform imaged in bathymetric data (Maia et al., 2016). In addition, the procedure yields focal depth, and we observe that deeper earthquakes are located mostly in the middle of the transform segments of the SPTS and centroids occur at temperatures of 600 to 900 °C. Therefore, our results of the focal depth solutions suggest that oceanic transform faults generally present deeper earthquakes toward their central and cooler domains.
2.1 Tectonics of the St. Paul Transform System
The St. Paul Transform System is a complex multi-transform system composed of four transforms named A, B, C, and D, that offset the axis of the Mid-Atlantic Ridge (MAR) by 303, 142, 88, and 53 km, respectively (Schilling et al., 1995; Maia et al., 2016). Within this system, three short intra-transform ridge (ITR) segments of the MAR axis have been identified (Maia et al., 2016). Transform A is slowly slipping at a rate of 27.71 mm yr−1 (DeMets et al., 2010). A prominent topographic feature along transform A is the Atobá Ridge, 200 km long and 30 km wide, that reaches the sea level at Saint Peter and Saint Paul Archipelago (SPSPA; 0°55′ N and 29°38′ W) (Maia et al., 2016). SPSPA is a set of 6 islets and 4 rocks composed of peridotite mylonite and alkaline ultramafic mantle rocks with different serpentinization degrees (Melson et al., 1967, Hekinian et al., 2000; Campos et al., 2022). Samples obtained from the submarine parts of the Atobá Ridge along the COLMEIA (COLd Mantle Exhumation and Intra-transform Accretion) cruise (Maia et al., 2016), either by dredging or by submersible, were also predominately serpentinized mantle rocks (Hekinian et al., 2000; Maia et al., 2016). Maia et al. (2016) constrained the age offset along the transform system (Fig. S1 in the Supplement) and revealed a low-density layer (LDL; Fig. S2 in the Supplement) beneath the SPTS, which is interpreted in terms of a layer of serpentinized mantle (limited at 500 °C) as the nature of the rock sampled at the seafloor suggests that the low density layer may represent serpentinized mantle rather than magmatic crust. Transform A is highly segmented and composed of a diversity of restraining bends and stepovers, which induce local transpression in the Atobá Ridge area resulting in the ridge uplift and consequent exhumation of the mantle rocks (Maia et al., 2016). The present-day uplift rate is estimated to be 1.5 mm yr−1 (Campos et al., 2010). Bickert et al. (2023) showed that the fluid percolation in Transform A causes a grain size reduction and weakens the local fault strength along the eastern part of the Atobá Ridge. To the best of our knowledge, the Atobá Ridge is the largest known example of a push-up ridge in the oceanic lithosphere and the only case studied so far.
Transform B extends between the ∼ 27.6 and 26.4° W longitude range and is formed by a principal transform displacement zone (PTDZ) slowly slipping at 27.77 mm yr−1 (DeMets et al., 2010), with a deep valley reaching more than 5500 m beneath the sea level () close to the western ridge-transform intersection (RTI) with ∼ 4000 in its middle part. Transform C is slipping at 27.83 mm yr−1 (DeMets et al., 2010), extending between the ∼ 26.3 and 25.55° W longitude range, with a deep valley reaching more than 5000 Transform D is the shortest transform, occurring between ∼ 25.5 and 25.05° W, with a transform valley reaching approximately 4500 Long-lived oceanic core complexes exhuming mantle rocks have been mapped along the segment between Transforms C and D, suggesting colder spreading contexts (Vincent et al., 2023).
2.2 Seismotectonics of the St. Paul Transform System
At Transform A, the local micro-seismicity has been recorded by a local station installed at SPSPA islets (de Melo and do Nascimento, 2018), revealing a seismically active setting. Fault plane motions analyzed by the GCMT along the SPTS (Figs. 1b and S3 in the Supplement) indicate that most of the solutions are strike-slip, consistent with the main transform fault orientations. However, at Transform A, some solutions differ from the expected transform fault kinematics, confirming complex fault geometry and segmentation. Previous studies reported compressive mechanisms, uncommon for transform fault areas, near the SPSPA islets in Transform A (e.g. Wolfe et al., 1993). Wolfe et al. (1993) identified focal depths reaching up to 14 km below seafloor () in earthquakes that occurred at Transform A, while Engeln et al. (1986) found in strike-slip solutions with a focal depth of 3–7 at the same transform segment. Francis et al. (1978) reported microseismicity with focal depth reaching up to 11 at Transform D. Wolfe et al. (1993) suggested that additional factors may control the occurrence of compressive earthquakes in Transform A, such as recent changes in plate motion, differential lithospheric cooling, or the development of a weakened fault zone. More recently, Maia et al. (2016) favored a southward propagation of the MAR into the transform domain as a possible mechanism generating the large stepovers and associated thrust faults.
In this work, we use 35 regional earthquakes with moment magnitude (Mw) > 5.3 reported by the GCMT since 2004 over Transforms A, B, and C. No earthquakes with Mw > 5.3 were cataloged in Transform D over the same time. The dataset includes permanent 3-component broad brand seismometers belonging to the Brazilian Seismographic Network (RSBR, Bianchi et al., 2018), the IRIS/IDA (Incorporated Research Institutions for Seismology) network (Scripps Institution of Oceanography, 1986), and GEOSCOPE (https://doi.org/10.18715/GEOSCOPE.G, IPGP and EOST, 1982). These networks were chosen based on the epicentral distance to the earthquakes and the data availability (see map and histograms in Fig. S4 in the Supplement). In addition, we also included data from temporary stations installed by the BLSP2002 project (Feng et al., 2004) in North-Northeast Brazil to analyze earthquakes that happened in 2004–2005.
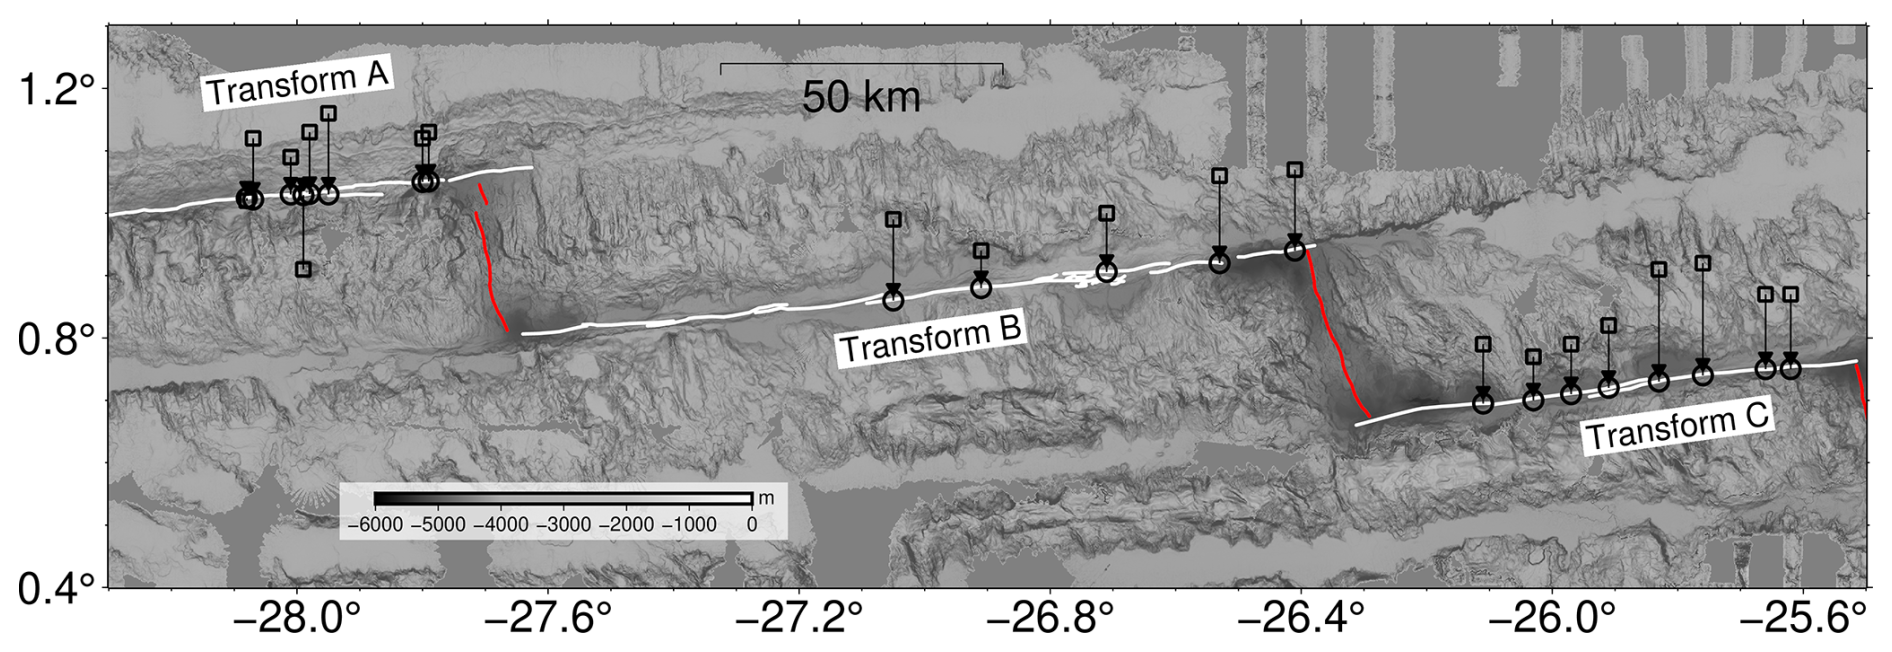
Figure 2Bathymetric map of the moved epicenters. White lines show the transform faults, while the intra-transform ridges are shown in red lines (Maia et al., 2016). Squares are the initial GCMT epicenter, with the moved location used on the waveform model presented by the circle symbols. The arrows connect the GCMT locations to the final locations, with a mislocation average of 11.25 km away.
4.1 Surface Waveform Modeling
We study the focal depth of the 35 earthquakes using a surface waveform model from records of 21 regional seismic stations at 1000–3050 km distance range (Fig. 1b; Table S1 in the Supplement; Fig. S4). We only use stations where the Rayleigh waves present a good signal-to-noise ratio after filtering by a low-frequency filter (0.02–0.04 Hz). The waveform modeling was performed using an open-source MATLAB code package called ISOLA (Sokos and Zahradnik, 2008; Zahradnık and Sokos, 2018). The regional earthquakes used for modeling were chosen in the GCMT catalog based on two criteria: 1 – Data availability in networks; 2 – A magnitude threshold of Mw 5.3, which from our experience (de Melo et al., 2021, 2024), provides signals with sufficiently high signal-to-noise ratio suitable for surface waveform model. All epicenter-station ray paths are represented in Fig. S4, with the operation time of the stations.
A simple 1D crustal velocity model obtained from the CRUST1.0 global model (Laske et al., 2013) was used in ISOLA to model the surface waves in the oceanic crust (Table S2 in the Supplement), with the model indicating a seafloor located 5.1 km below sea level. The model process starts with applying a 4th-degree Butterworth filter to remove the instrumental response and generate displacement waveforms in the frequency range of 0.02–0.04 Hz frequency range. In some cases, we modified the filter frequency range to 0.01–0.03 Hz for the farthest stations (e.g. DBIC and MPG; see Fig. 1a). Next, a synthetic displacement waveform is generated for comparison, using the same filter frequency applied station by station. Green's functions were calculated using the AXITRA program (Coutant 1989), implemented in the ISOLA package. We used the fixed point-source ISOLA inversion, which fixes the strike/dip/range angles, applying focal mechanism angles provided by the GCMT catalog (Dziewonski et al., 1981; Ekström et al., 2012). ISOLA searches for the best solution across a source grid spaced at 1 km intervals.
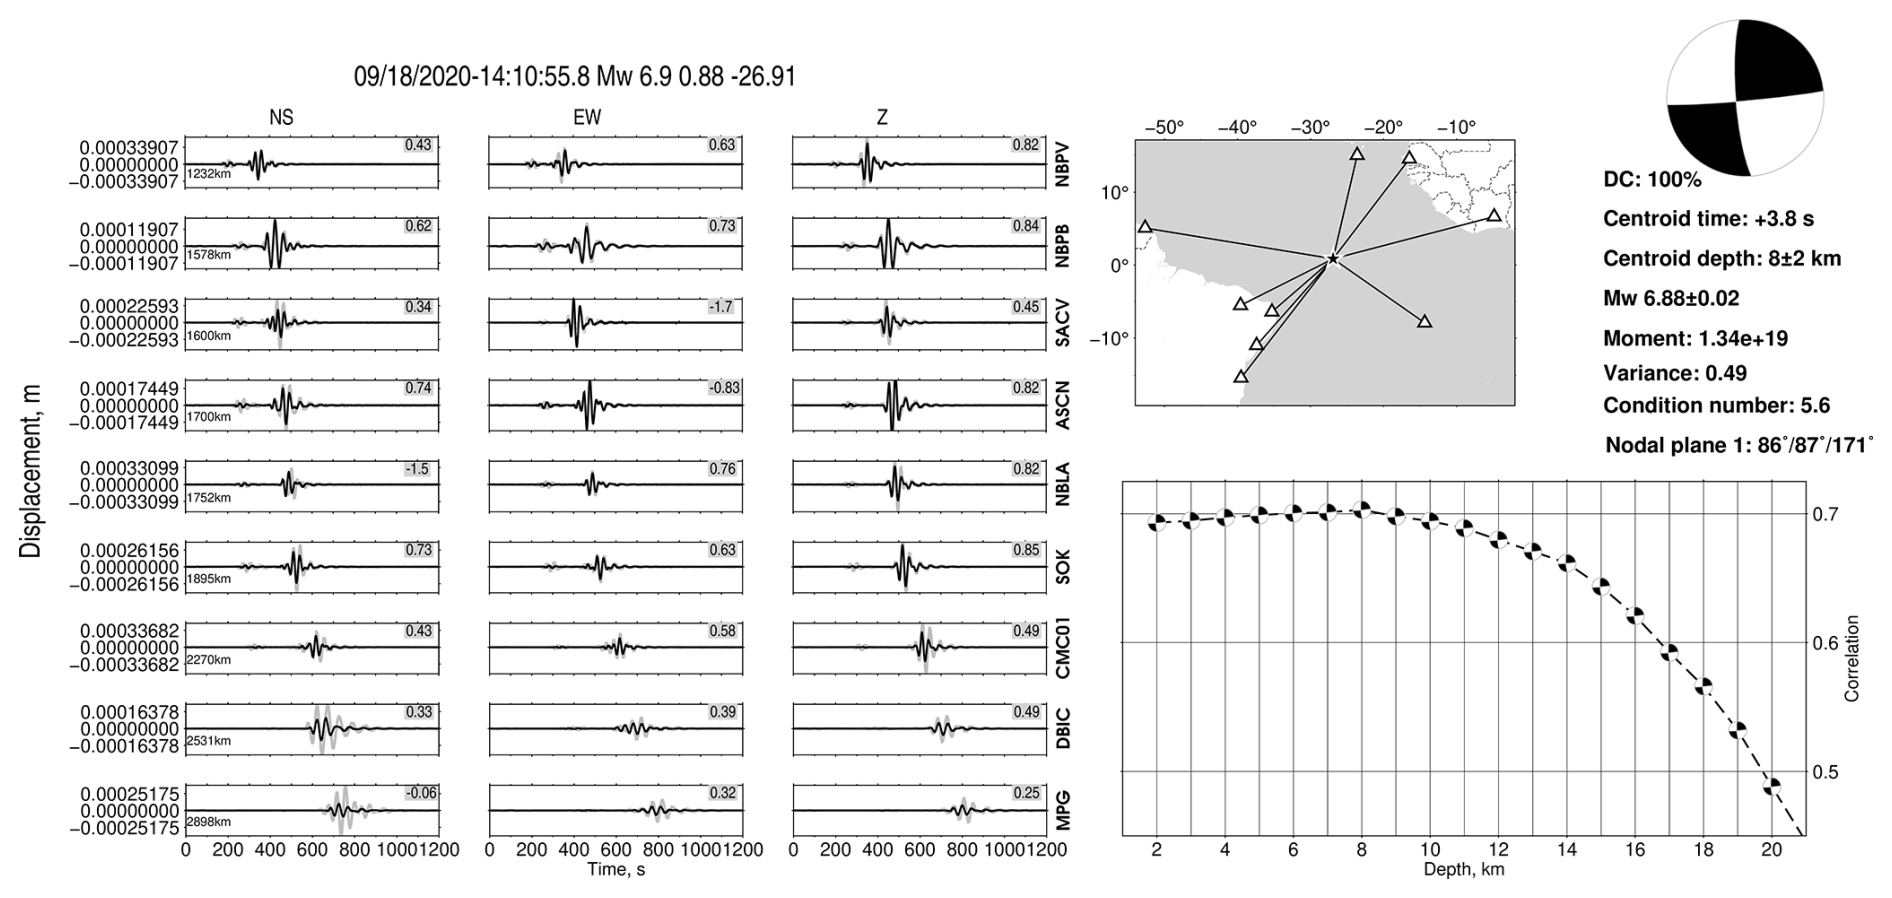
Figure 3Focal depth analysis in SPTS of the Mw 6.9 earthquake occurred at Transform B in 18 September 2020. Left figure: Waveforms (gray) and their models (black) obtained with the best-fitting source position at 8 km depth. Middle upper figure: epicentral location map with their specified source-data ray paths for the respective seismic stations used on ISOLA analysis. Downright figure: Correlation vs Depth for the earthquake. The best solutions referent to each of the two earthquakes were fitted with higher correlation at 8 ± 2 km depth.
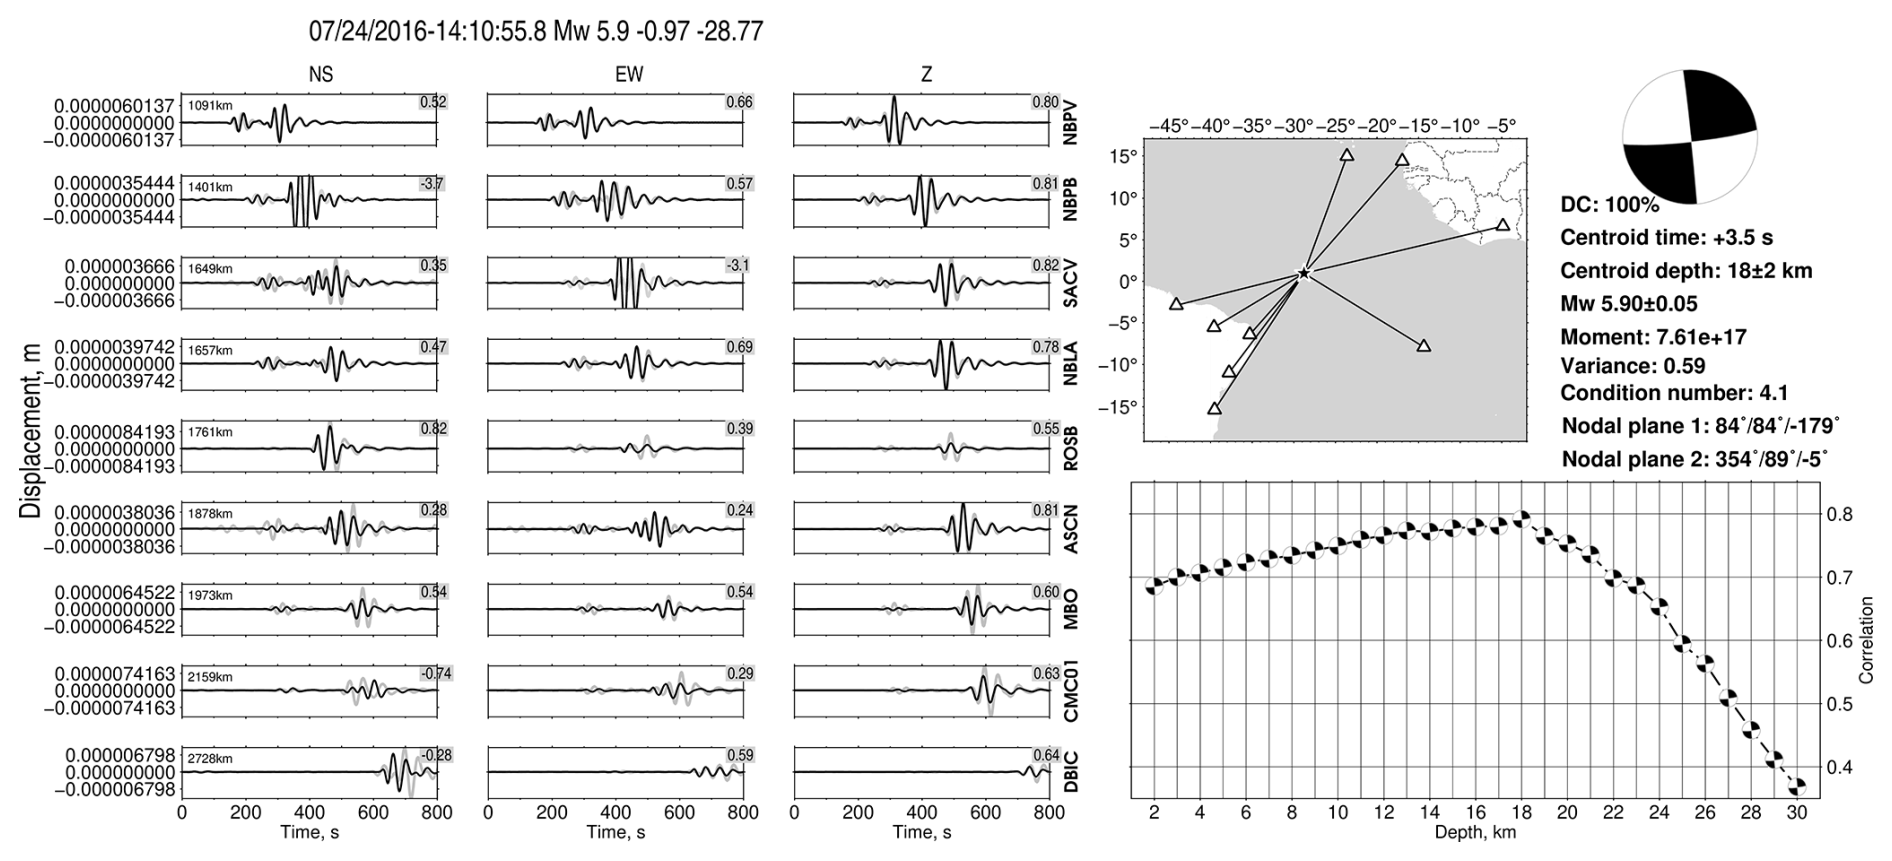
Figure 4Focal depth analysis in SPTS of the Mw 5.9 earthquake occurred at Transform A in 24 July 2016. Left figure: Waveforms (gray) and their models (black) obtained with the best-fitting source position at 18 km depth. Middle upper figure: epicentral location map with their specified source-data ray paths for the respective seismic stations used on ISOLA analysis. Downright figure: Correlation vs Depth for the earthquake. The best solutions referent to each of the two earthquakes were fitted with higher correlation at 18 ± 2 km depth.
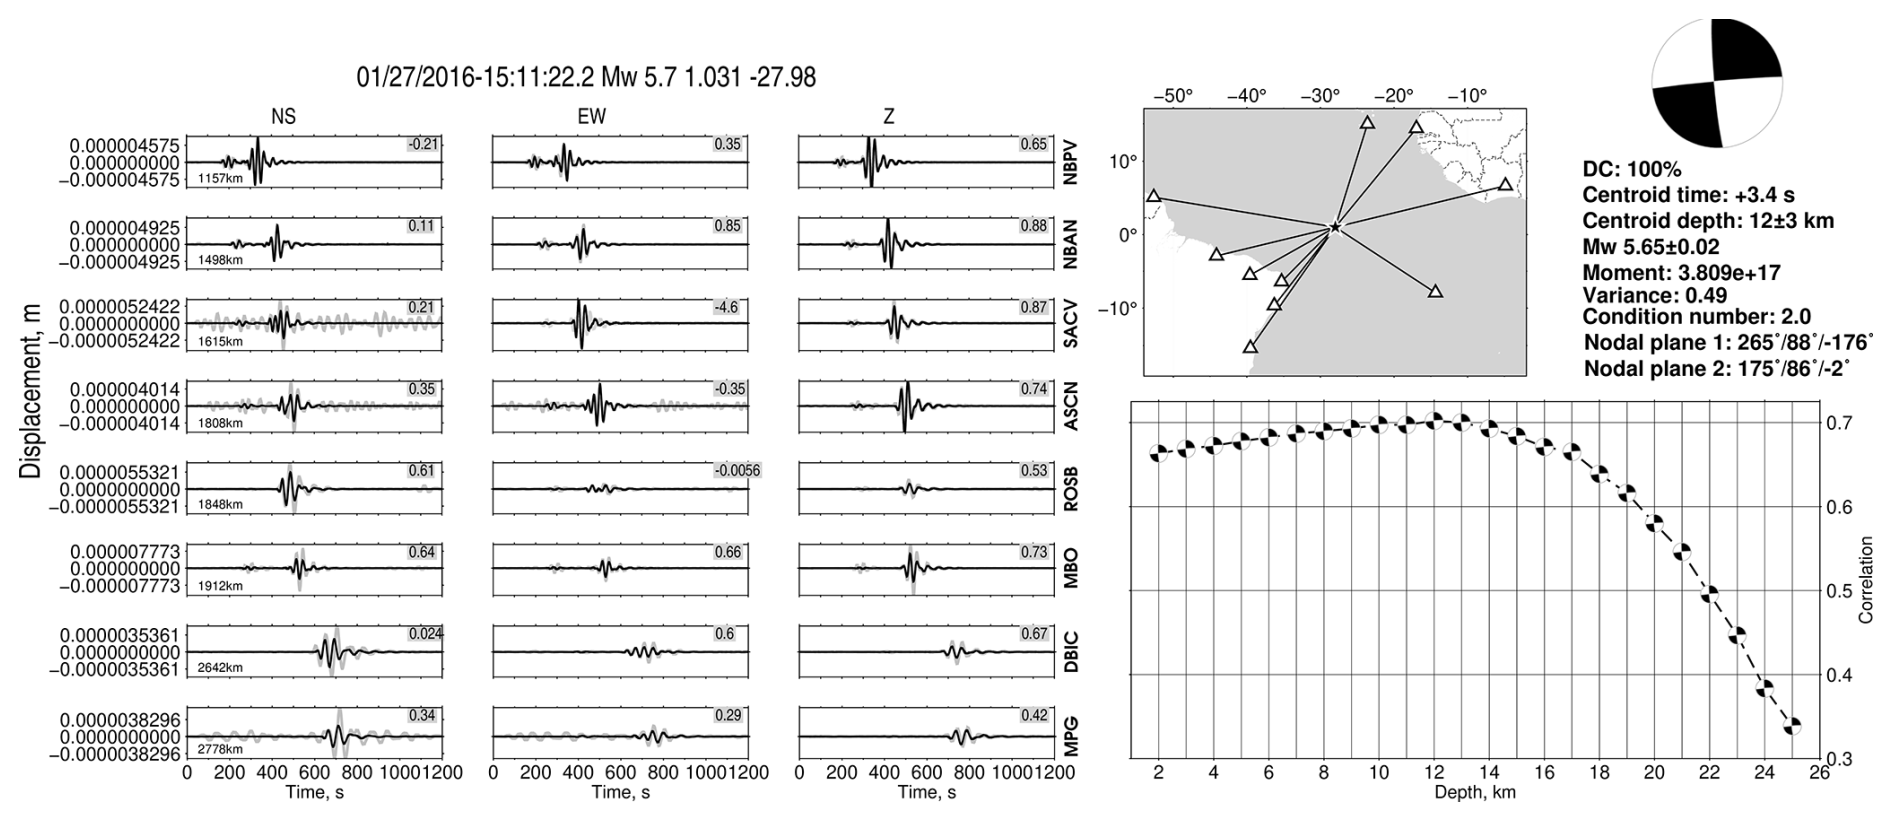
Figure 5Focal depth analysis in SPTS of the Mw 5.7 earthquake occurred at Transform A in 27 January 2016. Left figure: Waveforms (gray) and their models (black) obtained with the best-fitting source position at 12 km depth. Middle upper figure: epicentral location map with their specified source-data ray paths for the respective seismic stations used on ISOLA analysis. Downright figure: Correlation vs Depth for the earthquake. The best solutions referent to each of the two earthquakes were fitted with higher correlation at 12 ± 3 km depth.
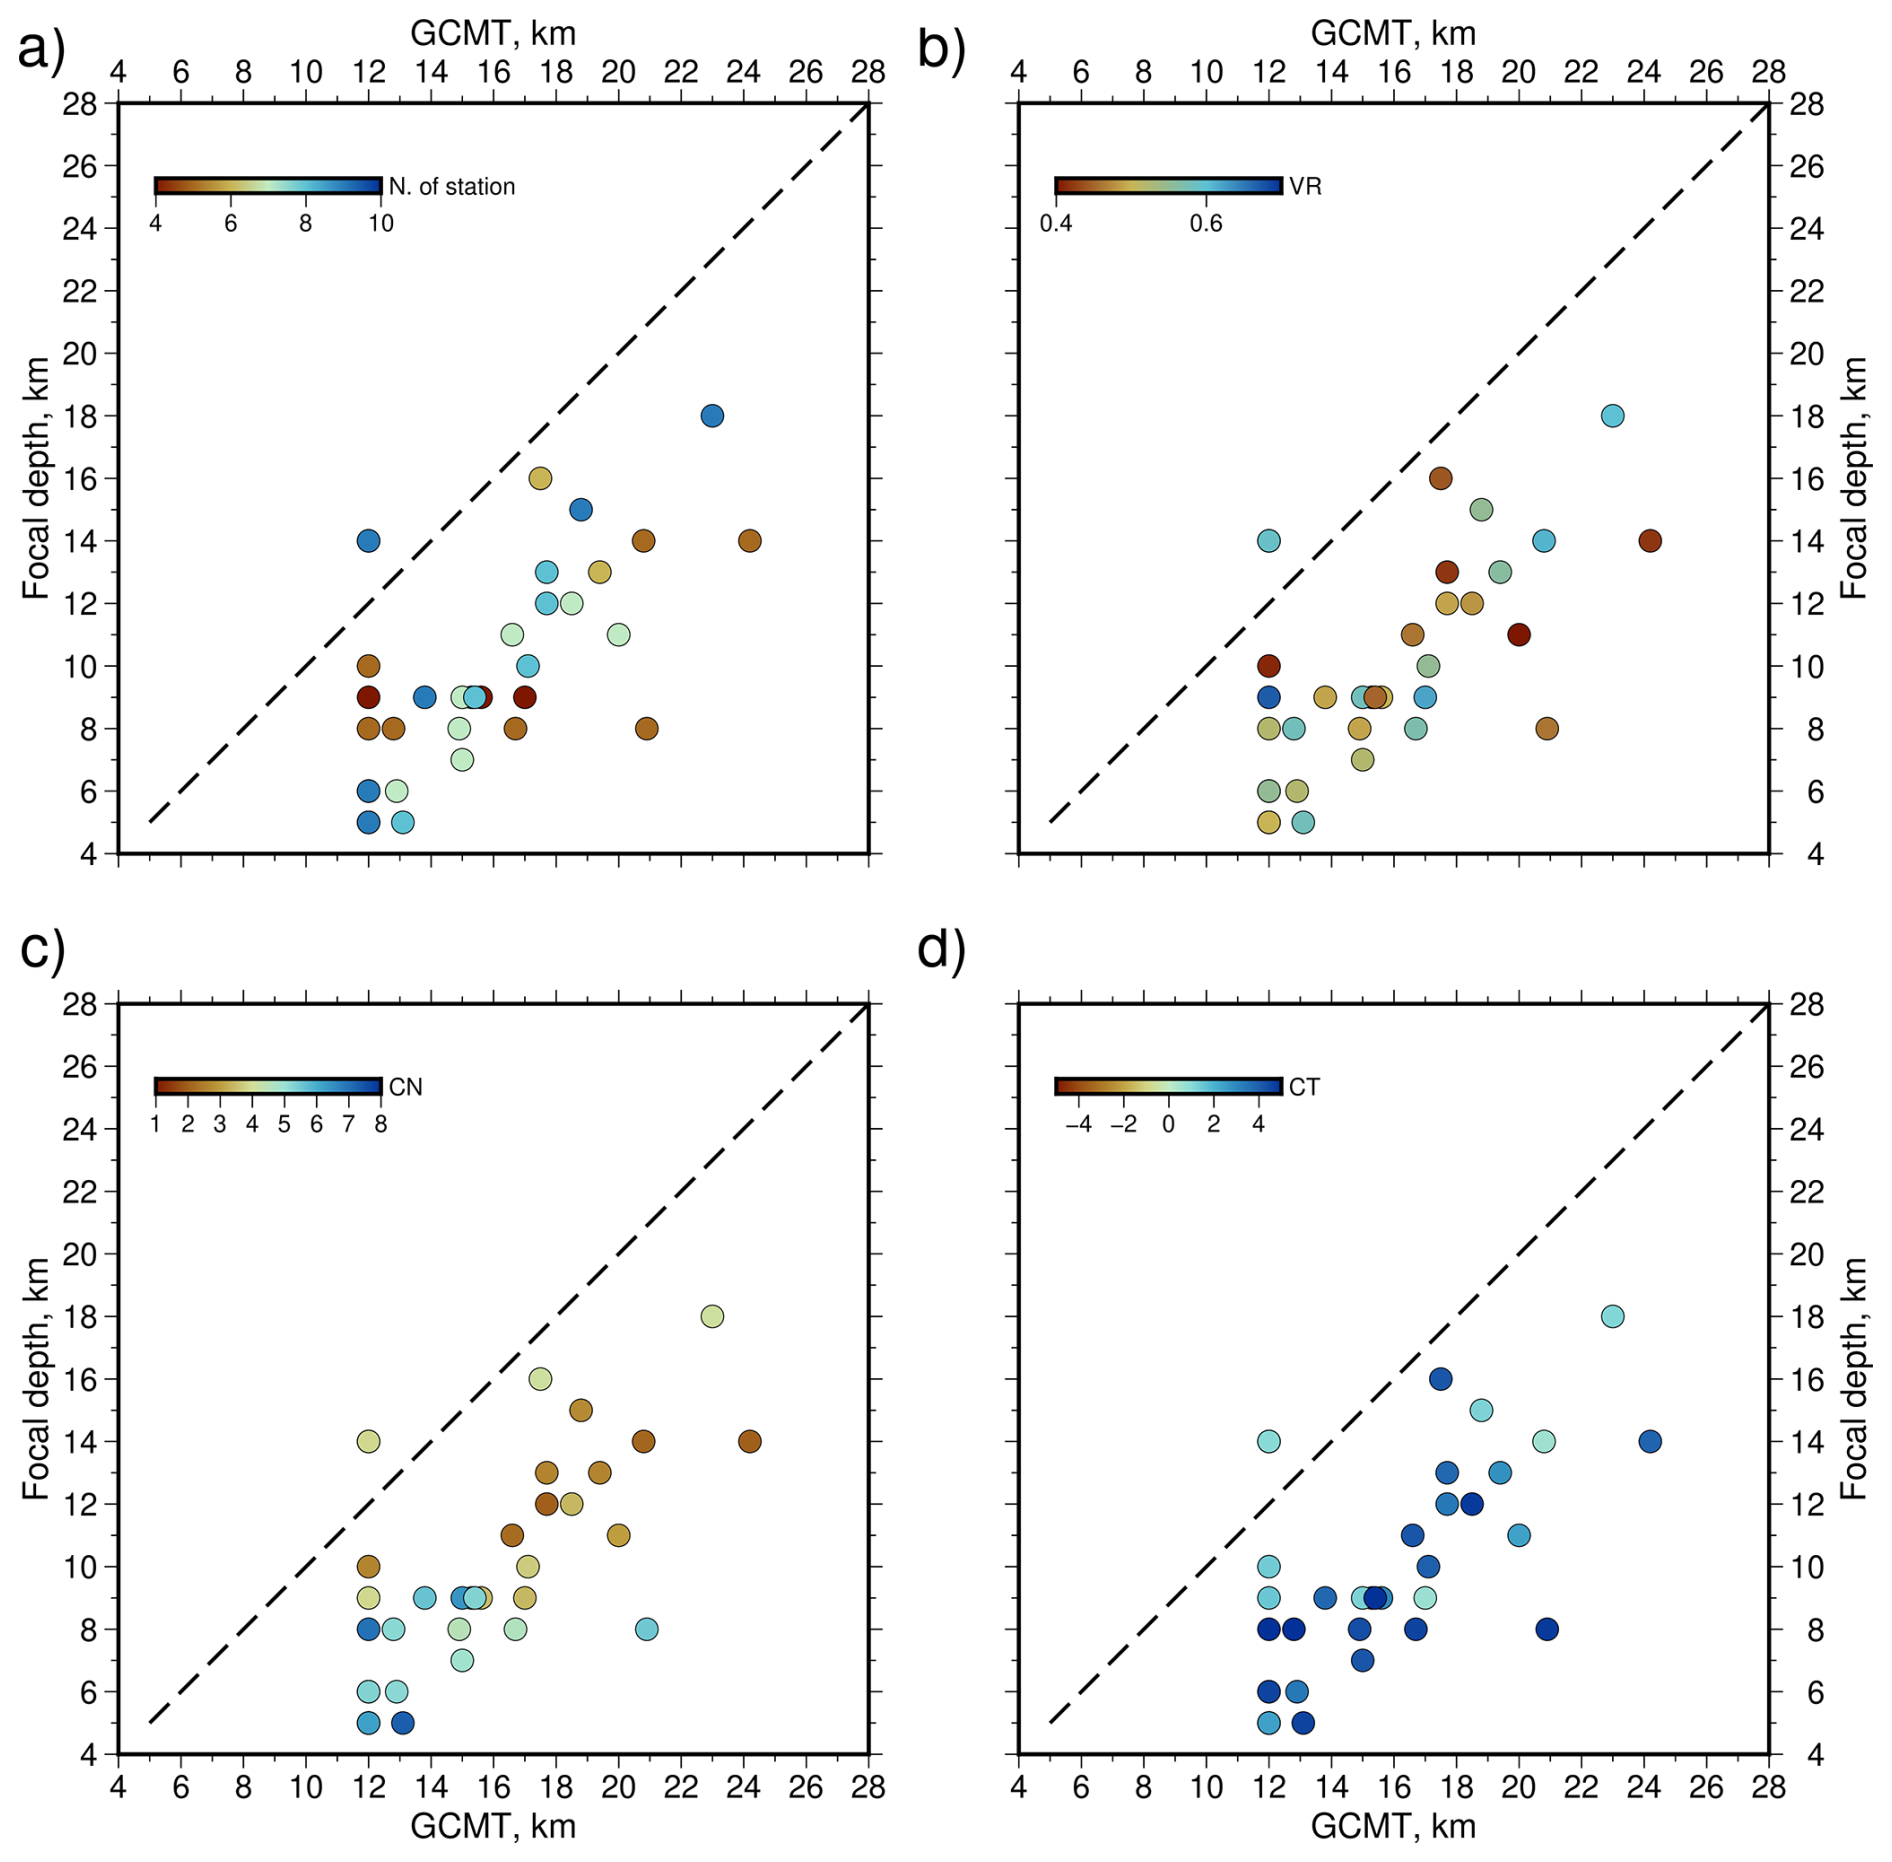
Figure 6Comparison of the focal depth below seafloor analyzed in SPTS using regional records versus GCMT depth. (a) Comparison with the number of stations used in the analysis, presented by the symbol colors. Most of the earthquake had a minimum of six stations used in analysis, with most of the solutions presenting a synthetic/real waveform fitting with VR > 0.5 (b). (c) Symbol color showing the variation of the condition number (CN) of the ISOLA solution referent to each earthquake. Most solutions had CN < 5. (d) Comparison with the centroid-time (CT) obtained in waveform fitting, with most events presenting CT > 0, indicating the existence of a difference between the origin time of the moment tensor solutions of the GCMT with the CT obtained using the regional stations.
Large strike-slip earthquakes should rupture along the PTDZ (de Melo et al., 2025a). Instead, we observed that the location of the GCMT epicenters are biased and occur sometimes several tens of kilometers away from the transform valley at Transform B and C (Fig. S3). Pan and Dziewonski (2005) found that GCMT epicenters can be located up to half a degree from the proper tectonic plate borders. Therefore, we modified the epicentral coordinates, keeping the GCMT longitude, but moving the latitude onto the PTDZ mapped in multibeam data (Maia et al., 2016). The distance between GCMT epicenter and the new modified epicenter vary from 0.44 to 20 km with average of 11.25 km (Fig. 2). Recorded/synthetic waveform best-fitting solutions are described by the focal depth, centroid-time (CT), seismic moment (M0), moment magnitude (Mw), CN (condition number which tells us whether the inversion problem is ill-posed, values < 5 indicate the moment-tensor which is relatively well resolved), the double-couple percentage (DC) and 95 % confidence interval VR (1). We estimate the depth uncertainties using a computer code that expands the ISOLA package solutions (Dias et al., 2016), which applies several different frequency ranges in the waveform inversion to reveal the stability and uncertainty of the solution of the aforementioned centroid parameters considering a threshold (0.95) concerning the solution with the largest VR. Three waveform-fitting examples of earthquakes with Mw 6.9, 5.9 and 5.7 are shown in Figs. 3–5. We used 4–10 stations during the analysis (Fig. 6a; Table S3), depending on the data availability. The mean 95 % confidence interval for the earthquake waveform fitting shows VRs from 0.41 to 0.69, with most vertical components often exceeding 0.90 (Fig. 6b; Table S3). Most CN solutions of the earthquakes are < 4.5 (Fig. 6c; Table S3), with the CTs obtained in analysis ranging from −0.2 to 4.8 s (Fig. 6d; Table S3). Changes in parameters like source-station orientation and velocity model provide new ISOLA solutions with higher VR values. We used regional distance records, which makes it difficult to find an adequate single velocity model to provide results with VRs close to 1.0 for all components (de Melo et al., 2021, 2024). Nevertheless, low values of VR do not necessarily signify that a solution is ill-posed once ISOLA considers fitted solutions with VR of 0.4 or more (Zahradnık and Sokos, 2018).
4.2 Thermal Structure Modeling
We employ the approach of the classical half-space cooling model to construct the thermal structure of the SPTS. A geodynamic model can be found in Sect. S1 in the Supplement and Fig. S5 in the Supplement. The temperature field in the cooling model is derived from the oceanic plate temperature formula (Turcotte and Schubert 2014):
where Ts (0 °C) and Tm are temperatures of the surface and mantle, respectively, z is the depth from 0 at the seafloor down to 200 km, κ is the thermal diffusivity (10−6 m2 yr−1), x is the distance from the ridge axis, and u is the spreading rate (27.8 mm yr−1; DeMets et al., 2010). Previous studies reported that the mantle temperature in the equatorial Atlantic might be ∼ 150 °C lower than elsewhere in the Atlantic Ocean (Bonatti, 1990; Bonatti et al., 1993; Schilling et al.. 1995; Hékinian et al., 2000; Le Voyer et al., 2015). Consequently, we tested two different potential mantle temperatures of 1150 and 1300 °C. To account for thermal transitions across transform offsets, the temperature field beneath each transform segment is modified by averaging the temperatures of the adjacent ridge segments on both sides.
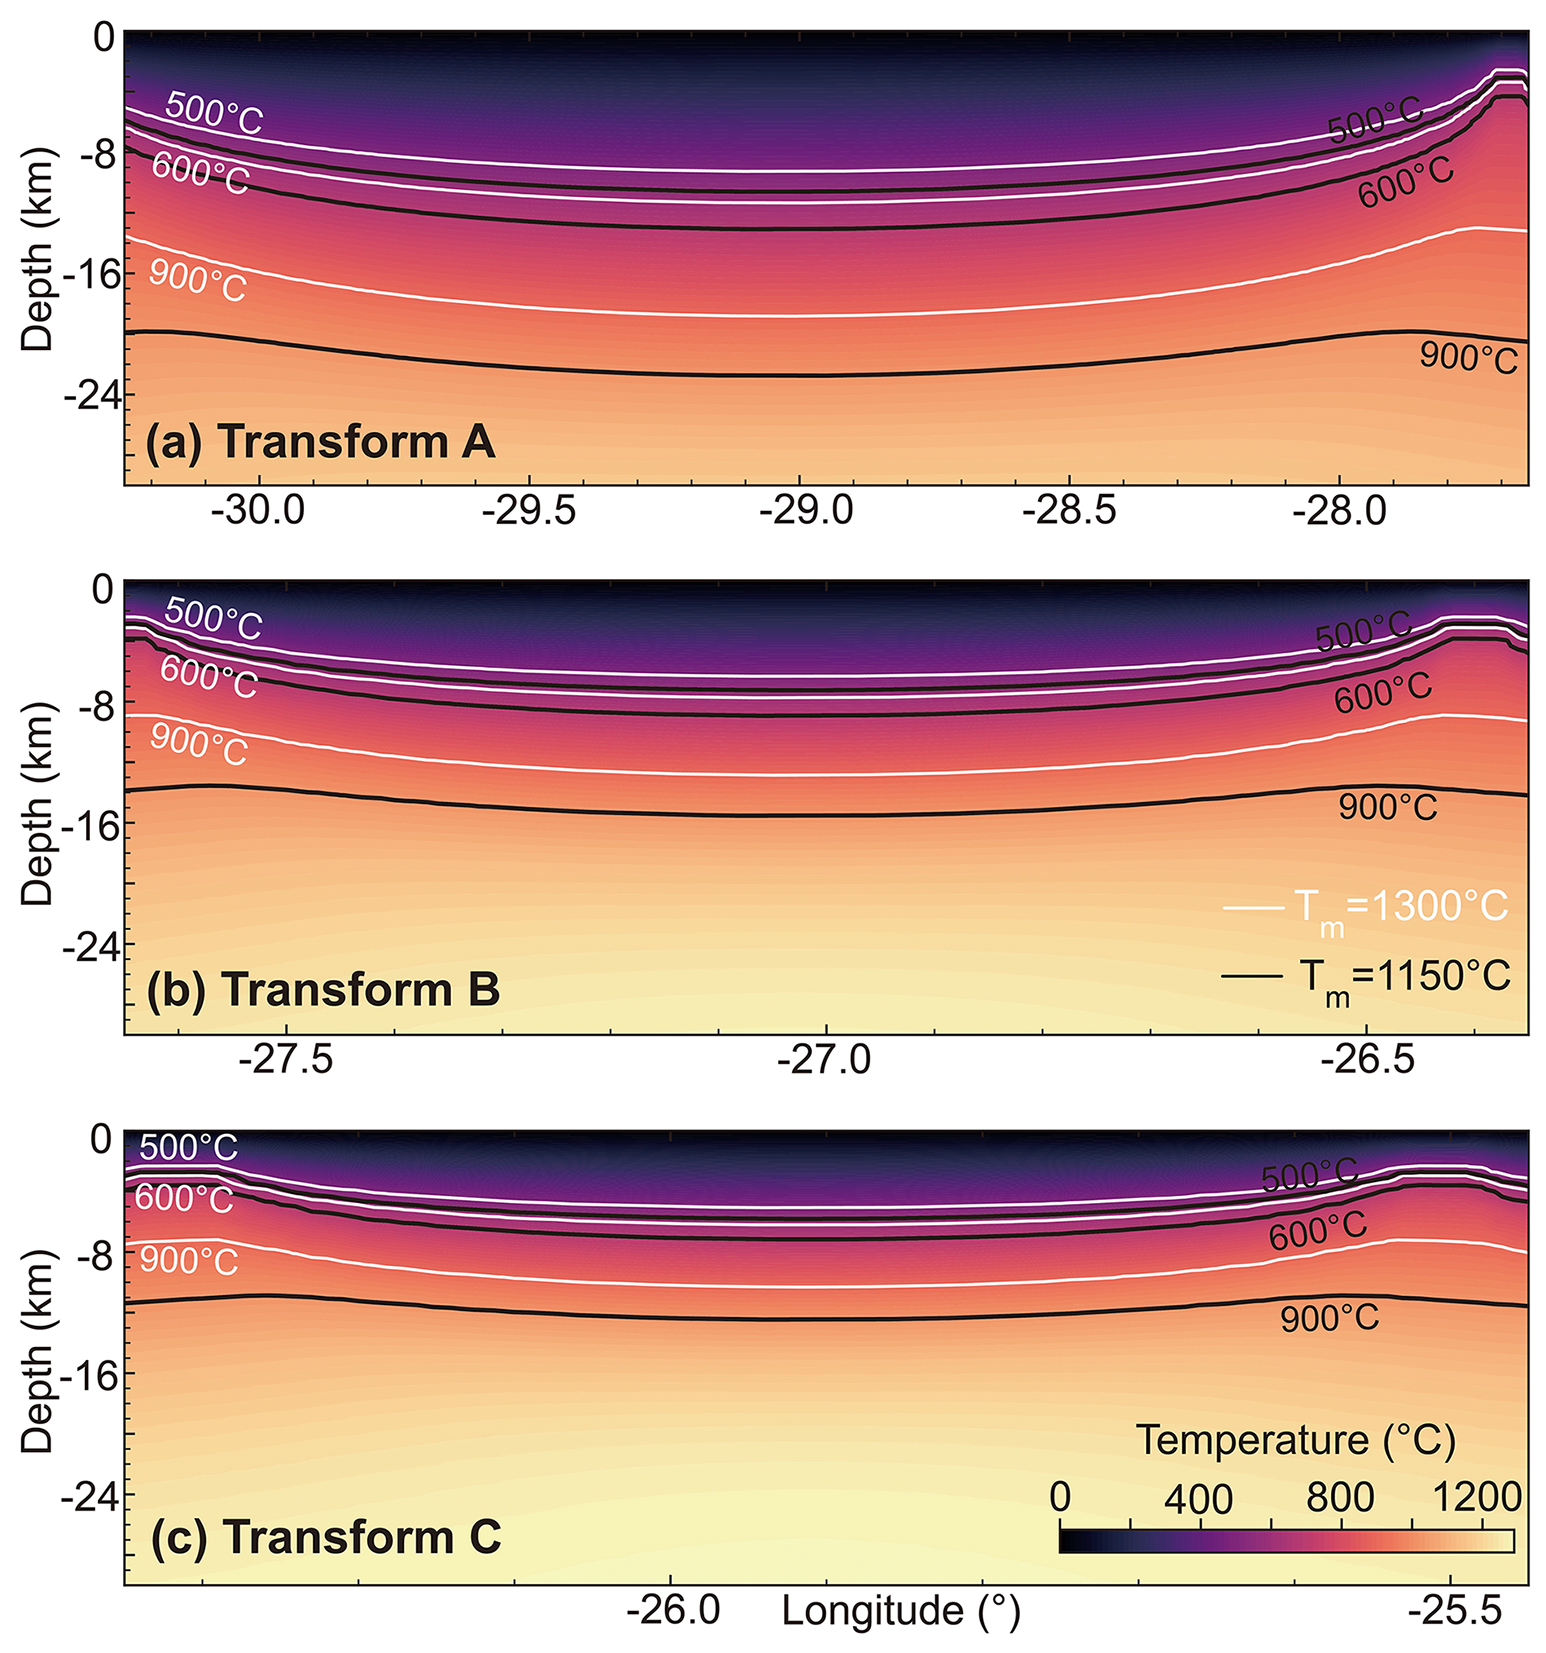
Figure 7Half-space cooling model (HSCM) referent to Transforms A, B, and C (a/b/c). Black lines refer to the model calculated assuming a mantle temperature of 1150 °C, referent to the respective maximum serpentinization depth at transform segments (500 °C, Maia et al., 2016); the 600 °C referent to the expected maximum brittle-ductile transition (Abercrombie and Ekström, 2001); and the limitation of the deep fluid-rock interaction with influence in deformation expected to occur until 900 °C (Prigent et al., 2020; Bickert et al., 2023). White lines indicate the results obtained for the same isotherms, but assuming the 1300 °C mantle temperature on HSCM. Due to the long-offset difference between the three transform segments, we can observe a considerable variation between the depth of the isotherms.
To evaluate the impact of different thermal structures, we extracted the depths of the 500, 600, and 900 °C isotherms from both models across three transform segments (A, B, and C). The comparison between the two mantle temperature scenarios reveals significant spatial variations. Transform A exhibits systematically shallower isotherms in areas away from the ridge in the 1300 °C model (Fig. 7a), indicating a hotter lithosphere compared to the central region of the transform fault segment. In Transform B and C (Fig. 7b and c), the 500 and 600 °C isotherms show minimal differences, whereas the 900 °C isotherm given by the 1300 °C model is notably shallower than Transform A due to the shorter offset area.
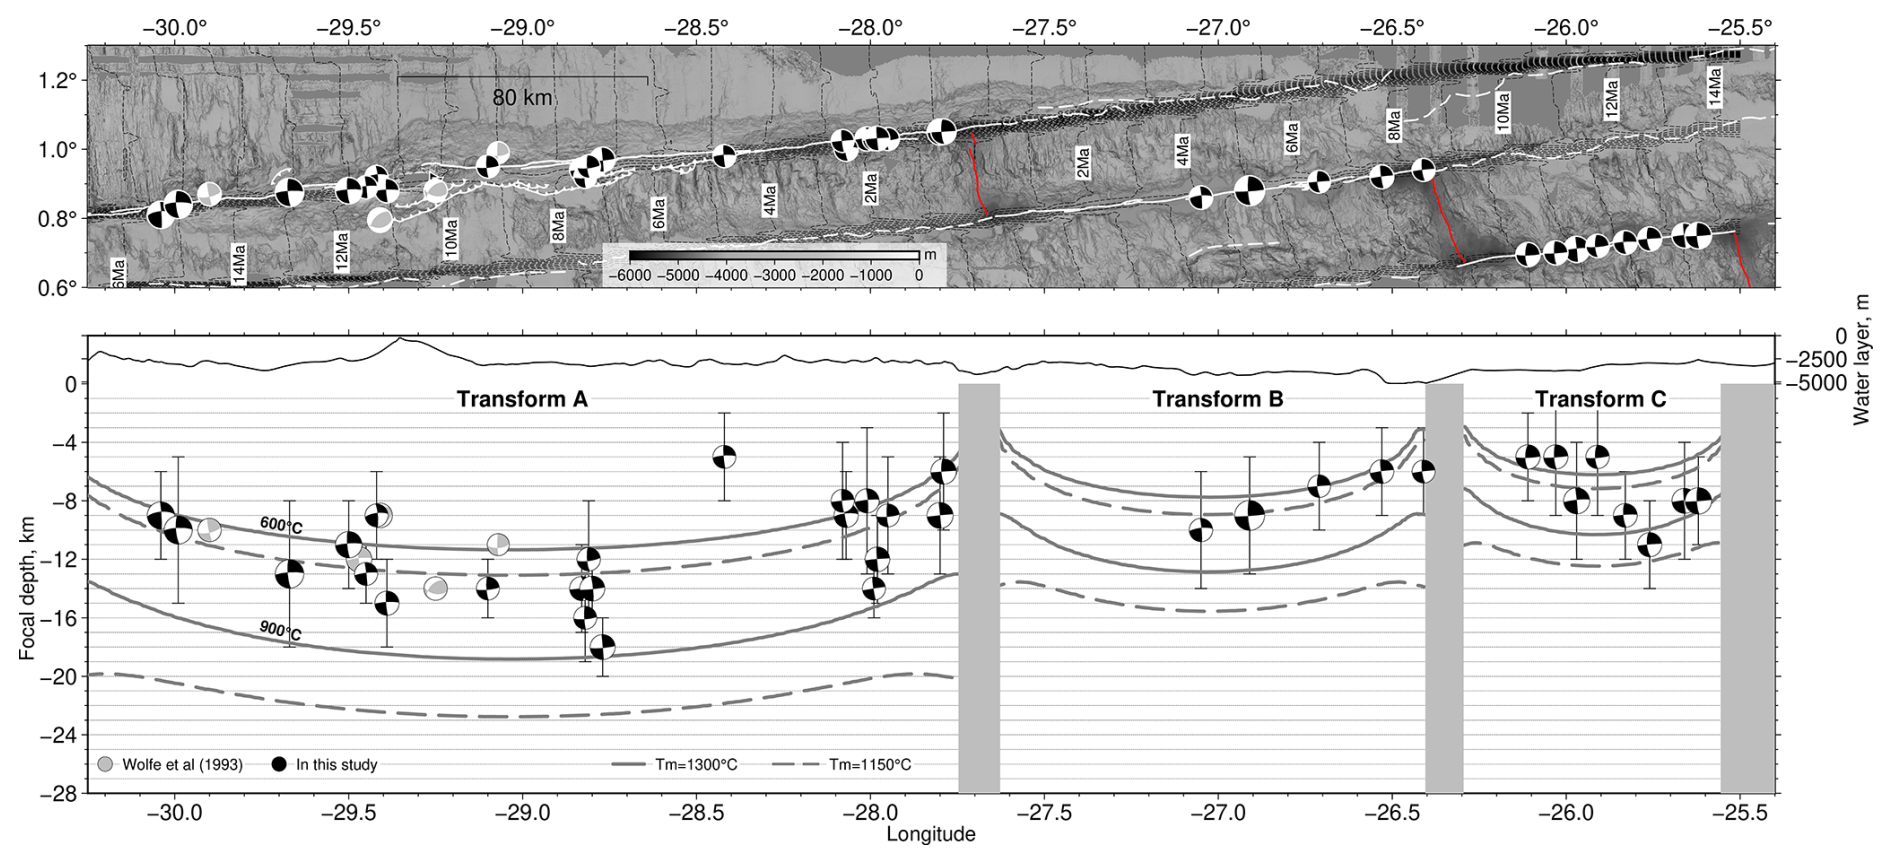
Figure 8Earthquake focal depth distribution along the St. Paul transform system. Upper panel: Bathymetric map of the transform segments A, B, C. White lines refer to the transform faults, while red lines show the mid-ocean ridges tectonic plate boundaries mapped by Maia et al. (2016). White dashed lines indicate the fracture zones. Black dashed lines show the crustal age variation in the St. Paul transform system (see Fig. S1), calculated by Maia et al. (2016). The epicenter locations of the 32 events of the GCMT catalog with Mw > 5.3 are presented by the black beachballs. Gray beach balls refer to the earthquakes reported by Wolfe et al. (1993) with a magnitude of 5.1 < mb < 5.9 (5.2 < Mw < 6.0; Kim et al., 2024). Bottom panel: cross-section of the Transform A, B, and C segments following the map longitude range, with the vertical distribution of the 32 earthquakes analyzed in this study (black beachballs) and the five earthquakes reported by Wolfe et al. (1993). Vertical uncertainties of the focal depths varying from 2 to 5 km are presented by the thinner vertical black lines. The gray isotherms lines indicate the thermal structure for temperatures of 600, and 900 °C beneath the SPTS assuming the mantle temperature of 1300 °C, while the dashed gray lines refer to the mantle temperature of 1150 °C. In both two models, at least 18 earthquakes are located at depths deeper than the 600 °C isotherm, the predicted brittle-ductile transition beneath the oceanic transform faults (Abercrombie and Ekstrom, 2001).
The 35 events analyzed in Transforms A, B, and C show focal depths between 5 ± 4 and 18 ± 2 (Fig. 8; Table S3). At Transform A, the magnitude of the 20 events ranges from 5.3 to 6.5 Mw. The focal depths vary between 5 ± 3 and 18 ± 2 Just two events were found in its western area of the Transform A, rupturing between 30.5 and 29.8° W longitudes, with the two epicenters of Mw 6.3 and 6.5 located close to each other, and focal depths at 9 ± 3 and 10 ± 5 , with an average of 9.5 km. Nine earthquakes are located beneath the Atobá Ridge between 29.6–28.6° W longitude, with focal depths ranging from 9 ± 2 to 18 ± 2 and an average of 14.3 km, most of them situated in the flanks of the Atobá Ridge, close to the mapped thrust faults. At the eastern end of Transform A between 28.5 to 27.75° W longitudes, eight strike-slip earthquakes presented focal depths with an average of 9.4 km, ranging from 6 ± 4 to 14 ± 2 , and their epicenters located in a deep basin crossed by the PTDZ. The zone is more linear and less segmented than the western and central areas of Transform A (Maia et al., 2016). Five events with moment magnitudes ranging from Mw 5.3–6.9 were analyzed for Transform B, providing an average of 7.8 Two of the strike-slip earthquakes occur in the middle of the segment, with focal depths of 10 ± 4 and 9 ± 4 The other two events are in the eastern domain close to the spreading segment separating the Transforms B and C, with focal depths of 6 ± 3 for both earthquakes. Eight focal depth estimates are available for Transform C, with an average of 7.4 The best-fitting waveforms show results with a 5–11 km depth range and a maximum uncertainty of 4 km, with most epicenters located over the restraining bends.
In general, our results from waveform modeling shows that the thickness of the seismogenic zone varies along the three transform segments (A, B, and C), with a maximum focal depth of 18 km. Wolfe et al. (1993) previously analyzed six earthquakes at Transform A, revealing focal depths of 8–14 Our depth estimates are at least 3.5 km shallower than the depth reported in the GCMT catalog (Fig. 7), which its common since GCMT does not consider the water layer in the depth analysis (Ekström et al., 2012). In our case, we assume the depth already removing the 5.1 km water layer of the CRUST1.0 (see de Melo et al., 2021). Just one earthquake that occurred in 2004-10-25 displayed focal depth deeper than those of the GCMT, which can be due to the poor seismographic network coverage during that period (Fig. 1).
6.1 Epicenter distribution along the Transforms A, B, and C
Oceanic transform faults may suffer from significant water percolation, thus inducing mantle rocks alteration (Bonatti, 1976; Francis et al., 1978; Detrick et al., 1993; Roland et al., 2010). Serpentinization consistently reduces the bulk density and influences the strength and the tectonic style of the slow-spreading oceanic lithosphere (Escartin et al., 1997, 2001). Bickert et al. (2023), for example, demonstrated that fluid-rock interactions take place under the Atoba Ridge, altering the rheology at Transform A. These effects govern the deformation and subsequently the activity in the Transform A region. Recent study have used teleseismic relative relocation to compare the earthquake distribution along globally oceanic transform faults, indicating that ∼ 68 % of the SPTS aseismically (Shi et al., 2022). However, the author did not address transform segmentation along the St. Paul transform fault system, nor did he compare it to the local structure features offered by high resolution bathymetry.
We compared the new location of the earthquakes with the local structure presented by the multibeam data at Transform B and C. At Transform B, the five epicenters cover the PTDZ from its eastern RTI towards the center, indicating that a total of ∼ 45 % of the PTDZ is seismically active. Although we are using only five earthquakes, the same seismic coupling proportion apply compared to the entire GCMT catalog since 1990 (Fig. S3). However, that proportion increase compared to nine earthquakes analyzed at Transform C, with the PTDZ seismically active for ∼ 75 % of the whole PTDZ extension. Additionally, the active area of the Transform C can increase to ∼ 80 % if we consider the whole GCMT catalog, suggesting that at least ∼ 45 % of the Transform B and ∼ 75 %–80 % of the Transform C extension are seismically active, contradicting the aseismic proportion provided by previous results (Shi et al., 2021). Locals features such as a cold upper mantle could explain a different strength along the Transform A and B.
6.2 The focal depth distribution along the Transforms A, B, and C
The maximum depth of seismic faulting is controlled by the brittle to ductile transition which is itself a function of temperature. Early studies suggested that earthquakes along Atlantic transforms occur at shallow depth of ∼ 4 km with no events occurring deeper than 7 km (Engeln et al., 1986). However, waveform inversion for focal mechanisms and focal depth, mostly based on teleseismic recordings, showed that these very shallow focal depths and little depth variation along a transform fault might not be correct. Instead, focal depth may vary profoundly along oceanic transform faults, with shallower earthquake occurrence near ridge-transform intersections and deeper earthquakes in the center of segments. For example, Bergman and Solomon (1988) found that at the Charlie–Gibbs and Vema transform faults focal depths increase towards the center, deepening from 4–5 km near transform-ridge intersections (RTI) and reaching a maximum depths of 14–20 in the center of the transforms. Similar patterns are found by Fang and Abercrombie (2023) at the Chain transform in the equatorial Atlantic, revealing that earthquakes ruptured at∼ 20–25 km near its center, while the shallower earthquakes clustered at 5–10 km near the RTIs. Abercrombie and Ekström (2001) also observed for the Chain transform focal depths of ∼ 8–10 km near the RTI and ∼ 12–16 km depth for earthquakes occurring away from both RTIs. At the Romanche transform, the longest transform fault in the equatorial Atlantic, they found identical pattern, though focal depth reached with 8–12 and ∼ 12–21 km somewhat deeper into the lithosphere at both RTIs and near its center, respectively.
The focal depths examined in our study are based on regional waveforms instead of teleseismic data and range from 5 to 18 along the Transforms A, B, and C of the St. Paul transform system. At Transform A, earthquakes in its central area and beneath the Atoba Ridge reach 9–18 , earthquakes closest to the western RTI reach 9–10 , and earthquakes near to the eastern RTI have a focal depth of 5–14 (Fig. 8). We see focal depths of earthquakes ranging from 6 to 10 km along Transform B, with the deeper ones situated in the center (Fig. 8). Earthquakes at Transform C display focal depths 5–11 (Fig. 8). Therefore, our observations, in concert with previous investigations from teleseismic data (e.g., Bergman and Solomon, 1988; Abercrombie and Ekström, 2001; Fang and Abercrombie, 2023), provide a comprehensive understanding of how focal depths are distributed along transform faults revealing a systematic change of focal depths with deeper earthquakes occurring in the central area of transforms and shallow events near the RTIs.
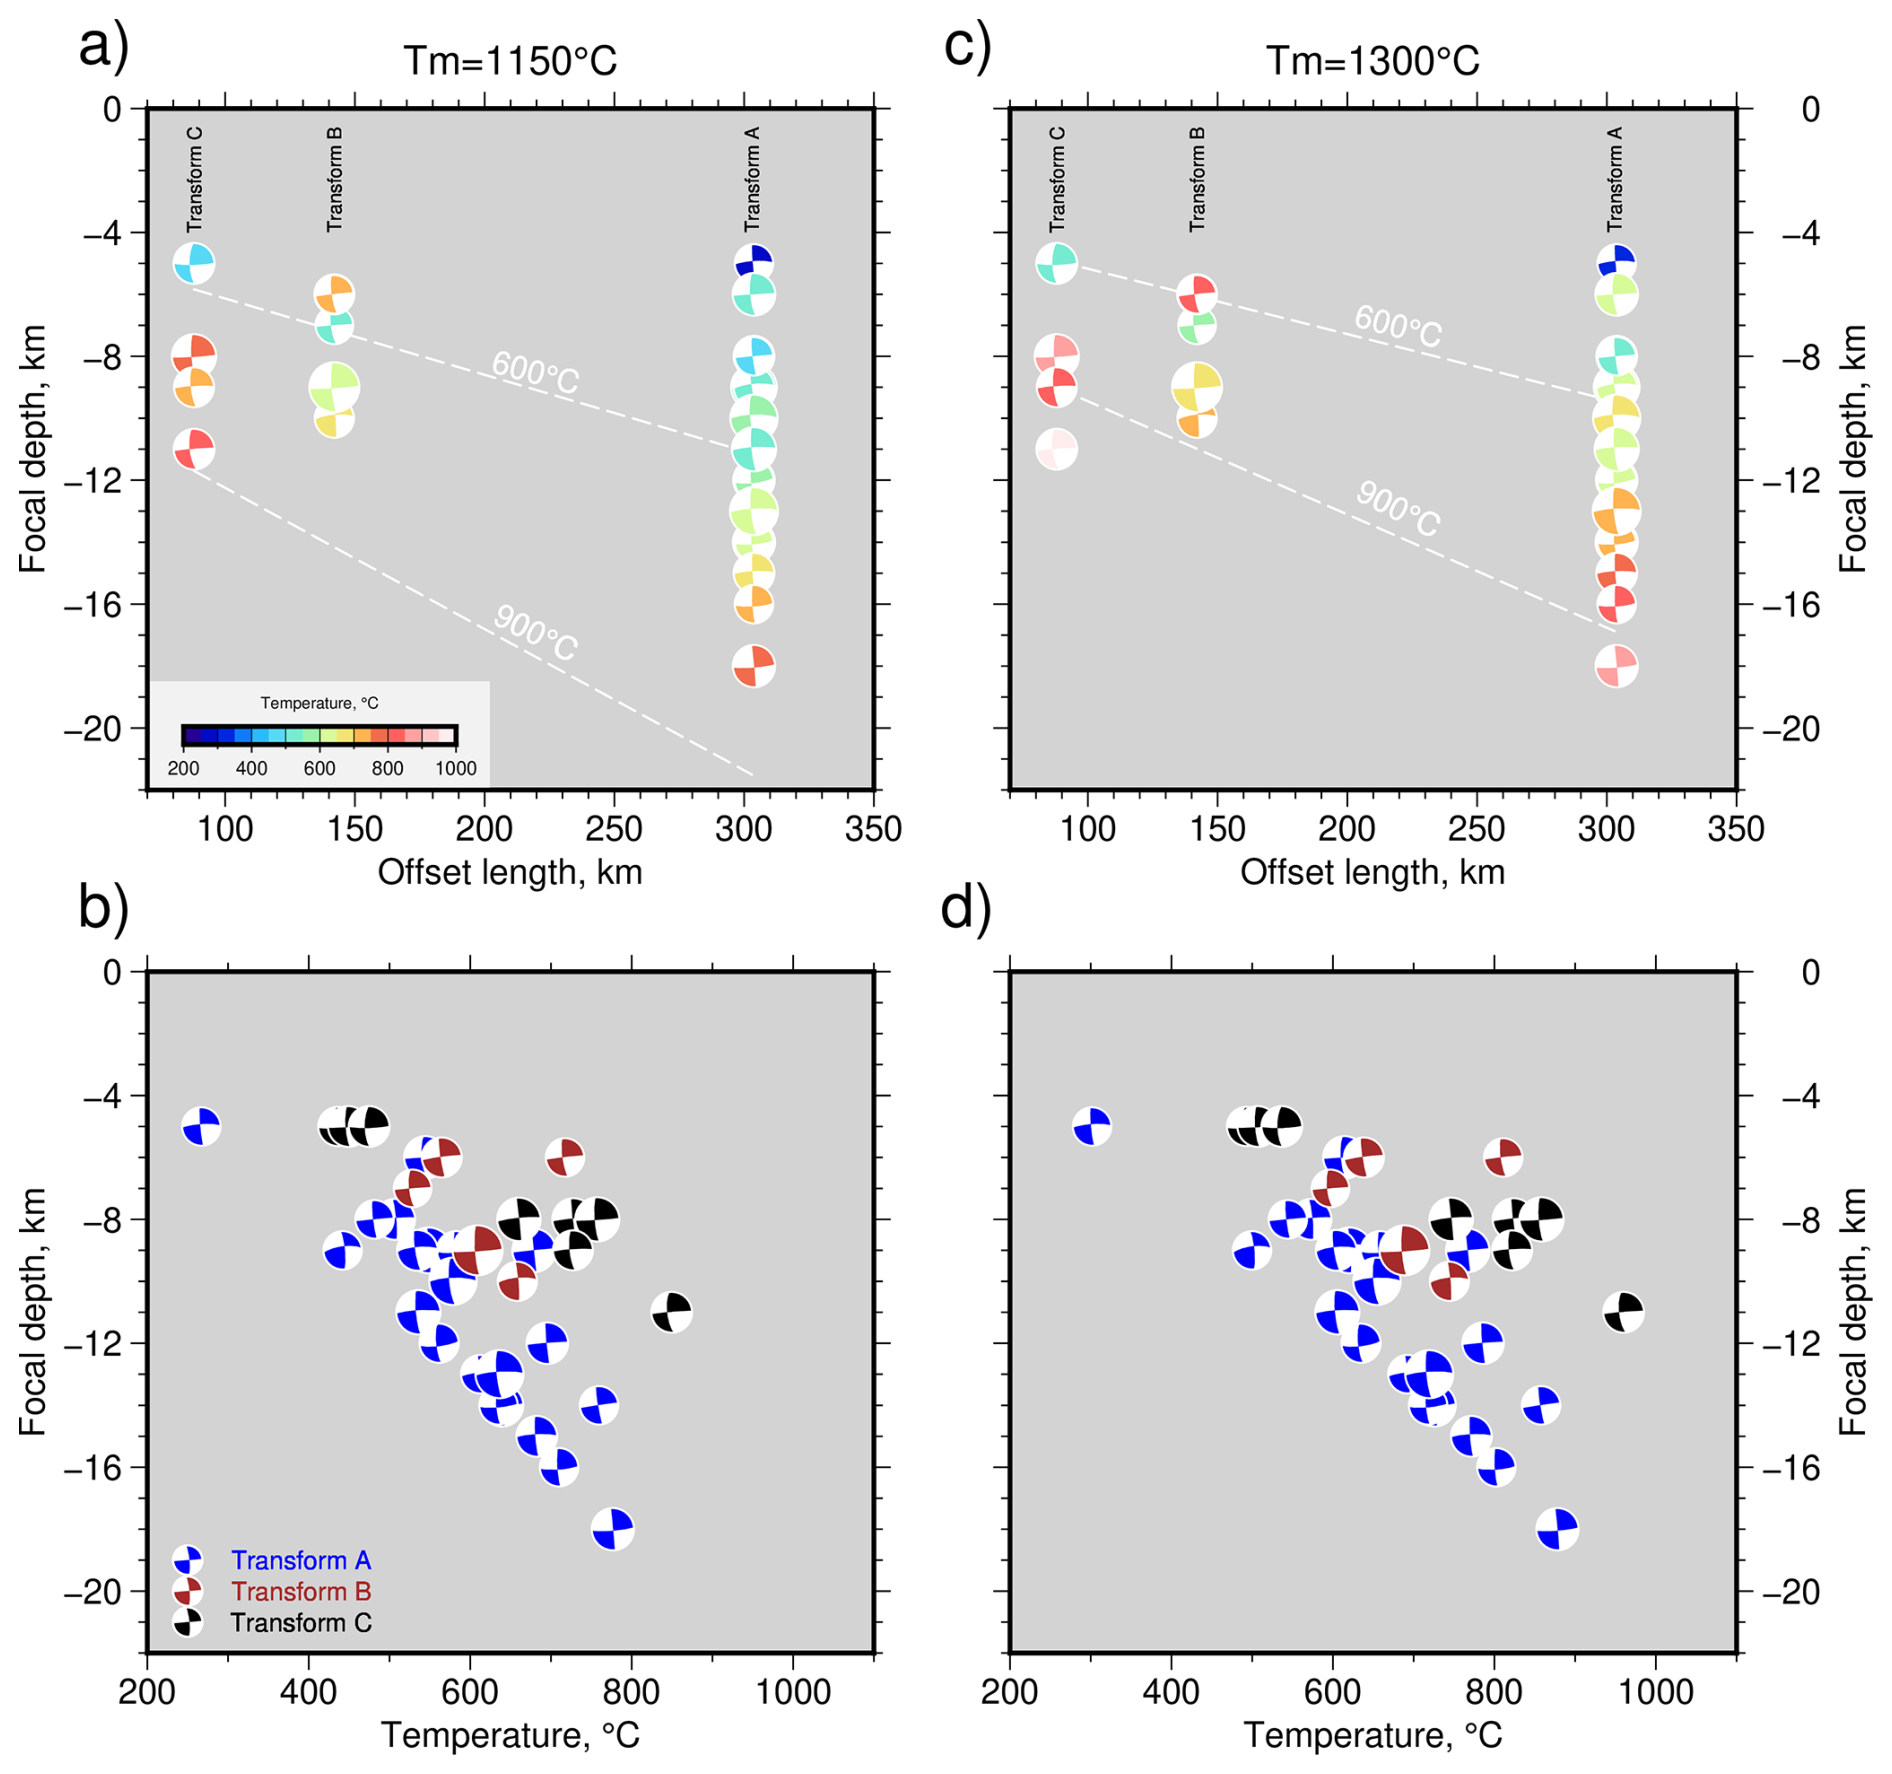
Figure 9(a, b) Comparison of the focal depth with the offset length of the Transform A, B, C (Ren et al., 2022) and calculated temperatures, respectively. A mantle temperature of 1150 °C was assumed for results presented in both (a) and (b). Results obtained using a hotter mantle temperature of 1300 °C is shown in (c) and (d). We can observe a gradual increase of the maximum focal depth with the increase of the offset length, which is expected to occur along the half-space cooling.
6.3 Focal depth and thermal structure
Early seismic studies of oceanic transform faults found rather shallow focal depth, suggesting that earthquakes may occur at a similar thermal range (50–300 °C) as those along continental faults (Burr and Solomon, 1978). The distribution of seismicity along both Chain and Romanche transform faults matches plate cooling thermal models, demonstrating the importance of temperature in determining focal depth and suggesting that most earthquakes occur with maximum depth related to the 600 °C isotherm (Abercrombie and Ekström, 2001). However, other studies suggested that some earthquakes may rupture at a higher temperature. For example, Bergman and Solomon (1988) suggested from their thermal models that seismicity is limited to the thickness of the lithosphere (∼ 900 °C isotherm).
Morgan and Forsyth (1988) developed a 3-dimensional numerical model to explain seismicity patterns in the mid-ocean ridge system with transform offsets, including the increase in earthquake occurrence away from the RTIs towards the transform center. Their model, however, introduces an isoviscous rheology, whereas modern geodynamic model studies favor nonlinear viscoplastic rheology, which provides a better approximation of the mantle dynamics (Behn et al., 2007; Liu et al., 2023). However, these models predict a strain localization that causes warm mantle upwelling beneath the transform fault, which contradicts observations of deeper seismicity toward transform centers. One potential explanation might be that active hydrothermal circulation along transform faults may dissipate heat at their centers. Nevertheless, without independent evidence for the amount of hydrothermal mining of heat, we instead use a 3-dimensional half-space cooling model to study the relationship between thermal state and seismogenesis.
Our thermal model considers two thermal scenarios: a standard mantle temperature of 1300 °C commonly used in the literature and a colder mantle (1150 °C) based on previous studies indicating a lower mantle temperature in the equatorial Atlantic (Bonatti, 1990; Bonatti et al., 1993; Schilling et al., 1995; Hékinian et al., 2000; Le Voyer et al., 2015). The model results show that the depth of the 600 °C isotherm, corresponding to the maximum depth of the brittle deformation (Abercrombie and Ekström, 2001), increase with transform offset length (Fig. 9a and b). Transform A present the maximum depths, ∼ 11 and 13 , for 1300 and 1150 °C models, respectively (Fig. 8). At Transform B, the 600 °C isotherm is located at depths of 7.9 and 9 km, and at Transform C, the isotherm reaches 6 and 7 km (Fig. 8). For both thermal scenarios, the deeper earthquakes are located above isotherms of 780–880 °C at the center of the Transform A, 660–750 °C in Transform B, and 850–960 °C in Transform C. Across all transforms, the depth of the earthquakes increases with the modelled mantle temperature (Fig. 9b and c). Similarly, recent examinations of focal depths using ocean-bottom seismometer data along the Chain transform fault revealed that the seismogenic zone is deeper than the fault's maximum predicted depths in the center (Leptokaropoulos et al., 2023; Schlaphorst et al., 2023). These results suggest that the focal depth distribution compared with model temperatures indicate that the seismic deformation occur inside a general range from ∼ 600 to 900 °C along the length of the fault, reinforcing the idea that the center of transform faults is cooler than RTIs. In addition, the half-space results assuming a colder mantle temperature (1150 °C) fits better with observed focal depths (Fig. 8).
Our results suggest that the depth of seismogenic zone beneath Transforms A, B, and C agree with expected maximum deformation presented by previous structural, geochemical, and seismological analyses (Wolfe et al., 1993; Roland et al., 2010; Barão et al., 2020; Prigent et al., 2020; Bickert et al., 2023). However, these results challenge the brittle weakening with viscoplastic mantle rheology done by Behn et al. (2007), in which predicted warmer temperatures toward the middle of the transform caused by mantle upwelling and cooling toward the ridge segments (Behn et al., 2007). Instead, our observations support a cooler transform center, potentially influenced by hydrothermal activity and lower ambient mantle temperatures in the equatorial Atlantic.
We relocated earthquakes along the St. Paul transform fault system to the active fault using regional waveform modelling of surface waves and bathymetric data. From our analysis of focal depths and thermal modelling we conclude that
-
The strike-slip segments of the SPTS are strongly segmented revealing a considerable variation in seismic coupling, showing that between 45 %–80 % of the mapped fault are seismically active.
-
The horizontal distribution of focal depths along Transforms A, B, and C reveals that the epicenters of the deepest earthquakes occur near the center zone of the PTDZs, whereas shallower focal depths are found near RTIs. These findings indicate that the horizontal distribution of seismic behavior at the St. Paul transform system is consistent with previous studies conducted on other transform faults such as Charlie–Gibbs, Vema, Romanche, and Chain.
-
Compared with the thermal model, the deepest earthquakes at the center zone of Transforms A, B, and C, are in colder area with lower temperatures along the PTDZ, contrary of the shallower earthquakes locating in hotter areas close to the RTI. These results support the existence of a colder upper mantle at center of the oceanic transform faults, challenging features issued by viscoplastic mantle rheology models.
The broadband seismic waveform data of the Brazilian Seismographic Network (RSBR; Bianchi et al., 2018) network can be obtained at http://rsbr.on.br/request.html (last access: February 2025). The seismic data of the BLSP2002 project (Feng et al., 2004), the GEOSCOPE network (Romanowicz et al., 1984), and other global stations were downloaded from EarthScope Consortium Inc (https://service.iris.edu/, last access: February 2025). The ISOLA package (http://seismo.geology.upatras.gr/isola/, last access: February 2025) is applied for data processing and waveform models using MATLAB version 9.6 (The MathWorks Inc. 2019). The Global Centroid Moment Tensor database (http://www.globalcmt.org, last access: February 2025). Maps and graphics were made with Generic Mapping Tools, version 6.6.0 (Wessel et al., 2019). Bathymetric data in Fig. 1 was based on the Global Multi-Resolution Topography (GMRT; Ryan et al., 2009), version 4.3, available at https://www.gmrt.org/GMRTMapTool/ (last access: February 2025). Additional Supplement Material information about the analysis for all earthquakes is accessible using the Zenodo repository (https://doi.org/10.5281/zenodo.15204422, de Melo et al., 2025b).
The supplement related to this article is available online at https://doi.org/10.5194/se-16-1059-2025-supplement.
GWSdM conducted the conceptualization, data curation, methodology and formal analysis of the waveform modeling, investigation, and validation of the focal depths. IG and MM contributed with supervision. SL developed the methodology, formal analysis, and validation of the thermal modeling. GWSdM, IG, SL, and MM contributed to the interpretation of the results. IG and LR provided funding acquisition and resources. GWSdM wrote the manuscript with contributions and reviews from all co-authors.
The contact author has declared that none of the authors has any competing interests.
Publisher's note: Copernicus Publications remains neutral with regard to jurisdictional claims made in the text, published maps, institutional affiliations, or any other geographical representation in this paper. While Copernicus Publications makes every effort to include appropriate place names, the final responsibility lies with the authors. Also, please note that this paper has not received English language copy-editing. Views expressed in the text are those of the authors and do not necessarily reflect the views of the publisher.
Guilherme W. S. de Melo thanks for the rich comments and tips of Jiri Zahradnik about the surface waveform modeling, and Fabio Dias for supplying the code to calculate the depth uncertainties. We acknowledge the Resource Allocation Board, Germany for providing computational resources. Computations of thermal models in this study were performed on the supercomputers at NHR@ZIB under the projects SHK00051 and BBP00064. Thank Captain Gilles Ferrand and his crew and the COLMEIA scientific party for their help during the RV COLMEIA cruise. The RV COLMEIA ship time was financed by a grant from the Flotte océanographique française. Financial support for the cruise and preliminary data processing came from CNRS INSU Campagnes à la Mer and Labex Mer. Finally, thank you from our reviewers, David Schlaphorst and Pavla Hrubcová, who provided detailed comments that helped us to clarify some raised points in the text and figures, improving the manuscript.
This research has been supported by the HORIZON EUROPE Marie Sklodowska-Curie Actions (grant no. 101073148) and the European Research Council, HORIZON EUROPE European Research Council (grant no. 101096190).
The article processing charges for this open-access publication were covered by the GEOMAR Helmholtz Centre for Ocean Research Kiel.
This paper was edited by Simone Pilia and reviewed by David Schlaphorst and Pavla Hrubcová.
Abercrombie, R. E. and Ekström, G.: Earthquake slip on oceanic transform faults, Nature, 410, 74–77, https://doi.org/10.1038/35065064, 2001.
Barão, L. M., Trzaskos, B., Angulo, R. J., and de Souza, M. C.: Deformation and structural evolution of mantle peridotites during exhumation on transform faults: A forced transition from ductile to brittle regime, J. Struct. Geol., 133, 103981, https://doi.org/10.1016/j.jsg.2020.103981, 2020.
Behn, M. D., Boettcher, M. S., and Hirth, G.: Thermal structure of oceanic transform faults, Geology, 35, 307–310, https://doi.org/10.1130/G23112A.1, 2007.
Bergman, E. A. and Solomon, S. C.: Transform fault earthquakes in the North Atlantic: Source mechanisms and depth of faulting, J. Geophys. Res. Solid Earth, 93, 9027–9057, https://doi.org/10.1029/JB093iB08p09027, 1988.
Bianchi, M. B., Assumpção, M., Rocha, M. P., Carvalho, J. M., Azevedo, P. A., Fontes, S. L., Dias, F. L., Ferreira, J. M., Nascimento, A. F., Ferreira, M. V., and Costa, I. S.: The Brazilian seismographic network (RSBR): Improving seismic monitoring in Brazil, Seismol. Res. Lett., 89, 452–457, https://doi.org/10.1785/0220170227, 2018.
Bickert, M., Kaczmarek, M. A., Brunelli, D., Maia, M., Campos, T. F., and Sichel, S. E.: Fluid-assisted grain size reduction leads to strain localization in oceanic transform faults, Nat. Commun., 14, 4087, https://doi.org/10.1038/s41467-023-39556-5, 2023.
Bonatti, E.: Serpentinite protrusions in the oceanic crust, Earth Planet. Sci. Lett., 32, 107–113, https://doi.org/10.1016/0012-821X(76)90048-0, 1976.
Bonatti, E.: Subcontinental mantle exposed in the Atlantic Ocean on St Peter–Paul islets, Nature, 345, 800–802, https://doi.org/10.1038/345800a0, 1990.
Bonatti, E., Seyler, M., and Sushevskaya, N.: A cold suboceanic mantle belt at the Earth's equator, Science, 261, 315–320, https://doi.org/10.1126/science.261.5119.315, 1993.
Burr, N. C. and Solomon, S. C.: The relationship of source parameters of oceanic transform earthquakes to plate velocity and transform length, J. Geophys. Res. Solid Earth, 83, 1193–1205, https://doi.org/10.1029/JB083iB03p01193, 1978.
Campos, T. F., Bezerra, F. H., Srivastava, N. K., Vieira, M. M., and Vita-Finzi, C.: Holocene tectonic uplift of the St Peter and St Paul Rocks (Equatorial Atlantic) consistent with emplacement by extrusion, Mar. Geol., 271, 177–186, https://doi.org/10.1016/j.margeo.2010.02.013, 2010.
Campos, T. F., Sichel, S. E., Maia, M., Brunelli, D., Motoki, K., Magini, C., Barão, L. M., Vargas, T., Szatmari, P., Fonseca, E., and de Melo, G. W. S.: The singular St. Peter and St. Paul Archipelago, equatorial Atlantic, Brazil, in: Meso-Cenozoic Brazilian Offshore Magmatism, edited by: Academic Press, https://doi.org/10.1016/B978-0-12-823988-9.00003-4, 121–165, 2022.
Coutant, O.: Program of numerical simulation AXITRA, Res. Rep. LGIT, Université Joseph Fourier, Grenoble, 1989 (in French).
DeMets, C., Gordon, R. G., and Argus, D. F.: Geologically current plate motions, Geophys. J. Int., 181, 1–80, https://doi.org/10.1111/j.1365-246X.2009.04491.x, 2010.
de Melo, G. W. S. and do Nascimento, A. F.: Earthquake magnitude relationships for the Saint Peter and Saint Paul archipelago, equatorial Atlantic, Pure Appl. Geophys., 175, 741–756, https://doi.org/10.1007/s00024-017-1732-6, 2018.
de Melo, G. W. S., Mitchell, N. C., Zahradnik, J., Dias, F., and do Nascimento, A. F.: Oceanic seismotectonics from regional earthquake recordings: the 4–5° N Mid-Atlantic Ridge, Tectonophysics, 819, 229063, https://doi.org/10.1016/j.tecto.2021.229063, 2021.
de Melo, G. W. S., Mitchell, N. C., and Sokolov, S. Y.: The 2020 Mw 6.6 Vernadsky transform earthquake sequence: Rupture and Coulomb stress changes surrounding an oceanic core complex, Mar. Geophys. Res., 45, 28, https://doi.org/10.1007/s11001-024-09558-z, 2024.
de Melo, G. W. S., Grevemeyer, I., Lange, D., Metz, D., and Kopp, H.: Relationship between rupture length and magnitude of oceanic transform fault earthquakes, Geophys. Res. Lett., 52, e2024GL112891, https://doi.org/10.1029/2024GL112891, 2025a.
de Melo, G. W. S., Grevemeyer, I., Liu, S., Maia, M., and Ruepke, L.: Seismicity and thermal structure of the St. Paul Transform System, equatorial Atlantic: Insights from focal depth analysis, Zenodo [data set], https://doi.org/10.5281/zenodo.15204422, 2025b.
Detrick, R. S., White, R. S., and Purdy, G. M.: Crustal structure of North Atlantic fracture zones, Rev. Geophys., 31, 439–458, https://doi.org/10.1029/93RG01952, 1993.
Dias, F., Zahradník, J., and Assumpção, M.: Path-specific, dispersion-based velocity models and moment tensors of moderate events recorded at few distant stations: Examples from Brazil and Greece, J. South Am. Earth Sci., 71, 344–358, https://doi.org/10.1016/j.jsames.2016.07.004, 2016.
Dziewonski, A. M., Chou, T. A., and Woodhouse, J. H.: Determination of earthquake source parameters from waveform data for studies of global and regional seismicity, J. Geophys. Res. Solid Earth, 86, 2825–2852, https://doi.org/10.1029/JB086iB04p02825, 1981.
Ekström, G., Nettles, M., and Dziewoński, A. M.: The global CMT project 2004–2010: Centroid-moment tensors for 13,017 earthquakes, Phys. Earth Planet. Inter., 200, 1–9, https://doi.org/10.1016/j.pepi.2012.04.002, 2012.
Engeln, J. F., Wiens, D. A., and Stein, S.: Mechanisms and depths of Atlantic transform earthquakes, J. Geophys. Res. Solid Earth, 91, 548–577, https://doi.org/10.1029/JB091iB01p00548, 1986.
Escartin, J., Hirth, G., and Evans, B.: Effects of serpentinization on the lithospheric strength and the style of normal faulting at slow-spreading ridges, Earth Planet. Sci. Lett., 151, 181–189, https://doi.org/10.1016/S0012-821X(97)81847-X, 1997.
Escartin, J., Hirth, G., and Evans, B.: Strength of slightly serpentinized peridotites: Implications for the tectonics of oceanic lithosphere, Geology, 29, 1023–1026, https://doi.org/10.1130/0091-7613(2001)029<1023:SOSSPI>2.0.CO;2, 2001.
Fang, H. and Abercrombie, R. E.: SMatStack to enhance noisy teleseismic seismic phases: Validation and application to resolving depths of oceanic transform earthquakes, Geochem. Geophys. Geosyst., 24, e2023GC011109, https://doi.org/10.1029/2023GC011109, 2023.
Feng, M., Assumpção, M., and Van der Lee, S.: Group-velocity tomography and lithospheric S-velocity structure of the South American continent, Phys. Earth Planet. Inter., 147, 315–331, https://doi.org/10.1016/j.pepi.2004.07.008, 2004.
Francis, T. J. G., Porter, I. T., and Lilwall, R. C.: Microearthquakes near the eastern end of St Paul's Fracture Zone, Geophys. J. Int., 53, 201–217, https://doi.org/10.1111/j.1365-246X.1978.tb03738.x, 1978.
Hekinian, R., Juteau, T., Gracia, E., Sichler, B., Sichel, S., Udintsev, G., Apprioual, R., and Ligi, M.: Submersible observations of equatorial Atlantic mantle: The St. Paul Fracture Zone region, Mar. Geophys. Res., 21, 529–560, https://doi.org/10.1023/A:1004819701870, 2000.
Institut de physique du globe de Paris (IPGP) and École et Observatoire des Sciences de la Terre de Strasbourg (EOST): GEOSCOPE, French global network of broad band seismic stations, Institut de physique du globe de Paris (IPGP), Université Paris Cité, https://doi.org/10.18715/GEOSCOPE.G, 1982.
Kim, W. Y., de Melo, G. W. S., and Assumpcão, M.: A Pn magnitude scale mb (Pn) for earthquakes along the equatorial Mid-Atlantic Ridge, Geophys. J. Int., 238, 1696–1707, https://doi.org/10.1093/gji/ggae242, 2024.
Laske, G., Masters, G., Ma, Z., and Pasyanos, M.: Update on CRUST1.0—A 1-degree global model of Earth's crust, Geophys. Res. Abstr., 15, 2658, 2013.
Le Voyer, M., Cottrell, E., Kelley, K. A., Brounce, M., and Hauri, E. H.: The effect of primary versus secondary processes on the volatile content of MORB glasses: An example from the equatorial Mid-Atlantic Ridge (5° N–3° S), J. Geophys. Res. Solid Earth, 120, 125–144, https://doi.org/10.1002/2014JB011160, 2015.
Leptokaropoulos, K., Rychert, C. A., Harmon, N., Schlaphorst, D., Grevemeyer, I., Kendall, J. M., and Singh, S. C.: Broad fault zones enable deep fluid transport and limit earthquake magnitudes, Nat. Commun., 14, 5748, https://doi.org/10.1038/s41467-023-41403-6, 2023.
Liu, S., Guo, Z., Rüpke, L. H., Morgan, J. P., Grevemeyer, I., Ren, Y., and Li, C.: Sensitivity of gravity anomalies to mantle rheology at mid-ocean ridge–transform fault systems, Earth Planet. Sci. Lett., 622, 118420, https://doi.org/10.1016/j.epsl.2023.118420, 2023.
Maia, M., Sichel, S., Briais, A., Brunelli, D., Ligi, M., Ferreira, N., Campos, T., Mougel, B., Brehme, I., Hémond, C., Motoki, A., Moura, D., Scalabrin, C., Pessanha, I., Alves, E., Ayres, A., and Oliveira, P.: Extreme mantle uplift and exhumation along a transpressive transform fault, Nat. Geosci., 9, 619–623, https://doi.org/10.1038/ngeo2759, 2016.
Melson, W. G., Jarosewich, E., Bowen, V. T., and Thompson, G.: St. Peter and St. Paul Rocks: A high-temperature, mantle-derived intrusion, Science, 155, 1532–1535, https://doi.org/10.1126/science.155.3769.1532, 1967.
Morgan, J. P. and Forsyth, D. W.: Three-dimensional flow and temperature perturbations due to a transform offset: Effects on oceanic crustal and upper mantle structure, J. Geophys. Res. Solid Earth, 93, 2955–2966, https://doi.org/10.1029/JB093iB04p02955, 1988.
Pan, J. and Dziewonski, A. M.: Comparison of mid-oceanic earthquake epicentral differences of travel time, centroid locations, and those determined by autonomous underwater hydrophone arrays, J. Geophys. Res. Solid Earth, 110, B07302, https://doi.org/10.1029/2003JB002785, 2005.
Pan, J., Antolik, M., and Dziewonski, A. M.: Locations of mid-oceanic earthquakes constrained by seafloor bathymetry, J. Geophys. Res. Solid Earth, 107, EPM-8, https://doi.org/10.1029/2001JB001588, 2002.
Parnell-Turner, R., Smith, D. K., and Dziak, R. P.: Hydroacoustic monitoring of seafloor spreading and transform faulting in the equatorial Atlantic Ocean, J. Geophys. Res. Solid Earth, 127, B024008, https://doi.org/10.1029/2022JB024008, 2022.
Prigent, C., Warren, J. M., Kohli, A. H., and Teyssier, C.: Fracture-mediated deep seawater flow and mantle hydration on oceanic transform faults, Earth Planet. Sci. Lett., 532, 115988, https://doi.org/10.1016/j.epsl.2019.115988, 2020.
Ren, Y., Geersen, J., and Grevemeyer, I.: Impact of spreading rate and age‐offset on oceanic transform fault morphology, Geophys. Res. Lett., 49, e2021GL096170, https://doi.org/10.1029/2021GL096170, 2022.
Ren, Y., Lange, D., and Grevemeyer, I.: Seismotectonics of the Blanco transform fault system, northeast Pacific: Evidence for an immature plate boundary, J. Geophys. Res. Solid Earth, 128, e2022JB026045, https://doi.org/10.1029/2022JB026045, 2023.
Roland, E., Behn, M. D., and Hirth, G.: Thermal-mechanical behavior of oceanic transform faults: Implications for the spatial distribution of seismicity, Geochem. Geophys. Geosyst., 11, Q07001, https://doi.org/10.1029/2010GC003034, 2010.
Romanowicz, B., Cara, M., Fel, J. F., and Rouland, D.: GEOSCOPE: A French initiative in long-period three-component global seismic networks, Eos Trans. AGU, 65, 753, https://doi.org/10.1029/EO065i042p00753-01, 1984.
Ryan, W. B., Carbotte, S. M., Coplan, J. O., O'Hara, S., Melkonian, A., Arko, R., Weissel, R. A., Ferrini, V., Goodwillie, A., Nitsche, F., Bonczkowski, J., and Zemsky, R.: Global multi-resolution topography synthesis, Geochem. Geophys. Geosyst., 10, Q03014, https://doi.org/10.1029/2008GC002332, 2009.
Sautter, B., Escartin, J., Petersen, S., Gaina, C., Granot, R., and Pubellier, M.: MAPRIDGES: Global database of Mid-Oceanic ridges segments and transform faults, SEANOE, https://doi.org/10.17882/99981, 2024.
Schilling, J. G., Ruppel, C., Davis, A. N., McCully, B., Tighe, S. A., Kingsley, R. H., and Lin, J.: Thermal structure of the mantle beneath the equatorial Mid-Atlantic Ridge: Inferences from the spatial variation of dredged basalt glass compositions, J. Geophys. Res. Solid Earth, 100, 10057–10076, https://doi.org/10.1029/95JB00668, 1995.
Schlaphorst, D., Rychert, C. A., Harmon, N., Hicks, S. P., Bogiatzis, P., Kendall, J. M., and Abercrombie, R. E.: Local seismicity around the Chain Transform Fault at the Mid-Atlantic Ridge from OBS observations, Geophys. J. Int., 234, 1111–1124, https://doi.org/10.1093/gji/ggad124, 2023.
Scripps Institution of Oceanography: IRIS/IDA seismic networkm International Federation of Digital Seismograph Networks [data set], https://doi.org/10.7914/SN/II, 1986.
Shi, P., Wei, M., and Pockalny, R. A.: The ubiquitous creeping segments on oceanic transform faults, Geology, 50, 199–204, https://doi.org/10.1130/G49562.1, 2022.
Sokos, E. N. and Zahradnik, J.: ISOLA a Fortran code and a Matlab GUI to perform multiple-point source inversion of seismic data, Comput. Geosci., 34, 967–977, https://doi.org/10.1016/j.cageo.2007.07.005, 2008.
The MathWorks Inc.: MATLAB version: 9.6 (R2019a) [software], The MathWorks Inc., https://www.mathworks.com (last access: February 2025), 2019.
Turcotte, D. and Schubert, G.: Geodynamics, 3rd edn., Cambridge University Press, Cambridge, https://doi.org/10.1017/CBO9780511843877, 2014.
Vincent, C., Maia, M., Briais, A., Brunelli, D., Ligi, M., and Sichel, S.: Evolution of a cold intra-transform ridge segment through oceanic core complex splitting and mantle exhumation, St. Paul Transform System, equatorial Atlantic, Geochem. Geophys. Geosyst., 24, e2023GC010870, https://doi.org/10.1029/2023GC010870, 2023.
Wessel, P., Luis, J. F., Uieda, L. A., Scharroo, R., Wobbe, F., Smith, W. H., and Tian, D.: The Generic Mapping Tools version 6, Geochem. Geophys. Geosyst., 20, 5556–5564, https://doi.org/10.1029/2019GC008515, 2019.
Weston, J., Engdahl, E. R., Harris, J., Di Giacomo, D., and Storchak, D. A.: ISC-EHB: reconstruction of a robust earthquake data set, Geophys. J. Int., 214, 474–484, https://doi.org/10.1093/gji/ggy155, 2018.
Wolfe, C. J., Bergman, E. A., and Solomon, S. C.: Oceanic transform earthquakes with unusual mechanisms or locations: Relation to fault geometry and state of stress in the adjacent lithosphere, J. Geophys. Res. Solid Earth, 98, 16187–16211, https://doi.org/10.1029/93JB00887, 1993.
Zahradník, J. and Sokos, E.: ISOLA code for multiple-point source modeling, in: Moment tensor solutions: A useful tool for seismotectonics, Springer, https://doi.org/10.1007/978-3-319-77359-9_1, 1–28, 2018.