the Creative Commons Attribution 4.0 License.
the Creative Commons Attribution 4.0 License.
 | 23 Oct 2025
2D seismic imaging of the Koillismaa Layered Igneous Complex, north-eastern Finland
Andrzej Górszczyk
Michał Malinowski
Suvi Heinonen
Uula Autio
Tuomo Karinen
Marek Wojdyła
The Seismic and Electromagnetics Methods for Deep mineral exploration (SEEMS DEEP) project is associated with the Koillismaa Layered Igneous Complex (KLIC) in north-eastern Finland. The KLIC is characterized by a Bouguer positive gravity and magnetic anomaly zone connecting the two exposed ends of the KLIC, i.e. the Koillismaa intrusion and the Näränkävaara intrusion. The KLIC has the potential to host several critical raw minerals like nickel and cobalt, which are in the European Union's critical raw material list. For this purpose, two reflection seismic profiles were acquired to map the regional reflectivity in the area with a focus on imaging the large-scale geological architecture of the KLIC and the associated mineralization. Seismic imaging delineated reflectivity up to a depth of approximately 5 to 6 km with several distinctive reflective packages at various depths representative of the presence of dykes, faults, and major lithological contacts in the area. Symmetrical orientation of several shallow reflectors indicates systematic fracturing in the area. The deep-seated magma conduit associated with the KLIC was successfully mapped, revealing a complex internal structure with more structural or compositional heterogeneity than was previously assumed to be formed from a single lithological unit. The magma conduit is characterised as a vertically extensive mafic–ultramafic package with the potential of hosting orthomagmatic critical raw material deposits of mostly Ni-Cu-PGE sulphide type. A system of overthrust – steep regional faults was imaged for the first time in the western part of the study area. It is interpreted that such steep fault systems might have played a key role in magma emplacement by acting as pathways for ascending melts and mineralising fluids. Results were compared against the available petrophysical data and a preliminary geological model based on the density model obtained from the gravity inversion with constraints from the drillhole data.
- Article
(13139 KB) - Full-text XML
- BibTeX
- EndNote


The demand for raw materials has increased rapidly in recent times for various reasons: high-tech solutions, developing green energy, push towards a carbon-neutral society, sustainability, etc. (European Commission, 2023). As a result, there is a growing need to explore new and deeper targets to maintain the balance between supply and demand. Ore deposits associated with mafic to ultramafic igneous rocks hold great potential to fulfil this requirement, e.g., sulphide deposits, chromite deposits, carbon mineralization, etc. (Ripley and Li, 2018). The Koillismaa Layered Igneous Complex (KLIC) has been of interest among geologists for several decades due to its potential to host critical raw materials (Alapieti, 1982; Karinen, 2010). The rocks of similar lithologies worldwide were found to be rich in Ni-Cu-Co-PGE and Cr-V-Ti-Fe type deposits (Barnes et al., 2016; Schulz et al., 2014). Many of the associated elements, such as nickel, copper, cobalt, lithium, titanium, vanadium, etc., are in the European Union's strategic raw material list (EU Critical Raw Materials Act, 2024).
The KLIC is composed of two exposed mafic–ultramafic layered intrusions, i.e. the Koillismaa intrusion in the west and the Näränkävaara intrusion in the east (Fig. 1). These intrusions are linked by a high gravity and magnetic anomaly zone: the Koillismaa Deep Anomaly (KDA), which has been recognized since the earliest ground gravimetric and airborne geophysical measurements conducted in the 1950s (Karinen, 2010; Salmirinne and Iljina, 2003). In 2018, the Geological Survey of Finland (GTK) acquired a low-fold 2D seismic profile in the Koillismaa area delineating a weak reflectivity at ∼ 1.3 km and a stronger reflectivity at ∼ 3.3 km depth which were tentatively interpreted as the top and bottom of the intrusion (Fig. 2, KOSE2018 profile, Gislason et al., 2019). In 2020, GTK's Koillismaa deep drillhole project confirmed the presence of the mafic–ultramafic plutonic rocks at a depth of ∼ 1.4 km from the surface. A deep-seated magma conduit system which connects the exposed intrusions of the complex, i.e. the Koillismaa Intrusion and the Näränkävaara Intrusion was inferred (Karinen et al., 2021b; Tirronniemi et al., 2024). This makes KLIC an interesting area to be studied in greater detail.
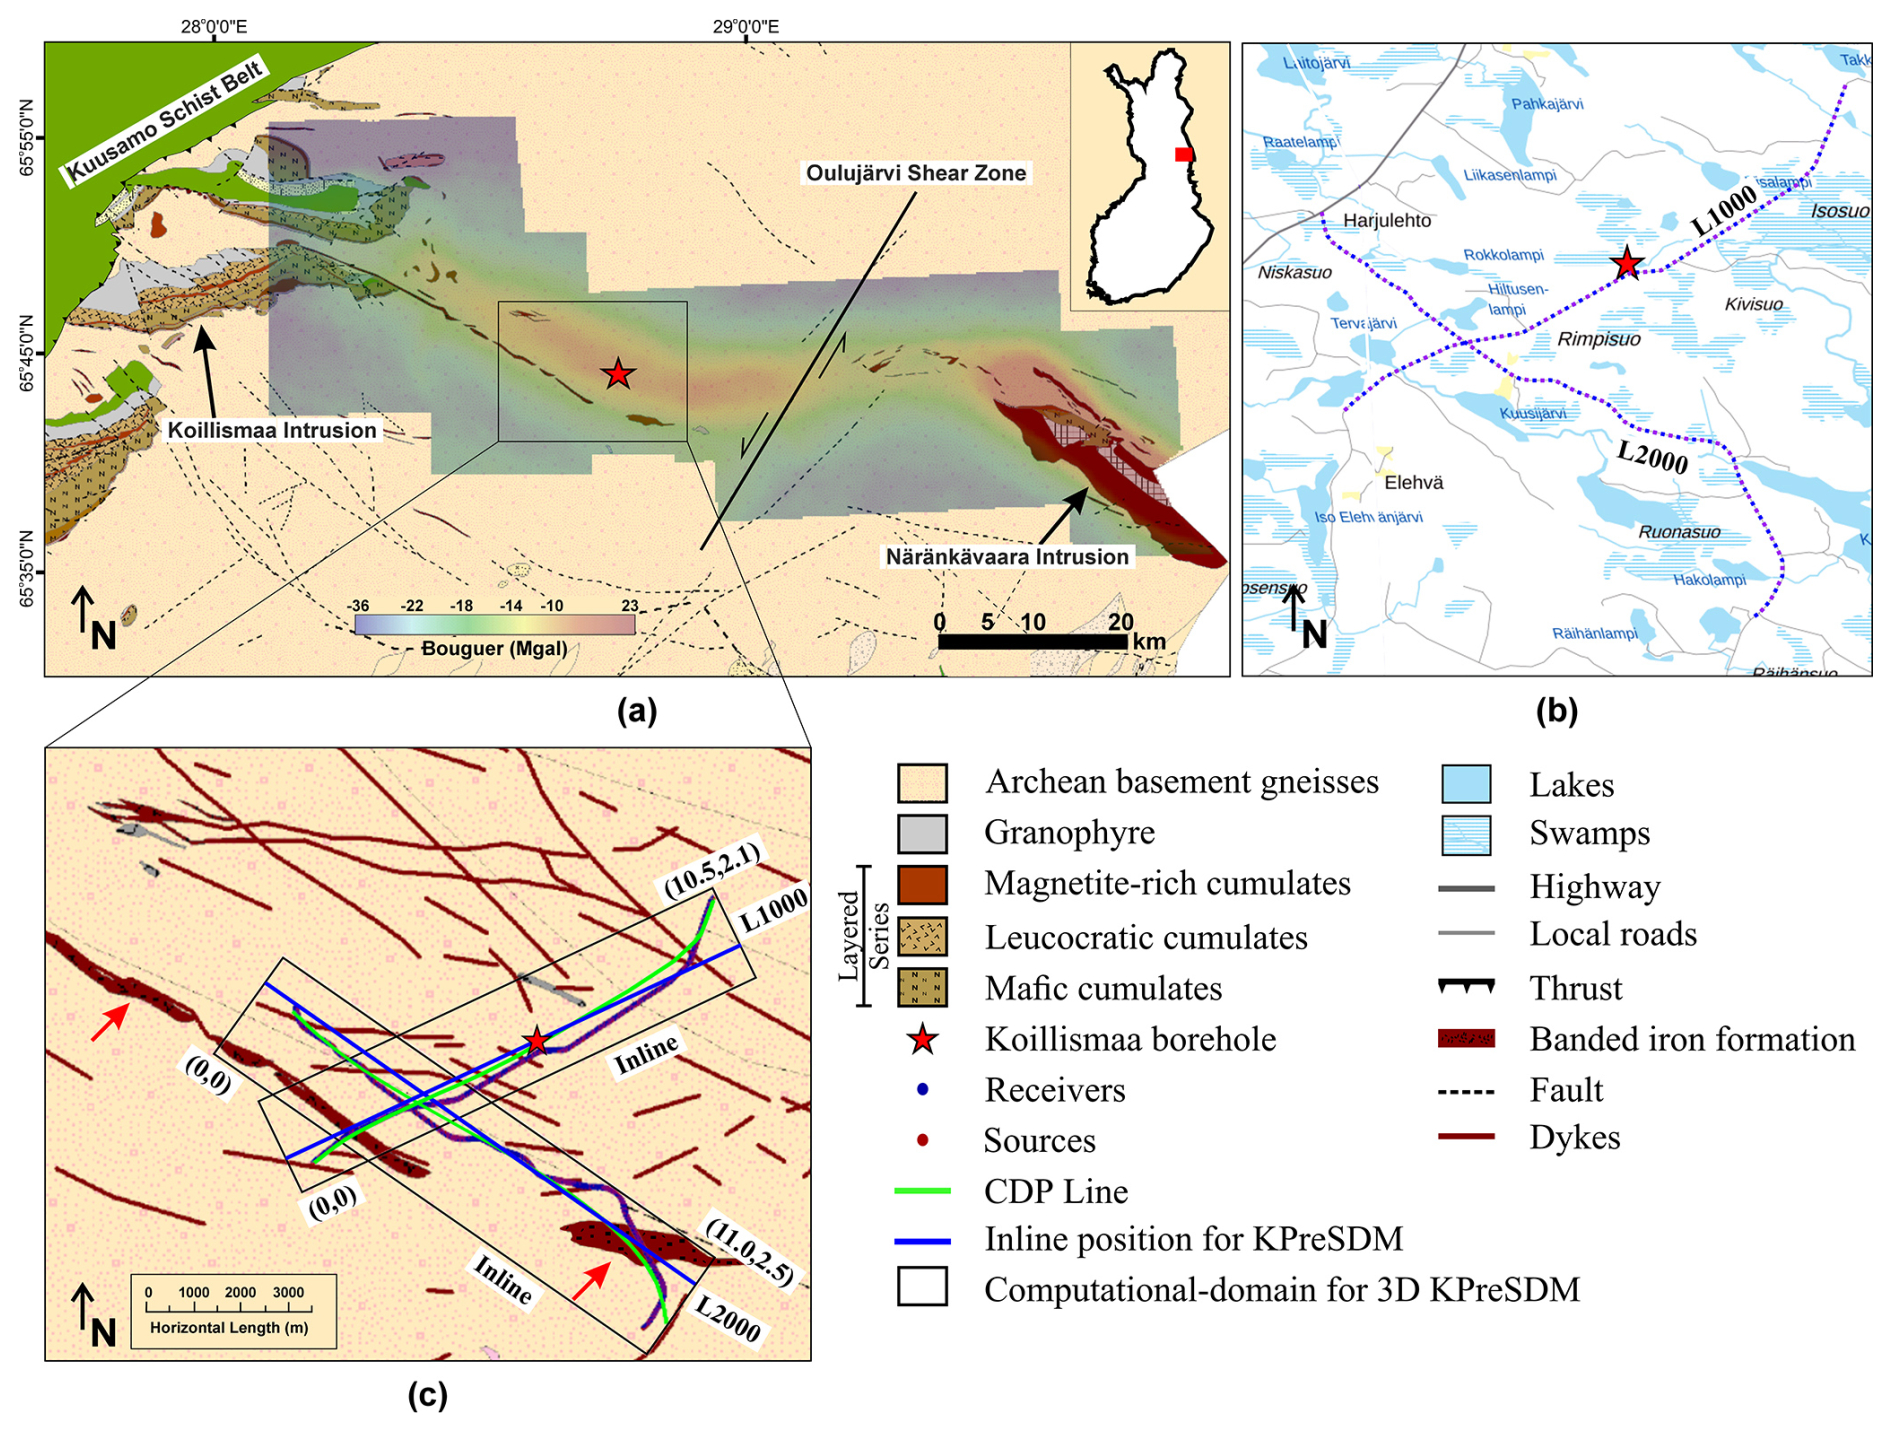
Figure 1(a) Generalized geological map of the KLIC with the Koillismaa intrusion in the west and the Näränkävaara intrusion in the east (Geological map is from “Bedrock of Finland v2.3 at the scale 1:200 000”; Bedrock of Finland, 2019). The study area is indicated by the red rectangle on the map of Finland in the top-right inset (© Google Maps). A Bouguer gravity anomaly map is overlaid over the geological map. The red star marks the Koillismaa drillhole. (b) Seismic profiles (L1000 and L2000) overlaid on the topographic map. (c) Acquisition profiles overlaid over the geological map. Purple and blue dots mark the position of the shotpoints and receivers, respectively. The green lines show the processing lines (CDP binning line) for each profile. The black boxes show the computational domain for depth migration (in km). The blue lines indicate the position of the inline at which the results from Kirchhoff prestack depth migration (KPreSDM) are shown in Figs. 5c and 6b. Red arrows mark the banded iron formations (BIFs).
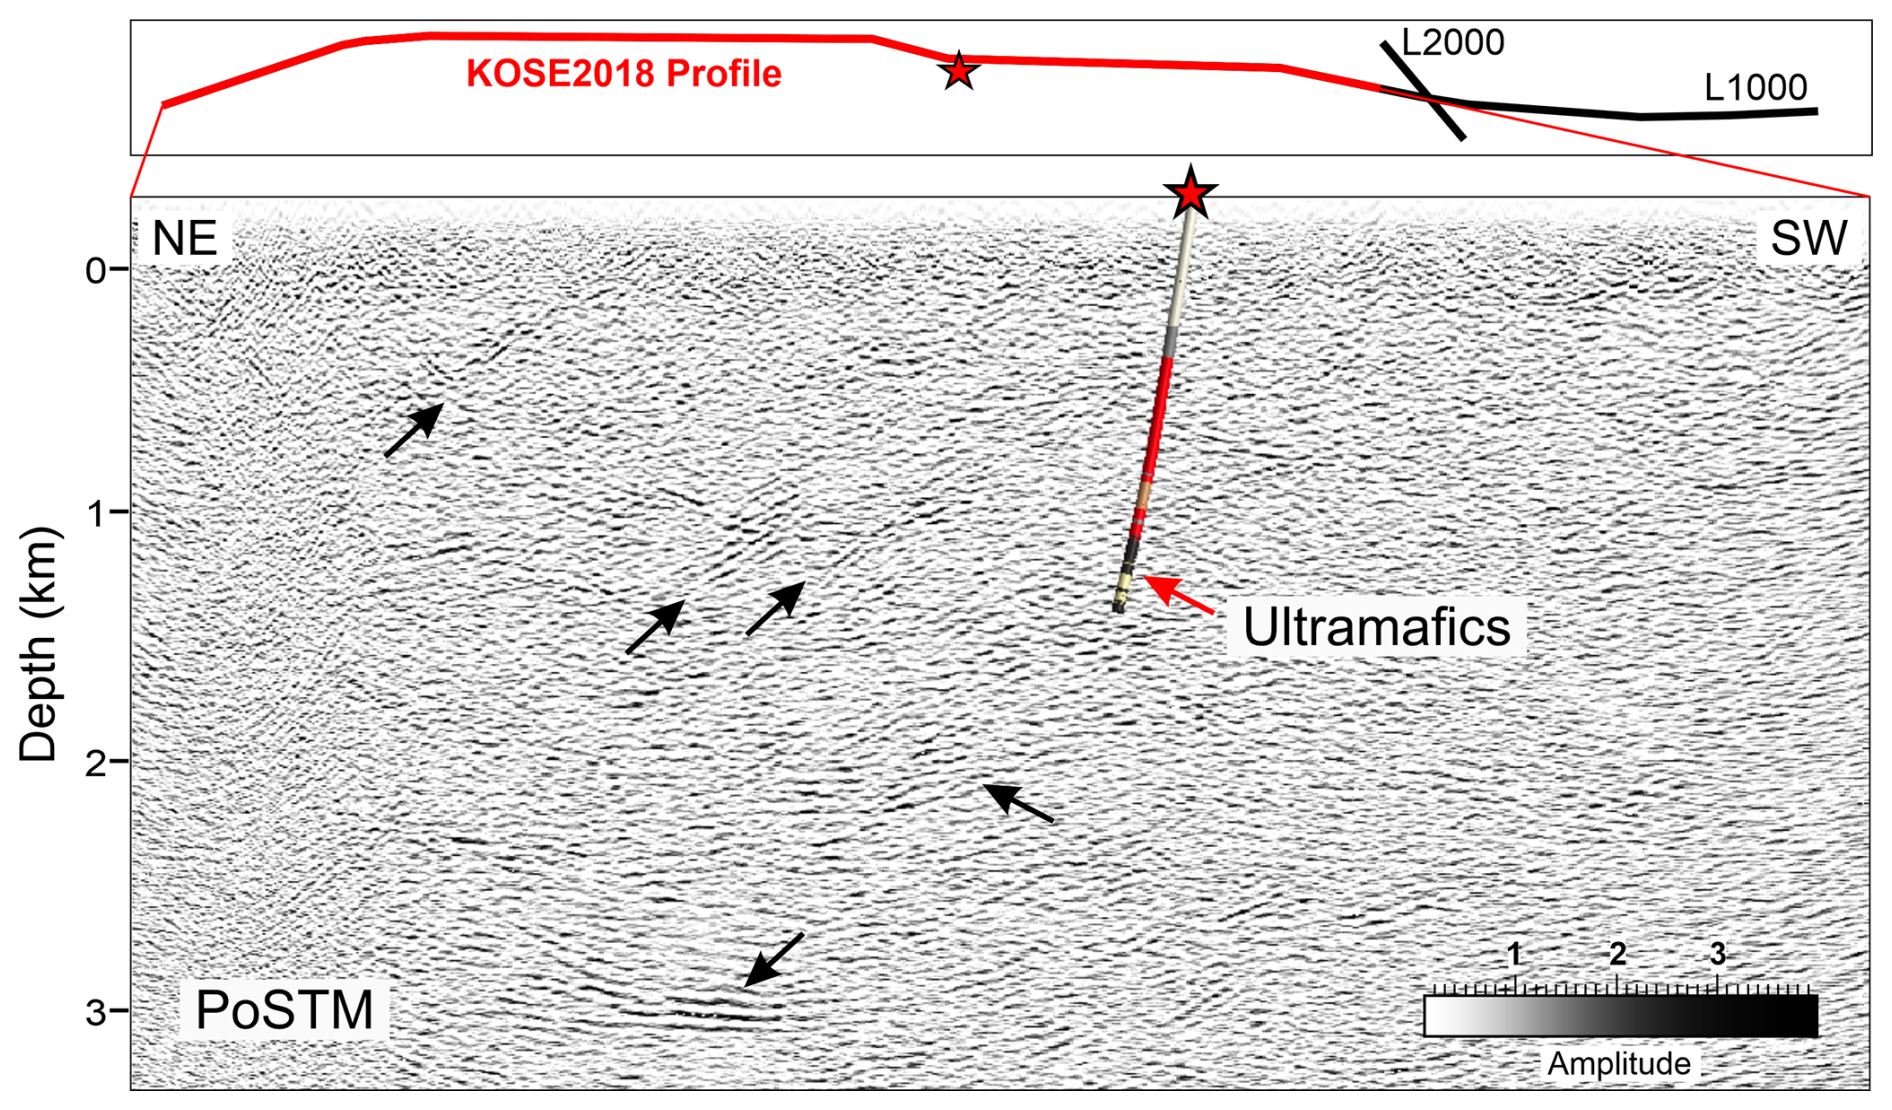
Figure 2KOSE2018 2D seismic profile (Gislason et al., 2019). The top panel shows the map view of the overlapping KOSE2018 profile (red) with the SEEMS DEEP profile L1000 (in black). Black arrows in the bottom panel mark different reflectors mapped in the area (compare with Fig. 5b). The drillhole is plotted for different lithologies based on the analysis of Koillismaa drill core data (red star, Fig. 1). The lithology for the same is also shown in Fig. 3e.
Geophysical surveys for mineral exploration have been routinely accomplished by potential field methods, electromagnetics, electrical methods, etc., but those methods lack higher resolution at deeper depths required to distinguish different lithologies. In comparison, seismic reflection surveys can provide higher-resolution images of the subsurface and have now emerged as an established method for deep mineral exploration in the hardrock environment (also called crystalline environment) (Malehmir et al., 2012). In this regard, three-dimensional (3D) surveys are often conducted for detailed mapping of the mineralization, whereas two-dimensional (2D) surveys are an excellent choice for affordable regional assessment (Bellefleur et al., 2015; Cheraghi et al., 2020; Milkereit et al., 2000; Nedimović and West, 2003 and references therein). 2D surveys are also valuable for the initial seismic assessment of the area and can form a basis for the development of a full-scale 3D survey. 2D surveys are cheaper, faster, and logistically simpler than 3D surveys (Malehmir et al., 2017; Markovic et al., 2020), but one has to be careful when interpreting 2D profiles crossing complex 3D geology.
The SEEMS DEEP project (2022–2025) was funded under the ERA-MIN3 consortium to study the underlying geological setting of the KLIC in greater detail using an integrated approach of seismics and electromagnetic methods (Autio et al., 2024). Apart from being a method-development playground, the project aims to improve our understanding of the geology of the Koillismaa area. Within this aim, two regional crooked 2D reflection seismic profiles were acquired in August 2023 in the vicinity of the Koillismaa drillhole along with a 3D seismic survey (see details in Malinowski et al., 2025). The main objectives of the 2D seismic survey were: (i) mapping the regional seismic reflectivity in the area, (ii) imaging of the large-scale geometrical architecture of the magma conduit associated with the KLIC, (iii) to obtain a first-order information on the mineralization potential of KLIC, and (iv) to provide a constrain on the geometrical nature of the KLIC beyond the coverage of the 3D survey. In this article, we will discuss the results for the first three objectives supported by the petrophysical data and the a priori geological model available in the study area.
The Fennoscandian Shield hosts numerous ∼ 2.51–2.43 Ga mafic–ultramafic layered intrusions which were formed during the magmatism associated with an extensional phase that led to the breakup of Archaean cratons (Bleeker and Ernst, 2006; Ciborowski et al., 2015; Heaman, 1997; Köykkä et al., 2022; Skyttä et al., 2019). In Finland, the ∼ 2.44 Ga Tornio–Näränkävaara Belt (TNB; Alapieti and Lahtinen, 2002), representing the ∼ 2.51–2.43 Ga intrusions is considered of high economic interest with a continuous history of mineral exploration and mining from much of the 20th century to the present day. The TNB is located along the contact zone between the basement and the overlying Palaeoproterozoic greenstone and schist belts extending from the Finnish–Swedish border to the Finnish–Russian border. The KLIC belongs to the TNB, and it is composed of two exposed intrusions, the Koillismaa Intrusion in the west and the Näränkävaara Intrusion in the east (Fig. 1). The Koillismaa intrusion was emplaced into the boundary between the Archaean basement and the overlying Kuusamo Schist Belt (KSB) (top-left corner, Fig. 1a; Köykkä et al., 2022). The intrusion is composed of mafic–ultramafic cumulates and was later tectonically dismembered into distinct blocks which are now mostly oriented in an E–W direction (Karinen, 2010). The Näränkävaara intrusion is surrounded by the Archean gneiss and has largely retained its original position. The intrusion is mostly composed of ultramafic cumulates (Järvinen et al., 2020). These two exposed intrusions are linked to each other by a ∼ 50 km long positive gravity and magnetic anomaly (Karinen, 2010; Salmirinne and Iljina, 2003). Previous interpretations of the observed Bouguer anomaly suggested a tubular/funnel-shaped intrusion (magma conduit) of about ∼ 2.5–4 km in width, and the depth from the top at ∼ 1–2 km (Salmirinne and Iljina, 2003).
The study area is mostly located within the Archaean basement. The southern part of the area is characterised by a narrow belt of banded iron formations (BIFs) marked by the red arrows in Fig. 1c (Makkonen, 1972). These lithologies may be related to the Archaean greenstone rocks known east of the study area (Järvinen et al., 2023). A major NE–SW trending sinistral Oulujärvi Shear Zone (OSZ) crosscuts the study area (Fig. 1a) (Kärki and Laajoki, 1995). There is also the presence of multiple diabase dykes which are likely intruded along the fractures and faults present in the study area. According to these studies, the surface bedrock geology at the Koillismaa study site is primarily composed of homogeneous orthogneisses, cross-cutting diabase dykes and a narrow belt of banded iron formations. The magma conduit at depth is characterized by the mafic–ultramafic rocks such as peridotites, pyroxenites, and gabbronorites (see Fig. 3e).
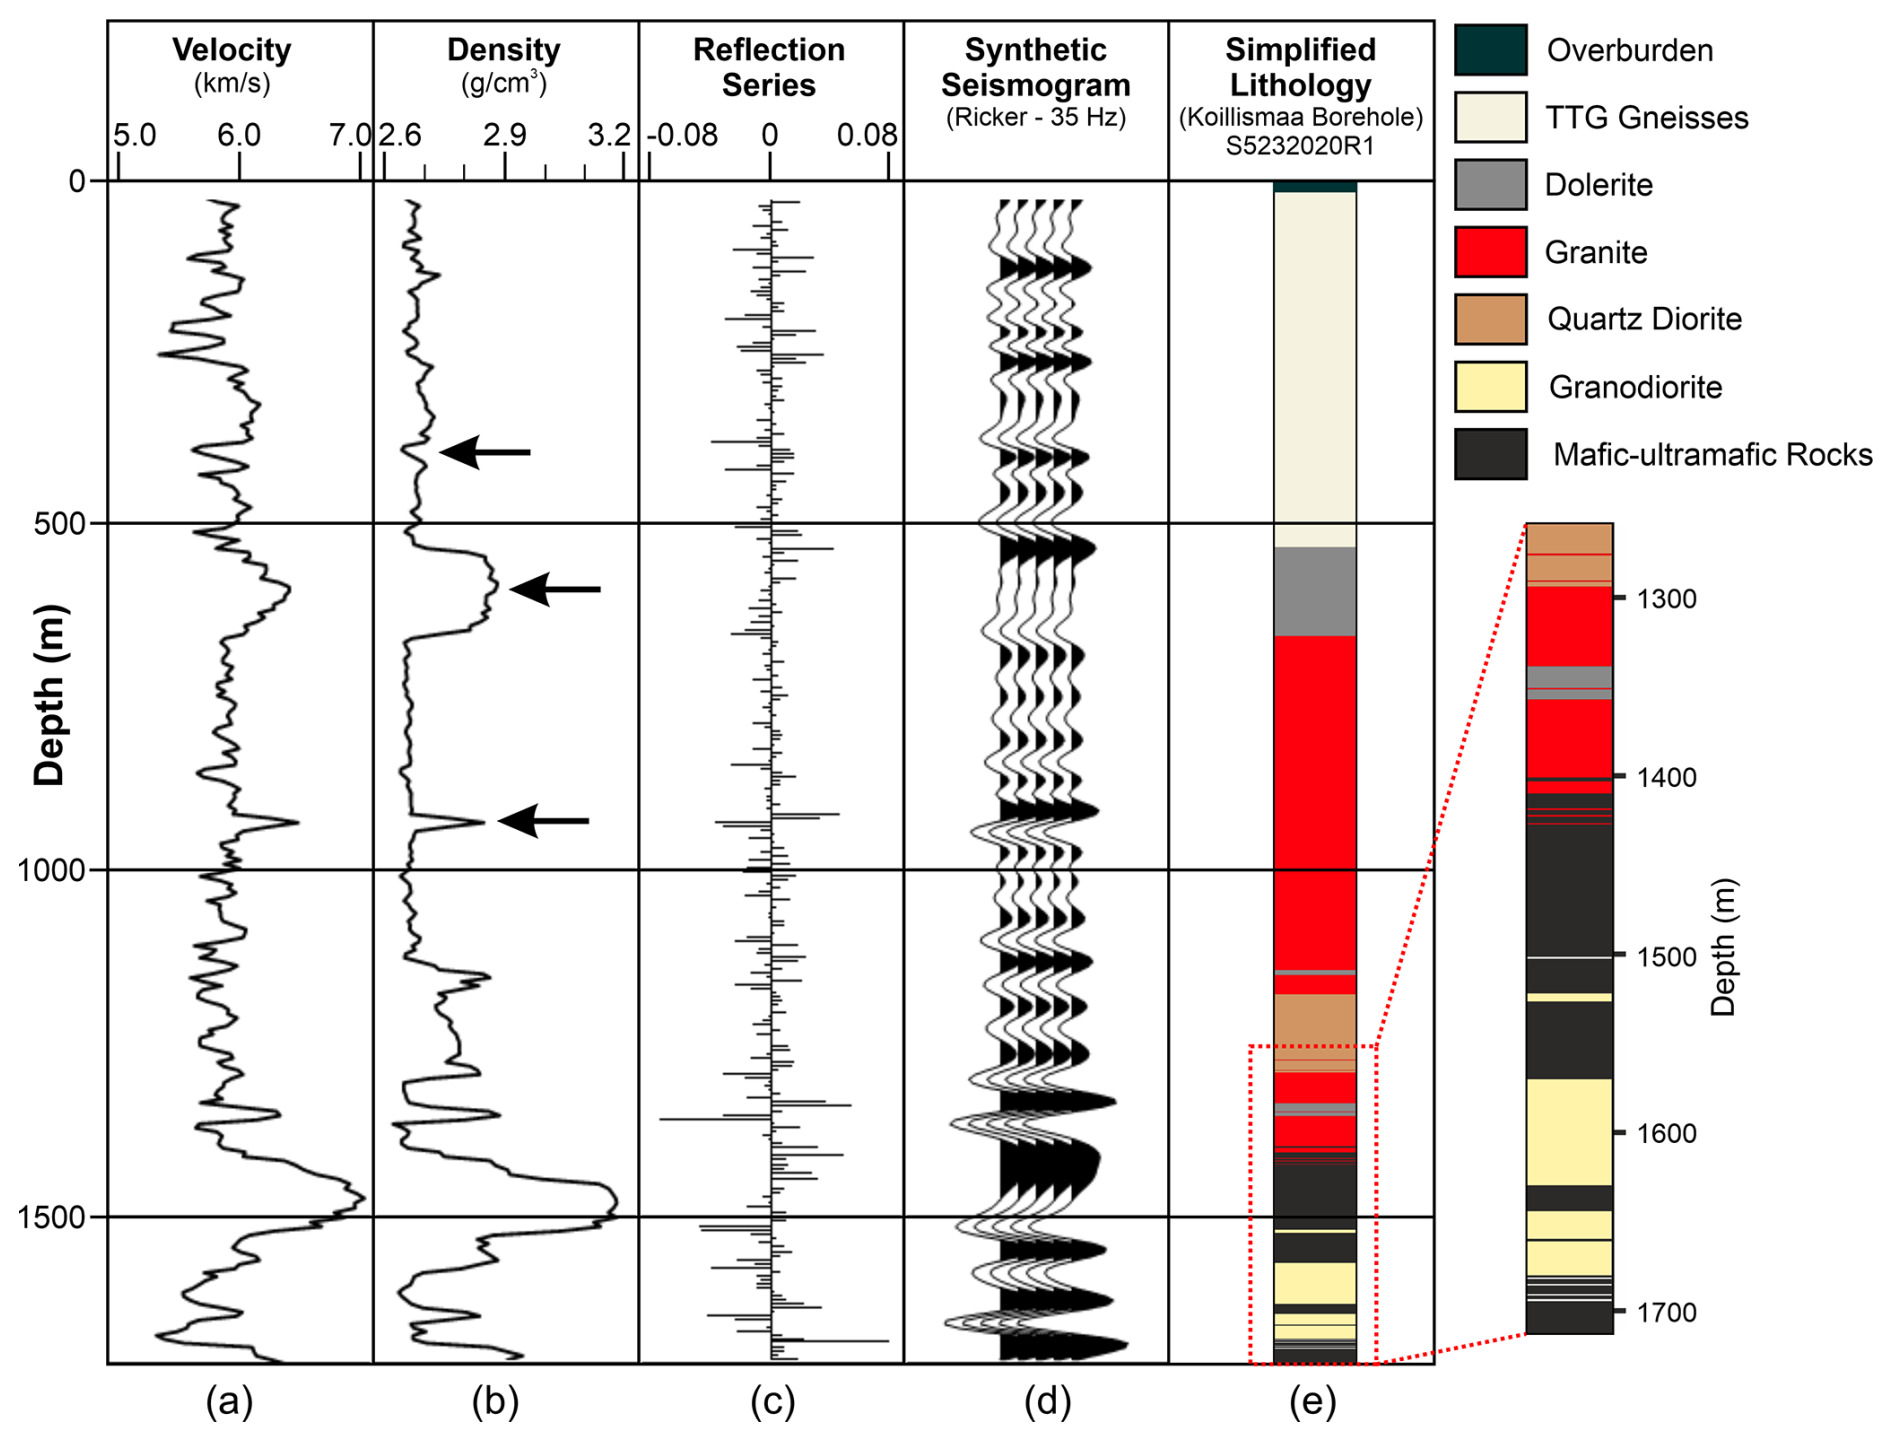
Figure 3Panels (a), (b) and (c) show plot of P-wave velocity, density and reflection coefficient series based on the laboratory measurements on core samples from the Koillismaa drillhole (red star, Fig. 1), (d) synthetic seismogram produced using a Ricker wavelet with dominant frequency 35 Hz highlighting the acoustic impedance contrast between different lithologies, (e) simplified lithology of the drilhole (same as in Fig. 2). Drilling shows the surface bedrock geology to be composed of homogenous orthogneisses, cross-cutting dykes and the magma conduit characterized by the mafic–ultramafic rocks at an approx. depth of 1.4 km from the surface. Black arrows in panel (b) mark the events for which reflectivity was observed in the walkaway VSP study done in the drillhole.
As part of the siting study before the deep research drilling project, GTK acquired a low-fold 2D seismic profile in the KDA area in 2018. The seismic survey profile named KOSE2018 partially overlapped profile L1000 acquired under the SEEMS DEEP project (top panel, Fig. 2). The survey delineated the top of the intrusion at ∼ 1.3 km as a weak reflector and the bottom at ∼ 3.3 km in depth with stronger reflectivity (Gislason et al., 2019). In 2020–2021, a drillhole approximately 1724 m deep from the surface was drilled next to the KOSE2018 survey profile (red star in Fig. 1, drillhole shown in Figs. 2 and 3) confirming the presence of the ultramafic rocks at a depth of more than ∼ 1.4 km (Karinen et al., 2021b; Tirronniemi et al., 2024). This verified the presence of a deep-seated magma conduit system connecting the exposed intrusions of the complex (Karinen et al., 2021a). Extensive petrophysical and lab studies were performed on the collected drill core samples and classifications were made for different lithologies and rock types (Heinonen et al., 2022; Nousiainen et al., 2022). Recent age determinations of these mafic–ultramafic lithologies confirm that the magma conduit corresponds to the same ∼ 2.44 Ga magmatic event as the Koillismaa and Näränkävaara intrusions (Karinen et al., 2025).
A plot of P-wave velocity, density, reflection coefficient series and the corresponding synthetic seismogram is shown in Fig. 3a–d. The synthetic seismogram is produced by convolving the reflection coefficients with the 35 Hz dominant frequency Ricker wavelet to obtain the seismic response from the key geological units from the drillhole. A simplified lithology of the drillhole is shown in Fig. 3e (red star in Figs. 1 and 2). Average seismic P-wave velocities for mafic–ultramafic rocks range from approximately 5.5 to 6.5 km s−1, and densities range from ∼ 2800 to 3200 kg m−3, based on core samples measured under room temperature and pressure conditions. A clear acoustic impedance contrast was observed between the ultramafic and the overlying felsic rocks with several cross-cutting diabase veins in the vicinity of the drill hole (see synthetic seismogram, Fig. 3d). Some of the events, e.g. fault/fracture zones, dolerite, lithology changes, etc., were imaged during the walkaway vertical seismic profiling (VSP) survey conducted in the same drillhole (Malinowski et al., 2023; Tirronniemi et al., 2024). These events are marked by black arrows in Fig. 3b, e.g. fault/fracture zone at ∼ 400 m (Mylorite), the top and the bottom of the Dolerite (∼ 550–650 m) and the lithology changes at c.a. 900 m (Schist (altered Diabase)). A preliminary geological model was created based on the density model from the gravity inversion with constraints from existing drilling data.
The dataset comprises two crooked regional-reflection seismic profiles acquired along existing gravel roads (see map in Fig. 1b). The first profile (L1000) is ∼ 10.5 km long and is oriented in the NE-SW direction, and the second profile (L2000) is ∼ 11.5 km long and is oriented in the NW-SE direction (see Fig. 1a and c). Both profiles have a uniform receiver spacing of 15 m and shot spacing of 30 m. Blue dots mark receivers and purple dots mark shots overlapping the receiver points. Geospace's GS-ONE – low-frequency, three-component (GSB3-3C) land geophones with a natural frequency of 5 Hz were used in a continuous mode for both profiles. A 22 t Mark IV Vibroseis truck (48 000 lbs peak force) was used as the source. All the acquisition parameters related to the survey are summarised in Table 1. The acquired data are of good quality with reflections visible in the raw shot gathers (Fig. 4, red arrows). The data is of better quality for shotpoints located in the southern and western end of the survey where the first-break energy is visible for the full-offset range. For the remaining shotpoints, clear first breaks are generally limited to approximately 4–5 km.
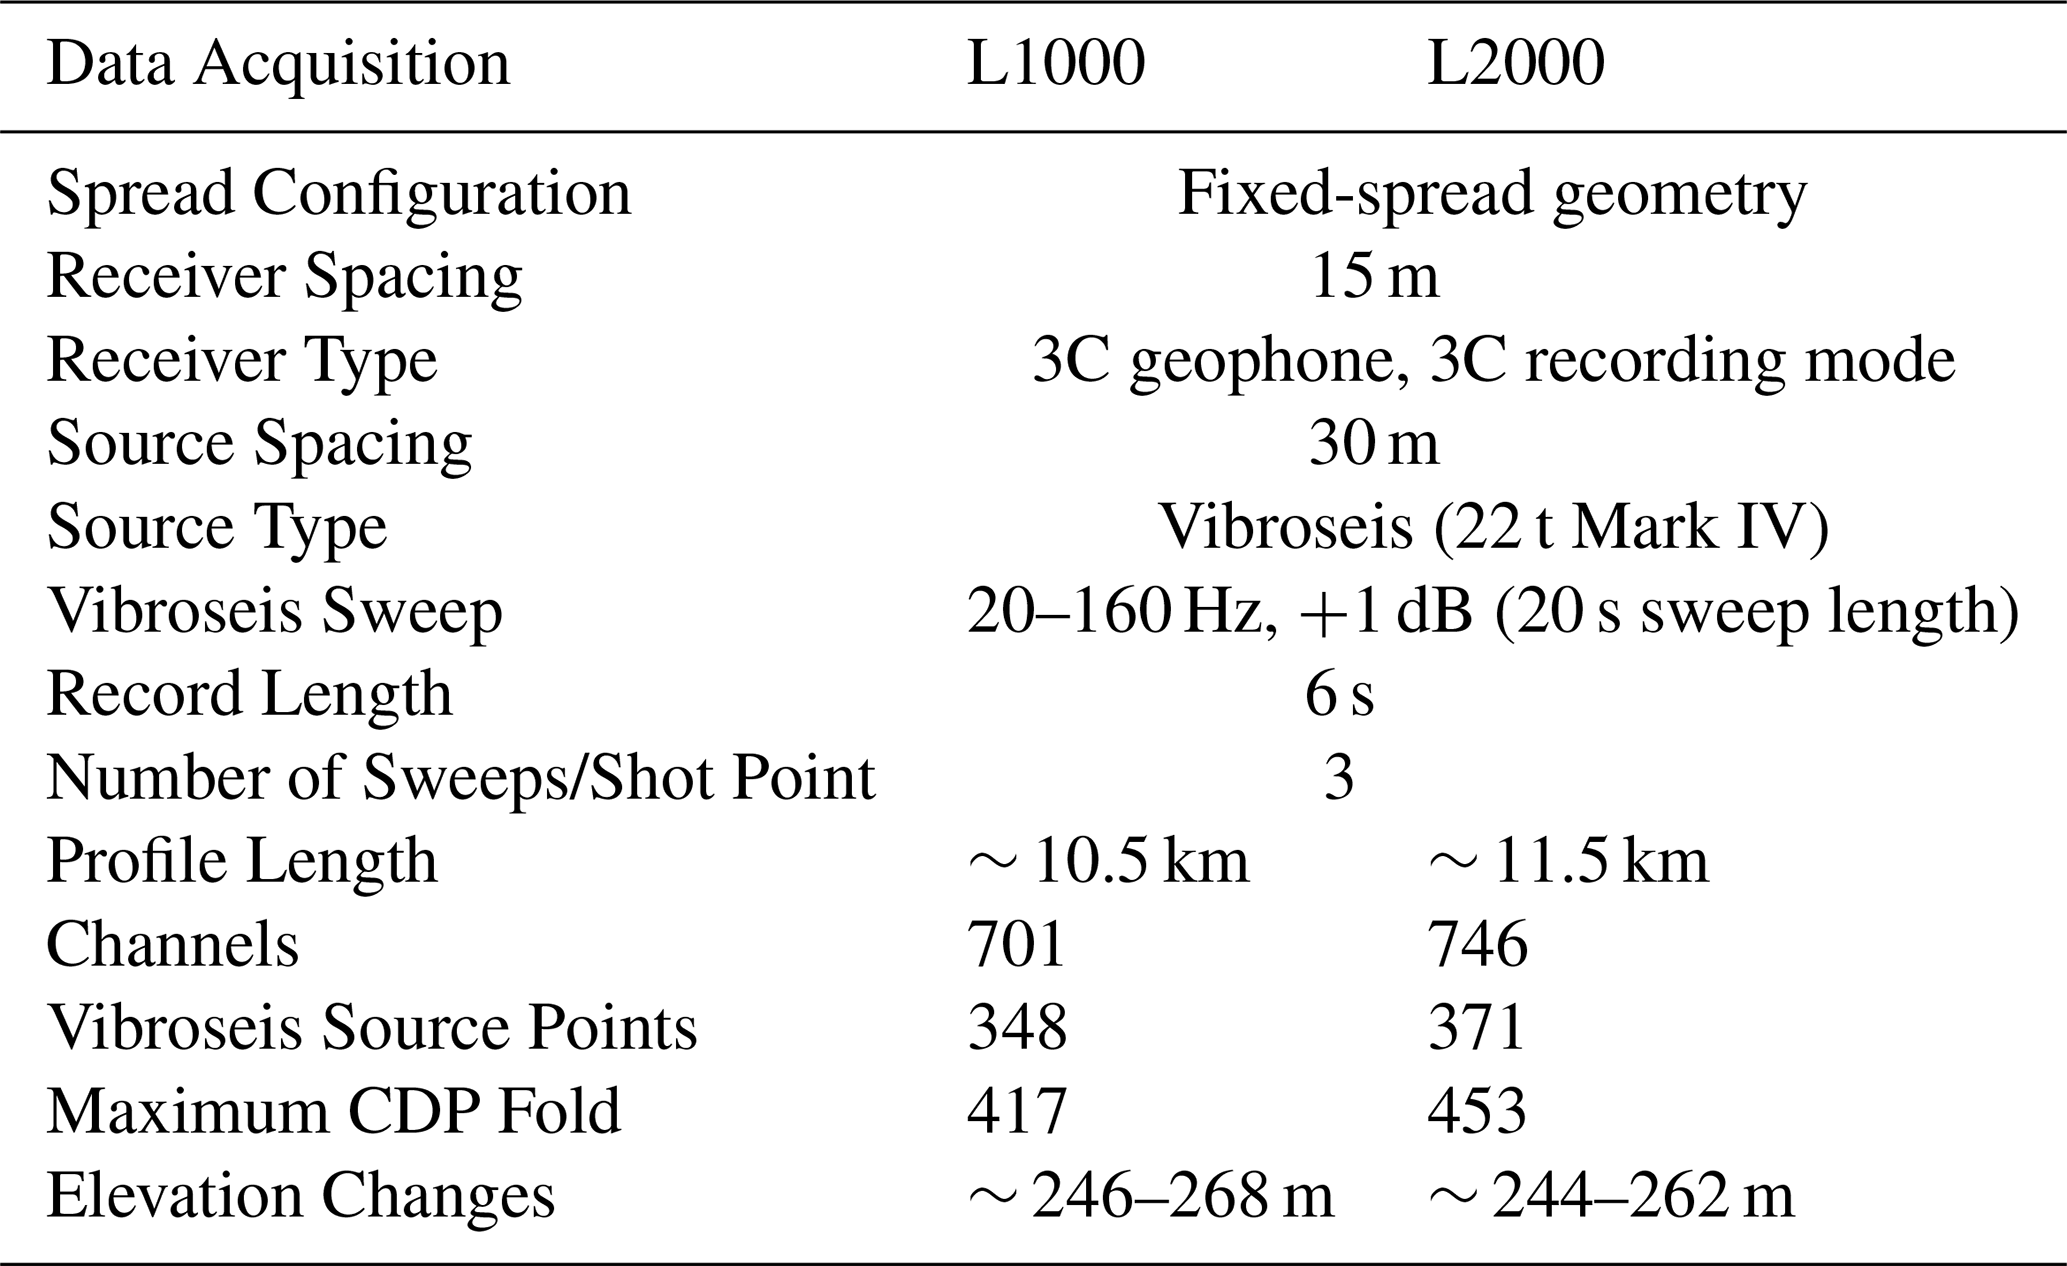
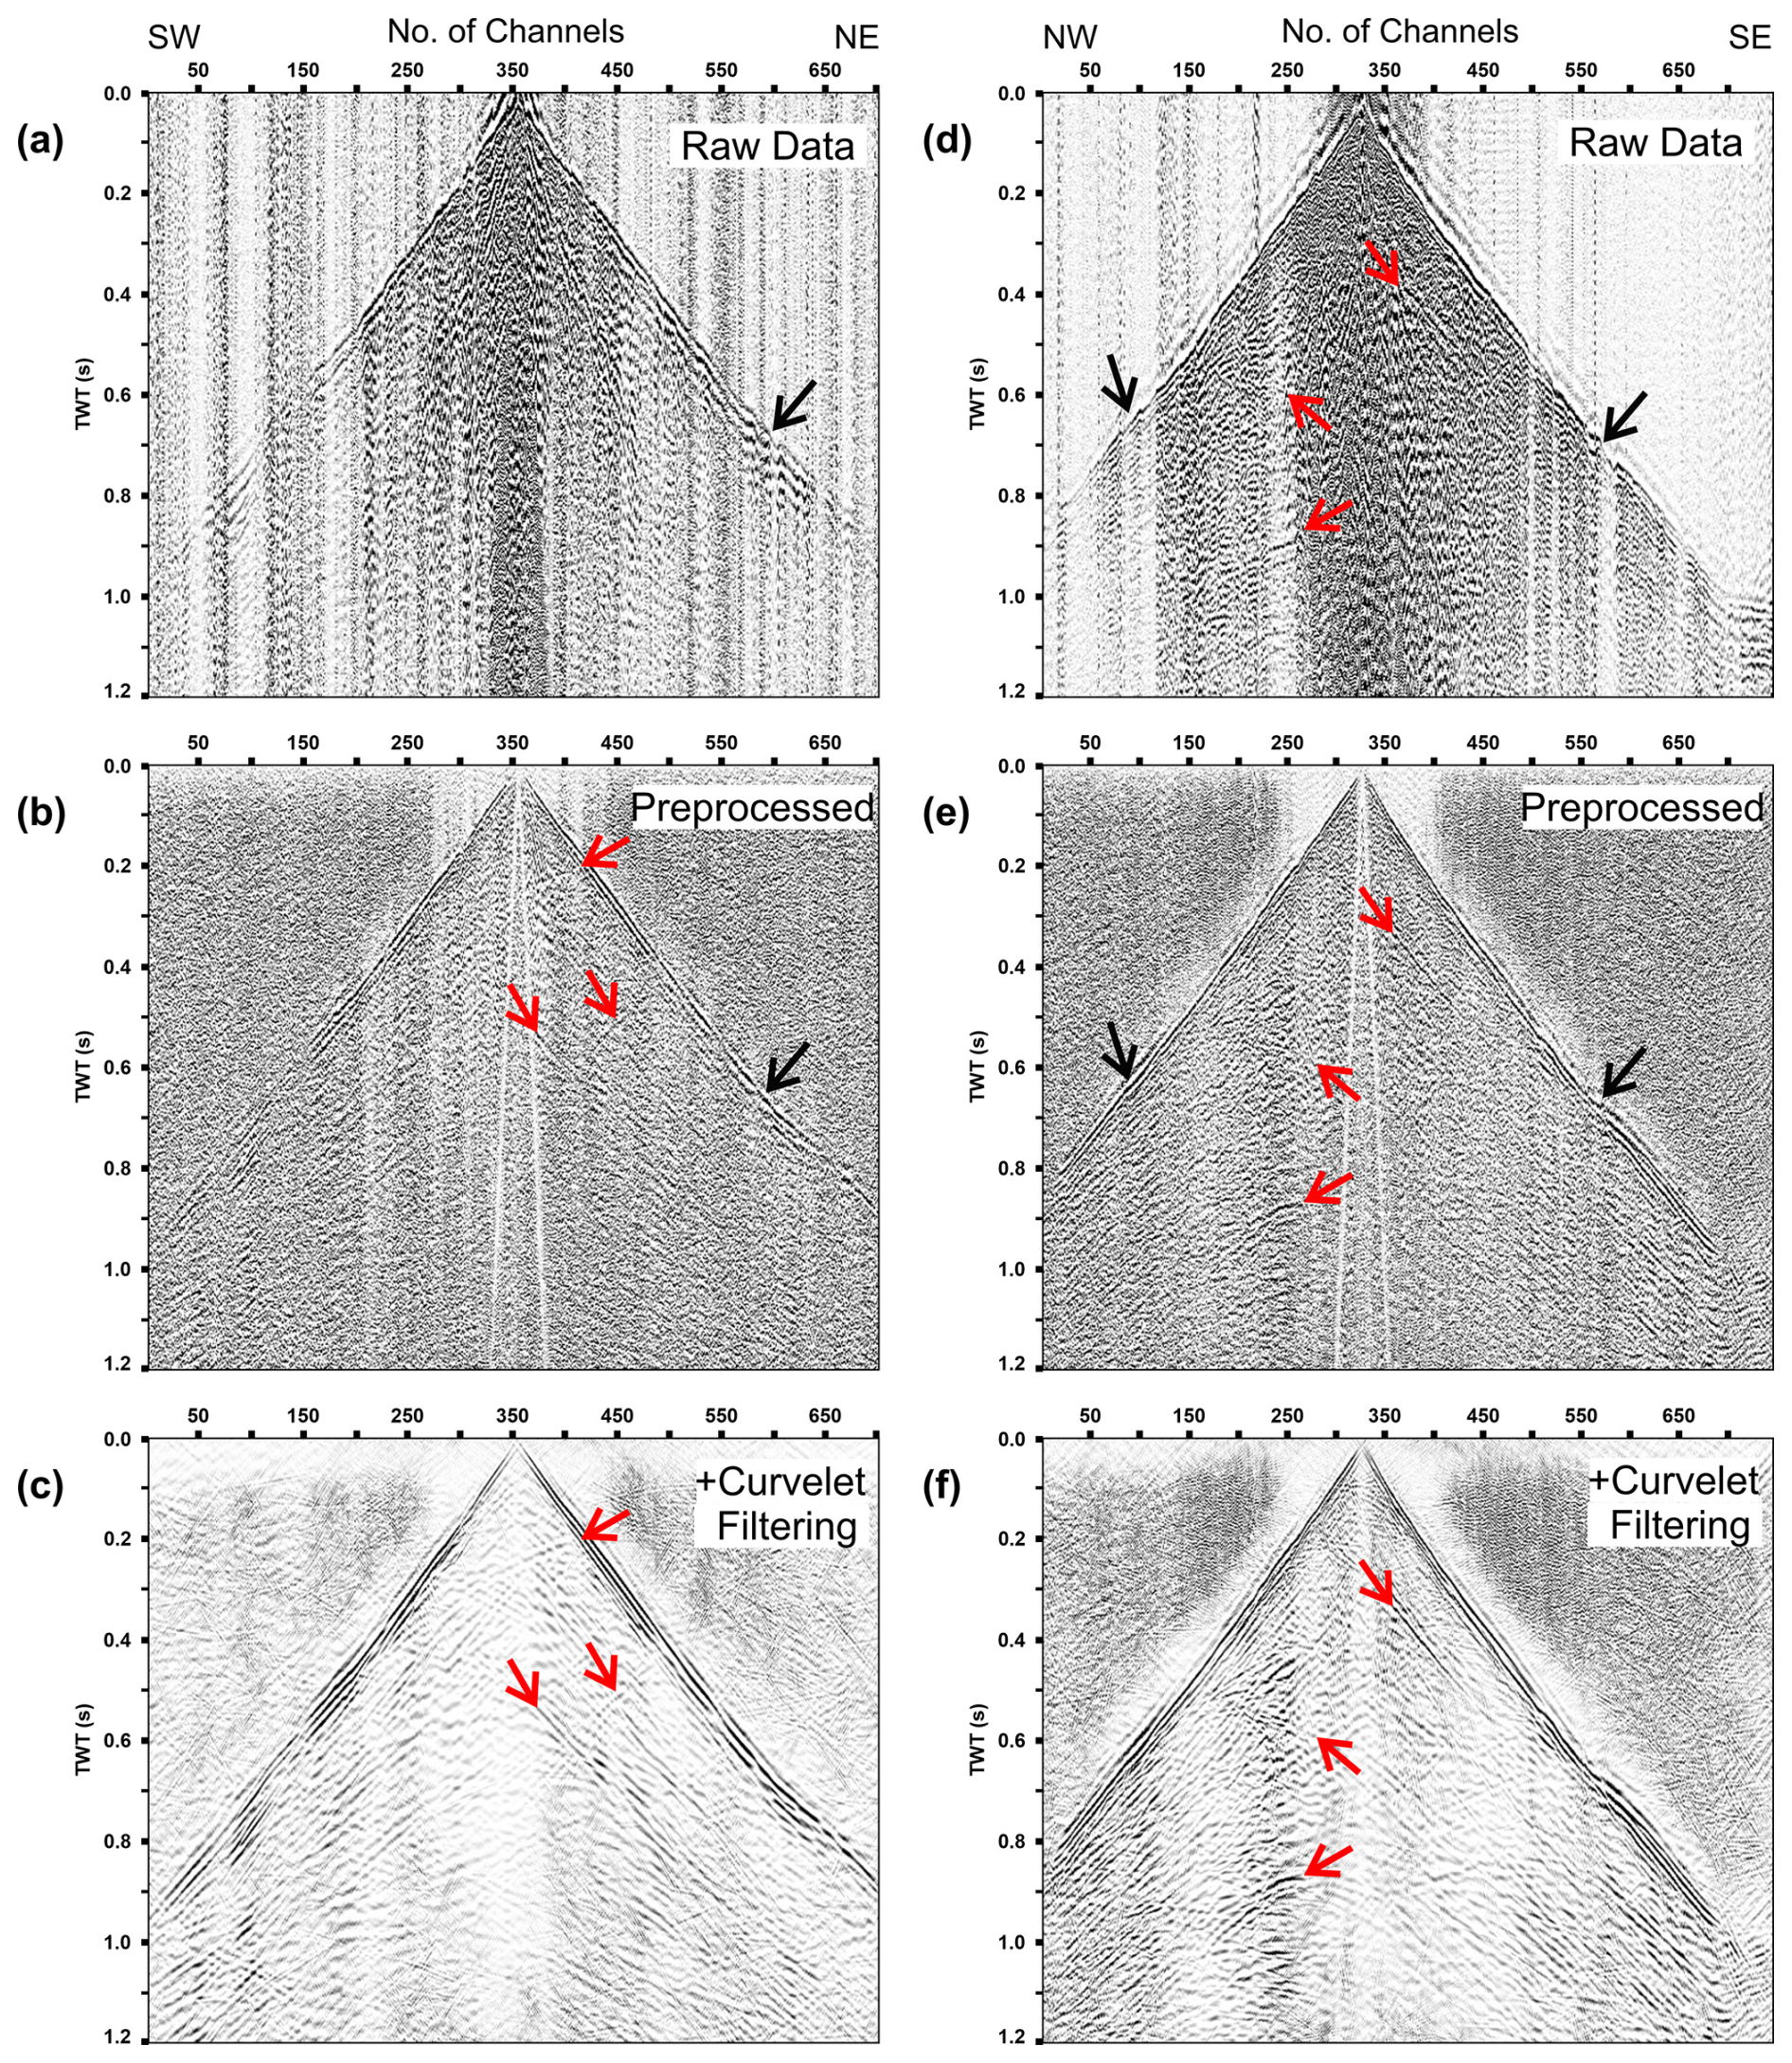
Figure 4Result of the data preprocessing applied to profiles L1000 and L2000. (a) Raw shot gather for profile L1000, (b) data with full preprocessing without the top-mute, and (c) is the same as (b) with curvelet filtering. Trace balancing was applied for presentation purposes. (d), (e) and (f) are the same as (a), (b) and (c) for profile L2000. Black arrows show the correction of first arrivals due to the heterogeneous near-surface weathered layer. Red arrows mark the comparative enhancement/preservation of reflectivity in the raw shot gathers.
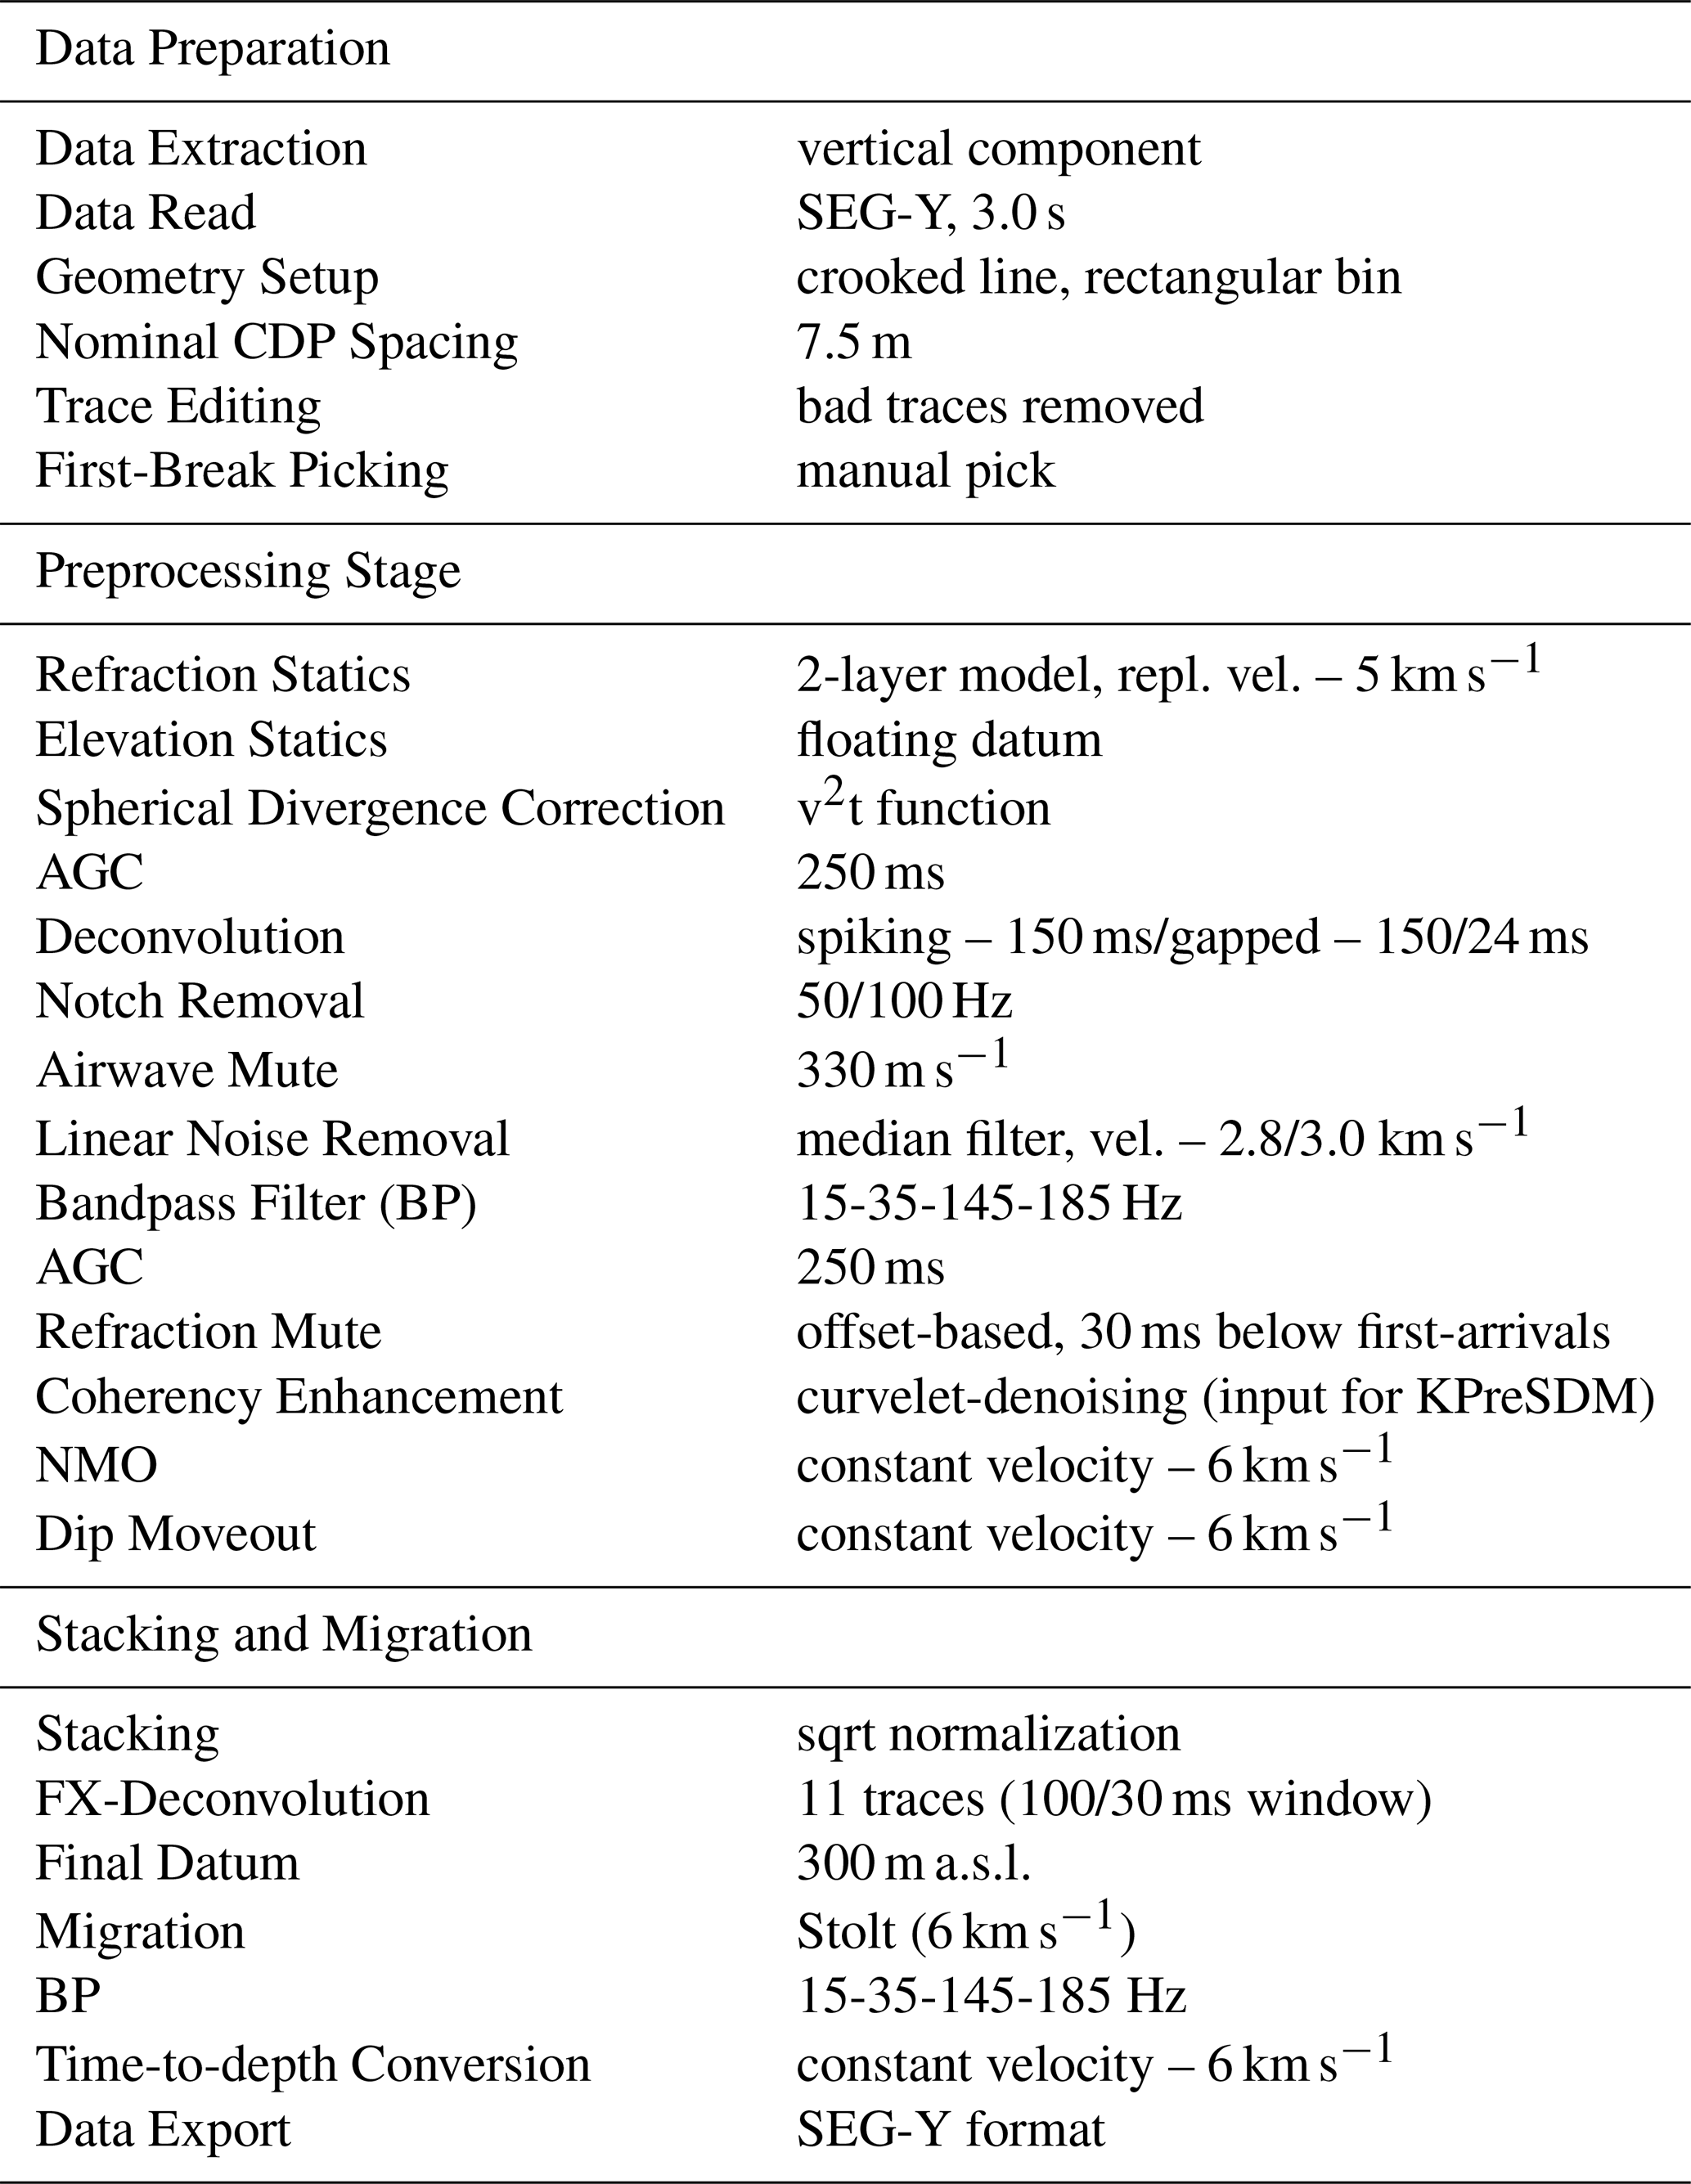
Reflection seismic data processing for both profiles followed the standard processing workflow applied to the hardrock seismics (Cheraghi et al., 2020; Malehmir et al., 2017; Markovic et al., 2020; Nedimović and West, 2003). Data preprocessing started with the extraction of the vertical component from the 3C receiver data. A crooked-line geometry was set up with rectangular bin geometry. Common Depth Point (CDP) bin spacing was kept at half of the receiver spacing sufficient to map the steeply dipping diabase veins, fault, etc., present in the area. The CDP processing line for both profiles is shown by the green line in Fig. 1c. Bad traces were removed and manual picking of first-break energy for the full offset range was done for both profiles (see Fig. 4a and d).
Preprocessing included a two-layered refraction statics solution with a replacement velocity of 5 km s−1 to account for the heterogeneous near-surface weathering layer. A floating datum was defined to account for the elevation variations for the source and receivers. It was followed by the spherical divergence correction, automatic gain control (AGC) and deconvolution. A combination of spiking and gapped deconvolution was found most effective in enhancing the data reflectivity. A notch filter was applied to remove the mono-frequencies. An airwave mute, 1D median filter and bandpass filter (BP) were used to attenuate the ground roll and shear waves (compare Fig. 4a with Fig. 4b, and Fig. 4d with Fig. 4e). An offset-based refraction mute, ∼ 30 ms below the first break was used. A special emphasis was placed on improving the coherency of the signal with curvelet denoising (Górszczyk et al., 2015) (compare Fig. 4b with Fig. 4c, and Fig. 4e with Fig. 4f).
Velocities were picked on the prestack gathers, yielding in the normal moveout (NMO) velocities in the range of ∼ 5.7–6.2 km s−1. However, due to the uniformity of P-wave velocity associated with the homogenous geology above the target area, i.e. mafic–ultramafic rocks (∼ 1.4 km); a constant velocity of 6 km s−1 produced similarly good results when used for the NMO followed by the dip moveout correction (DMO). Final migration tests were conducted using a range of velocities (∼ 5.0–6.5 km s−1) to evaluate the overall imaging quality of the different geological units. A square-root normalization stacking was done on the DMO corrected shot gathers, followed by the FX-Deconvolution and BP filtering. Stolt (F-K) migration with a constant velocity of 6 km s−1 produced optimum results for the target area. We also tested prestack time migration which produced better imaging in some areas, but overall, DMO followed by post-stack time migration (PoSTM) produced qualitatively better imaging results (i.e. with less migration artifacts). Finally, the processed time sections were converted into depth sections, and the data were exported for visualization. All time-domain processing parameters are summarized in Table 2.
Depth-domain imaging
Along with PoSTM, we also tested Kirchhoff prestack depth migration (KPreSDM) due to its ability to better handle the complexity of the medium. No additional processing was applied, and the dataset after the coherency enhancement step was used as the input for the KpreSDM (see Table 2). To avoid artefacts arising from strict 2D migration of a crooked line, we performed KPreSDM in 3D mode (Singh and Malinowski, 2022, 2023). We used the migration code of Hloušek et al. (2015) in the shot-domain. The computational domain for KPreSDM is shown as black boxes in Fig. 1c. Depth migration parameters were kept similar for both profiles, given the same acquisition setup and underlying geology in the area. For profiles L1000 and L2000, the grid dimensions were 701 × 141 × 434 and 735 × 168 × 434 (inline × crossline × depth) with a uniform grid spacing of 15 m. Similar to PoSTM, a migration velocity of 6 km s−1 was used; however, KPreSDM was also tested for a scan of velocities in the range of 5.0 to 6.5 km s−1.
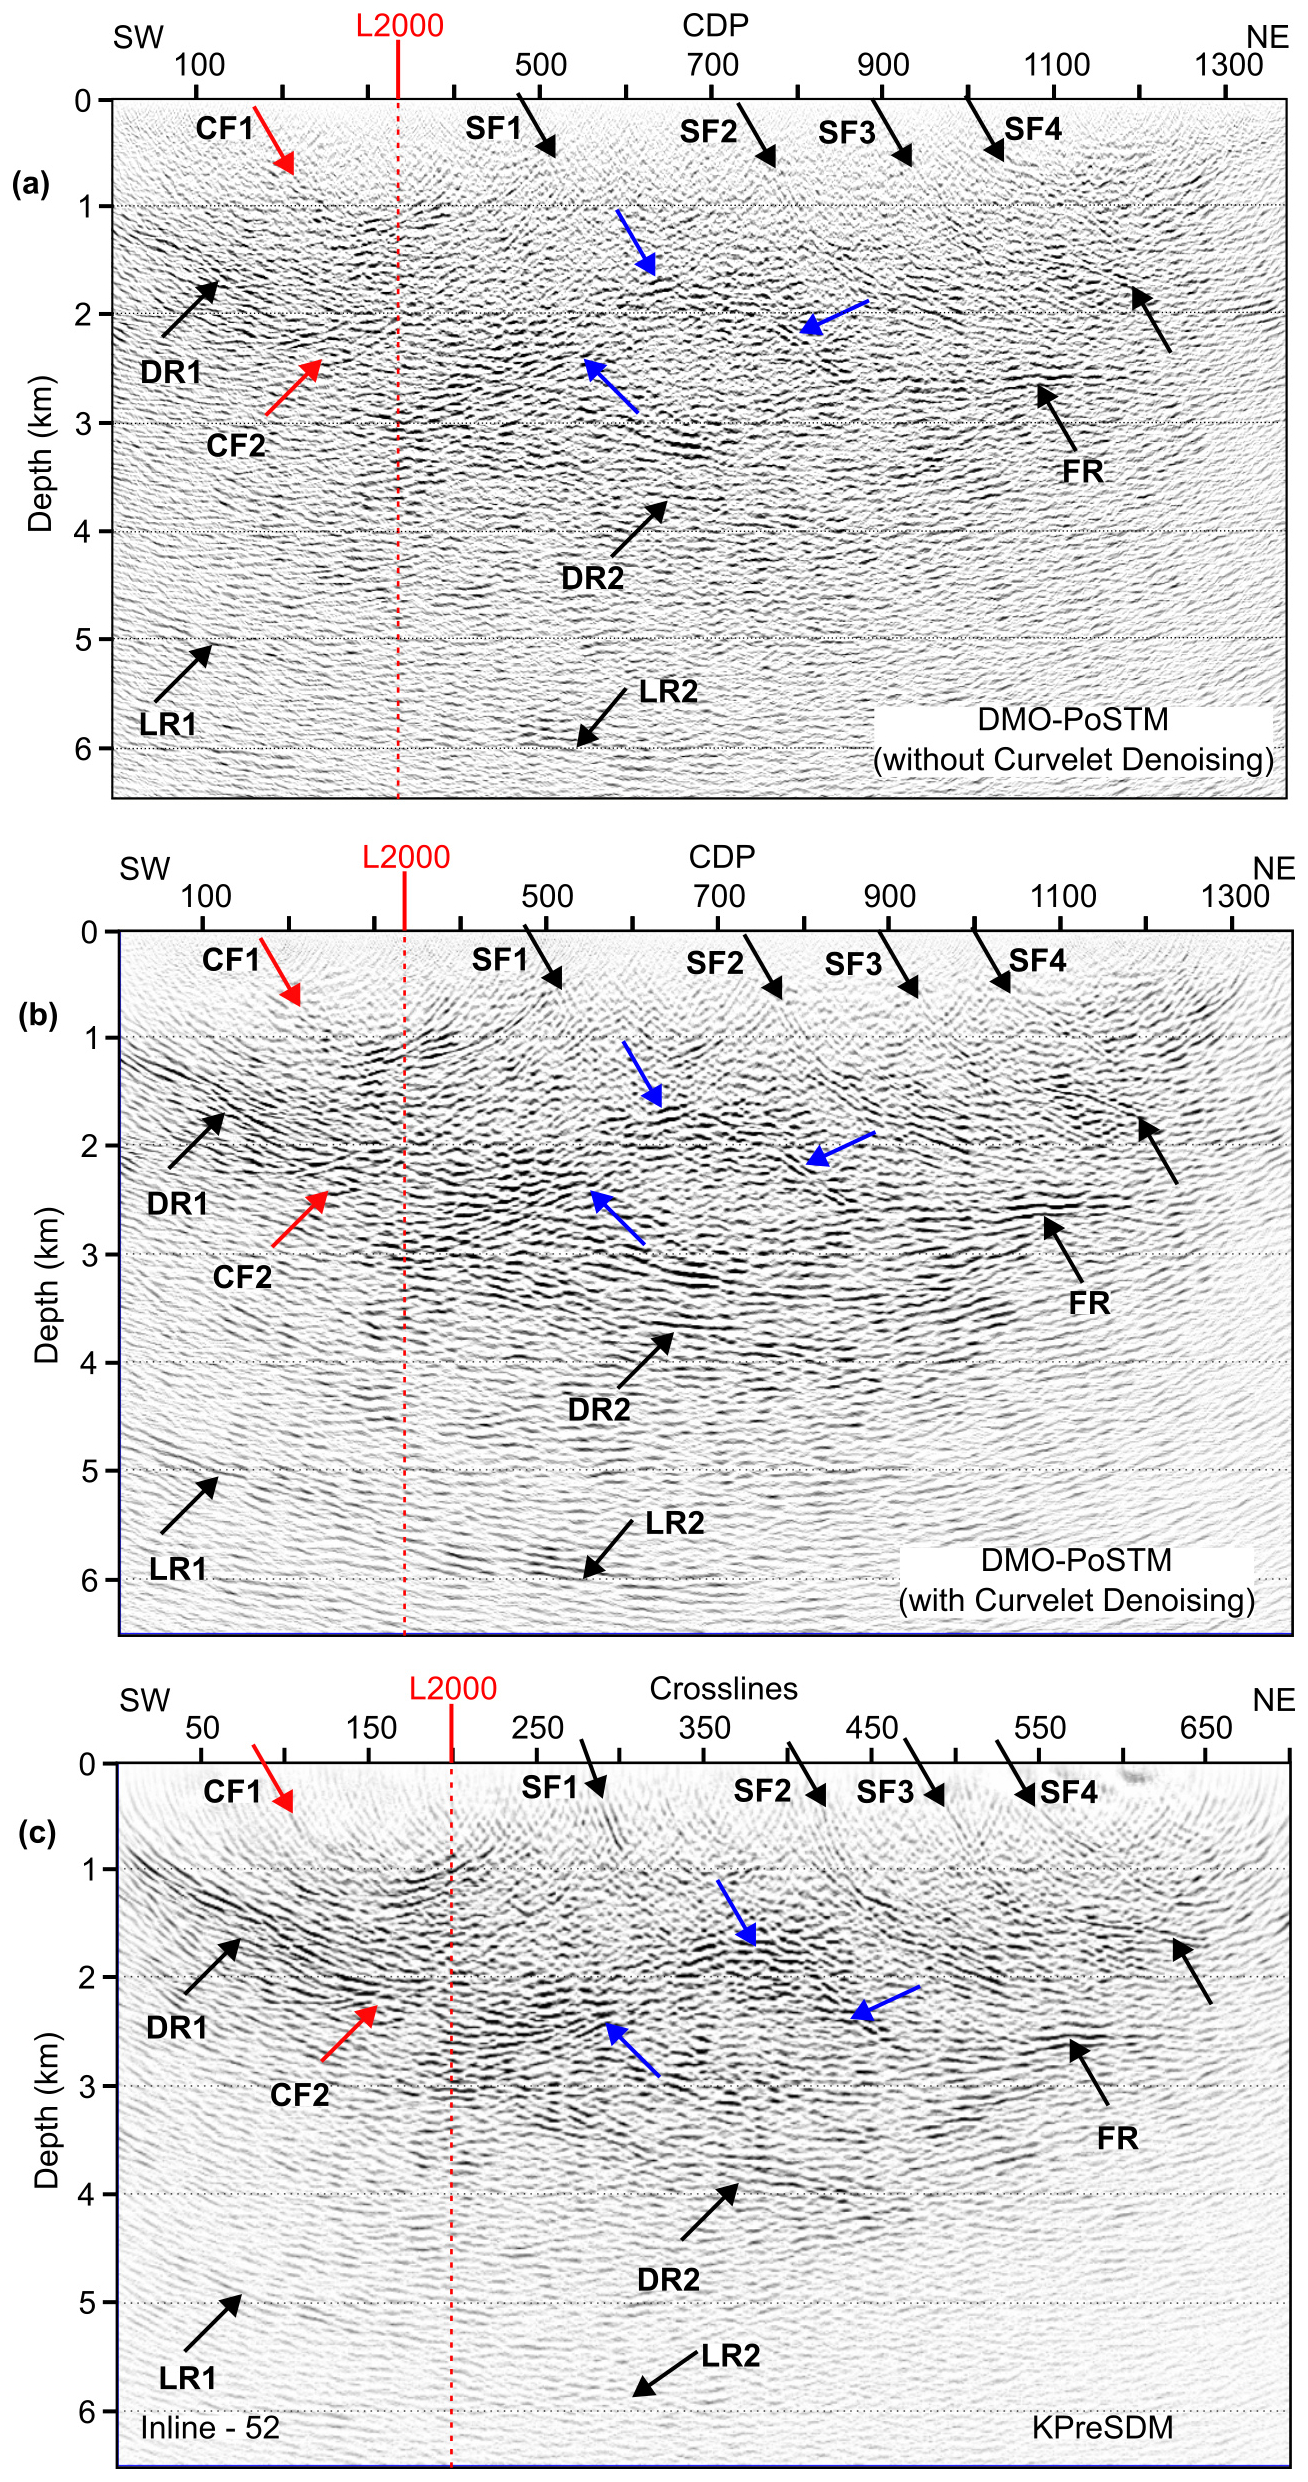
Figure 5Imaging results for profile L1000. 2D DMO-PoSTM without curvelet denoising (a), with curvelet denoising applied (b), and 3D KPreSDM – central inline (c). Black arrows show delineated reflectors at various depths and blue arrows mark the likely extent of the arcuate reflectivity. Red arrows mark the presence of crosscutting reflectors. The red dashed line shows the intersection location of profile L2000 with L1000.
Processing and time/depth imaging of the seismic data revealed several reflective packages at various depths. Figure 5 shows imaging results for profile L1000. Figure 5a shows the DMO-PoSTM section without the curvelet denoising applied, which is usually not a part of the standard processing workflow (see Table 2), and Fig. 5b with the curvelet denoising applied. On comparison, it is evident that the curvelet denoising did not introduce any potential artefacts and resulted in a more weighted image. Therefore, it can be used as a key tool in the standard hardrock seismics processing workflow to obtain a more focused image. Similar results were obtained for profile L2000 as well. The origin (zero depth) is at 300 and is the same for all the results presented in this article. Reflections are imaged down to a depth of ∼ 5–6 km. Events are less focussed in the first kilometre, although there are hints of steep reflectors projecting towards the surface (see black arrows labelled SF1-SF4). Other prominent reflections imaged at various depths are also marked by the black arrows. An arcuate reflectivity is mapped in the central area of the profile (blue arrows). Its top is mapped at a depth of ∼ 1.6 km with a clearly visible northeastern flank. A near-horizontal reflector at a depth of ∼ 2.8 km (marked as FR) appears to crosscut the northeastern flank of the curved reflector around CDP ∼ 875. A major reflector down-dipping from the southwestern end of the profile (starting at ∼ 1 km depth) appears to be crosscutting the southwestern flank of the arcuate reflector (marked as DR1 and DR2). There is also the impression of cross-cutting reflectors in the area (red arrows, CF1 and CF2). Higher reflectivity is mapped in the southwestern end of the profile in the depth range of ∼ 1–3 km bounded by the reflector DR1. Reflectors mapped between CDPs 725–1200 (SF2, SF3, SF4) and depth between ∼ 2–3 km have an up-dip direction towards the surface. A dipping reflectivity is also mapped in the depth range of ∼ 5–6 km (marked as LR1 and LR2).
Figure 5c shows the result for 3D KPreSDM along an inline position shown by the blue line in Fig. 1c. The inline crosscuts the curved CDP line as a straight line shown in Fig. 5a and b; therefore, the assessment here is only done on a comparative basis. Overall, the events for KPreSDM results are much more focussed and continuous compared to DMO-PoSTM results (compare Fig. 5b with Fig. 5c). For example, the continuity of events SF1–SF4 are much better imaged. The central arcuate reflectivity is also better delineated along with other events except for the deeper reflectors marked as LR1 and LR2, for which higher migration velocities/aperture are required.
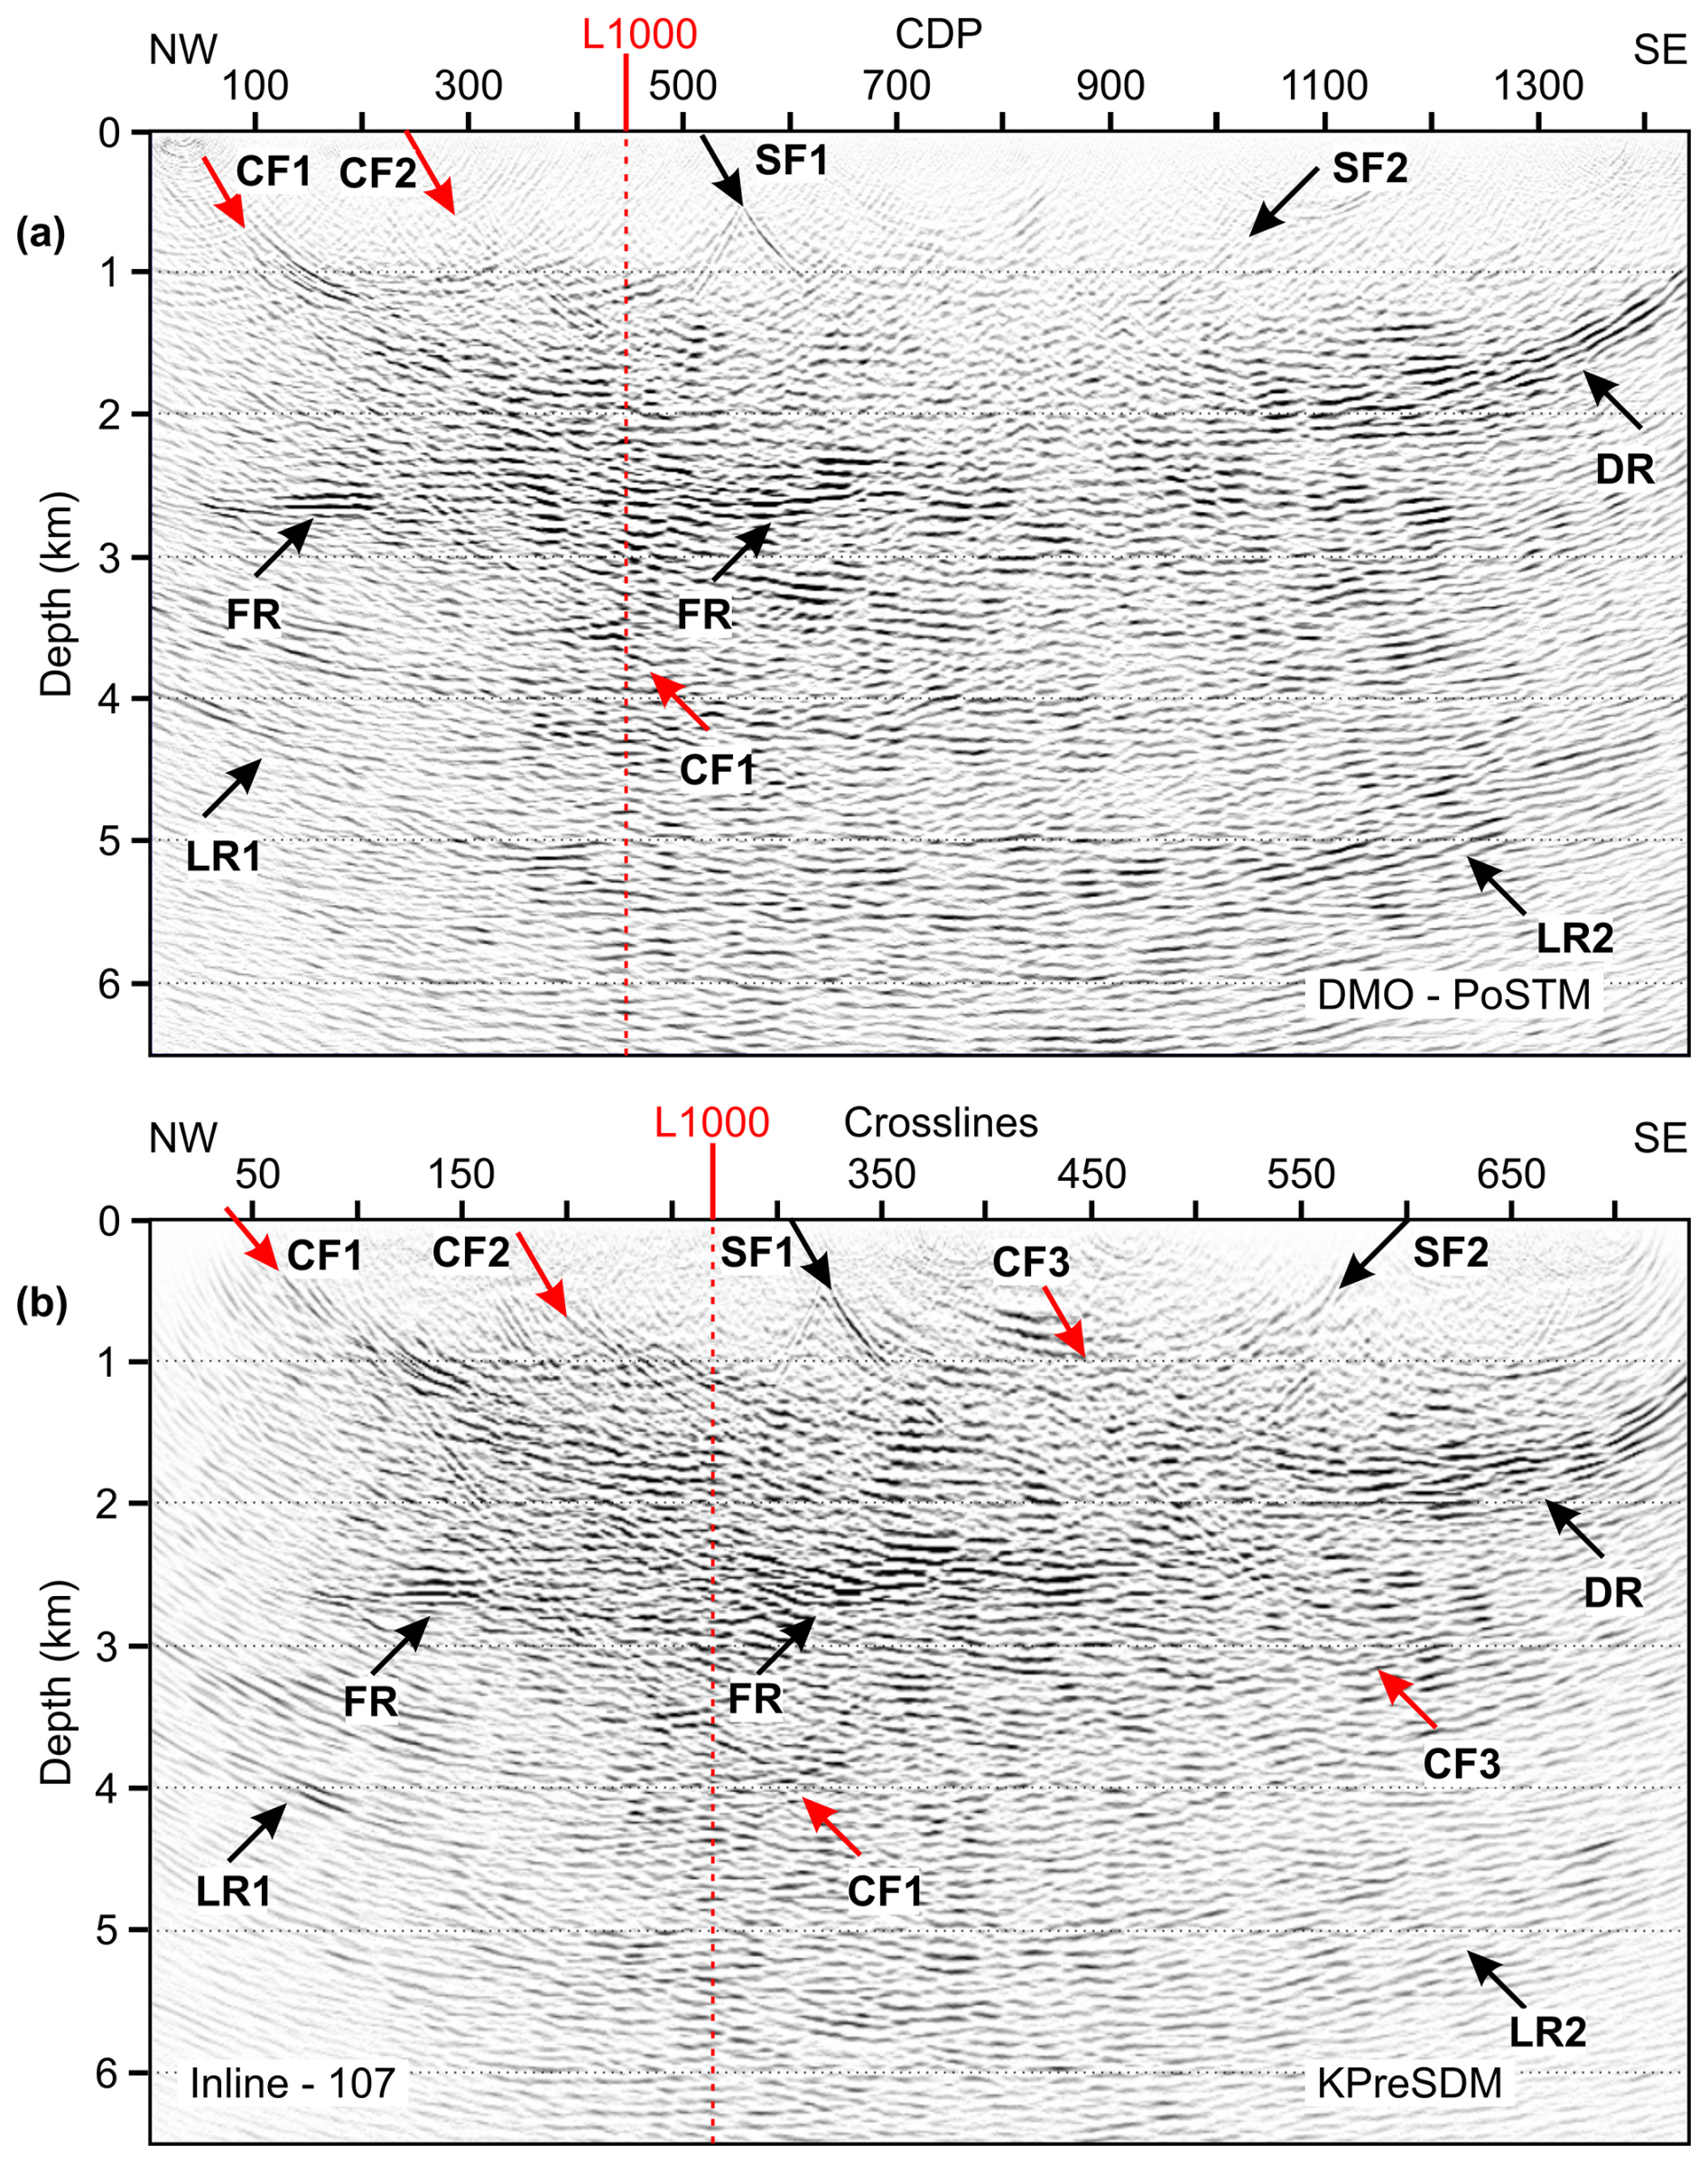
Figure 6Imaging results for profile L2000. (a) 2D DMO-PoSTM, (b) 3D KPreSDM (central inline). Black arrows show imaged reflectivity at various depths in the area. Red arrows mark the steeply dipping cross-cutting reflectors. The red dashed line shows the intersection location of profile L1000 with L2000.
Similar to Fig. 5, Fig. 6 shows imaging results for profile L2000. Figure 6a shows the result for DMO-PoSTM with curvelet denoising applied in the preprocessing stage. Black arrows mark different reflectors mapped in the area at various depth levels. Similar to profile L1000, events are less focussed in the first kilometre with some visible reflectivity marked by black arrows (SF1 and SF2 – not the same events shown in Fig. 5, same is valid for other marked events in Fig. 6). There are hints of several cross-cutting events at the regional scale, although these events are weak to mark their clear extents (red arrows, CF1 and CF2). The reflector marked as CF1 is delineated clearly up to a depth of ∼ 4 km. Similar to profile L1000, a horizontal reflector is mapped at a depth of ∼ 2.8 km (black arrows, FR). There is also the presence of deeper reflectivity marked by black arrows (LR1; depth ∼ 4 km, and LR2; depth ∼ 5 km). A package of dipping reflectivity at the southeastern end of the profile is also mapped at a depth of ∼ 1–2 km (marked as DR). Figure 6b shows results for 3D KPreSDM. The inline location is shown as the blue line in Fig. 1c. Same as for profile L1000, KPreSDM results are better focussed than DMO-PoSTM results (compare Fig. 6a with Fig. 6b). A notable difference can be seen for the reflector (CF3, red arrows) which is almost absent in the DMO-PoSTM result.
Interpreting the seismic reflectivity in the study area is challenging due to the availability of only a single drillhole for calibration. Nevertheless, the observed reflectors can be associated with the mafic–ultramafic intrusions, cross-cutting dykes, fault systems and the lithological contacts. The seismic survey successfully imaged the upper part of the interpreted magma conduit down to a depth of approximately 4–5 km. Internally, the conduit appears more complex than previously understood, with steep fault-like features potentially cross-cutting the intrusion. These results were correlated with the pre-seismic geological model to guide interpretation. The two new 2D seismic profiles acquired under the SEEMS DEEP project proved highly beneficial compared to the previously acquired KOSE 2018 profile (compare Fig. 5b with Fig. 2). Seismic imaging produced abundant reflectivity at various depths which is generally absent or otherwise poorly focussed, especially around the target area. This is mainly due to the better optimized/regular acquisition (see Table 1) compared to the previous survey which used only 90 channels with a maximum offset range of ∼ 1800 m, shot-receiver spacing of 20/40 m and small explosive charges ∼ 120–240 g.
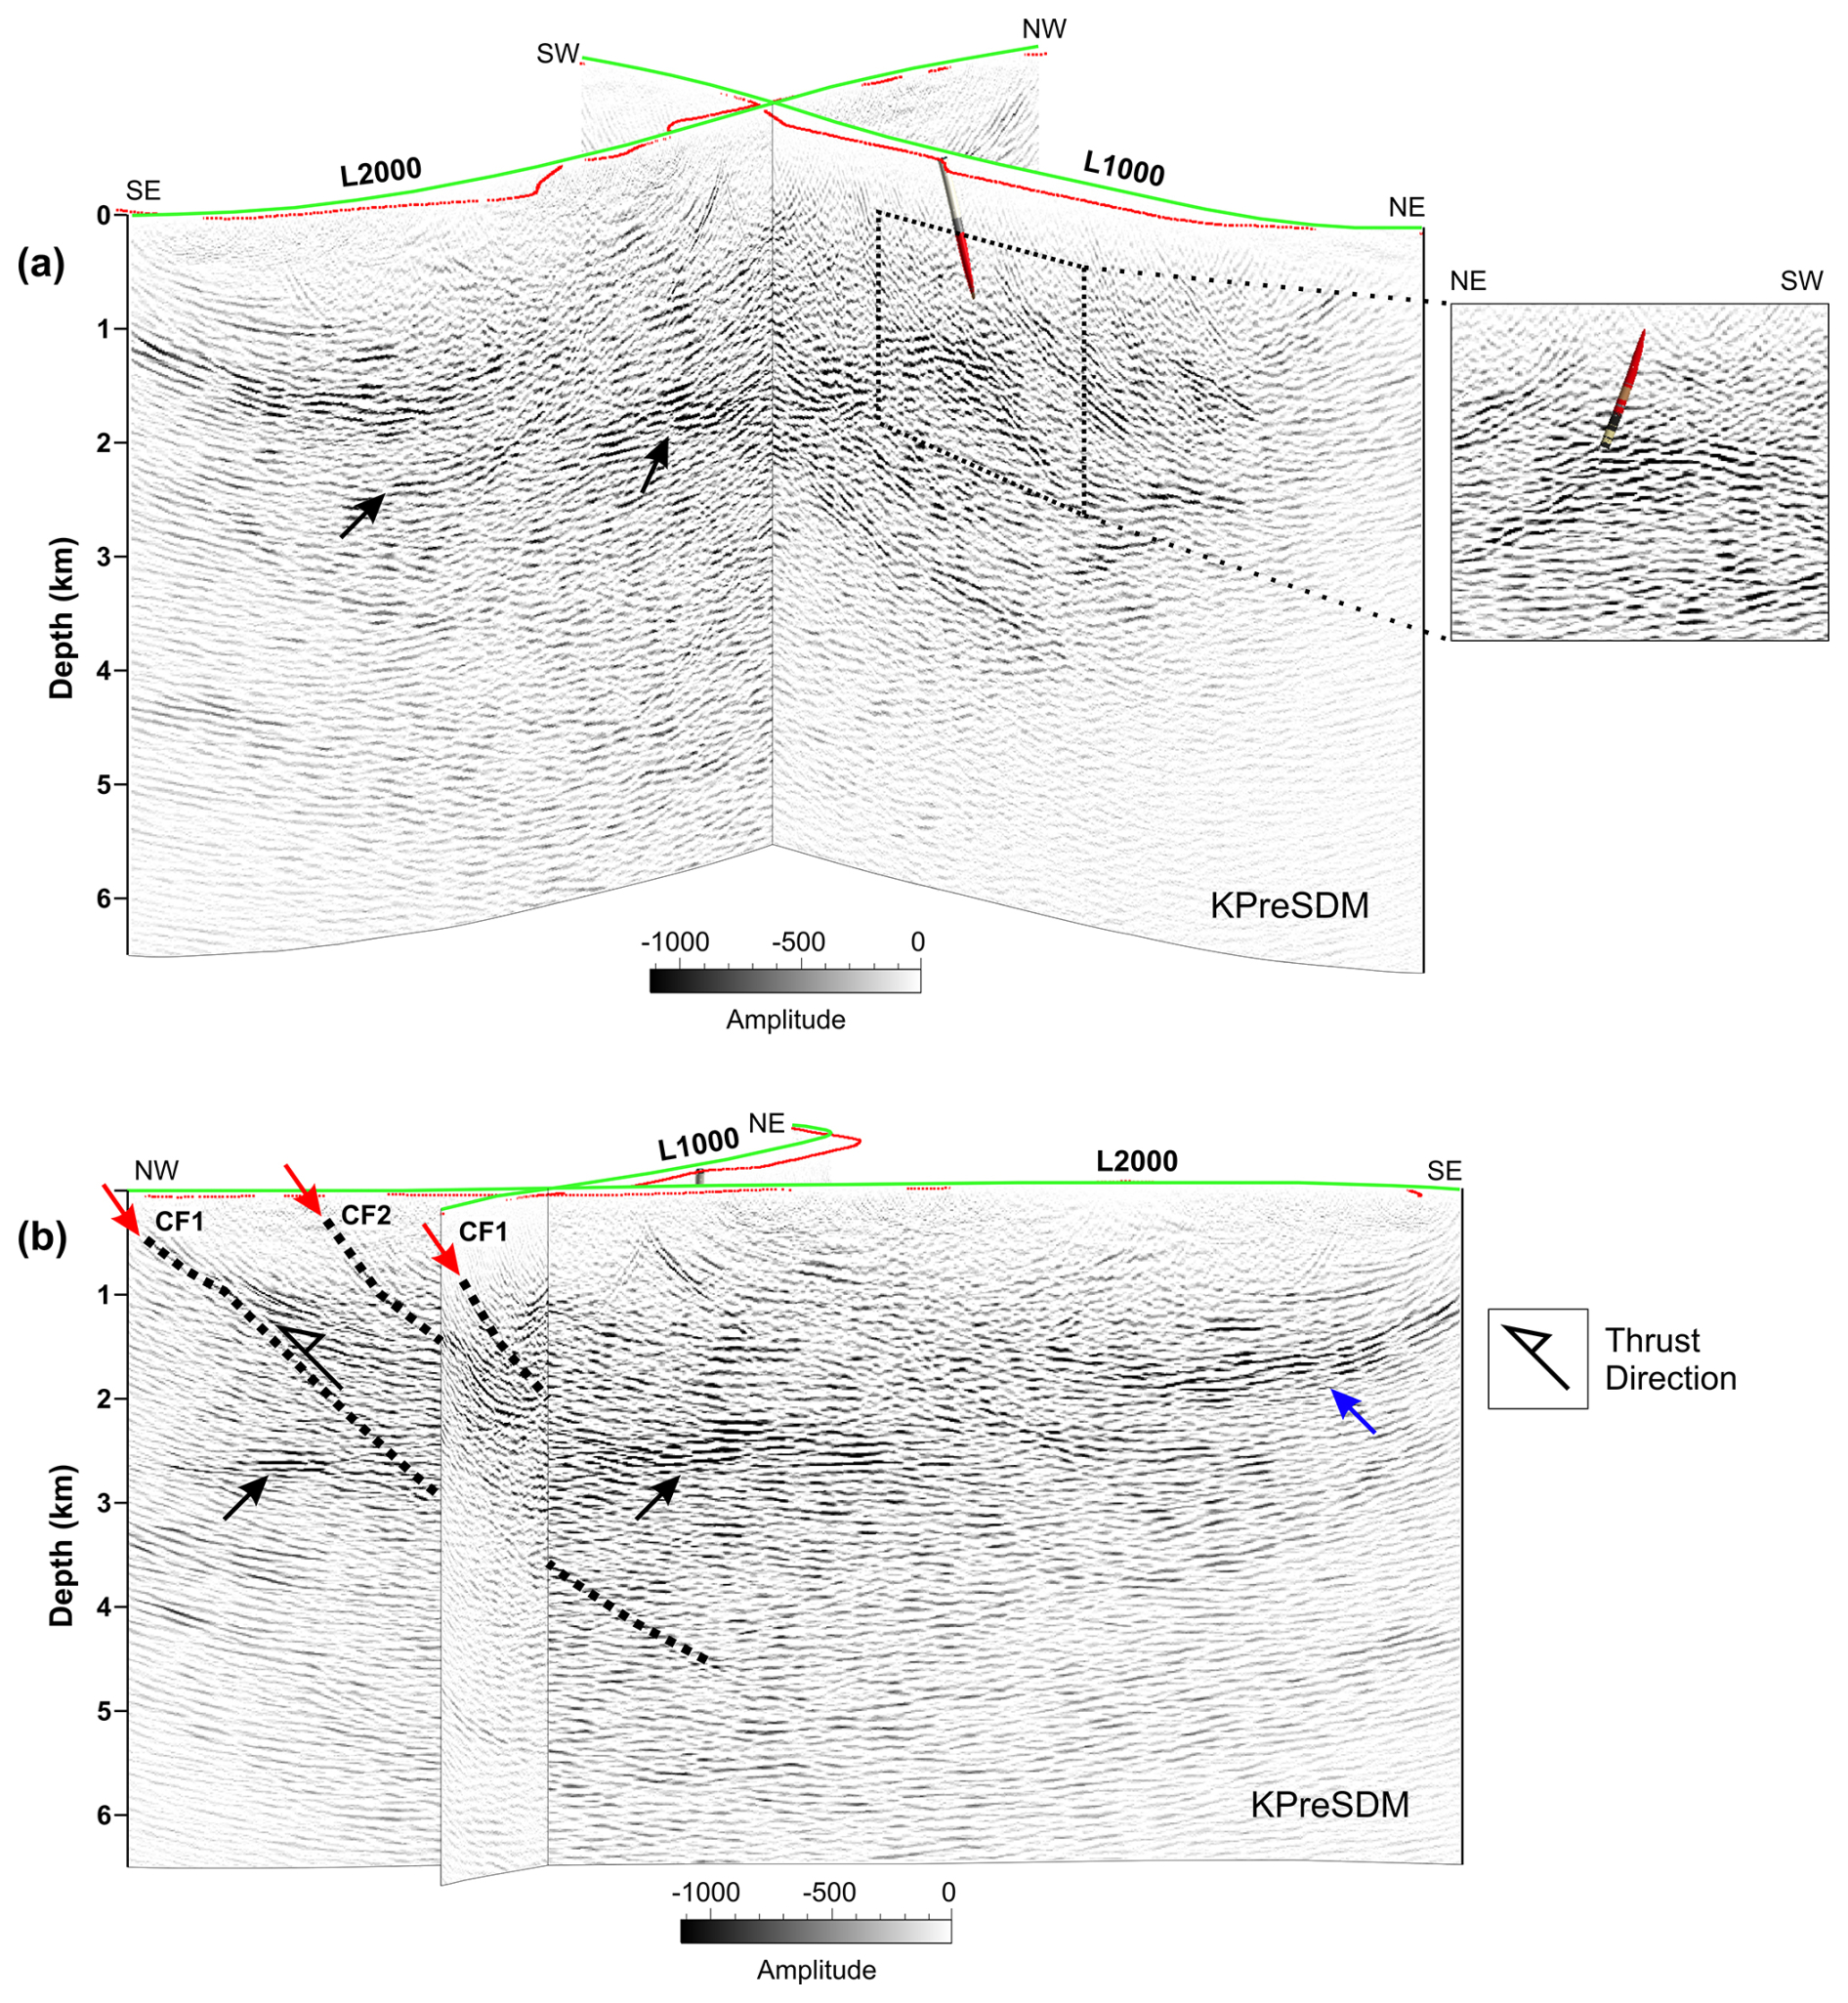
Figure 7Cross-sectional view of (a) KPreSDM result, (b) same as (a) from a different view angle. Inset (a) shows an enlarged section around the drillhole location. Red, blue and black arrows highlight reflectors used for the interpretation. The green line is the same CDP line shown in Fig. 1c, and the red dots show the source locations along the profiles. Dashed black lines represent mapped faults in the area.
Qualitatively, KPreSDM results were preferred over DMO-PoSTM processing due to improved imaging quality and reflector continuity (see the comparison in Figs. 5 and 6). Figure 7 shows the cross-sectional view of the KPreSDM results for both profiles. KPreSDM results are extracted along the same CDP processing line (green lines, Fig. 1c) at which the DMO-PoSTM results are shown in Figs. 5a, b and 6a. The drill hole is shown along profile L1000. It is to be noted that the processing line intersects the drillhole at a steep angle, and only a part of the drillhole is visible from the shown direction in Fig. 7a. An enlarged view of the cross-section of the drillhole is shown in the inset on the right. Depth imaging reveals arcuate and steep reflectors, with the arcuate reflector intersected by the drillhole correlating spatially with the mafic–ultramafic cumulates and coinciding with gravity and magnetic anomalies. This consistency confirms the presence of a deep-seated magma conduit. Although the drillhole does not reach the deepest reflectors; the combined seismic, lithological, and petrophysical evidence supports the existence of a vertically extensive mafic–ultramafic package capable of hosting orthomagmatic critical raw material deposits, most likely including Ni–Cu–PGE sulphides. This interpretation aligns with observations from other intrusions in the Tornio–Näränkävaara Belt, which has been a focus of PGE–Cu–Ni, V–Ti–Fe and Cr exploration and mining from the 20th century to the present day. In particular, the arcuate reflector near the drillhole likely corresponds to a mafic diabase unit intersected during drilling (see Fig. 3e), with its base coinciding with the onset of mafic–ultramafic cumulates. Deeper reflectivity, particularly in the western parts of the profile indicates several steep reflectors dipping to the east and south (red arrows, Fig. 7b). These likely represent regional-scale faults which were earlier unknown in the area, including the CF1 fault, which appears to be an overthrust. The CF1 structure coincides spatially with a banded iron formation (BIF) that runs parallel to the magma conduit at depth (marked by red arrow in Fig. 1c). Its association with strong horizontal reflectivity (marked by black arrows) suggests that the BIF may have been structurally overprinted or tectonically emplaced.
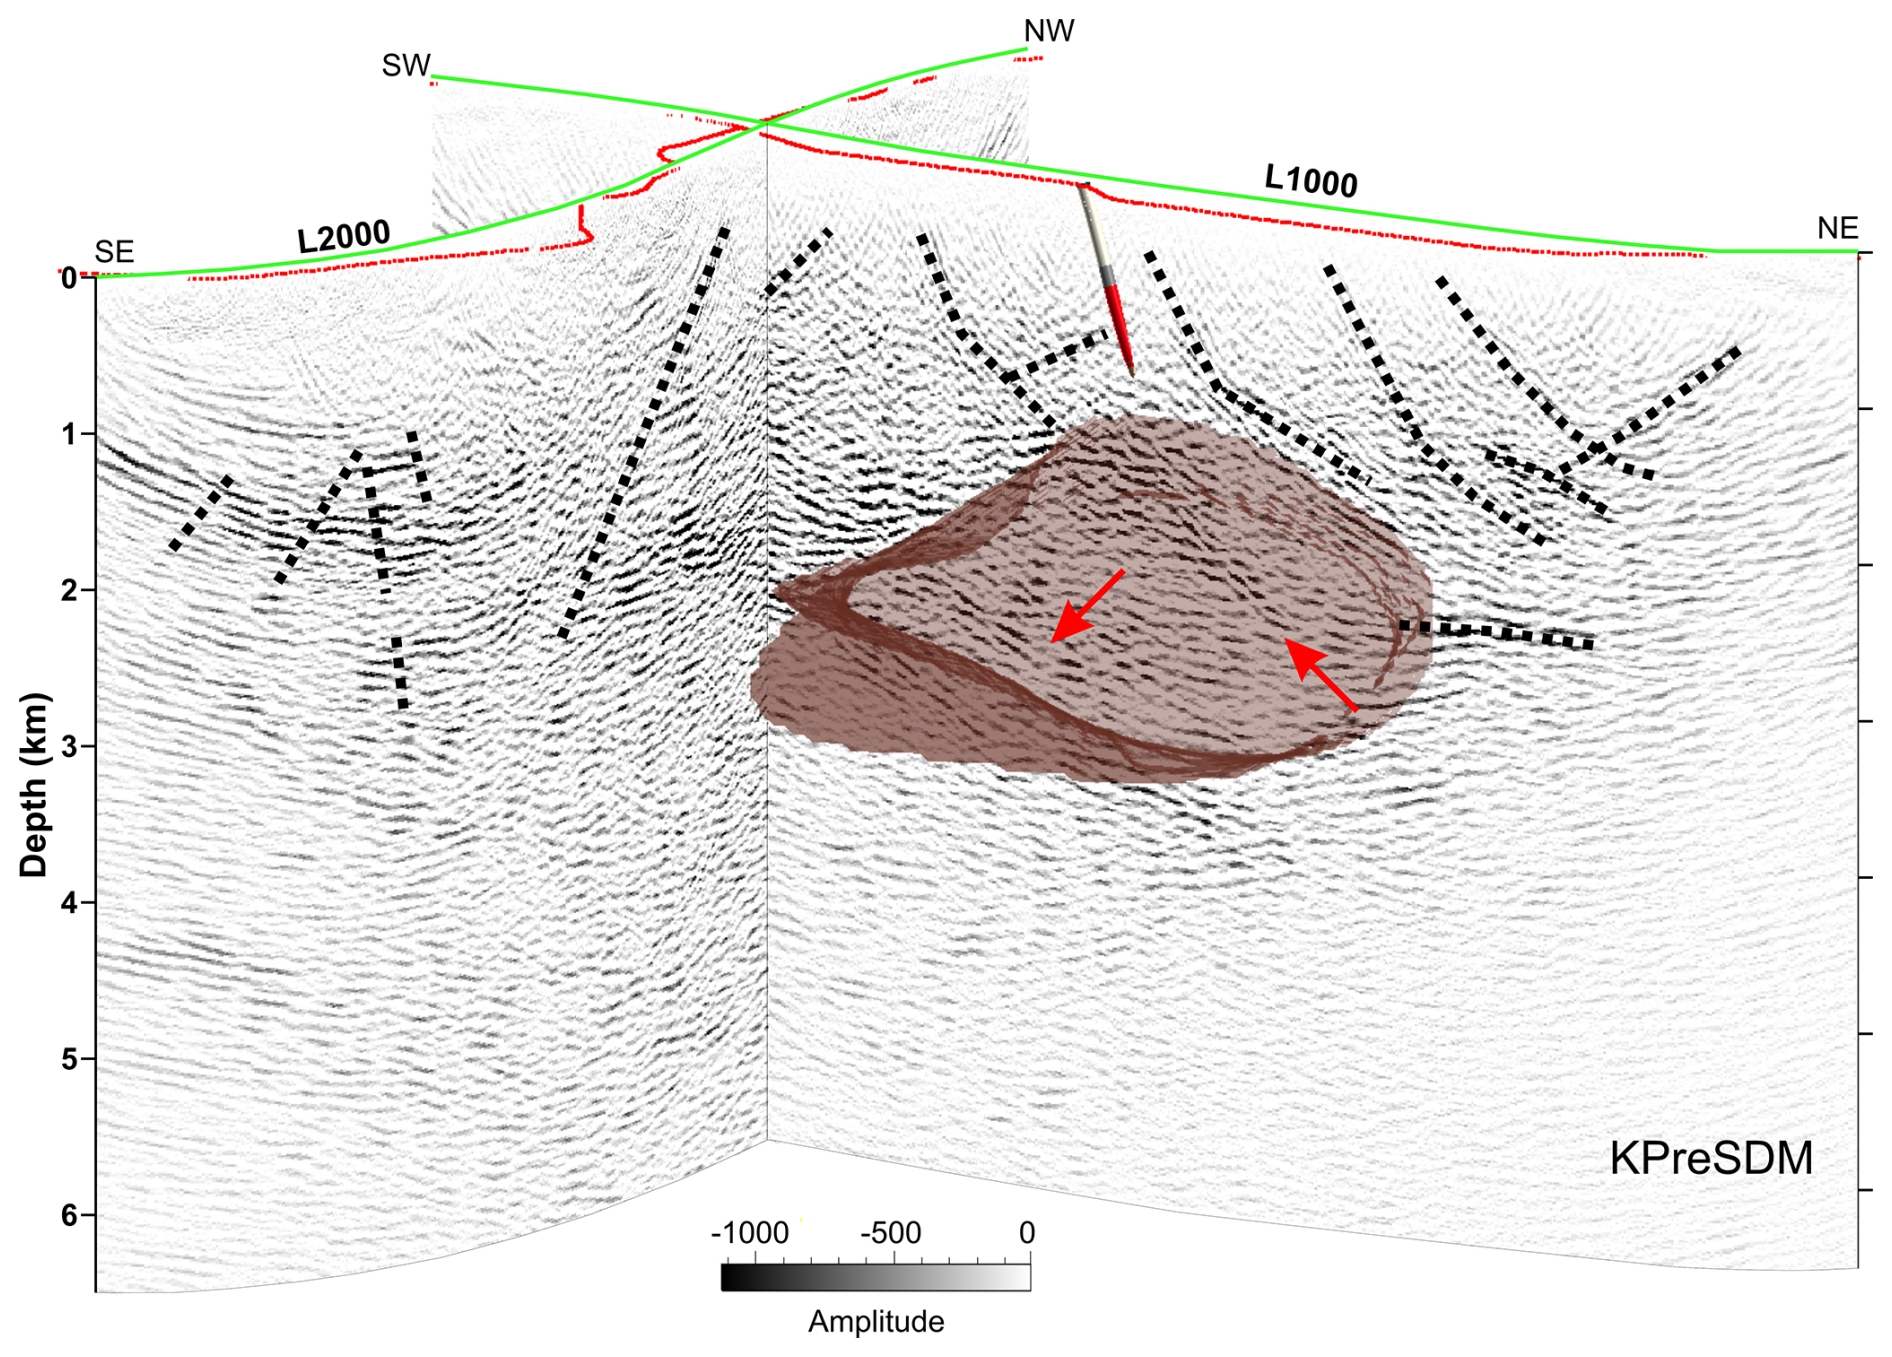
Figure 8Cross-sectional view of KPreSDM with the initial geological volume model of the mafic intrusion and the drillhole. The red arrow marks the delineated internal reflectivity within the magma conduit. Black dashed lines show the possible faults, dykes or lithological contacts present in the area. The green line shows the CDP line shown in Fig. 1c, and the red dots show the source locations along the profiles.
The presence of such steep, reflector-defined fault systems further adds structural complexity to the intrusion and its surroundings. These faults may have played a key role in magma emplacement by acting as pathways for ascending melts and mineralising fluids. In addition to orthomagmatic processes, such structures could also have facilitated later-stage hydrothermal activity. The spatial association of the CF1 fault with the BIF suggests potential for hydrothermal overprinting or remobilisation, possibly giving rise to orogenic Au–Co mineralisation. Furthermore, a dense package of southeast-dipping reflectors (marked by blue arrows in Fig. 7b) may represent a continuation or a structurally juxtaposed block of the BIF, previously mapped in the region (Makkonen, 1972). Although this area lacks direct drill control, the structural context supports this interpretation.
Figure 8 compares the KPreSDM seismic results with the pre-existing geological 3D surface model of the Koillismaa conduit, which was developed from the gravity inversion constrained by the drillhole data. The observed reflectivity aligns well with the modelled conduit geometry, particularly in the central portion of the intrusion. Internally, zones of prominent reflectivity suggest structural or compositional heterogeneity within the mafic–ultramafic body (marked by red arrows). Some of these features may reflect additional lithological contacts or post-emplacement faulting. Black dotted lines show observed reflectors possibly representing faults and dykes present in the area that could not be confirmed due to the lack of direct evidence in terms of borehole or other independent study. The contrasting dip directions of fault zones northeast and southwest of the intrusion could reflect structural uplift, diabase veining, or variations in country rock stratigraphy (see also Figs. 5 and 6). These findings demonstrate the value of integrating seismic and petrophysical datasets in areas with limited drill control. Even in the absence of deep drilling, it is possible to identify structural and lithological features critical for mineral systems analysis and for assessing the potential for critical raw materials.
Two regional seismic profiles were acquired within the SEEMS DEEP project to map the regional reflectivity and to constrain the geometrical architecture of the deep-seated Koillismaa magma conduit. Depth-domain imaging (KPreSDM) provided focussed images with better continuity than DMO-PoSTM imaging. Several reflections are mapped at various depths whose origin can be associated with the presence of dykes, faults and lithological contacts in the area. Regional faults were imaged with reflectivity down to a depth of ∼ 4–5 km. The magma conduit associated with KLIC has been successfully revealed which was one of the main aims of the SEEMS DEEP project. The mapped internal structure of the magma conduit seems more complex than its present understanding with prominent internal reflectivity suggesting a more structural or compositional heterogeneity within the mafic–ultramafic body. The extensive mafic–ultramafic intrusion has the potential to host critical raw material deposits of Ni-Cu-PGE sulphide type. Overthrusting has been observed in the western part of the study area with several steep regional-scale fault systems which were not known prior to this seismic study. These steep faults might have played an important role in magma emplacement acting as pathways for ascending melts and mineralisation fluids. The two profiles' cross-cutting proximity proved advantageous in constraining the mapped regional-scale reflectivity in the area, leading to a more detailed understanding of the structural architecture associated with the mafic intrusion. This will help in building a more detailed geological model of the Koillismaa area.
Data associated with this research are available per request to the project coordinator: Uula Autio (uula.autio@gtk.fi), Geological Survey of Finland, Vuorimiehentie 5, 02151 Espoo, Finland.
Jochen Kamm, Cedric Patzer, Veera Pajunen, Toni Eerola, Tuija Luhta, Viveka Laakso, Olli Salmela (Geological Survey of Finland (GTK), Finland); Mathieu Darnet, Francois Bretaudeau, Simon Vedrine, Bitnarae Kim, Florent Beaubois, Jacques Deparis (French Geological Survey (BRGM), France); Szymon Oryński (Institute of Geophysics, Polish Academy of Sciences Warsaw (IGF PAN), Poland); Thomas Kalscheuer, Karol Sierszen, Mehrdad Bastani (Uppsala University, Sweden); Catherine Truffert, Fabrice Vermeersch, Julien Gance (IRIS Instruments, France); Łukasz Sito (Geopartner Geofizyka Sp z o.o., Poland); Antti Kivinen, Janne Kaukolinna (GRM-services Oy, Finland); Yuriy Koltun (Laakso Minerals Oy, Finland)
AG, MM and SH obtained funding. BS, AG and MM designed the 2D survey. BS, AG, MM, SH and MW contributed to the data acquisition. BS performed the signal processing for the seismic dataset used for DMO-PoSTM and KPreSDM. AG contributed to the implementation of curvelet denoising on the seismic dataset. BS and MM QC'ed the signal processing results at various stages. BS, AG and MM interpreted the results. BS, MM and TK contributed to the geological interpretation. BS wrote the manuscript's main content with major contributions from TK, AG, MM, and other authors. All authors contributed to the final interpretation and discussion of the results.
At least one of the (co-)authors is a member of the editorial board of Solid Earth . The peer-review process was guided by an independent editor, and the authors also have no other competing interests to declare.
Publisher's note: Copernicus Publications remains neutral with regard to jurisdictional claims made in the text, published maps, institutional affiliations, or any other geographical representation in this paper. While Copernicus Publications makes every effort to include appropriate place names, the final responsibility lies with the authors. Also, please note that this paper has not received English language copy-editing. Views expressed in the text are those of the authors and do not necessarily reflect the views of the publisher.
This article is part of the special issue “Seismic imaging from the lithosphere to the near surface”. It is a result of the Seismix 2024 conference, Uppsala, Sweden, 24 to 28 June 2024.
We are most thankful to the two anonymous reviewers for their constructive comments, which have helped us significantly in the improvement of the article. We are greatly thankful to the entire SEEMS DEEP field crew for helping in the acquisition of the data. 3C seismic receivers were used from the FINNSIP seismic instrument pool (FLEX-EPOS, Research Council of Finland 328776) and electric field sensors from the Geophysical Instrument Pool Potsdam (GIPP) were used. Globe Claritas™ under the academic license from Petrosys Ltd. and Seismic Unix were used for the data processing and visualization. Thanks to Mira Geoscience for special licensing terms to use the Geoscience Analyst software. We thank TU Freiberg, Germany for allowing us to use their in-house code for depth-domain imaging. The curvelet denoising algorithm was taken from the CURVELAB project (https://www.curvelet.org, last access: 2 June 2024). We gratefully acknowledge the Polish high-performance computing infrastructure PLGrid (HPC Centre: ACK Cyfronet AGH) for providing computer facilities and support within computational grant no. PLG/2024/017350. We acknowledge Google for using the map of Finland (Map data © 2025 Google, GeoBasis-DE/BKG (© 2009)).
This research is part of the ERA-MIN3 program, supported by Business Finland (grant no. 640/31/2022), the Agence Nationale de la Recherche (grant no. ANR-22-MIN3-0006-02), VINNOVA (grant no. 2022-00209), and the Narodowe Centrum Badań i Rozwoju (grant no. ERAMIN3/1/113/SEEMSDEEP/2022).
This paper was edited by Christopher Juhlin and reviewed by two anonymous referees.
Alapieti, T.: The Koillismaa Layered Igneous Complex, Finland – Its Structure, Mineralogy and Geochemistry with Emphasis on the Distribution of Chromium, Geological Survey of Finland, Bulletin 319, 116 pp., https://hakku.gtk.fi/en/publications?id=506 (last access: 1 May 2024), 1982.
Alapieti, T. and Lahtinen, J.: Platinum-group element mineralization in layered intrusions of northern Finland and the Kola Peninsula, Russia, The geology, geochemistry, mineralogy and mineral beneficiation of platinum-group elements, Canadian Institute of Mining, Metallurgy and Petroleum, CIM Special Volume, 54, 507–546, 2002.
Autio, U., Darnet, M., Górszczyk, A., Kamm, J., Heinonen, S., Malinowski, M., Kim, B., Singh, B., Vedrine, S., Bretaudeau, F., Patzer, C., Karinen, T., Kalscheuer, T., Truffert, C., Wojdyła, M., Kivinen, A., and Koltun, Y.: Integrating Seismic and Electromagnetic Methods for Deep Mineral Exploration – Results from the SEEMS DEEP Project, NSG 2024 5th Conference on Geophysics for Mineral Exploration and Mining, 1–5, https://doi.org/10.3997/2214-4609.202420147, 2024.
Barnes, S. J., Cruden, A. R., Arndt, N., and Saumur, B. M.: The mineral system approach applied to magmatic Ni–Cu–PGE sulphide deposits, Ore Geology Reviews, 76, 296–316, https://doi.org/10.1016/j.oregeorev.2015.06.012, 2016.
Bedrock of Finland: DigiKP Digital Map Database, Version 2.3, Geological Survey of Finland, Espoo, Finland, https://gtkdata.gtk.fi/Kalliopera/index.html (last access: 19 June 2025), 2019.
Bellefleur, G., Schetselaar, E., White, D., Miah, K., and Dueck, P.: 3D seismic imaging of the Lalor volcanogenic massive sulphide deposit, Manitoba, Canada, Geophysical Prospecting, 63, 813–832, https://doi.org/10.1111/1365-2478.12236, 2015.
Bleeker, W. and Ernst, R.: Short-lived mantle generated magmatic events and their dyke swarms: The key unlocking Earth's paleogeographic record back to 2.6 Ga, 5th International Dyke Conference: Dyke Swarms – Time Markers of Crustal Evolution, IDC-5, 3–26, ISBN 0 415 39899 1, 2006.
Cheraghi, S., Naghizadeh, M., Snyder, D., Haugaard, R., and Gemmell, T.: High-resolution seismic imaging of crooked two-dimensional profiles in greenstone belts of the Canadian shield: results from the Swayze area, Ontario, Canada, Geophysical Prospecting, 68, 62–81, https://doi.org/10.1111/1365-2478.12854, 2020.
Ciborowski, T. J. R., Kerr, A. C., Ernst, R. E., McDonald, I., Minifie, M. J., Harlan, S. S., and Millar, I. L.: The Early Proterozoic Matachewan Large Igneous Province: Geochemistry, Petrogenesis, and Implications for Earth Evolution, Journal of Petrology, 56, 1459–1494, https://doi.org/10.1093/petrology/egv038, 2015.
EU Critical Raw Materials Act: Regulation (EU) 2024/1252 of the European Parliament and of the Council of 11 April 2024 establishing a framework for ensuring a secure and sustainable supply of critical raw materials and amending Regulations (EU) No 168/2013, (EU) 2018/858, (EU) 2018/1724 and (EU) 2019/1020.: Official Journal of the European Union, https://eur-lex.europa.eu/eli/reg/2024/1252/oj, last access: 12 November 2024.
European Commission: Directorate-General for Internal Market, Industry, Entrepreneurship and SMEs, Grohol, M. and Veeh, C.: Study on the critical raw materials for the EU 2023 – final report, Publications Office of the European Union, https://doi.org/10.2873/725585, 2023.
Gislason, G., Heinonen, S., Salmirinne, H., Konnunaho, J., and Karinen, T.: KOSE-Koillismaa Seismic Exploration survey: Acquisition, processing and interpretation, GTK:n työraportti-GTK Open File Work Report, 101/2018, 33 pp., Geological survey of Finland, https://hakku.gtk.fi/en/publications?id=21695 (last access: 13 July 2024), 2019.
Górszczyk, A., Malinowski, M., and Bellefleur, G.: Enhancing 3D post-stack seismic data acquired in hardrock environment using 2D curvelet transform, Geophysical Prospecting, 63, 903–918, https://doi.org/10.1111/1365-2478.12234, 2015.
Heaman, L. M.: Global mafic magmatism at 2.45 Ga: Remnants of an ancient large igneous province?, Geology, 25, 299–302, https://doi.org/10.1130/0091-7613(1997)025<0299:GMMAGR>2.3.CO;2, 1997.
Heinonen, S., Nousiainen, M., Karinen, T., and Häkkinen, T.: Are Seismic P-Wave Velocities Capable of Revealing The Deep-Seated Prospective Intrusion?, NSG2022 4th Conference on Geophysics for Mineral Exploration and Mining, 1–5, https://doi.org/10.3997/2214-4609.202220167, 2022.
Hloušek, F., Hellwig, O., and Buske, S.: Improved structural characterization of the Earth's crust at the German Continental Deep Drilling Site using advanced seismic imaging techniques, Journal of Geophysical Research: Solid Earth, 120, 6943–6959, https://doi.org/10.1002/2015JB012330, 2015.
Järvinen, V., Halkoaho, T., Konnunaho, J., Heinonen, J. S., and Rämö, O. T.: Parental magma, magmatic stratigraphy, and reef-type PGE enrichment of the 2.44-Ga mafic-ultramafic Näränkävaara layered intrusion, Northern Finland, Mineralium Deposita, 55, 1535–1560, https://doi.org/10.1007/s00126-019-00934-z, 2020.
Järvinen, V., Karampelas, N., Rämö, T., Halkoaho, T., Törmänen, T., Mikkola, P., and Lahaye, Y.: Secular change of tectonic setting in the Archean Takanen greenstone belt, northeastern Karelia Province, Fennoscandian Shield, Bulletin of the Geological Society of Finland, 95, 107–134, https://doi.org/10.17741/bgsf/95.2.002, 2023.
Karinen, T.: The Koillismaa intrusion, northeastern Finland: evidence for PGE reef forming processes in the layered series, Geological Survey of Finland, https://hakku.gtk.fi/en/publications?id=22154 (last access: 12 July 2024), 2010.
Karinen, T., Heinonen, S., Konnunaho, J., Salmirinne, H., Lahti, I., and Salo, A.: Koillismaa Deep Hole–Solving the mystery of a geophysical anomaly, in: Lithosphere 2021, eleventh symposium on structure, composition and evolution of the lithosphere, Programme and Extended Abstracts, 55–58, https://research.fi/en/results/publication/0374173621 (last access: 15 July 2024), 2021a.
Karinen, T., Salmirinne, H., Lahti, I., Konnunaho, J., S., H., and Salo, A.: The Koillismaa Deep Hole: insight to anomalous mafic intrusion, ARLIN – Online Workshop 1 (Apatity, 25.02.2021), 38–41, https://www.researchgate.net/publication/355906032, 2021b.
Karinen, T., Kurhila, M., Moilanen, M., Konnunaho, J., Salmirinne, H., and Tirroniemi, J.: Chilled margin and marginal reversal formation in the Koillismaa Deep Intrusion: implications for parental magma compositions in the 2.44 Ga Tornio–Näränkävaara Belt, Contributions to Mineralogy and Petrology, 180, 43, https://doi.org/10.1007/s00410-025-02226-4, 2025.
Kärki, A. and Laajoki, K.: An interlinked system of folds and ductile shear zones—late stage Svecokarelian deformation in the central Fennoscandian Shield, Finland, Journal of Structural Geology, 17, 1233–1247, https://doi.org/10.1016/0191-8141(95)00006-Y, 1995.
Köykkä, J., Lahtinen, R., and Manninen, T.: Tectonic evolution, volcanic features and geochemistry of the Paleoproterozoic Salla belt, northern Fennoscandia: From 2.52 to 2.40 Ga LIP stages to ca. 1.92–1.90 Ga collision, Precambrian Research, 371, 106597, https://doi.org/10.1016/j.precamres.2022.106597, 2022.
Makkonen, V.: Korpuan Jatkotutkimus, Rautaruukki Oy Research Report Ou 16/72, Rautaruukki Oy, 1972.
Malehmir, A., Durrheim, R., Bellefleur, G., Urosevic, M., Juhlin, C., White, D. J., Milkereit, B., and Campbell, G.: Seismic methods in mineral exploration and mine planning: A general overview of past and present case histories and a look into the future, Geophysics, 77, WC173–WC190, https://doi.org/10.1190/geo2012-0028.1, 2012.
Malehmir, A., Maries, G., Bäckström, E., Schön, M., and Marsden, P.: Developing cost-effective seismic mineral exploration methods using a landstreamer and a drophammer, Scientific Reports, 7, 10325, https://doi.org/10.1038/s41598-017-10451-6, 2017.
Malinowski, M., Brodic, B., Martinkauppi, I., Koskela, E., and Laakso, V.: Distributed acoustic sensing vertical seismic profiling in hardrock environment: case study from Koillismaa drillhole, Finland, 84th EAGE Annual Conference & Exhibition, 1–5, https://doi.org/10.3997/2214-4609.2023101043, 2023.
Malinowski, M., Karinen, T., Autio, U., Heinonen, S., Singh, B., Górszczyk, A., Sito, L., and the SEEMS DEEP Working Group: Uncovering the deep structure of the Koillismaa Layered Intrusion Complex, Finland using a novel 3D seismic survey, EGUsphere [preprint], https://doi.org/10.5194/egusphere-2025-3111, 2025.
Markovic, M., Maries, G., Malehmir, A., Ketelhodt, J. von, Bäckström, E., Schön, M., and Marsden, P.: Deep reflection seismic imaging of iron-oxide deposits in the Ludvika mining area of central Sweden, Geophysical Prospecting, 68, 7–23, https://doi.org/10.1111/1365-2478.12855, 2020.
Milkereit, B., Berrer, E. K., King, A. R., Watts, A. H., Roberts, B., Erick, A., Eaton, D. W., Wu, J., and Salisbury, M. H.: Development of 3-D seismic exploration technology for deep nickel-copper deposits – A case history from the Sudbury basin, Canada3-D Seismic Exploration Technology, Geophysics, 65, 1890–1899, https://doi.org/10.1190/1.1444873, 2000.
Nedimović, M. R. and West, G. F.: Crooked-line 2D seismic reflection imaging in crystalline terrains: Part 2, migration, Geophysics, 68, 286–296, https://doi.org/10.1190/1.1543214, 2003.
Nousiainen, M., Heinonen, S., and Karinen, T.: Petrophysics of the Koillismaa drill hole, in: Lithosphere 2022: twelfth symposium on the structure, composition and evolution of the lithosphere, Report – Institute of Seismology, University of Helsinki, 131–134, http://hdl.handle.net/10138/350596 (last access: 23 Feb 2024), 2022.
Ripley, E. M. and Li, C.: Chapter 3 – Metallic Ore Deposits Associated With Mafic to Ultramafic Igneous Rocks, in: Processes and Ore Deposits of Ultramafic-Mafic Magmas through Space and Time, edited by: Mondal, S. K. and Griffin, W. L., Elsevier, 79–111, https://doi.org/10.1016/B978-0-12-811159-8.00004-4, 2018.
Salmirinne, H. and Iljina, M.: Koillismaan kerrosintruusiokompleksin tulokanavamuodostuman painovoimatulkinta ja alueen malmimahdollisuudet (osa 1), GTK:n arkistoraportit, https://hakku.gtk.fi/en/publications?id=14126 (last access: 1 July 2024), 2003.
Schulz, K. J., Woodruff, L. G., Nicholson, S. W., Ii, R. R. S., Piatak, N. M., Chandler, V. W., and Mars, J. L.: Occurrence model for magmatic sulfide-rich nickel-copper-(platinum-group element) deposits related to mafic and ultramafic dike-sill complexes, Scientific Investigations Report, U. S. Geological Survey, https://doi.org/10.3133/sir20105070I, 2014.
Singh, B. and Malinowski, M.: Depth Imaging of Crooked Seismic Profiles in Hardrock Environment: Is 2D Enough?, NSG2022 4th Conference on Geophysics for Mineral Exploration and Mining, 1–5, https://doi.org/10.3997/2214-4609.202220169, 2022.
Singh, B. and Malinowski, M.: Seismic Imaging of Mineral Exploration Targets: Evaluation of Ray- vs. Wave-Equation-Based Pre-Stack Depth Migrations for Crooked 2D Profiles, Minerals, 13, 264, https://doi.org/10.3390/min13020264, 2023.
Skyttä, P., Piippo, S., Kloppenburg, A., and Corti, G.: 2.45 Ga break-up of the Archaean continent in Northern Fennoscandia: Rifting dynamics and the role of inherited structures within the Archaean basement, Precambrian Research, 324, 303–323, https://doi.org/10.1016/j.precamres.2019.02.004, 2019.
Tirronniemi, J., Bischoff, A., Malinowski, M., Autio, U., Karinen, T., Lukkarinen, V., Heinonen, S., Mikkola, P., Leskelä, T., Patzer, C., Piipponen, K., Nousiainen, M., Hakala, P., Martinkauppi, I., Anttilainen, T., Engström, J., Konnunaho, J., Telkkälä, P., and Haavikko, S.: Koillismaa Deep Hole Final Report, GTK Open File Work Report, 77 pp., https://hakku.gtk.fi/en/publications?id=22284 (last access: 1 July 2024), 2024.
- Abstract
- Introduction
- Geology of the area, previous geophysical studies, and petrophysical analysis
- Data Acquisition
- Data Processing
- Results
- Interpretation and Discussion
- Conclusions
- Data availability
- Team list
- Author contributions
- Competing interests
- Disclaimer
- Special issue statement
- Acknowledgements
- Financial support
- Review statement
- References