the Creative Commons Attribution 4.0 License.
the Creative Commons Attribution 4.0 License.
 | 14 Nov 2025
Passive seismic imaging of the Lower Palaeozoic in the Sudret area of Gotland, Sweden
Zhihui Wang
Christopher Juhlin
Peter Hedin
Mikael Erlström
Daniel Sopher
Passive seismic data were acquired together with active seismic data along a 2.8 km long profile in the Sudret area of Gotland, Sweden, as part of a feasibility study for storage of CO2 below the Baltic Sea. Seismic interferometry using cross-correlation and cross-coherence was employed on the passive seismic data. Cross-correlation was used to retrieve virtual shot gathers containing mainly surface waves, while cross-coherence was used to retrieve mainly seismic reflections. Inversion for shear wave velocity and CDP processing of the passive data result in velocity profiles and images that correlate well with borehole data, synthetic seismograms and active seismic data acquired at the site. Interpretations of the passive surface wave and body wave results provide geological information which complement the active data results, the surface waves providing S-wave velocity information and the body waves providing an image that may have better signal quality at deeper levels. Results from the active seismic and passive seismic data correlate well and there is no indication of any large-scale faults in the area. Furthermore, analysis of the frequency and direction of the ambient noise using power spectral density and beam forming show that ocean waves and human activity around the island of Gotland make the Sudret area an ideal location for passive imaging through ambient noise interferometry. Our results illustrate that passive seismic imaging can be an important complement to active seismic data for structural studies of the subsurface with respect to CO2 storage and monitoring in the Gotland area, Sweden, and perhaps elsewhere.
- Article
(15557 KB) - Full-text XML
- BibTeX
- EndNote


Carbon capture and storage (CCS) is a strategy that can be employed for reducing atmospheric emissions of greenhouse gases and thereby their adverse effects on the climate (Niemi et al., 2017). A large theoretical capacity to store carbon dioxide (CO2) in the Palaeozoic sedimentary successions within the Baltic Basin exists, including large saline aquifers and depleted oil and gas fields (Anthonsen, 2013; Sopher et al., 2014; Shogenova et al., 2021). Identification and characterization of potential storage sites are important cornerstones for establishing safe geological storage of CO2 (Lüth et al., 2017). In Sweden, sedimentary strata potentially suitable for CO2 storage are only found in the Baltic Basin, south of Gotland and in southwest Skåne and adjacent offshore areas. During the past few years, the Geological Survey of Sweden (SGU) has been investigating suitable locations for CO2 storage offshore. Two Swedish marine areas with potential for storage are being investigated, one south of Skåne in southern Sweden and one in the southeastern part of the Baltic sea (https://www.sgu.se/, last access: 7 November 2025). These areas contain deeply seated porous reservoir sandstones capped by thick caprock which could provide the prerequisites for safe storage of CO2. Because drilling at sea is costly, as well as complex, two boreholes were drilled down to about 800 m in the Sudret area on south Gotland where the sandstones are found deepest onshore and can be used as analogs to the offshore area. In November 2023, reflection seismic data were acquired in the vicinity of the two boreholes to provide a better understanding of the sedimentary strata and the local subsurface structural framework (Juhlin et al., 2025).
Active seismic reflection surveying and distributed acoustic sensing (DAS) with high resolution have been the dominant methods for imaging and monitoring CO2 storage sites (Juhlin et al., 2007; Alcalde et al., 2014; Pevzner et al., 2015; Roach et al., 2015; White et al., 2015, 2022; Huang et al., 2016; Zhang et al., 2016; Cheraghi et al., 2017; Harris et al., 2017; Lüth et al., 2017; Ivandic et al., 2018; Papadopoulou et al., 2023, 2024; Wang and Lawton, 2024; Zappalà et al., 2024). However, active-source seismic surveys suffer from the high cost of data acquisition and lack of continuous monitoring for sudden temporal variations (Ikeda et al., 2017). Several studies show that passive seismic surveying could be a complement to CO2 geological storage monitoring (De Ridder and Biondi, 2012; Riahi et al., 2013; Boullenger et al., 2015; Gassenmeier et al., 2015; Cheraghi et al., 2017; Cao and Askari, 2019; Xu et al., 2012; Hassing et al., 2024). Potential advantages of the technique are that it is relatively environmentally, friendly and cost effective, as it uses ambient noise as a source.
Our investigation recorded 14 h of continuous passive data along a 2.8 km long profile to retrieve virtual shot gathers using seismic interferometry. First we present examples of ambient noise data that include surface waves and body waves. These data are analysed for their frequency content and directionality to determine if seismic interferometry is suitable to apply to the data set. Secondly, cross-correlation and cross-coherence calculations were performed to retrieve surface waves and body waves, respectively. Subsequently, standard surface wave and seismic reflection data processing were employed to obtain a shear wave velocity model and a seismic reflection stacked section. Both the body waves and surface waves provide high-quality images and have good consistency with the borehole section, geophysical logging and the active seismic data from the same location. Moreover, the results reveal some potential deep geological information which the active data could not provide due to energy limitations of the 500 kg weight drop hammer used as a source. Finally, we discuss the comparisons of active and passive data results and the relevance of our results for CO2 storage and seismic imaging.
The test site is situated on Sudret, the southernmost part of Gotland Island, which lies in the central Baltic Sea (Fig. 1a). The present investigation is furthermore focused around the cored borehole Nore-1 drilled in 2024 to 791 m depth (Erlström et al., 2024). Nore-1 and the neighboring Nore-2 borehole were drilled by the Geological Survey of Sweden in 2023 within a CO2 investigation program launched by the Swedish Government with the objective to investigate three potential Cambrian sandstone reservoirs, as well as studying the overlying Ordovician and Silurian sealing strata. The Nore-1 borehole intersected a 778 m thick sedimentary succession on top of porphyritic potassium-rich granite basement (Fig. 1b and c). At the base of the sedimentary succession there is a ca. 220 m thick Lower and Middle Cambrian interval which includes three 20 to 50 m thick sandstone units, i.e. the Viklau, När and Faludden sandstones, with intermediate layers of silty claystone and mudstone. The three potential reservoirs for CO2 storage are located at the depths of 554–575, 677–706 and 728–778 m, respectively. The uppermost unit, i.e. the Faludden Sandstone, is the most promising candidate for CO2 storage. The overlying Ordovician interval between 472 and 554 m depth comprises variably argillaceous limestone and calcareous mudstone. The top of the Ordovician has strong reflectivity according to results of the active seismic data analysis (Juhlin et al., 2025). One interval in the Ordovician, between 492 and 505 m depth, stands out due to its bentonite and mudstone layers. This unit has been consistently penetrated in existing wells on Gotland and can be identified in most of the available geophysical well logs. Furthermore, with relatively high frequency seismic reflection data, a reflection can be observed to be associated with this interval (Erlström and Sopher, 2019). Overlying the Ordovician is a 472 m thick Silurian succession, which from 118 m depth down to the Ordovician mainly comprises marlstone and calcareous claystone with subtle lithological variations. Besides a 55 m thick mudstone above the Ordovician, and two relatively thin limestone-dominated intervals at 400 and 310 m, which can be correlated between wells, most of the interval between 118–472 m is poorly lithostratigraphically defined. The uppermost part of the Silurian from 118 m depth to the top of the bedrock consists of a mixed interval with limestone, mudstone, sandstone and reef limestone, representing the Eke, Burgsvik and Hamra-Sundre formations. The Eke limestone between 107 and 118 m stands out as a significant marker in the geophysical logs in all wells on south Gotland. Above the Eke limestone follows the ca. 50 m thick Burgsvik interval with alternating layers of fine-grained sandstone and calcareous mudstone. The uppermost part of the Silurian present in the Sudret area consists of relatively coarse-grained carbonates of the Hamra and Sundre formations. The Quaternary deposits are up to ca. 4 m thick in the study area and mainly consist of sandy and pebbly deposits.

Figure 1(a) The experimental site shown as the red star located in southern Gotland, Sweden. (b) Locations of survey line and borehole Nore-1. For clarity, every tenth receiver and source location are shown. Receivers are marked by the yellow triangles, and source locations are represented by the orange triangles. Both receiver spacing and source spacing were 10 m. The blue hollow circle shows the Nore-1 borehole location (the aerial image from ©Google Maps). (c) Mapped Nore-1 borehole lithology.
3.1 Active and passive data acquisition
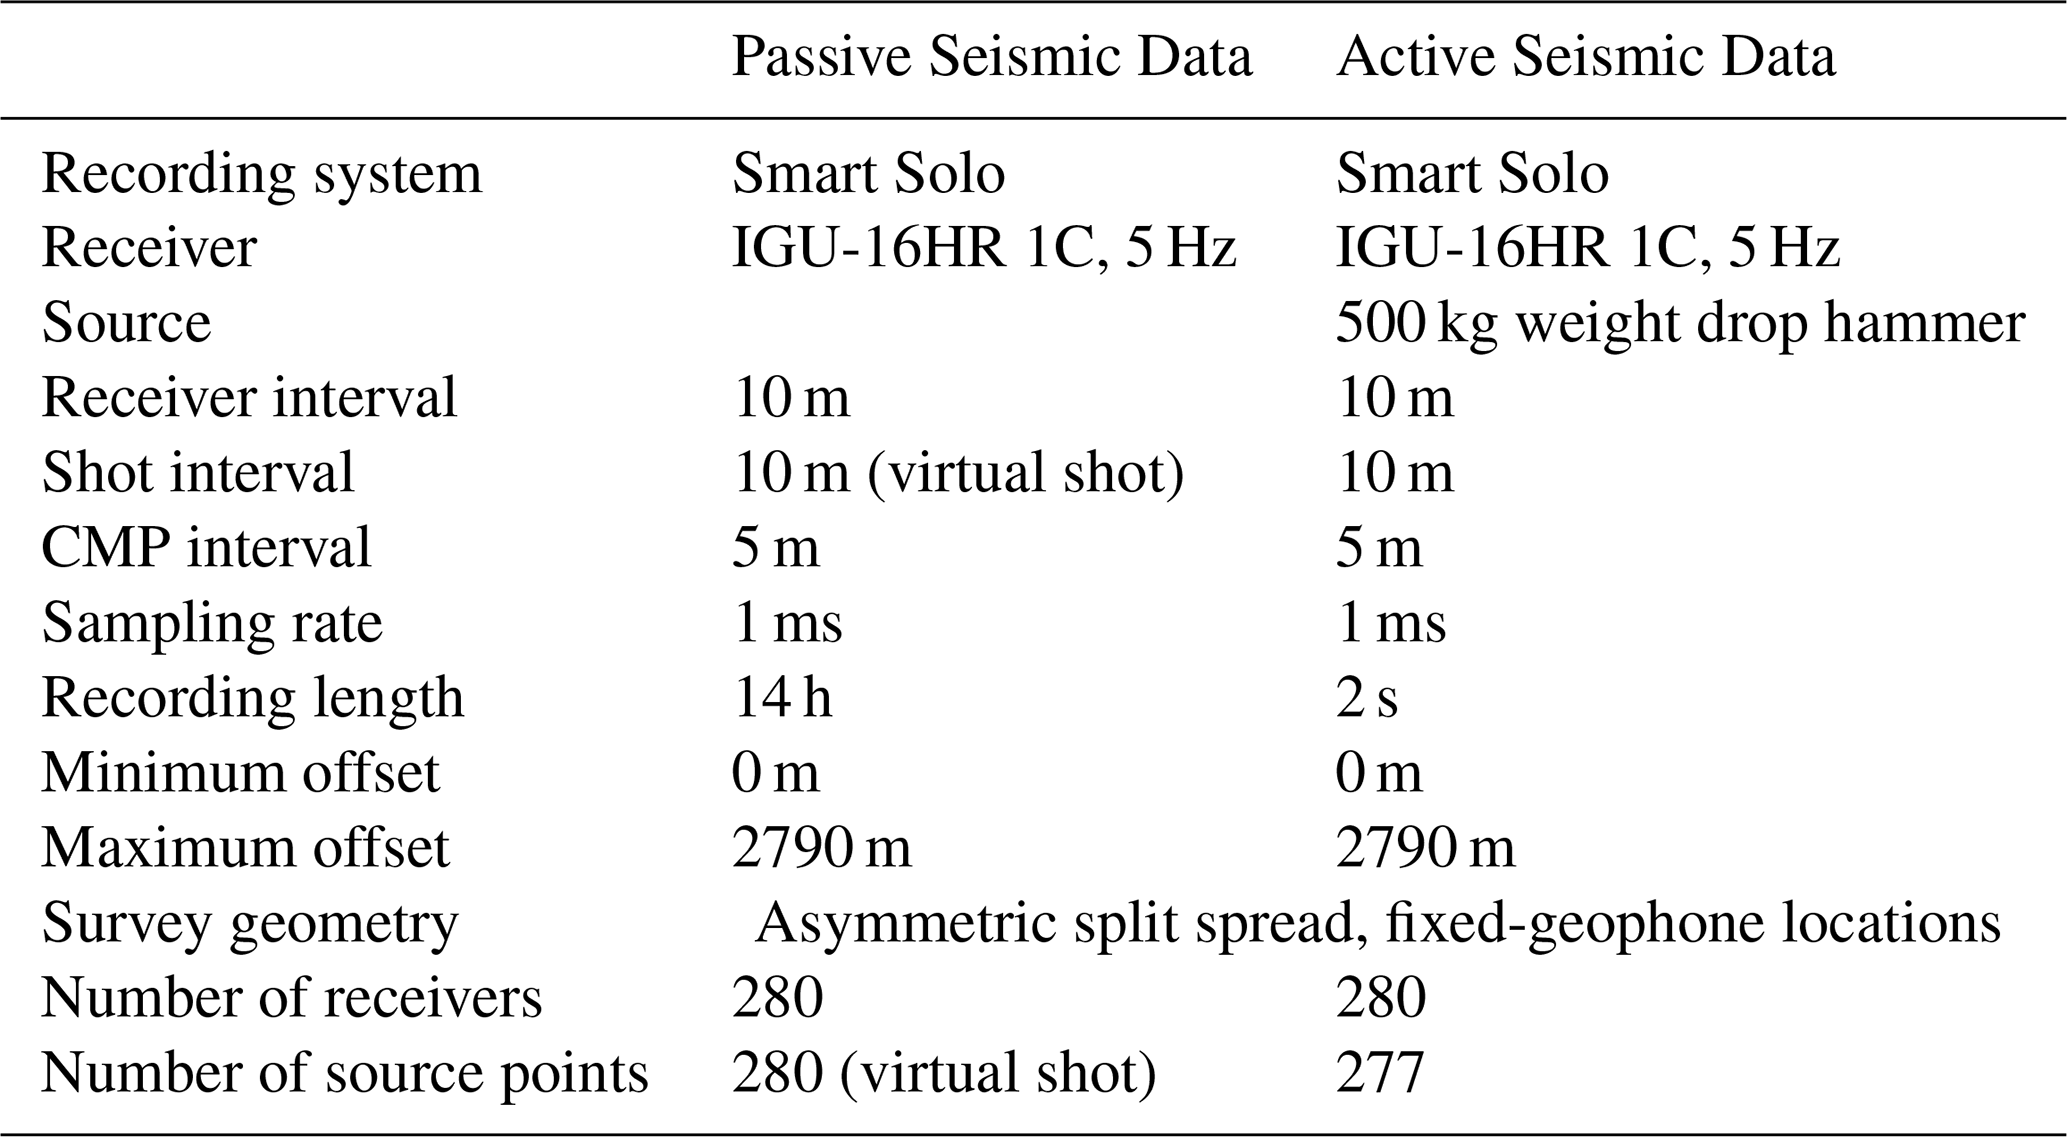
In order to image the subsurface down to the Precambrian basement in the vicinity of the two boreholes that had been drilled earlier and to investigate if any faults could be observed in the sedimentary strata a 2D active seismic survey was carried out from 12 November 2023 to 13 November 2023. This 2D survey was part of a larger investigation of the area that included a small 3D survey (Juhlin et al., 2025). A skid-steer loader with a 500 kg weight drop hammer with iron plate was used as a source and 329 5 Hz SmartSolo nodal units were available for recording. After acquiring the active data, ambient noise data from 17:00 on 12 November 2023 to 07:00 on 13 November 2023 (UTC+1) were recorded along the 2.8 km long profile with 10 m receiver spacing and 1 ms sample rate (Table 1).
Table 1Active and passive seismic data acquisition parameters for the Sudret area on Gotland, Sweden.
3.2 Ambient noise data analysis
Two continuous data recordings were picked out to demonstrate surface waves and body waves included in the ambient noise data (Fig. 2). Surface waves are clear and have a velocity of about 1500 m s−1 in Fig. 2a. Body waves are dominant after filtering out low frequency signals with a bandpass filter of 5–6–20–25 Hz and their linear apparent velocity is about 4000 m s−1 (Fig. 2b). To better understand the time-variant nature of the ambient noise sources, 14 1 h power spectral density panels (Fig. 3) were calculated for every two stations from receiver No. 79 to No. 358 from 17:00 on 12 November 2023 to 07:00 on 13 November 2023 (UTC+1). All plots show good consistency except the last one at 06:00–07:00, indicating the frequency components of the noise sources were stable during data acquisition. Unlike the active seismic data with certain energy and location of sources, passive data relies on natural and anthropogenic sources, such as seismic energy generated from ocean-wave-induced microseisms (0.03–1 Hz), distant earthquakes (<1 Hz), traffic (>1 Hz) and so on (Nimiya et al., 2021; Bertoldi et al., 2024). In our study, ambient noise data were observed at frequencies of 0.5–20 Hz in each panel. Four peaks at the frequencies of 1, 5, 12 and 16 Hz originate from ocean waves and human activities. These frequencies all contribute to retrieving the virtual source gathers. Surface waves dominate at the frequencies of 0.5–7 Hz, whereas body waves dominate at 7–20 Hz.
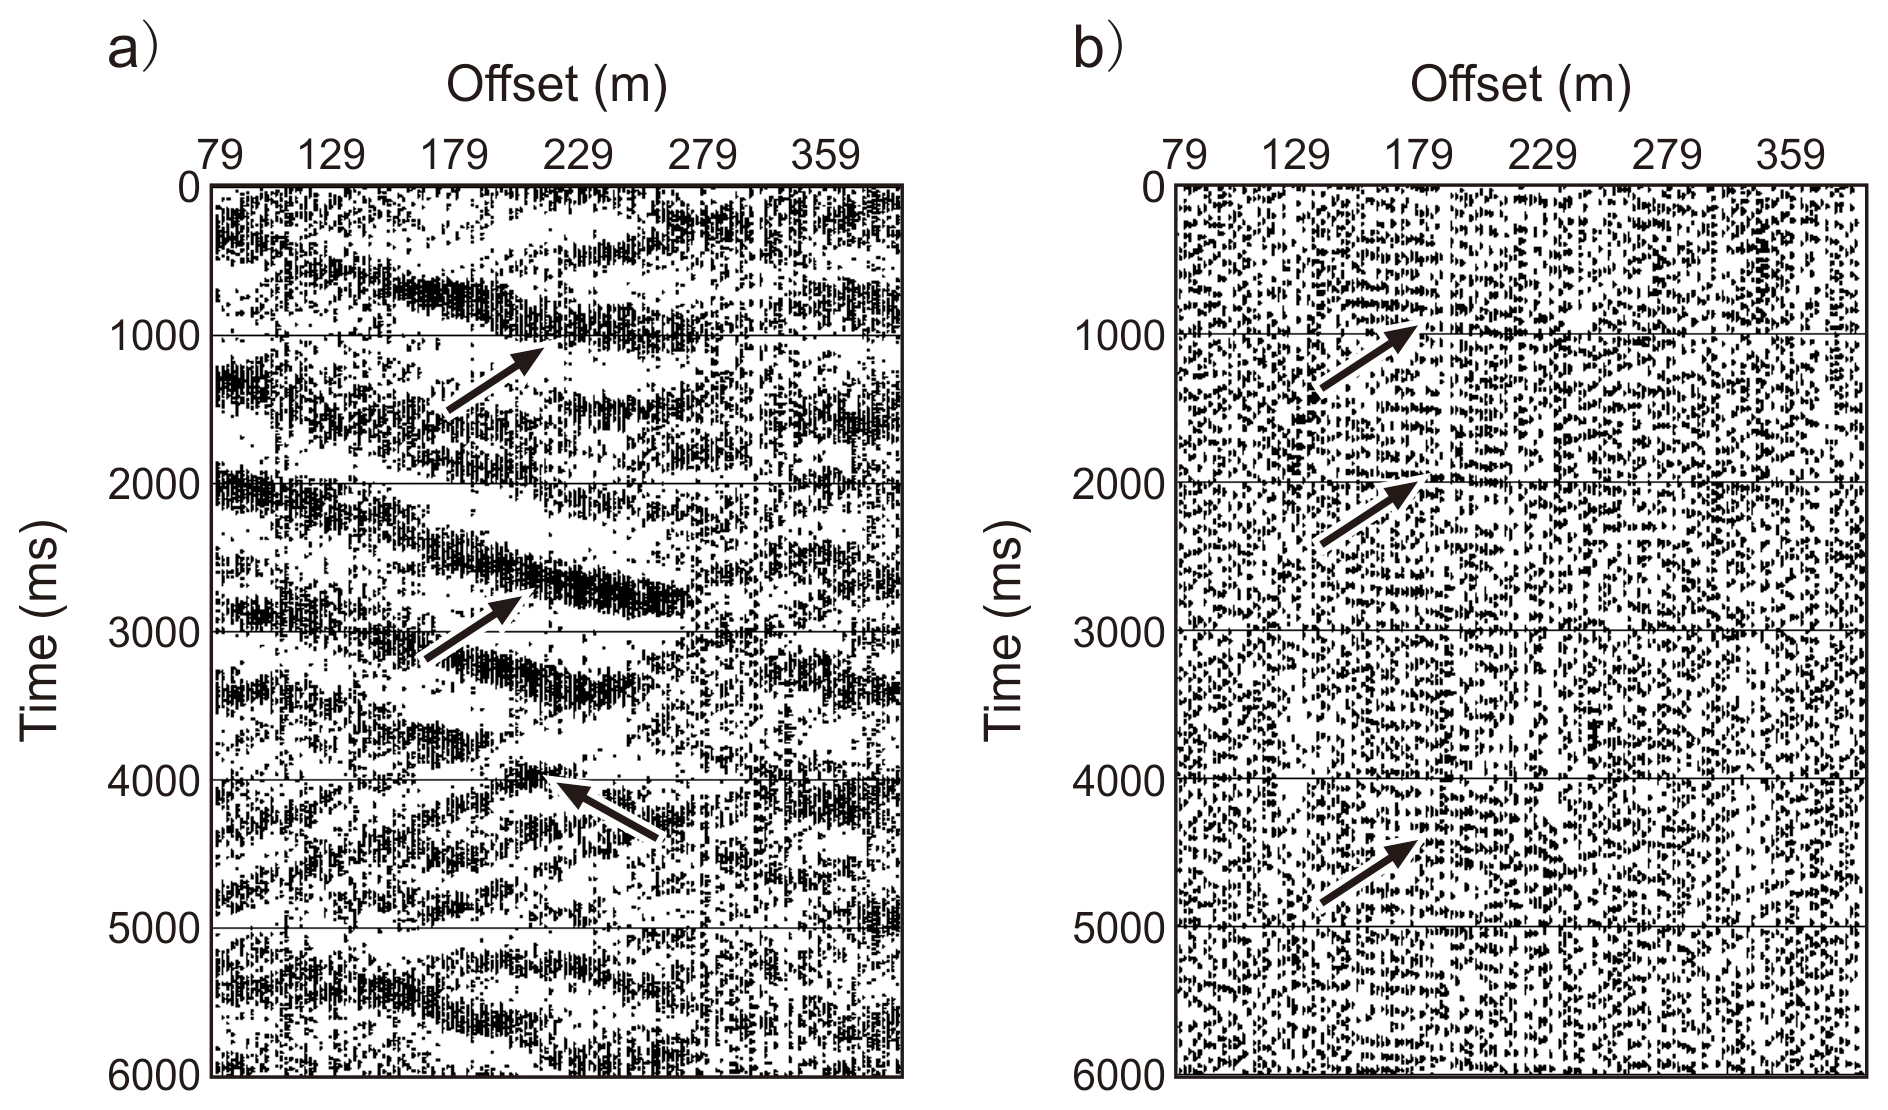
Figure 2Continuous ambient noise data recordings at different times to display surface waves and body waves. (a) Ambient data recording dominated by surface waves after applying a bandpass filter of 0.5–1–40–50 Hz. (b) Ambient data recording dominated body waves after applying a bandpass filter of 5–6–20–25 Hz.
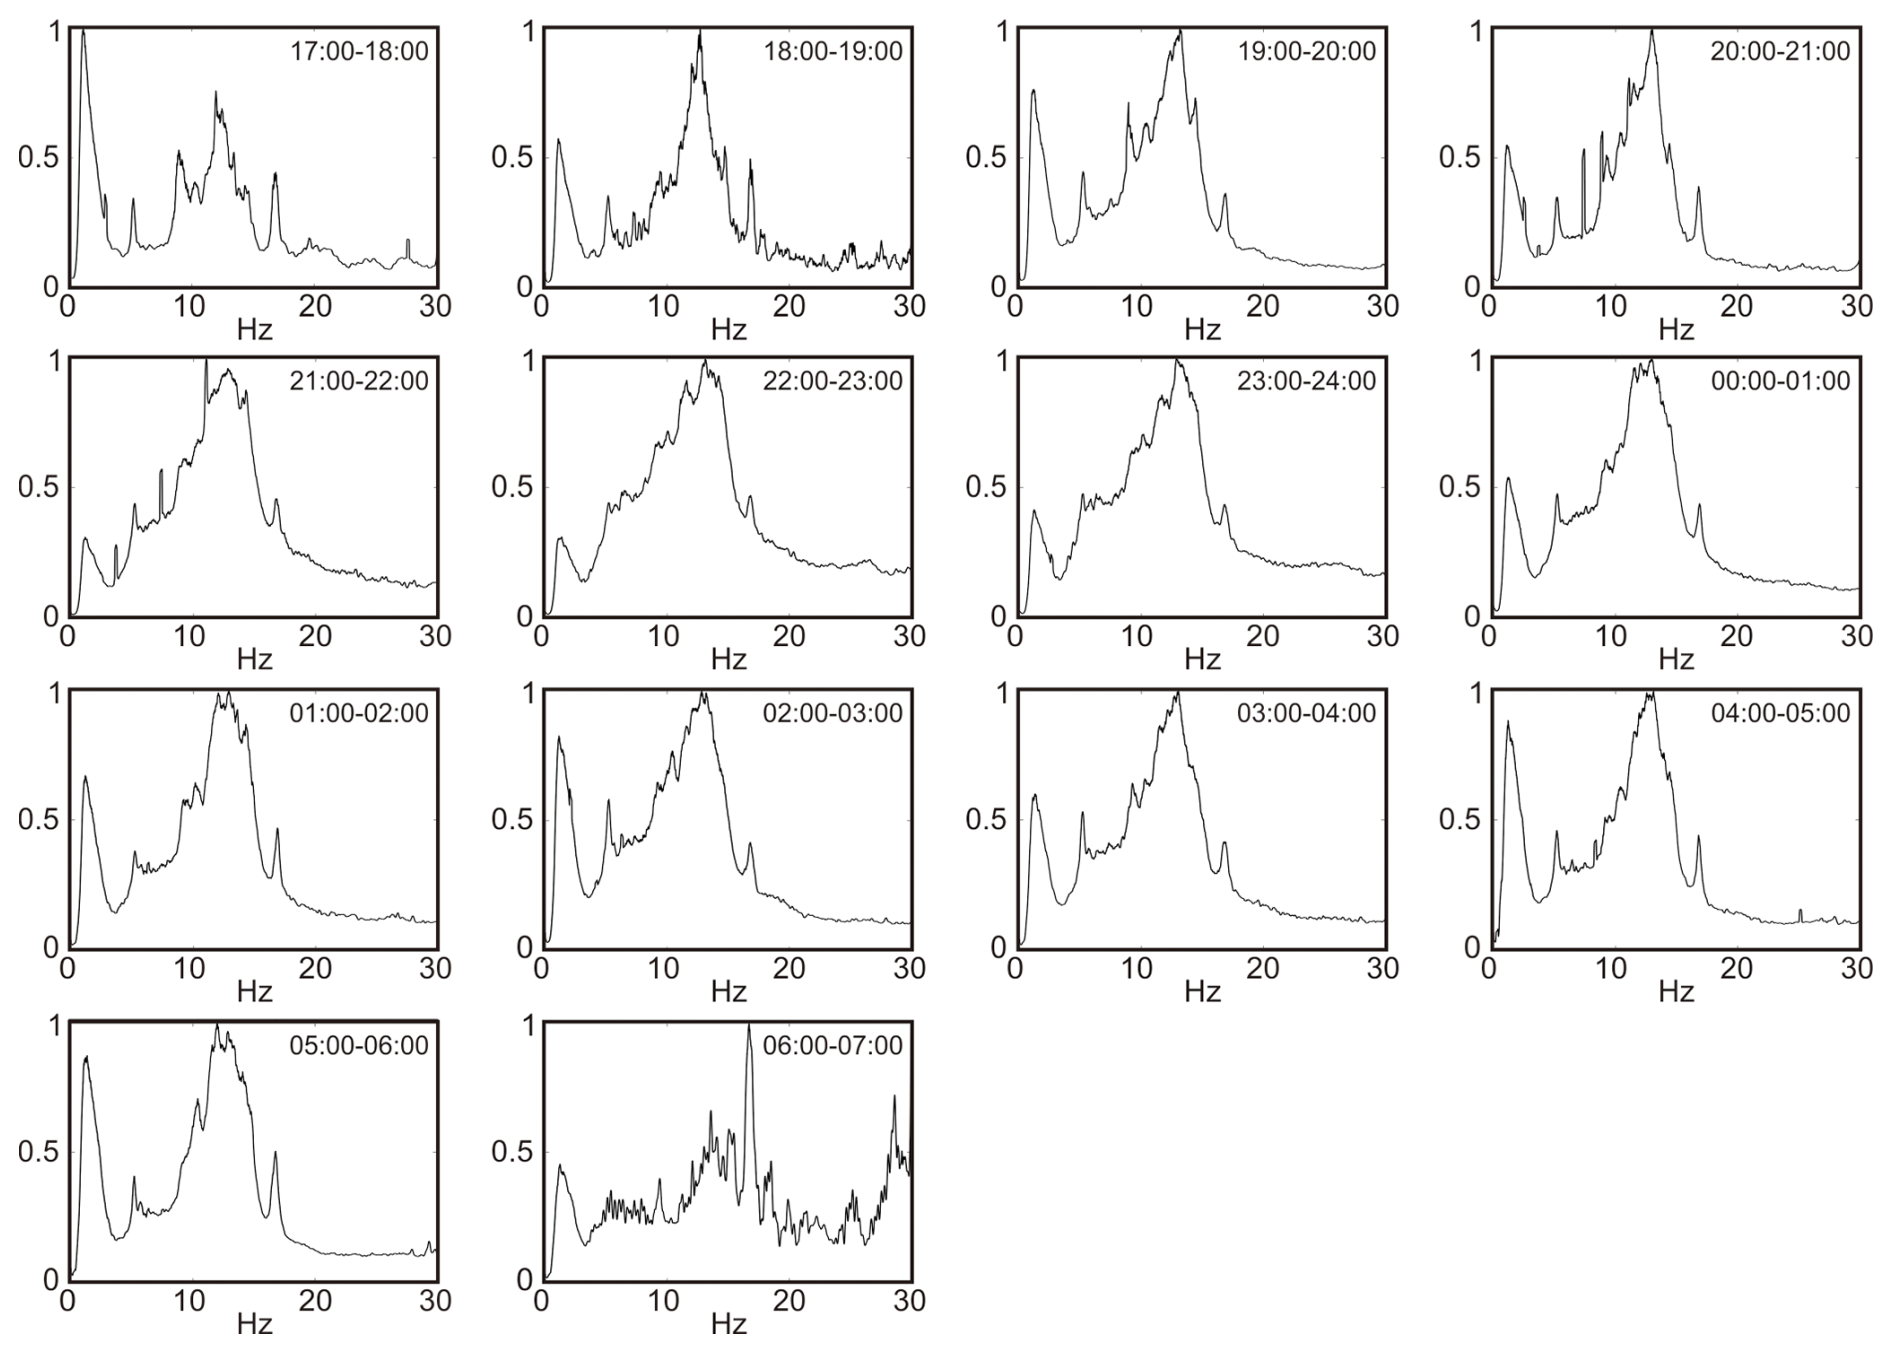
Figure 3Amplitude spectra normalization of 1 h ambient noise recordings continuously from 17:00 on 12 November 2023 to 07:00 on 13 November 2023 (UTC+1).
After the power spectrum density analysis, we evaluate the spatial distributions of the ambient noise sources at the experimental site. A beam forming analysis (Gouédard et al., 2008; Cheraghi et al., 2015) of receiver stations No. 6, No. 49 and No. 185, forming a triangle, was performed with 14 h of continuous passive data. Figure 4a and b represent the maximum beam power in the frequency ranges of 0.5–7 and 7–20 Hz, respectively. The recorded wavefield of surface waves with a velocity less than 4000 m s−1 came from the NNW and the azimuth of the ambient noise sources are consistent with the seismic survey line (green lines) and located in the stationary-phase regions. This implies the Green's function and its time-reversed variant would be retrieved equally well. The ambient noise sources for the body waves are scattered in several directions at a velocity higher than 3000 m s−1 and related to anthropogenic sources originating from human activities around the island of Gotland, such as in mainland Sweden, Finland, Estonia, Poland, Germany, Denmark, Norway, etc. (Fig. 1a). This implies that body waves probably can be retrieved from our ambient noise data.
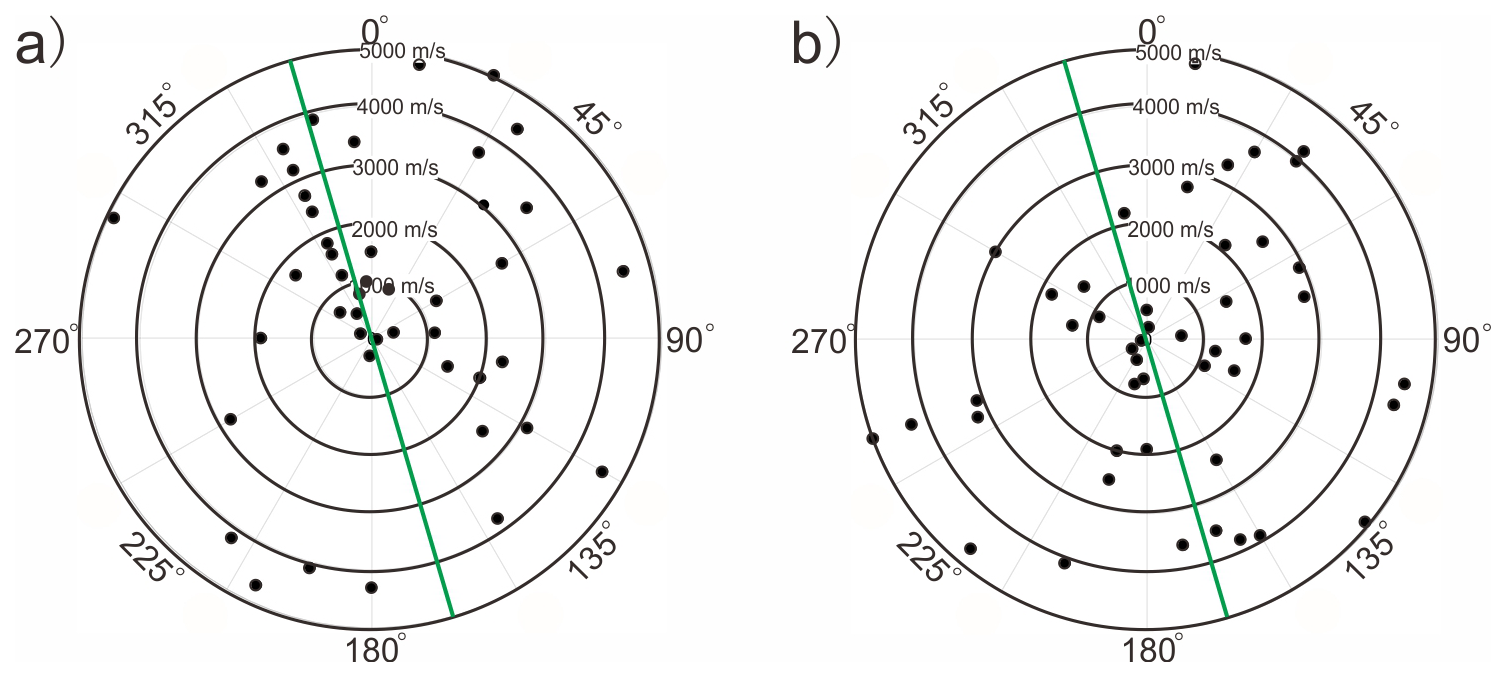
Figure 4Directional beam forming analysis of ambient sources with different frequency components. (a) The maximum values of normalized strength of source energy at the frequencies of 0.5–7 Hz. (b) The maximum values of normalized strength of source energy at the frequencies of 7–20 Hz. The green lines show the azimuth of the seismic profile.
3.3 Data pre-processing
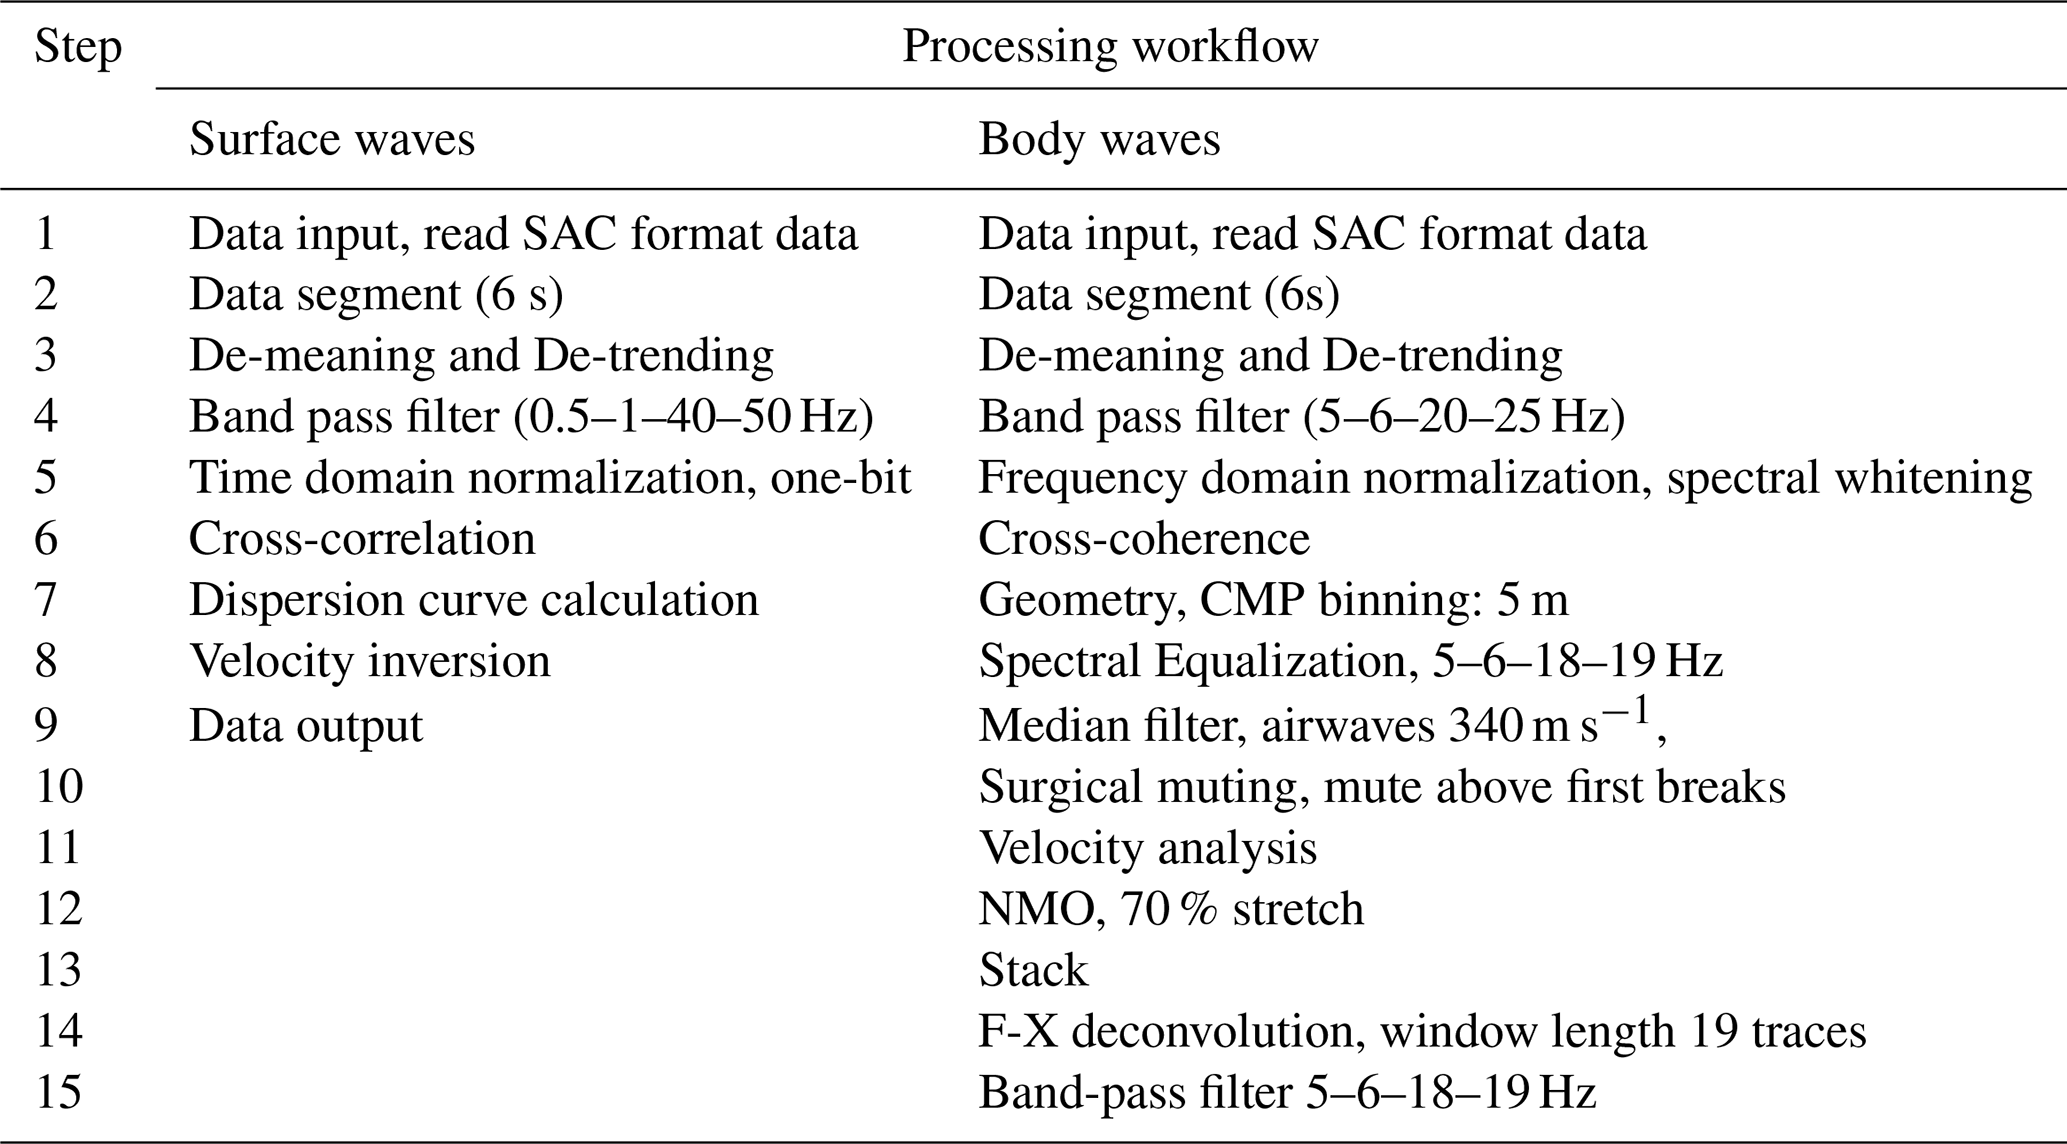
Prior to applying seismic interferometry, standard data pre-processing was applied to the ambient noise data (Table 2). We removed the mean and de-trended the recordings and afterwards separated 14 h of continuous ambient noise data into 8400 segments with 6 s length. Then, normalization and bandpass filtering with different parameters were applied to extract the surface and body waves from the ambient noise data. For the surface waves, a bandpass filter with corner frequencies of 0.5–1–40–50 Hz was used to filter out too low/high-frequency components to avoid producing noise during the cross-correlation calculation. Prior to cross-correlation, normalization in the time domain was applied. For the body waves, a bandpass filter with corner frequencies of 5–6–20–25 Hz and spectral whitening in the frequency domain were applied to suppress surface waves and enhance reflected energy.
3.4 Retrieving Green's function by cross-correlation and cross-coherence
The wavefield generated by a noise source can be represented by the convolution of the source wavelet and a Green's function. Since Claerbout (1968) first proposed that the reflection response of a horizontally layered medium can be obtained from one side of the autocorrelation of its transmission response, different seismic interferometry techniques have been developed and improved to retrieve the Green's function and characterize the seismic wave propagation between two receivers (Cole, 1995; Rickett and Claerbout, 1999; Schuster, 2001; Campillo and Paul, 2003; Bakulin and Calvert, 2006; Draganov et al., 2009; Wapenaar et al., 2004, Shapiro et al., 2005; Snieder, 2004; Wapenaar and Fokkema, 2006; Prieto et al., 2009; Nakata et al., 2015; Meles et al., 2015; Olivier et al., 2015; Oren and Nowack, 2017). However, the different methods have both strengths and weaknesses, for example, cross-correlation is stable, clearer and less noisy and cross-coherence can enhance temporal resolution and be able to retrieve body wave data (Snieder et al., 2009; Nakata et al., 2011; Zhang et al., 2019). Here, we use cross-correlation (Wapenaar and Fokkema, 2006) and cross-coherence (Nakata et al., 2011) of the ambient noise data recorded at different receivers to retrieve approximations of Green's functions (Fig. 5) after data pre-processing. Strong surface waves are observed on the causal and acausal parts and airwaves are only retrieved on the acausal part through the cross-correlation calculation (Fig. 5a). The symmetry between the causal and acausal parts of the cross-correlation functions suggests a noise directionality that correlates well with the directional beam forming analysis (Fig. 4a). The body wave signatures of cross-coherence functions are shown in Fig. 5b. The direct or diving S-wave (SPW) and airwaves are clear in the acausal part of positive-offset traces and causal part of negative-offset traces (quadrant 1 and quadrant 3 in Fig. 5b), while the direct or diving P-wave (DPW) and reflections are observed in the causal part of positive-offset traces and acausal part of negative-offset traces (quadrant 2 and quadrant 4 in Fig. 5b). Existing research has demonstrated that more complete results are obtained when the causal and acausal correlation results are summed if the ambient-noise sources do not illuminate the receiver stations from all directions with comparable strength or in the stationary-phase regions (Draganov et al., 2013; Wilczynski et al., 2025). Therefore, the summed causal and acausal parts were used to construct the virtual shot gathers of surface waves and body waves.
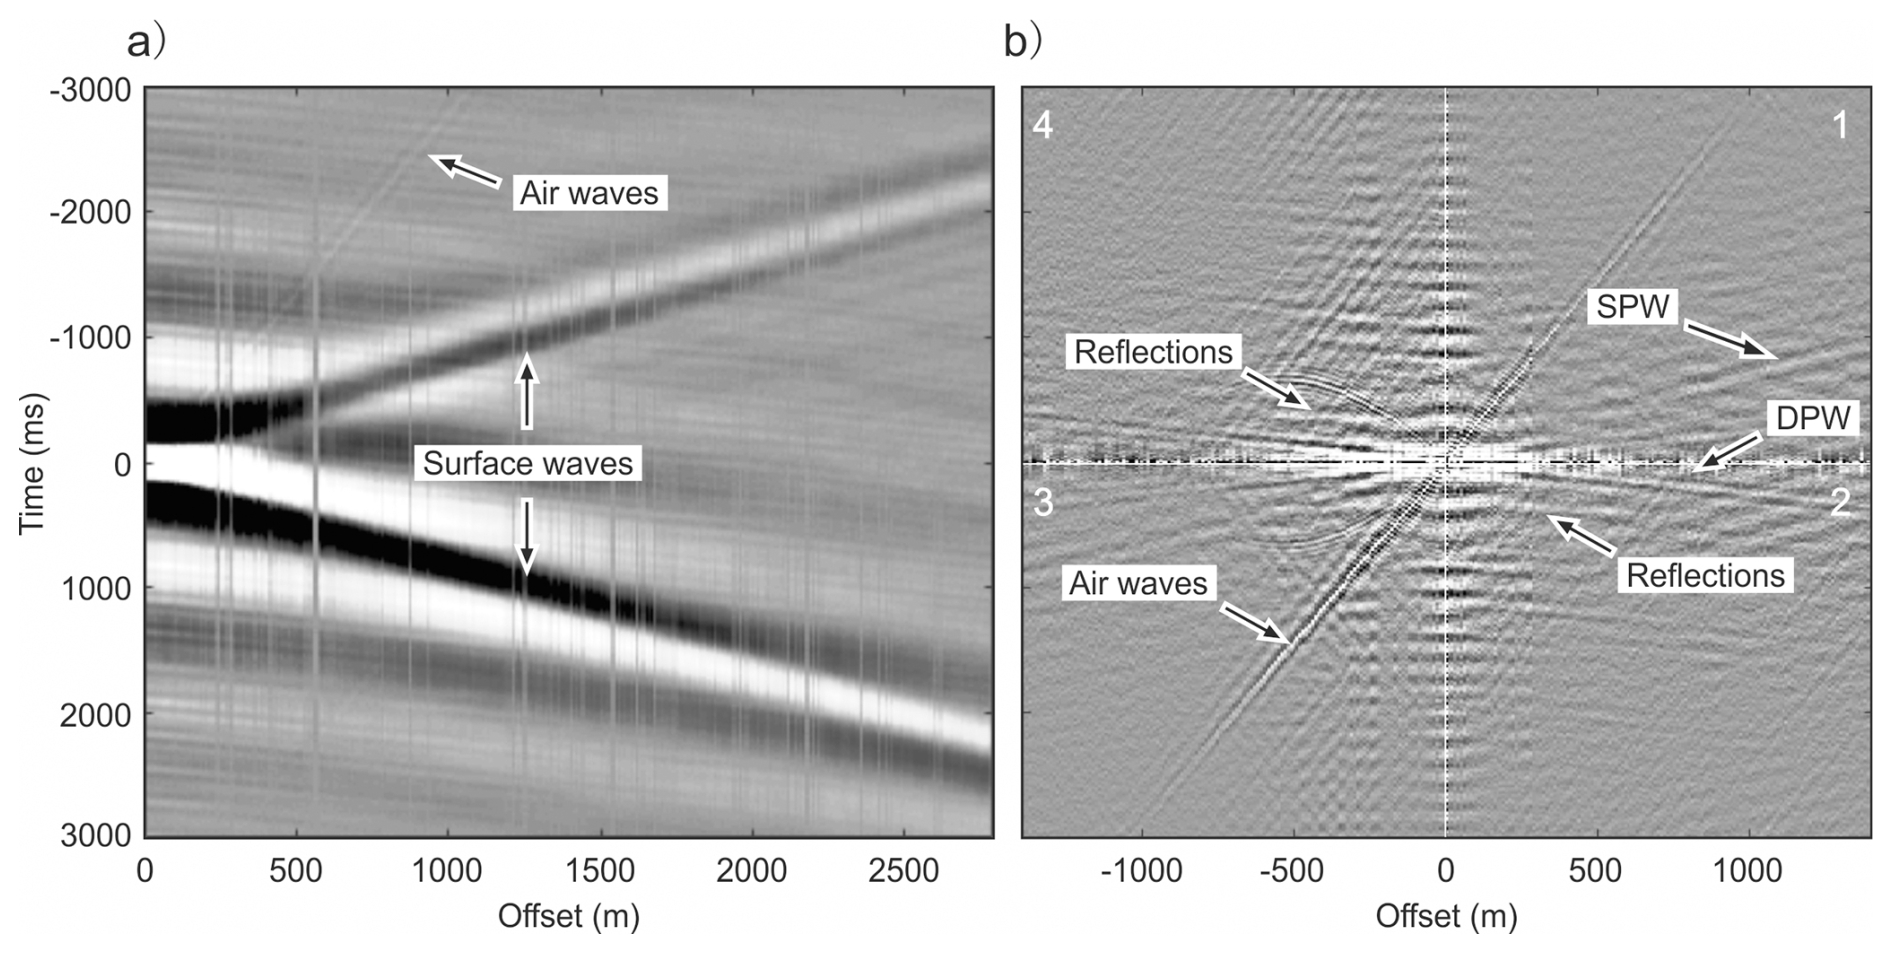
Figure 5(a) Noise cross-correlation results with both causal and acausal parts at source location No. 79; (b) Noise cross-coherence results at source location No. 224, DPW and SPW represent the direct or diving P-wave and the direct S-wave, respectively. Numbers mark different quadrants in the time-offset coordinate system.
4.1 Dispersion curve extraction
A total of 90 source gathers were retrieved by cross-correlation (Wapenaar and Fokkema, 2006) from receiver number 79 to 358 (see Fig. 1b for locations). Each retrieved source gather consists of 191 nodal units with a 3 s recording length and 0–1900 m offsets. Figure 6a shows a retrieved source gather and its dispersion diagram, the surface wave dominates in the virtual source recording and a reliable frequency curve within the window 0.8–5.5 Hz can be picked (Fig. 6b). The dispersion curves from different source gathers shown in Fig. 6c have a good consistency and suggest that we have obtained high signal-to-noise ratio surface wave data and that the structural variation in the horizontal direction is minor in this area.

Figure 6(a) Retrieved source gather for surface waves at source location No. 79; (b) dispersion diagram from (a); (c) Extracted dispersion curves plotted for all survey points.
4.2 Dispersion curve inversion
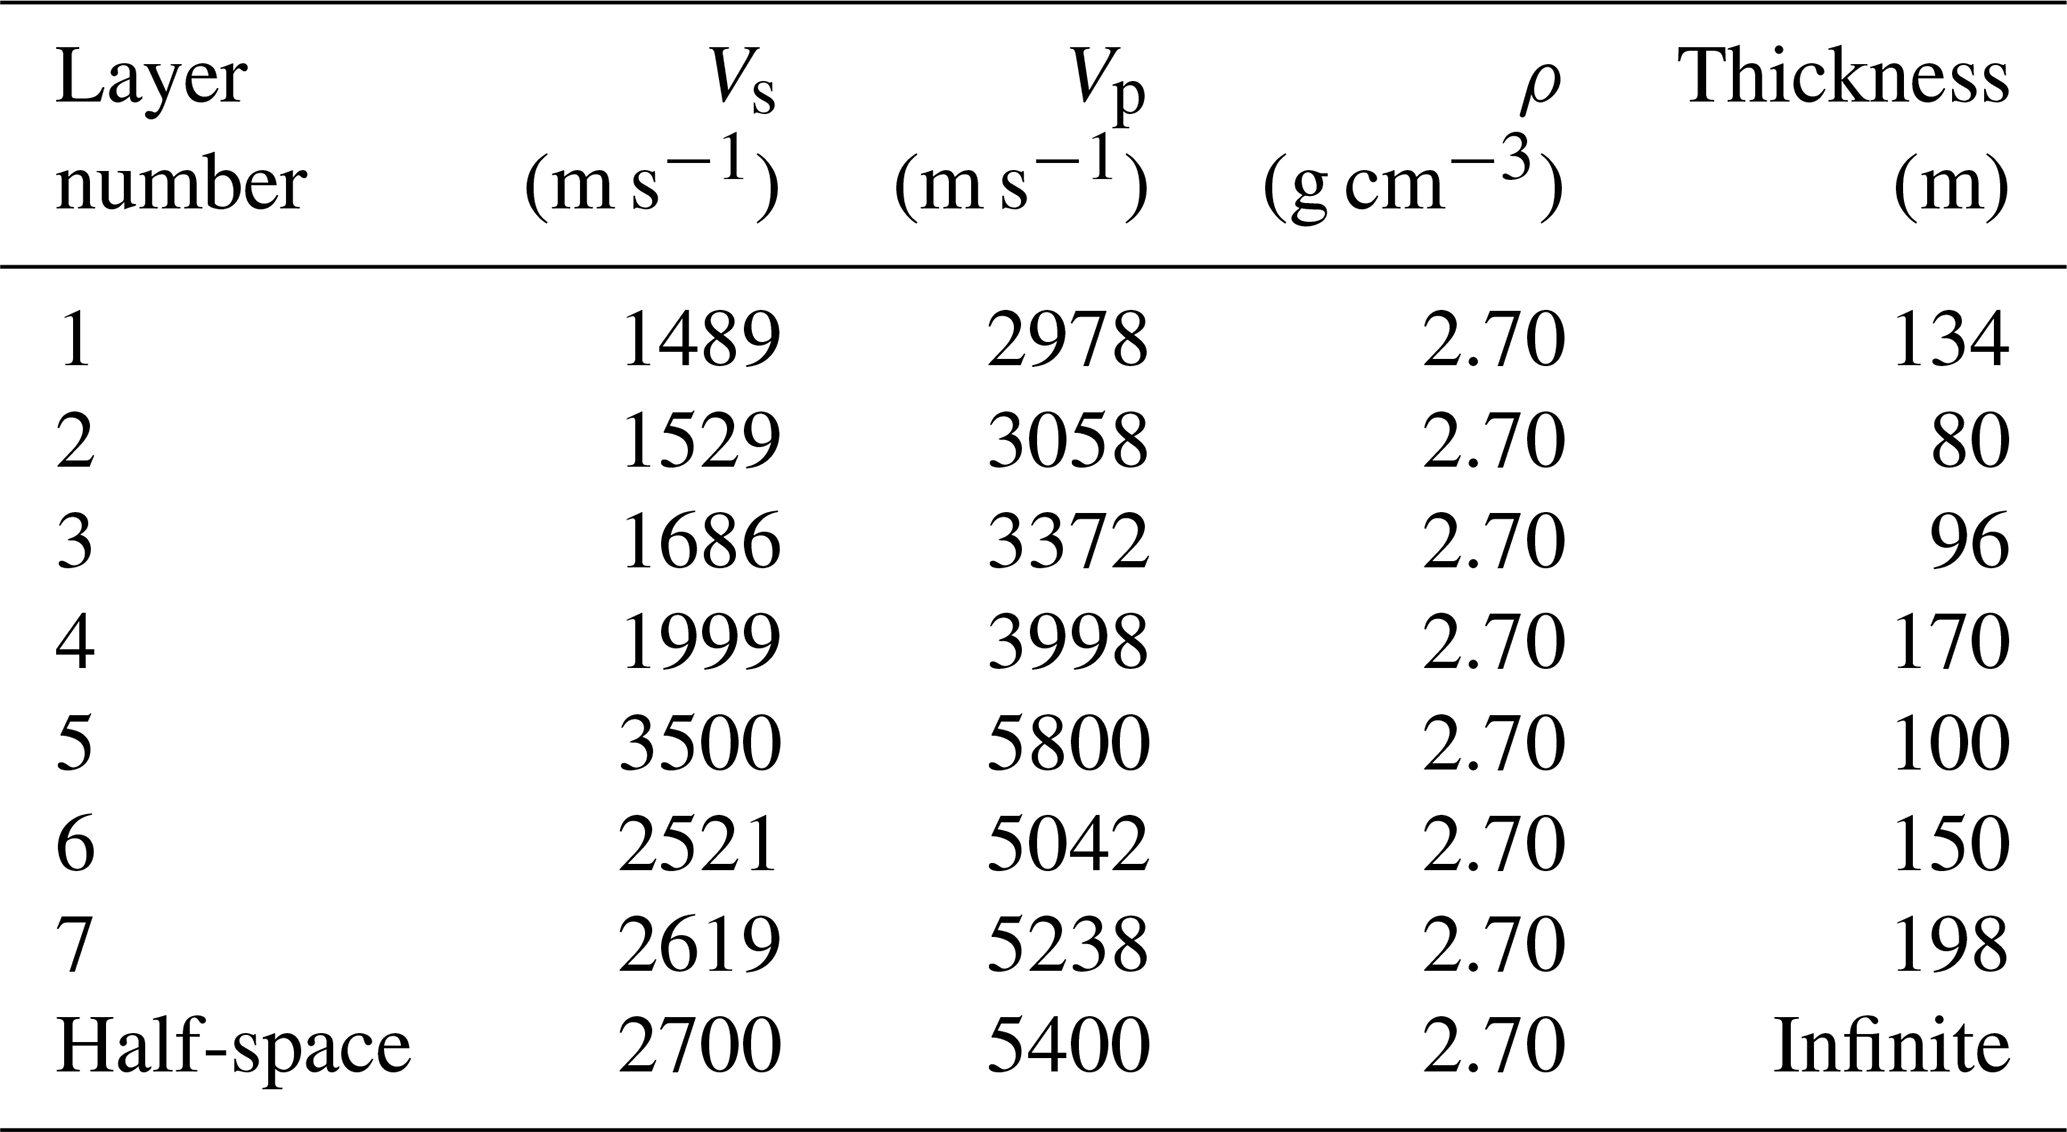
Rayleigh wave inversion is a nonlinear optimization problem. To avoid the solution estimate falling into a local minimum value of the objective function and to minimize the dependency on the initial model, an overall optimization based on a genetic algorithm (Zhao et al., 1995) was used to invert for the shear wave velocity model. Four different models were used as initial models to compare with the inverted results (Fig. 7a). Model 1 used a velocity gradually increasing with depth, while model 3 was embedded with a high velocity layer at depths of 480 to 580 m, known to be present from acoustic logging data (Fig. 7b and Table 3). Model 2 and model 4 were variations of model 3 and embedded with a high velocity layer between 380 to 480 m and between 580 to 680 m, respectively, to test the sensitivity of the inversion to the preferred initial model (model 3). A comparison of the velocity inversion results between model 1 and model 3 shows, as expected, that the inclusion of the high velocity layer in the initial model results in a better match with the acoustic log (Fig. 7b). This is also seen in the comparison between the inverted dispersion curves and the observed one (Fig. 7c and e). Furthermore, if this high velocity layer is moved up or down in the initial model then a poorer match between the observed dispersion curves and the inverted curves is obtained (compare Fig. 7e with Fig. 7d and f). Consequently, model 3, comprising an eight-layer structure (Table 3) was used as the initial model to invert all dispersion curves to obtain the shear wave velocity image. In the inversion we assume the density of the different sedimentary rocks is constant at 2.7 g cm−3 and the ratio equal is 2 based on well-logging and first break traveltimes. Each extracted frequency dispersion curve was calculated iteratively 30 times to obtain the optimized model. Normalized Root Mean Square Error (NRMSE) described as Eq. (1) was applied to evaluate the inversion results.
where Vinvi and Vobsi respectively, represent the inverted and observed phase velocity of the ith frequency point, denotes the mean of all observed phase velocities. As shown in Fig. 7g, NRMSE of all dispersion curves is less than 3 % and most of them are around 1 %. This demonstrates the robustness of the inversion methodology employed in our study.

Figure 7(a) Four different initial models for inversion, initial model 1 is a velocity gradually increasing with depth, initial model 2, initial model 3 and initial model 4 are embedded with a high velocity layer at depths of 380 to 480, 480 to 580 and 580 to 680 m, respectively; (b) Acoustic logging curve and inverted shear wave velocity models Vs1 and Vs3 are from initial model 1 and initial model 3, respectively; (c) Observed and inverted curves from initial model 1; (d) Observed and inverted curves from initial model 2; (e) Observed and inverted curves from initial model 3; (f) Observed and inverted curves from initial model 4; (g) Normalized Root Mean Square Error (NRMSE) for different virtual shot gather inversions after 30 iterations.
Table 3Parameters of model 3 as initial model for inversion calculation.
A total of 290 source gathers were retrieved with fixed geometry after the cross-coherence calculation. Raw source gather recordings are dominated by low frequency signals (Fig. 8a and e), however, a direct, or diving, P-wave with a velocity of 3763 m s−1, a direct S-wave with a velocity of 1703 m s−1, air waves with a velocity of 353 m s−1 and reflections from the top of Ordovician with a moveout velocity of 3181 m s−1 are clear in the raw source gather. Reflections with low frequency and high amplitude are present at times of 350 and 500 ms. Spectral equalization in the frequency band 5–6–18–19 Hz and a median filter at velocities of 340 m s−1 were applied on all retrieved raw source gathers to reduce noise and enhance the weaker amplitude reflected signals. Afterward, reflections are more clearly observed in Fig. 8c. Further conventional seismic reflection processing included surgical muting, velocity analysis, normal moveout, stacking, f-x deconvolution and bandpass filtering as outlined in Table 2.
For comparison with the passive source gather, an active source gather (Fig. 8b) at the same location is made. Both the active and passive source gathers show the same kinematic characteristics of the seismic waves with similar velocities of the direct P-and S-waves, and reflections from the top of Ordovician. However, a higher velocity of 4200 m s−1 from the shallow part is shown in the active source gather. This arrival probably represents a wave traveling through the hard near-surface limestone layer (Juhlin et al., 2025). Spherical divergence compensation, deconvolution, bandpass filter, statics, and median filtering were applied to remove noise and enhance reflections in the active source gather (Fig. 8d). Comparison of Fig. 8c and d shows that reflections from the top of Ordovician at about 350 ms correlate well, indicating we are obtaining useful body wave data in the source gathers from the passive data.
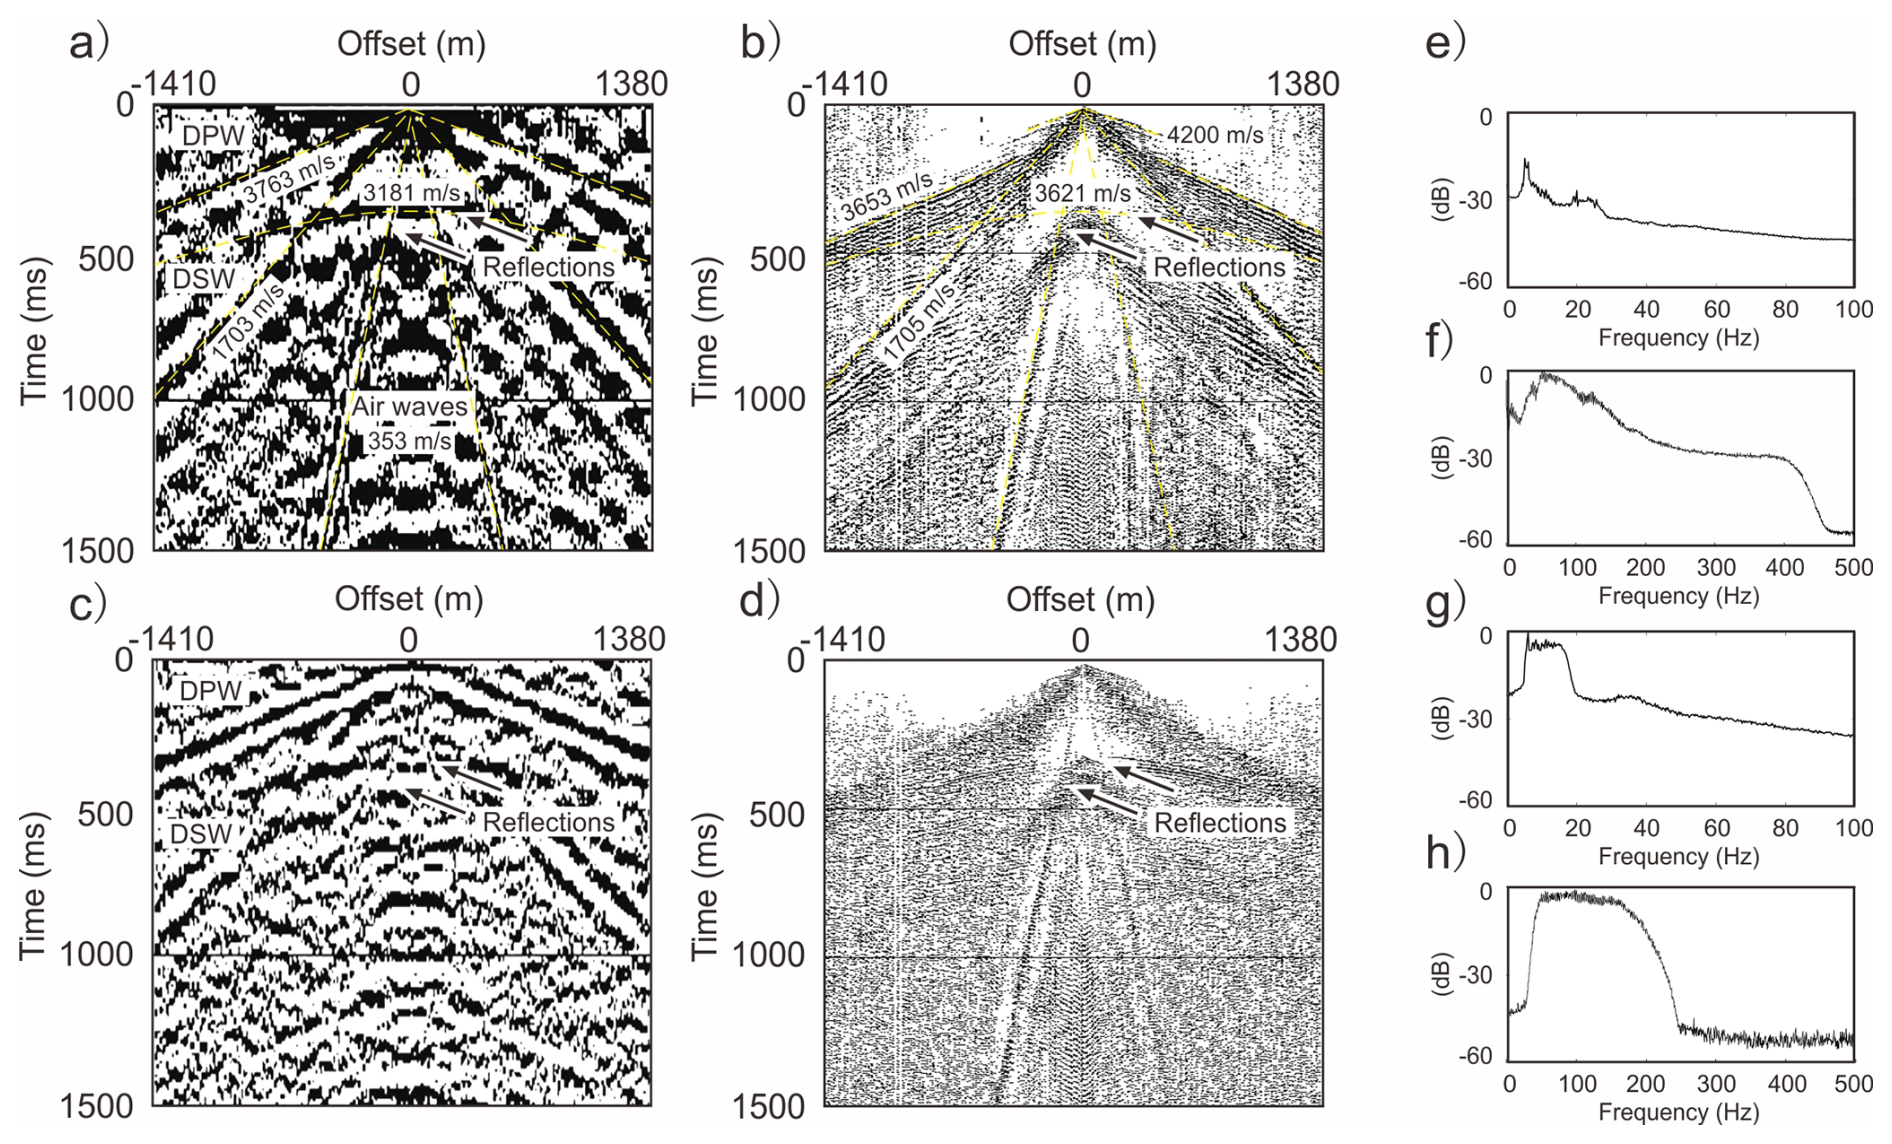
Figure 8Comparisons of active and passive source gathers at shot number 224. (a) Raw retrieved source gather, DPW and DSW represent the direct or diving P-wave with a velocity of 3763 m s−1 and the direct S-wave with a velocity of 1703 m s−1, reflections from the top of the Ordovician and air waves have velocities of 3763 and 353 m s−1, respectively; (b) active source gather with a similar velocity of the direct P-wave and S-wave, reflections from the top of the Ordovician, a higher velocity of 4200 m s−1 at the shallow part is probably due to hard limestone near the surface; (c) (a) after spherical divergence compensation, deconvolution, bandpass filter, static, median filter to remove noise and enhance reflections; (d) (b) after spectral equalization filter (5–6–18–19 Hz) and median filtering to remove noise, air wave at 350 m s−1; (e), (f), (g), (h) are power spectra for (a), (b), (c) and (d), respectively.
The acoustic velocity log from the Nore-1 borehole along with a constant density value, 2.7×10³ kg m−3, was used to calculate a seismic impedance log and associated reflection coefficients (Fig. 9a). A synthetic seismogram was then produced by convolving the acoustic reflection coefficient with a 10 Hz Ricker wavelet (Fig. 9b). To compare with the passive seismic results, 11 stacked CDP gathers from near the Nore-1 borehole were extracted from the passive stacked section (Fig. 9c). As shown in Fig. 9b and c, three reflections correlate well between the synthetic seismogram and the passive seismic image at times of 170, 280 and 360 ms, indicating that the passive seismic reflection data are trustworthy and can be used for geological interpretation.
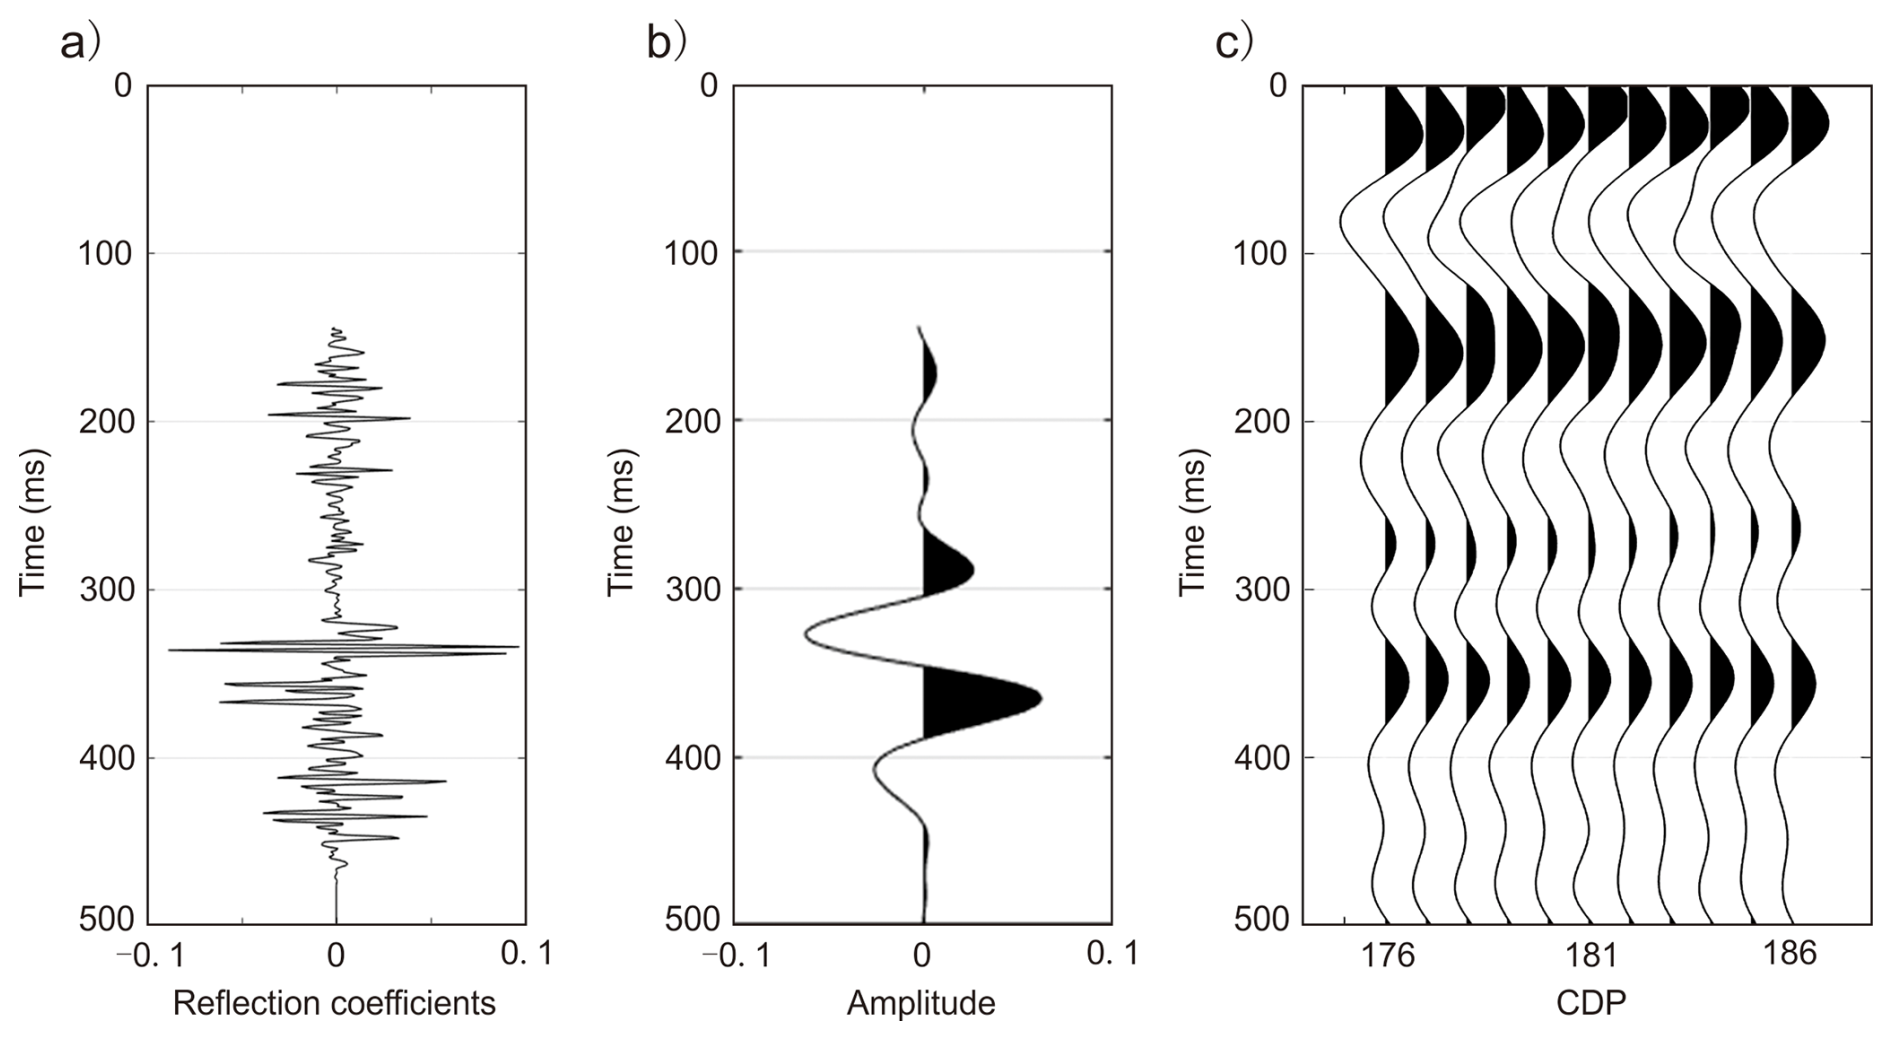
Figure 9(a) Reflection coefficient curve based on acoustic velocity logging from the Nore-1 borehole and an assumed constant density of 2.7×10³ kg m−3. (b) Synthetic seismogram produced from convolving (a) with a 10 Hz Ricker wavelet. (c) stacked CDP gathers near borehole Nore-1.
7.1 Shear wave velocity model
The extracted surface wave data were inverted for shear wave velocity using the logging data as constraints. The inverted shear wave velocity model shown in Fig. 10a can be interpreted as representing four geological units that can be correlated well with the borehole section (Fig. 10b). From the ground surface to 470 m depth, the velocity increases and varies from 1400 to ca. 2600 m s−1. A high velocity layer is embedded at the depths of 470 to 550 m, which corresponds to the Ordovician. Note that the presence of this high velocity layer, and the depth to it, is dependent upon the starting model used, but the results indicate that it is continuous along the profile and the depth to it does not vary. Cambrian rocks are located from 550 to 780 m. The high velocity under 780 m represents the Precambrian. Moreover, the velocity structure is continuous along the survey line, indicating that there are no potentially large-scale faults in the area. The reliable geological interpretation suggests that passive surface wave inversion results can be used to map the geological strata in the area. Although not proved here, they also have the potential to map regional faults.
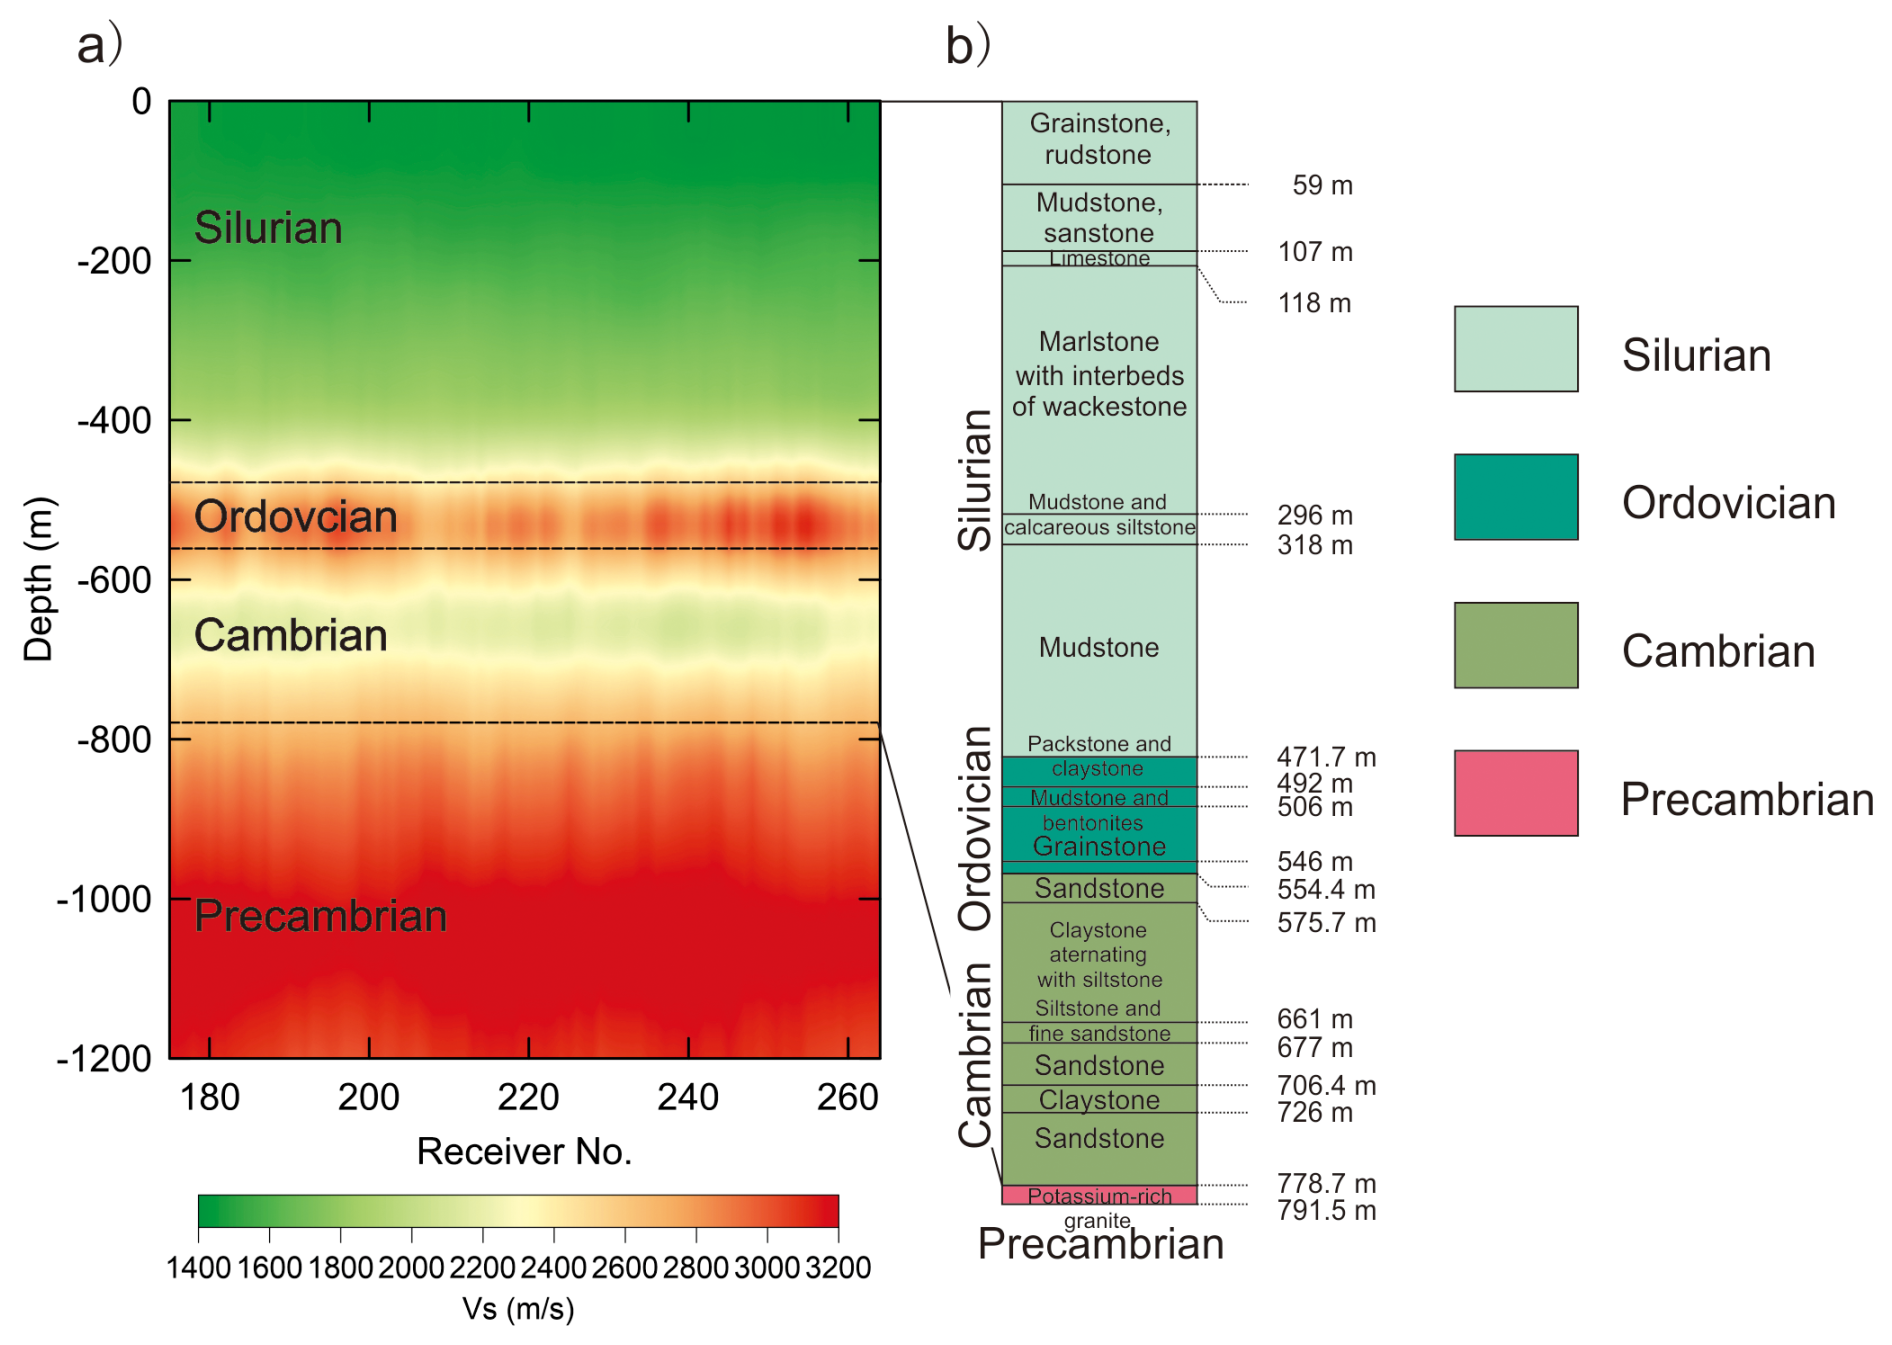
Figure 10(a) Inverted shear wave velocity from passive surface waves. (b) Nore-1 borehole section.
7.2 Stacked seismic reflection section
Passive source gathers containing body waves were processed to test if the passive body wave image can resolve subsurface geological structure. Acoustic logging analyses from Nore-1 at depths of 170 to 800 m indicated three seismic reflections at travel times of ca. 170, 280 and 360 ms (labelled as R1, R2 and R3 in Fig. 11) can also be mapped in the stacked section. The uppermost two reflections (R1 and R2) are produced by marlstone with interbeds of wackestone and mudstone from the Silurian. The reflection labelled as R3 likely originates from the top of the Ordovician, consistent with logging data (Fig. 9b) and active data (Fig. 12). In addition to the R1, R2 and R3 reflections, two more reflecting horizons are recognized at times of ca. 500 and 700 ms, labelled as R4 and R5 in Fig. 11. R4 may represent the base of the Cambrian that was interpreted in the active data as the point where the seismic response in the stacked section becomes generally transparent (Juhlin et al., 2025). No borehole or other data are available to validate where R5 originates from, it may originate within the Precambrian or represent a multiple from the top of the Ordovician. As for the inverted shear wave velocity model (Fig. 10a), all reflection horizons shown in Fig. 11 are nearly flat with no obvious disturbances, indicating no large-scale faults are present again.
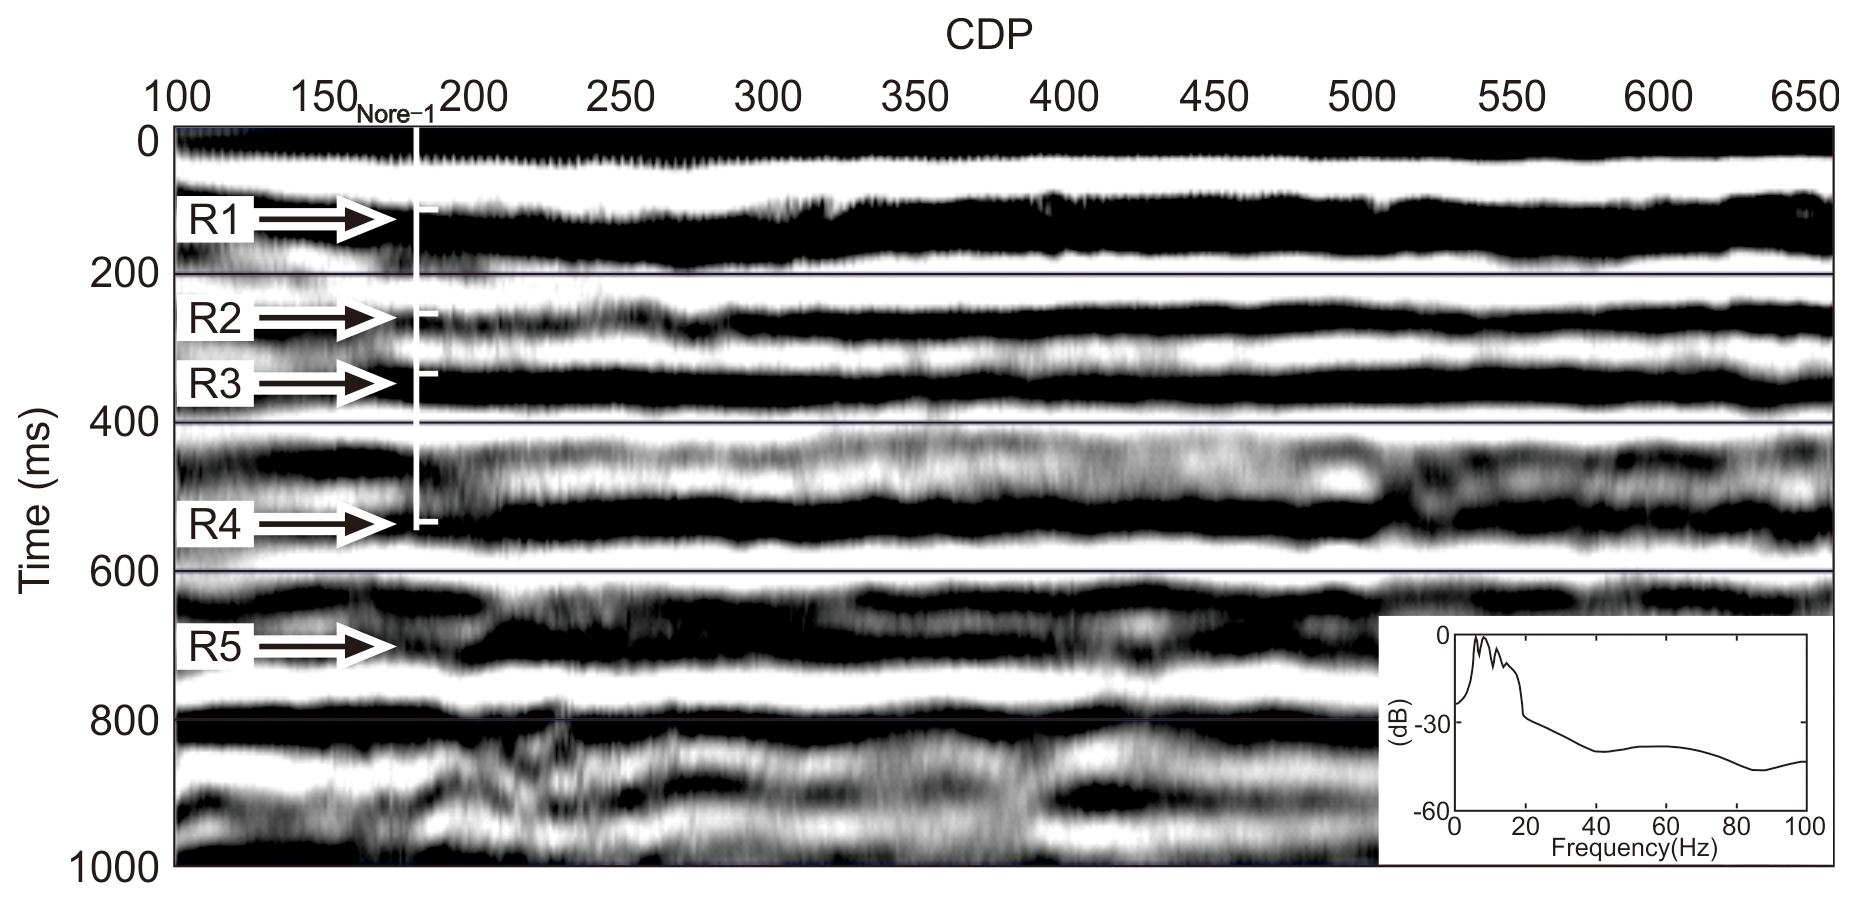
Figure 11Passive seismic reflection section overlaid with its power spectrum. R1 and R2 represent reflections from the interior of Silurian, R3 represents a reflection from the top of the Ordovician, R4 represents a reflection from the base of the Cambrian, and R5 represents a possible reflection from within the Precambrian or a multiple from the top of the Ordovician.

Figure 12Active seismic reflection stacked section overlaid with its power spectrum (after Juhlin et al., 2025). R1 and R2 represent reflections from within the Silurian, R3 represents a reflection from the top of the Ordovician, R4 represents a reflection from the base of the Cambrian, and R5 represents a possible reflection from within the Precambrian or a multiple from the top of the Ordovician. The dashed box indicates reflected energy that can potentially be correlated with the R5 reflection in the passive stacked section in Fig. 11.
8.1 Comparisons of active and passive seismic reflection imaging
The stacked image from the high-resolution active seismic shown in Fig. 12 (Juhlin et al., 2025) indicates that a particularly strong reflection at about 350 ms likely originates from the top of the Ordovician. In addition, Cambrian sandstones below are also reflective, as well as shallow sandstone layers in the upper 150 ms. Reflections labelled R1, R2 and R3 in the active data are consistent with the passive seismic stacked section (Fig. 11). As mentioned previously, R4 may represent a reflection from the top of the crystalline basement. No clear top of basement reflection is observed in the active data, but this may be due to the lack of lower frequencies in these data or the power limitation of the weight drop hammer. The lower frequencies in the passive data may be more sensitive to the velocity structure near the top of the crystalline basement. There is no clear reflection in the active seismic data that corresponds to the R5 reflection in the passive data. Some indications of reflected energy, interpreted to lie below the crystalline basement can be observed in the active data within the dashed rectangle in Fig. 12. However, it should be noted that the timing of this reflected energy is consistent with a multiple from the top of the Ordovician. The general consistency of the passive seismic data with the active data down to the top of the crystalline basement implies that passive methods can be used to reliably map some of the structural features on Gotland. However, the active data provide a higher resolution image and more geological detail. The power spectra of the passive and active reflection data shown in Figs. 11 and 12 indicate the dominant frequency ranges for the passive data are 5–20 Hz, while the active data have a 30–200 Hz range. Consequently, we cannot expect that the passive seismic reflection method will provide the same resolution as the active seismic reflection method, but the methodology can be used to map the general structure of the Palaeozoic rocks at a low cost.
8.2 Relevance of results for CO2 storage and seismic imaging
Both the passive surface wave and body wave results provide high-quality images for investigating the subsurface geological structure at the Sudret site. Processing of the passive data allowed us to obtain images of the subsurface down to the Precambrian basement around the Nore-1 borehole that had been core-drilled earlier down to about 800 m. Compared with the active data (Juhlin et al., 2025), these images show major features that can be mapped over a wide area at low cost using passive methods. However, the Sudret site may not represent a typical site for passive seismic imaging given that it is located on an island. This allows noise from nearly all directions to be recorded, which is especially important for body wave imaging. Furthermore, the ambient noise from local sources was very low at the location, allowing far-field noise to be recorded without interference. A next step would be to set up synthetic models to test how much CO2 is required in the bedrock in order to detect it by the passive methods presented in this paper. The surface waves would be more sensitive to pressure changes in the reservoir, whereas the body waves would be more sensitive to the amount of free CO2 in the reservoir. It remains to be seen if these passive methods can be used for monitoring CO2 storage sites in an effective manner.
We retrieved virtual shot gathers with body waves and surface waves after applying signal separation through cross- coherence and cross-correlation calculations. For the body waves, conventional seismic data processing was conducted to obtain a stacked section consistent with active data and a synthetic seismogram generated from an acoustic sonic log. For the surface waves, we determined the dispersion curve in the frequency range 0.8 to 5.5 Hz and inverted these curves to obtain a velocity model that correlates with borehole data from the surface down to ca. 800 m. Both the body waves and surface waves provide high-quality images of the top of the Ordovician formation and have a good consistency with the borehole section. These results show that passive data can be used for mapping some general features in the subsurface of Gotland. Specifically, the top of the Ordovician and the top of the Precambrian can be mapped. Compared with active seismic exploration, passive seismic is friendly to the environment and cost effective. In some cases, it may have the potential to replace active seismic imaging for initial subsurface surveying of the sedimentary layers on Gotland, and perhaps elsewhere. The method remains to be tested for monitoring CO2 storage sites.
Requests for the seismic data should be directed to SGU (http://www.sgu.se, last access: 7 November 2025).
CJ and PH conceptualized and designed this study. ZW and CJ were involved in the data acquisition and responsible for the data processing. ME and DS provided borehole data. ZW and CJ led the geological interpretation. ZW wrote the initial draft and CJ reviewed it. All authors participated in the results discussion and approved the submission of this paper.
The contact author has declared that none of the authors has any competing interests.
Publisher's note: Copernicus Publications remains neutral with regard to jurisdictional claims made in the text, published maps, institutional affiliations, or any other geographical representation in this paper. While Copernicus Publications makes every effort to include appropriate place names, the final responsibility lies with the authors. Views expressed in the text are those of the authors and do not necessarily reflect the views of the publisher.
This article is part of the special issue “Seismic imaging from the lithosphere to the near surface”. It is a result of the Seismix 2024 conference, Uppsala, Sweden, 24 to 28 June 2024.
This research was funded by the Deep Earth Probe and Mineral Resources Exploration – National Science and Technology Major Project (2024ZD1002201), the Geological Survey of Sweden and the China Geological Survey Project (DD20221819). We acknowledge Wilczynski Zbigniew from Uppsala University, Bojan Brodic from University of the Witwatersrand, South Africa and Johan Söderman and Per Wahlquist from the Geological Survey of Sweden who contributed to the data acquisition. Globe Claritas™ under the academic license from Petrosys Ltd. and Seismic Unix was used for the data processing. We thank two anonymous reviewers whose constructive comments helped to improve this paper.
This research has been supported by the Deep Earth Probe and Mineral Resources Exploration – National Science and Technology Major Project (grant no. 2024ZD1002201) and the Geological Survey of Sweden and the China Geological Survey Project (grant no. DD20221819).
This paper was edited by Michal Malinowski and reviewed by two anonymous referees.
Alcalde, J., Marzán, I., Saura, E., Martí, D., Ayarza, P., Juhlin, C., Pérez-Estaún, A., and Carbonell, R.: 3D geological characterization of the Hontomín CO2 storage site, Spain: Multidisciplinary approach from seismic, well-log and regional data, Tectonophysics, 627, 6–25, https://doi.org/10.1016/j.tecto.2014.04.025, 2014.
Anthonsen, K. L., Aagaard, P., Bergmo, P. E. S., Erlström, M., Fareide, J. I., Gislason, S. R., Mortensen, G. M., and Snæbjörnsdottir, S.Ó.: CO2 storage potential in the Nordic region, Energy Procedia, 37, 5080–5092, https://doi.org/10.1016/j.egypro.2013.06.421, 2013.
Bakulin, A. and Calvert, R.: The virtual source method: Theory and case study, Geophysics, 71, SI139–SI150, https://doi.org/10.1190/1.2216190, 2006.
Bertoldi, A., Gaffet, S., Prevedelli, M., and Smith D. A.: Forecasting ocean wave-induced seismic noise, Sci. Rep., 14, 21002, https://doi.org/10.1038/s41598-024-71628-4, 2024.
Boullenger, B., Verdel, A., Paap, B., Thorbecke, J., and Draganov, D.: Studying CO2 storage with ambient-noise seismic interferometry: A combined numerical feasibility study and field-data example for Ketzin, Germany, Geophysics, 80, Q1–Q13, https://doi.org/10.1190/geo2014-0181.1, 2015.
Campillo, M. and Paul, A.: Long-range correlations in the diffuse seismic coda, Science, 299, 547–549, https://doi.org/10.1126/science.1078551, 2003.
Cao, H. and Askari, R.: Comparison of seismic interferometry techniques for the retrieval of seismic body waves in CO2 sequestration monitoring, Journal of Geophysics and Engineering, 16, 1094–1115, https://doi.org/10.1093/jge/gxz079, 2019.
Cheraghi, S., Craven, J. A., and Bellefleur, G.: Feasibility of virtual source reflection seismology using interferometry for mineral exploration: A test study in the Lalor Lake volcanogenic massive sulphide mining area, Manitoba, Canada, Geophysical Prospecting, 63, 833–848, https://doi.org/10.1111/1365-2478.12244, 2015.
Cheraghi, S., White, D. J., Draganov, D., Bellefleur, G., Craven, J. A., and Roberts, B.: Passive seismic reflection interferometry: A case study from the Aquistore CO2 storage site, Saskatchewan, Canada, Geophysics, 82, B79–B93, https://doi.org/10.1190/geo2016-0370.1, 2017.
Claerbout, J. F.: Synthesis of a layered medium from its acoustic transmission response, Geophysics, 33, 264–269, https://doi.org/10.1190/1.1439927, 1968.
Cole, S. P.: Passive seismic and drill-bit experiments using 2-D arrays, California, Stanford University, SEP-86, https://sep.sites.stanford.edu/publications/theses/passive-seismic-and-drill-bit-experiments-using-2-d-arrays-sep-86-1995 (last access: 7 November 2025), 1995.
De Ridder, S. and Biondi, B.: Continuous passive seismic monitoring of CCS projects by correlating seismic noise – A feasibility study, 74th Annual International Conference and Exhibition, EAGE, Extended Abstracts, P253, 2012.
Draganov, D., Campman, X., Thorbecke, J., Verdel, A., and Wapenaar, K.: Reflection images from ambient seismic noise, Geophysics, 74, A63–A67, https://doi.org/10.1190/1.3193529, 2009.
Draganov, D., Campman, X., Thorbecke, J., Verdel, A., and Wapenaar, K.: Seismic exploration-scale velocities and structure from ambient seismic noise (>1 Hz), J. Geophys. Res.-Sol. Ea., 118, 4345–4360, https://doi.org/10.1002/jgrb.50339, 2013, 2013.
Erlström, M. and Sopher, D.: Geophysical well log-motifs, lithology, stratigraphical aspects and correlation of the Ordovician succession in the Swedish part of the Baltic Basin. International Journal of Earth Sciences, 108, 1387–1407, https://doi.org/10.1007/s00531-019-01712-y, 2019.
Erlström, M., Rosberg, J.-E., Dahlqvist, P., Hjerne, C.-E., and Lorenz, H.: Scientific core drilling of the Lower Palaeozoic succession in the Swedish sector of the Baltic Sea – investigation of the CO2 storage potential, EGU General Assembly 2024, Vienna, Austria, 14–19 April 2024, EGU24-5974, https://doi.org/10.5194/egusphere-egu24-5974, 2024.
Gassenmeier, M., Sens-Schönfelder, C., Delatre, M., and Korn, M.: Monitoring of environmental influences on seismic velocity at the geological storage site for CO2 in Ketzin (Germany) with ambient seismic noise, Geophysical Journal International, 200, 524–533, https://doi.org/10.1093/gji/ggu413, 2015.
Gouédard, P., Stehly, L., Brenguier, F., Campillo, M., Colin de Verdière, Y., Larose, E., Margerin, L., Roux, P., Sánchez-Sesma, F. J., Shapiro, N. M., and Weaver, R. L.: Cross-correlation of random fields: Mathematical approach and applications, Geophysical Prospecting, 56, 375–393, https://doi.org/10.1111/j.1365-2478.2007.00684.x, 2008.
Harris, K., White, D., and Samson, C.: Imaging the Aquistore reservoir after 36 kilotonnes of CO2 injection using distributed acoustic sensing, Geophysics, 82, M81–M96, https://doi.org/10.1190/geo2017-0174.1, 2017.
Hassing, S. H. W., Draganov, D., Janssen, M., Barnhoorn, A., Wolf, K.-H. A. A., van den Berg, J., Friebel, M., van Otten, G., Poletto, F., Bellezza, C., Barison, E., Brynjarsson, B., Hjörleifsdóttir, V., Obermann, A., Sánchez-Pastor, P., and Durucan, S.: Imaging CO2 reinjection into basalts at the Carbfix2 reinjection reservoir (Hellisheiði, Iceland) with body-wave seismic interferometry, Geophysical Prospecting, 72, 1919–1933, https://doi.org/10.1111/1365-2478.13472, 2024.
Huang, F., Bergmann, P., Juhlin, C., Ivandic, M., Lüth, S., Ivanova, A., Kempka, T., Henninges, J., Sopher, D., and Zhang, F.: The first post-injection seismic monitor survey at the Ketzin pilot CO2 storage site: Results from time-lapse analysis, Geophysical Prospecting, 66, 62–84, https://doi.org/10.1111/1365-2478.12497, 2016.
Ikeda, T., Tsuji, T., Takanashi, M., Kurosawa, I., Nakatsukasa, M., Kato, A., Worth, K., White, D., and Roberts, B.: Temporal variation of the shallow subsurface at the Aquistore CO2 storage site associated with environmental influences using a continuous and controlled seismic source, Journal of Geophysical Research: Solid Earth, 122, 2859–2872, https://doi.org/10.1002/2016JB013691, 2017.
Ivandic, M., Bergmann, P., Kummerow, J., Huang, F., Juhlin, C., and Lüth, S.: Monitoring CO2 saturation using time-lapse amplitude versus offset analysis of 3D seismic data from the Ketzin CO2 storage pilot site, Germany, Geophysical Prospecting, 66, 1568–1585, https://doi.org/10.1111/1365-2478.12666, 2018.
Juhlin, C., Giese, R., Zinck-Jørgensen, K., Cosma, C., Kazemeini, H., Juhojuntti, N., Lüth, S., Norden, B., and Förster, A.: 3D baseline seismics at Ketzin, Germany: The CO2SINK project, Geophysics, 72, B121–B132, https://doi.org/10.1190/1.2754667, 2007.
Juhlin, C., Erlström, M., Hedin, P., Brodic, B., and Sopher, D.: Reflection seismic investigations on south Gotland, Sweden, to evaluate CO2 storage strategies, Solid Earth, 16, 865–876, https://doi.org/10.5194/se-16-865-2025, 2025.
Lüth, S., Bergmann, P., Huang, F., Ivandic, M., Ivanova, A., Juhlin, C., and Kempka, T.: 4D seismic monitoring of CO2 storage during injection and post-closure at the Ketzin pilot site, Energy Procedia, 114, 5761–5767, https://doi.org/10.1016/j.egypro.2017.03.1714, 2017.
Meles, G. A., Löer, K., Ravasi, M., Curtis, A., and da Costa Filho, C. A.: Internal multiple prediction and removal using Marchenko autofocusing and seismic interferometry, Geophysics, 80, A7–A11, https://doi.org/10.1190/geo2014-0408.1, 2015.
Nakata, N., Snieder, R., Tsuji, T., Larner, K., and Matsuoka, T.: Shear wave imaging from traffic noise using seismic interferometry by cross-coherence, Geophysics, 76, SA97–SA106, https://doi.org/10.1190/geo2010-0188.1, 2011.
Nakata, N., Chang, J. P., Lawrence, J. F., and Boué, P.: Body wave extraction and tomography at Long Beach, California, with ambient-noise interferometry, Journal of Geophysical Research: Solid Earth, 120, 1159–1173, https://doi.org/10.1002/2015JB011870, 2015.
Niemi, A., Bear, J., and Bensabat, J.: Geological storage of CO2 in deep saline formations, Geological Storage of CO2 in Deep Saline Formations, 2017.
Nimiya, H., Ikeda, T., and Tsuji, T.: Temporal changes in anthropogenic seismic noise levels associated with economic and leisure activities during the COVID-19 pandemic. Sci Rep, 11, 20439, https://doi.org/10.1038/s41598-021-00063-6, 2021.
Olivier, G., Brenguier, F., Campillo, M., Lynch, R., and Roux, P.: Body-wave reconstruction from ambient seismic noise correlations in an underground mine, Geophysics, 80, KS11–KS25, https://doi.org/10.1190/geo2014-0299.1, 2015.
Oren, C. and Nowack, R. L.: Seismic body-wave interferometry using noise autocorrelations for crustal structure, Geophysical Journal International, 208, 321–332, https://doi.org/10.1093/gji/ggw394, 2017.
Papadopoulou, M., Zappalá, S., Malehmir, A., Gregersen, U., Hjelm, L., Nielsen, L., and Haspang, M. P.: Innovative land seismic investigations for CO2 geologic storage in Denmark, Geophysics, 88, B251–B266, https://doi.org/10.1190/geo2022-0693.1, 2023.
Papadopoulou, M., Zappalá, S., Malehmir, A., Kucinskaite, K., Westgate, M., Gregersen, U., Funck, T., Smit, F., and Vosgerau, H.: Advancements in seismic imaging for geological carbon storage: Study of the Havnsø structure, Denmark, International Journal of Greenhouse Gas Control, 137, https://doi.org/10.1016/j.ijggc.2024.104204, 2024.
Pevzner, R., Caspari, E., Gurevich, B., Dance, T., and Cinar, Y.: Feasibility of CO2 plume detection using 4D seismic: CO2CRC Otway project case study – Part 2: Detectability analysis, Geophysics, 80, B105–B114, https://doi.org/10.1190/geo2014-0460.1, 2015.
Prieto, G. A., Lawrence, J. F., and Beroza, G. C.: Anelastic Earth structure from the coherency of the ambient seismic field, Journal of Geophysical Research: Solid Earth, 114, https://doi.org/10.1029/2008JB006067, 2009.
Riahi, N., Bokelmann, G., Sala, P., and Saenger, E. H.: Time-lapse analysis of ambient surface wave anisotropy: A three-component array study above an underground gas storage, Journal of Geophysical Research: Solid Earth, 118, 5339–5351, https://doi.org/10.1002/jgrb.50375, 2013.
Rickett, J. and Claerbout, J.: Acoustic daylight imaging via spectral factorization: Helioseismology and reservoir monitoring, The Leading Edge, 18, 957–960, https://doi.org/10.1190/1.1438420, 1999.
Roach, L. A. N., White, D. J., and Roberts, B.: Assessment of 4D seismic repeatability and CO2 detection limits using a sparse permanent land array at the Aquistore CO2 storage site, Geophysics, 80, WA1–WA13, https://doi.org/10.1190/geo2014-0201.1, 2015.
Schuster, G. T.: Theory of daylight/interferometric imaging – Tutorial, 63rd EAGE Conference & Exhibition, European Association of Geagers & Engineers, Amsterdam, the Netherlands, https://doi.org/10.3997/2214-4609-pdb.15.A-32, 2001.
Shapiro, N. M., Campillo, M., Stehly, L., and Ritzwoller, M. H.: High-resolution surface-wave tomography from ambient seismic noise, Science, 307, 1615–1618, https://doi.org/10.1126/science.1108339, 2005.
Shogenova, A., Nordback, N., Sopher, D., Shogenov, K., Niemi, A., Juhlin, C., Sliaupa, S., Ivandic, M., Wojcicki, A., Ivask, J., Klimkowski, L., and Nagy, S.: Carbon Neutral Baltic Sea Region by 2050: Myth or Reality?, 1 April 2021, Proceedings of the 15th Greenhouse Gas Control Technologies Conference 15–18 March 2021, https://doi.org/10.2139/ssrn.3817722, 2021.
Snieder, R.: Extracting the Green's function from the correlation of coda waves: A derivation based on stationary phase, Physical Review E, 69, 046610, https://doi.org/10.1103/PhysRevE.69.046610, 2004.
Snieder, R., Miyazawa, M., Slob, E., Vasconcelos, I., and Wapenaar, K.: A comparison of strategies for seismic interferometry, Surveys in Geophysics, 30, 50–523, https://doi.org/10.1007/s10712-009-9069-z, 2009.
Sopher, D., Juhlin, C., and Erlström, M.: A probabilistic assessment of the effective CO2 storage capacity within the Swedish sector of the Baltic Basin, International Journal of Greenhouse Gas Control, 30, 148–170, https://doi.org/10.1016/j.ijggc.2014.09.009, 2014.
Wang, Y. and Lawton, D. C.: Time-lapse attenuation variations using distributed acoustic sensing vertical seismic profile data during CO2 injection at Cami Field Research Station, Alberta, Canada, Geophysics, 89, N31–N44, https://doi.org/10.1190/geo2022-0731.1, 2024.
Wapenaar, K. and Fokkema, J.: Green's function representations for seismic interferometry, Geophysics, 71, SI33–SI46, https://doi.org/10.1190/1.2213955, 2006.
Wapenaar, K., Thorbecke, J., and Draganov, D.: Relations between reflection and transmission responses of three-dimensional inhomogeneous media, Geophysical Journal International, 156, 179–194, https://doi.org/10.1111/j.1365-246X.2003.02152.x, 2004.
White, D. J., Roach, L. A. N., and Roberts, B.: Time-lapse seismic performance of a sparse permanent array: experience from the Aquistore CO2 storage site, Geophysics, 80, WA35–WA48, https://doi.org/10.1190/geo2014-0239.1, 2015.
White, D., Bellefleur, G., Dodds, K., and Movahedzadeh, Z.: Toward improved distributed acoustic sensing sensitivity for surface-based reflection seismics: Configuration tests at the Aquistore CO2 storage site, Geophysics, 87, P1–P14, https://doi.org/10.1190/geo2021-0120.1, 2022.
Wilczynski, Z., Kaslilar, A., Malehmir, A., Manzi, M., Vivin, L., Lepine, J., Valishin, O., and Hogdahl, K.: Ambient noise surface-wave imaging in a hardrock environment: implications for mineral exploration, Geophysical Journal International, 240, 571–590, https://doi.org/10.1093/gji/ggae392, 2025.
Xu, Z., Juhlin, C., Gudmundsson, O., Zhang, F., Yang, C., Kashubin, A., and Lüth, S.: Reconstruction of subsurface structure from ambient seismic noise: an example from Ketzin, Germany, Geophysical Journal International, 189, 1085–1102, https://doi.org/10.1111/j.1365-246X.2012.05411.x, 2012.
Zappalà, S., Malehmir, A., Papadopoulou, M., Gregersen, U., Funck, Clausen, O. R., and Nørmark, E.: Combined onshore and offshore wide-scale seismic data acquisition and imaging for carbon capture and storage exploration in Havnsø, Denmark, Geophysics, 89, B257–B272, https://doi.org/10.1190/geo2023-0503.1, 2024.
Zhang, F., Juhlin, C., Niemi, A., Huang, F., and Bensabat, J.: A feasibility and efficiency study of seismic waveform inversion for time-lapse monitoring of onshore CO2 geological storage sites using reflection seismic acquisition geometries, International Journal of Greenhouse Gas Control, 48, 134–141, https://doi.org/10.1016/j.ijggc.2015.11.015, 2016.
Zhang, Y. Li, Y., Zhang, H., and Ku, T.: Near-surface site investigation by seismic interferometry using urban traffic noise in Singapore, Geophysics, 84, B169–B180, https://doi.org/10.1190/geo2017-0798.1, 2019.
Zhao, D., Wang, G., Wang, S., and Sun, R.: The application of genetic algorithm to Rayleigh wave inversion, Geophysical & Geochemical Exploration, 19, 178–185, 1995 (in Chinese).
- Abstract
- Introduction
- Geological setting of the test site
- Data acquisition and processing
- Surface wave data processing
- Body wave data processing
- Synthetic seismogram
- Results
- Discussion
- Conclusions
- Data availability
- Author contributions
- Competing interests
- Disclaimer
- Special issue statement
- Acknowledgements
- Financial support
- Review statement
- References