the Creative Commons Attribution 4.0 License.
the Creative Commons Attribution 4.0 License.
 | 02 Dec 2025
New paleoseismological and morphotectonic investigations along the 2018 surface ruptures of the Fiandaca Fault, eastern flank of Etna volcano (Italy)
Giorgio Tringali
Domenico Bella
Franz A. Livio
Anna Maria Blumetti
Gianluca Groppelli
Luca Guerrieri
Marco Neri
Vincenzo Adorno
Rosario Pettinato
Sara Trotta
Alessandro M. Michetti
We present the first paleoseismological results along the Fiandaca Fault, source of the 26 December 2018, Mw 5.0 Fleri earthquake. This earthquake caused extensive damage and 8 km of surface faulting. We excavated two exploratory trenches close to the Fiandaca village, in the central segment of the 2018 coseismic rupture. Analysis of trench walls allows identifying, besides the 2018 event, two additional historical surface faulting events. Based on amount of displacement of dated stratigraphic units, including tephra from the 122 BCE eruption, these historical events were similar to the 2018 earthquake. The most recent one occurred in the period 1281–1926 CE, most likely during the1894 earthquake. The oldest one, previously unknown, occurred in the Early Middle Ages (757–894 CE). When compared with the available seismic catalogue for Mt. Etna volcano, this paleoseismic evidence might suggest increased seismic activity along the Fiandaca Fault in the last centuries. In order to test this hypothesis, we conducted detailed morphotectonic analyses and throw rate measurements across offset historical lava flows. In addition, we developed a trishear kinematic model that describes the fault zone and the morphological features of the scarps. Throw rates mean values show an increase from 3.3 mm yr−1 since the Greek-Roman period reaching 7.8 mm yr−1 since the Late Middle Ages. These findings highlight the needs of further investigations to evaluate the slip rates variations of other faults accommodating the flank instability. Our findings confirm that paleoseismological and morphotectonic studies are of critical value for defining surface faulting and seismic hazard in volcanic settings.
- Article
(20107 KB) - Full-text XML
-
Supplement
(1661 KB) - BibTeX
- EndNote


Paleoseismology is an important tool for the study of earthquake hazard and active tectonics (McCalpin, 2009). Nonetheless, its application in the context of active volcanoes may encounter limitations due to the inherent highly dynamic geological processes of such systems. However, Mt. Etna volcano provides an ideal setting for overcoming these limitations (e.g., Azzaro et al., 2000; Ferreli et al., 2002). In particular, the densely populated Mt. Etna eastern flank records frequent surface faulting earthquakes and aseismic fault creep, which result in offsets of well-dated historical landforms and stratigraphy, including lava flows, interlayered pyroclastic deposits, and anthropic structures. This allows for the analysis of paleoseismic events and fault slip rates across various time scales (Monaco et al., 1997; Azzaro et al., 2000; Ferreli et al., 2002). Furthermore, new technical and instrumental developments in paleoseismic studies allow better characterization of a fault zone (McCalpin et al., 2023).
Little has been accomplished since the first paleoseismological studies in the early 2000's, but the extensive building damage and surface faulting produced by the 2018 Fleri earthquake renewed interest in the characterization of Mt. Etna capable faults (Monaco et al., 2021; Romagnoli et al., 2021; Tortorici et al., 2021; Azzaro et al., 2022; Tringali et al., 2023a). Historical earthquake and aseismic creep events illustrate severe frequent building damage and ground ruptures (Rasà et al., 1996; Azzaro, 1999). Still, they mostly date back to the second half of the 1800s, leaving sparse or even no information about earlier periods. In this framework, paleoseismology and morphotectonics might play a crucial role for detecting earthquakes that precede the historically known ones, and to evaluate the slip rates variations over longer and shorter time windows.
In this paper, we provide an accurate description of the first paleoseismological results along the Fiandaca Fault (FIA in Fig. 1) and analyse its recent coseismic activity. The 2018 post-earthquake urban reconstruction work allowed us to dig two trenches in Fiandaca (see trenching site location in Fig. 1) to test whether it was possible to rebuild in the same area. While post-earthquake reconstruction may present new opportunities for research, it has not been possible to excavate along the entire fault zone due to logistic constraints and requests of landowners. However, it was precisely the desire of the landowners to rebuild in a place dear to them, as illustrated by Neri and Neri (2024), that allowed us to dig the trenches. Moreover, the location of the trenching site in the central portion of the Fiandaca Fault and the coseismic surface faulting of the 2018 earthquake allowed us to study the entire fault rupture. These results provided suitable information for relocating the residential buildings in the area affected by coseismic scarps. Otherwise, the trenches allowed us to recognize past surface faulting events. The results obtained by the trenches were compared with a seismic tomography and with the coseismic surface ruptures of the 2018 earthquake. Furthermore, we developed a kinematic model to assess that: (a) the morphological scarp is consistent with the accommodation of the fault slip in a distributed deformation zone; (b) the morphological scarp is not the result of other erosional and/or depositional processes. Finally, we compared these results with topographic profiles of FIA scarps across offset dated historical lava flows to assess throw rates over a longer time window with respect to that observable by available macroseismic historical information. Based on the throws obtained from the topographic profiles, we assess throw rates variations in the last ∼ 2 kyr. A similar approach has been applied along the Pernicana Fault (PER in Fig. 1a) where throw rates in acceleration were observed in the last 3.5 kyr (D'Amato et al., 2017).
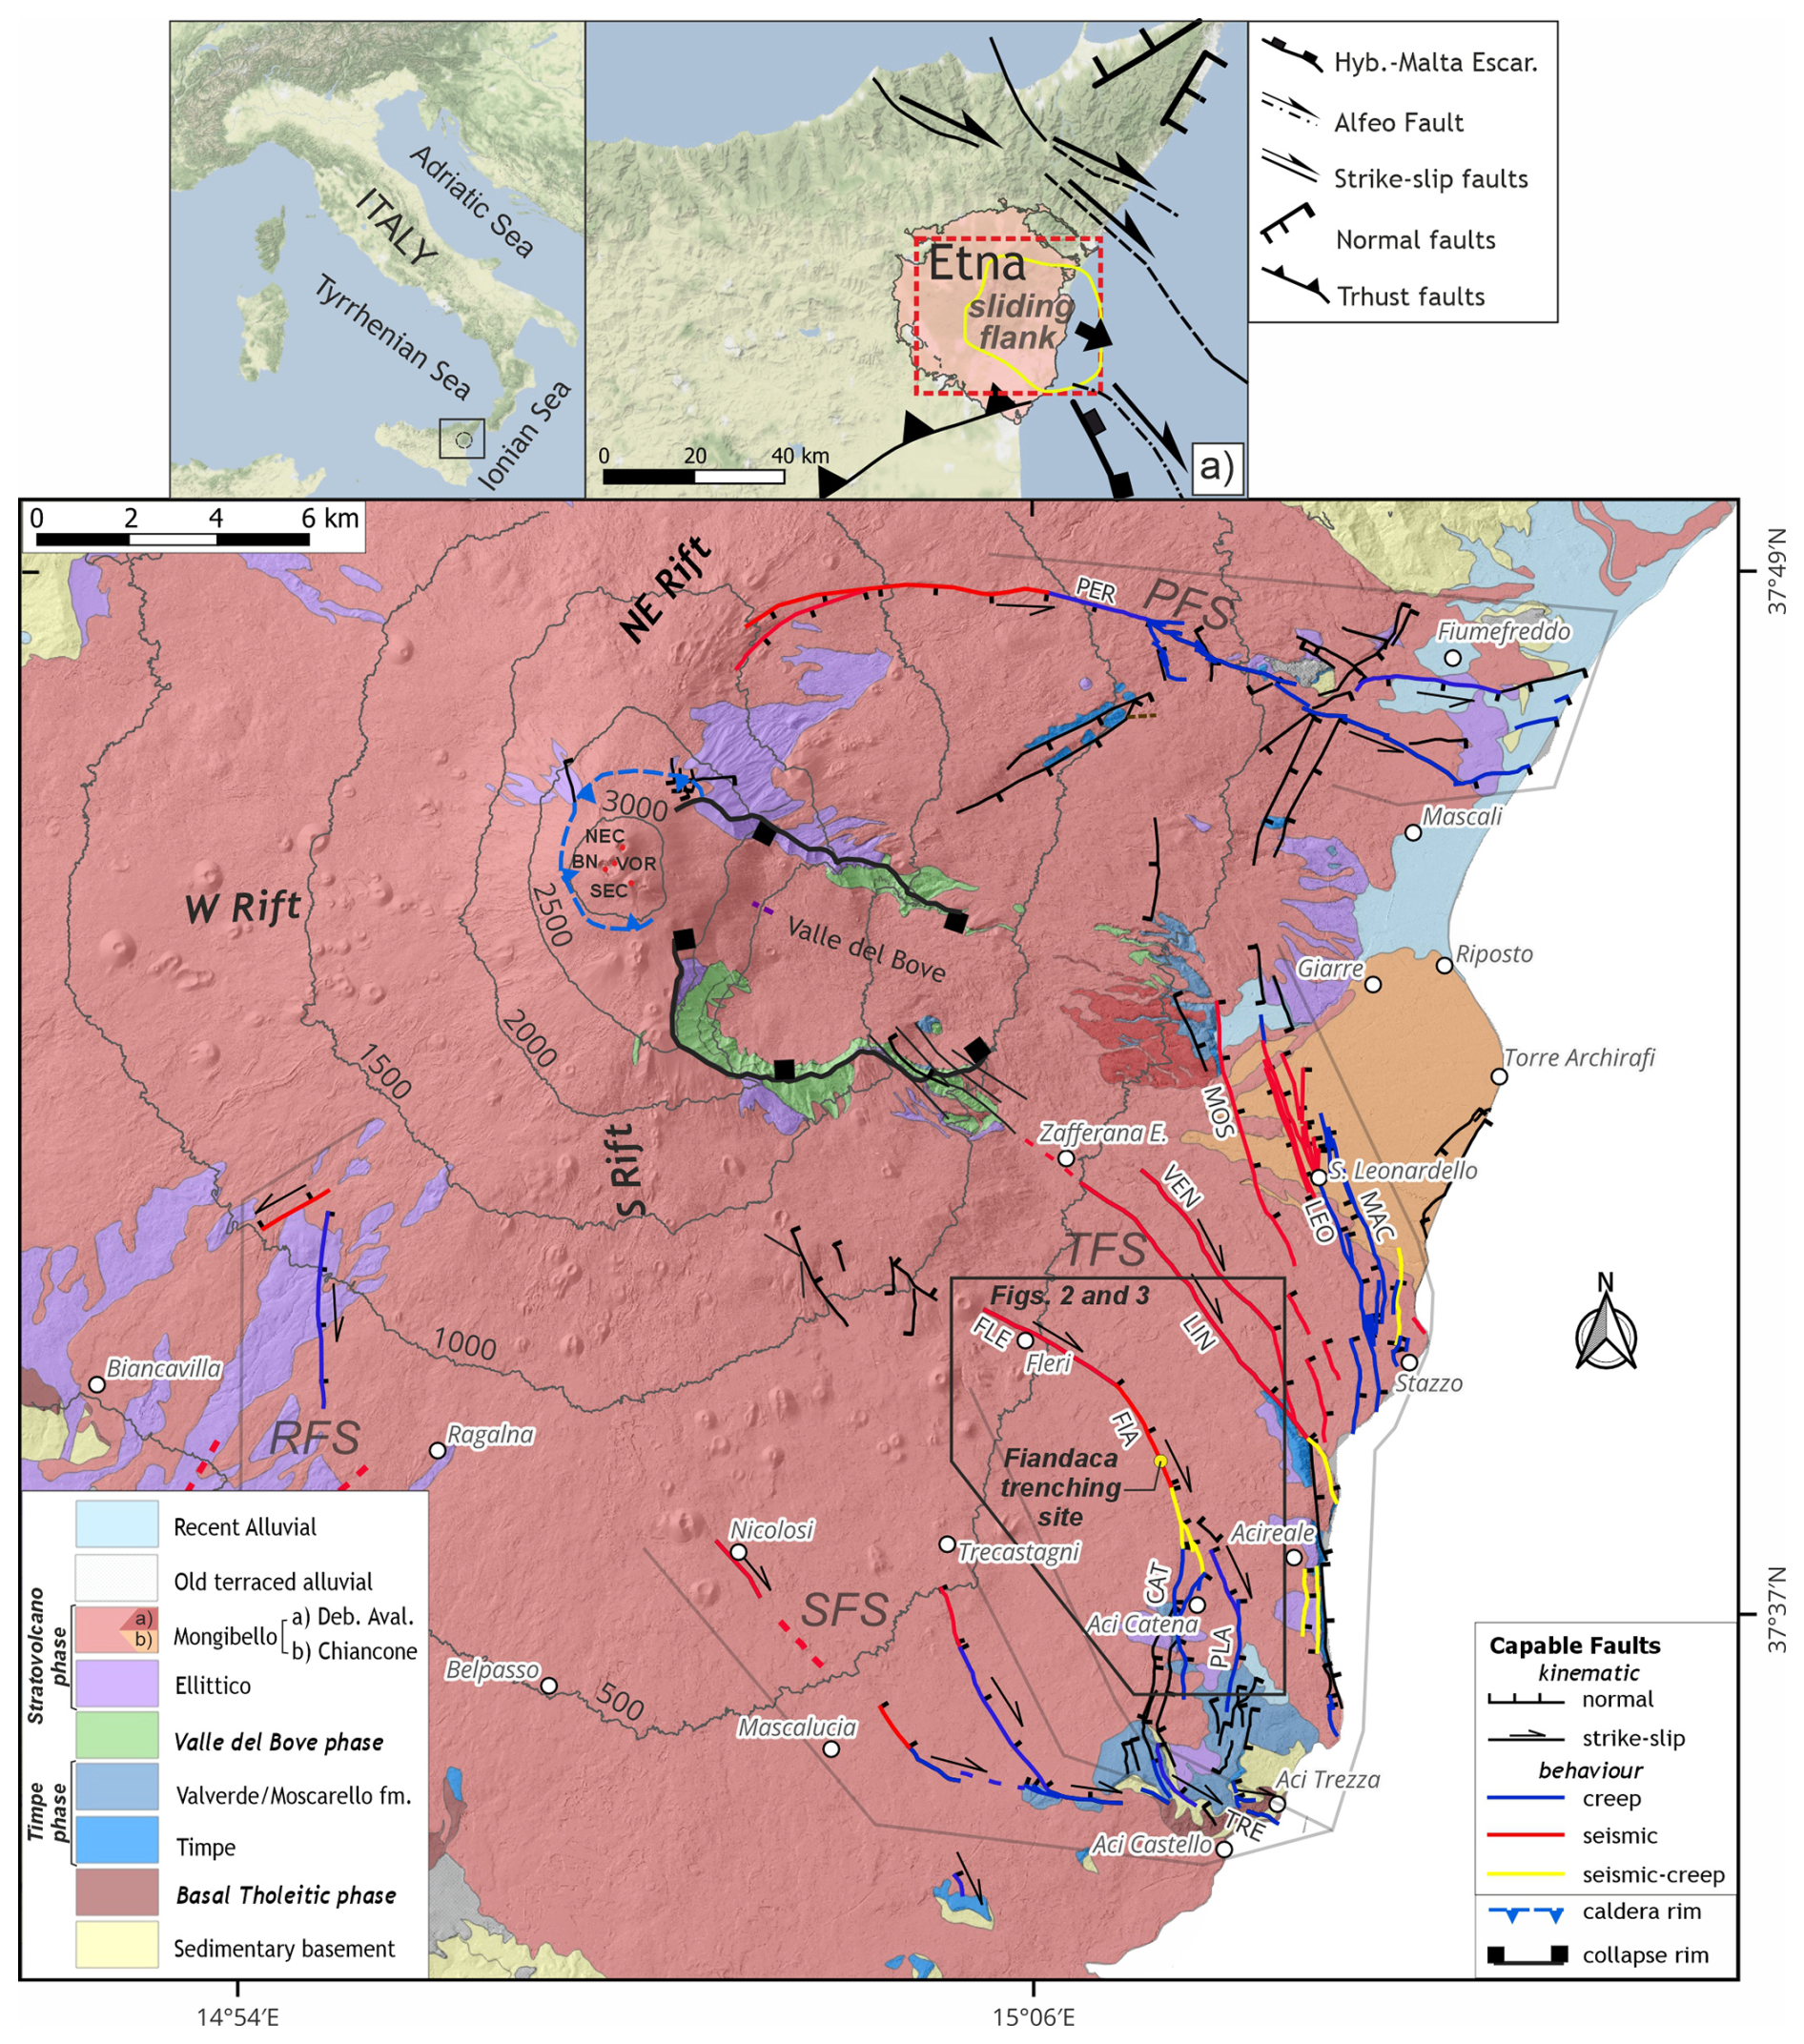
Figure 1Simplified geological and volcano-tectonic map (modified after Branca et al., 2011a; Azzaro et al., 2012; ITHACA Working Group, 2019; Barreca et al., 2013); black lines are faults (dashed where uncertain) with their kinematics and seismic/creep behaviour; TFS: Timpe fault system; PFS: Pernicana fault system; RFS: Ragalna fault system; SFS: Southern fault system. Fault labels: FIA: Fiandaca; CAT: Aci Catena; FLE: Fleri; LEO: San Leonardello; LIN: Linera; MAC: Macchia; MOS: Moscarello; PER: Pernicana; PLA: Aci Platani; TRE: Aci Trezza; VEN: Santa Venerina. Etna Central Craters (red dots) labels: VOR: Voragine; BN: Bocca Nuova; NEC: Northeast Crater; SEC: Southeast Crater; inset (a) shows the general tectonic framework of NE Sicily with Etna volcanic edifice and its sliding flank borders (in yellow).
Etna volcano has a peculiar position in the Mediterranean geodynamics, located on the Appennine-Maghrebian active fold and thrust belt (Fig. 1a; Doglioni et al., 2001; Branca et al., 2011a). The current volcanic edifice is the result of the superimposition of different volcanoes during the last 180 ka (Branca et al., 2011a), starting with the Timpe (180–110 ka) and Valle del Bove phases (110–65 ka). About 65 ka ago, the volcanic activity migrated to the W with the inception of a stratovolcano phase with two different volcanoes: Ellittico (65–15 ka) and Mongibello (15 ka–present). Mt. Etna is currently one of the most active volcanoes in the world and its activity is mainly localised in the summit area with eruptive episodes in the central craters (VOR, BN, NEC and SEC in Fig. 1; Acocella et al., 2016), or in subterminal monogenic craters. The eruptions are characterised by a prevalent strombolian activity with the deposition of fall out deposits and basaltic lava flows. The eruptive activity is sometimes located in the flanks along eruptive fissures, fed by dykes (i.e., lateral or flank eruptions), and interesting mostly the so-called NE, S and W Rifts (Neri et al., 2011; Azzaro et al., 2012; Tibaldi et al., 2021; see location in Fig. 1). Between 7478–7134 BCE, catastrophic collapses on Mount Etna's E flank created the Valle del Bove depression (Calvari et al., 1998, 2004; Guest et al., 1984; Malaguti et al., 2023). Debris avalanches at the valley's open end mark these events (Branca et al., 2011b). Erosion and alluvial processes later formed the Chiancone fan along the Ionian coast (Calvari and Groppelli, 1996).
The eastern and southern flanks of the Etna volcano include several capable faults characterized by coseismic and aseismic slip (Fig. 1; Rasà et al., 1996; Gresta et al., 1997; Azzaro et al., 2012; Barreca et al., 2013). The NE flank is affected by the Pernicana Fault system (PFS in Fig. 1; Acocella and Neri, 2005) characterized by prevalent left-lateral kinematics, and stick-slip behaviour to the W, whereas aseismic creep is dominant to the E. The Ragalna Fault system (RFS in Fig. 1; Rust and Neri, 1996) affects the SW flank of the volcano with two fault segments (Fig. 1). The Etna E flank is affected by the mainly NNW-trending Timpe Fault system (TFS in Fig. 1) characterized by a general E–W extension along normal faults dipping toward the E, with right lateral strike-slip components (Lanzafame et al., 1996; Monaco et al., 1997). The SE flank is affected by the Southern Fault System (SFS in Fig. 1), composed of normal and right lateral strike-slip faults (Azzaro et al., 2012; Barreca et al., 2013). These structures separate shallow sliding blocks (Bonforte et al., 2011, 2013; Siniscalchi et al., 2012; Acocella et al., 2013; Azzaro et al., 2013) due to gravitational collapse of the entire sector toward the Ionian Sea (Neri et al., 1991; Borgia et al., 1992; Lo Giudice and Rasà, 1992; Solaro et al., 2010; Chiocci et al., 2011; Gross et al., 2016; Urlaub et al., 2018). The boundaries of the gravitational collapse are defined by the PFS in the NE flank (Neri et al., 2004), and by the SFS and RFS in the S (Rasà et al., 1996; Rust and Neri, 1996).
Regarding the seismicity, moderate magnitude (Mw<5) earthquakes, with a shallow hypocentral depth, mostly less than 2 km, typically generate coseismic surface ruptures and damage to the urban areas (Carveni and Bella, 1994; Azzaro, 1999; Azzaro et al., 2017). Historical events reached maximum macroseismic intensity of grade IX–X in the EMS scale (Azzaro et al., 2017). Aseismic creep events are common along some sectors of the lower eastern flank faults (Fig. 1), occurring during periods of seismic swarms as well as during times of low seismic activity (Rasà et al., 1996; Palano et al., 2022). Therefore, the shallow deformation is concurrently driven by volcano-tectonic and gravity processes (Rasà et al., 1996; Tibaldi and Groppelli, 2002) that can be also influenced by the sedimentary basement morphology and the thickness of the volcanic pile (Branca and Ferrara, 2013; Palano et al., 2022; Tringali et al., 2023a, b).
3.1 Stratigraphic framework
The area under investigation is located on the lower SE flank, in a sector characterised by scattered dwellings and lemon trees established on historic Mongibello lava flows (Branca et al., 2011b; Fig. 2) of the Torre del Filosofo formation (volcanic products of the period 122 BCE–1669 CE) and Pietracannone formation (3.9 ka–122 BCE Upper member and 15–3.9 ka Lower member). The lava flows outcropping in the area are mostly attributed to eruptions that occurred in the lower eastern flank in the period 3.9 ka–122 BCE (Fig. 2) that were partially covered by new flows during the Medieval period (e.g., 1030 ± 40 and 1329 CE). In the trenching site the outcropping is the Mt. Salto del Cane lava flow (Branca et al., 2011b; 150 BCE in Fig. 2) with an archaeomagnetic age of 150 ± 200 BCE (Tanguy et al., 2012). The 122 BCE tephra fallout is a marker stratigraphic bed, due to a Plinian basaltic eruption that led to the formation of a vast pyroclastic deposit that covered the SE flank of the volcano, about 10–30 cm thick around the trenching site (Coltelli et al., 1998; Branca et al., 2011b). The onset of a new lateral eruption in 1329 CE formed the M. Rosso scoria cone, and the lava flow erupted reached the area of Santa Maria la Stella to the N of Acireale (Fig. 2). Toward the S, the Piano d'Api lava flow (ay in Fig. 2) covered between 3.9 ka and 122 BCE, the 15 ka Aci Platani lava flow (at in Fig. 2).
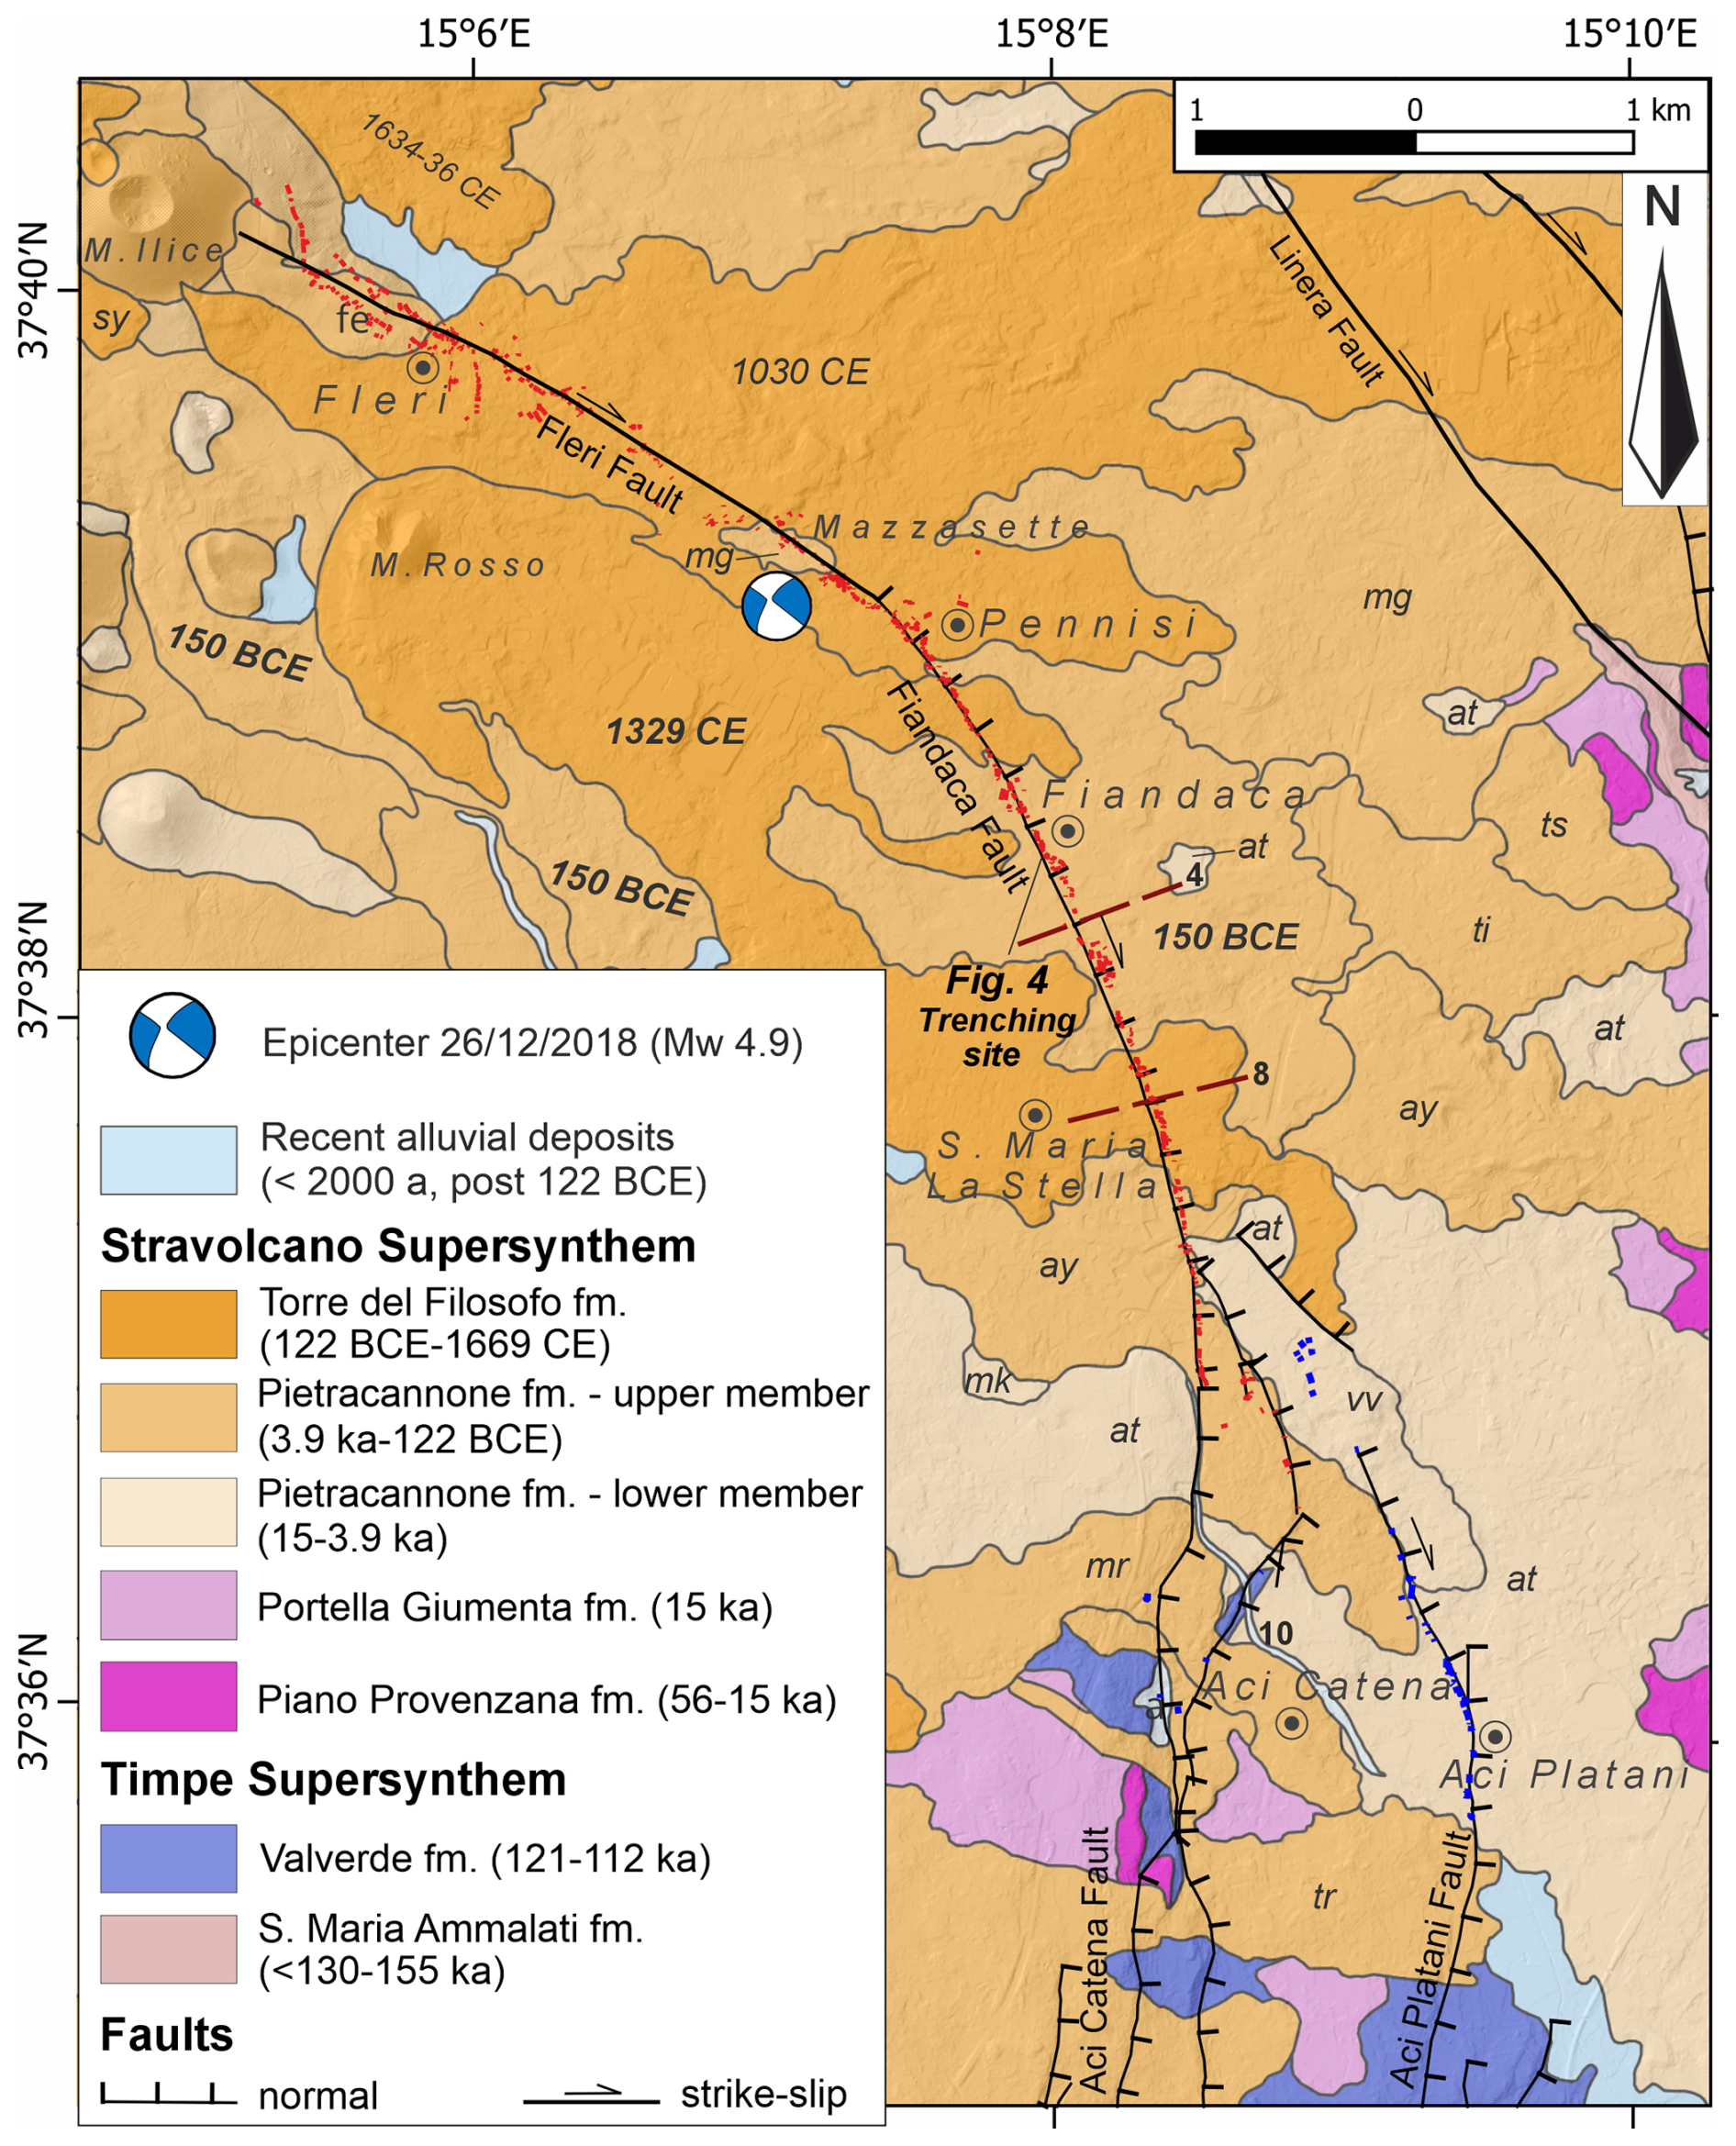
Figure 2Geological map of Mt. Etna E flank around the Fiandaca Fault (modified after Branca et al., 2011b; Azzaro et al., 2012; Barreca et al., 2013; ITHACA Working group, 2019); in red the coseismic ruptures of the 26 December 2018 earthquake, in blue the fractures related to the subsequent aseismic creep event (modified after Tringali et al., 2023a); dark red dashed lines are selected profiles across faulted lava flows (n. 5, 10); lava flows chronologically labelled: sy: Case Scandurra (850 ± 40 CE); mg: M. Gorna; mr: M. Serra; ay: Piano d'Api; tr: Trecastagni; ti: Timone; fe: Fleri; ts: Castelluccio; mk: Monaci; vv: Villa Vincenzina; at: Aci Platani.
3.2 Morphotectonic setting and historical seismicity
The Fiandaca Fault (FIA) is part of the TFS and stretches for an overall length of ∼ 4.5 km from Pennisi to the N of Aci Catena with a curvilinear, almost NNW-trending trace (Fig. 2). From the kinematic point of view, FIA is a normal fault with a right-lateral slip component. Small but evident scarps, typically less than 10 m high, reflecting long-term vertical displacement, mark the fault trace. At its N termination, FIA directly connects to the NW-striking Fleri Fault (FLE), while to the S it connects directly to the Aci Catena Fault (CAT) and, through several fault splays and multiple parallel scarps, to the Aci Platani Fault (PLA). CAT shows multiple fault strands with mostly a N-trending, displacing with a normal component Mongibello lavas and to the S also 115 ka lava flows of the Valverde formation (Branca et al., 2011a). CAT is characterized by retreated, up to 70 m high, fault scarps. Two of them intersect the 115 ka lavas, resulting in a cumulated vertical offset of ∼ 90 m. To the S, CAT changes its strike to NNW–SSE and NW–SE connecting to the E–W Aci Trezza Fault (TRE in Fig. 1). PLA has a curvilinear trace with strike changing from NNW–SSE to NNE–SSW (Fig. 2) with 5 to 20 m high scarps.
FIA is one of the most active faults of TFS, characterized by a significant seismic activity (Fig. 3; see Sect. S1 of the Supplement for further details). The trenching site is in the central sector of FIA, where only coseismic fault activation has been documented over the last 150 years. This sector is characterized by well evident surface ruptures with vertical displacement occurred during at least 9 earthquakes in the last 600 years (Fig. 3). The first known strong earthquake in the study area (Mw 4.03; Rovida et al., 2020) occurred during the seismic swarm that preceded and accompanied the 1329 lateral eruption (Guidoboni et al., 2019). This event occurred on the Mt. Etna E flank; however, there is no available information about the seismogenic structure responsible for 1329 earthquake. Azzaro and Castelli (2015) revised the historical sources during the period 1600–1831 CE, recognizing at least 6 earthquakes that could be associated with the TFS (see Table S1 of the Supplement). One of these earthquakes occurred in April 1809 CE, it is associated with ground ruptures but without a precise location. Despite the uncertainties, the highly felt earthquakes in Acireale and Zafferana Etnea might suggest a causative fault identified in FIA or LIN (Linera Fault, Fig. 1), as these faults are closest to the affected villages (see Fig. 1a). In spite the FIA high seismic activity, its southern termination shows also slow and constant aseismic creep as testified by the frequent damage along buildings, roads and walls crossed by the fault.
CAT and PLA have recently experienced frequent aseismic creep phenomena showing a maximum short term throw rate of 2.3-6 mm yr−1 for CAT in the period 1970–2000 (Rasà et al., 1996; Bonforte et al., 2011). In particular, the last aseismic creep episodes with surface faulting occurred in 2023 along CAT (Tringali, 2023a) and in 2018 along PLA (Tringali et al., 2023a).
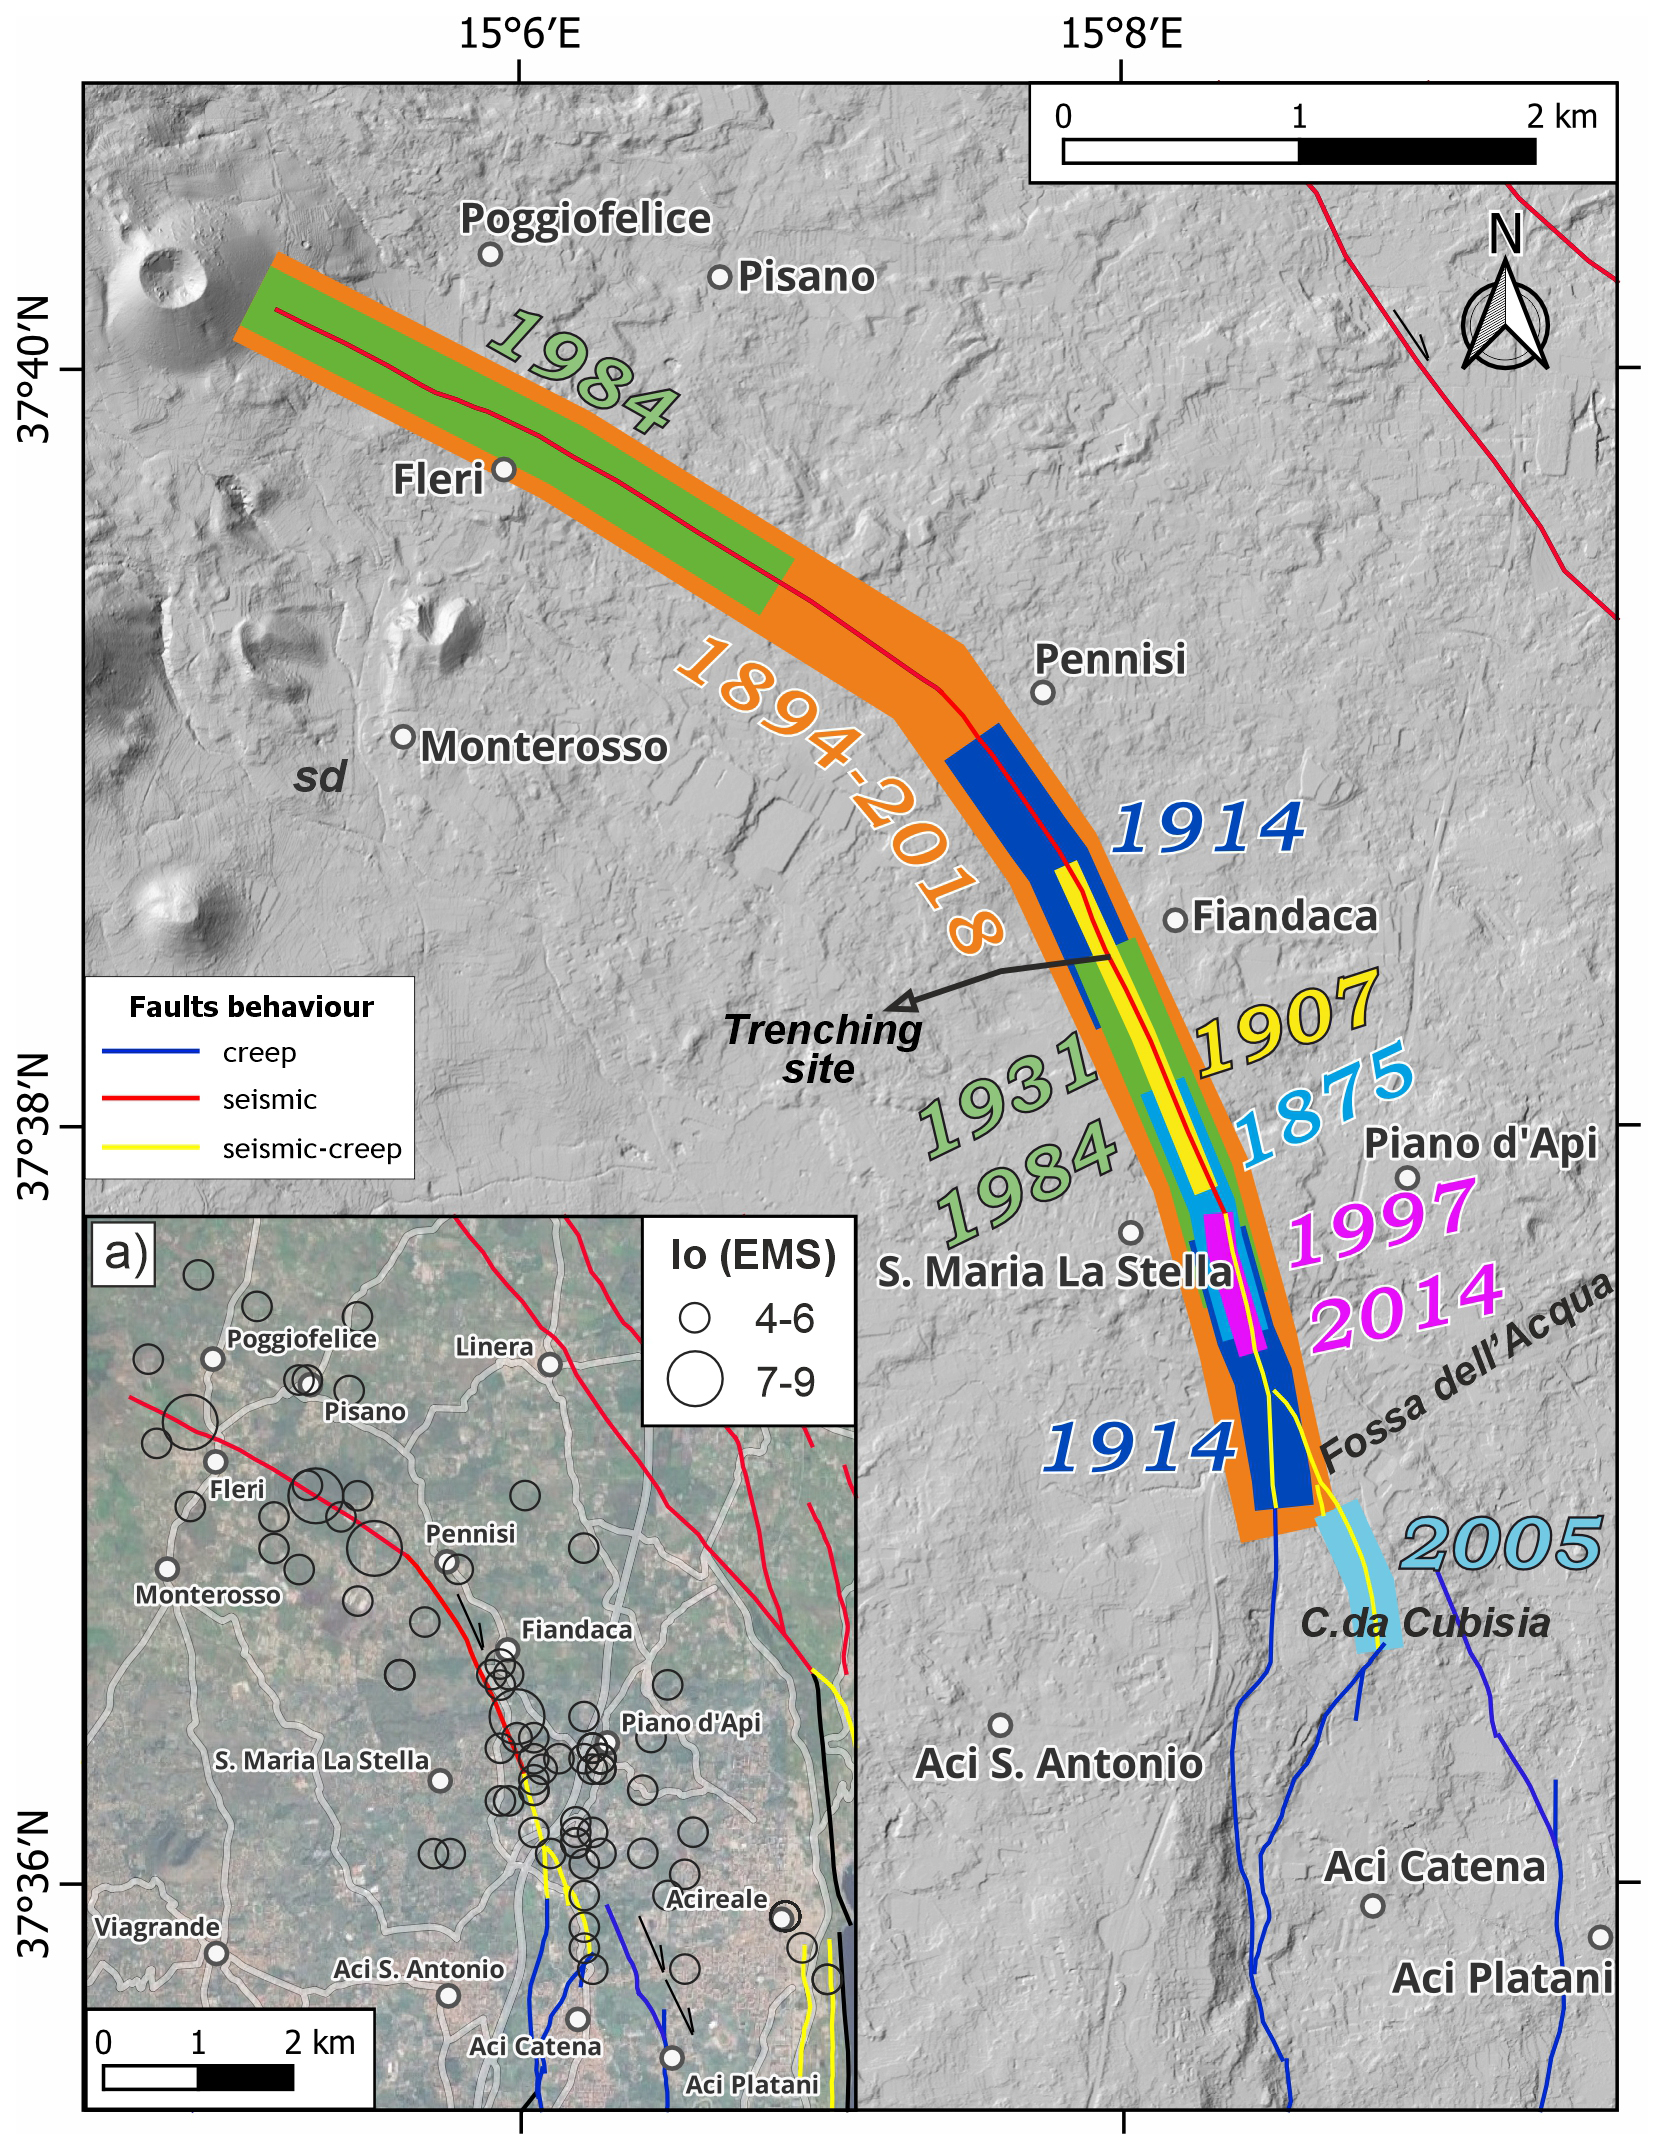
Figure 3Map showing 1875 CE to present surface faulting events along the Fiandaca Fault, coloured segments represent the earthquake ruptures (modified after Azzaro et al., 2022; Tringali et al., 2023a). In the inset (a) the seismicity around the Fiandaca Fault from 1633 CE, Io is the epicentral intensity (after Azzaro and D'Amico, 2014).
3.2.1 26 December 2018 surface faulting
The 26 December 2018 Fleri earthquake (ML 4.8–Mw 5.0; Bonforte et al., 2019; De Novellis et al., 2019; Rovida et al., 2020) generated 8 km of surface faulting along FIA and FLE (Civico et al., 2019; Tringali et al., 2023a). The ruptures showed an en-échelon pattern along FIA with left-stepping transtensive fault grabens. The maximum observed throw is 45–50 cm along the central sector of FIA with a general increase moving to the S (Azzaro et al., 2022; Tringali et al., 2023a). The heave values were particularly high in some localities, up to 120 cm, due to graben collapses and the formation of deep and elongated sinkholes.
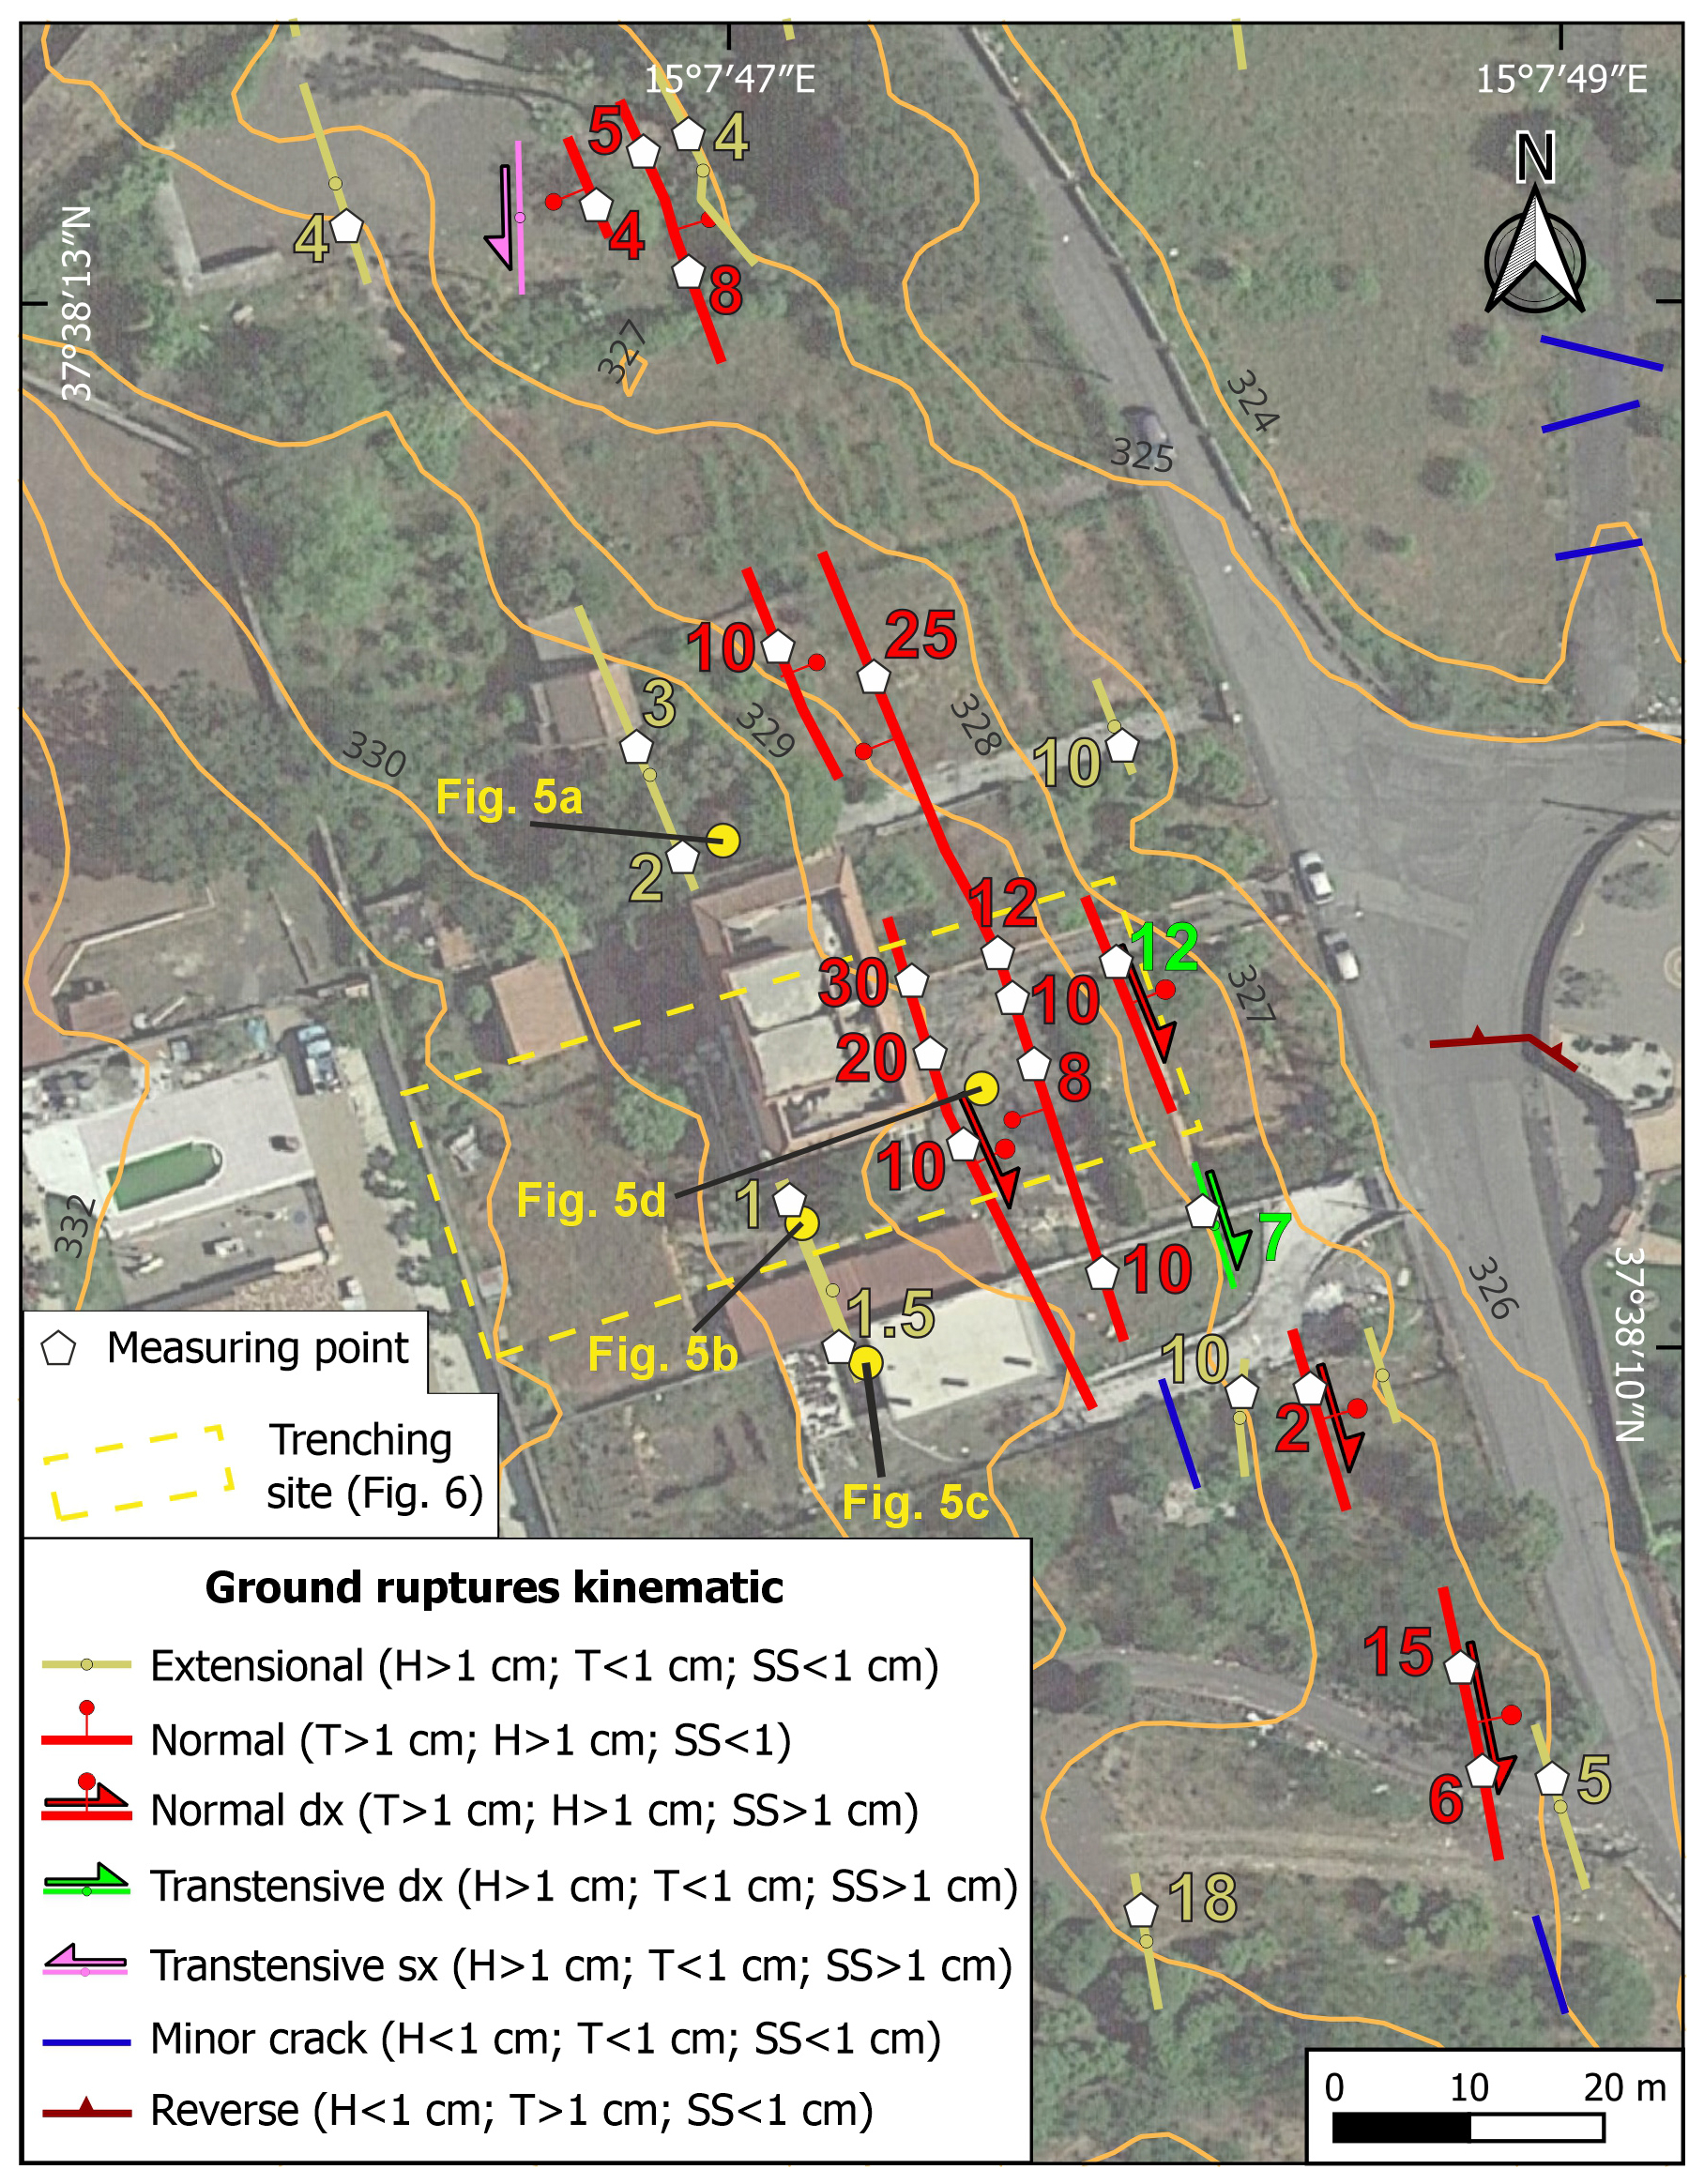
Figure 426 December 2018, earthquake ground ruptures map around the trenching site (modified after Tringali et al., 2023a); numbers show the amount of heave (H, in yellow), throw (T, in red) and strike-slip (SS, in green); yellow dots are field photos location of Fig. 5; satellite image from Orthophoto by Regione Siciliana dataset (see Data availability section).
We conducted a two-month field survey following the 26 December 2018, earthquake, starting after the mainshock (see Tringali et al., 2023a). In particular, we conducted field surveys at the Fiandaca trenching site on 26, 29 and 31 December 2018; 22 January 2019; and 18 February 2019. At Fiandaca site we observed four ground ruptures striking N150–170° (Fig. 4). The ruptures reactivated a pre-existing, ∼ 8 m high, degraded fault scarp. The western most ruptures are quite discontinuous small open cracks with a 0.5–2 cm heave, offsetting pavements and walls of the buildings over a length of ∼ 10 m (Figs. 4, 5b and c). The eastern most rupture displaced the asphalt and the walls, showing a transtensive kinematic with up to 3 cm heave and 2 cm throw, and a prevalent right lateral offset of 12 cm (Fig. 4). The central part of the fault zone showed two main ruptures delimiting a 4–5 m wide and more than 10 m long graben (Figs. 4 and 5d). The main fault of the graben showed up to 30 cm throw (with an average of 20 cm), up to 15 cm heave, and 4 cm right-lateral offset. The antithetic fault showed a maximum heave and throw of 12 cm with an average of 10 cm.
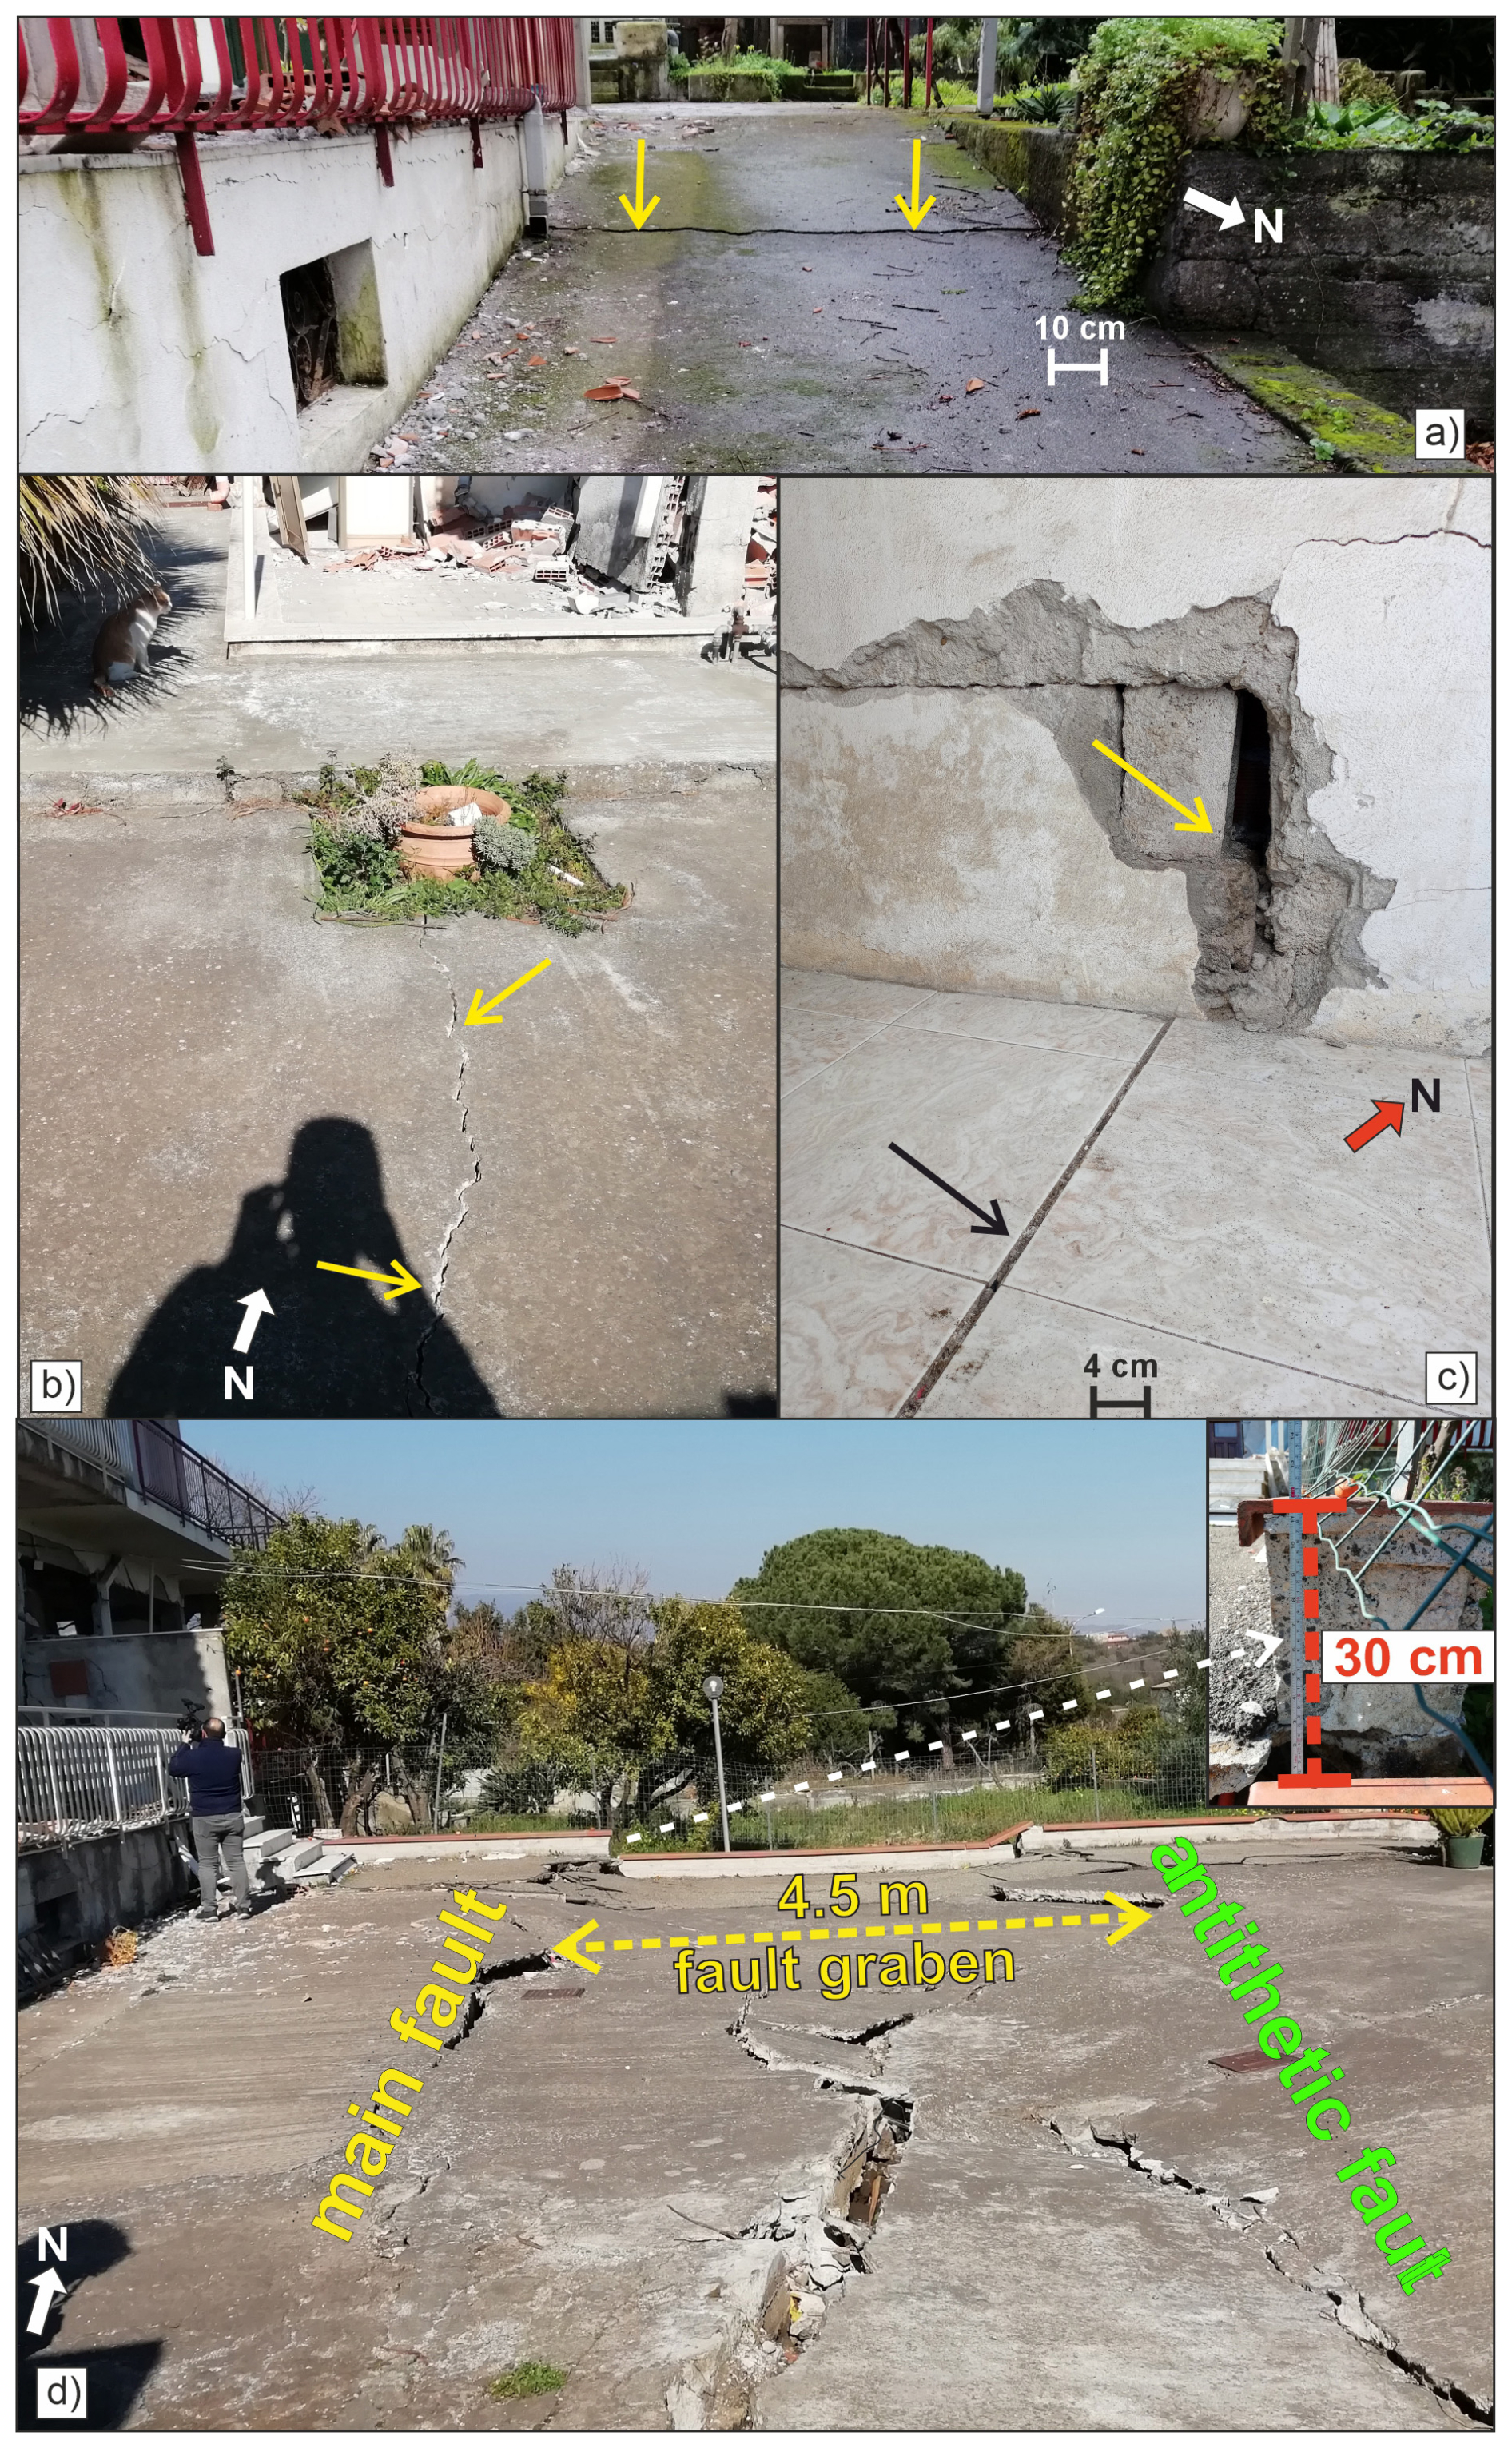
Figure 526 December 2018 coseismic ruptures at Fiandaca trench site (see photos location in Fig. 4): (a) ground rupture along a private road with few cm of offset; (b) ground rupture which follows a damaged building wall, offset ∼ 1 cm; (c) 1.5 cm horizontal offset between two floor tiles continuing into the wall; (d) fault graben on a private asphalt parking which extends over the wall and farmland. Photos taken on: 26 December 2018 (a); 22 January 2019 (b and c); 18 February 2019 (d).
4.1 Paleoseismology, trenching, logging and sample dating
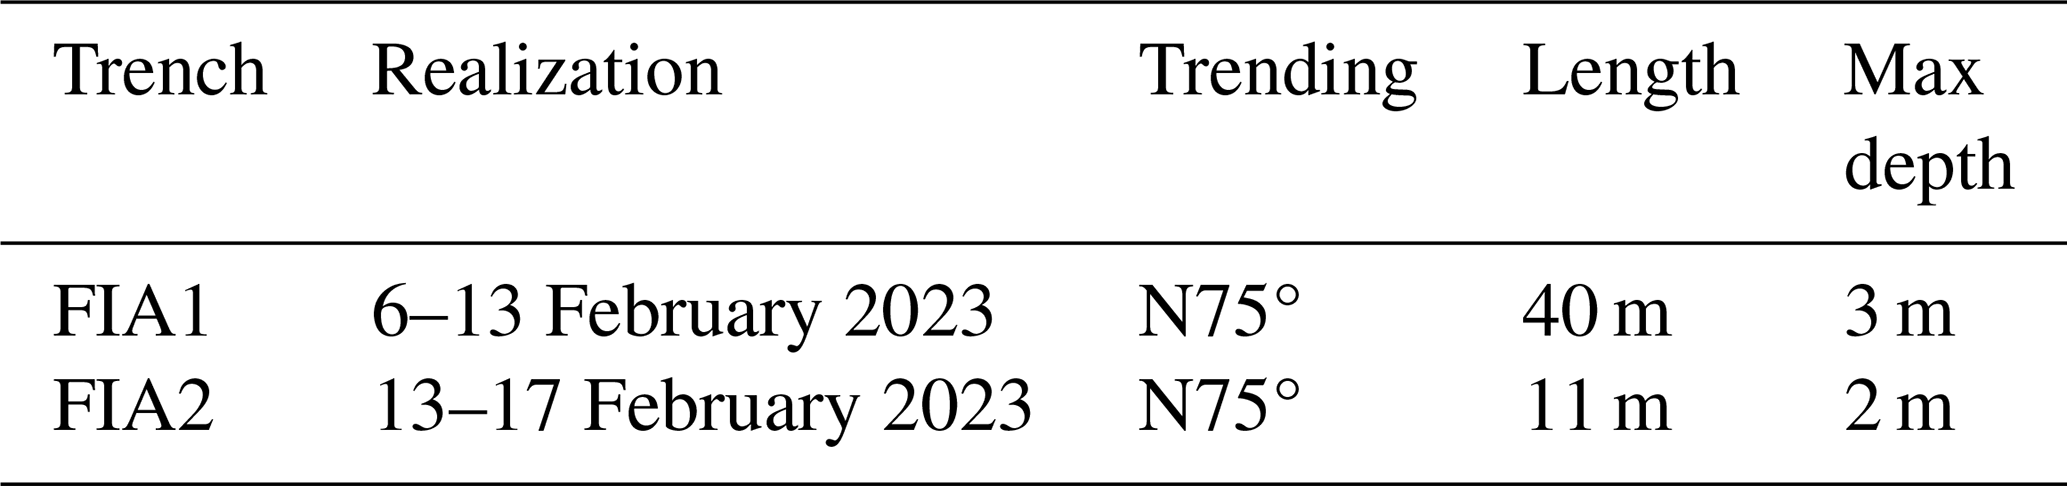
We excavated two trenches, named FIA1 and FIA2 (Fig. 6), across the 2018 coseismic ruptures to a maximum depth of 3 m (see Table 1 for details). We cleaned the trench walls in order to facilitate accurate recognition of natural stratigraphy. Parts of the trenches encountered thick anthropic refill and therefore were not cleaned and studied. It was possible to study the natural stratigraphic and tectonic features along the trench sections named N-Wall, S-Wall1 and S-Wall2, for the FIA1; and N-Wall, for the FIA2. We identified the main stratigraphic units and the faults based on the grain-size distribution, fabric and colour, separated by bed tops of unconformities, considered as horizons. Horizons were flagged with coloured pins and logged. We logged the trench walls at 1:50 scale. We used UAV survey to obtain a detailed orthophoto image of the trench site. We generated three ortho-photomosaics from a 3D digital model of the trench walls, obtained by the processing of ground-based 24-megapixel imagery means of common Structure-from-Motion photogrammetry workflow (Agisoft Metashape® software).
Table 1Features of the FIA1 and FIA2 paleoseismological trenches.
We collected three charcoal samples and subsequently dated by AMS at CEDAD (CEntro di DAtazione e Diagnostica, University of Salento). For the determination of the experimental error in the radiocarbon date, the scattering of the data around the mean value and the statistical error resulting from the 14C count were considered. We collected one sample of tephra in FIA2 that was analysed in the INGV-OE labs by Mauro Coltelli (personal communication). Two additional samples (EFIA and WFIA) were collected from the easternmost and westernmost sections of FIA1 to perform chemical analyses, providing a more accurate constraint on the identified horizons (see further information in Sect. S2 of the Supplement).
4.2 Seismic tomography
Before trenching, we performed a seismic refraction tomography survey, in order to investigate the subsurface fault zone width. The instrumentation used for the survey consists of a 24 channel seismograph (MAE sysmatrack), 2 seismic cables with 12 sockets each, 13 geophones with a frequency of 4.5 Hz and one 8 kg hammer. To enhance the definition of the underground seismic refractors, we used seven energization points during the tomography data acquisitions. We processed seismic data using SeisOpt® @2D software.
4.3 Kinematic modelling
Kinematic modelling of the folding, related to faulting at surface, has been made by means of the trishear model (Erslev, 1991; Hardy and Ford, 1997). We used FaultFold 7.2 software (https://www.rickallmendinger.net/faultfold; last access: 30 August 2025) to model the fault-propagation folding (e.g., Allmendinger, 1998; Cardozo et al., 2003;; Jin and Groshong, 2006; Zehnder and Allmendinger, 2000). We used kinematic modelling to explore a conceptual tectono-stratigraphic setting similar to the one observed around FIA, also revealed by trenching and coseismic ruptures. Results provide a conceptual analogue to compare with our observations and with the topographic profiles, to assure that a distributed zone of deformation can be invoked across FIA. For the kinematic modelling, we assumed a dip slip normal fault kinematic and set the following parameters: (a) Ramp Angle: 80°; (b) Trishear Angle: 70°; Propagation/Slip: 1.5.
4.4 Evaluation of throw rates
We measured 10 topographic profiles across the prominent fault scarps that characterize the Fiandaca Fault. We selected the trace of the topographic profiles in order to quantify the displacement of well-dated lava flows that cross the Fiandaca Fault trace, with the aim of calculating the averaged throw rates for each profile. Their location was chosen in areas with minimal forest cover and anthropic disturbance (i.e., low presence of buildings). To ensure the reliability of the obtained rates, we compared the throws with the thickness of the lava flows. We realized the topographic profiles only where the thickness of the lava flows is more than 10 m, i.e. with values higher than the current morphological throw.
The DTM (https://www.sitr.regione.sicilia.it/geoportale/it/Metadata/Details/946, last access: 20 September 2024) used to realize the topographic profiles, and to estimate the lava flows thickness, has generally an accuracy of ±0.3 m varying at ±0.6 m in areas covered for the 70 % by tree vegetation. Therefore, the calculated throws have an accuracy of ±0.3 m.
5.1 Trench stratigraphy and seismic tomography
The paleoseismological trench FIA1 and FIA2 were oriented N75° across the 2018 coseismic ruptures (Fig. 6a), enabling assessment of the width of the deformation zone, and identification of pre-2018 displacement events. We excavated FIA2 at the E termination of the FIA1, extending the initial trench to better investigate the fault zone in the sector affected by the hanging wall graben.
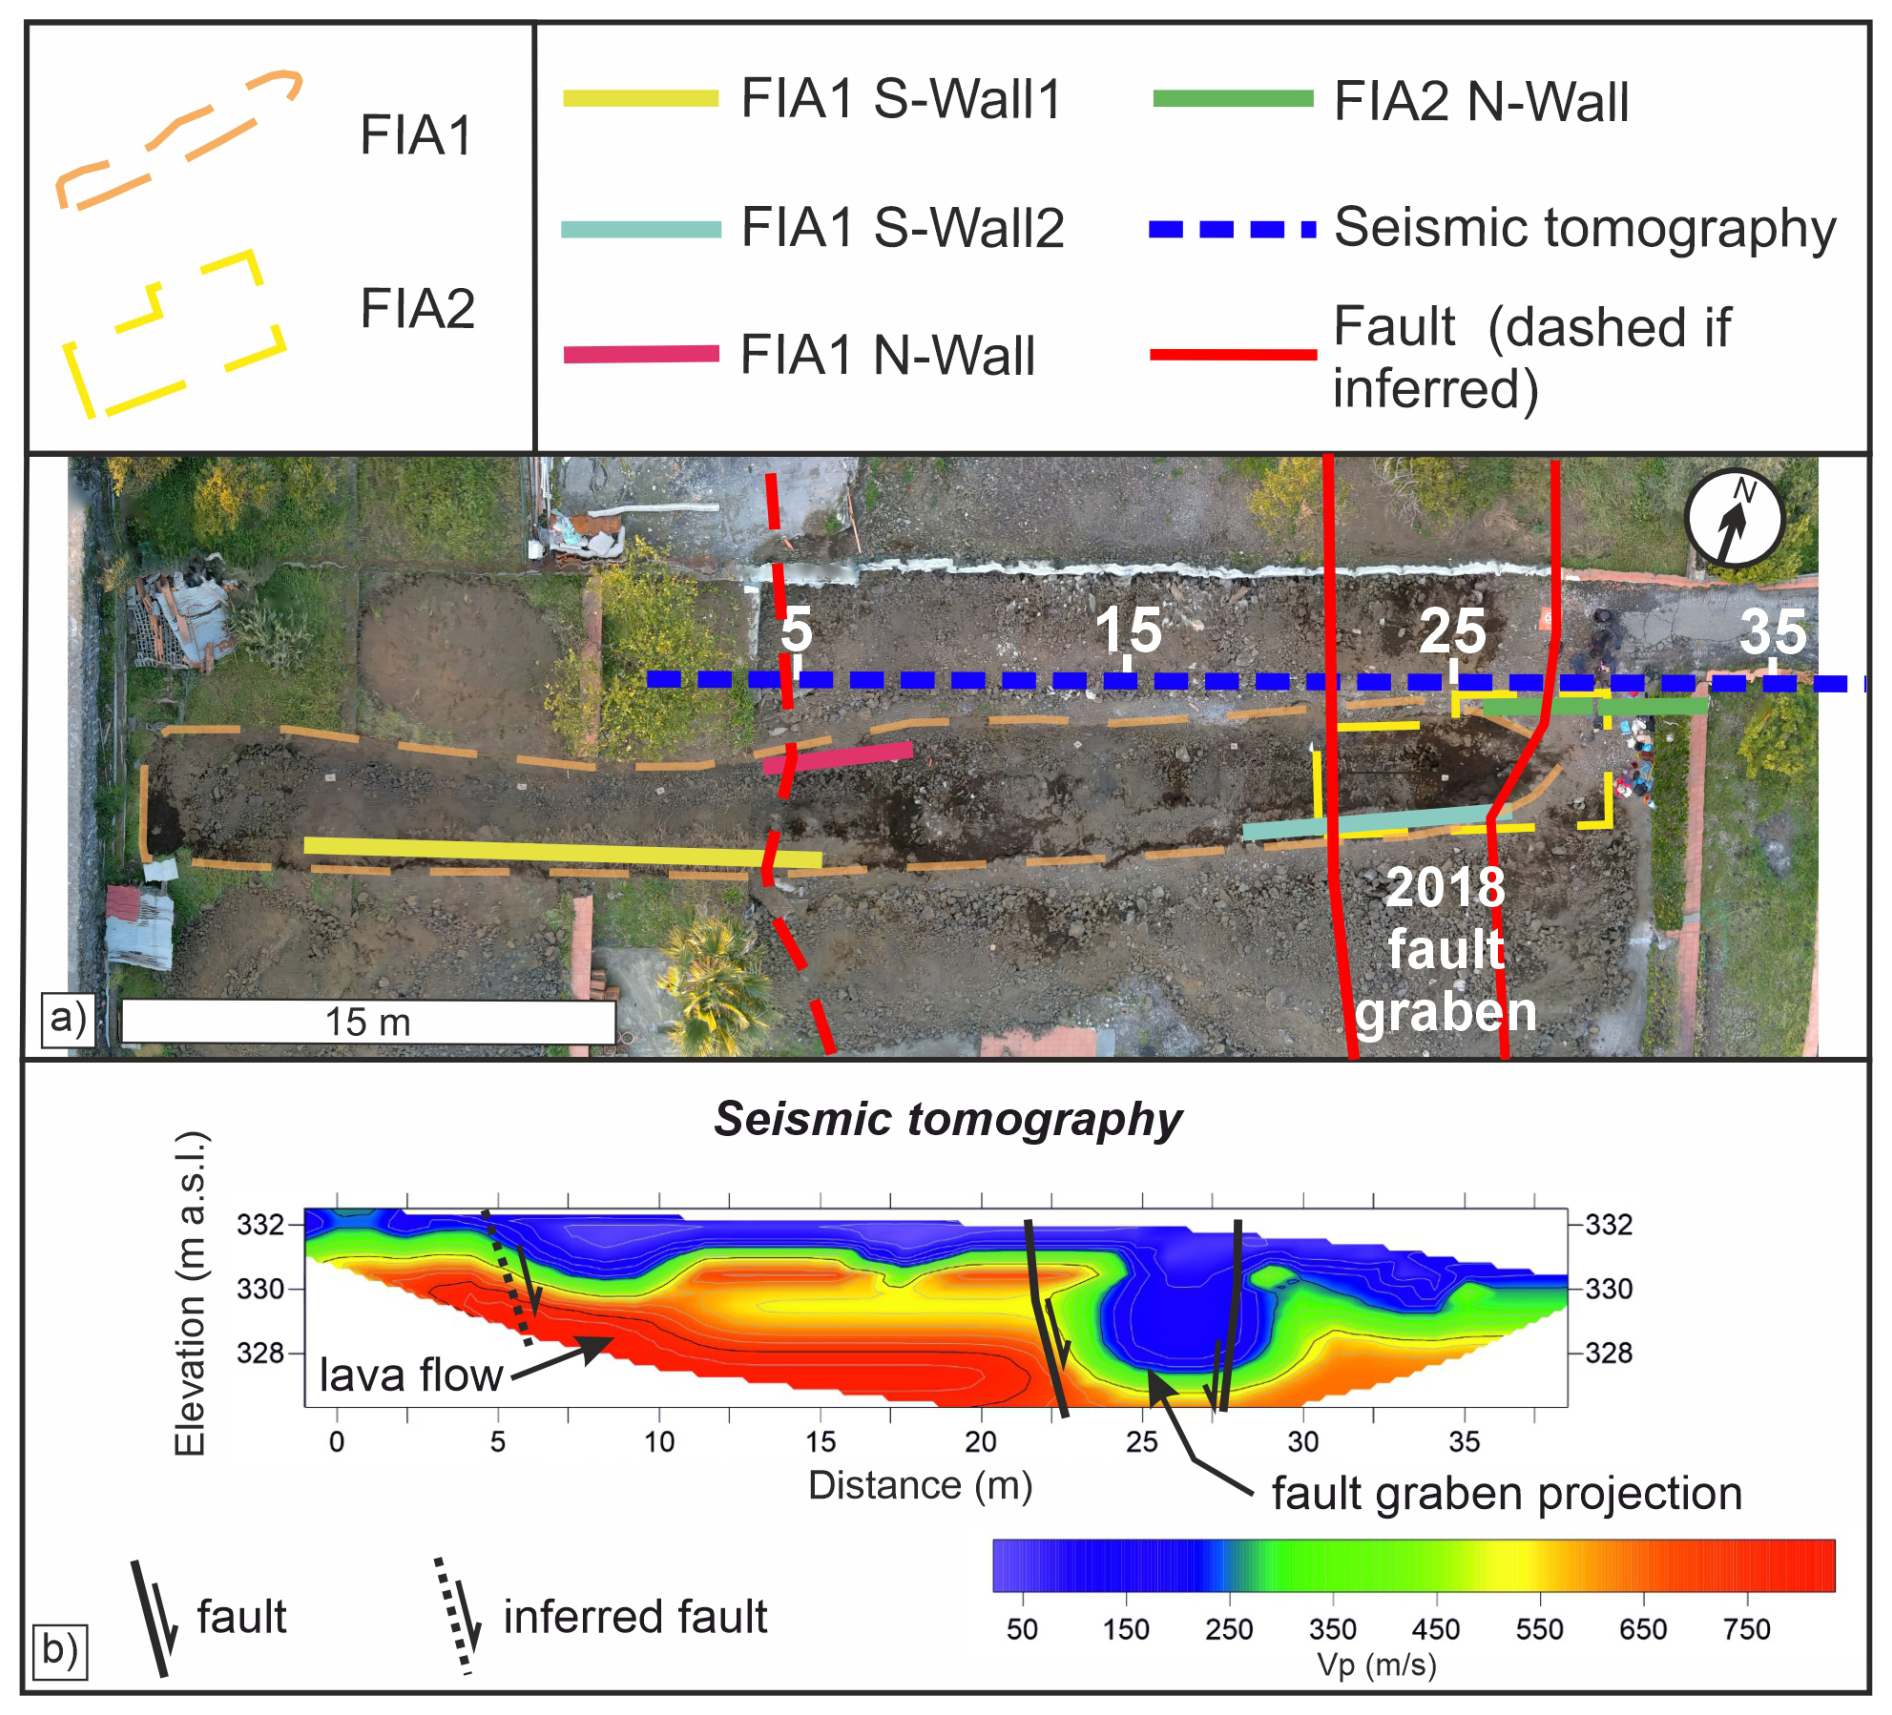
Figure 6Map of Fiandaca trench site: (a) orthophoto mosaic obtained by aerial drone photos showing FIA1 and FIA2 with sectors of the walls investigated in detail, and faults in accordance with the 2018 coseismic ruptures; dashed blue line is the trace of seismic tomography showed in (b).
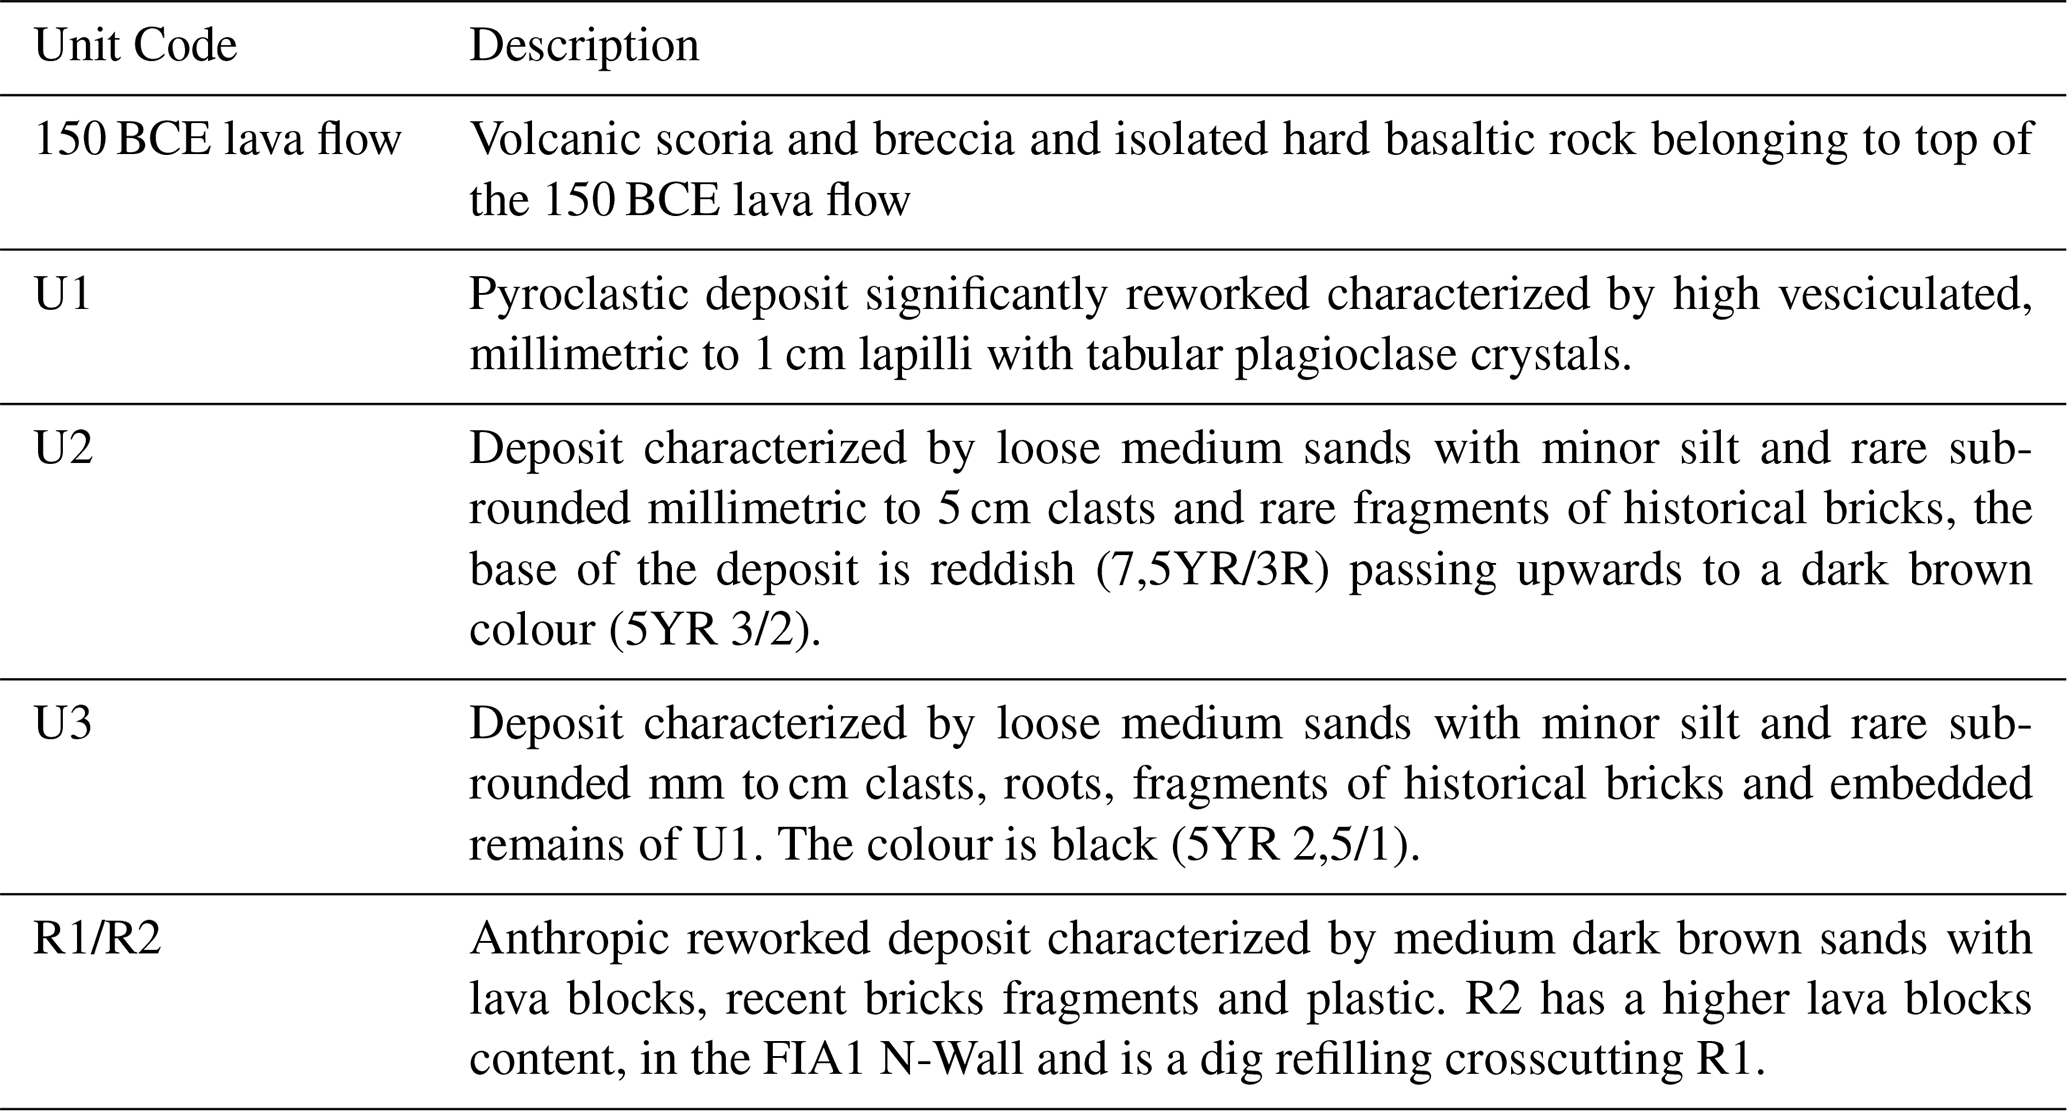
The analysis of the two trenches allowed us to identify three stratigraphic units lying on volcanic blocks associated to the top of the 150 BCE lava flow, commonly outcropping in the area. The stratigraphic units are covered by reworked anthropogenic material, in some cases directly overlapping the 150 BCE lava flow. The units are synthesised and described in Table 2.
Table 2Stratigraphic units identified along the FIA1 and FIA2 walls.
U1 is missed in many parts of the trenches, especially in the western side. An erosive surface recognized in both trenches separates U2 and U3. The seismic tomography in Fig. 6b shows two main seismic layers with different Vp values. The shallowest layer, indicated in blue, can be ascribed to the U1, U2 and U3 identified within the trench. The second layer with higher Vp is attributed to the 150 BCE lava flow observed at the base of the trenches (Fig. 6b), which exhibits a minimum vertical displacement of ∼ 3 m. The low-velocity zone between the progressives 22–28 m can be associated with the main damaged fault zone of FIA that corresponds to the surface fault graben (Fig. 6b).
5.1.1 Units dating
We calibrated radiocarbon dating obtained from 3 collected samples; the result of the calibration is shown in Table 3.
Table 3Calibrated dating of the charcoal samples collected in the FIA1 and FIA2 trenches.
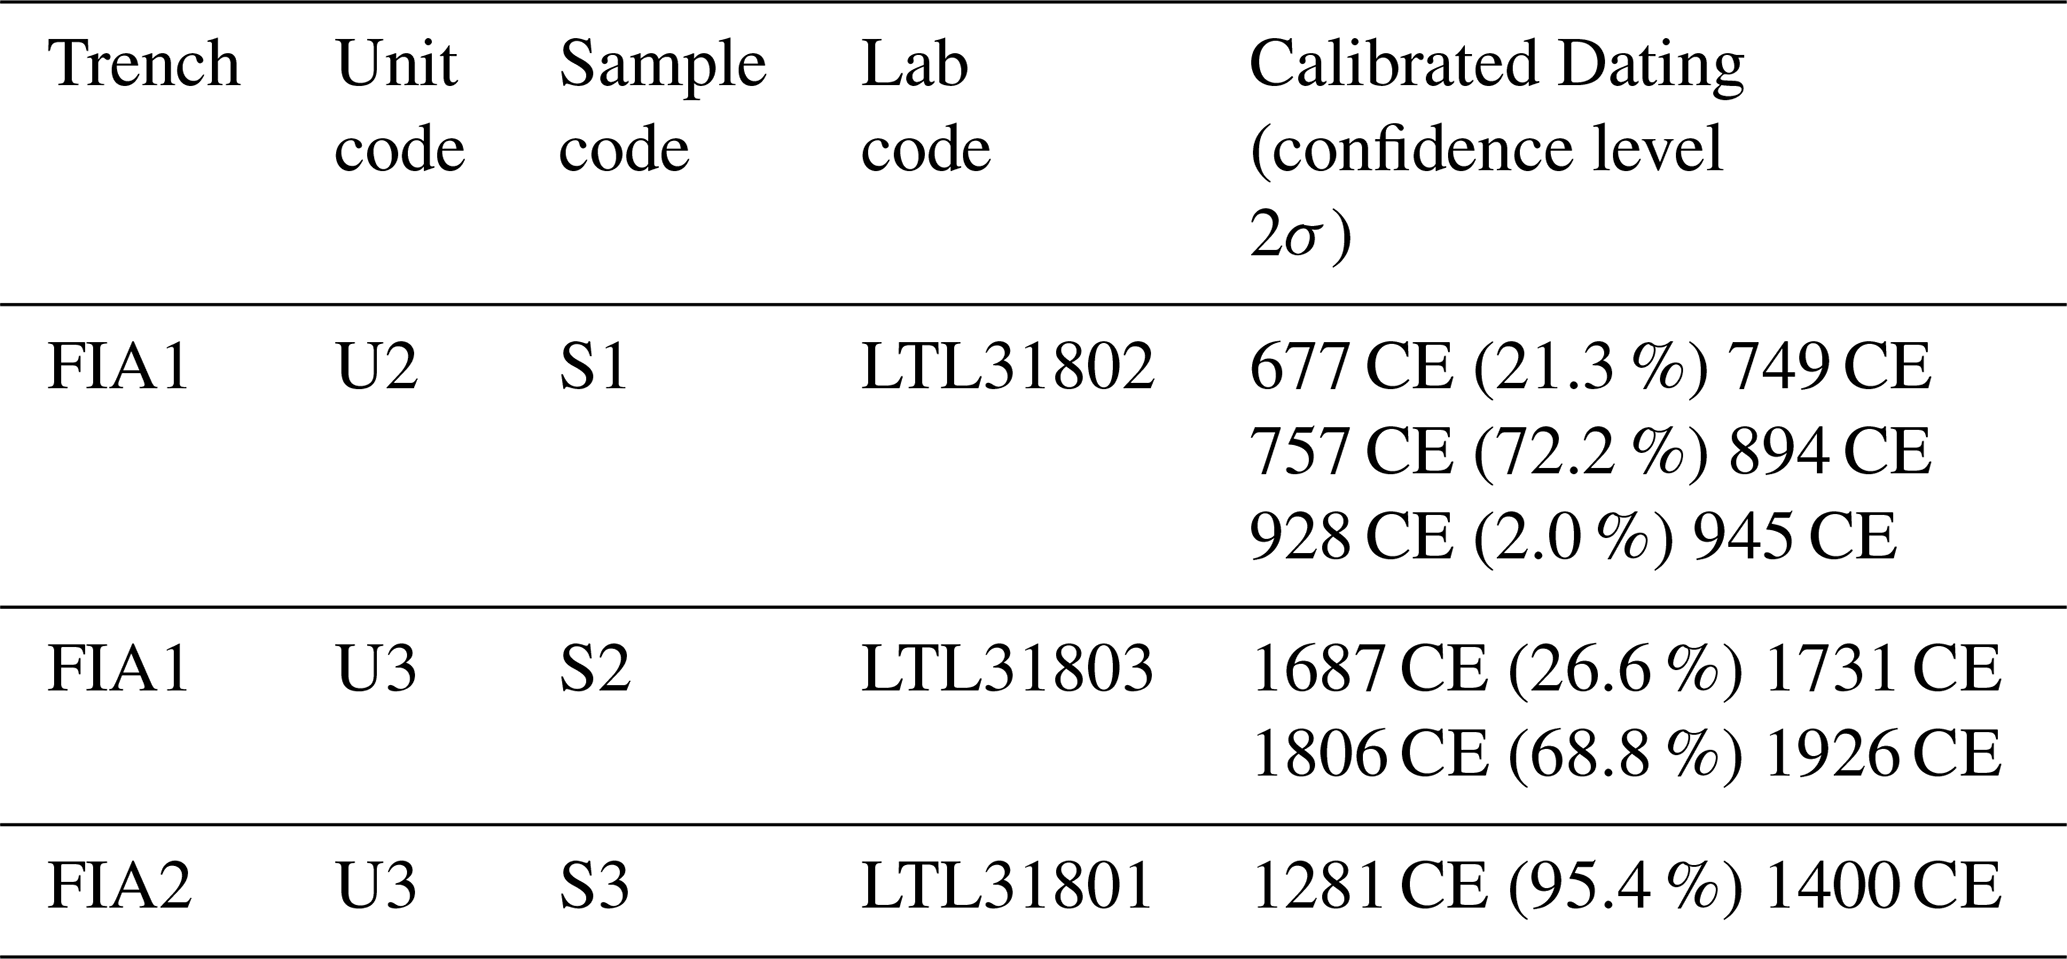
The pyroclastic deposit U1 can be ascribed to the 122 BCE (personal communication by Mauro Coltelli) aligning with its petrographic features described by Coltelli et al. (1998). Meanwhile U2 and U3 are identified as a colluvial deposit. U2 dates to the early medieval period in accordance with S1 radiocarbon dating. U3 may be likely from the late medieval period to the beginning of the last century, based on radiocarbon dating of S2 and S3.
5.2 FIA1 trench
For the FIA1 trench, three separated logs were realized named: N-Wall, S-Wall1, S-Wall2. In the western portion of FIA1 S-Wall1, the stratigraphy is sub-horizontal with U2 directly covering 150 BCE lava flow in most of the section (Fig. 7a and b). Toward the east from 5 to 0 m along section, the beds, including the 150 BCE lava flow roof, are tilted to a dip of 10° angle, increasing eastward to 15°, starting from 12 m (Fig. 7a and b). This part of the trench is characterized by an apparent thickening of the colluvium of unit U2 and the progressive increase of the eastward dipping angle of the units (Fig. 7b), which could be ascribed to an inferred fault activity. The inferred fault displaces U2 of about 20 cm.
The FIA1 N-Wall (Fig. 7c and d) shows an eastward dipping fault plane that displaces the base of U2 and the top of the 150 BCE lava flow, showing a vertical offset of about 40 cm. The original roof of U2 and part of the 150 BCE lava flow top have been eroded by two anthropogenic excavations filled with R1 and R2 (Fig. 7d), hence the clear evidence of surface faulting may have been removed. The thickness of U1 is apparently greater on the hanging wall of the fault (Fig. 7d) suggesting a colluvial deposition during the tectonic processes.
The faults observed in S-Wall1 and N-Wall of FIA1 are uncertain due to the erosive surface that truncates U2 (Fig. 7).
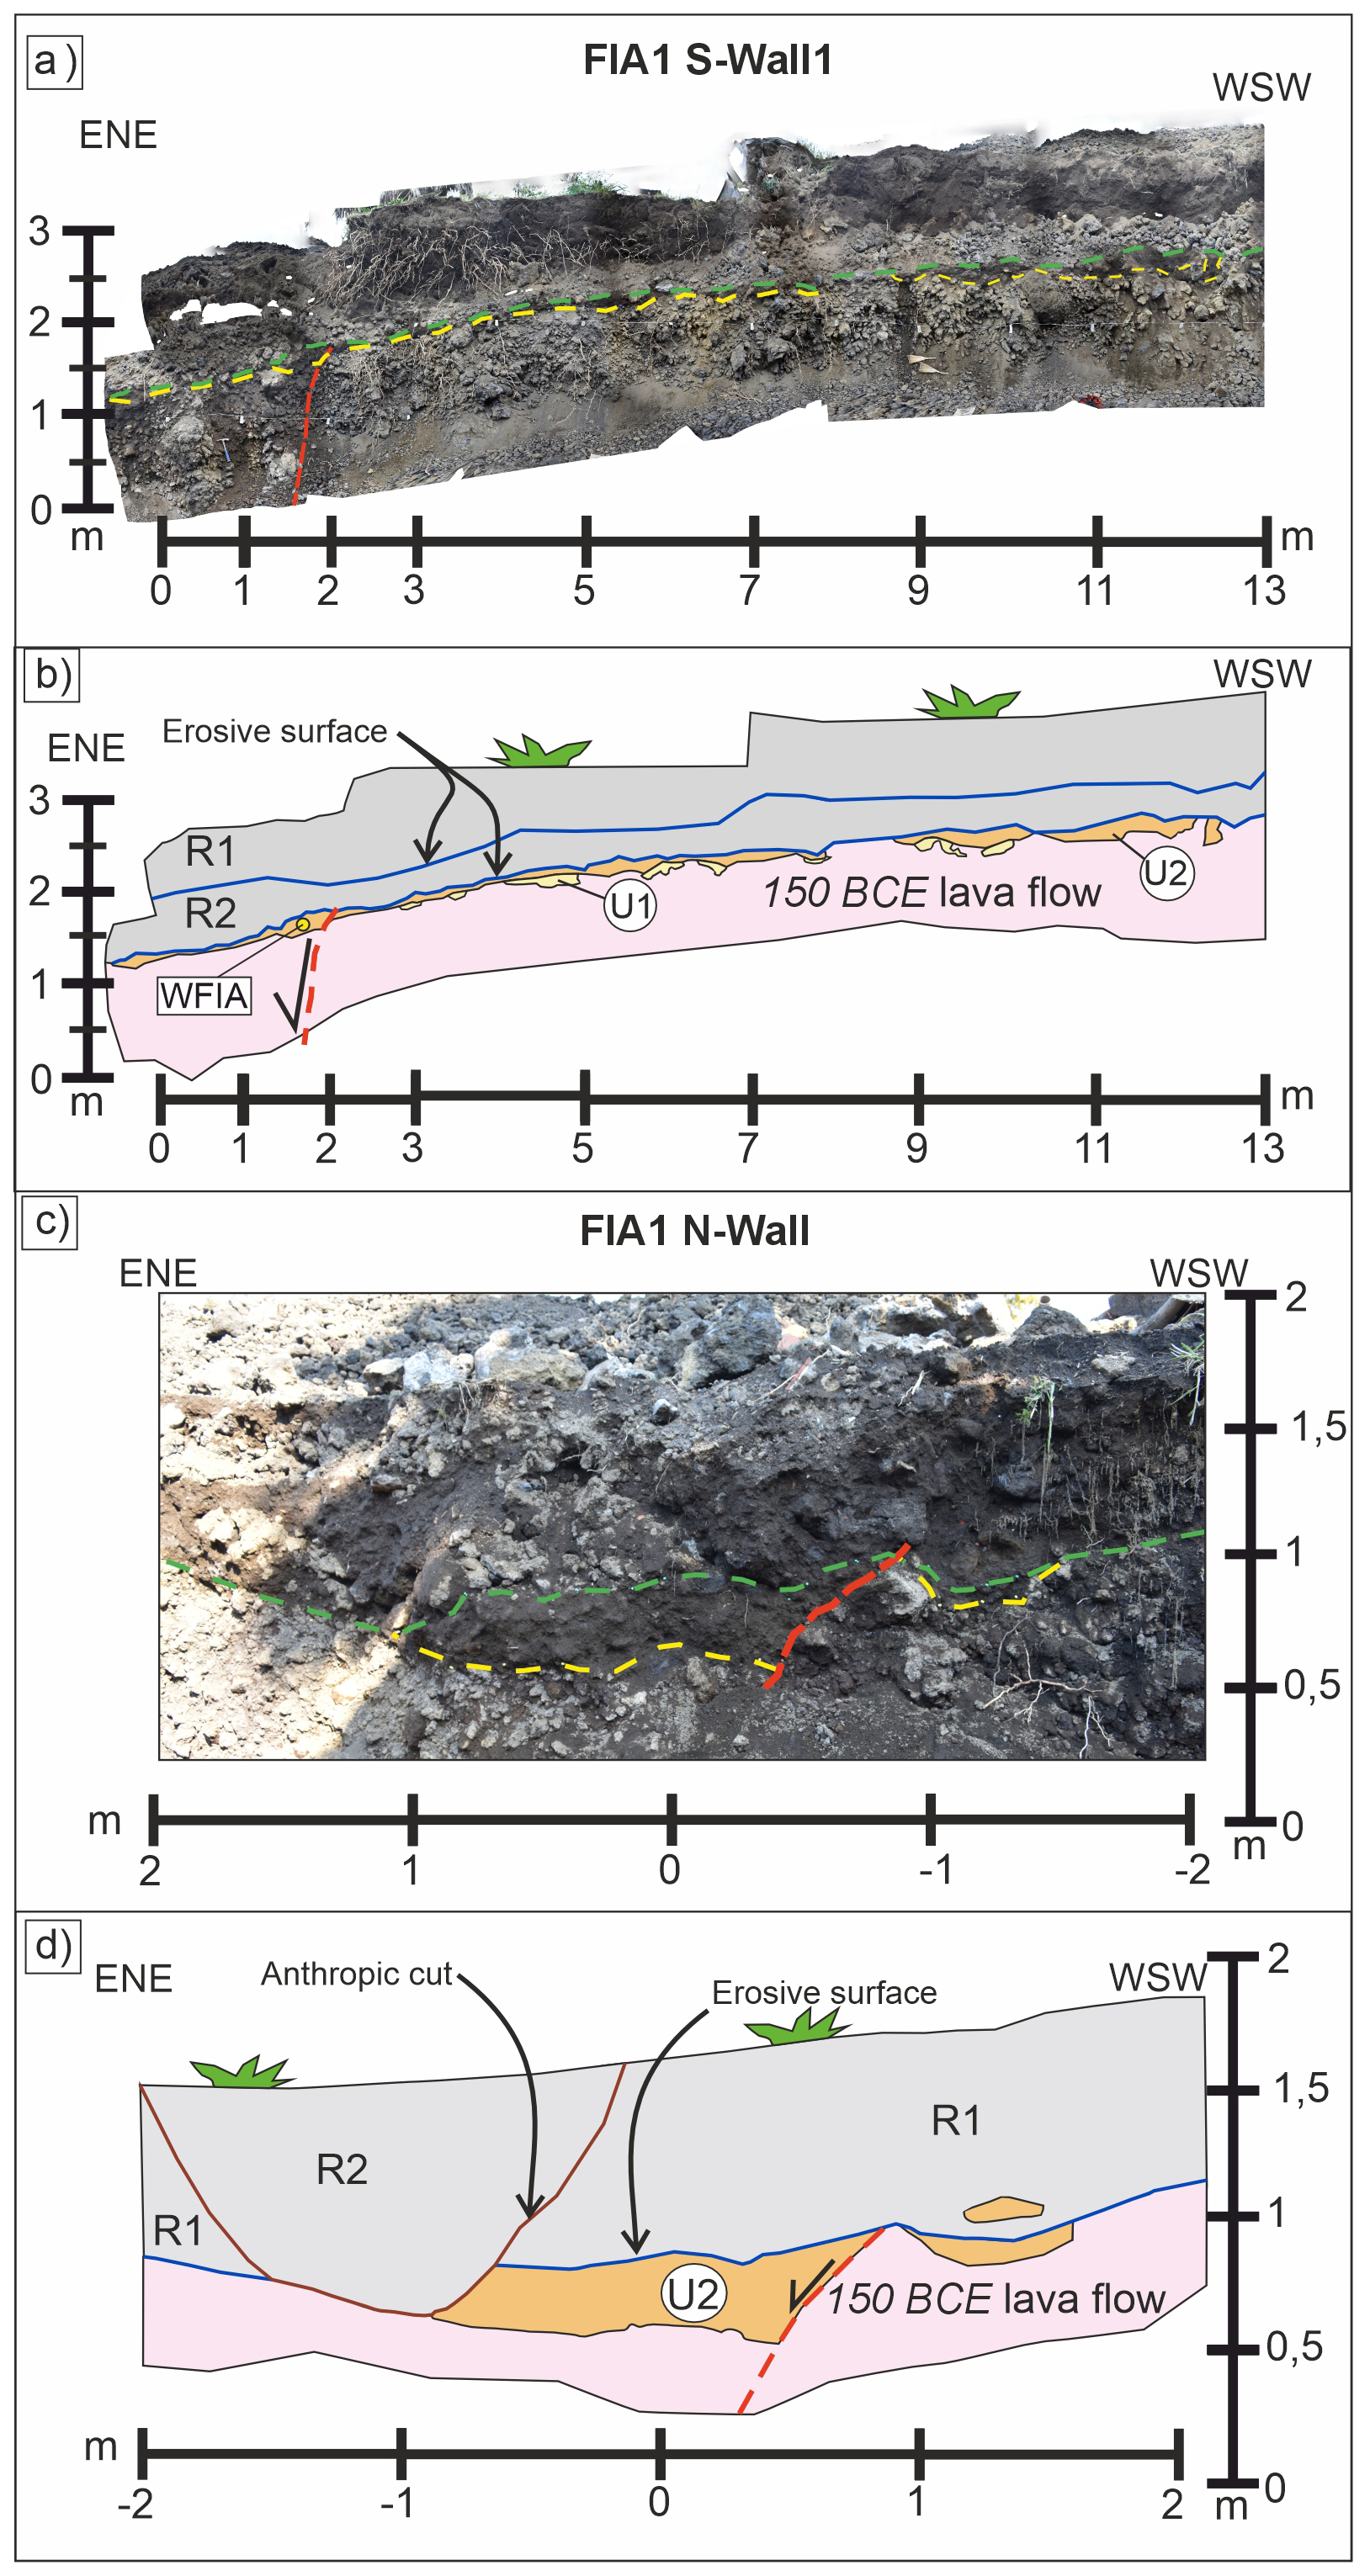
Figure 7Orthophoto mosaic of the FIA1 S-Wall1 (a) and N-Wall (c): the yellow dashed line is the top of the lava flow, the green dashed line is an erosive surface interesting the tops of U2 and the lava flow, the inferred fault planes are shown in red. (b) and (d) reconstruction of the stratigraphic succession along the FIA1 S-Wall1 and N-Wall (mirror); the inferred fault planes in red displace the lava flow and U2. Yellow dot is the sample collected for chemical analysis; the erosive surfaces are in blue.
In FIA1 S-Wall2 (Fig. 8) five fault planes have been identified displacing the 150 BCE lava, U2 and U3 (Fig. 8). The faults create “horst” and “graben” systems, where in the most depressed areas the thickness of U3 increases (Fig. 8b). The eastward dipping F2 fault shows a vertical displacement of 28 cm along U2 and a dip direction of N50°/70°, while the two W-dipping F1 and F3 faults show a maximum vertical displacement of 19 cm along U2. The F2 appears to displace also R1 with an offset of 15 cm. The F4 and F5 faults are uncertain, appearing to create a horst in the 150 BCE lava without clearly displacing the units but the erosive surface between U2 and U3 is lowered of about 40 cm. As a result, the 150 BCE lava also appears to have a total displacement of about 40 cm inside the graben formed by F2 and F4. Considering also F5, the 150 BCE lava appears to have a total throw >1 m, dipping toward the E. The dip directions of the faults are consistent with the value observed in the 2018 surface ruptures.
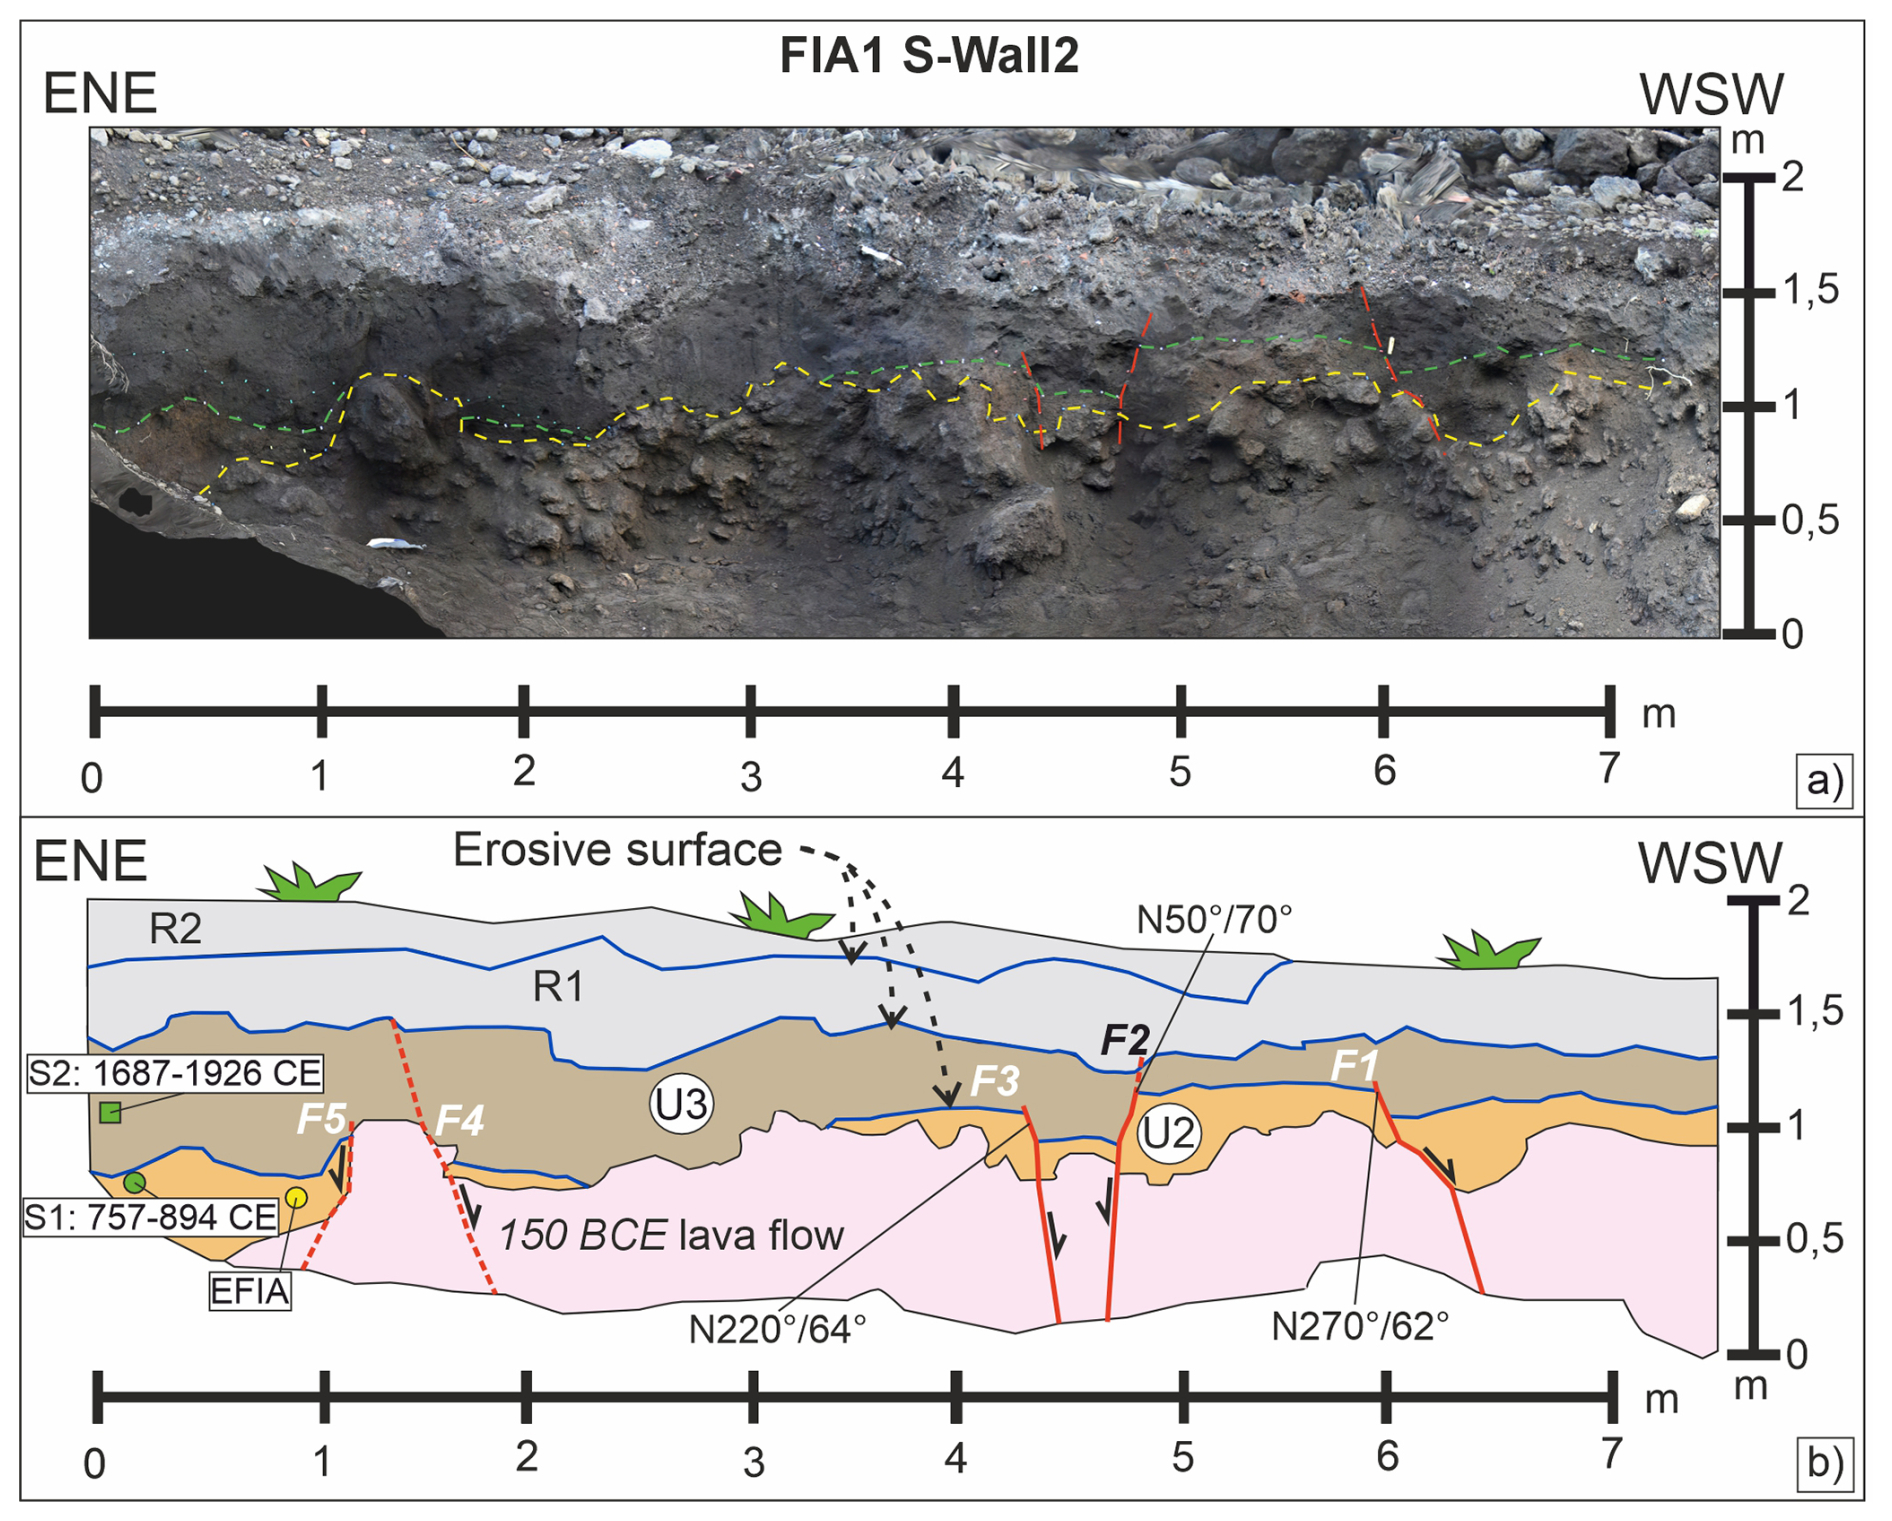
Figure 8(a) Orthophoto mosaic of the FIA1 S-Wall: the yellow dashed line is the top of the lava flow, the green dashed line is top of U2, the fault planes are shown in red. (b) reconstruction of the stratigraphic succession along the FIA1 S-Wall; the fault planes in red displace the lava flow, U2, U3 and R; the erosive surfaces are in blue. The green square and dot are dated charcoals (the square corresponds to the opposite wall); yellow dot is the sample collected for chemical analysis; the erosive surfaces are in blue.
5.3 FIA2 trench
FIA2 N-Wall (Fig. 9) highlights a westward dipping fault (F6) affecting the 150 BCE lava flow, U1, U2 and U3 (Fig. 9). U3 shows a vertical displacement of about 15 cm along F6. U2 and U1, on the other hand, show a maximum displacement of 26 cm. On the F6 hanging wall, an open fissure is filled by anthropogenic reworked material in U3 and by the silty sands of U3 in U2 up to the top of U1. The fault F6 is dipping N226°/72° which is consistent with the values measured along the coseismic antithetic surface ruptures of the 2018 earthquake.
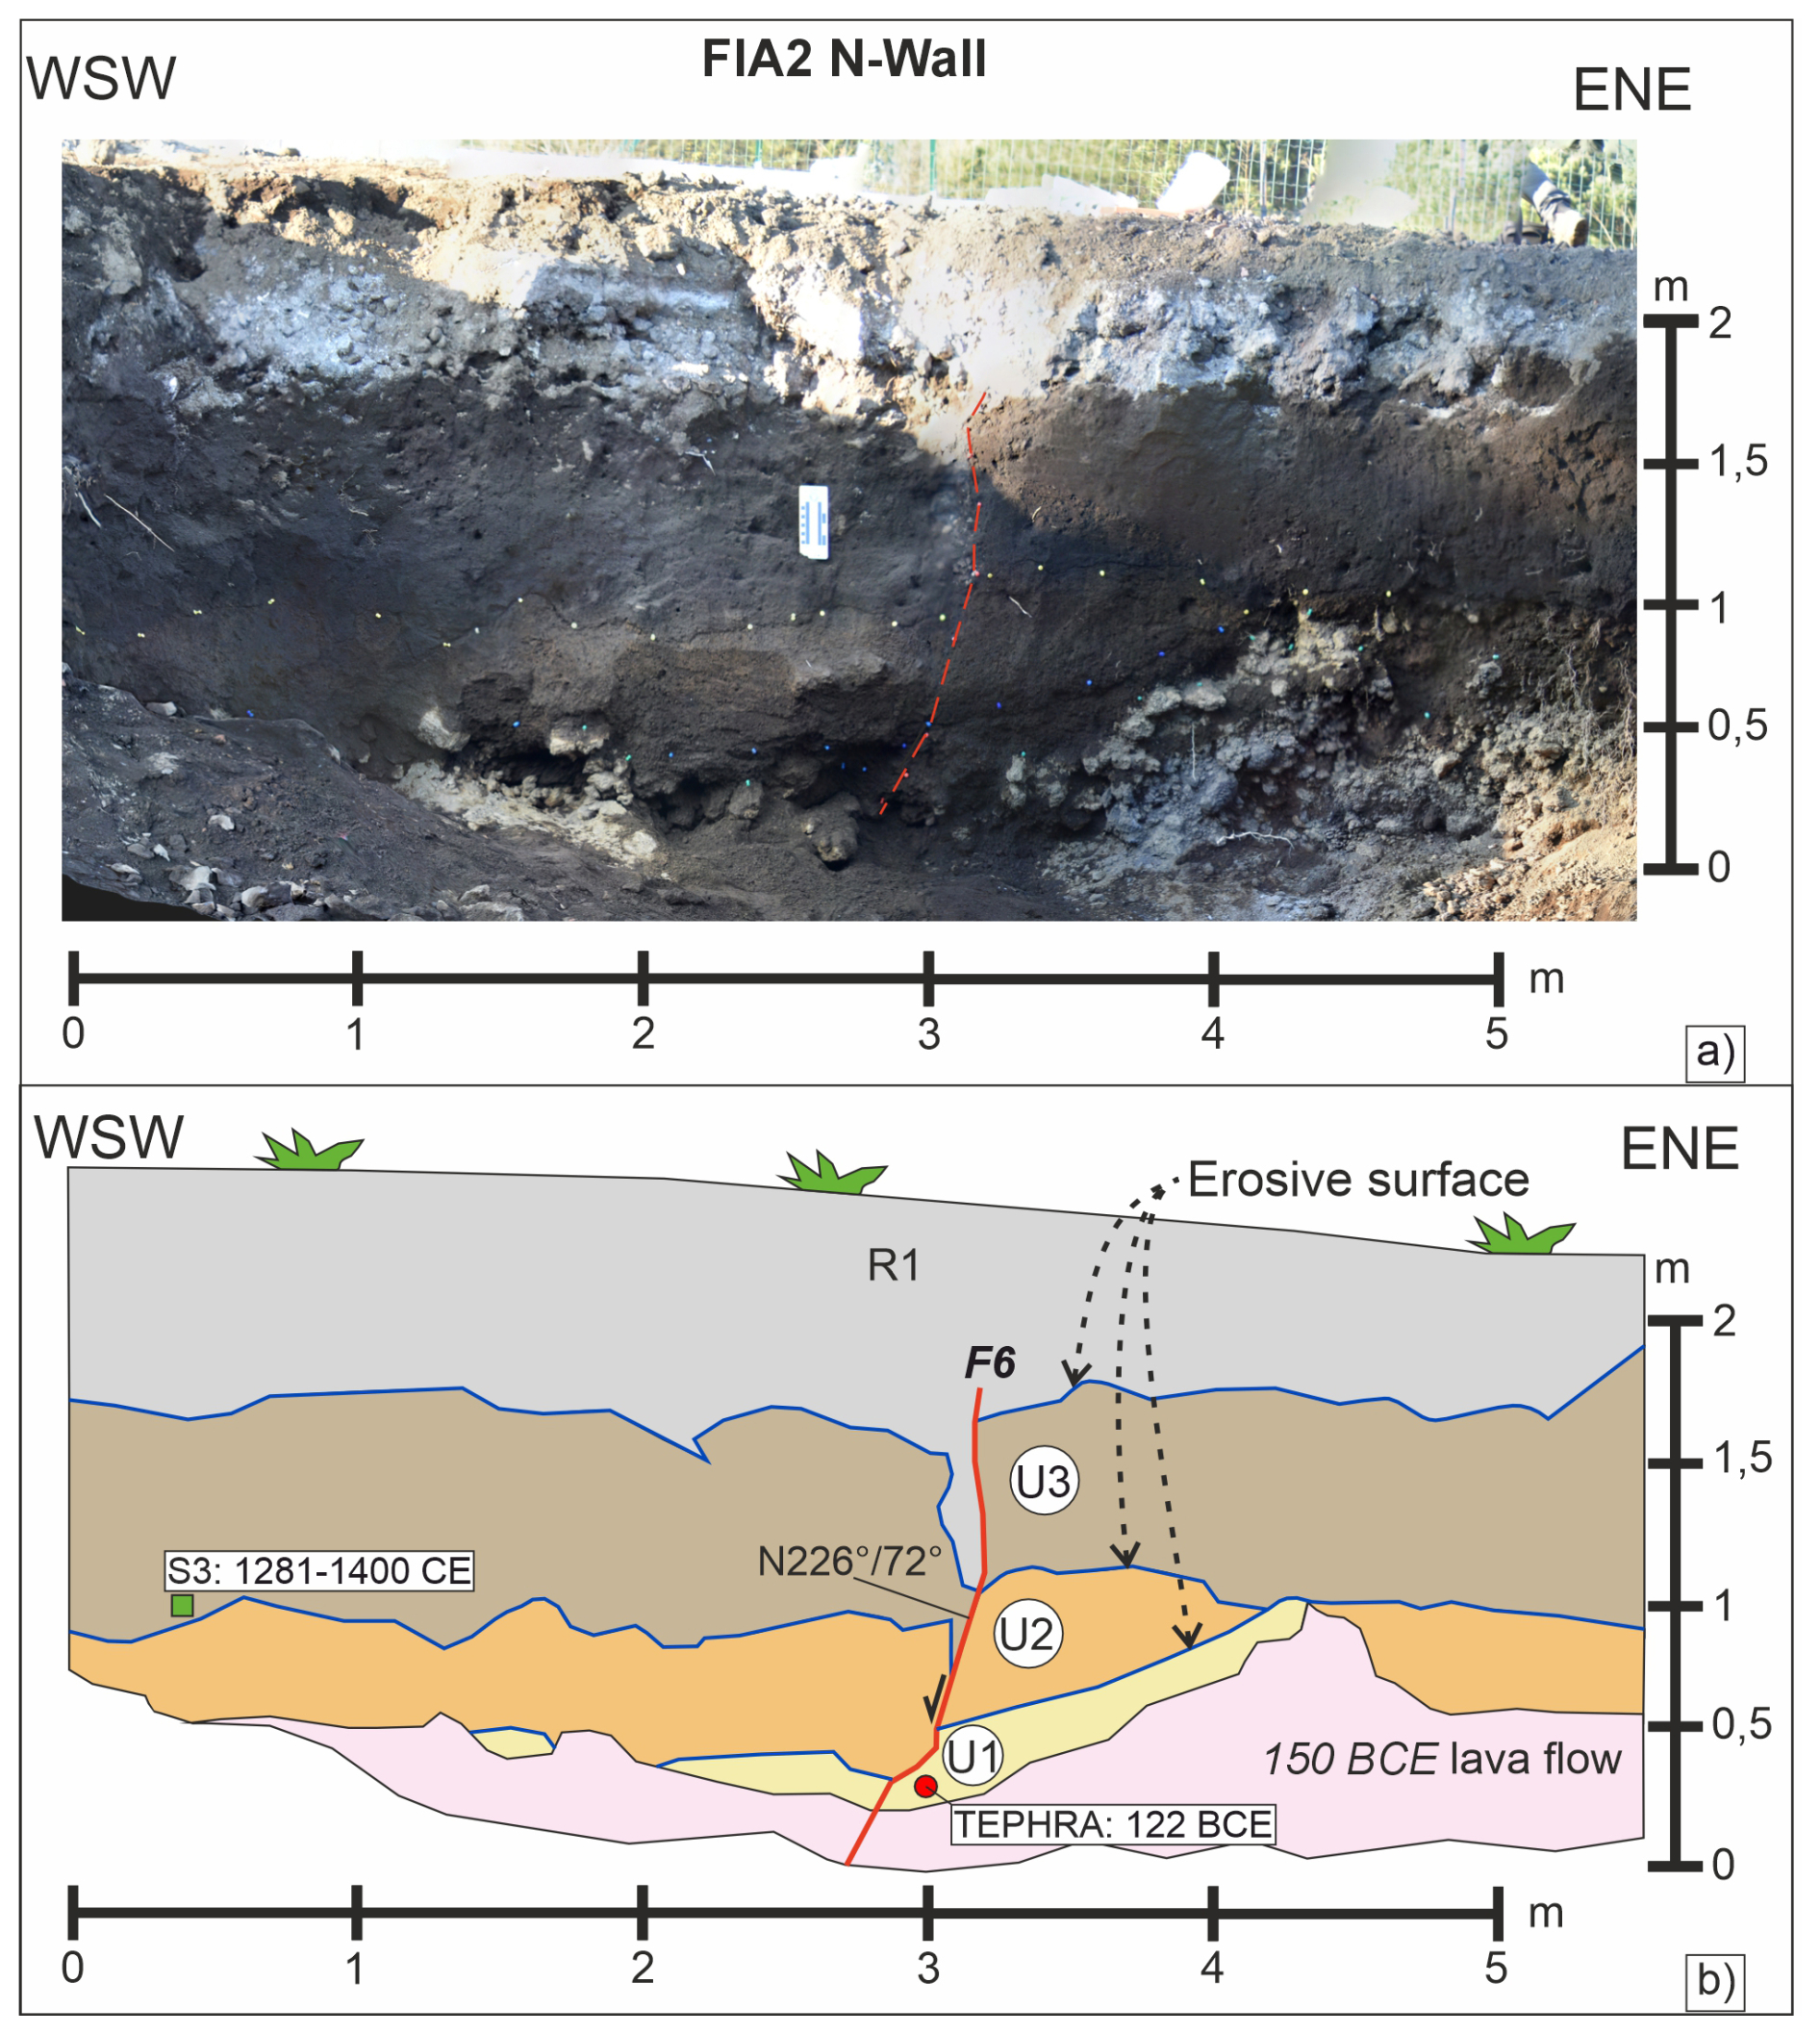
Figure 9(a) Orthophoto mosaic of the FIA2 N-Wall, the coloured pins are between the stratigraphic units and the F6 fault plane (in red); (b) reconstruction of the stratigraphic succession along the FIA1 S-Wall, the fault plane in red displaces the lava flow, U1, U2, U3 and R1. The red dot is the collected tephra sample; the green square corresponds to a dated charcoal along the opposite wall; the erosive surfaces are in blue.
6.1 Fault zone analysis
The analysis of the faults recognized along trenches walls and the 2018 coseismic ground ruptures in the same area, highlights a distributed fault deformation zone about 30 m wide which is consistent with 2018 fault rupture width (Tringali et al., 2023a). The faults in the FIA1 S-Wall2 and FIA2, more specifically F2, F4 and F6, correspond with the 2018 coseismic ruptures forming the main fault graben (Figs. 4 and 6a). The inferred fault of the FIA1 N-Wall and S-Wall1 is aligned with the 2018 westernmost coseismic ruptures. The 150 BCE lava flow in the seismic tomography also appears slightly displaced between 4 and 6 m (Fig. 6b) suggesting the existence of the inferred fault observed in the FIA1 N-Wall and S-Wall1.
6.2 Trench restoration and paleoseismic sequence
Previous studies about the Etna eruptions and the dating of charcoal samples allowed to temporal constrain the restoration of the trenches. We conducted this restoration only for the FIA1 S-Wall2 (Fig. 10) and FIA2 N-Wall (Fig. 11), where we found clear evidence of faulting.
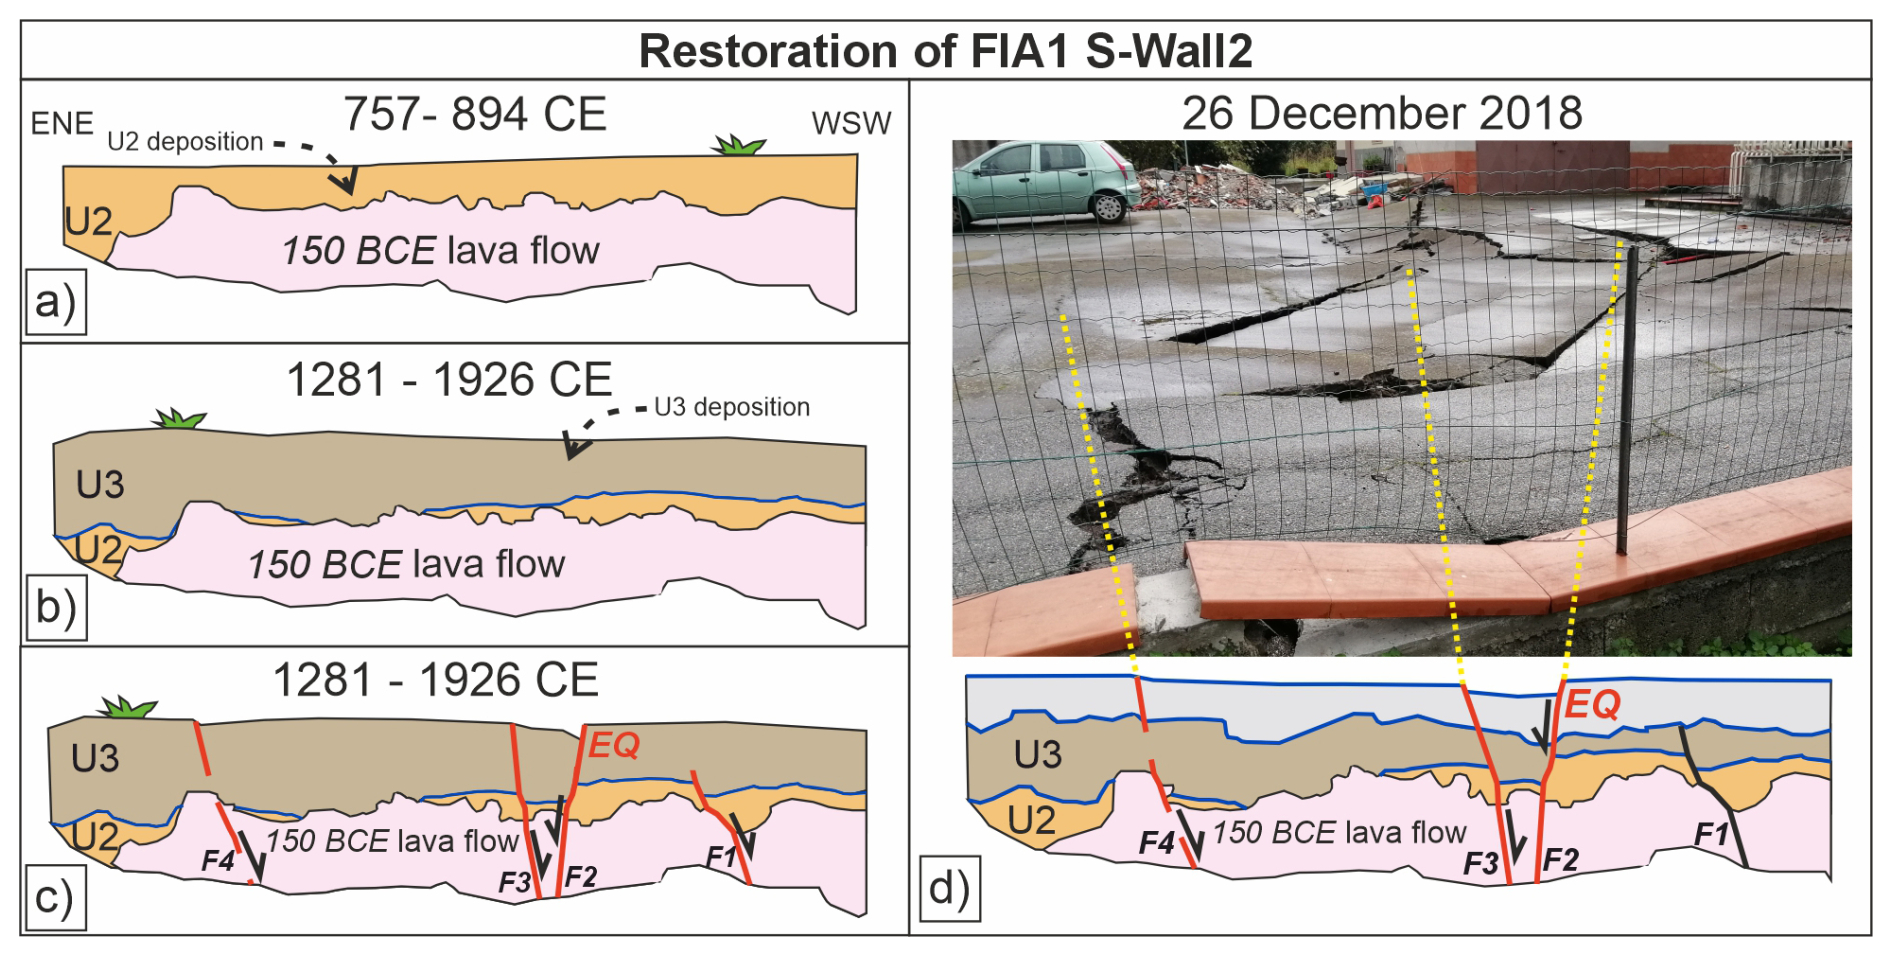
Figure 10Possible restoration of the FIA1 S-Wall2; (a) deposition of the colluvial deposit of U2 during the period 757–894 AD, subsequently partially eroded and reworked because of its exposure to the surface; (b) period 1281–1926 AD with the deposition of the colluvial deposit of U3 followed by an earthquake (c) which activated F1, F2, F3 and presumably F4; (d) after the reworking of the surface by the human activity and formation of the R1 during the 1970s, a second earthquake in 2018 produced a new surface faulting event along F2 and probably F3 and F4.
Figure 10 shows the restoration of the FIA1 S-Wall, at least two seismic events can be observed: the first earthquake occurred after or during the deposition of U3 in the period 1281–1926 CE, and a second one in 2018. In fact, F2 of the FIA1 S-Wall appears to also affect R1, showing evidence of activation during the 2018 event, as this fault corresponds with the 2018 event main surface rupture (Fig. 10d). The supposed F4 corresponds to the antithetic surface rupture of 2018 coseismic graben (Fig. 10d). Probably, the demolition works of the pre-existing building have further reworked R1, thereby obliterating clear evidence of the 2018 faulting. The displacements measured along F1, F2, F3 and F4 in FIA1 appear to be consistent with two seismic events in accordance with the average throw values observed in the 2018 surface ruptures of the area. Thus, certainly one earthquake occurred along the F1, F2 and F3, but it is very likely that they have undergone two events. If only one earthquake had occurred, this should have been of a higher Mw than the one in 2018 (i.e., Mw>5) given the amount of displacement. However, 5 is the maximum expected Mw estimated for FIA (Azzaro et al., 2017; Azzaro et al., 2022), hence we assume that 2 earthquakes can be observed in FIA1 S-Wall.
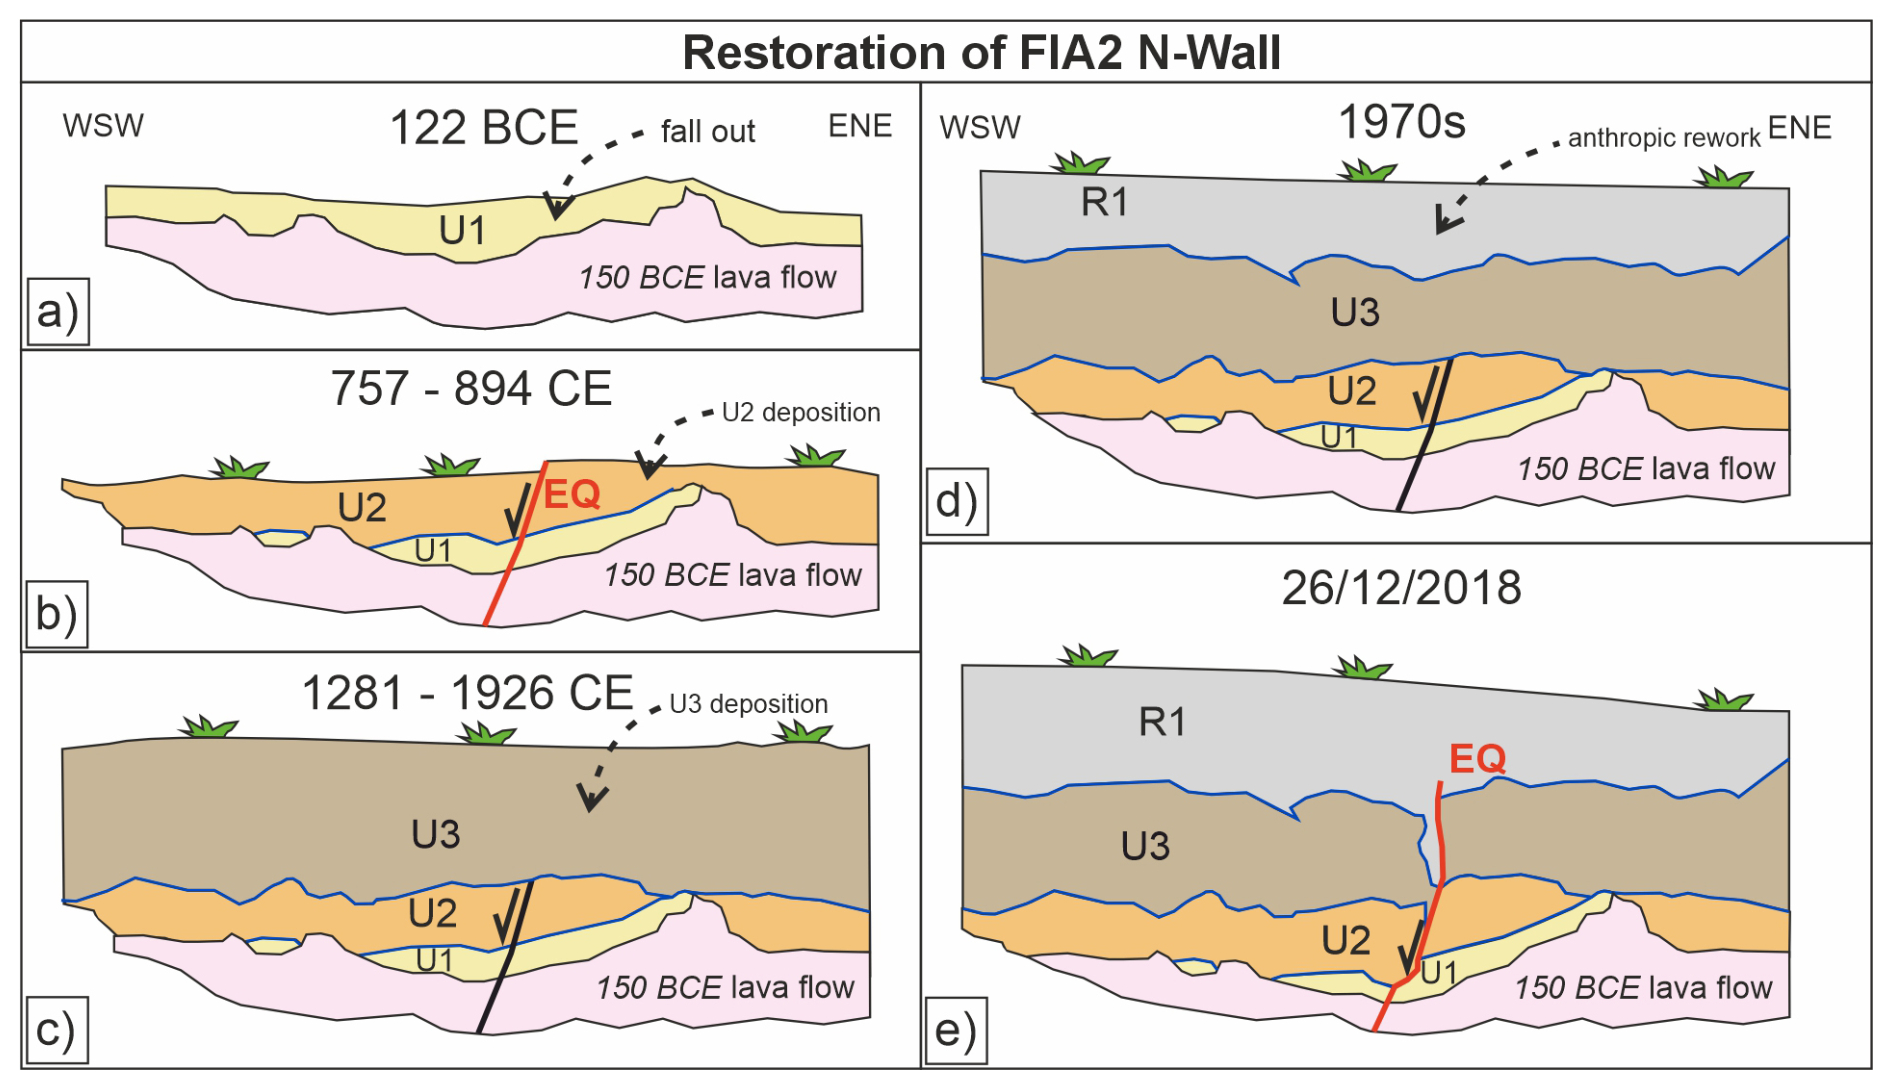
Figure 11Possible restoration of the FIA2 N-Wall. (a) pyroclastic fallout (122 BC Plinian eruption) is deposited on the 150 ± 200 BC lava flow, subsequently partially eroded and reworked because of its exposure to the surface; (b) an earthquake occurred during the deposition of the colluvial deposit of U2 in the period 757–894 AD; (c) after an erosive event on U2, the deposition of the colluvial deposit of U3 occurred in the period 1281–1926 AD; (d) reworking of the surface by the human activity and formation of the R1 during the 1970s; (e) earthquake in 2018 displacing the lava flow, U1, U2, U3 and R1.
Regarding the FIA2 N-Wall the F6 displacement of 26 cm measured along U2 and U3 appears to be related to at least two seismic events in accordance with the throw values of the 2018 surface ruptures in the area. Displacement of 15 cm observed in U3 are consistent with the ones of the 2018 W-dipping surface ruptures occurred exactly in the same location. Moreover, the open fissure along F6 filled by the R1 allows associating it to the 2018 event with a high confidence. The displacement of 26 cm measured in U2 is a minimum, but it can indicate at most least two events when compared with the throw values measured along the 2018 west-dipping surface ruptures. Therefore, also along the FIA2 N-Wall it is possible to infer the occurrence of two earthquakes (Fig. 11).
Finally, the combination of the two trenches allow to detect 3 earthquakes (Fig. 12) occurred in: (1) 757–894 CE time interval (Fig. 11b); (2) 1281–1926 CE time interval (Fig. 10c); (3) 26 December 2018 (Figs. 10d and 11e). The first event is a novelty because it is not reported in any seismic catalogue due to the lack of available historical sources so far. Furthermore, this early medieval earthquake might have been triggered by a dyke intrusion related to one of the three eruptions that occurred along the eastern flank in the period 700–850 CE (see Branca and Abate, 2019). The second event, which preceded that of 2018, may be associated with the 1894 CE earthquake, because it is the strongest historical known seismic event with documented surface faulting. However, there are some uncertainties regarding the precise timing of this second event which might also be related to other historical earthquakes occurred around the trenching site as shown in Fig. 12.
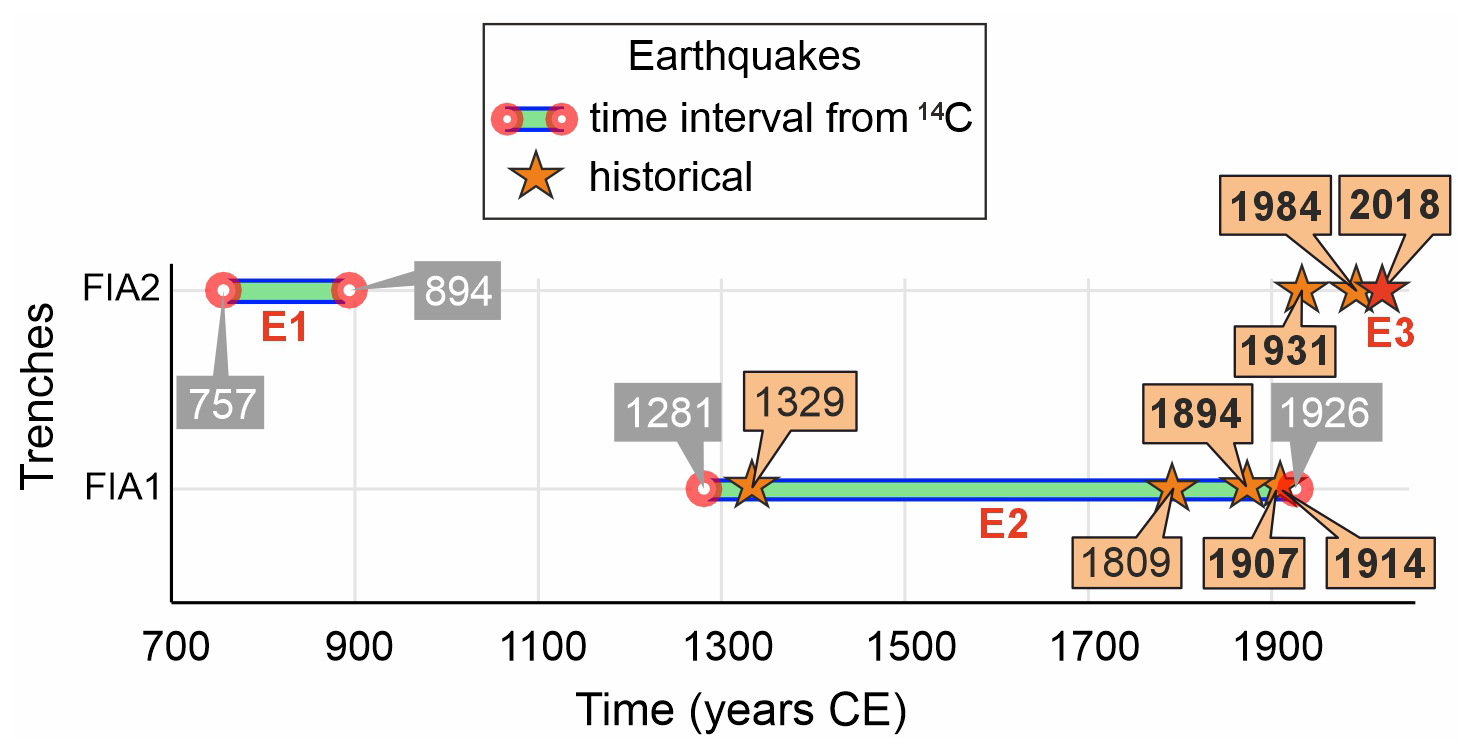
Figure 12Historical earthquakes occurred around the trenching site (macroseismic intensities between VI and VIII–IX of the EMS; Mw between 3.2 and 5; in bold the ones certainly associated with coseismic ruptures along FIA) and time interval of the 3 surface faulting events recognized in the trenches.
Hence, Tthe highlighted sequence of earthquakes might suggest an increase in fault activation over time. In the following paragraphs, we investigate this hypothesis by examining the temporal variation of historical throw rates along FIA after performing a kinematic model to evaluate the evolution of the fault scarp. We are aware that this hypothesis is based on evidence that in principle might seems not comparable: detailed historical accounts vs faulting events detected in a trench. However, paleoseismic data allow to extend the seismic catalogue back in time (Michetti et al., 2005; and reference therein). Even with dating uncertainties, paleoseismology is the only possible methodological approach that permit to complement the macroseismic and instrumental seismicity data in order to obtain a long-term record of strong earthquakes, which is the only reliable basis for seismic hazard analysis. This is the case for Mt. Etna, where historical macroseismic information is essentially limited to the XVIII century to present time window. Moreover, the extensive literature that uses a similar approach worldwide testify in fact the robustness of this approach (e.g., Rockwell et al., 2001). Therefore, we consider the paleoseismic information obtained in the Fiandaca trench site worth to be checked using independent evidence, based on fault scarp morphology, fault kinematics and throw rate analyses.
6.3 Fault kinematic model
Different models have been proposed by several authors regarding the deformation caused by normal faults in volcanic environments (Grant and Kattenhorn, 2004; Holland et al., 2006; Hardy, 2013; Kettermann et al., 2019; Von Hagke et al., 2019). In particular, Hardy (2013) modelled the propagation of blind normal faults toward the surface in basaltic sequences, showing the formation of a surficial monocline flexure and dilatant fractures in the initial stage. Analogue models by Jin and Groshong (2006) also show the formation of folding and cracks. Holland et al. (2006) proposed the effects of different resurfacing events on fault morphology, also showing the formation of open cracks and a monoclinal surface flexure.
FIA is considered buried beneath lava flows (Azzaro et al., 2022) because shows subdue morphological evidence, with the fault plane not yet propagated toward the surface (Tortorici et al., 2021). This morphological evidence is a flexure that may represent an initial stage of deformation of a lava flow in the near surface, similarly to what described by Holland et al. (2006) and Hardy (2013). In fact, if we consider throw rates of 1 mm yr−1 (Azzaro et al., 2012), the 150 BCE lava flow would have had morphological evidence similar to the current one. Consequently, the 1329 CE lava flow, which is approximately 12–15 m thick and superimposed on the 150 BCE lava, would have erased the old fault morphological evidence anyway. Based on this observation the morphological throw on the 1329 CE lava flow is tectonically cumulated and not inherited by buried fault scarps. Therefore, it is likely that the 150 BCE lava flow accumulated at least half of its surface offset after 1329 CE. Otherwise, the morphological throw of the fault would be greater than the thickness of the lava flows. This flexure shows vertical displacements ranging from approximately ∼ 5.6 m in the 1329 CE lava flow to ∼ 7.2 m in the 150 BCE lava (see Table 4 and the following paragraph). According to these observations on the fault scarps, we have modelled the FIA fault zone with FaultFold software until we obtained morphological evidence like the current one. We ran the model until a total slip amount of ∼ 2 m on seven pre-growth layers, with a total thickness of 14 m, corresponding to an average of the lava flows at the site. Subsequently, we run again the model after adding other layers representing a new lava flow (i.e., growth strata) with a total thickness of 14 m, reaching a total slip amount of ∼ 7 m (Fig. 13a). The modelling shows the formation of the triangular trishear deformed zone and a flexure on the surface (Fig. 13a). The resulting conceptual model shows a damage zone outlined in the area affected by trishear (Fig. 13b). In particular, a main deformation zone is highlighted with the formation of a fault graben ∼ 5 m wide at the surface (Fig. 13c). At the sides of the main deformation zone secondary ruptures occur with extensional minor offset or with reverse kinematics in compressive areas resulting in surface bulge (Fig. 13b and c).
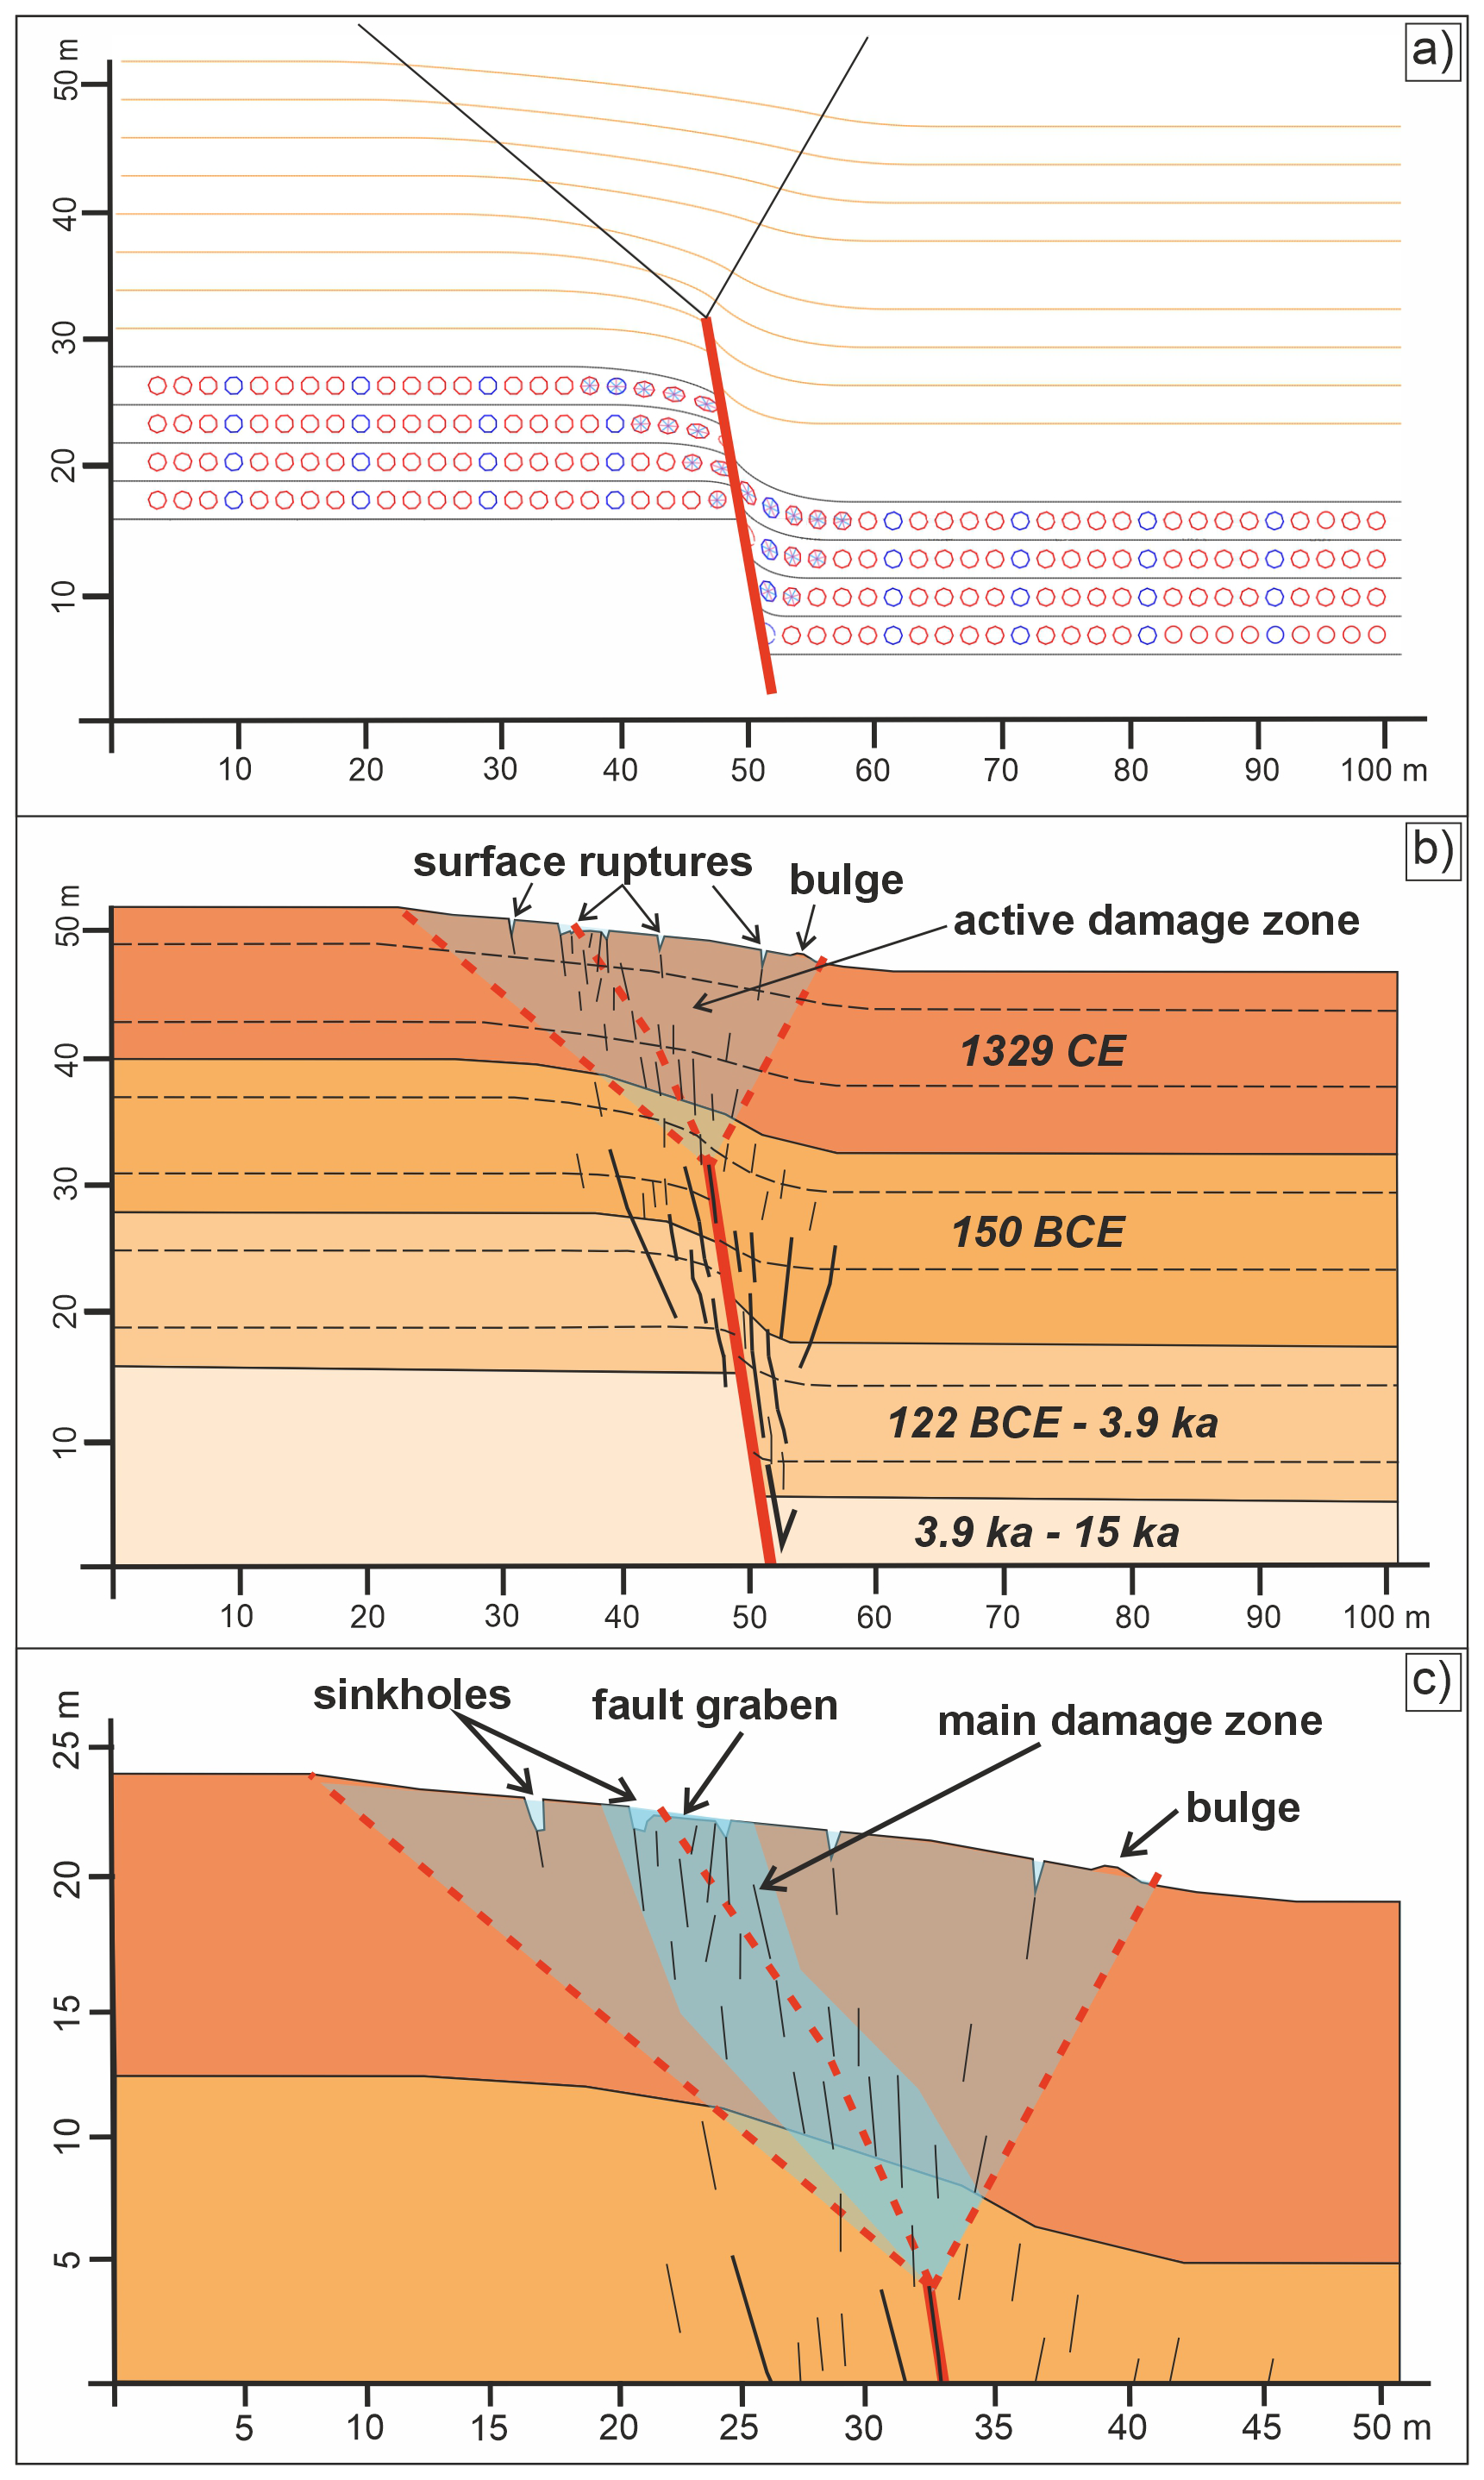
Figure 13Results of the kinematic model (a) and proposed conceptual interpretation (b and c). The fault starts its propagation toward the surface with the formation of a monocline flexure, the process continues after the resurfacing event (yellow layers); (b) interpretative model with layers associated to lava flows and their relative damage zone with the formation of dilatant fractures propagating upwards; (c) zoom on the damage zone highlighting a main deformation zone with the formation of fault graben at surface with associated secondary surface ruptures, sinkholes and/or reverse features in the sides.
In a dynamic context, during an earthquake, the already naturally fractured massive rocks behave in a fragile manner with the formation of new fractures, or the widening of existing ones, that propagate towards the surface. Meanwhile the breccia layers are free to move forming bends and cavities. These processes lead to the formation of surface fractures and sinkholes in the main damage zone (Fig. 13c). The modelled damage zone is consistent with the observed 2018 fault rupture width. The proposed model also results in subsurface features similar to that described in Romagnoli et al. (2021) regarding the 2018 coseismic ruptures along FIA. Despite the model does not take into account the strike-slip component, it is still suitable for FIA, which shows a dominant normal kinematics as observed from the field data. Anyway, the model shows a 2D section where only the dip-slip component is depicted. In three dimensions, the right lateral component would result in extensional and/or transtensive fractures arranged en-échelon. Therefore, the proposed conceptual kinematic model, together with others (e.g., Holland et al., 2006; Jin and Groshong, 2006; Hardy, 2013), may fits with FIA and the rheology of lava flows, which are composed of massive basaltic rock portions and unconsolidated scoria and breccia layers. Nonetheless, the trishear deformative model may fit even if the lava flows had mantled the fault scarp, explaining the width of the fault zone.
6.4 Throw rates analysis
At the Fiandaca trenching site, the lack of information regarding the erosive surfaces and the anthropogenic reworking of a subsurface portion precludes the estimation of total throw-rates based on the observed displacements along the trenches. Thereby, 10 topographic profiles, with the reconstruction of the relative geological cross section, (see traces in Fig. S2 of the Supplement) have been realized along FIA where historical Mongibello lava flows (i.e., 150 BCE and 1329 CE) are displaced, in order to assess vertical slip rates. Table 4 summarizes minimum morphological fault throw assessed along all the profiles, the corresponding throw rates, and their accuracy. Figure 14a shows two selected profiles (see locations in Fig. 2) with the reconstruction of the relative geological cross section. All the geological cross sections and the relative traces are available in the section 3 of the Supplement (Figs. S3, S4 and S5).
Table 4Fiandaca fault's morphological throws and throw rates obtained by 10 topographic profiles along displaced and dated lava flows.
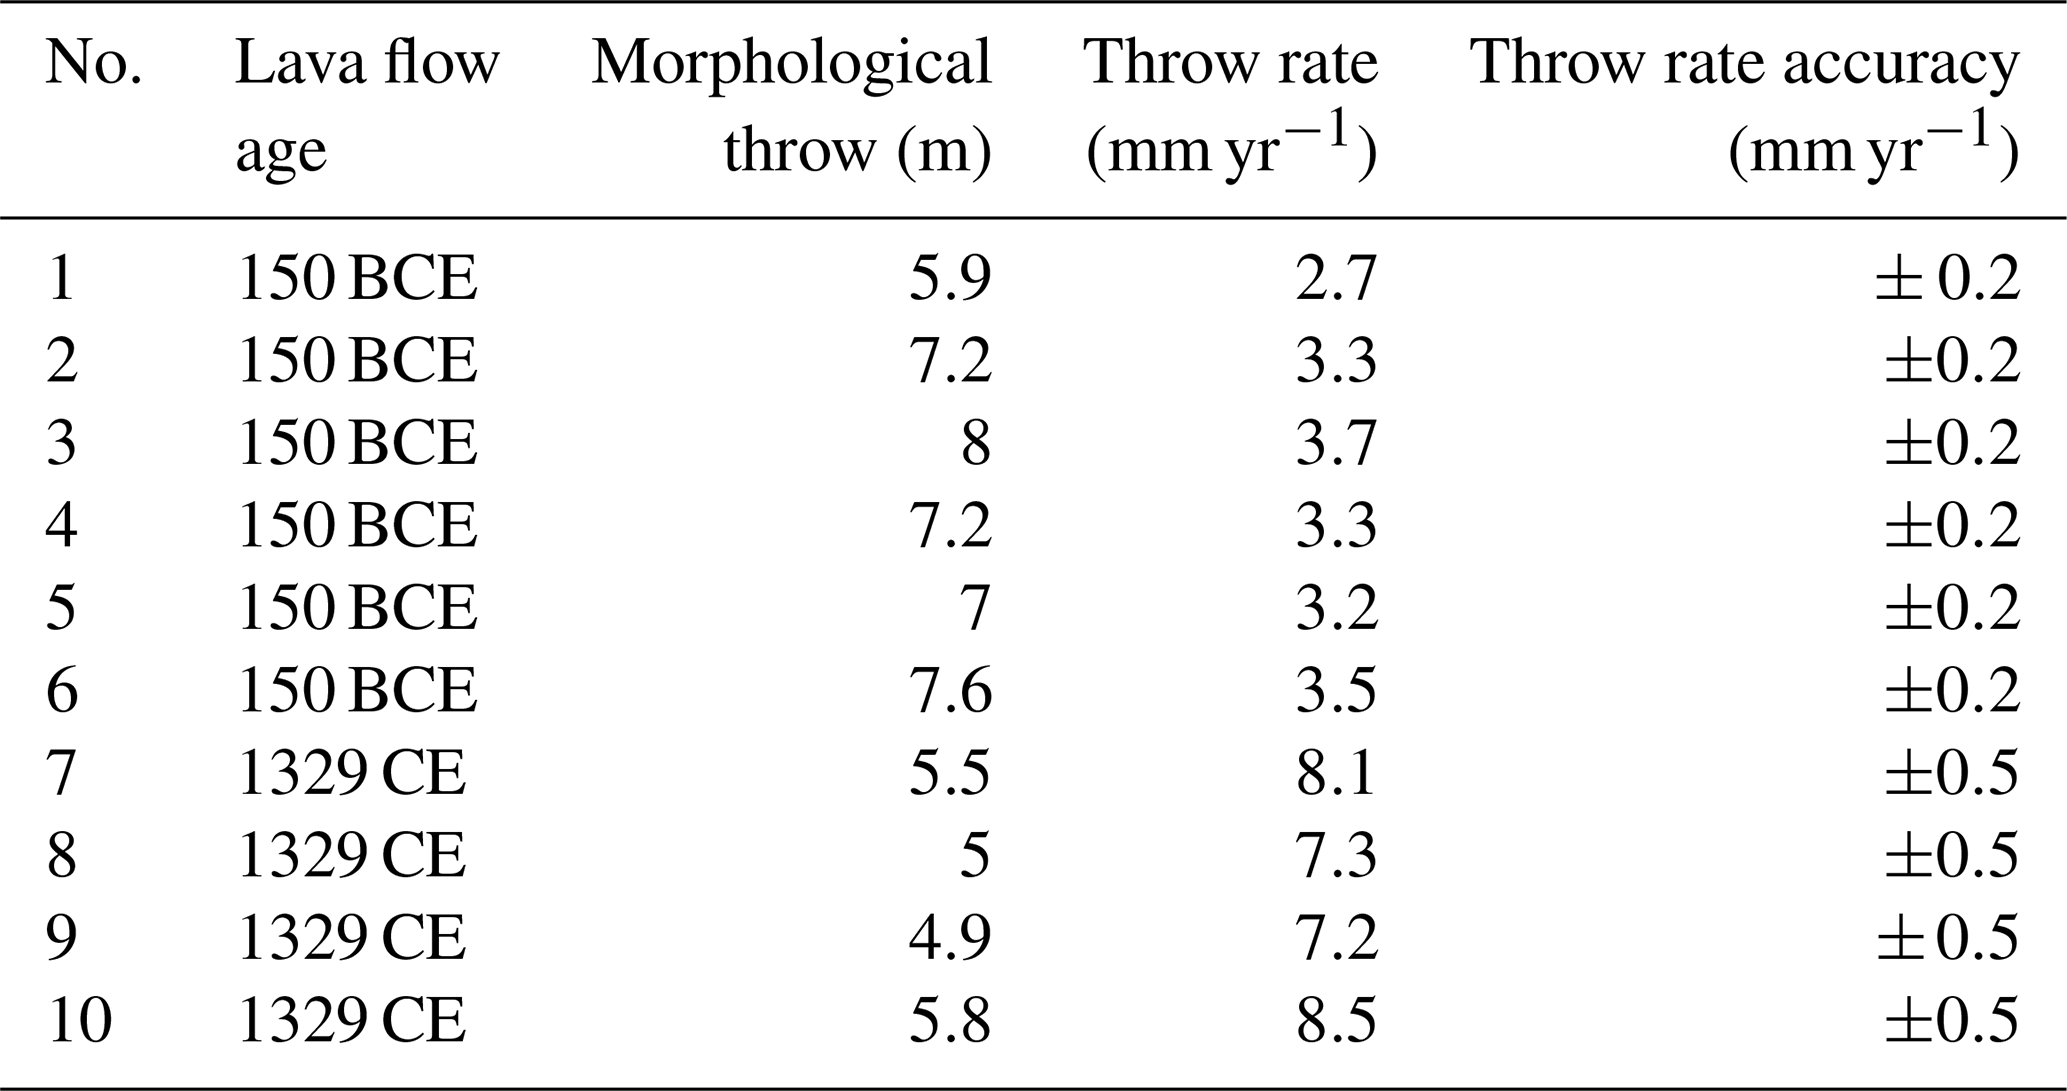
The 150 BCE lava flow shows an average vertical displacement of ∼ 7.2 m along six profiles, indicating a mean throw rate of ∼ 3.3 mm yr−1. The 1329 CE lava flow has vertical displacements of ∼ 5.3 m from four profiles, indicating a mean throw rate of 7.8 mm yr−1. The morphological throws obtained are in accordance with those proposed by Azzaro et al. (2022). Moreover, the morphology of the fault scarp obtained is consistent with the proposed kinematic model in Fig. 13. The throw rates obtained show an increasing after 1329 CE passing from 3.3 to 7.8 mm yr−1 (Fig. 14b). Also considering a throw rate of 1 mm yr−1 estimated by Azzaro et al. (2012) for the last 3.9 kyr, a gradual increase can be observed.
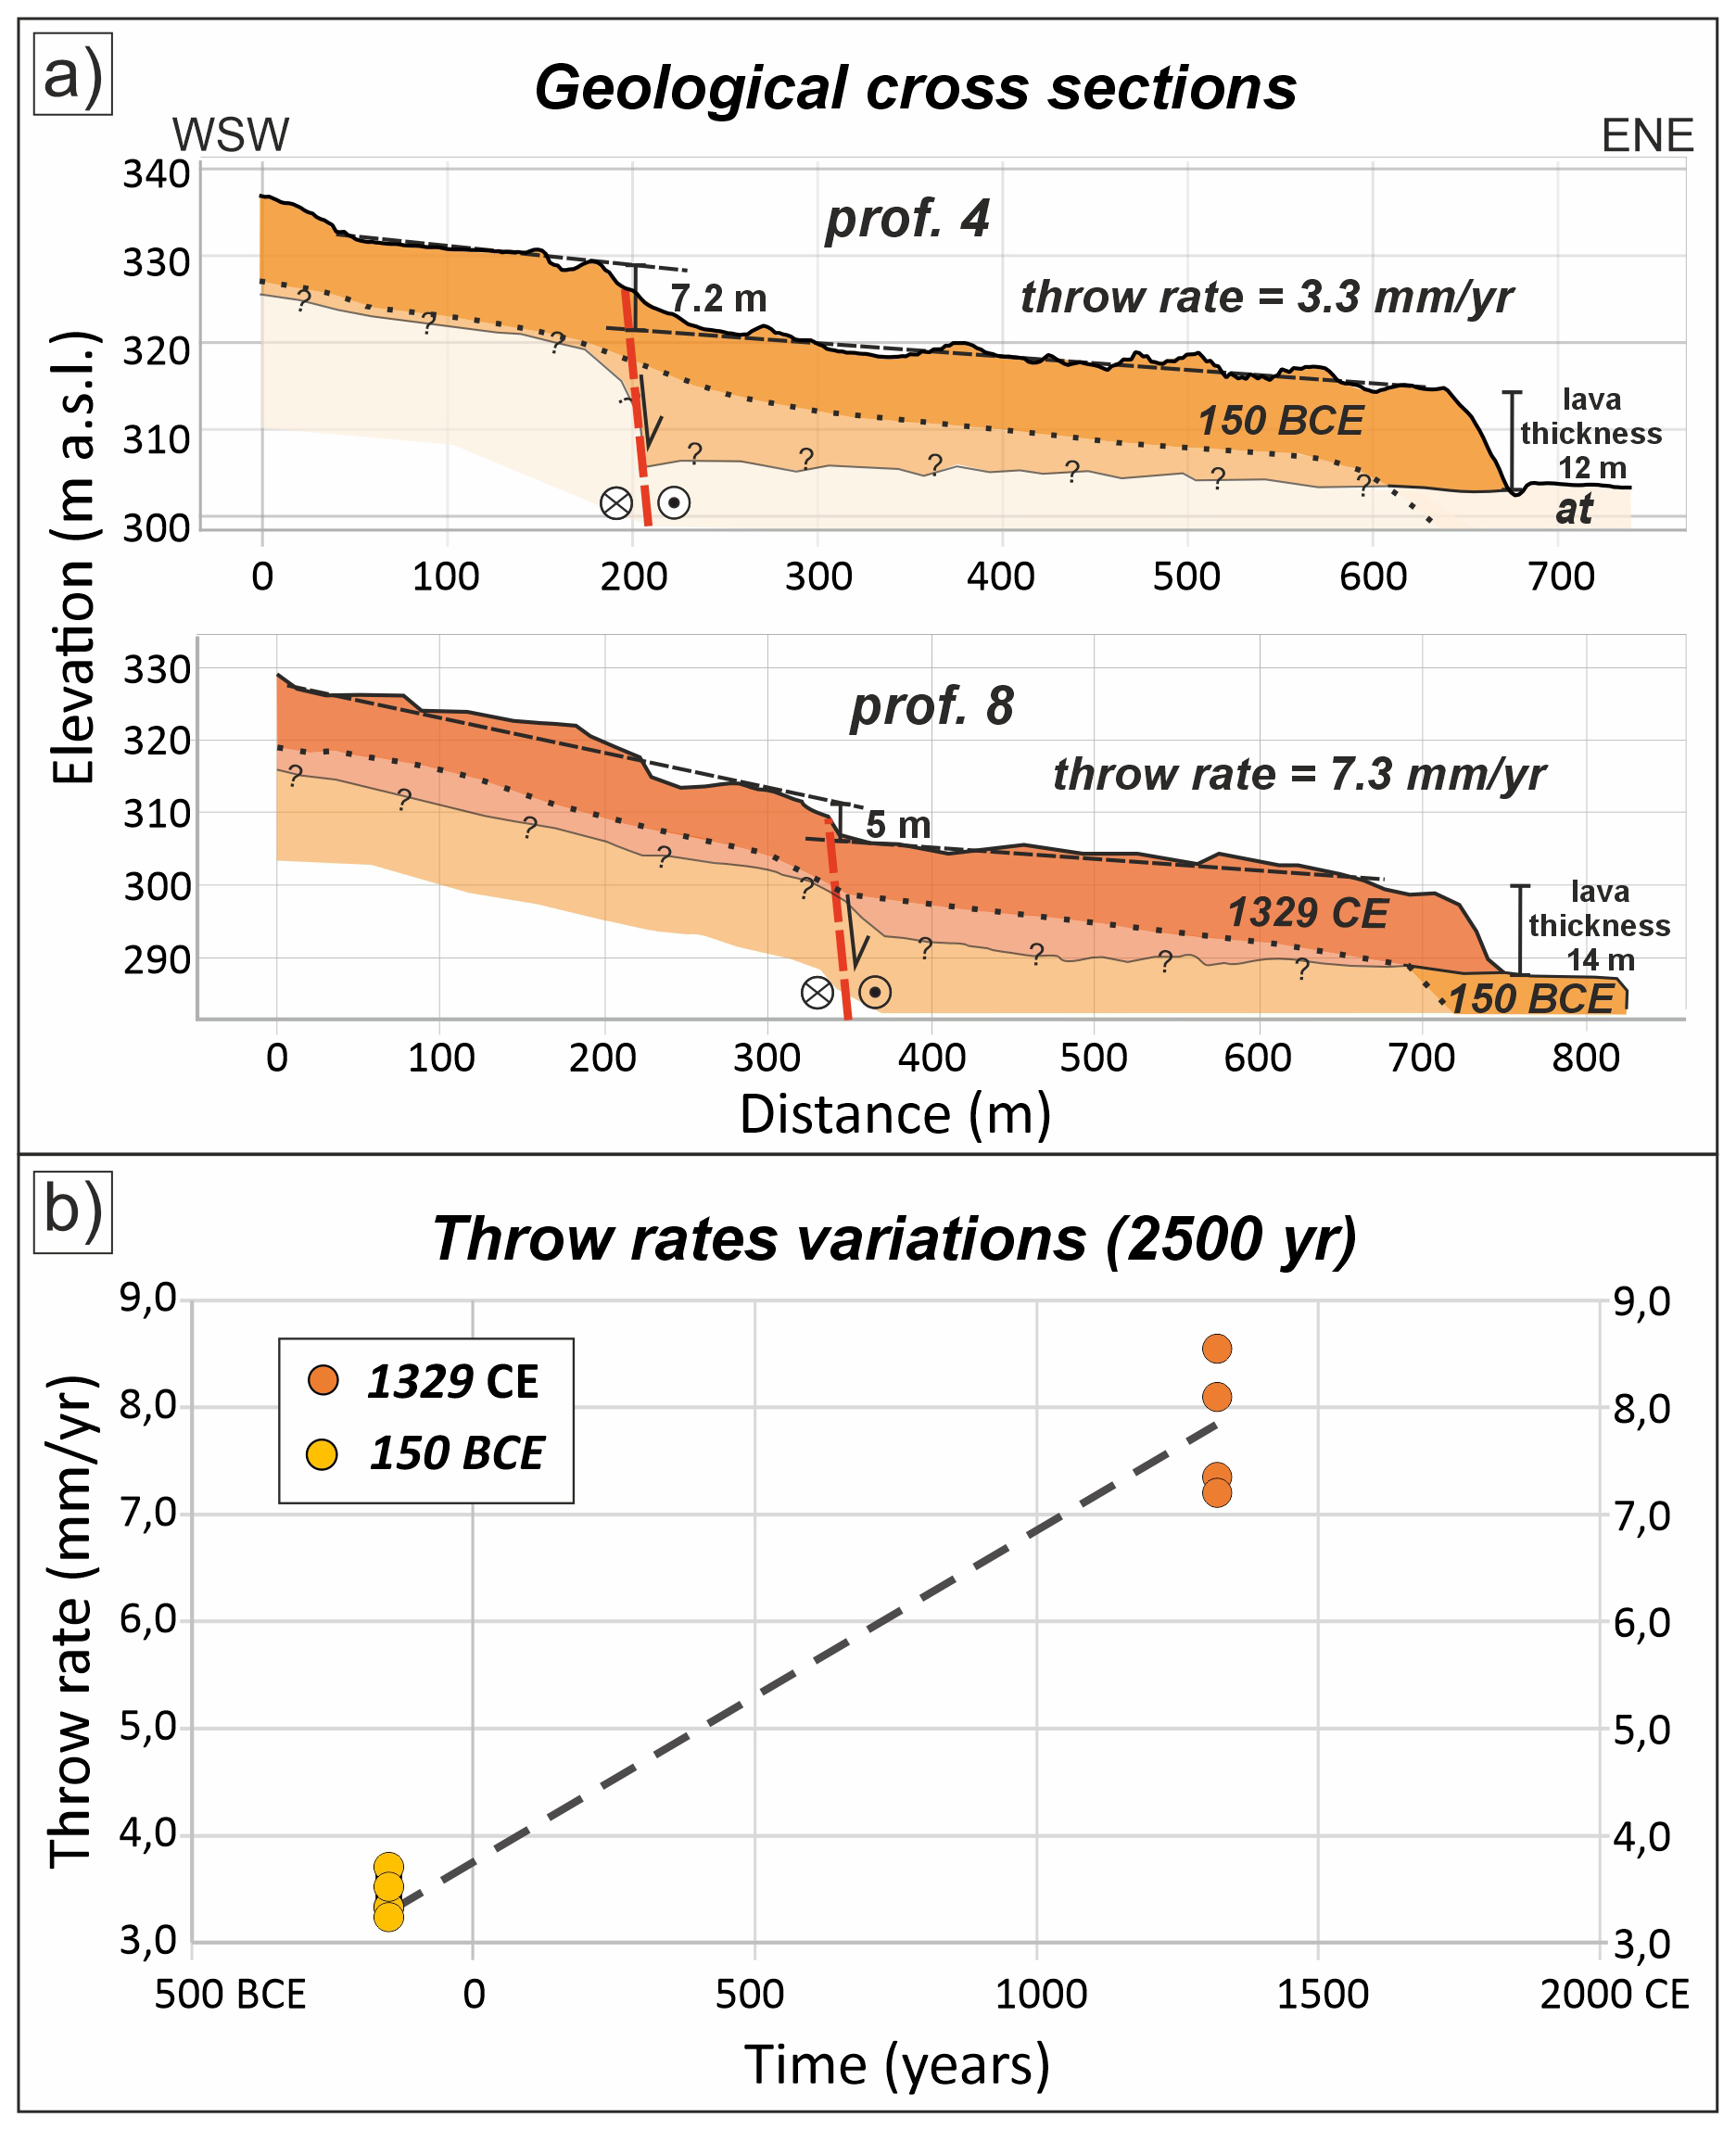
Figure 14(a) selected topographic profile and related geological cross sections (vertical exaggeration) across the Fiandaca Fault, lower transparent part is uncertain; (b) throw rate variations for the last 2500 kyr.
These throw rates could be supported by the high displacements observed during minor historical events with surface ruptures along FIA. The 1984 CE earthquake has been accompanied by surface ruptures with 20 cm of vertical displacement (Benina et al., 1984; Patanè and Imposa, 1995). The surface faulting associated to the 1907 and 1914 CE seismic events are described as large open cracks with well evident vertical components forming like-graben features (Platania, 1908, 1915). Even though it is not possible to determine the amount of displacement, it is highly likely that also these minor events may contribute to the development of the fault scarp. Furthermore, it is also likely that some FIA segments are activated more frequently. For example, the southern sector of FIA, where the 1329 CE lava flow also occurs, appear to show more activations (Fig. 3) with an associated higher seismicity (Fig. 3a). This aspect also probably contributes to the growing of the fault scarp, and therefore to the observed throw rates.
As proposed for the Pernicana Fault by D'Amato et al. (2017), this recent throw rate growth could be related to an increase in magmatic intrusions along the eastern flank of the volcano. In fact, as happened in 2018, magmatic intrusions can trigger the activation of faults. In any case, further analysis is needed to investigate the fault scarps and determine the causes of the likely increase in throw rates.
The first paleoseismological investigation along the Fiandaca Fault, in the eastern flank of Etna volcano, prompted the identification of three surface faulting earthquakes occurred:
- i.
in the Early Middle Ages (i.e., 757–894 CE);
- ii.
in the period spanning the last eight centuries (i.e., 1281–1926 CE), may be considered to correspond to the date of 8 August 1894;
- iii.
the 26 December 2018.
At present we have no record in any seismic catalogue of the earthquake that occurred in the Early Middle Ages. We may speculate that it was triggered by the dyke intrusion associated with one of the three flank eruptions, reported in Branca and Abate (2019), that took place along the eastern flank during the same period. The 2018 surface faulting correspond to the faults recognized within the trenches and during field survey immediately after the earthquake. Although new lava flows and human activity may erase much of the evidence on the surface, our results confirm the importance of paleoseismology and exploratory stratigraphic trenches for the seismic risk reduction also in volcanic contexts. In addition, these paleoseismic results might suggest an increase of seismicity and fault activation through time.
The proposed conceptual kinematic model is consistent with the rheology of the lava flows highlighting an active trishear deformation zone which result in a morphological flexure on the historic lava flows crosscut by the Fiandaca Fault. This kinematic model is also consistent with the surface ruptures pattern observed after the 2018 earthquake. However, from the results of the seismic tomography, it is possible to confirm that this type of geophysical investigation might only highlight a main deformation zone. This corroborates that the definition of buffer zones for seismic microzonation studies, must be consistent with the kinematics of the fault. The accurate delineation of fault rupture zones, validated through paleoseismological investigations such as the one presented in this study, provides an essential foundation of scientific evidence for policymakers and urban planners. This level of precision is indispensable for the reliable identification of areas with elevated seismic hazard, enabling informed decisions aimed at excluding these zones from future urban development. Such preventive measures are crucial to mitigate seismic risk and safeguard human lives by avoiding construction in locations where surface faulting could pose catastrophic consequences.
The analysis of throw rates variations over time obtained for the Fiandaca Fault across the historic lava flows could be compatible with an increase in throw rates from 3.3 mm yr−1 during the Greek-Roman period to 7.8 mm yr−1 starting from the Late Middle Ages onwards. These results are consistent with the paleoseismic evidence and they might be supported by vertical displacement of ∼ 20 cm observed along surface ruptures for minor earthquakes occurred in the last 150 years.
Considering that recent increases in throw rates have also been observed along the Pernicana Fault (D'Amato et al., 2017), further analysis of throw rates needs to be extended to other faults of the Mt. Etna flanks. We are currently conducting these analyses, which we consider important since these faults accommodate the sliding of the volcano eastern flank toward the sea.
The data about Fiandaca historic surface faulting events, geological cross sections with associated traces on maps that support the findings of this study are available in the Supplement of this article. Data about historical and instrumental seismicity can be found in the CFTI5MEd (https://storing.ingv.it/cfti/cfti5/, last access: 15 November 2024) and CMTE (https://www.ct.ingv.it/macro/etna/index.html, last access: 15 November 2024). Spatial and structural data about the 2018 surface ruptures are available in the zenodo repository (https://doi.org/10.5281/zenodo.8414945, Tringali, 2023b). DTM and satellite images are available online in the published datasets by Regione Sicilia (https://www.sitr.regione.sicilia.it/geoportale/mobile/index.html, last access: 20 September 2024).
The supplement related to this article is available online at https://doi.org/10.5194/se-16-1473-2025-supplement.
Conceptualization of the study was done by GT. Field work investigations was performed by GT, DB, AMM, FL, AMB, LG, and ST. VA performed the UAV survey and processed the acquired data. RP performed the geophysical survey and processed the seismic refraction data acquired. Modelling with FaultFold software was done by GT. The data analysis was performed by GT with help from FL and GG. The interpretation of the results was done by GT with help from DB, FL, GG, MN and AMM. The writing of the original draft and preparation of figures was done by GT with help from all co-authors. All authors read, revised and approved the final paper.
The contact author has declared that none of the authors has any competing interests.
Publisher’s note: Copernicus Publications remains neutral with regard to jurisdictional claims made in the text, published maps, institutional affiliations, or any other geographical representation in this paper. While Copernicus Publications makes every effort to include appropriate place names, the final responsibility lies with the authors. Views expressed in the text are those of the authors and do not necessarily reflect the views of the publisher.
We are grateful to the owners of the Fiandaca site for allowing us the excavation of the trenches. We are indebted with Mauro Coltelli for visiting the trenching site, analysing the tephra sample and for providing us detailed information about the 122 BCE pyroclastic deposit, but also for the fruitful scientific discussions. We extend our gratitude to the anonymous reviewers and to the associate editor Christoph von Hagke for their comments, which contributed to improve the final version of the article. This work is part of the Giorgio Tringali PhD project carried out at the University of Insubria (Italy).
Research funded by European Union – NextGenerationEU – Mission 4 “Education and Research” – Component 2 “From Research to Business” – Investment 3.1 “Fund for the realization of an integrated system of research and innovation infrastructures” – Project IR0000037 – GeoSciences IR – CUP I53C22000800006.
This paper was edited by Christoph von Hagke and reviewed by Christoph von Hagke and one anonymous referee.
Acocella, V. and Neri, M.: Structural features of an active strike-slip fault on the sliding flank of Mt. Etna (Italy), J. Structural Geology, 27/2, 343–355, https://doi.org/10.1016/j.jsg.2004.07.006, 2005.
Acocella, V., Neri, M., and Norini, G.: An overview of analogue models to understand a complex volcanic instability: application to Etna, Italy, J. of Volcanology and Geothermal Research, 251, 98–111, https://doi.org/10.1016/j.jvolgeores.2012.06.003, 2013.
Acocella, V., Neri, N., Behncke, B., Bonforte, A., Del Negro, C. and Ganci, G.: Why does a mature volcano need new vents? The case of the New Southeast Crater at Etna, Front. Earth Sci. 4, 67, https://doi.org/10.3389/feart.2016.00067, 2016.
Allmendinger, R. W.: Inverse and forward numerical modeling of trishear fault-propagation folds, Tectonics, 17, 640–656, https://doi.org/10.1029/98TC01907, 1998.
Azzaro, R.: Earthquake surface faulting at Mount Etna volcano (Sicily) and implications for active tectonics, J. of Geodynamics, 28, 193–213, https://doi.org/10.1016/S0264-3707(98)00037-4, 1999.
Azzaro, R. and Castelli, V.: Materiali per un catalogo di terremoti etnei dal 1600 al 1831, Quaderni di Geofisica, 123, 284 pp., https://doi.org/10.13127/qdg/123, 2015.
Azzaro, R. and D'Amico, S.: Catalogo Macrosismico dei Terremoti Etnei (CMTE), 1633–2023, Istituto Nazionale di Geofisica e Vulcanologia (INGV) [data set], https://doi.org/10.13127/cmte, 2014.
Azzaro, R., Bella, D., Ferreli, L., Michetti, A. M., Santagati, F., Serva, L., and Vittori, E.: First study of fault trench stratigraphy at Mt. Etna volcano, Southern Italy: understanding Holocene surface faulting along the Moscarello fault, J. of Geodynamics, 29, 187–210, https://doi.org/10.1016/S0264-3707(99)00055-1, 2000.
Azzaro, R., Branca, S., Gwinner, K., and Coltelli, M.: The volcano-tectonic map of Etna volcano, 1:100.000 scale: an integrated approach based on a morphotectonic analysis from high-resolution DEM constrained by geologic, active faulting and seismotectonic data, Italian Journal of Geosciences, 131, 153–170, https://doi.org/10.3301/IJG.2011.29, 2012.
Azzaro, R., Bonforte, A., Branca, S. and Guglielmino, F.: Geometry and kinematics of the fault systems controlling the unstable flank of Etna volcano (Sicily), J. of Volcanology and Geothermal Research, 251, 5–15, https://doi.org/10.1016/j.jvolgeores.2012.10.001, 2013.
Azzaro, R., Barberi, G., D'Amico, S., Pace, B., Peruzza, L., and Tuvè, T.: When probabilistic seismic hazard climbs volcanoes: the Mt. Etna case, Italy – Part 1: Model components for sources parameterization, Nat. Hazards Earth Syst. Sci., 17, 1981–1998, https://doi.org/10.5194/nhess-17-1981-2017, 2017.
Azzaro, R., Pucci, S., Villani, F., Civico, R., Branca, S., Cantarero, M., De Beni, E., De Martini P. M., Cinti, F. R., Caciagli, M., Cucci, L., and Pantosti, D.: Surface faulting of the 26 December 2018, Mw 5 earthquake at Mt. Etna volcano (Italy): Geological source model and implications for the seismic potential of the Fiandaca fault, Tectonics, 41, e2021TC007182, https://doi.org/10.1029/2021TC007182, 2022.
Barreca, G., Bonforte, A., and Neri, M.: A pilot GIS database of active faults of Mt. Etna (Sicily): A tool for integrated hazard evaluation, J. of Volcanology and Geothermal Research, 251, 170–186, https://doi.org/10.1016/j.jvolgeores.2012.08.013, 2013.
Benina, A., Imposa, S., Gresta, S., and Patanè, G.: Studio macrosismico e strumentale di due terremoti tettonici avvenuti sul versante meridionale dell'Etna, in: Proc. 3th Conv. GNGTS, CNR, Rome, 1984, 3, 934–940, 1984.
Bonforte, A., Guglielmino, F., Coltelli, M., Ferretti, A., and Puglisi, G.: Structural assessment of Mount Etna volcano from Permanent Scatterers analysis, Geochemistry, Geophysics, Geosystems, 12, https://doi.org/10.1029/2010GC003213, 2011.
Bonforte, A., Federico, C., Giammanco, S., Guglielmino, F., Liuzzo, M., and Neri M.: Soil gases and SAR data reveal hidden faults on the sliding flank of Mt. Etna (Italy), J. of Volcanology and Geothermal Research, 251, 27–40, https://doi.org/10.1016/j.jvolgeores.2012.08.010, 2013.
Bonforte, A., Guglielmino, F., and Puglisi, G.: Large dyke intrusion and small eruption: The December 24, 2018 Mt. Etna eruption imaged by Sentinel-1 data, Terra Nova, 31, 405–412, https://doi.org/10.1111/ter.12403, 2019.
Borgia, A., Ferrari, L., and Pasquarè, G.: Importance of gravitational spreading in the tectonic and volcanic evolution of Mount Etna, Nature, 357, 231–235, https://doi.org/10.1038/357231a0,1992.
Branca, S. and Abate, T.: Current knowledge of Etna's flank eruptions (Italy) occurring over the past 2500 years. From the iconographies of the XVII century to modern geological cartography, J. of Volcanology and Geothermal Research, 385, 159–178, https://doi.org/10.1016/j.jvolgeores.2017.11.004, 2019.
Branca, S. and Ferrara, V.: The morphostructural setting of Mount Etna sedimentary basement (Italy): Implications for the geometry and volume of the volcano and its flank instability, Tectonophysics, 586, 46–64, https://doi.org/10.1016/j.tecto.2012.11.011, 2013.
Branca, S., Coltelli, M., and Groppelli, G.: Geological evolution of a complex basaltic stratovolcano: Mount Etna, Italy, Ital. J. Geosci., 130, 306–317, https://doi.org/10.3301/IJG.2011.13, 2011a.
Branca, S., Coltelli, M., Groppelli, G., and Lentini, F.: Geological map of Etna volcano, scale, Ital. J.of Geosci., 130, 265–291, https://doi.org/10.3301/IJG.2011.15, 2011b.
Calvari, S. and Groppelli, G.: Relevance of the Chiancone volcaniclastic deposit in the recent history of Etna Volcano (Italy), J. of Volcanology and Geothermal Research, 72, 239–258, https://doi.org/10.1016/0377-0273(96)00012-1, 1996.
Calvari, S., Tanner, L. H., and Groppelli, G.: Debris-avalanche deposits of the Milo Lahar sequence and the opening of the Valle del Bove on Etna volcano (Italy), J. of Volcanology and Geothermal Research, 87, 193–209, https://doi.org/10.1016/S0377-0273(98)00089-4, 1998.
Calvari, S., Tanner, L. H., Groppelli, G., and Norini, G.: Valle del Bove, eastern flank of Etna volcano: a comprehensive model for the opening of the depression and implications for future hazards, In Etna Volcano Laboratory edited by: Bonaccorso, A., Calvari, S., Coltelli, M., Del Negro, C., and Falsaperla, S., American Geophysical Union, https://doi.org/10.1029/143GM05, 2004.
Cardozo, N., Bhalla, K., Zehnder, A. T., and Allmendinger, R. W.: Mechanical models of fault propagation folds and comparison to the trishear kinematic model, Journal of Structural Geology, 25, 1–18, https://doi.org/10.1016/S0191-8141(02)00013-5, 2003.
Carveni, P. and Bella, D.: Aspetti geomorfologici legati ad attività sismica su vulcani attivi: il basso versante orientale dell'Etna come modello di studio, Boll. Acc. Gioenia Sc. Nat., 27, 253–285, 1994.
Chiocci, F. L., Coltelli, M., Bosman, A., and Cavallaro, D.: Continental margin large-scale instability controlling the flank sliding of Etna volcano, Earth and Planetary Science Letters, 305, 57–64, https://doi.org/10.1016/j.epsl.2011.02.040, 2011.
Civico, R., Pucci, S., Nappi, R., Azzaro, R., Villani, F., Pantosti, D., Cinti, F. R., Pizzimenti, L., Branca, S., Brunori, C. A., Caciagli, M., Catarero, M., Cucci, L., D'Amico, S., De Beni, E., De Martini, P. M., Mariucci, M. T., Montone, P., Nave, R., Ricci, T., Sapia, V., Smedile, A., Tarabusi, G., Vallone, R., and Venuti, A.: Surface ruptures following the 26 December 2018, Mw 4.9, Mt. Etna earthquake, Sicily (Italy): EMERGEO Working Group (Etna 2018), J. of Maps, 15, 831–837, https://doi.org/10.1080/17445647.2019.1683476, 2019.
Coltelli, M., Del Carlo, P., and Vezzoli, L.: Discovery of a Plinian basaltic eruption of Roman age at Etna volcano, Italy, Geology, 26, 1095–1098, https://doi.org/10.1130/0091-7613(1998)026<1095:DOAPBE>2.3.CO;2, 1998.
D'Amato, D., Pace, B., Di Nicola, L., Stuart, F. M., Visini, F., Azzaro, R., Branca, S., and Barfod, D. N.: Holocene slip rate variability along the Pernicana fault system (Mt. Etna, Italy): Evidence from offset lava flows, GSA Bulletin, 129, 304–317, https://doi.org/10.1130/B31510.1, 2017.
De Novellis, V., Atzori, S., De Luca, C., Manzo, M., Valerio, E., Bonano, M., Cardaci, C., Castaldo, R., Di Bucci, D., Manunta, M., Onorato, G., Pepe, S., Solaro, G., Tizzani, P., Zinno, I., Neri, M., Lanari, R., and Casu, F.: DInSAR analysis and analytical modeling of Mount Etna displacements: The December 2018 volcano-tectonic crisis, Geophysical Research Letters, 46, https://doi.org/10.1029/2019GL082467, 2019.
Doglioni, C., Innocenti, F., and Mariotti, G.: Why Mt Etna?, Terra Nova, 13, 25–31, https://doi.org/10.1046/j.1365-3121.2001.00301.x, 2001.
Erslev, E. A.: Trishear fault-propagation folding, Geology, 19, 617–620, https://doi.org/10.1130/0091-7613(1991)019<0617:TFPF>2.3.CO;2, 1991.
Ferreli, L., Michetti, A., Serva, L., and Vittori, E.: Stratigraphic evidence of coseismic faulting and aseismic fault creep from exploratory trenches at Mt. Etna volcano (Sicily, Italy), Geological Society Of America Bulletin, 359, 49–62, https://doi.org/10.1130/0-8137-2359-0.49, 2002.
Grant, J. V. and Kattenhorn, S. A.: Evolution of vertical faults at an extensional plate boundary, southwest Iceland, Journal of Structural Geology, 26, 537–557, https://doi.org/10.1016/j.jsg.2003.07.003, 2004.
Gresta, S., Bella, D., Musumeci, C., and Carveni, P.: Some efforts on active faulting processes (earthquakes and aseismic creep) acting on the eastern flank of Mt. Etna (Sicily), Acta Vulcanologica, 9, 101–108, 1997.
Gross, F., Krastel, S., Geersen, J., Behrmann, J. H., Ridente, D., Chiocci, F. L., Bialas, J., Papenber, C., Cukur, D., Urlaub, M., and Micallef, A.: The limits of seaward spreading and slope instability at the continental margin offshore Mt Etna, imaged by high-resolution 2D seismic data, Tectonophysics, 667, 63–76, https://doi.org/10.1016/j.tecto.2015.11.011, 2016.
Guest, J. E., Chester, D. K., and Duncan, A. M.: The Valle del Bove, Mount Etna: its origin and relation to the stratigraphy and structure of the volcano, J. of Volcanology and Geothermal Research, 21, 1–23, https://doi.org/10.1016/0377-0273(84)90013-1, 1984.
Guidoboni, E., Ferrari, G., Tarabusi, G., Sgattoni, G., Comastri, A., Mariotti, D., Ciuccarelli, C., Bianchi, M. G., and Valensise, G.: CFTI5Med, the new release of the catalogue of strong earthquakes in Italy and in the Mediterranean area, Scientific Data, 6, 80, https://doi.org/10.1038/s41597-019-0091-9, 2019.
Hardy, S.: Propagation of blind normal faults to the surface in basaltic sequences: Insights from 2D discrete element modelling, Marine and Petroleum Geology, 48, 149–159, https://doi.org/10.1016/j.marpetgeo.2013.08.012, 2013.
Hardy, S. and Ford, M.: Numerical modeling of trishear fault propagation folding, Tectonics, 16, 841–854, https://doi.org/10.1029/97TC01171, 1997.
Holland, M., Urai, J. L., and Martel, S.: The internal structure of fault zones in basaltic sequences, Earth and Planetary Science Letters, 248, 301–315, https://doi.org/10.1016/j.epsl.2006.05.035, 2006.
ITHACA Working Group: ITHACA (ITaly HAzard from CApable faulting), A database of active capable faults of the Italian territory, Version December 2019, ISPRA Geological Survey of Italy [data set], https://sgi.isprambiente.it/ithaca/viewer/index.html (last access: 20 September 2024), 2019.
Jin, G. and Groshong Jr., R. H.: Trishear kinematic modeling of extensional fault-propagation folding, J. of Structural Geology, 28, 170–183, https://doi.org/10.1016/j.jsg.2005.09.003, 2006.
Kettermann, M., Weismüller, C., von Hagke, C., Reicherter, K., and Urai, J. L.: Large near-surface block rotations at normal faults of the Iceland rift: Evolution of tectonic caves and dilatancy, Geology, 47, 781–785, https://doi.org/10.1130/G46158.1, 2019.
Lanzafame, G., Neri, M., and Rust, D.: A preliminary structural evaluation of recent tectonic activity on the eastern flank of Mount Etna, Sicily, West London Papers in Environmental Studies, 3, 73–90, 1996.
Lo Giudice, E. and Rasà, R.: Very shallow earthquakes and brittle deformation in active volcanic areas: The Eatnean region as an example, Tectonophysics, 202, 257–268, https://doi.org/10.1016/0040-1951(92)90111-I, 1992.
Malaguti, A. B., Branca, S., Speranza, F., Coltelli, M., Del Carlo, P., and Renzulli, A.: Age of the Valle del Bove formation and chronology of the post-collapse flank eruptions, Etna volcano (Italy), J. of Volcanology and Geothermal Research, 434, 107752, https://doi.org/10.1016/j.jvolgeores.2023.107752, 2023.
McCalpin, J. P.: Paleoseismology, International Geophysics, vol. 95, 615 pp., ISBN 9780080919980, 2009.
McCalpin, J., Ferrario, F., Figueiredo, P., Livio, F., Grützner, C., Pisarska-Jamroży, M., Quigley, M., Reicherter, K., Rockwell, T., Štěpančíková, P., and Tábořík, P.: New developments in onshore paleoseismic methods, and their impact on Quaternary tectonic studies, Quaternary International, 664, 59–76, https://doi.org/10.1016/j.quaint.2023.03.008, 2023.
Michetti, A. M., Audemard, F., and Marco, S.: Future trends in paleoseismology: Integrated study of the seismic landscape as a vital tool in seismic hazard analyses, in: Paleoseismology, integrated study of the Quaternary geological record for earthquake deformation and faulting, edited by: Michetti, A. M., Audemard, F., and Marco, S., Tectonophysics, 408, 3–21, https://doi.org/10.1016/j.tecto.2005.05.035, 2005.
Monaco, C., Tapponnier, P., Tortorici, L., and Gillot, P. Y.: Late Quaternary slip rates on the Acireale-Piedimonte normal faults and tectonic origin of Mt. Etna (Sicily), Earth and Planetary Science Letters, 147, 125–139, https://doi.org/10.1016/S0012-821X(97)00005-8, 1997.
Monaco, C., Barreca, G., Bella, D., Brighenti, F., Bruno, V., Carnemolla, F., De Guidi, G., Mattia, M., Menichetti, M., Roccheggiani, M., and Scarfì, L.: The seismogenic source of the 2018 December 26th earthquake (Mt. Etna, Italy): A shear zone in the unstable eastern flank of the volcano, J. of Geodynamics, 143, 101807, https://doi.org/10.1016/j.jog.2020.101807, 2021.
Neri, M. and Neri, E.: Etna 2018 earthquake: rebuild or relocate? Applying geoethical principles to natural disaster recovery planning, J. of Geoethics and Social Geosciences, 2, 1–28, https://doi.org/10.13127/jgsg-49, 2024.
Neri, M., Garduño, V. H., Pasquarè, G., and Rasà, R.: Studio strutturale e modello cinematico della Valle del Bove e del settore nord-orientale etneo, Acta Vulcanol., 1, 17–24, 1991.
Neri, M., Acocella, V., and Behncke, B.: The role of the Pernicana Fault System in the spreading of Mt. Etna (Italy) during the 2002–2003 eruption, Bulletin of Volcanology, 66, 417–430, https://doi.org/10.1007/s00445-003-0322-x, 2004.
Neri, M., Acocella, V., Behncke, B., Giammanco, S., Mazzarini, F., and Rust, D.: Structural analysis of the eruptive fissures at Mount Etna (Italy), Annals of Geophysics, 54, 464–479, https://doi.org/10.4401/ag-5332, 2011.
Palano, M., Sparacino, F., Gambino, P., D'Agostino, N., and Calcaterra, S.: Slow slip events and flank instability at Mt. Etna volcano (Italy), Tectonophysics, 836, 229414, https://doi.org/10.1016/j.tecto.2022.229414, 2022.
Patanè, G. and Imposa, S.: Atlante delle isosiste dei terremoti etnei dal 1971 al 1991, Univ. Studi di Catania e CNR-Gr. Naz. geofisica della Terra Solida, 89, 1995.
Platania, G.: Il terremoto del 7 Dicembre 1907, Mem. Cl. Sci. R. Acc. Zelanti, 5, 13–20, 1908.
Platania, G.: Sul periodo sismico del Maggio 1914 nella regione orientale dell'Etna, Mem. Cl. Sci. R. Acc. Zelanti, 7, 48 pp., 1915.
Rasà, R., Azzaro, R., and Leonardi, O.: Aseismic creep on faults and flank instability at Mount Etna volcano, Sicily, Geological Society, London, Special Publications, 110, 179–192, https://doi.org/10.1144/GSL.SP.1996.110.01.14, 1996.
Rockwell, T., Barka, A., Dawson, T., Akyuz, S., and Thorup, K.: Paleoseismology of the Gazikoy-Saros segment of the North Anatolia fault, northwestern Turkey: Comparison of the historical and paleoseismic records, implications of regional seismic hazard, and models of earthquake recurrence, Journal of Seismology, 5, 433–448, https://doi.org/10.1023/A:1011435927983, 2001.
Romagnoli, G., Pavano, F., Tortorici, G., and Catalano, S.: The 2018 Mount Etna earthquake (Mw 4.9): Depicting a natural model of a composite fault system from coseismic surface breaks, Tectonics, 40, e2020TC006286, https://doi.org/10.1029/2020TC006286, 2021.
Rovida A., Locati M., Camassi R., Lolli B., and Gasperini P.: The Italian earthquake catalogue CPTI15, Bulletin of Earthquake Engineering, 18, 2953–2984, https://doi.org/10.1007/s10518-020-00818-y, (2020).
Rust, D. and Neri, M.: The boundaries of large-scale collapse on the flanks of Mount Etna, Sicily, Geological Society, London, Special Publications, 110, 193–208, https://doi.org/10.1144/GSL.SP.1996.110.01.15, 1996.
Siniscalchi, A., Tripaldi,S., Neri, M., Balasco, M., Romano, G., Ruch, J., and Schiavone D.: Flank instability structure of Mt Etna inferred by a magnetotelluric survey, J. Geophys. Res., 117, B03216, https://doi.org/10.1029/2011JB008657, 2012.
Solaro, G., Acocella, V., Pepe, S., Ruch, J., Neri, M., and Sansosti, E.: Anatomy of an unstable volcano from InSAR: Multiple processes affecting flank instability at Mt. Etna, 1994–2008, J. of Geophysical Research: Solid Earth, 115, https://doi.org/10.1029/2009JB000820, 2010.
Tanguy, J. C., Condomines, M., Branca, S., La Delfa, S., and Coltelli, M.: New archeomagnetic and 226Ra-230Th dating of recent lavas for the Geological map of Etna volcano, Italian Journal of Geosciences, 131, 241–257, https://doi.org/10.3301/IJG.2012.01, 2012.
Tibaldi, A. and Groppelli, G.: Volcano-tectonic activity along structures of the unstable NE flank of Mt. Etna (Italy) and their possible origin, J. of Volcanology and Geothermal Research, 115, 277–302, https://doi.org/10.1016/S0377-0273(01)00305-5, 2002.
Tibaldi, A., Corti, N., De Beni, E., Bonali, F. L., Falsaperla, S., Langer, H., Neri, M., Cantarero, M., Reitano, D., and Fallati, L.: Mapping and evaluating kinematics and the stress and strain field at active faults and fissures: a comparison between field and drone data at the NE rift, Mt Etna (Italy), Solid Earth, 12, 801–816, https://doi.org/10.5194/se-12-801-2021, 2021.
Tortorici, G., Pavano, F., Romagnoli, G., and Catalano, S.: The effect of recent resurfacing in volcanic areas on the distribution of co-seismic ground deformation due to strike-slip earthquakes: New insights from the 12/26/2018 seismic event at Mt. Etna, Journal of Structural Geology, 145, 104308, https://doi.org/10.1016/j.jsg.2021.104308, 2021.
Tringali, G.: Earthquake surface faulting and aseismic creep on Etna volcano: role of the pre-volcanic basement, relationships with flank instability and magmatic intrusions, implications for future hazard scenarios, PhD thesis, Università degli Studi dell'Insubria, Italy, https://hdl.handle.net/11383/2165092 (last access: 5 December 2024), 2023a.
Tringali, G.: 26 December 2018 surface ruptures along the eastern flank of Mt. Etna, Zenodo [data set], https://doi.org/10.5281/zenodo.8414945, 2023b.
Tringali, G., Bella, D., Livio, F. A., Ferrario, M. F., Groppelli, G., Blumetti, A. M., Di Manna, P., Vittori, E., Guerrieri, L., Porfido, S., Boso, D., Pettinato, R., Paradiso, G., and Michetti, A. M.: Fault rupture and aseismic creep accompanying the December 26, 2018, Mw 4.9 Fleri earthquake (Mt. Etna, Italy): Factors affecting the surface faulting in a volcano-tectonic environment, Quaternary International, 651, 25–41, https://doi.org/10.1016/j.quaint.2021.12.019, 2023a.
Tringali, G., Bella, D., Livio, F., Ferrario, M. F., Groppelli, G., Pettinato, R., and Michetti, A. M.: Aseismic creep and gravitational sliding on the lower eastern flank of Mt. Etna: Insights from the 2002 and 2022 fault rupture events between Santa Venerina and Santa Tecla, Tectonophysics, 856, 229829, https://doi.org/10.1016/j.tecto.2023.229829, 2023b.
Urlaub, M., Petersen, F., Gross, F., Bonforte, A., Puglisi, G., Guglielmino, F., Krastel, S., Lange, D., and Kopp, H.: Gravitational collapse of Mount Etna's southeastern flank, Science Advances, 4, eaat9700, https://doi.org/10.1126/sciadv.aat9700, 2018.
Von Hagke, C., Kettermann, M., Bitsch, N., Bücken, D., Weismüller, C., and Urai, J. L.: The effect of obliquity of slip in normal faults on distribution of open fractures, Frontiers in Earth Science, 7, 18, https://doi.org/10.3389/feart.2019.00018, 2019.
Zehnder, A. T. and Allmendinger, R. W.: Velocity field for the trishear model, Journal of Structural Geology, 22, 1009–1014, https://doi.org/10.1016/S0191-8141(00)00037-7, 2000.
- Abstract
- Introduction
- Geological and seismotectonic setting
- Geologic features around the Fiandaca Fault
- Methods and materials
- Trenching site results
- Discussions
- Conclusions and future perspectives
- Data availability
- Author contributions
- Competing interests
- Disclaimer
- Acknowledgements
- Financial support
- Review statement
- References
- Supplement