the Creative Commons Attribution 4.0 License.
the Creative Commons Attribution 4.0 License.
 | 27 Jun 2025
Strike-slip kinematics from crustal to outcrop-scale: the impact of material properties on analogue modelling
Jürgen Adam
Elham Jonade
Silvia Negrão
Yasuhiro Yamada
Strike-slip fault zones commonly display complex kinematics and 3D geometries, with high structural variability along strike and with depth. In this regard, analogue modelling techniques are a powerful tool for investigating such complex structural, kinematic, and mechanical deformation processes at various scales. Dynamically scaled experiments allow a direct comparison between models and natural systems. The geometric scaling factor defines the model resolution in terms of model/prototype length equivalence and depends on the mechanical and physical properties of prototype and analogue materials.
In this study, systematic strike-slip experiments were performed by using four different model materials to investigate the deformation dynamics at various scales and to highlight the impact of the physical and mechanical properties of the model material on the experiment results. The applied model materials showed a non-linear strain-dependent deformation behaviour while providing different dynamically scaled geometric scaling factors.
Digital image correlation (DIC) analyses of the experiments allowed a quantitative comparison of the displacement and strain fields at different stages of the dextral displacement above a single planar basement fault. The analysis of the localisation and development of the faults and fractures in the strike-slip shear zones enabled the comparison of the different structural styles and dynamics observable at various levels of resolution. The increasing resolution enabled by the model materials with higher cohesion allowed a higher detail into the shear zones, with the development of a more complex network of discontinuities, larger shear zone width, and higher vertical relief. Therefore, the application of such a multi-scale approach in dynamically scaled experiments can provide new insights into the investigation of complex deformation processes with analogue modelling techniques.
- Article
(9006 KB) - Full-text XML
- BibTeX
- EndNote


Strike-slip fault zones are characterised by complex 3D structures, with rapid changes in deformation along strike and with depth (Wu et al., 2009). The development of the strike-slip faults initiates from arrays of en échelon fractures. With increasing deformation, these early fractures further develop and link together, forming a continuous and complex strike-slip shear zone (Shipton and Cowie, 2001; Crider and Peacock, 2004). The spatial properties of the damage and fault zones, along with the fracture network they develop, have a critical impact on the permeability and stability of rock masses, with direct applications in resource management, e.g. water reservoirs and geothermal energy (Bisdom et al., 2014; Zeng and Yao, 2016; Massaro et al., 2019); risk mitigation, e.g. rockfalls (Lambert et al., 2012; Mammoliti et al., 2023; Schilirò et al., 2024); and civil engineering constructions, e.g. tunnels (Cacciari and Futai, 2017; Wang et al., 2020).
Analogue modelling techniques allow us to simulate geological processes and investigate their evolution through space and time. Dynamically scaled models enable direct comparison between the experiment and the prototype. The observations in the final model are, therefore, quantitative and not only qualitative. In this context, the model materials applied in the experiment play a critical role in defining the scaling relationships. In fact, the dynamically scaled length equivalence between the model and the natural systems depends on the physical and mechanical properties of the model materials applied and the rock prototype simulated. Therefore, the choice of the model materials strictly depends on the processes and structures to be simulated.
In this study, we present results from strike-slip experiments using four analogue materials that enabled different levels of dynamic scaling. With such comparison between models, we aim to highlight the impact of the material properties on the analogue modelling results. The selection of the model material must be in line with the processes to be simulated and to the scale of resolution intended to be achieved. The strike-slip experiment, also referred to as the Riedel experiment, consists of deforming an overburden above a single planar and vertical basement fault with pure strike-slip movement (Dooley and Schreurs, 2012). The materials used were quartz sand, clay, and granular rock-analogue material (GRAM) (Massaro et al., 2022). The quartz sand was used as “dry” quartz sand and “wet” quartz sand. In the latter case, 10 wt % of water was added during the sample preparation. The clay was used in a mixture of quartz sand with 5 wt % of clay. GRAM is a cohesive granular material composed of quartz sand, hemihydrate powder, and water. In this study, GRAM was used with 2 wt % of hemihydrate.
The physical and mechanical properties of the model materials were analysed, comparing their deformation behaviour under different loading conditions. Also, their shear and frictional properties were determined. The mechanical properties are necessary, along with the density, for the dynamic scaling calculation. The latter was defined by referring to a common prototype (a generic sedimentary rock with 26.3 MPa of cohesion and a density of 2.37 g cm−3; Kulhawy, 1975), quantifying the different model resolutions provided by the analogue materials in the experiments.
The four models were compared from the top-view images analysed with strain-monitoring digital image correlation (DIC) techniques. The investigation from the larger to the smaller scale represented a zoom-in on the fault systems, with the shear zone architecture showing increasing complexity. Thus, a multi-scale approach with analogue modelling techniques can provide fundamental insights into the analysis of complex brittle deformation processes.
Strike-slip fault systems commonly display complex geometries with high variability in depth and along strike. A fault system is a complex volume of deformed rock, composed of differently strained zones with peculiar structures. The most internal part is the fault core, surrounded by the enveloping damage zones and, most externally, the undeformed host rock (Childs et al., 1996; Wibberley et al., 2008; Faulkner et al., 2010). Most of the displacement is accommodated by the central fault core, resulting in intensely deformed rocks characterised by high-strain features, including cataclasite and ultra-cataclasite, breccia, and clay-rich gouge zones. The surrounding damage zones undergo lower deformation, resulting in lower-strain deformation structures. These include a fracture network, secondary faults, veins, cleavage, folds, and deformation bands. The intensity of deformation of fault core and damage zones affects the permeability of the rock, which critically increases towards the inner part of the fault system with a remarkable reduction in the fault core (Billi et al., 2003; Kim et al., 2004; Faulkner et al., 2010; Choi et al., 2016). Finally, the lateral reduction in strain leads to the transition from the damage zones to the undeformed host rock, which is not affected by the fault deformation.
3.1 Analogue modelling
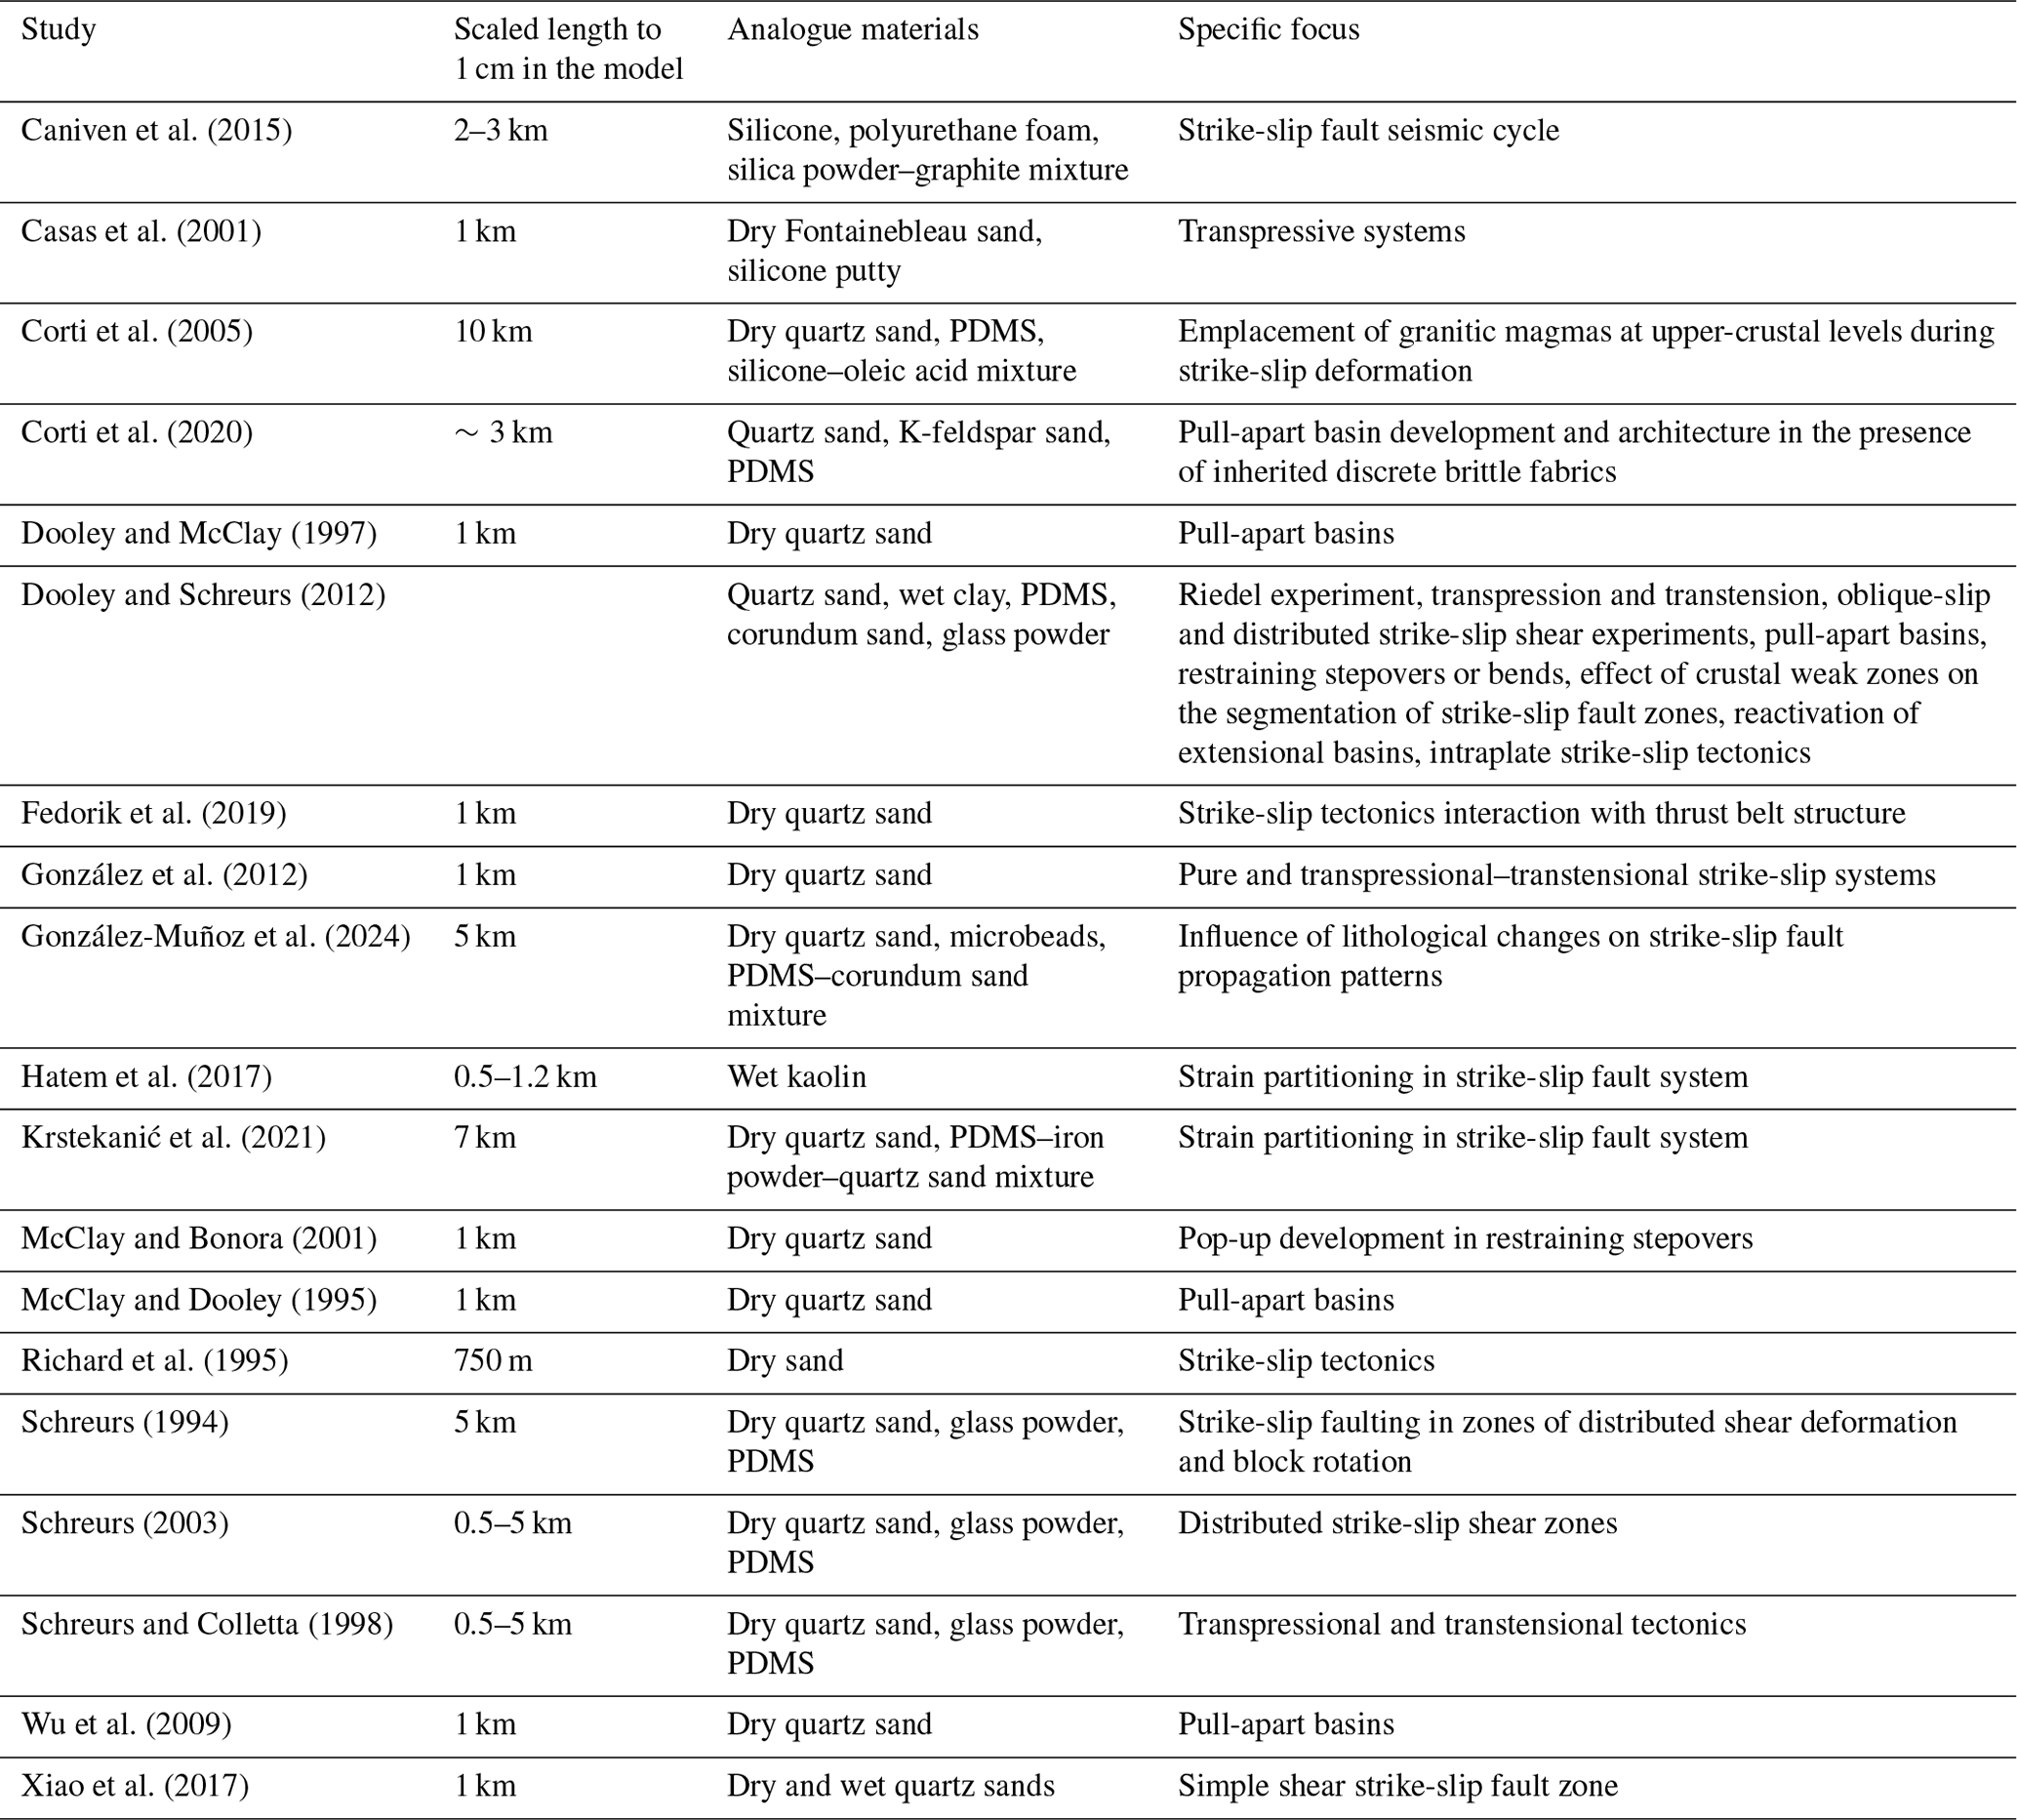
Analogue modelling techniques have been applied by several studies to investigate strike-slip tectonics and individual aspects, including transtension, transpression, block rotation, fault zone segmentation, and strain partitioning. In general, the model materials applied strictly depend on the aims of the study, as summarised in Table 1.
Table 1Summary of studies on analogue modelling of strike-slip tectonics. PDMS: polydimethylsiloxane silicone.
The scaling theory represented a turning point for analogue modelling, upgrading it from a qualitative to a quantitative investigation method (Hubbert, 1937). A scaled model enables the direct comparison between the model and the natural system. The scaling is composed of three hierarchical levels of similarity between the experiment and the rock prototype. The geometric scaling is the lowest of the three levels and requires that all the corresponding lengths (ln, n=1, 2, 3, …) are proportional and that all the corresponding angles (α) are equal in the two systems so that
where m indicates the model and p indicates the prototype.
The kinematic scaling involves the time required for the deformation to happen in the two systems and must be scaled as follows (Ramberg, 1967):
To obtain the highest level of similarity, i.e. the dynamic scaling, the angle of internal friction of the model material must be similar to the upper-crustal rocks, 27–45° (Handin, 1966; Jaeger et al., 2007). In addition, the physical and mechanical properties of the model material and rock prototype must be scaled as follows (Hubbert, 1937; Ramberg, 1981):
where C is the cohesion, ρ is the density, g is the gravity acceleration, and L is the length.
In some studies (Ramberg, 1967; Harris and Koyi, 2003), the experiments are conducted in an artificial field of gravity, obtained by means of a centrifuge. For experiments performed at normal gravity conditions, the ratio and Eq. (3) can be rewritten as follows:
The length ratio between the model and the prototype (Eq. 4) defines the dynamically scaled geometric scaling factor (L*) of the experiment. This relationship represents a critical feature of the model, defining its resolution and, therefore, the structures that can be developed and analysed during the experiment. As a result, the choice of the model material is of primary importance for the physical experiment.
Quartz sands, and granular materials in general, are widely used as analogue materials for the physical simulation of brittle upper-crust processes (McClay et al., 1998; Bonini et al., 2000; Galland et al., 2006; Dooley and Schreurs, 2012), mainly for their handling and mechanical properties. The granular materials can be prepared with many techniques (pouring, sieving, compacting) that determine different values of density and porosity (Panien et al., 2006; Klinkmüller et al., 2016). Also, most of the granular materials can be coloured and different layers can be created in the experiment to improve the visualisation of the developing structures. Finally, the models can be preserved and sliced to analyse the deformation throughout the model.
From the mechanical point of view, granular materials show a complex strain-dependent non-linear deformation behaviour similar to experimentally deformed natural rocks, with elastic–plastic behaviour, strain hardening, and strain softening (Byerlee, 1978; Paterson, 1978; Mandl, 1988; Marcher and Vermeer, 2001; Lohrmann et al., 2003; Adam et al., 2005; Panien et al., 2006).
3.2 Model materials
In this study, the experiments were run with four model materials having the following raw components: quartz sand, clay, and hemihydrate powder. Quartz sand was used as dry sand, preparing the samples with the sieving technique, and as wet sand, prepared by adding 10 wt % of water during the sample preparation. The third analogue material was a mixture of quartz sand with 5 wt % of clay, prepared by sieving. The fourth material was a granular rock-analogue material (GRAM) composed of quartz sand, hemihydrate powder, and water prepared with 2 wt % of hemihydrate powder (Massaro et al., 2022). The chemical compositions of the three basic materials, as defined by the respective suppliers, are summarised in Table 2.
Table 2Chemical composition of the raw materials as provided by the suppliers. LOI: loss on ignition.
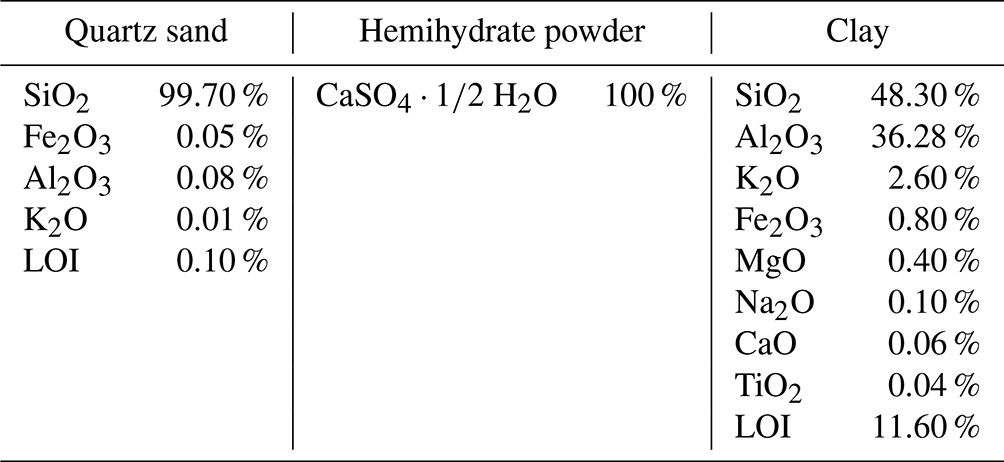
The quartz sand is supplied by Minerals Marketing Ltd and is a natural shallow marine sand of the Cretaceous Lower Greensand Fm., extracted from Godstone, Surrey, United Kingdom. The hemihydrate powder is supplied by Scientific Laboratory Supplies and is 100 % hemihydrate calcium sulfate powder. The clay bulk mineralogical composition is kaolinite (66 %), mica (23 %), feldspar (6 %), and quartz (1 %), supplied by Sibelco UK Ltd.
3.2.1 Model material preparation
The four model materials were prepared for mechanical tests and for the strike-slip experiments by following a systematic procedure. The sand–clay mixture was prepared by mixing the two components, ensuring that no clay agglomerates formed. The two materials were mixed by using a concrete mixer. Successively, the material was sieved at a constant rate and from a fixed height (about 15 cm) into the mechanical tester cell or the experiment rig. Dry sand did not require any action before sieving it with the same procedure described for sand–clay samples. Wet sand samples were prepared by placing the sand in the concrete mixer, adding 10 wt % of water and mixing to ensure that no dry parts remained. Successively, the material was poured into the mechanical tester cell or experiment rig. GRAM 2 % sample preparation needed more time, since the material requires a stage of drying after the addition of 10 wt % of water to the sand and hemihydrate (2 wt %) mixture (Massaro et al., 2023).
3.2.2 Mechanical properties
The dry quartz sand and GRAM 2 % are mechanically characterised in Massaro et al. (2023). The wet quartz sand and the sand–clay mixture were mechanically tested in this study. The mechanical test series was performed as described by Massaro et al. (2023), using a specialised dynamic ring shear tester for powder testing under the range of normal loads observed in analogue modelling (Schulze, 1994; Panien et al., 2006).
The bulk density of the model materials was derived by weighing different samples of known volume and defining the best-fit regression line of the mass/volume graph. The sand–clay 5 wt % mixture shows a density of 1.58 g cm−3, dry sand 1.60 g cm−3, wet sand 1.47 g cm−3, and GRAM 2 wt % 1.45 g cm−3.
3.3 Experiment setup
The physical experiments were run in the Analogue Tectonics Modelling Laboratories of the Department of Earth Sciences at Royal Holloway University of London (ATML@RHUL). The experiment, also referred to as the Riedel experiment (Dooley and Schreurs, 2012), simulates the deformation occurring in an overburden placed on a straight and vertical basement fault (Riedel, 1929). The apparatus is composed of 100 cm long, 60 cm wide, and 12 cm high independent metal walls fixed on two mobile metal baseplates (Fig. 1). The baseplates slide against each other along a central straight interface that represents the basement strike-slip fault. All the experiments were run with dextral strike-slip kinematics.
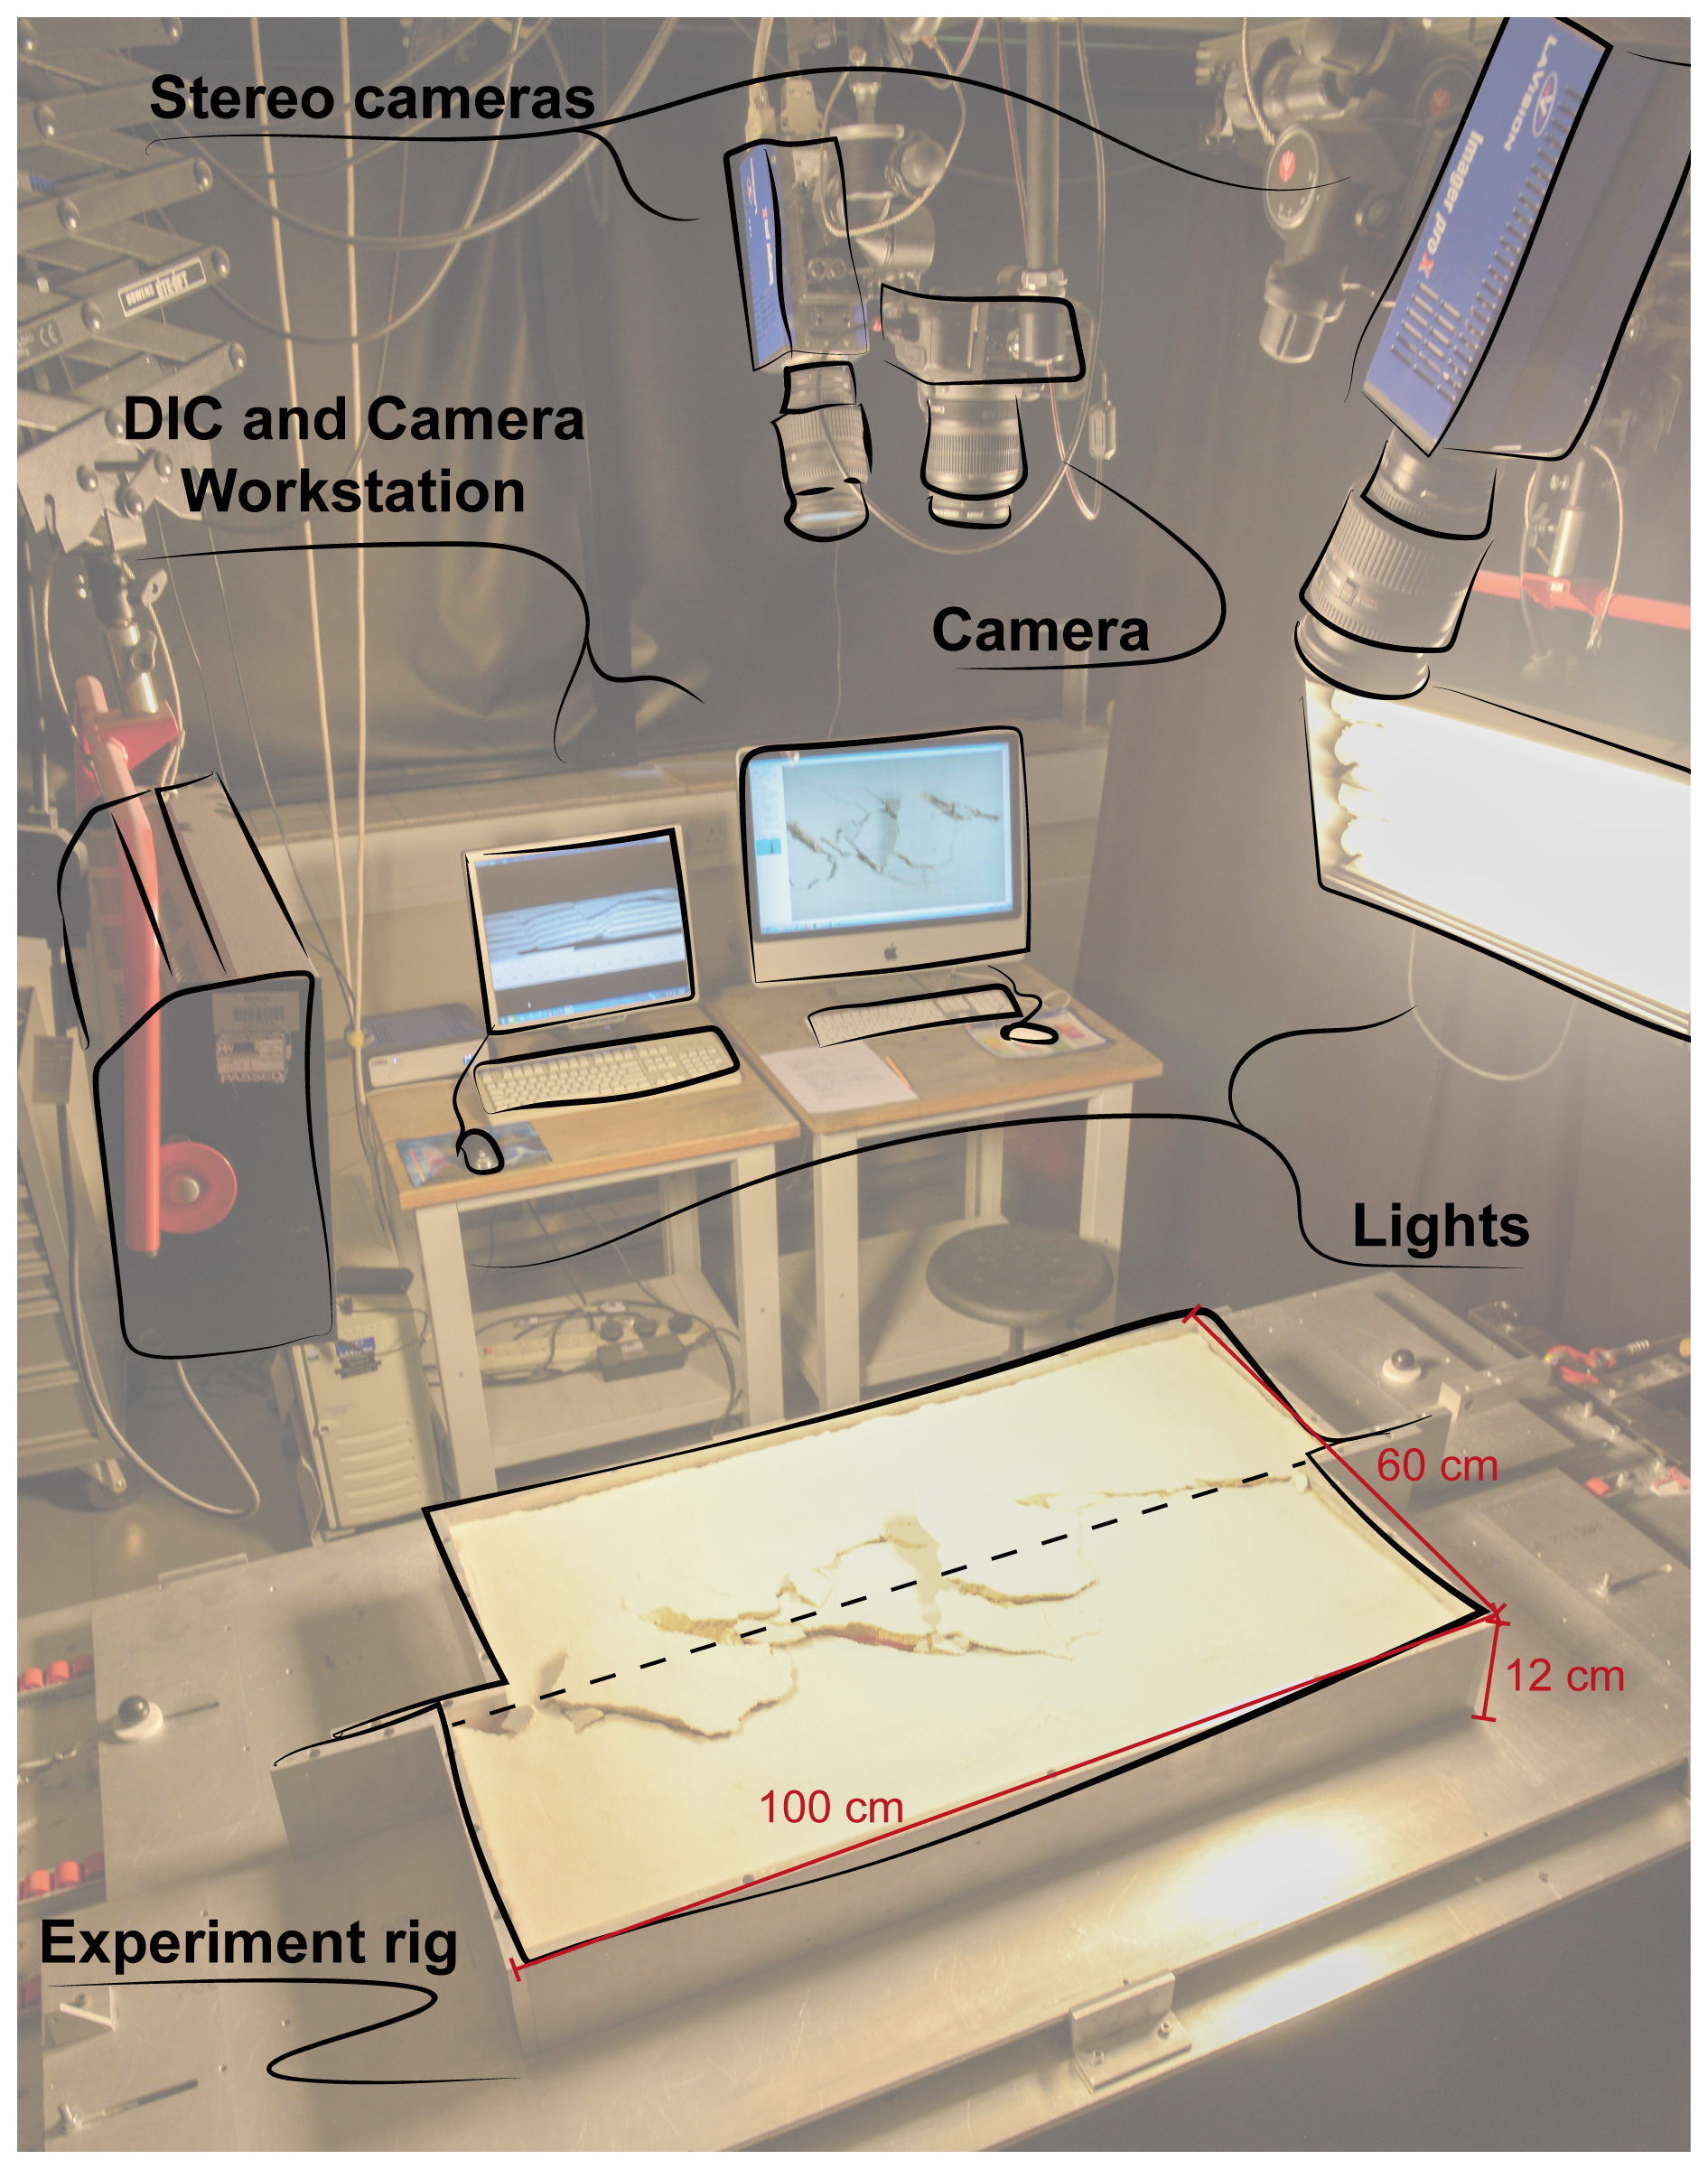
Figure 1Experiment setup with stereoscopic CCD cameras and DIC setup, with a schematic representation of the strike-slip rig (modified after Massaro et al., 2022).
The displacement was applied with two different systems depending on the range of material strength. The sand–clay and dry sand experiments were run with two electric stepper motors, with a constant and pre-defined displacement rate. Each motor pulls one of the baseplates in opposite directions, resulting in a symmetric shear zone. The electronic motors available at the facility are designed for experiments with nearly cohesionless materials. Therefore, their application for wet sand and GRAM 2 % experiments was not possible, as this would damage the motors themselves. For these experiments, the displacement was applied with a manually driven hydraulic winch. This leads to a displacement rate that is not constant and is generally higher with respect to the motors. Also, only one winch was used to avoid different displacement rates applied by two operators. Consequently, one of the baseplates is pulled while the other is fixed, forming an asymmetric shear zone.
Additionally, the experiments had individual DIC frame rate values due to the abovementioned differences in the setup and data acquisition reasons. To ensure proper comparison between the models, the DIC incremental displacement and strain data were processed with a corrected incremental step size of 0.42 mm. This was easily achieved for the models run with the stepper motors (sand–clay and dry sand), which enabled fixed and regular displacement rates. For the models manually run with the hydraulic winch (wet sand and GRAM), the irregular displacement rate allowed a data elaboration with an incremental step size of 0.42 mm and a margin of error of ± 0.03 mm. The setup parameters of each experiment are summarised in Table 3.
Table 3Specifics of the experiments analysed in this study with sand–clay, dry sand, wet sand, and GRAM 2 %.
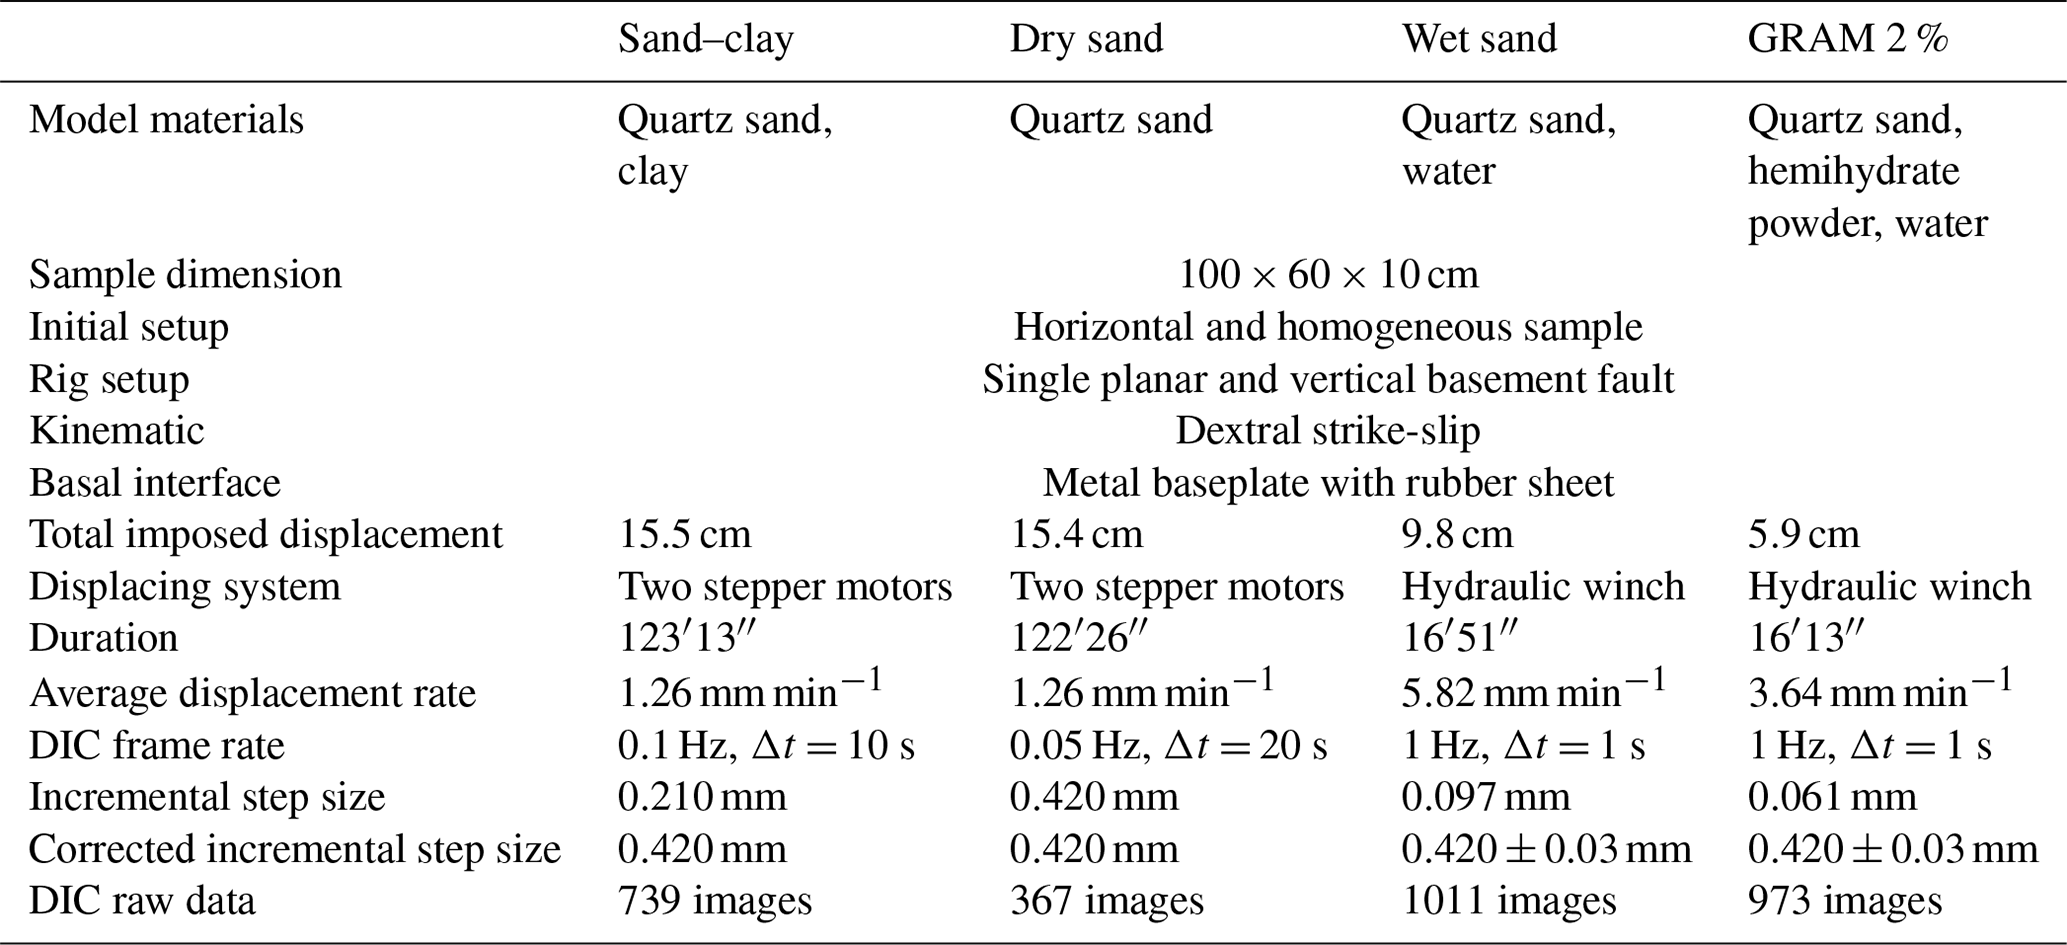
For all the materials, two independent 1 mm thick metal baseplates covered with a glued-on rubber sheet were placed on the rig, constituting a high-friction basal interface between the sample and the rig. These rubber sheets were aimed at minimising the slip at the base of the samples. All the experiments and mechanical tests were performed at monitored laboratory conditions (temperature 22 ± 2 °C and humidity 33 ± 4 %).
3.4 DIC analysis
The top surface of the samples was monitored during the experiments. Digital image correlation (DIC) techniques were applied to monitor strain at high resolution (Adam et al., 2002; Adam et al., 2005; Krezsek et al., 2007; Adam et al., 2013; Massaro et al., 2022). This analysis technique enables the full-field measurements of the displacement and strain changes and the monitoring of localised and distributed deformation processes on the model surface. The analysis has a resolution up to the particle scale with a sub-millimetric accuracy (White et al., 2003; Adam et al., 2005). The images were acquired with two high-resolution charge-coupled device (CCD) cameras (Fig. 1). The cameras were fixed symmetrically above the experiment rig in a stereoscopic setup. Additionally, a third, independent camera was fixed above the rig for photo acquisition.
The stereo images were sequentially acquired and then processed using Strain Master (LaVision) software, which is a digital image correlation and deformation analysis software adapted for scaled analogue experiments. The 3D experiment surface is calculated from the ortho-corrected stereo images by means of a mathematical mapping function. The latter is derived from 3D volume correlation and correction. This procedure is enhanced by a calibration plate with equidistant cross marks on the surface. Additionally, the 3D mapping of the experiment surface is enabled by the volume correlation. Subsequently, the 3D incremental (difference between each image acquired) or total (cumulative values) displacement vector field is calculated by digital image correlation of successive time series images. Finally, the 3D displacement vector field allows the calculation of additional surface deformation displacement and strain components.
4.1 Stress–strain behaviour
The ring shear test results are shown as shear stress (kPa) and compaction–decompaction (mm) versus shear strain curves (Fig. 2). The four model materials display a non-linear elastic–plastic frictional deformation behaviour with strain hardening and strain softening. In detail, all the samples show the highest values of shear stress during failure of the undeformed material (first peak, τpeak), followed by the second peak (τreact), which is the failure of the second cycle and represents the shear stress needed to reactivate the pre-existing shear zone. The lowest post-failure shear stress values correspond, in all the tested materials, to the stable sliding stages, which define the dynamic–stable strength (τdyn) necessary for active deformation of the shear zone (fault sliding).
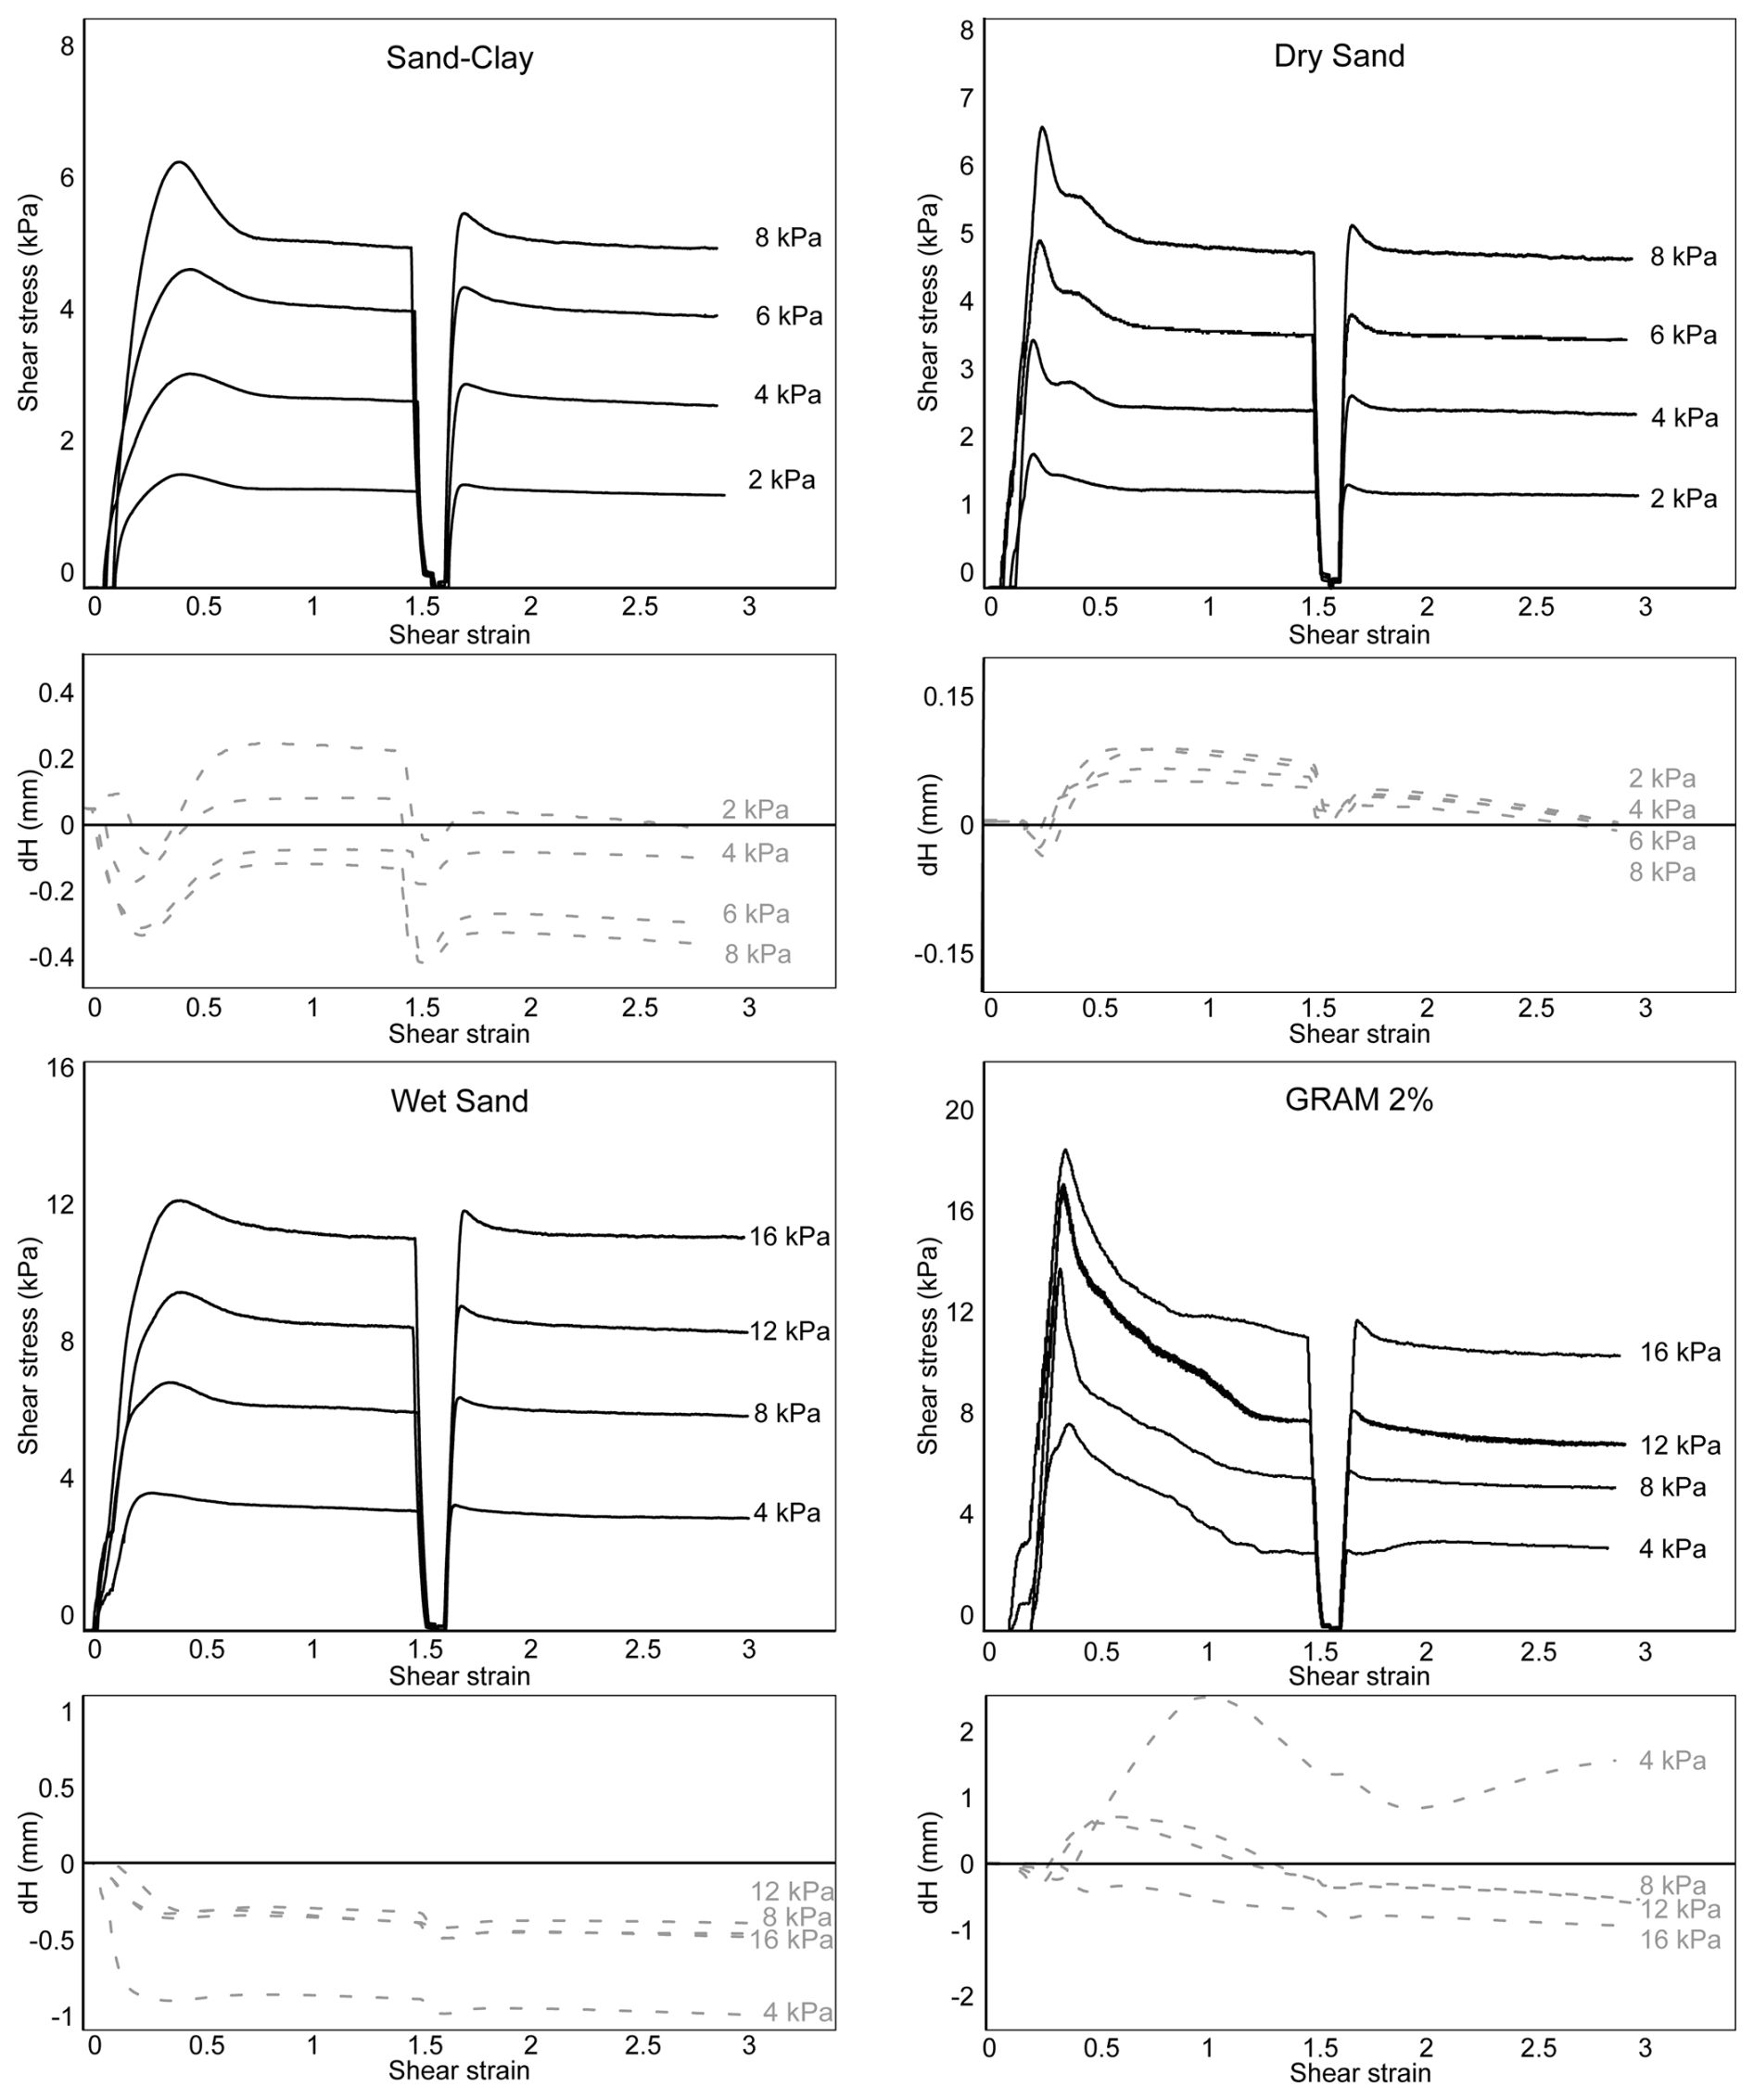
Figure 2Shear stress and compaction/decompaction (dH) versus shear strain plots for the analysed materials at different normal load conditions (from 2 to 16 kPa).
The stress–strain curves regularly vary with different loading conditions, with higher confined stresses requiring higher shear stresses for failure, reactivation, and active slip of shear zones. GRAM 2 % displays more irregular trends. At 8 kPa of normal stress, GRAM 2 % shows the highest peak strength values (about 13 kPa) and sand–clay shows the lowest (about 6 kPa), whereas wet sand and dry sand have values of about 7 and 6.5 kPa, respectively.
The values of compaction (negative dH variations) and decompaction (positive dH variations) occurring within the shear zone are derived from the vertical displacement of the lid (mm). In all materials, a stage of compaction is observed prior to failure (pre-failure strain hardening). Sand–clay samples display both compaction and decompaction during the test, with higher compaction values observed at higher normal load conditions. In the same way, dry sand samples show less decompaction under higher normal loads, and, through the tests, the compaction is observed before the first failure and during the second-cycle stable–sliding phase. Wet sand samples display only compaction throughout the whole duration of the tests, reaching the highest values (−1 mm) of the series. For GRAM samples, the compaction–decompaction curves are more irregular with respect to the other analysed materials, although a transition from decompaction to compaction is observed with higher normal loads.
4.2 Cohesion and frictional properties
The cohesion, internal friction, and strain hardening/softening parameters were derived from the ring shear test series (Table 4). The cohesion and internal friction parameters are extrapolated from the critical shear stress/normal stress graphs (Fig. 3) at peak strength, reactivation strength, and dynamic–stable sliding. Following the Coulomb failure criterion, the cohesion is the intercept on the y axis (i.e. the shear strength when the normal stress is zero), while the coefficient of internal friction is derived as the slope of the best-fit regression line, assuming a linear Coulomb behaviour at all normal stresses. Several studies demonstrated that, under low normal stresses (250–400 Pa for Schellart, 2000; 30 Pa for Mourgues and Cobbold, 2003), the failure envelope is not linear but shows a convex-upward shape. Therefore, linearly extrapolated cohesion values at low normal stresses can be overestimated (Schellart, 2000; Mourgues and Cobbold, 2003; Panien et al., 2006; Dooley and Schreurs, 2012). However, in this study, the lowest normal load applied in the ring shear tests is 2000 Pa; therefore, the cohesion values are linearly extrapolated. For all the analysed materials, the highest values of cohesion are obtained at peak strength, with GRAM 2 % and wet sand (7430 and 1428 Pa, respectively) showing values of 1 order of magnitude higher than dry sand and sand–clay (279 and 189 Pa, respectively).
Table 4Mechanical properties derived from ring shear test series for sand–clay, dry sand (Massaro et al., 2023), wet sand, and GRAM 2 % (Massaro et al., 2023): angle and coefficient of internal friction and extrapolated cohesion at peak, reactivation and dynamic–stable strength, and percentage of strain softening/hardening. The error is the standard error calculated after linear regression.
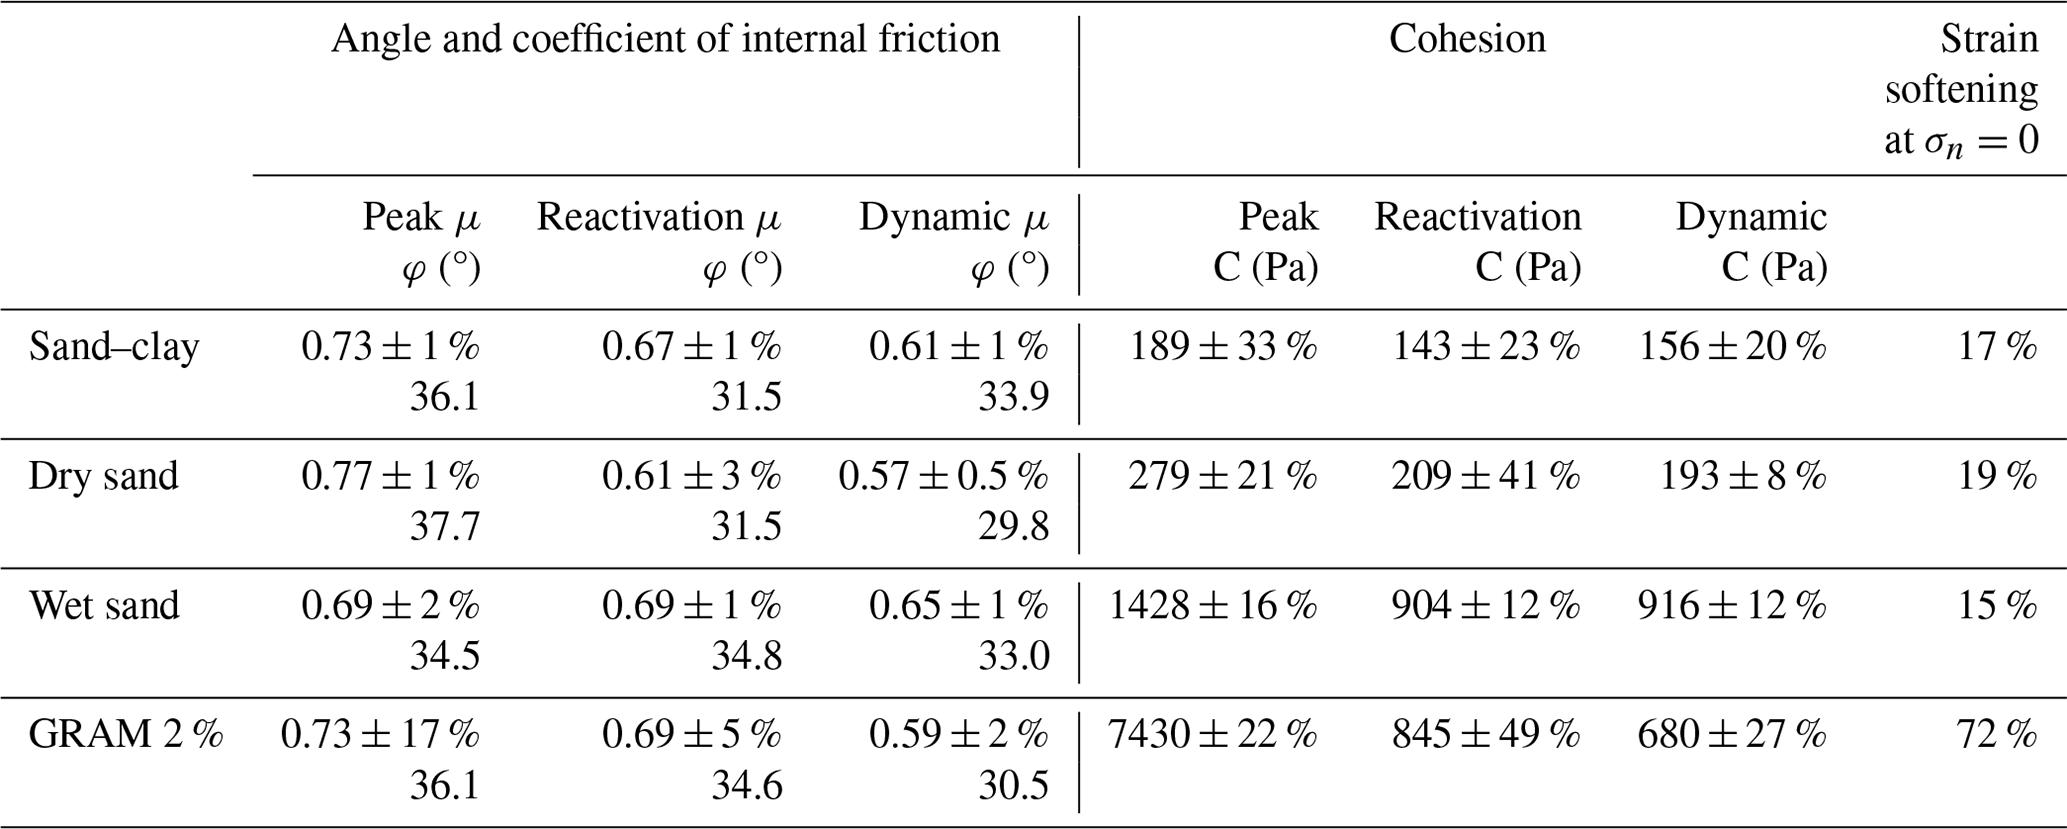
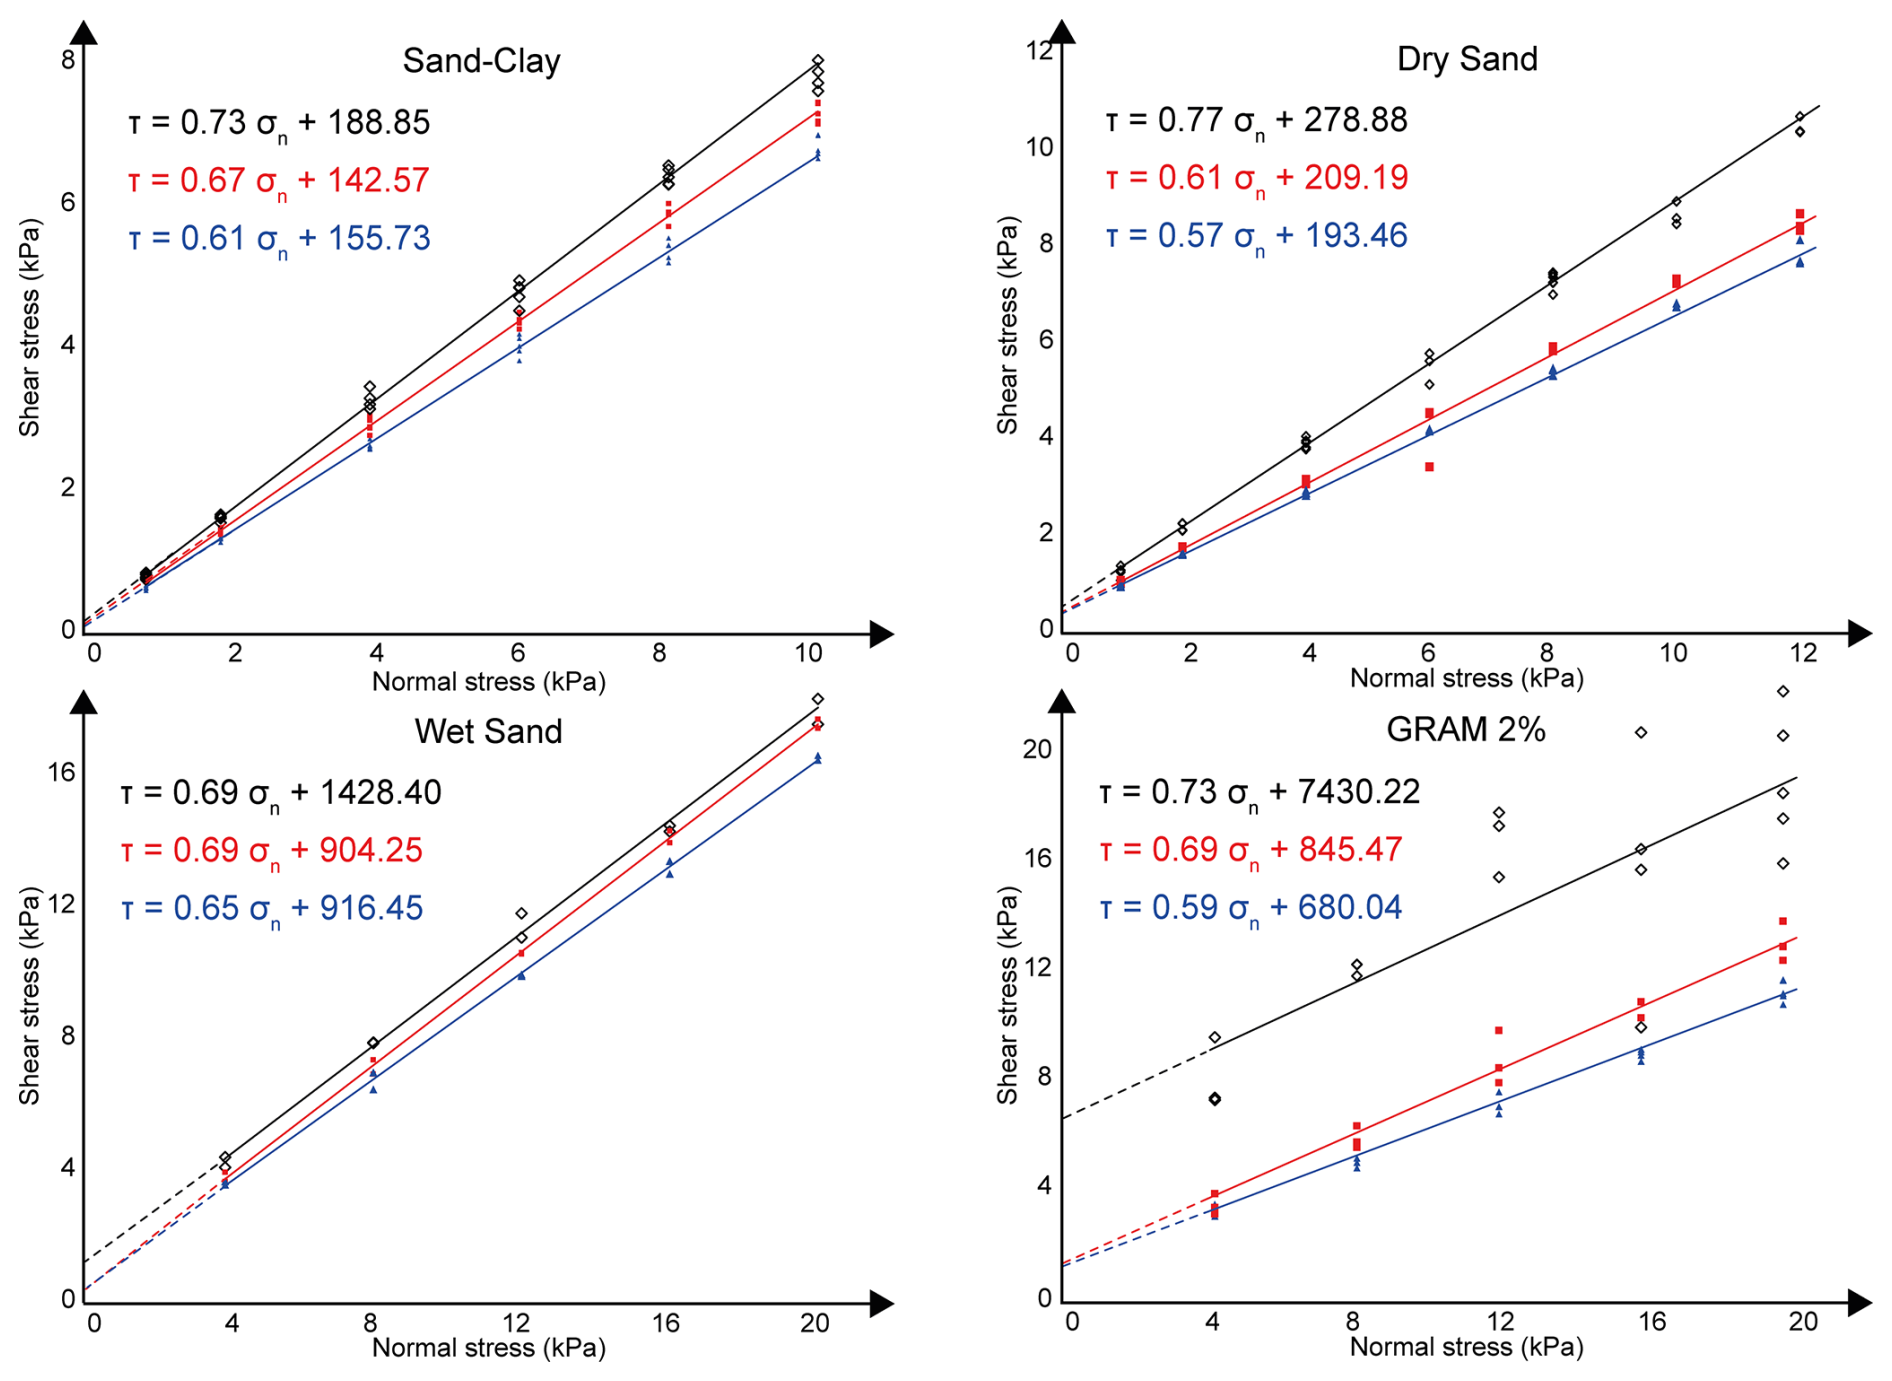
Figure 3Shear stress (kPa) versus normal stress (kPa) for the four analysed materials, with the critical values at peak (black), reactivation (red), and dynamic–stable (blue) strength (modified after Massaro et al., 2023).
Sand–clay, dry sand, and GRAM 2 % show the highest friction coefficients at peak strength (Fig. 4a), whereas, for wet sand, the highest value corresponds to the reactivation peak friction coefficient (μpeak=0.6885; μreact=0.6942). Dry sand and GRAM 2 % have similar trends, with a reduction in friction coefficient from peak to reactivation and dynamic–stable strength. Dry sand displays the highest peak friction value (0.77), whereas wet sand has the lowest (0.69).
The strain softening is defined as a reduction in strength with equal or increasing strain, determining the weakening of the shear zone. It is quantified as the difference between the peak shear strength and the dynamic–stable strength, divided by the peak shear strength and expressed as a percentage (Panien et al., 2006; Massaro et al., 2023). Sand–clay, wet sand, and GRAM 2 % show a decreasing strain softening with higher normal load values, although GRAM 2 % displays a much more negative slope coefficient (). This trend is similar to what is observed in natural rocks (Ritter et al., 2016). On the other hand, for dry sand samples, a positive slope of normal load versus strain softening is observed (Fig. 4b).
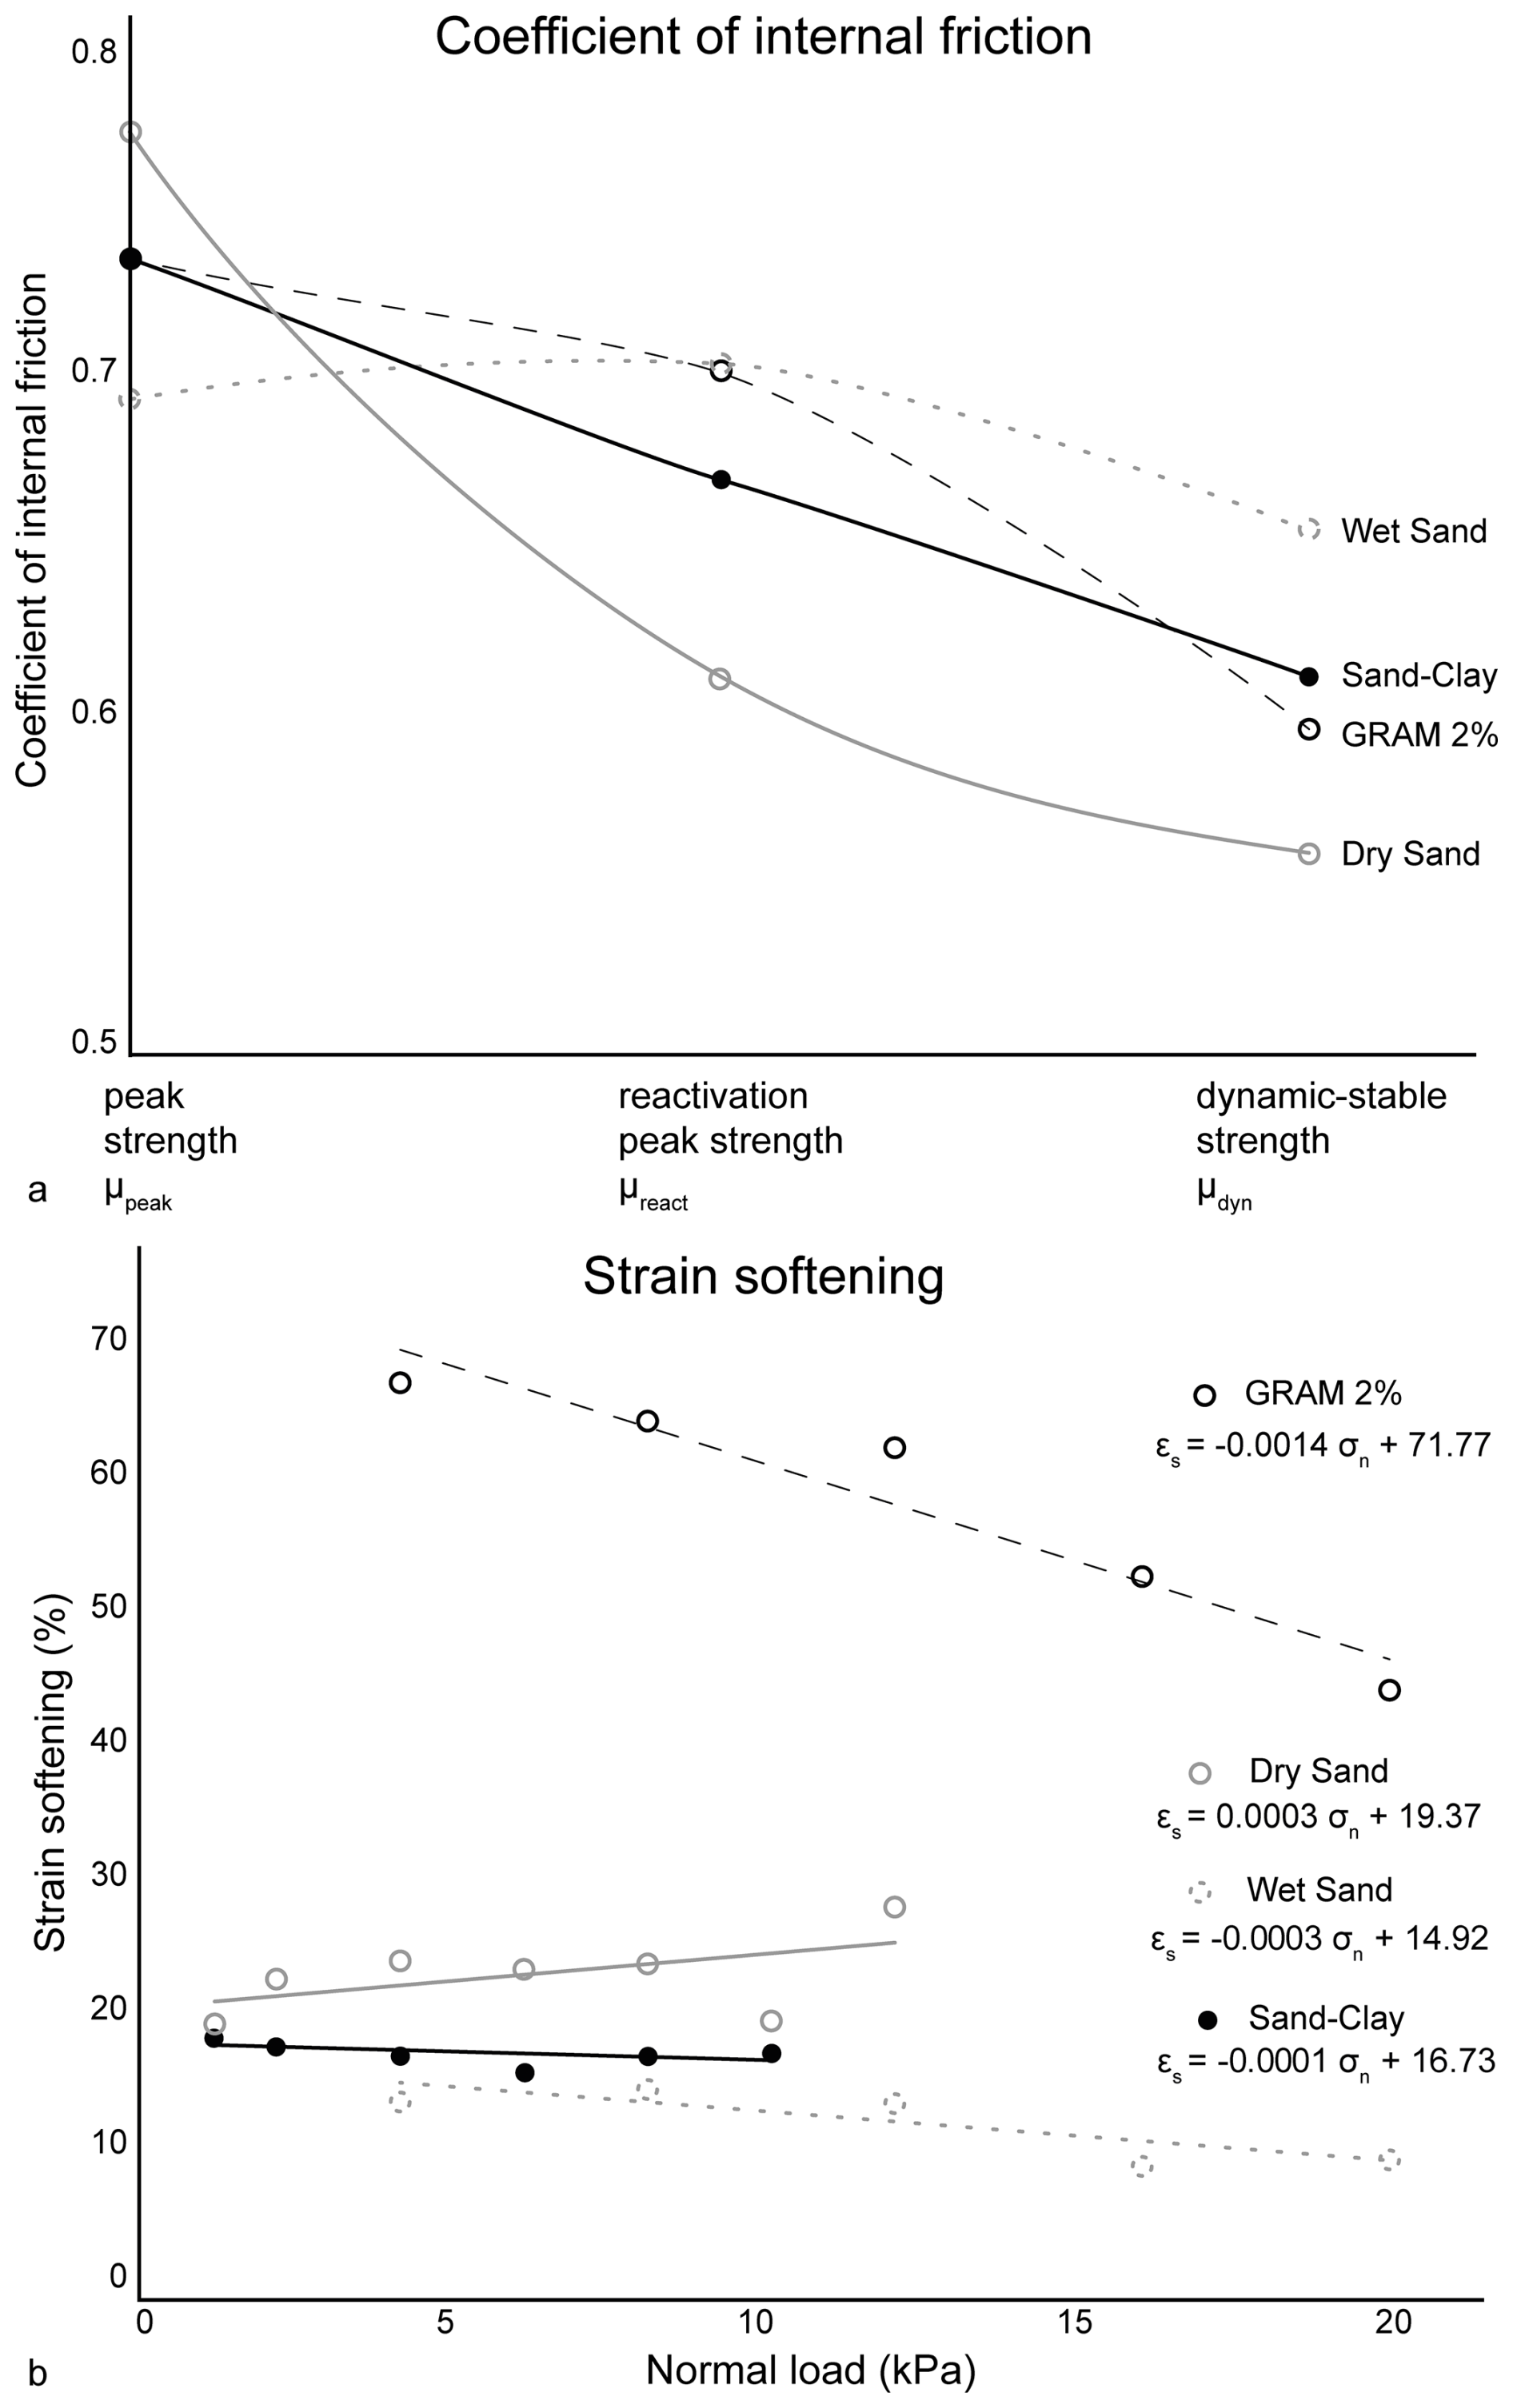
Figure 4Coefficient of internal friction and strain softening (%) derived from the ring shear test series for the four analysed materials (modified after Massaro et al., 2023). (a) Internal friction coefficient variation at peak strength, reactivation strength, and dynamic–stable strength; (b) strain softening (%) under different normal load conditions. The equation of the best-fit regression line is reported for each analysed material.
4.3 Dynamic scaling
The model resolution, in terms of geometric scaling factor (L*), derived for the analogue materials in dynamically scaled experiments was calculated following Eq. (4). The experiments were dynamically scaled with respect to a natural prototype to ensure quantitative and qualitative comparison with each other. A generic sedimentary rock was used as a reference natural prototype (Table 5), with the density, cohesive strength, and coefficient of internal friction described by Kulhawy (1975) and references therein (where they tested several rock formations and provided the average values per rock type).
Table 5Scaling factors of the four experiments. The natural prototype physical and mechanical properties are referred to a generic sedimentary rock (Kulhawy, 1975), and the displacement rate of the natural system is from Mouslopoulou et al. (2009).
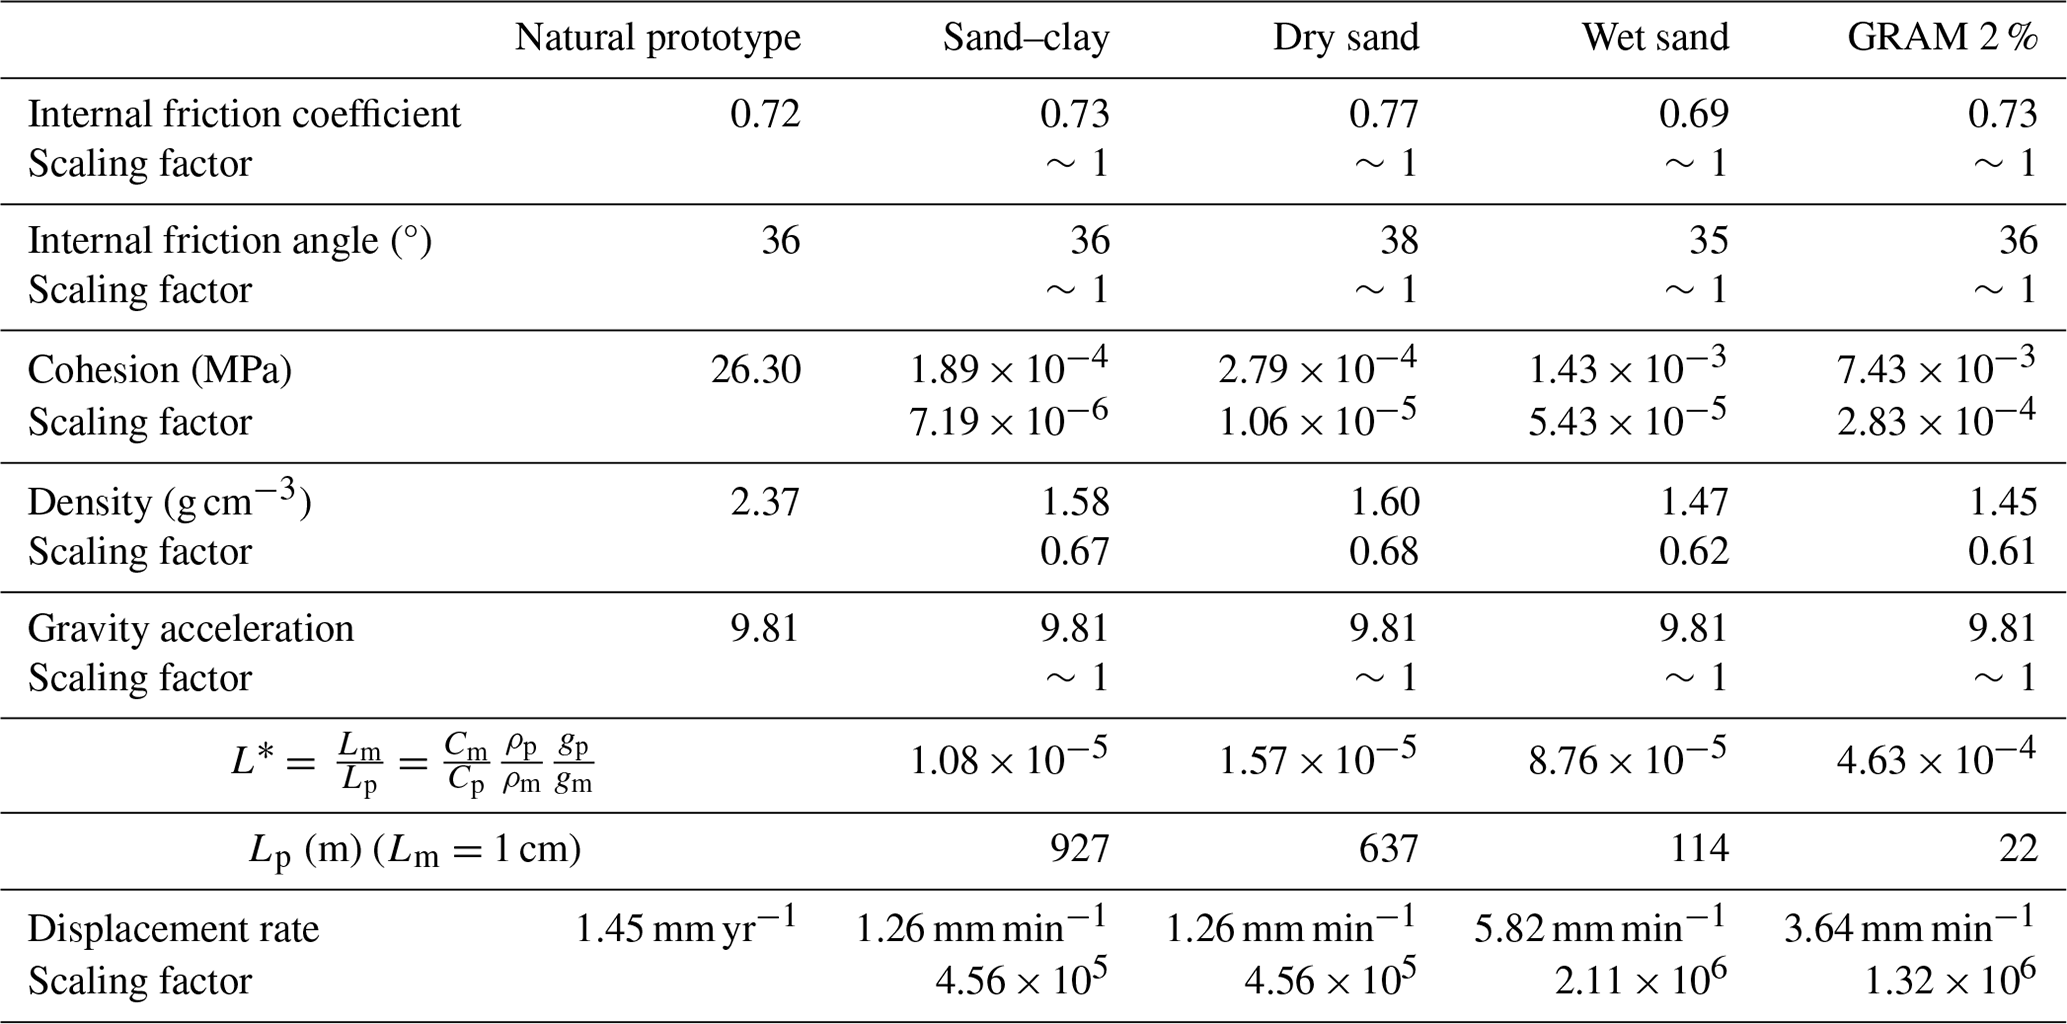
The geometric scaling factors (L*) calculated for the model materials are graphically summarised in Fig. 5. The calculated length equivalences between model (Lm) and prototype (Lp) are 1 cm in the model corresponding to 927 m (sand–clay), 637 m (dry sand), 114 m (wet sand), and 22 m (GRAM 2 %). The resolutions obtained with sand–clay mixture and with dry sand allow the simulation at the crustal scale. The wet sand geometric scaling factor falls just above the outcrop scale, corresponding to the field scale. GRAM 2 % enables the simulation at the outcrop scale.
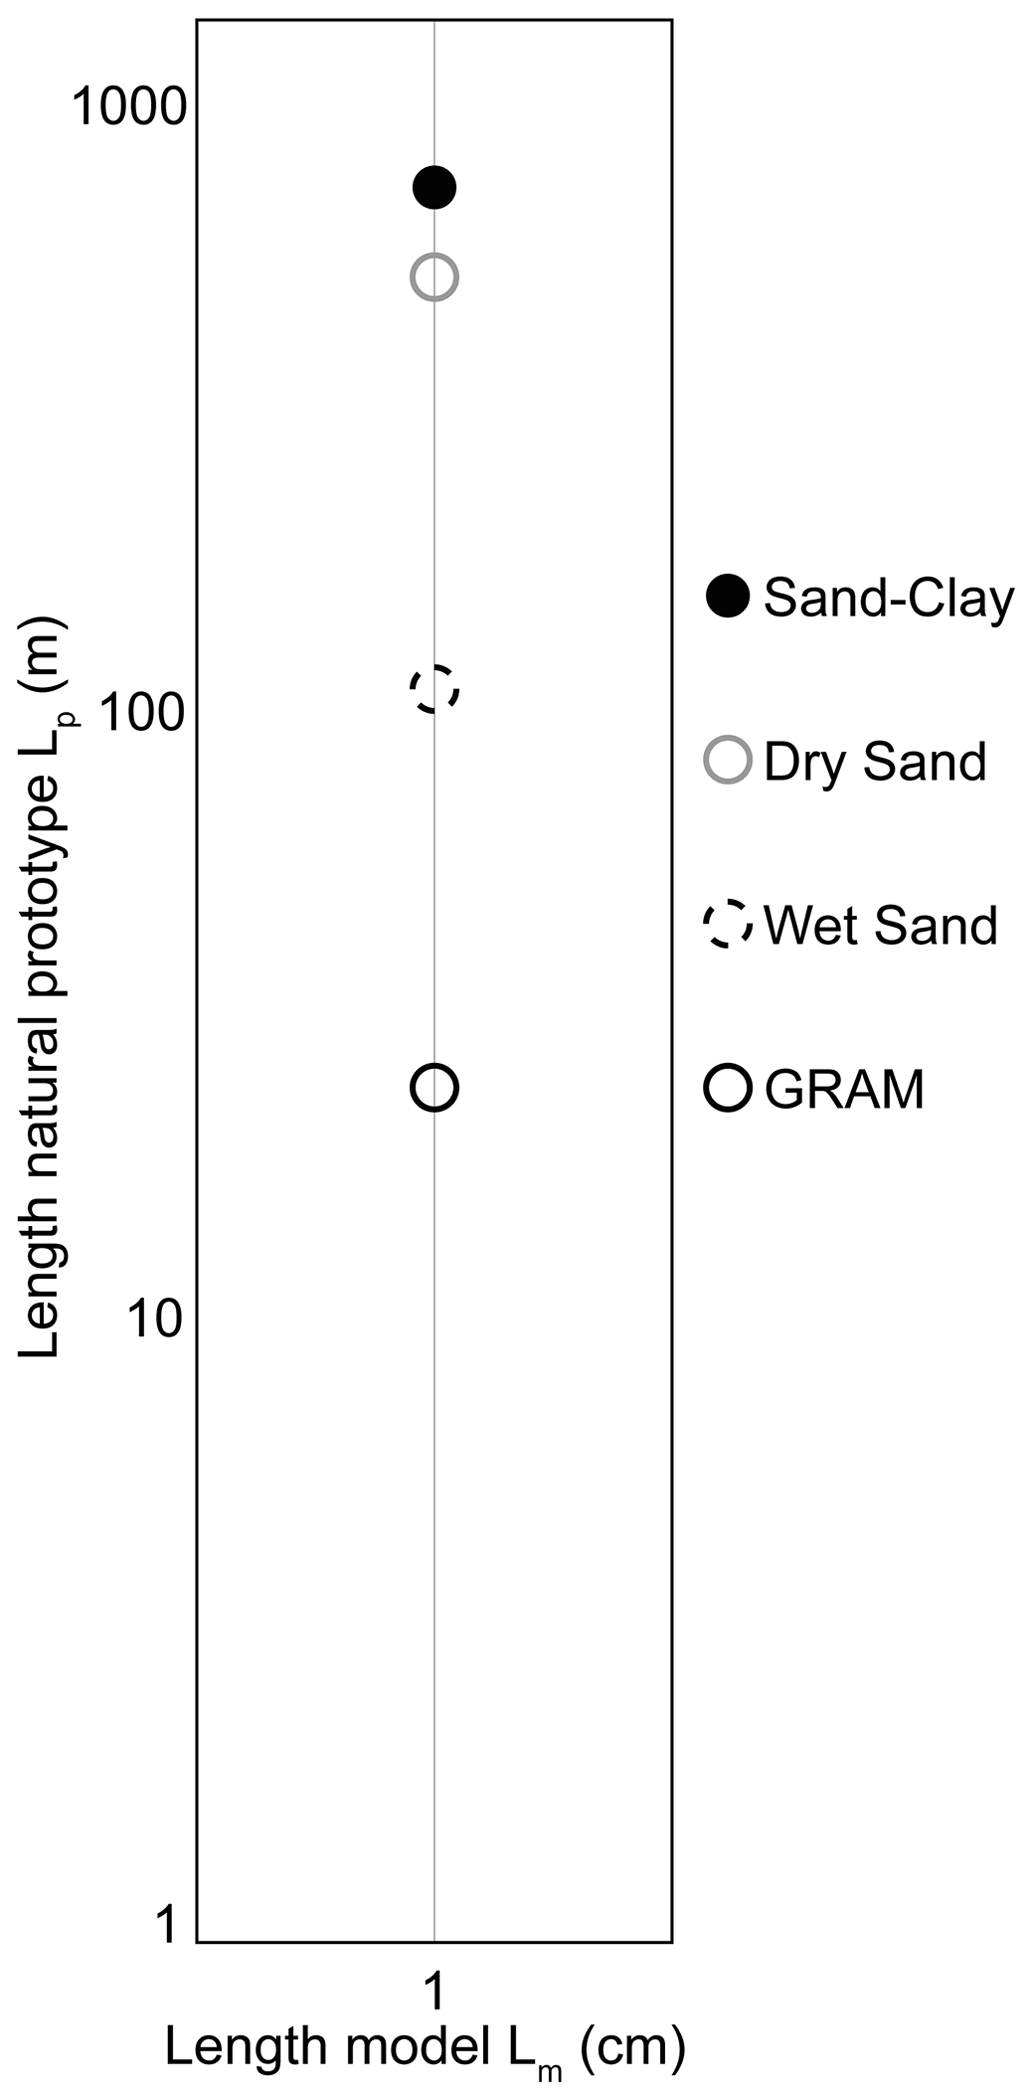
Figure 5Model resolution of the four model materials in terms of dynamically scaled geometric scaling factor (L*) calculated with respect to a sedimentary rock with 2.37 g cm−3 of density and 26.3 MPa of cohesion (Kulhawy, 1975).
The strike-slip experiments were systematically performed with the following analogue materials: sand–clay, dry sand, wet sand, and GRAM 2 %. In Table 5, the scaling factors are gathered for each of the model materials. The displacement rates of natural faults vary through time (Mouslopoulou et al., 2009), and an average value of 1.45 mm yr−1 was used for the scaling calculation.
The experiments were run for a duration and a total horizontal displacement that varied for different model materials, as summarised in Table 3. Sand–clay and dry sand models reached the maximum displacement allowed by the rig (about 15 cm), although no more discontinuities developed on the top surface once the main throughgoing fault was completely connected. The experiments with the manually driven hydraulic winch had a maximum displacement limit of 10 cm due to asymmetrical setup constraints. In the wet sand experiments, the maximum displacement was applied, whereas GRAM experiments were stopped at lower values of displacement. This was decided because of the pop-up structures developed in the sample, which with further deformation would have obstructed the surface view of the developing shear zone geometries.
In the following section, one representative experiment per material is shown in time series images of the sample surface at different values of imposed displacement. We analyse the raw stereo images (image source data), developing a structural map of the digitised fractures, and the different incremental displacement and shear strain components. These include the horizontal shear strain (εxy), z vorticity (ωz), total displacement (dt), and vertical displacement (dz) derived from the vector displacement fields. The z-vorticity data are shown in videos of the experiments (“Video supplement”), along with the videos of the total displacement and raw model surface. The vorticity represents a rotation measure in the xy plane, is independent to the orientation of the coordinate system, and can be derived from the horizontal displacement components (ux and uy) as follows:
In our models, the x axis and the y axis correspond to the long and short side of the model, respectively.
5.1 Image source data
The final models presented in Fig. 6 show the different levels of detail provided by the four model materials. The investigation, by moving from sand–clay to dry sand, wet sand, and GRAM models, corresponds to a progressive zoom-in on the fault system. The final shear zone is relatively narrower in the sand–clay model, while it reaches the highest width in the GRAM model. Consequently, the number of discontinuities developed and the complexity of the fault system increase with higher model resolutions.
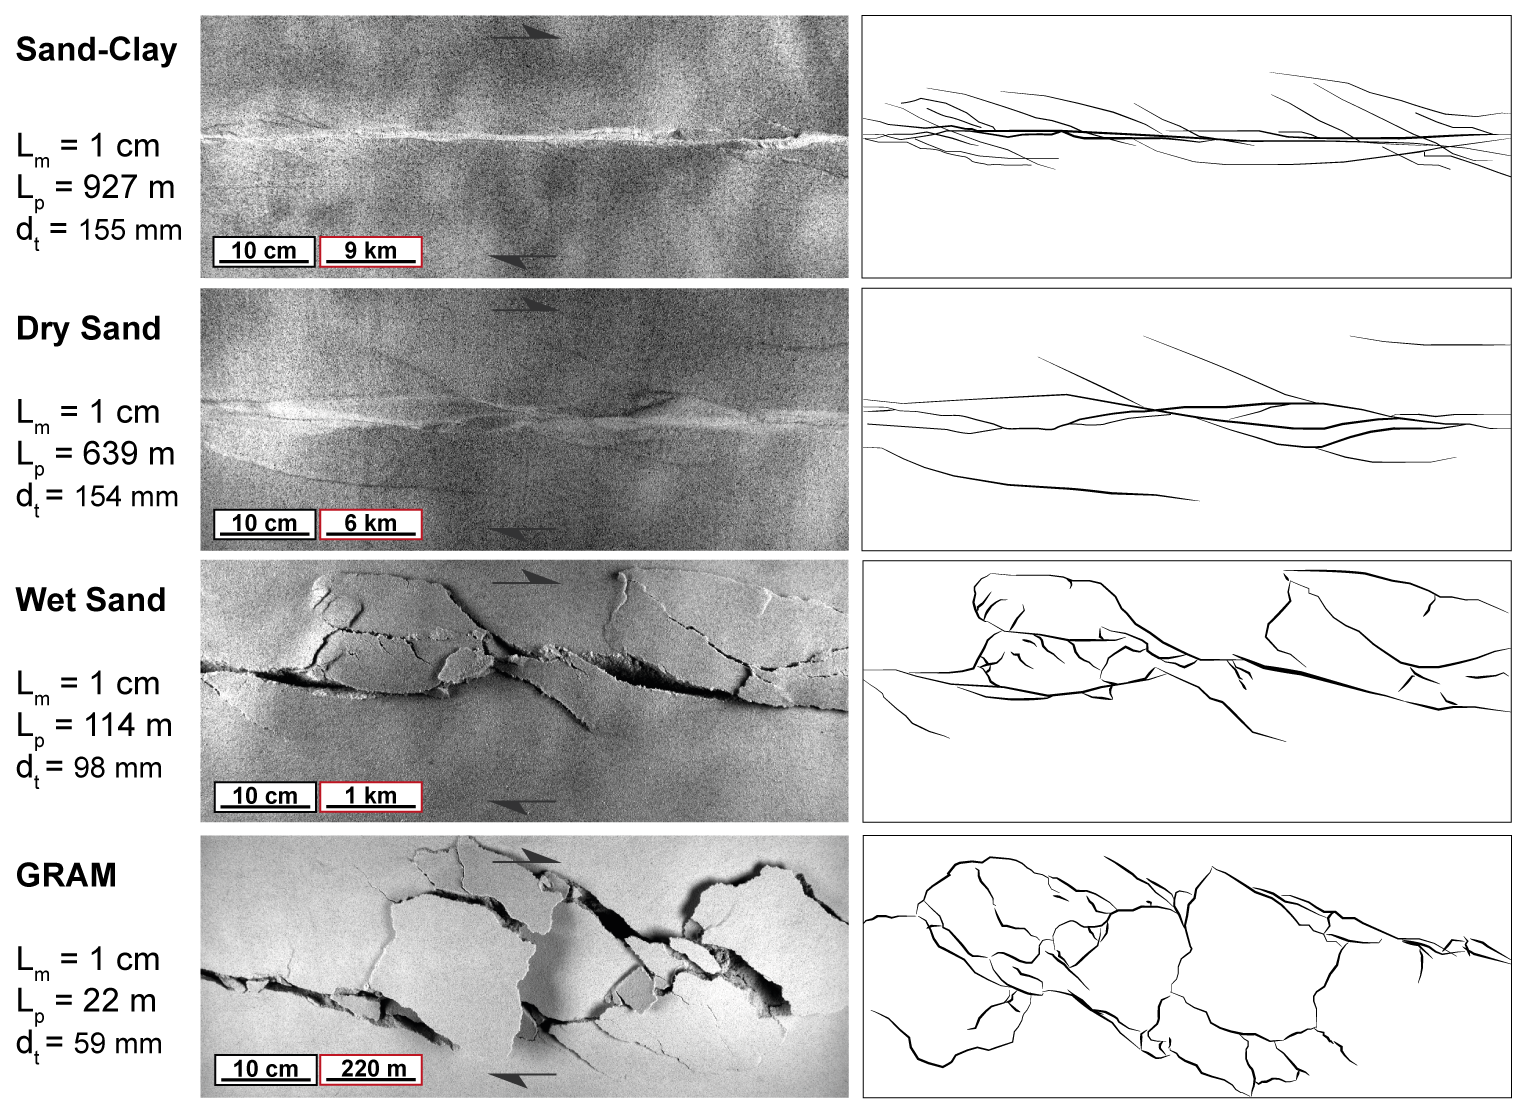
Figure 6Comparison of the final models from top-view raw images (image source data) with the structural map of the shear zone geometries. The model–prototype length equivalence () and the total displacement (dt) are reported for each model. The scale in black is related to the model. The scale in red is the corresponding scaled length in the natural prototype.
5.2 Displacement and strain analysis
The dynamic evolution of the shear zone was quantitatively analysed and compared between the four models at different values of total horizontal displacement: 2, 4, 6, 8, 10, 20, 40, and 60 mm. The total displacement (dt, mm), the shear strain εxy (%), and the vertical displacement (dz, mm) are shown in Figs. 7, 8, and 9, respectively. These displacement and strain data are calculated incrementally between each acquired image, with a fixed frame rate, as defined in Table 3. The total displacement (dt) is shown on a scale from 0 to the maximum incremental displacement (mm) obtained in that frame and with the vectors of displacement (Fig. 7). The shear strain εxy (%) is displayed with positive values (warm colours) for dextral shear sense and negative values (cold colours) indicating sinistral shear sense. The vertical (z) displacement (dz) is shown in millimetres (mm), with the positive values (warm colours) indicating uplift and the negative values (cold colours) representing subsidence.
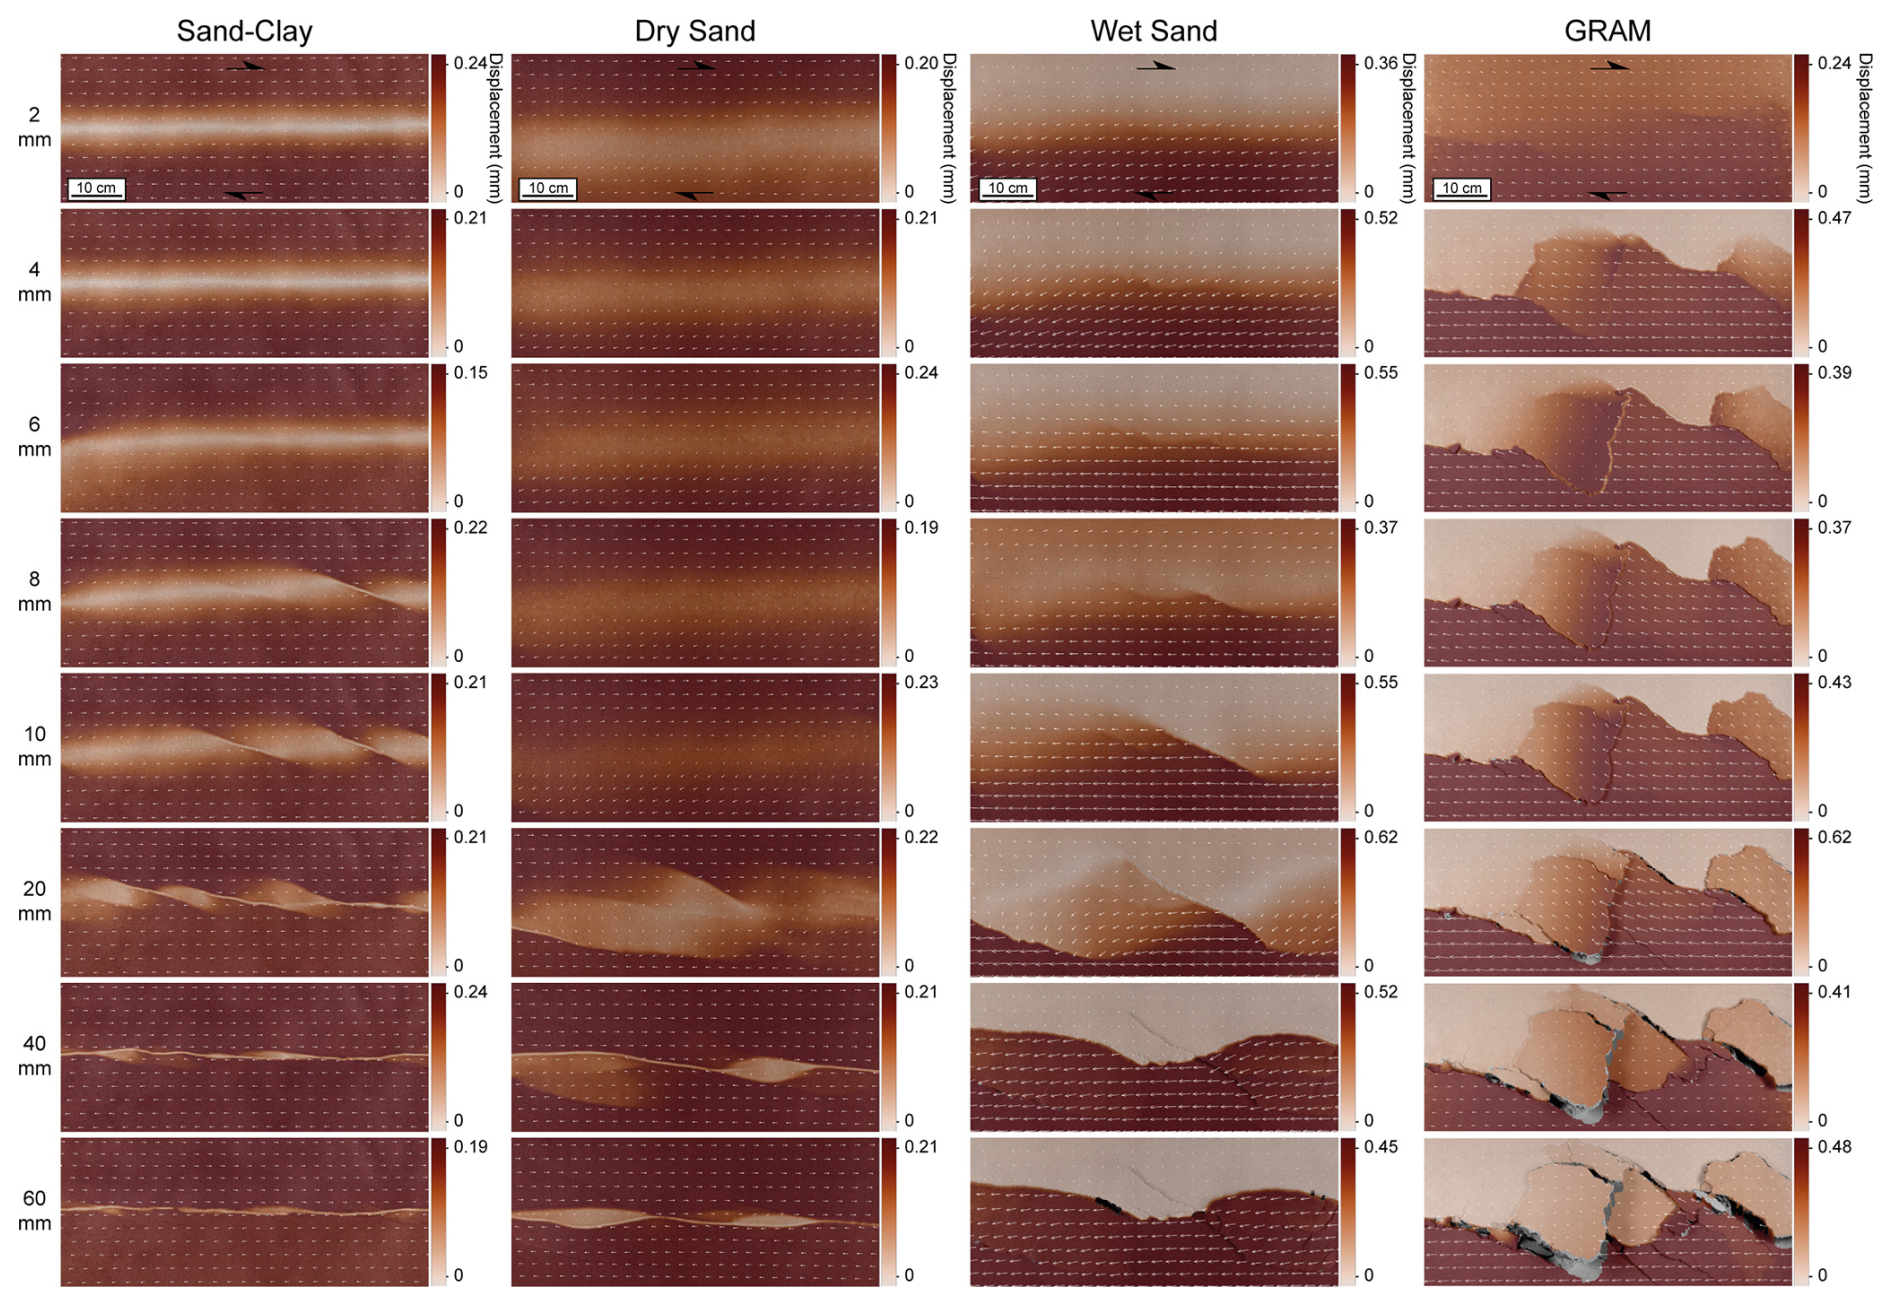
Figure 7DIC time series images of the incremental displacement field (mm) with the vectors of displacement at different values of imposed displacement for sand–clay, dry sand, wet sand, and GRAM. The incremental displacement and strain data are calculated for incremental step size values (i.e. average imposed displacement between two acquired images), as shown in Table 3.
5.2.1 Sand–clay model
In the sand–clay model (first column in Figs. 7, 8, 9), the first faults are formed in the early phases, with the shear strain clearly localised in a few structures from about 4 mm of imposed displacement. At 6 mm of displacement, three to four en échelon fractures form and then further develop (8–10 mm of displacement), increasing in length and broadening the shear zone. At 20 mm, the increase in the shear zone width stops, with the formation of Y shears (striking parallel to the boundaries of the moving base plates) that lead to the complete linkage of the major faults at 40 mm of displacement. Successively, the displacement and the shear strain are accommodated along the main throughgoing fault, and no more discontinuities develop. The areas between the main Riedel shears undergo local uplift (from 8–20 mm of imposed displacement), with the maximum values (0.06 mm) of incremental z displacement observed at 10 mm of imposed displacement. The maximum incremental shear strain (0.21 %–0.25 %) is reached at early deformation (2 mm) when no discontinuities are clearly formed yet and when the shear faults show their maximum extension and angle with respect to the direction of imposed displacement (8–10 mm).
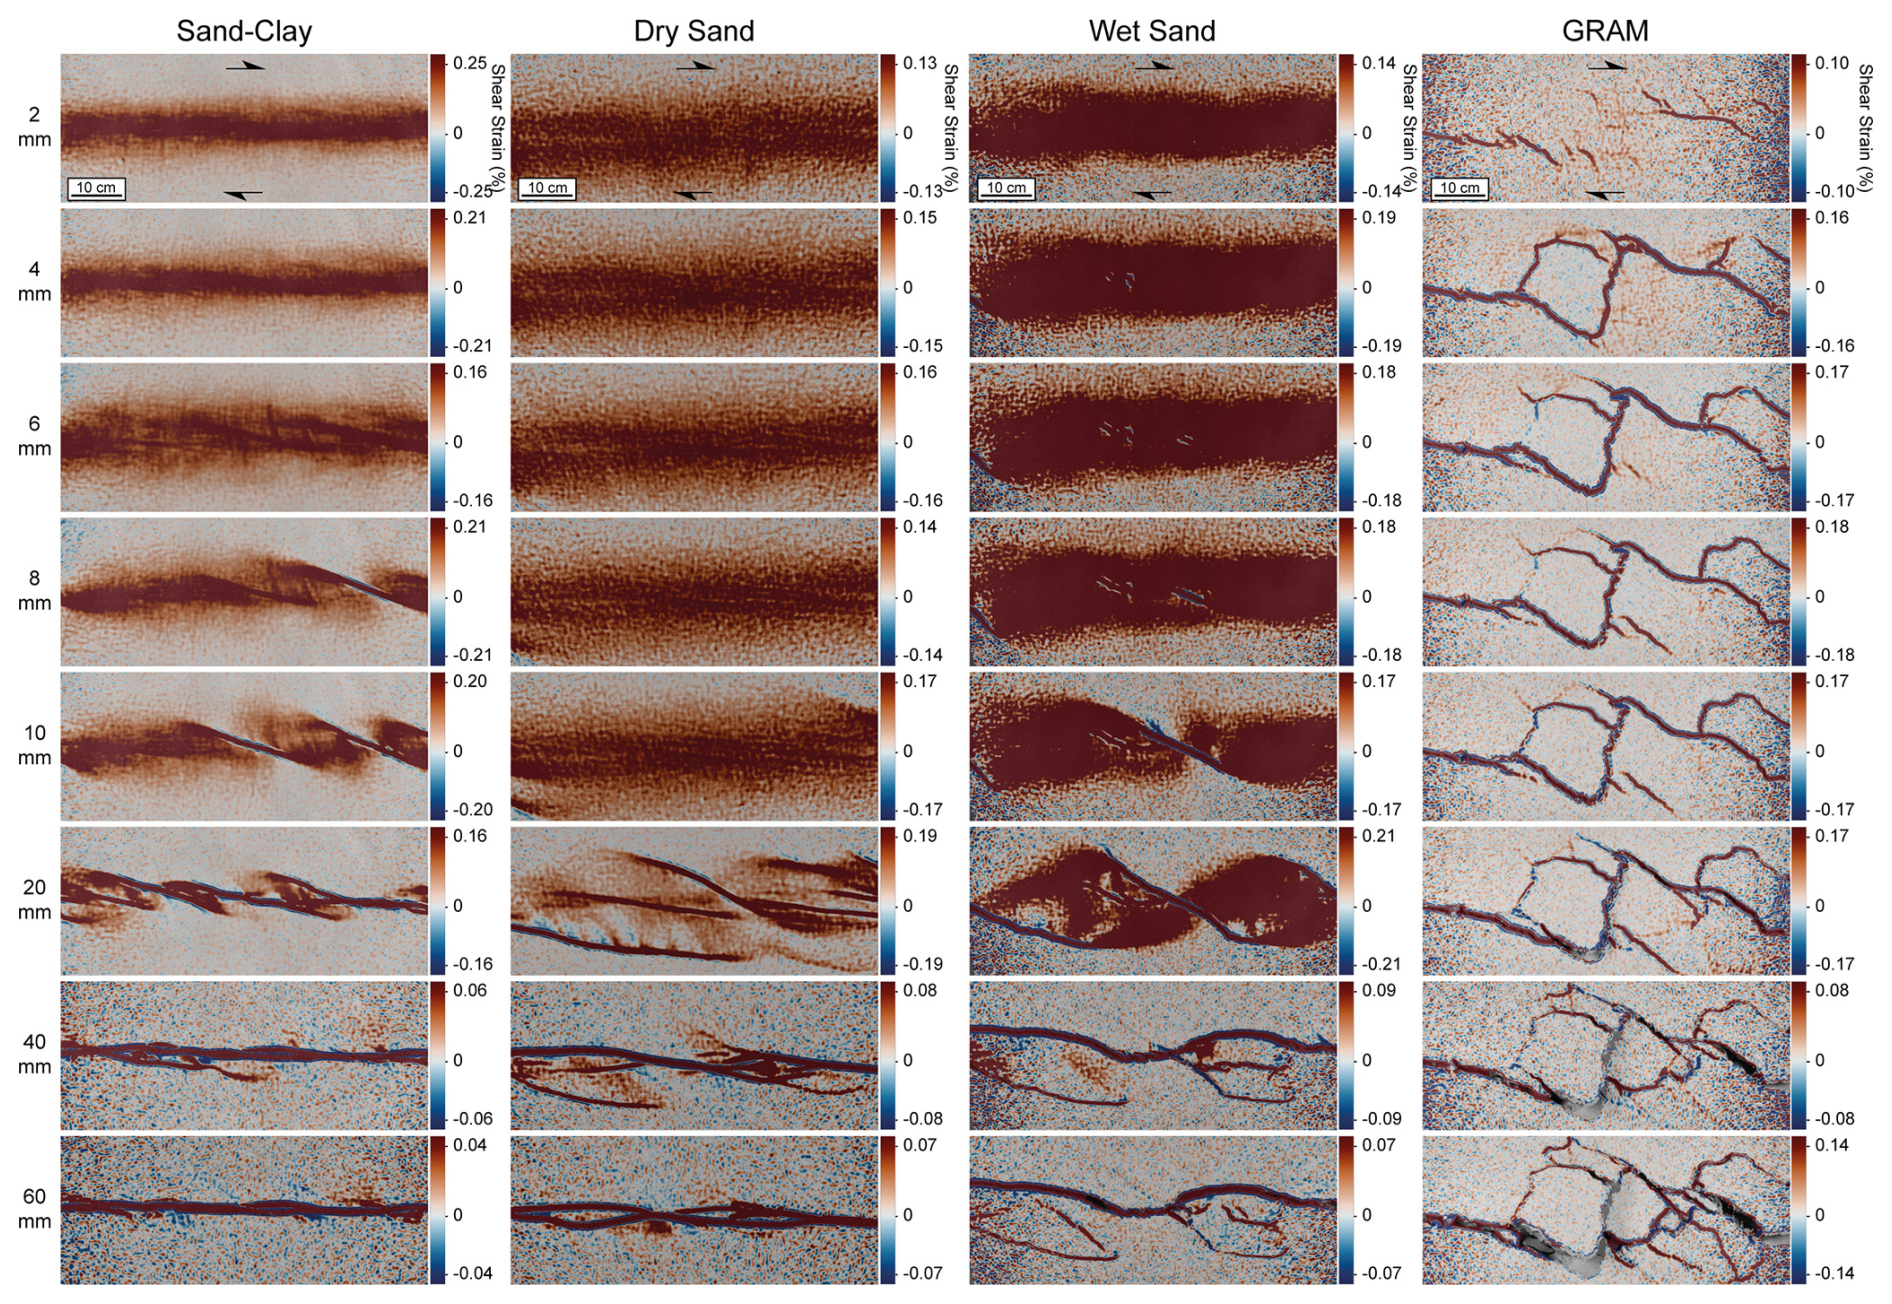
Figure 8DIC time series images of the incremental shear strain εxy (%) at different values of imposed displacement for sand–clay, dry sand, wet sand, and GRAM. The incremental displacement and strain data are calculated for incremental step size values (i.e. average imposed displacement between two acquired images), as shown in Table 3.
5.2.2 Dry sand model
In the dry sand experiment (second column in Figs. 7, 8, 9), a distributed strain field dominates up to 10 mm of imposed displacement, when the first discontinuities localise. Subsequently, the early shears further develop, temporarily increasing the shear zone width until they completely link together in a narrow primary deformation zone at 40 mm of displacement. The latter accommodates most of the subsequent displacement. Between 10–20 mm of displacement, the individual Riedel shears develop, increasing in length. After about 20–40 mm of imposed displacement, the Y shears form, linking with the early shears and completing the connection within the shear zone. The uplift (positive z displacement) is homogeneously distributed in a wide central area of the sample during the early phases (2–10 mm displacement). Successively, it is locally concentrated in individual fault blocks, with the maximum uplift rate (0.16 mm) displayed when the imposed displacement reached 10 mm. Additionally, in the final examined frames (40–60 mm), some subsidence is observed (−0.02 mm). Regarding the incremental shear strain, the maximum values (0.19 %) are reached when the shear zone shows its maximum width (at 20 mm of imposed displacement) along the main shear faults.
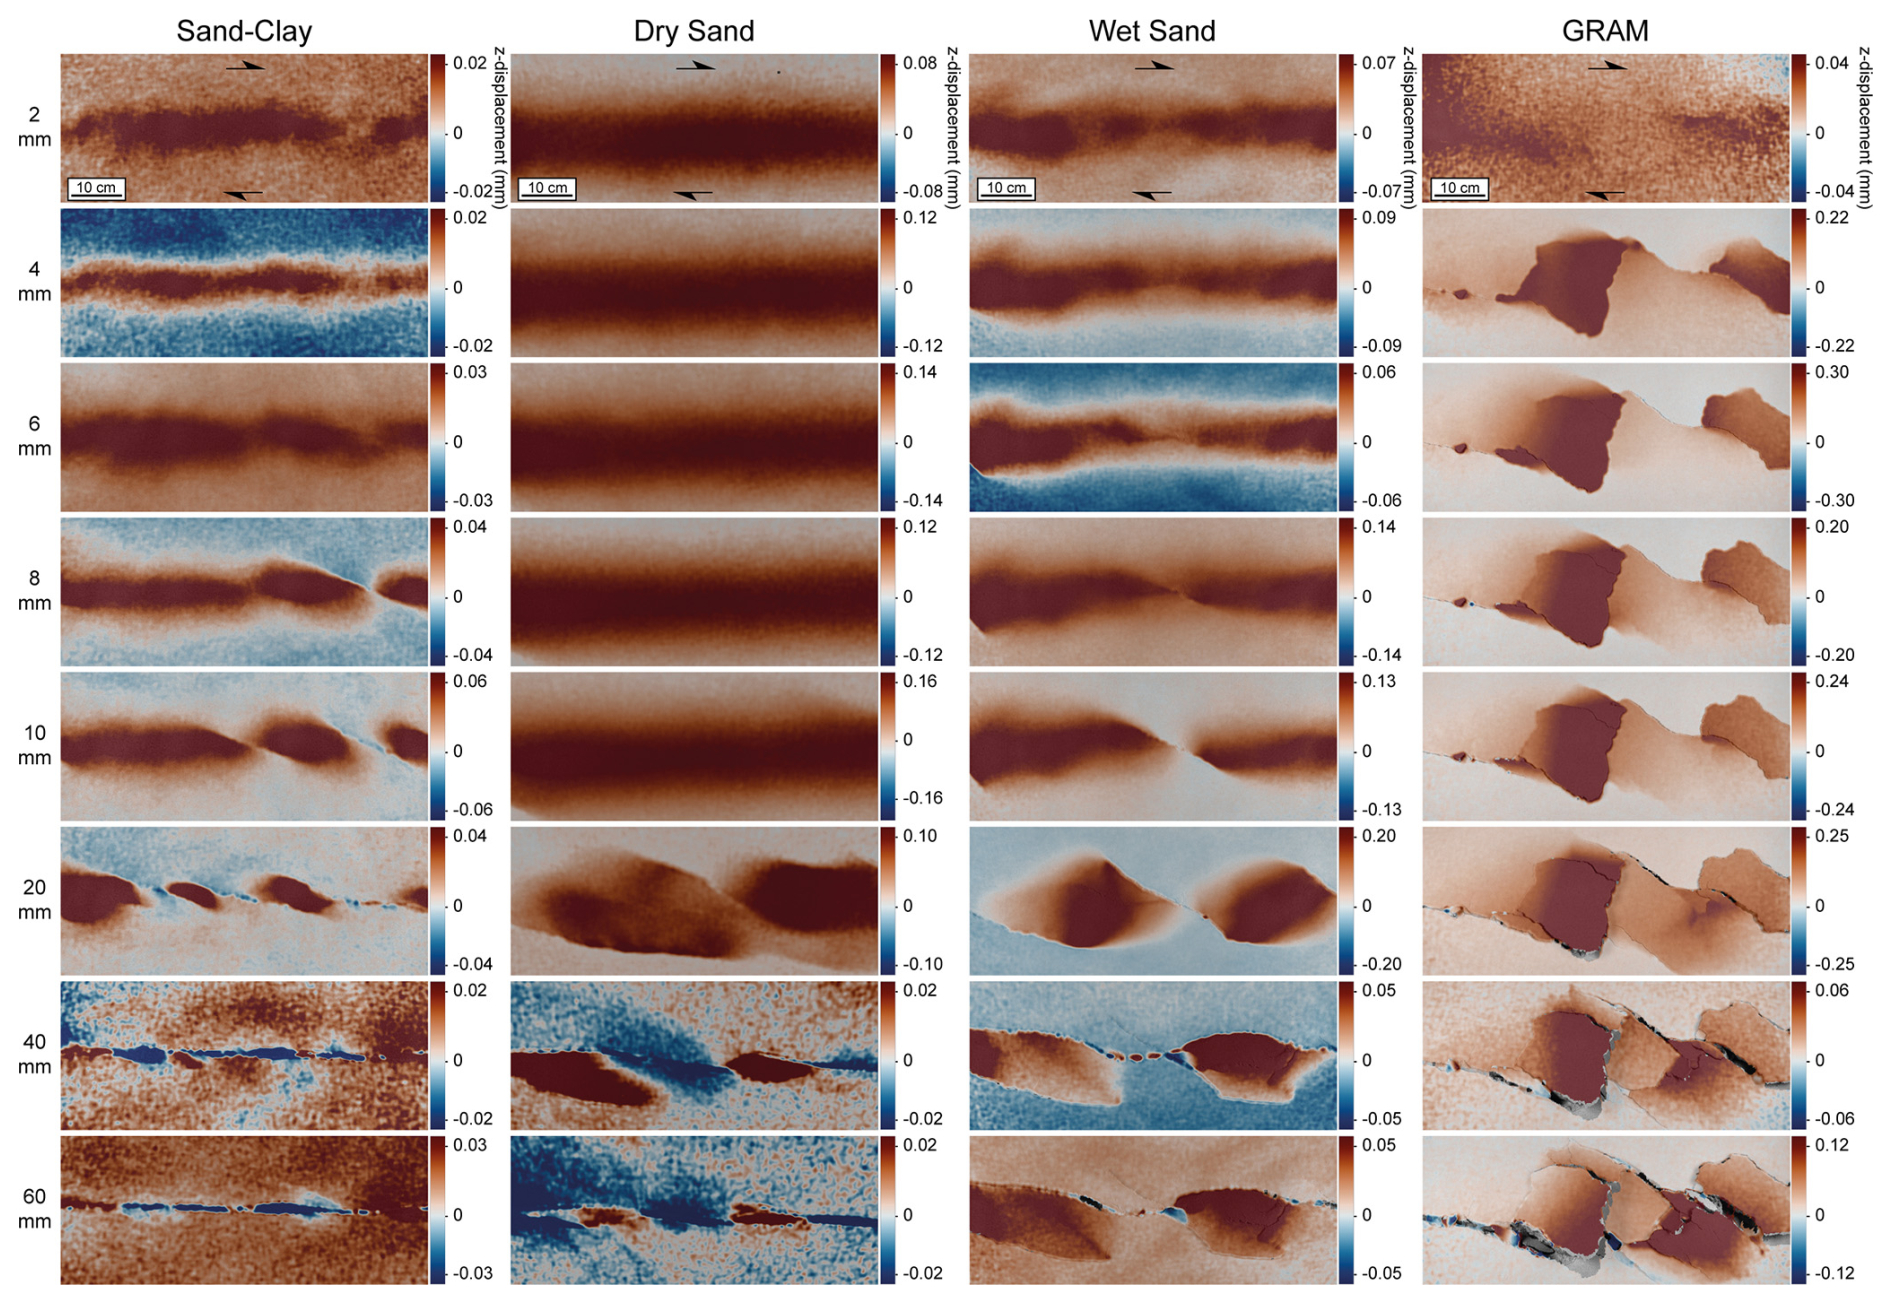
Figure 9DIC time series images of the incremental z-displacement field (mm) at different values of imposed displacement for sand–clay, dry sand, wet sand, and GRAM. The incremental displacement and strain data are calculated for incremental step size values (i.e. average imposed displacement between two acquired images), as shown in Table 3.
5.2.3 Wet sand model
In the wet sand experiment (third column in Figs. 7, 8, 9), the stress localisation starts when 4 mm of displacement is applied, when small Riedel shears form in the central part of the sample. Successively, the secondary faults increase in length, broadening the shear zone until 20 mm of imposed displacement. At this point, the shear zone width is at its maximum and Y shears develop at lower angles. A few (two to three) secondary P shears are observed in the final deformation (40–60 mm), developing at high angle between the major faults. With increasing imposed displacement, these secondary P shears link into a throughgoing fault that accommodates most of the successive displacement. Also, at 40–60 mm, sinistral sense of shear localises in a synthetic secondary fault, probably due to the rotation of the surrounding blocks. The z displacement progressively localises with the ongoing deformation (from 2 mm displacement), reaching the maximum value (0.20 mm) at 20 mm of imposed displacement. At 20 mm of imposed displacement, the incremental shear strain reaches its highest value (0.21 %), displayed by the major faults.
5.2.4 GRAM model
The GRAM experiment (fourth column in Figs. 7, 8, 9) shows an early compartmentalisation of the displacement in smaller areas defined by early R shears. The strain is localised in two main faults at 4 mm of imposed displacement. The R shears form when 2 mm of displacement is applied and quickly increase in length with further deformation. At 4–6 mm of displacement, more secondary R shears and two high-angle shears form. The latter high-angle shears provide linkage between the two early Riedel shears that connected at 6–8 mm of displacement. The shear zone reaches its maximum width at 6–8 mm of displacement, becoming progressively more complex with the formation of more R, P, and Y shears. Between 6 and 10 mm of displacement, a few antithetic R′ shears (sinistral sense of shear) develop between two main R shears. The highest percentage of dextral shear is 0.18 %, displayed along the major discontinuities. The z displacement is localised in the early phases between the main faults, defining three to four areas of local uplift. Between 10–40 mm of imposed displacement, the vertical displacement is constant, with a maximum value of 0.30 mm.
5.3 Quantitative comparison between the models
In addition to the incremental values, the cumulative displacement and strain parameters were calculated from DIC data. The total shear strain field at 40 mm of imposed displacement was compared between the models (Figs. 10). The cumulative shear strain values are shown in a min–max scale bar for the individual models, in order to highlight the occurrence of negative shear strain (left-lateral sense of shear). However, negative values at 40 mm are shown only in the GRAM model, while, in the wet sand experiment, some sinistral shear is developed between 40–60 mm of displacement (Fig. 8). The maximum values of cumulative shear strain εxy (%) gradually increase with higher model resolution, with the lowest shear strain reached in the sand–clay model (4.2 %) and the highest reached in the GRAM model (12.2 %). Similarly, the linearity of the final throughgoing primary deformation zone decreases with higher geometrical resolution of the model, with wet sand and GRAM models developing very complex final shear zones.
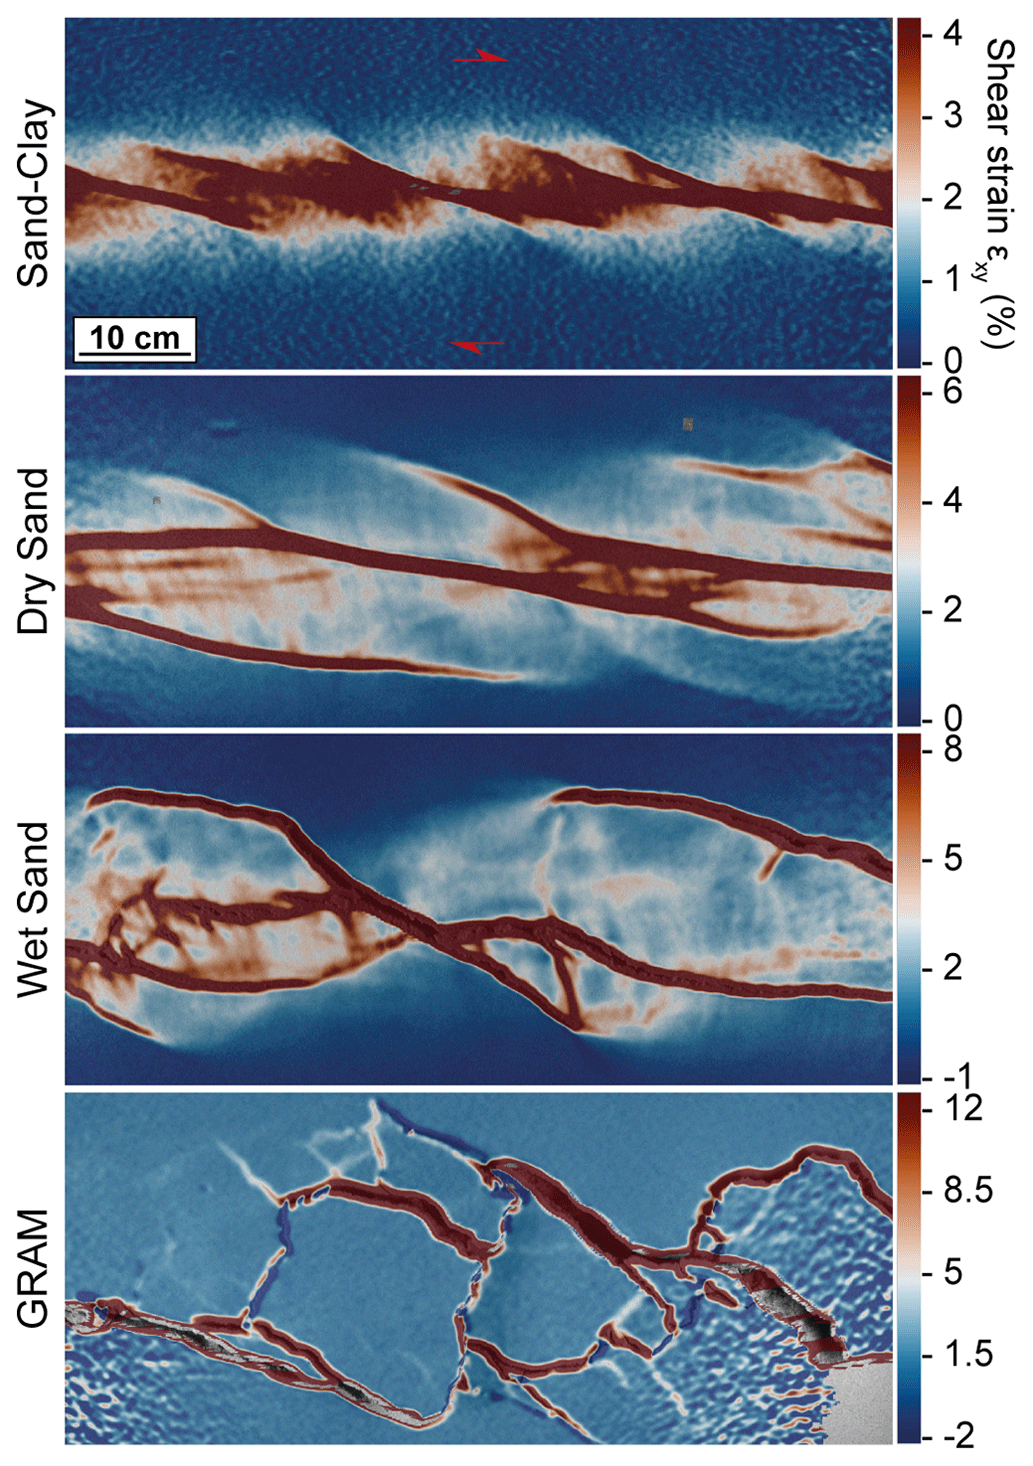
Figure 10DIC images of the total shear strain (%) accumulated at 40 mm of imposed displacement for sand–clay, dry sand, wet sand, and GRAM models.
The DIC strain monitoring of the experiments allowed a quantitative comparison of the displacement and strain evolution between the four models. The incremental values (Fig. 11a, b, c) were quantified from Figs. 7, 8, and 9, from 0 to 60 mm of total displacement. Sand–clay and dry sand models follow similar trends and with comparable values, while wet sand and GRAM models develop larger values.
The total shear strain (Fig. 11d) and total z displacement (Fig. 11e) were quantified and analysed as the maximum cumulative values recorded at the imposed displacement values analysed in Figs. 7, 8, and 9. In the GRAM experiment, the shear strain strongly increases in the early phases of deformation but shows only a minor additional increase (up to 12 % εxy) at the experiment completion. Dry sand and wet sand experiments display a similar evolution of cumulative shear strain. The GRAM model shows the highest values of total shear strain (about 12 % at 60 mm of displacement), followed by wet sand, dry sand, and sand–clay. However, all the models display the maximum shear strain rates when the individual faults develop their maximum extension, while displaying a shear strain reduction when the shear zone is fully interconnected with a major fault. The cumulative z displacement (Fig. 11e) shows a wide range of values between the four models. In detail, the GRAM model reaches the highest uplift values (35 mm), followed by wet sand (14 mm), dry sand (10 mm), and sand–clay (4 mm).
The evolution of the shear zone width was analysed at the different values of imposed displacement (Fig. 11f), quantifying the maximum width of the primary deformation zone and the width of the active shear zone with increasing imposed displacement. The evolution of the models from the formation of the early shears to the final interconnected primary fault zone is highlighted. GRAM develops the widest shear zone (∼ 228 mm), followed by wet sand (∼ 195 mm), dry sand (∼ 180 mm), and sand–clay (∼ 131 mm). In terms of active structures, in all the models, the maximum shear zone width corresponds to the maximum development in length of the early R shears. Once the main shear zones are fully interconnected, the deformation is localised in a few major discontinuities and the active shear zone width reduces. This is observed especially in the sand–clay and dry sand models.
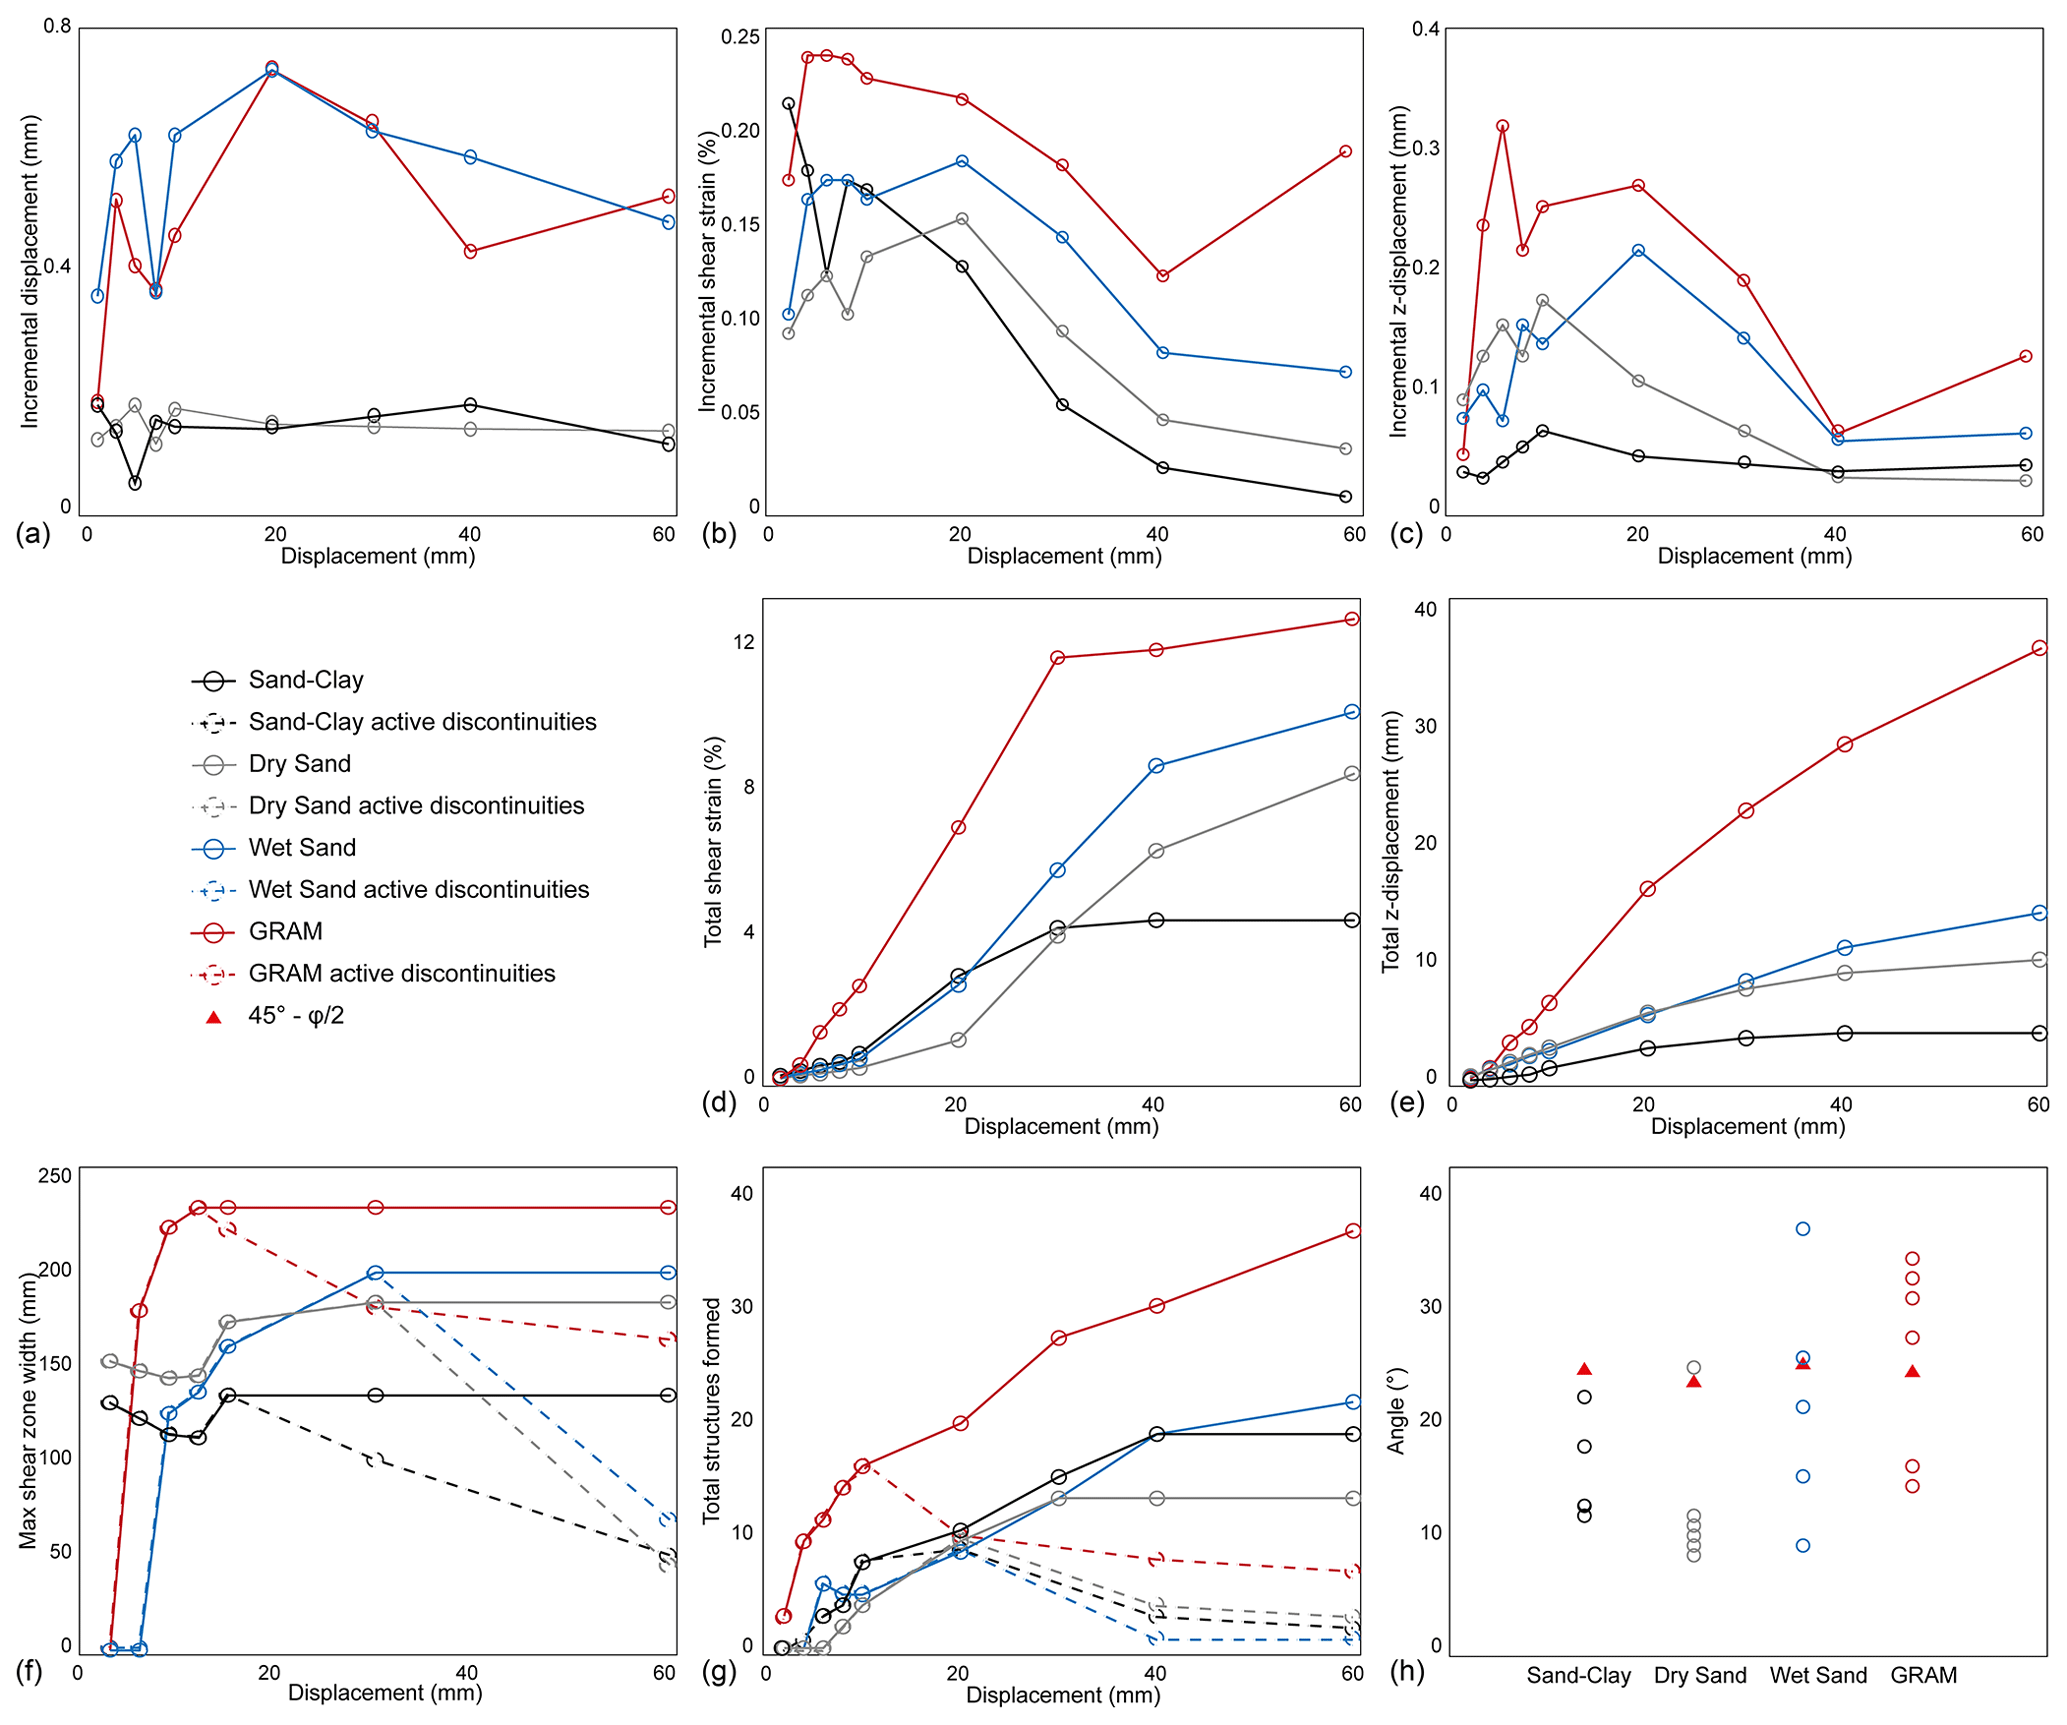
Figure 11Kinematic and dynamic evolution of the sand–clay (black), dry sand (grey), wet sand (blue), and GRAM (red) experiments. (a) Maximum incremental displacement (mm) versus displacement (mm); (b) maximum incremental shear strain (%) versus displacement (mm); (c) maximum incremental z displacement (mm) versus displacement (mm); (d) maximum cumulative shear strain (%) versus displacement (mm); (e) maximum cumulative z displacement (mm) versus displacement (mm); (f) maximum and active shear zone width (mm) versus displacement (mm); (g) cumulative number of discontinuities and active discontinuities versus displacement (mm); (h) angle of the shears (absolute values) with respect to the direction of the imposed displacement. φ is the angle of internal friction of each material.
Furthermore, the number of active and total discontinuities (i.e. fractures, shears) formed on the sample surfaces were analysed (Fig. 11g). GRAM developed the most complex shear zone, with the highest number of distinct discontinuities formed during the experiment, followed by wet sand, sand–clay, and dry sand. The number of discontinuities active at the same time has a similar trend for the four models. The GRAM final model developed nearly 40 individual discontinuities, with a maximum of about 15 faults active at the same time. On the other hand, the dry sand model developed the lowest number of discontinuities in the final model (a total of 12).
Finally, the angles at which the fractures formed with respect to the imposed direction of displacement (σ1) were measured on the sample surface at the moment they formed (Fig. 11h). According to the Coulomb criterion, the orientations of the potential fault planes in a perfect homogeneous and isotropic material make an angle of to the direction of the maximum principal stress (σ1). In general, the GRAM model developed discontinuities at higher angles with respect to the other models, including the early R shears and some high-angle synthetic shears. Sand–clay and dry sand models display the lowest angles, on average.
The differences between the four models were observed both in the geometry of the final shear zones (Fig. 6) and during their evolution with increasing imposed displacement (Figs. 7, 8, 9). In general, the evolution of the shear zone followed similar key steps in all the models while showing details of different kinematics and dynamics. The individual shears form in the central part of the incipient shear zone and then develop in length with increasing displacement, eventually linking together to form a fully interconnected shear zone. The level of structural detail is different between the four models and has a critical impact on what can be observed and measured during the kinematic and dynamic evolution of the models. With lower geometric scaling (i.e. from sand–clay to GRAM models), and therefore higher spatial resolution, the observation of more complex processes within the primary deformation zone is enabled. Although the fault and fracture systems display self-similar scale-invariant geometries (Barton and Larsen, 1985; Barton and Zoback, 1992), the multi-scale investigation could improve the understanding of the kinematic and dynamic aspects of such complex deformation processes.
Beyond the complexity of the shear zone developed in the four models, the other main differences observed were the distribution and localisation of the strain and the formation of the pop-up structures.
6.1 Strain localisation
The strain localisation occurs at low values of imposed displacement for wet sand and GRAM experiments (Figs. 7, 8, 9), with the formation of several R shears. In the sand–clay and dry sand models, the deformation is distributed in a wide and continuous shear zone, with no distinct discontinuities developed in the early phases of the experiments (Figs. 7, 8, 9). However, in the sand–clay model, the strain is localised earlier with respect to the dry sand model.
Additionally, the cumulative shear strain patterns enabled the identification of the high-strain structures formed during the experiment (Figs. 10). These show that, in sand–clay, dry sand, and wet sand models, the early faults that accommodated most of the shear strain are successively deactivated by the complete interconnection of the shear zone. At this point, most of the shear strain takes place along the main throughgoing linked fault zone. The latter develops at a lower angle with respect to the early R shears and is nearly parallel to the direction of the imposed displacement (σ1). This is observed less in the GRAM models, at least on the sample top surface, where the strain is distributed between various interconnected faults that accommodate most of the displacement until the end of the experiment (Figs. 10). This is also reflected by the active shear zone width (Fig. 11f) and number of active discontinuities (Fig. 11g) in the final displacement. The maximum number of active fractures has been observed at 10–20 mm of displacement, which corresponds to the formation of the main R shears preceding the progressive linkage of the main faults. The latter concentrates the shear zone activity in a few major faults in all the models, except for GRAM.
Furthermore, the active shear zone width displayed in the models confirms that the dry sand model shows the largest total/active width reduction and that the GRAM model shows the lowest. In fact, the activity of the final (fully interconnected) shear zone is limited to 24 % of the total developed width for the dry sand model, 34 % thereof for wet sand, 37 % thereof for sand–clay, and 70 % thereof for GRAM. This can be explained by the different levels of detail provided by the models with higher resolution but also by the fact that the experiments performed with wet sand and GRAM undergo an imposed displacement that is not sufficient to complete the evolution of the shear zone, due to the limitations of the rig settings. Wet sand and GRAM experiments, if run for higher displacement values, would most probably reach the same conditions observed in the sand–clay and dry sand models, with the concentration of the displacement on one main throughgoing fault. Therefore, this aspect should be further investigated in the future.
6.2 Uplift structures
In the GRAM experiment, several pop-up structures developed in the early phases of displacement and increased in dimension until the end of the experiment. This trend is reflected in the incremental and cumulative z-displacement evolution observed during the experiments (Fig. 11c, e). This aspect represents a partial limit of the GRAM experiment setup that determines a forced earlier termination of the experiments to preserve the developed structures (Massaro et al., 2022). The values of vertical displacement clearly depend on the cohesive strength of the materials. Therefore, this reflects the tendency of high-cohesion materials to form rigid pop-up structures, which are continuously uplifted due to the 3D in-depth curved geometries of the strike-slip faults. Overall, in all the models, negative z displacement (subsidence) is rarely observed. In some cases, low negative values are displayed, corresponding to small collapses of the structures that became unstable because of the uplift while approaching the final imposed displacement.
In this study, strike-slip experiments were systematically performed with four different model materials. The comparison between the models aimed to highlight the impact of the material mechanical properties on the physical simulation. The four model materials (sand–clay, dry sand, wet sand, and GRAM) were characterised by different physical and mechanical properties while showing a non-linear strain-dependent behaviour similar to brittle rocks and providing different dynamically scaled geometric scaling factors (in terms of model/prototype length equivalence).
Although fault and fracture systems are characterised by a self-similar distribution across the scales, the multi-scale comparison between the models enabled the observation of different kinematic and dynamic characteristics of the developed strike-slip shear zones. From the larger-scale to the smaller-scale models, the investigation corresponded to a magnification of the shear zone, with increasing complexity of the fault damage zone.
Some of the quantified geometric and kinematic parameters showed a positive relationship with the model resolution. From the largest (sand–clay) to smallest (GRAM) scale, higher values of shear strain, z displacement, shear zone width, and the number of fractures developed were observed. The patterns of strain distribution/localisation displayed higher concentration along fewer discontinuities for the sand–clay and dry sand models, while, in the wet sand and GRAM models, the strain was distributed into a more complex network of shears. In all cases, a turning point in the deformation process was represented by the complete interconnection of the primary deformation zone with the development of a main throughgoing fault. The latter tended to concentrate the strain accommodating all the following displacement, especially in the sand–clay and dry sand models.
The multi-scale comparison between the models showed how the choice of the analogue material applied in the experiment, its physical and mechanical properties, and the consequent scale of observation critically influence the investigation. Such multi-scale approaches can enhance the comprehension of complex brittle deformation processes in dynamically scaled experiments. The application of GRAM in dynamically scaled experiments allows greater detail on the analysis of the fault–fracture processes occurring within the fault core and fault damage zones.
The data that support the findings of this study are available from the corresponding author upon request.
The videos of the experiments are available at https://doi.org/10.5446/s_1908 (Massaro et al., 2025).
LM, JA, EJ, SN, and YY performed the measurements; LM and JA analysed the data; LM wrote the draft; LM, JA, and YY reviewed and edited the article; and JA acquired the funding.
The contact author has declared that none of the authors has any competing interests.
Publisher’s note: Copernicus Publications remains neutral with regard to jurisdictional claims made in the text, published maps, institutional affiliations, or any other geographical representation in this paper. While Copernicus Publications makes every effort to include appropriate place names, the final responsibility lies with the authors.
This paper includes work conducted during a PhD study undertaken as part of the Natural Environment Research Council (NERC) Centre for Doctoral Training (CDT) in Oil and Gas (grant no. NE/M00578X/1) sponsored by Royal Holloway University of London, whose support is gratefully acknowledged. We extend our thanks to Kevin D'Souza for the photos and for the constructive discussions and to Jerry Morris for the engineering support at RHUL Analogue Tectonic Modelling Laboratories. We would like to thank the reviewers Jacqueline Reber and Guido Schreurs and the editor Susanne Buiter for their constructive comments and suggestions that helped increase the quality and clarity of this contribution.
This research has been supported by the Natural Environment Research Council (NERC) Centre for Doctoral Training (CDT) in Oil and Gas (grant no. NE/M00578X/1) sponsored by Royal Holloway University of London.
This paper was edited by Susanne Buiter and reviewed by Jacqueline Reber and Guido Schreurs.
Adam, J., Lohrmann, J., Hoth, S., Kukowski, N., and Oncken, O.: Strain variation and partitioning in thrust wedges: High-resolution data from scaled sandbox experiments by 2D-3D PIV analysis, B. Geofis. Teor. Appl., 42, 123–126, 2002.
Adam, J., Klinkmüller, M., Schreurrs, G., and Wieneke, B.: 4D Simulation of Shear localization and Strain History in Fault systems: Insights from physical experiments, X-ray computed tomography and tomographic digital image correlation, J. Struct. Geol., 55, 127–149, https://doi.org/10.1016/j.jsg.2013.07.011, 2013.
Adam, J., Urai, J. L., Wieneke, B., Oncken, O., Pfeiffer, K., Kukowski, N., Lohrmann, J., Hoth, S., van der Zee, W., and Schmatz, J.: Shear localisation and strain distribution during tectonic faulting – new insights from granular-flow experiments and high-resolution optical image correlation techniques, J. Struct. Geol., 27, 283–301, https://doi.org/10.1016/j.jsg.2004.08.008, 2005.
Barton, C. A. and Zoback, M. D.: Self-similar distribution and properties of macroscopic fractures at depth in crystalline rock in the Cajon Pass Scientific Drill Hole, J. Geophys. Res.-Sol. Ea., 97, 5181–5200, https://doi.org/10.1029/91JB01674, 1992.
Barton, C. C. and Larsen, E.: Fractal geometry of two-dimensional fracture networks at Yucca Mountain, south-western Nevada, in: Proceedings of the international symposiumon fundamental sofrock joints, Bjorkliden, Sweden, 77–84, 1985.
Billi, A., Salvini, F., and Storti, F.: The damage zone-fault core transition in carbonate rocks: implications for fault growth, structure and permeability, J. Struct. Geol., 25, 1779–1794, https://doi.org/10.1016/S0191-8141(03)00037-3, 2003.
Bisdom, K., Gauthier, B. D. M., Bertotti, G., and Hardebol, N. J.: Calibrating discrete fracture-network models with a carbonate three-dimensional outcrop fracture network: Implications for naturally fractured reservoir modeling, AAPG Bull., 98, 1351–1376, https://doi.org/10.1306/02031413060, 2014.
Bonini, L., Sokoutis, D., Mulugeta, G., and Katrivanos, E.: Modelling hanging wall accommodation above rigid thrust ramps, J. Struct. Geol., 22, 1165–1179, https://doi.org/10.1016/S0191-8141(00)00033-X, 2000.
Byerlee, J.: Friction of rocks, Pure Appl. Geophys., 116, 615–626, 1978.
Cacciari, P. P. and Futai, M. M.: Modeling a Shallow Rock Tunnel Using Terrestrial Laser Scanning and Discrete Fracture Networks, Rock Mech. Rock Eng., 50, 1217–1242, https://doi.org/10.1007/s00603-017-1166-6, 2017.
Caniven, Y., Dominguez, S., Soliva, R., Cattin, R., Peyret, M., Marchandon, M., Romano, C., and Strak, V.: A new multilayered visco-elasto-plastic experimental model to study strike-slip fault seismic cycle, Tectonics, 34, 232–264, https://doi.org/10.1002/2014TC003701, 2015.
Casas, A. M., Gapais, D., Nalpas, T., Besnard, K., and Román-Berdiel, T.: Analogue models of transpressive systems, J. Struct.l Geol., 23, 733–743, https://doi.org/10.1016/S0191-8141(00)00153-X, 2001.
Childs, C., Nicol, A., Walsh, J. J., and Watterson, J.: Growth of vertically segmented normal faults, J. Struct. Geol., 18, 1389–1397, https://doi.org/10.1016/S0191-8141(96)00060-0, 1996.
Choi, J.-H., Edwards, P., Ko, K., and Kim, Y.-S.: Definition and classification of fault damage zones: A review and a new methodological approach, Earth-Sci. Rev., 152, 70–87, https://doi.org/10.1016/j.earscirev.2015.11.006, 2016.
Corti, G., Moratti, G., and Sani, F.: Relations between surface faulting and granite intrusions in analogue models of strike-slip deformation, J. Struct. Geol., 27, 1547–1562, https://doi.org/10.1016/j.jsg.2005.05.011, 2005.
Corti, G., Nencini, R., and Skyttä, P.: Modelling the influence of pre-existing brittle fabrics on the development and architecture pull-apart basins, J. Struct. Geol., 131, 103937, https://doi.org/10.1016/j.jsg.2019.103937, 2020.
Crider, J. G. and Peacock, D. C. P.: Initiation of brittle faults in the upper crust: a review of field observations, J. Struct. Geol., 26, 691–707, https://doi.org/10.1016/j.jsg.2003.07.007, 2004.
Dooley, T. and McClay, K.: Analog Modeling of Pull-Apart Basins1, AAPG Bull., 81, 1804–1826, https://doi.org/10.1306/3B05C636-172A-11D7-8645000102C1865D, 1997.
Dooley, T. P. and Schreurs, G.: Analogue modelling of intraplate strike-slip tectonics: A review and new experimental results, Tectonophysics, 574/575, 1–71, https://doi.org/10.1016/j.tecto.2012.05.030, 2012.
Faulkner, D. R., Jackson, C. A. L., Lunn, R. J., Schlische, R. W., Shipton, Z. K., Wibberley, C. A. J., and Withjack, M. O.: A review of recent developments concerning the structure, mechanics and fluid flow properties of fault zones, J. Struct. Geol., 32, 1557–1575, https://doi.org/10.1016/j.jsg.2010.06.009, 2010.
Fedorik, J., Zwaan, F., Schreurs, G., Toscani, G., Bonini, L., and Seno, S.: The interaction between strike-slip dominated fault zones and thrust belt structures: Insights from 4D analogue models, J. Struct. Geol., 122, 89–105, https://doi.org/10.1016/j.jsg.2019.02.010, 2019.
Galland, O., Cobbold, P. R., Hallot, E., de Bremond d'Ars, J., and Delavaud, G.: Use of vegetable oil and silica powder for scale modelling of magmatic intrusion in a deforming brittle crust, Earth Planet. Sc. Lett., 243, 786–804, https://doi.org/10.1016/j.epsl.2006.01.014, 2006.
González-Muñoz, S., Schreurs, G., Schmid, T. C., and Martín-González, F.: Influence of lateral heterogeneities on strike-slip fault behaviour: insights from analogue models, Solid Earth, 15, 1509–1523, https://doi.org/10.5194/se-15-1509-2024, 2024.
González, D., Pinto, L., Peña, M., and Arriagada, C.: 3D deformation in strike-slip systems: Analogue modelling and numerical restoration, Andean Geol., 39, 295–316, 2012.
Handin, J.: Handbook of Physical Constants, Geol. Soc. Am. Mem., 97, 223–290, https://doi.org/10.1130/MEM97-p223, 1966.
Harris, L. B. and Koyi, H. A.: Centrifuge modeling of folding in high-grade rocks during rifting, J. Struct. Geol., 25, 291–305, 2003.
Hatem, A. E., Cooke, M. L., and Toeneboehn, K.: Strain localization and evolving kinematic efficiency of initiating strike-slip faults within wet kaolin experiments, J. Struct. Geol., 101, 96–108, https://doi.org/10.1016/j.jsg.2017.06.011, 2017.
Hubbert, M. K.: Theory of scale models as applied to the study of geologic structures, Geol. Soc. Am. Bull., 48, 1459–1519, 1937.
Jaeger, J. C., Cook, N. G. W., and Zimmerman, R.: Fundamentals of Rock Mechanics, 4th Edn., Blackwell Publishing, Oxford, http://refhub.elsevier.com/S0040-1951(18)30250-6/rf0325 (last access: 22 November 2024), 2007.
Kim, Y.-S., Peacock, D. C. P., and Sanderson, D. J.: Fault damage zones, J. Struct. Geol., 26, 503–517, https://doi.org/10.1016/j.jsg.2003.08.002, 2004.
Klinkmüller, M., Schreurs, G., Rosenau, M., and Kemnitz, H.: Properties of granular analogue model materials: A community wide survey, Tectonophysics, 684, 23–38, https://doi.org/10.1016/j.tecto.2016.01.017, 2016.
Krezsek, C., Adam, J., and Grujic, D.: Mechanics of Fault and Expulsion Rollover Systems Developed on Passive Margins Detached on Salt, Insights from Analogue Modelling and Optical Strain Monitoring, Vol. 292, Geological Society Special Publications, 103–121, https://doi.org/10.1144/SP292.6, 2007.
Krstekanić, N., Willingshofer, E., Broerse, T., Matenco, L., Toljić, M., and Stojadinovic, U.: Analogue modelling of strain partitioning along a curved strike-slip fault system during backarc-convex orocline formation: Implications for the Cerna-Timok fault system of the Carpatho-Balkanides, J. Struct. Geol., 149, 104386, https://doi.org/10.1016/j.jsg.2021.104386, 2021.
Kulhawy, F. H.: Stress deformation properties of rock and rock discontinuities, Eng. Geol., 9, 327–350, https://doi.org/10.1016/0013-7952(75)90014-9, 1975.
Lambert, C., Thoeni, K., Giacomini, A., Casagrande, D., and Sloan, S.: Rockfall Hazard Analysis From Discrete Fracture Network Modelling with Finite Persistence Discontinuities, Rock Mech. Rock Eng., 45, 871–884, https://doi.org/10.1007/s00603-012-0250-1, 2012.
Lohrmann, J., Kukowski, N., Adam, J., and Oncken, O.: The impact of analogue material properties on the geometry, kinematics, and dynamics of convergent sand wedges, J. Struct. Geol., 25, 1691–1711, 2003.
Mammoliti, E., Pepi, A., Fronzi, D., Morelli, S., Volatili, T., Tazioli, A., and Francioni, M.: 3D Discrete Fracture Network Modelling from UAV Imagery Coupled with Tracer Tests to Assess Fracture Conductivity in an Unstable Rock Slope: Implications for Rockfall Phenomena, Remote Sens., 15, 1222, https://doi.org/10.3390/rs15051222, 2023.
Mandl, G.: Mechanics of tectonic faulting: Models and basic concepts, Developments in structural geology, Elsevier, New York, 407 pp., http://refhub.elsevier.com/S0191-8141(16)30198-5/sref130 (last access: 19 June 2024), 1988.
Marcher, T. and Vermeer, P. A.: Macromodelling of softening in non-cohesive soils, in: Continuous and Discontinuous Modelling of Cohesive-Frictional Materials, edited by: Vermeer, P. A., Herrmann, H. J., Luding, S., Ehlers, W., Diebels, S., and Ramm, E., Springer Berlin Heidelberg, Berlin, Heidelberg, 89–110, https://doi.org/10.1007/3-540-44424-6_7, 2001.
Massaro, L., Corradetti, A., Tramparulo, F. d. A., Vitale, S., Prinzi, E. P., Iannace, A., Parente, M., Invernizzi, C., Morsalnejad, D., and Mazzoli, S.: Discrete Fracture Network Modelling in Triassic–Jurassic Carbonates of NW Lurestan, Zagros Fold-and-Thrust Belt, Iran, Geosciences, 9, 496, https://doi.org/10.3390/geosciences9120496, 2019.
Massaro, L., Adam, J., Jonade, E., and Yamada, Y.: New granular rock-analogue materials for simulation of multi-scale fault and fracture processes, Geol. Mag., 159, 2036–2059, https://doi.org/10.1017/S0016756821001321, 2022.
Massaro, L., Adam, J., and Yamada, Y.: Mechanical characterisation of new Sand-Hemihydrate rock-analogue material: Implications for modelling of brittle crust processes, Tectonophysics, 855, 229828, https://doi.org/10.1016/j.tecto.2023.229828, 2023.
Massaro, L., Adam, J., Jonade, E., Negrão, S., and Yamada, Y.: Strike-slip kinematics from crustal to outcrop-scale: the impact of material properties on analogue modelling, TIB AV-Portal [video], https://doi.org/10.5446/s_1908, 2025.
McClay, K. and Bonora, M.: Analog Models of Restraining Stepovers in Strike-Slip Fault Systems, AAPG Bull., 85, 233–260, https://doi.org/10.1306/8626C7AD-173B-11D7-8645000102C1865D, 2001.
McClay, K. and Dooley, T.: Analogue models of pull-apart basins, Geology, 23, 711–714, https://doi.org/10.1130/0091-7613(1995)023<0711:AMOPAB>2.3.CO;2, 1995.
McClay, K. R., Dooley, T., and Lewis, G.: Analog modeling of progradational delta systems, Geology, 26, 771–774, 1998.
Mourgues, R. and Cobbold, P. R.: Some tectonic consequences of fluid overpressures and seepage forces as demonstrated by sandbox modelling, Tectonophysics, 376, 75–97, https://doi.org/10.1016/S0040-1951(03)00348-2, 2003.
Mouslopoulou, V., Walsh, J. J., and Nicol, A.: Fault displacement rates on a range of timescales, Earth Planet. Sc. Lett., 278, 186–197, https://doi.org/10.1016/j.epsl.2008.11.031, 2009.
Panien, M., Schreurs, G., and Pfiffner, A.: Mechanical behaviour of granular materials used in analogue modelling: insights from grain characterisation, ring-shear tests and analogue experiments, J. Struct. Geol., 28, 1710–1724, https://doi.org/10.1016/j.jsg.2006.05.004, 2006.
Paterson, M. S.: Experimental Rock Deformation, Springer-Verlag, New York, https://doi.org/10.1007/978-3-662-11720-0, 1978.
Ramberg, H.: Model experimentation of the effect of gravity on tectonic processes, Geophys. J. Roy. Astron. Soc., 14, 307–329, 1967.
Ramberg, H.: Gravity, Deformation and the Earth's Crust, Academic Press, New York, ISBN 10: 0125768605, ISBN 13: 9780125768603, 1981.
Richard, P., Naylor, M. A., and Koopman, A.: Experimental model of strike-slip tectonics, Petrol. Geosci., 1, 71–80, 1995.
Riedel, W.: Zur mechanik geologischer brucherscheinungen. Centralblatt für Mineralogie, Geol. Palaontol. B, 354–368, https://doi.org/10.1007/BF01803692, 1929.
Ritter, M. C., Leever, K., Rosenau, M., and Oncken, O.: Scaling the sandbox-Mechanical (dis) similarities of granular materials and brittle rock, J. Geophys. Res.-Sol. Ea., 121, 6863–6879, https://doi.org/10.1002/2016jb012915, 2016.
Schellart, W. P.: Shear test results for cohesion and friction coefficients for different granular materials: scaling implications for their usage in analogue modelling, Tectonophysics, 324, 1–16, https://doi.org/10.1016/S0040-1951(00)00111-6, 2000.
Schilirò, L., Massaro, L., Forte, G., Santo, A., and Tommasi, P.: Analysis of Earthquake-Triggered Landslides through an Integrated Unmanned Aerial Vehicle-Based Approach: A Case Study from Central Italy, Remote Sens., 16, 93, https://doi.org/10.3390/rs16010093, 2024.
Schreurs, G.: Experiments on strike-slip faulting and block rotation, Geology, 22, 567–570, 1994.
Schreurs, G.: Fault development and interaction in distributed strike-slip shear zones; an experimental approach, Geol. Soc. Spec. Publ., 210, 35–52, 2003.
Schreurs, G. and Colletta, B.: Analogue modelling of faulting in zones of continental transpression and transtension, Geol. Soc. Lond. Spec. Publ., 135, 59–79, https://doi.org/10.1144/GSL.SP.1998.135.01.05, 1998.
Schulze, D.: A New Ring Shear Tester for Flowability and Time Consolidation Measurements, International Particle Technology Forum, Denver/Colorado, USA, 11–16, http://refhub.elsevier.com/S1674-2001(13)00073-4/sbref0230 (last access: 5 Sepember 2024), 1994.
Shipton, Z. K. and Cowie, P. A.: Damage zone and slip-surface evolution over µm to km scales in high-porosity Navajo sandstone, Utah, J. Struct. Geol., 23, 1825–1844, https://doi.org/10.1016/S0191-8141(01)00035-9, 2001.
Wang, L., Chen, W., Tan, X., Tan, X., Yang, J., Yang, D., and Zhang, X.: Numerical investigation on the stability of deforming fractured rocks using discrete fracture networks: a case study of underground excavation, Bull. Eng. Geol. Environ., 79, 133–151, https://doi.org/10.1007/s10064-019-01536-9, 2020.
White, D. J., Take, W. A., and Bolton, M. D.: Soil deformation measurement using particle image velocimetry (PIV) and photogrammetry, Géotechnique, 53, 619–631, 2003.
Wibberley, C. A. J., Yielding, G., and Di Toro, G.: Recent advances in the understanding of fault zone internal structure: a review, Geol. Soc. Lond. Spec. Publ., 299, 5–33, https://doi.org/10.1144/sp299.2, 2008.
Wu, J. E., McClay, K., Whitehouse, P., and Dooley, T.: 4D analogue modelling of transtensional pull-apart basins, Mar. Petrol. Geol., 26, 1608–1623, https://doi.org/10.1016/j.marpetgeo.2008.06.007, 2009.
Xiao, Y., Wu, G., Lei, Y., and Chen, T.: Analogue modeling of through-going process and development pattern of strike-slip fault zone, Petrol. Explor. Dev., 44, 368–376, https://doi.org/10.1016/S1876-3804(17)30043-5, 2017.
Zeng, Q. and Yao, J.: Numerical simulation of fracture network generation in naturally fractured reservoirs, J. Nat. Gas Sci. Eng., 30, 430–443, https://doi.org/10.1016/j.jngse.2016.02.047, 2016.