the Creative Commons Attribution 4.0 License.
the Creative Commons Attribution 4.0 License.
 | 25 Sep 2025
Reflection seismic investigations on south Gotland, Sweden, to evaluate CO2 storage strategies
Christopher Juhlin
Mikael Erlström
Peter Hedin
Bojan Brodic
Daniel Sopher
Reflection seismic data were acquired in the Sudret area of Gotland between 6 and 13 November 2023. Objectives of the survey were to obtain images of the subsurface down to the Precambrian basement in the vicinity of two cored boreholes that had been drilled earlier down to about 800 m. The seismic profiles were positioned to provide a better understanding of the sedimentary strata and local structure near the two boreholes. It was also hoped that they could be used to correlate the properties of the geological formations offshore for studying the potential of future geological storage of CO2 within Swedish waters. For these purposes a sparse 3D survey was acquired that covered a ca. 300 m by 700 m rectangular area with high fold, including the locations where the boreholes were drilled. A longer ca. 2.8 km 2D profile was also acquired adjacent to the 3D survey that ran roughly in a N–S direction. In addition, distributed acoustic sensing (DAS) measurements were performed in the two cored boreholes. We report here on some results from the 2D and 3D surveys and from the DAS measurements, incorporating information from the core and sonic logs. Numerous semi-continuous reflection horizons are observed in the ca. upper 500 ms after stacking. A particularly strong reflection at about 330 ms likely originates from the top of Ordovician limestones. Generation of synthetic seismograms based on the acquired sonic logs in the two boreholes confirms this interpretation. Cambrian sandstones are also reflective, as well as shallow sandstone layers in the upper 150 ms. Normal moveout (NMO) velocities are relatively constant at about 3500 m s−1. However, depth conversion using this velocity places the reflectivity deeper than is expected from the well data. In comparison, using the DAS data, the vertically propagating P-wave velocity can be measured at an average 3100 m s−1 from the surface to 580 m depth. Using this velocity for depth conversion provides more reasonable depths to the main horizons. Since the NMO velocities are largely controlled by the horizontal velocity of the rock the difference between these and the DAS velocity can be explained by the rocks in the area having significant anisotropy. Seismic modeling indicates that a horizontal velocity of about 3500 m s−1 is necessary to explain the difference between the NMO velocity and the vertical velocity. This corresponds to an anisotropy of about 13 %. This may be important to take into account when acquiring and processing future, or legacy, offshore seismic data for the purpose of mapping potential structures or formations for CO2 storage.
- Article
(14727 KB) - Full-text XML
- BibTeX
- EndNote


Geological storage of CO2 has for several decades now been considered an option for reducing greenhouse gas emissions. In particular, the capture and storage of CO2 from large point sources, such as coal fired plants and cement production facilities, has the potential to significantly reduce emissions. However, there are few active projects worldwide where this is taking place. As of 2023 only about 40 Mt of the ca. 36 Gt of CO2 that is emitted annually was captured (Dziejarski et al., 2023). Although the amount actually captured at present is small, there is an increasing interest in applying the technology with a significant number of projects in the planning stage (Martin-Roberts et al., 2021). Therefore, several European countries are re-evaluating their storage potential, including Sweden. Considering the aforesaid points, in 2023 the Swedish government gave the Geological Survey of Sweden (SGU) the task to study the potential for CO2 storage within Swedish territory.
During initial studies on potential storage areas in Sweden two areas were identified as most prospective, the southern Baltic Sea and southwestern Sweden (Erlström et al., 2011). Currently, Swedish legislation only allows smaller amounts of CO2 (< 100 kt) to be stored geologically onshore; therefore any large scale storage would have to be offshore. However, drilling onshore is significantly cheaper than drilling offshore; hence if suitable onshore sites can be identified as analogs to the offshore sites, then these sites can provide valuable information about the properties of the reservoir and cap rocks. As part of the SGU program it was decided to first core-drill at one site on the southern part of Gotland island in the Swedish part of the Baltic sea and then the following year at another site onshore in southwestern Sweden. For both sites it was considered important to acquire reflection seismic data to be able to extrapolate drilling results away from the boreholes and investigate if nearby faults are present.
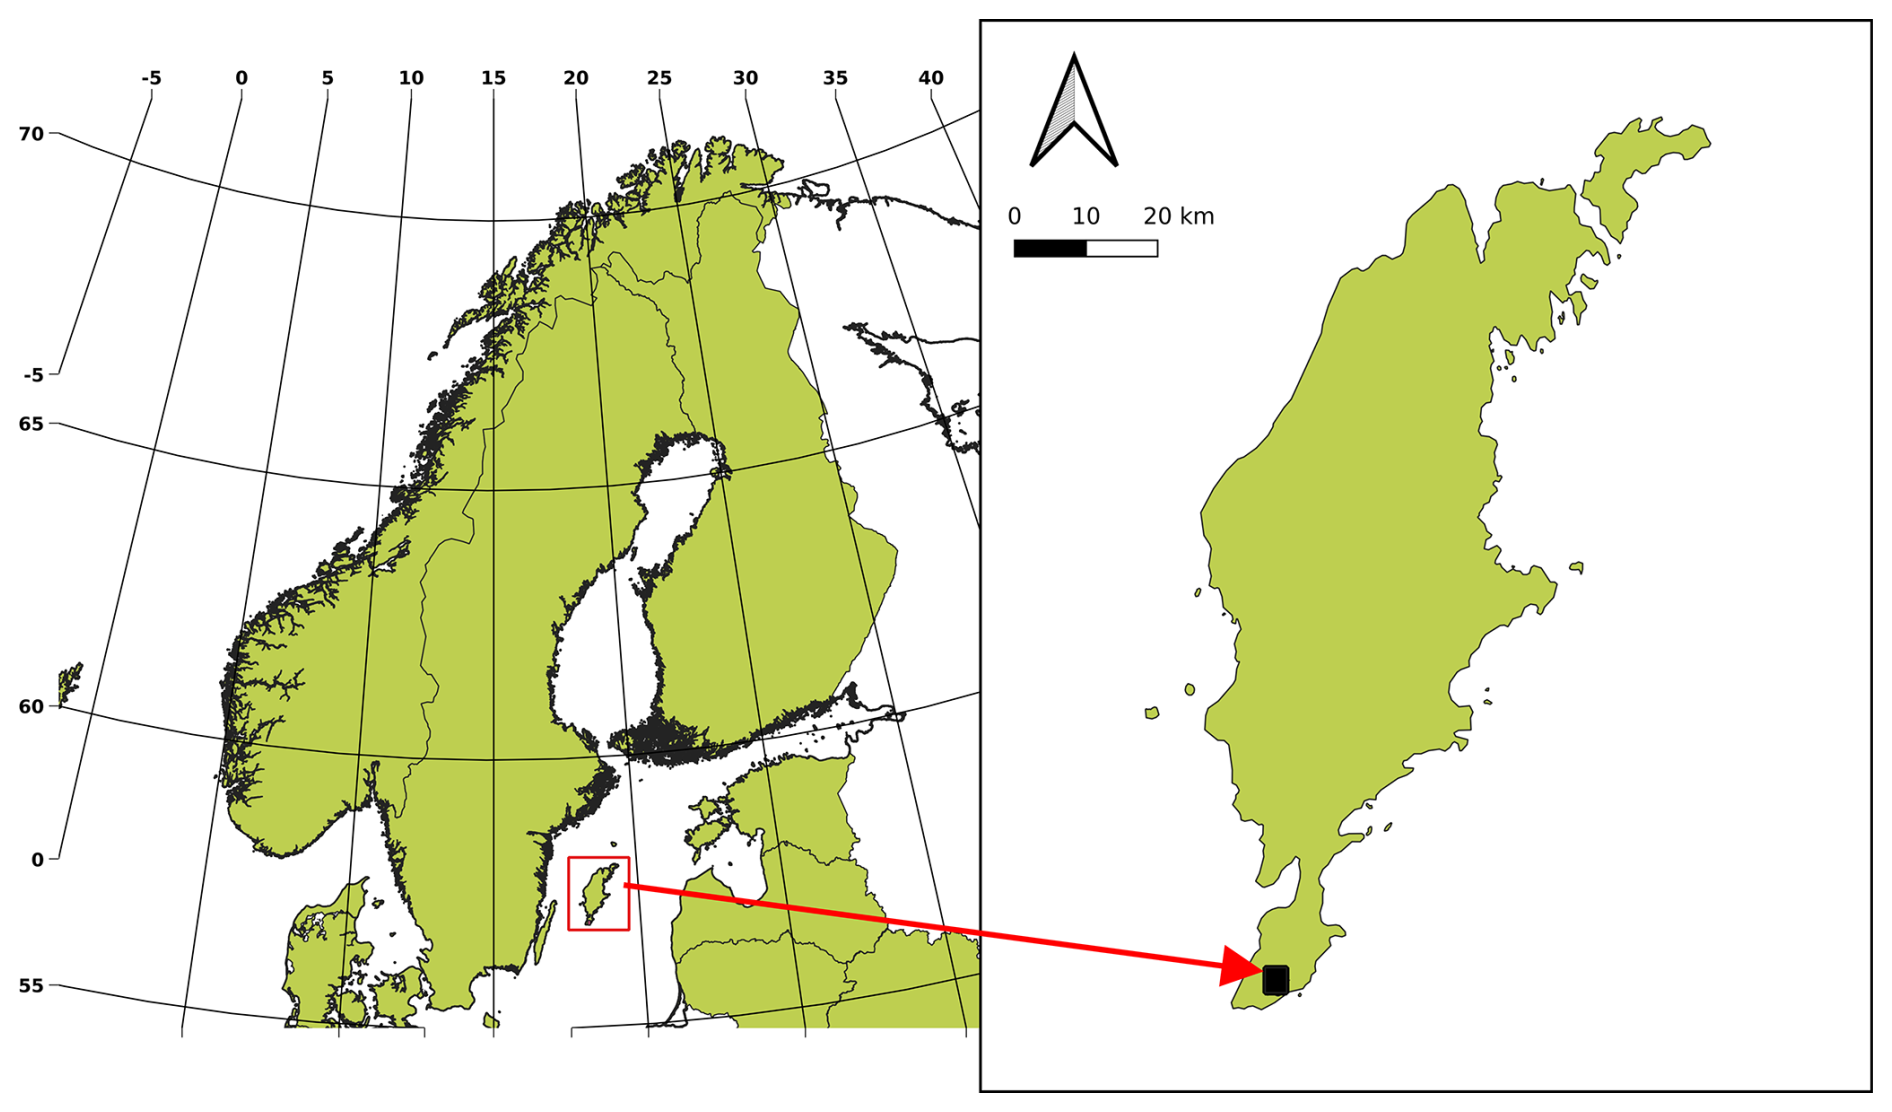
Figure 1Location map displaying national borders within Northern Europe, with the inset figure showing the survey area located on the southern part of the Swedish island of Gotland.
In southernmost Gotland (Fig. 1), in particular the Sudret area, the target reservoir contains the Middle Cambrian Faludden and Lower Cambrian När and Viklau sandstone units (Fig. 2). These occur at depths of between ca. 580 and 800 m on Gotland, depths which are typically considered to be too shallow for injected CO2 to remain in the supercritical state (temperatures above ca. 31 °C and pressures above ca. 7.4 MPa). No injection is currently planned at Sudret, but successful shallow CO2 injection test sites exist, for example Ketzin, Germany (Förster et al., 2006). Hence, the Sudret area could be suitable for a small-scale test site in the future, as at Ketzin. Probably the greatest benefit and geoscientific contribution of the Sudret site is the possibility to improve the assessment and understanding of the reservoir and its suitability as a potential CO2 storage alternative in the offshore areas southeast of Gotland. As the Cambrian sandstone is considered the main candidate for storage in the Baltic region, there is a great need for cost-effective feasibility studies, such as land-based investigations before going offshore. Aside from CO2 storage, the reservoirs below Gotland are also of interest from the standpoint of geological energy storage and geothermal energy (Sopher et al., 2019) where the results from this study can also contribute.
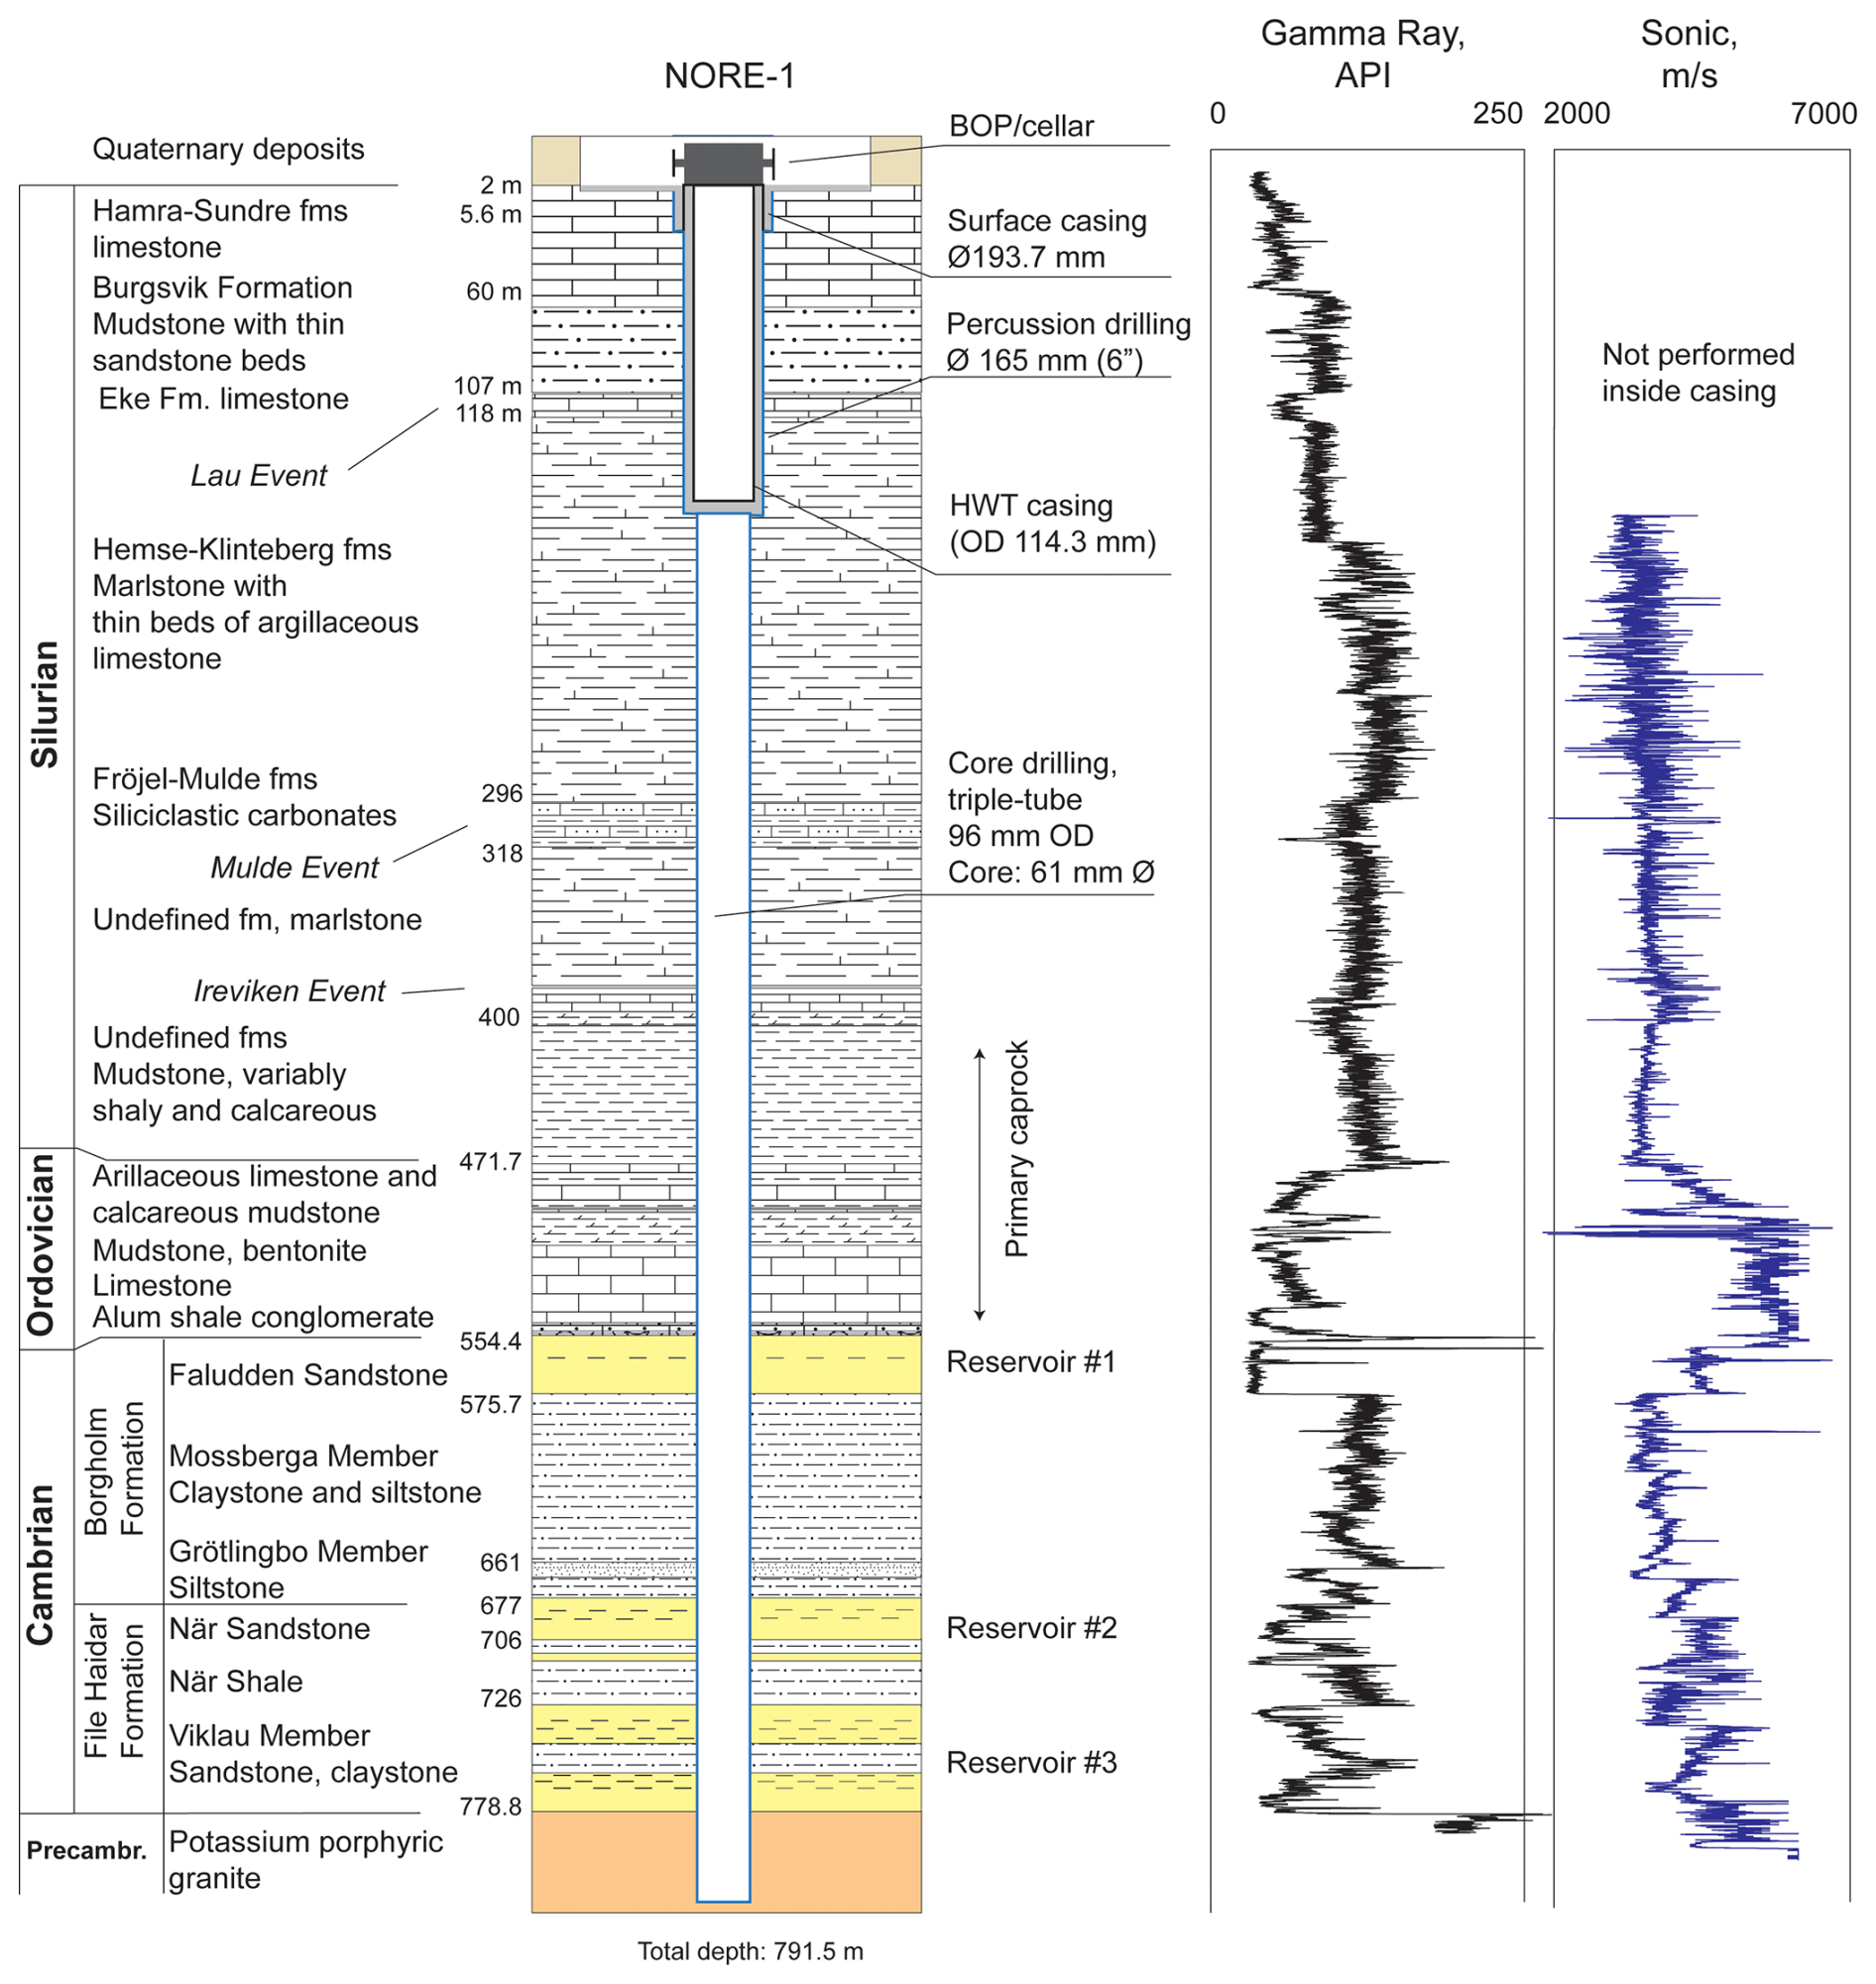
Figure 2Stratigraphy of the Nore-1 borehole. Note the limestone in the upper 60 m and the shaley sections down to about 500 m.
In this paper we present some of the reflection seismic data acquired at Sudret along with results from geophysical logging and distributed acoustic sensing (DAS) from the two cored boreholes drilled within the survey area (Nore-1 and Nore-2). During the processing it was observed that depth conversion using the normal moveout (NMO) velocities resulted in a poor match with the known lithology and geophysical logs from the cored boreholes. Analysis of the DAS and acoustic logging data shows that the NMO velocities are significantly higher than the DAS and logging velocities. We demonstrate with seismic modeling tests that this discrepancy can be explained by the upper ca. 500 m of the bedrock sequence being anisotropic. Finally, we discuss the relevance of these studies for offshore CO2 storage in the Baltic Sea area.
The Cambro–Silurian succession on south Gotland comprises ca. 225 m of Cambrian siliciclastics, ca. 85 m of Ordovician carbonates and ca. 470 m of Silurian-marlstone-dominated strata (Fig. 2). Prior to the core drilling of Nore-1 and Nore-2 there was primarily only geological information from rotary drillings containing scattered cored intervals. The coring from ca. 170 m depth down to the basement at ca. 790 m gave, for the first time, a continuous record of the Cambro–Silurian succession on south Gotland, including both potential storage aquifers and caprock intervals. The upper 177 m of bedrock was not cored since this section was drilled with a percussion technique and cased off for protection of the shallow groundwater resources. The wells are located only 250 m apart, and there are only a few meters' difference in depth for each of the different stratigraphical levels. Hence, only Nore-1 is illustrated as it is representative of both wells in Fig. 2.
During most of the Cambrian and Ordovician, relatively calm passive margin settings existed in the Gotland area. However, in the Silurian preceding the Caledonian collision between Avalonia and Baltica, a significant phase of foreland subsidence occurred, which generated a substantial increase in the thickness of the Silurian.
The Cambrian siliciclastic sequence illustrates the progressive deposition linked to the overall transgressive nature of the Cambrian Sea. Stacked fining-upwards sequences grading from sand to clay are frequent in the sequence and interpreted to be formed in a shore-face- and inner-shelf-dominated setting. Three sandstone-dominated intervals in the File Haidar and Borgholm formations, i.e., the Viklau, När and Faludden sandstones, are the main targets for the performed investigations regarding their CO2 storage potential. The ca. 50 m thick Viklau sandstone interval consists largely of well-cemented quartz arenites with low porosity and permeability. Similarly, the ca. 20 m thick När sandstone is predominantly well cemented, with intervals only a few meters thick with higher porosity and permeability. Intermediate beds are composed of dense silty mudstone.
The overlying Borgholm Formation (about 120 m thick) includes the Grötlingbo, Mossberga and Faludden members and is dominated by variably silty mudstone. However, within this formation, the ca. 20 m thick medium-grained, porous and permeable Faludden sandstone is present (Fig. 2). This sandstone is also considered the main potential storage reservoir for CO2 in the south Baltic Sea.
It is notable that strata representing the Furongian (upper Cambrian) are almost completely absent on Gotland. Locally, as in the Nore wells, there is a conglomerate with alum shale fragments and glauconitic sandstone, which is a few decimeters thick. A more detailed stratigraphic description of the Cambrian is given in Nielsen and Schovsbo (2007, 2015).
The Ordovician sedimentation on Baltica took place in a shallow epeiric sea surrounded by low relief and tectonically stable land masses supplying limited amounts of terrigenous sediments into the depositional areas. The resulting rocks are dominated by argillaceous limestone and calcareous mudstone with varying amounts of skeletal carbonate fragments and grains. The Ordovician sequence is commonly about 80 m thick in wells on south Gotland. Locally, the thickness reaches 100–125 m due to the occurrence of carbonate mud mounds. The Ordovician is roughly divided into three parts, a lower 30–40 m thick limestone-dominated unit followed by an up to 20 m thick mudstone- and claystone-dominated unit with thick bentonite layers. This unit can, under favorable conditions, generate a clear reflection on seismic profiles on Gotland. The upper part of the Ordovician consists of dense red, brown and argillaceous limestone with thin irregular layers of mudstone. This unit also contains carbonate mud mounds that can reach several tens of meters in height; hence, the unit can locally be as thick as 70 m (Sivhed et al., 2004; Erlström and Sopher, 2019; Levendal et al., 2019).
The Silurian succession has a total thickness of just under 500 m on south Gotland and covers about 10 Myr (428–418 Ma), corresponding to the Wenlock and Ludlow epochs. The original sediments were deposited on a shallow shelf that covered large parts of the central Baltic Sea basin during Silurian time. A 55 m thick dark grey and shaly mudstone constitutes the basal most part of the Silurian on south Gotland. This is followed by a ca. 300 m thick relatively homogeneous marlstone-dominated sequence with only a few thin intervals with greater amounts of limestone. The upper ca. 120 m of the Silurian is more varied and composed of a mixed limestone–mudstone–sandstone sequence belonging to the Eke, Burgsvik, Sundre and Hamra formations. The composition and the stratigraphy of the uppermost part of the Silurian down to ca. 170 m, including the Eke, Burgsvik, Hamra and Sundre formations, are well known from shallow core drillings and studies by Calner and Eriksson (2006) and Erlström et al. (2022). In combination, the Ordovician and the lowermost parts of the Silurian constitute the main sealing interval for potential CO2 storage in the Faludden sandstone reservoir.
Note that the Ireviken (ca. 400 m depth), Mulde (ca. 310 m) and Lau (ca. 110 m) events are coupled to global oceanic changes (e.g., Calner et al., 2004) and that the geophysical log responses (Fig. 2) suggest that they may be reflective. Specifically, in connection to these 10–40 m thick events, higher sonic wave velocities and lower gamma-ray (GR) readings are often observed, reflecting a change in the depositional setting.
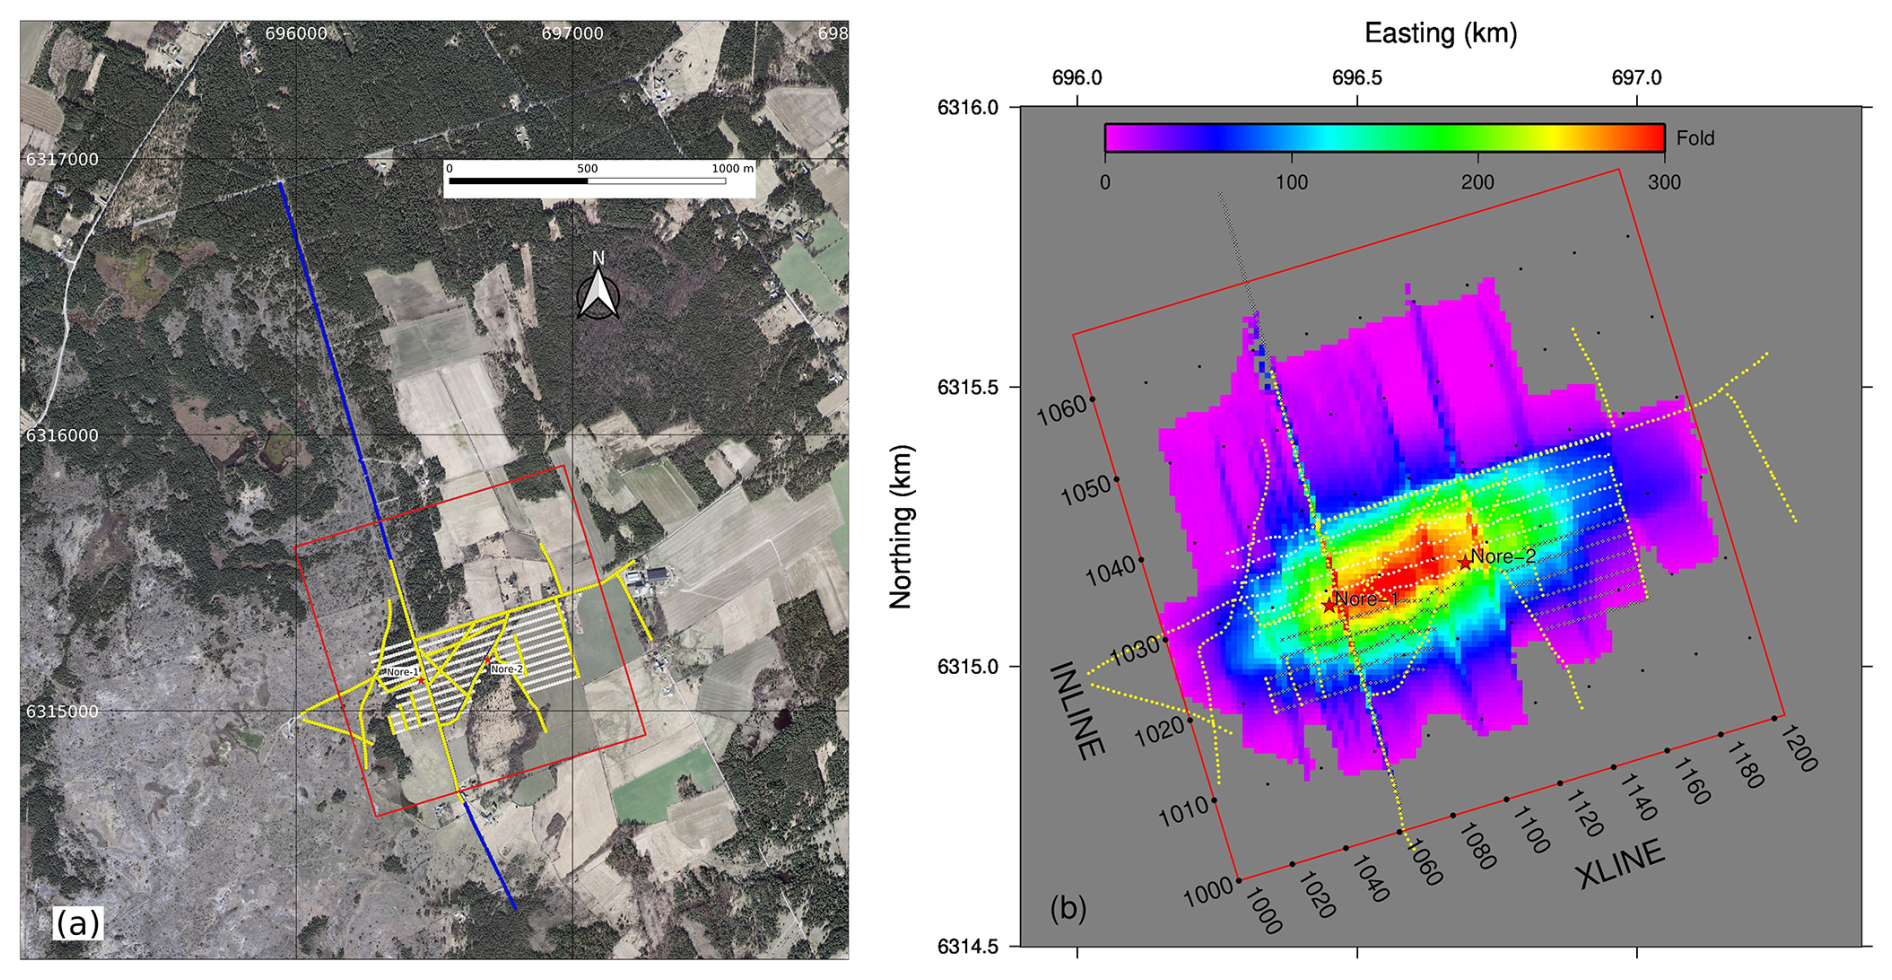
Figure 3(a) Source and receiver locations for the 3D acquisition, annotated with yellow and white circles, respectively. Source and receiver locations for the 2D acquisition are annotated with blue circles. For the 3D, source and receiver spacing was 10 m with a receiver line spacing of 30 m. The red rectangle outlines the 3D area. Red stars mark the Nore-1 and Nore-2 boreholes. (b) Detail of the 3D area with inlines and crosslines marked along with the fold for common depth point (CDP) bin sizes of 5 m in the inline direction and 15 m in the crossline direction. White circles mark receiver deployment #1, and white circles with crosses mark receiver deployment #2. Yellow dots mark the source locations. Aerial photo in (a) is from the Swedish Land Survey (https://lantmateriet.se, last access: 30 March 2025). Coordinates are in the SWEREF99 TM system.
3.1 Acquisition
Both 3D and 2D data were acquired over a 4 d period in mid-November 2023. A skid-steer-loader-mounted weight drop hammer (500 kg falling mass) with a base plate was used as a source, and 410 nodal units were available for recording. In total, 704 receiver locations were occupied for the 3D, with acquisition along 19 source lines (Fig. 3a). The 3D spread involved nominal inline and crossline receiver spacing of 10 and 30 m, respectively. The survey was done in two patches by first deploying the 410 units on the northernmost receiver lines (deployment #1 in Fig. 3b) and then moving 294 of these units to the remaining receiver lines and placing the other 116 units along the central parts of the 2D profile (deployment #2 in Fig. 3b). This required reshooting the same source lines (yellow circles in Fig. 3) to get complete coverage. Nearly all planned source locations were accessible with a total of 612 source points being accessed. Once the 3D survey was completed, 164 nodal units were moved and placed along the remaining parts of the 2.8 km long 2D profile (N–S blue line in Fig. 3a with the central part coincident with a 3D source line). To further increase the coverage of the 3D area, another 49 units were placed along one of the source lines leading to the Nore-2 borehole. Once the 3D acquisition was completed, the 2D profile was acquired, with 278 source points being shot. Vertical stacking of five repeated impacts at each source point for both the 2D and 3D surveys was used. Timing for the impacts was recorded on a microsecond accuracy GPS time event recorder.
3.2 Processing
Given the inline receiver spacing of 10 m and the crossline spacing of 30 m, it was decided to use 5 m by 15 m CDP bins for the processing. This led to inlines ranging from 1000 to 1068 and crosslines ranging from 1000 to 1204 (Fig. 3b), resulting in generally high fold within the receiver line locations but low fold outside this area. Therefore, the images presented in this paper are most reliable within the 300 m by 700 m area covered by the receiver lines, specifically between inline 1018 to 1038 and Crossline 1030 to 1170.
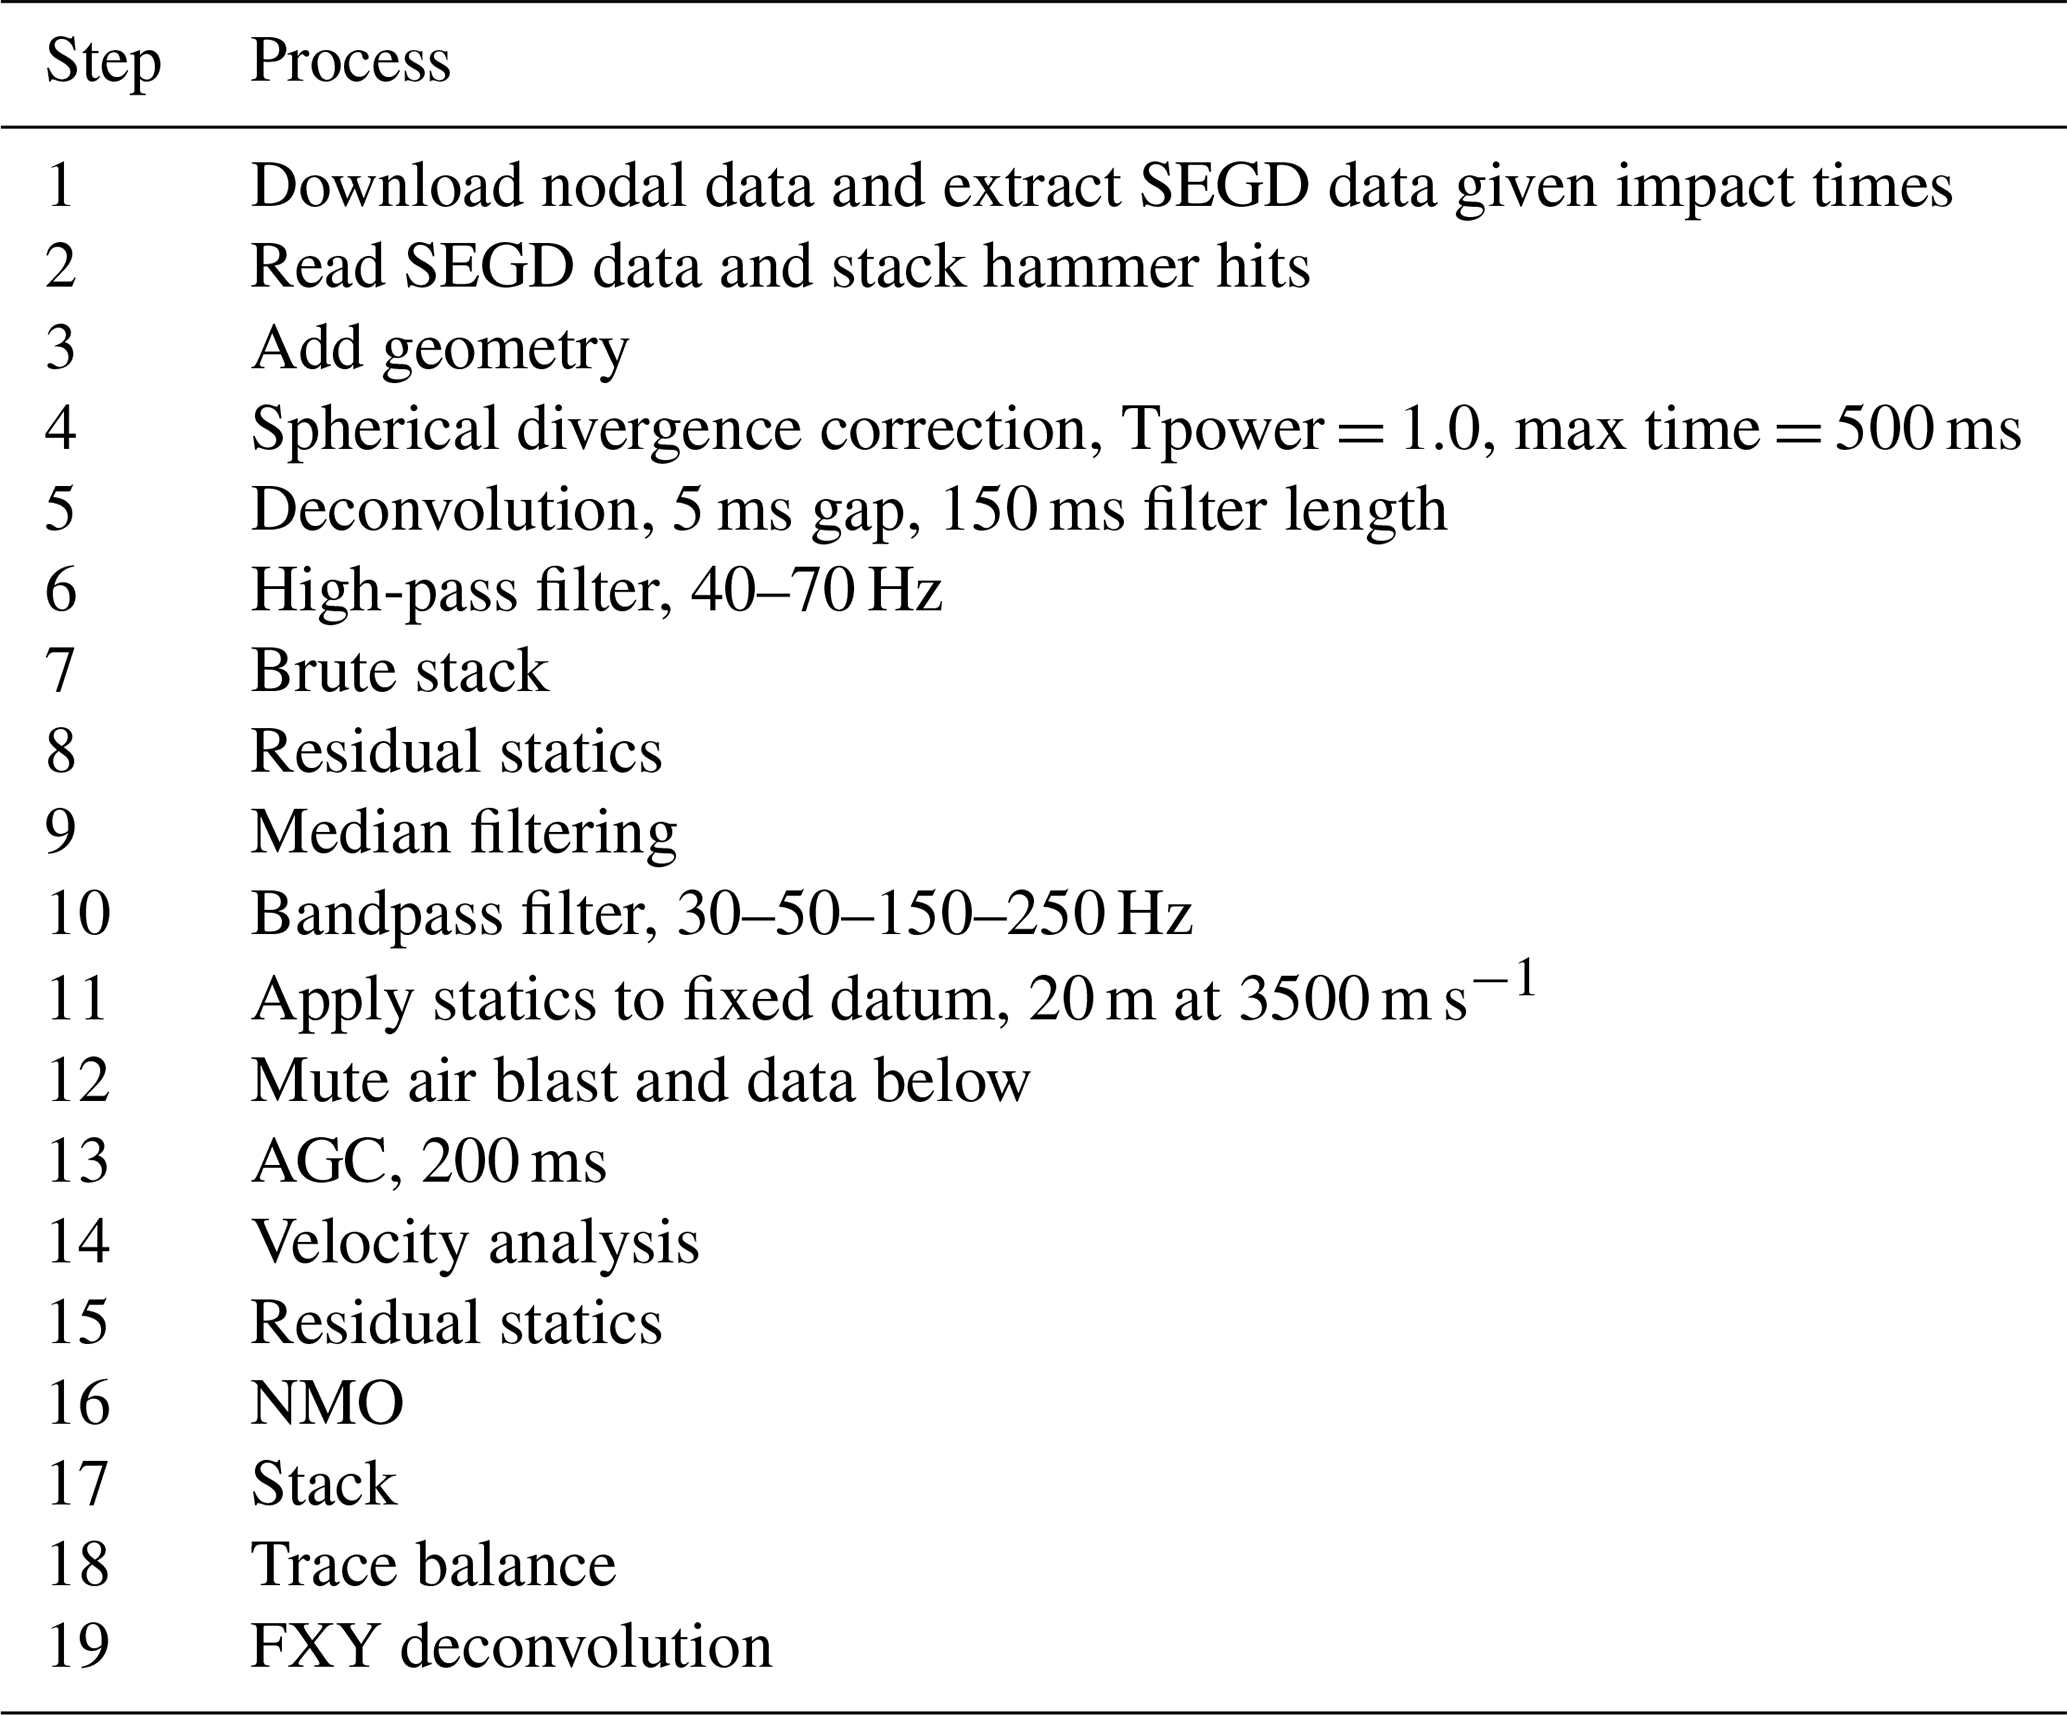
Once the geometry was defined, the seismic processing followed a fairly standard sequence, including noise suppression, filtering and velocity analysis. Source-generated noise consists of coherent arrivals of direct or diving P and S waves, the air blast, and surface waves (Fig. 4a). In addition, 50 Hz noise is present at some receiver locations. A high-pass 40–70 Hz filter removes much of the surface wave noise and attenuates the 50 Hz signals, leaving mainly linear coherent noise interfering with the reflections (Fig. 4b). At near offsets there is a rather weak first arrival with an apparent velocity of about 4500 m s−1. This arrival is observed at somewhat varying velocity throughout the survey area and is interpreted as a wave propagating through a thin near-surface high-velocity layer. A later strong arrival at an apparent velocity of about 3500 m s−1 is clear (DW in Fig. 4a), as well as another one at about 1800 m s−1 (S in Fig. 4a). These two arrivals mask much of the reflected energy in the upper 500 ms. The faster one can possibly be explained as a diving wave propagating through the lower-velocity rock below the 4500 m s−1 near-surface layer. The 1800 m s−1 one may be a direct shear wave or represent a wave propagating through the water saturated uppermost loose sediments. In order to reduce the influence of these linear noise trains, median filtering was applied to the source gathers. Prior to the filtering, an initial estimate of the residual statics was made and applied to increase coherency using the reflection window 300–500 ms. After median filtering, a strong reflection package with a zero-offset travel time of about 340 ms is clearly visible (Fig. 4c).
Additional processing consisted of a tail mute following the air blast arrival, as well as AGC scaling prior to NMO and stacking. Iterative velocity analysis and residual statics were also performed. Greatest coherency in the reflections was achieved with stacking velocities on the order of 3400–3700 m s−1 from the near surface to 500 ms. Similar velocity functions were determined throughout the 3D volume and along the 2D profile. The entire processing flow is given in Table 1.
Inline 1028 corresponds to the inline that passes closest to the two cored boreholes (Fig. 3b), with Nore-1 located at about crossline 1061 and Nore-2 located at about crossline 1110. There is little lateral variation in reflection travel times along inline 1028 (Fig. 5a). Amplitude variations are significant, but some of this variation may be due to differences in fold and in amplitude versus offset effects, as well as variable interference from residual source generated noise that has not been completely removed. Reflections below about 450 ms are possible multiples that have not stacked out, but could also correspond to top basement reflections. A strong multiple at about 700 ms was attenuated by stacking at higher velocities. A crossline passing over the boreholes (Fig. 5b) also shows only minor differences in reflection travel times, suggesting there is little structural variation below the 3D area.
Given the 1D structure of the area and the variable fold, we have chosen not to present migrated results since migration introduces some artifacts into the volume. The stacked volume was initially depth-converted using a velocity of 3500 m s−1 (Fig. 6). This velocity corresponds to the average NMO velocity used. Depth conversion with the actual stacking velocities gives a similar result, with the exception that some of the later reflections appear deeper than when using the constant velocity. It is clear that there is a poor match between the sonic log that follows the geological section (Fig. 2) versus the depth section extracted from the 3D seismic results (Fig. 6). The strong reflection at 340 ms is located at 600 m on the depth section, and the reflectivity extends about 100 m below the top of the Precambrian, implying strong reflections in the upper part of the Precambrian basement when depth converting with the average NMO velocity.
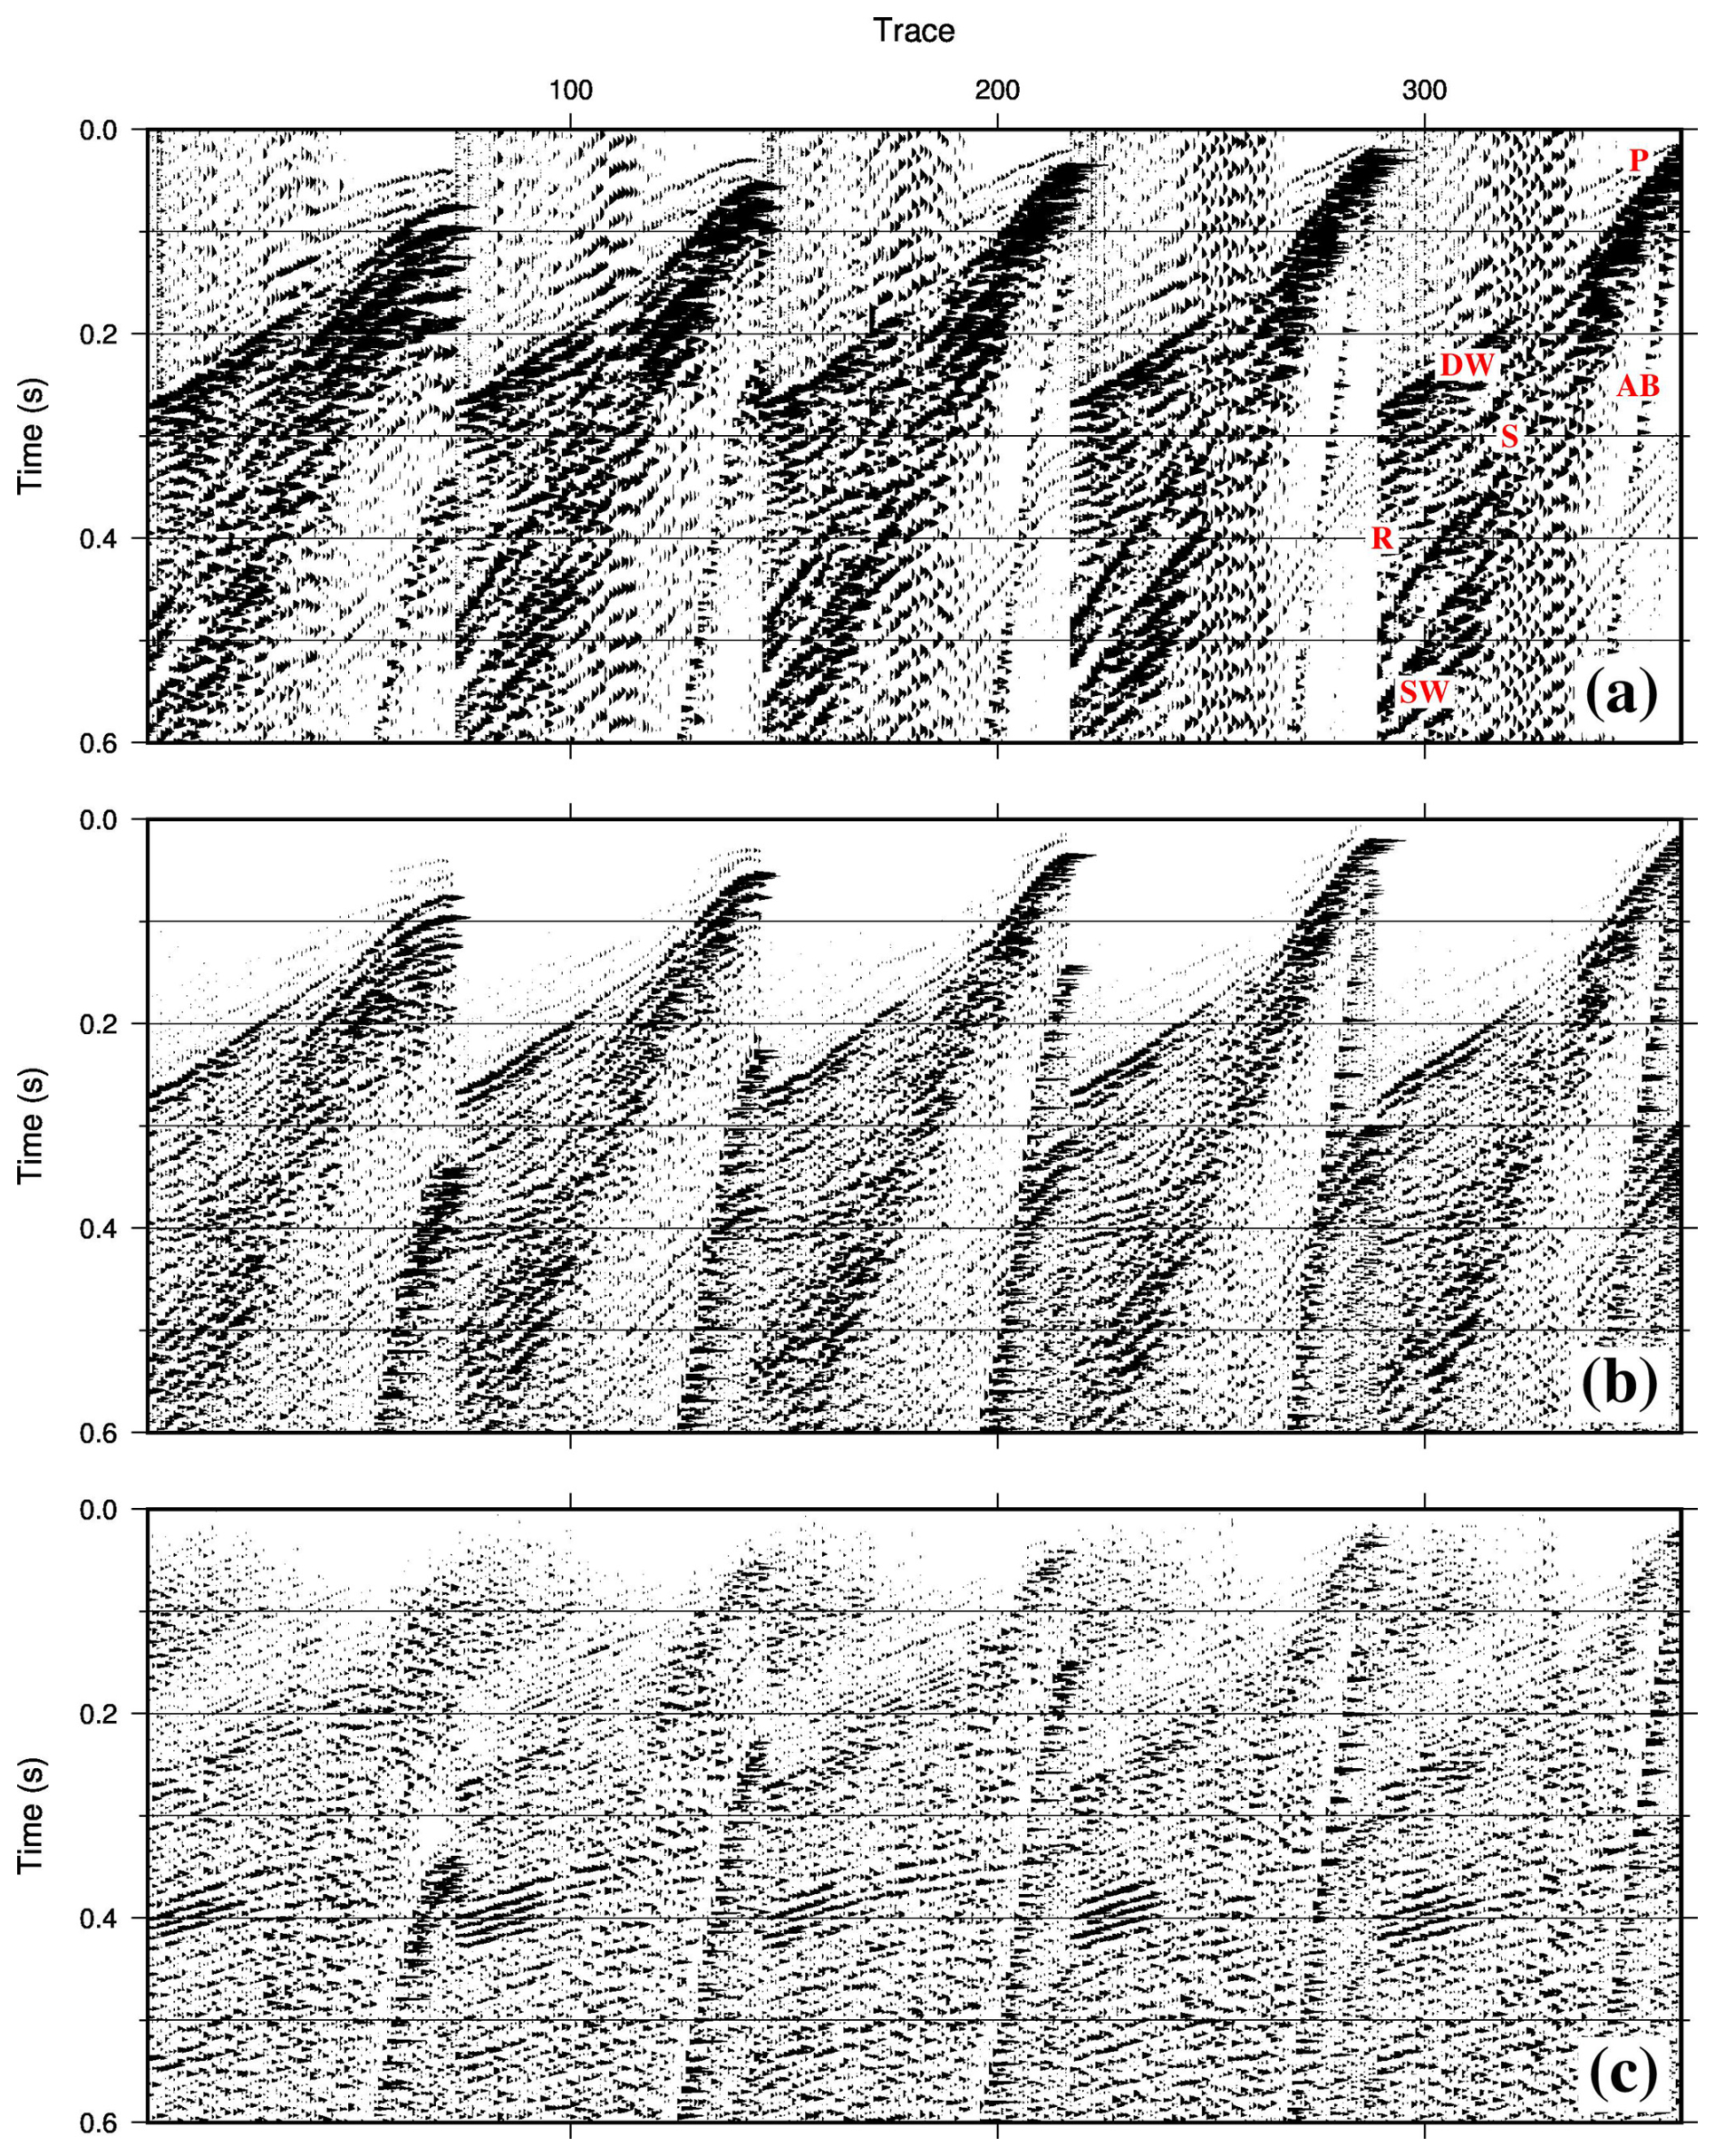
Figure 4Source gather processing. (a) Raw data with only trace balancing applied. (b) Same source gather as (a) with spherical divergence, deconvolution and a high-pass 40–70 Hz filter applied. (c) Source gather with processing up to step 10 in Table 1 applied. P: first arrival; DW: diving P wave; R: reflection; SW: surface wave; AB: air blast; S: direct shear wave.
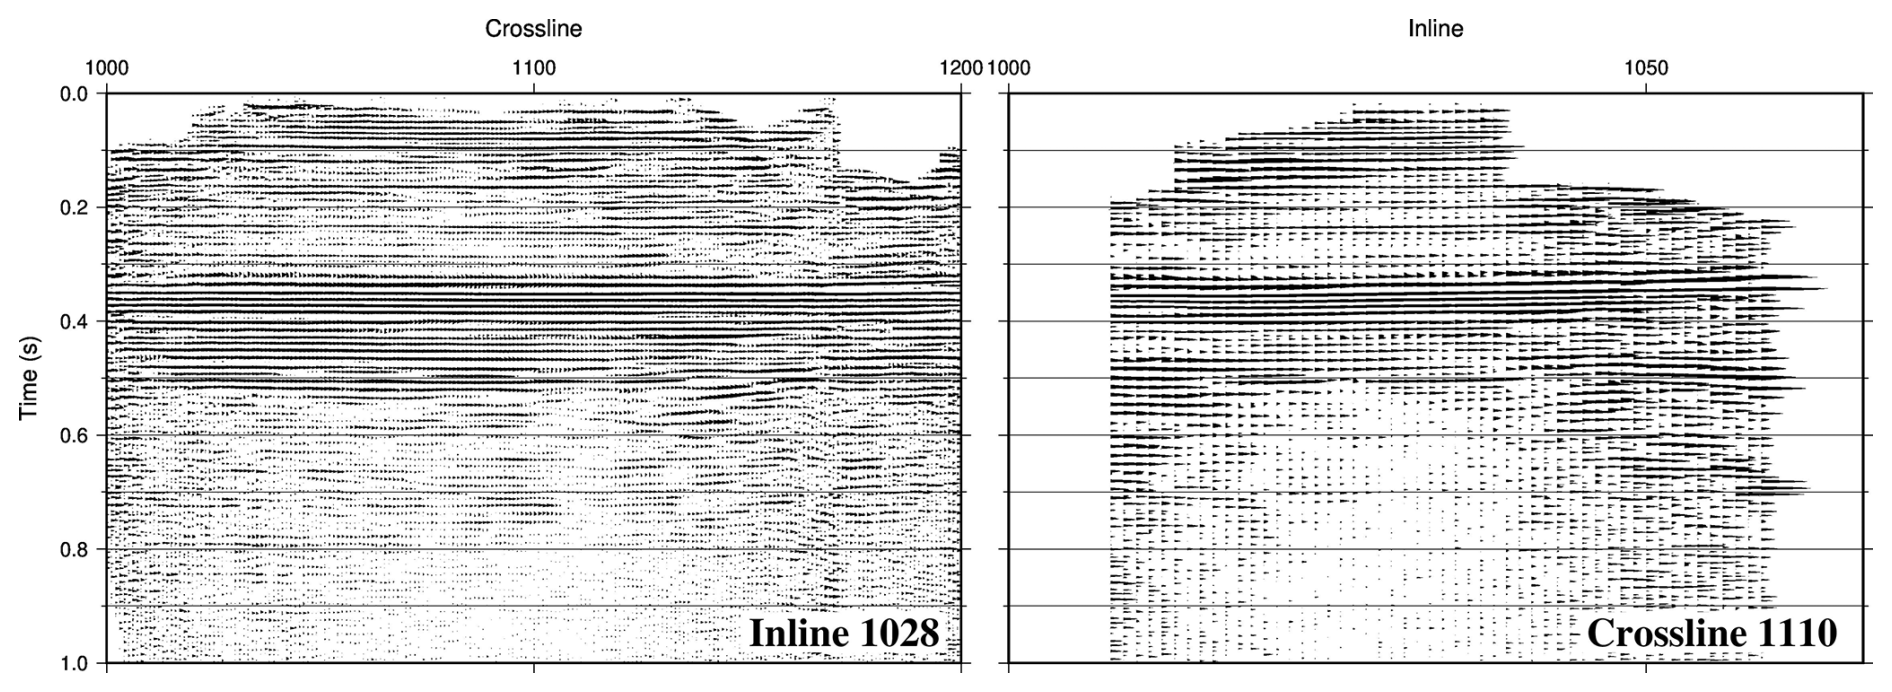
Figure 5Inline 1028 and crossline 1110 time sections extracted from the 3D stacked volume crossing the two boreholes along different directions.
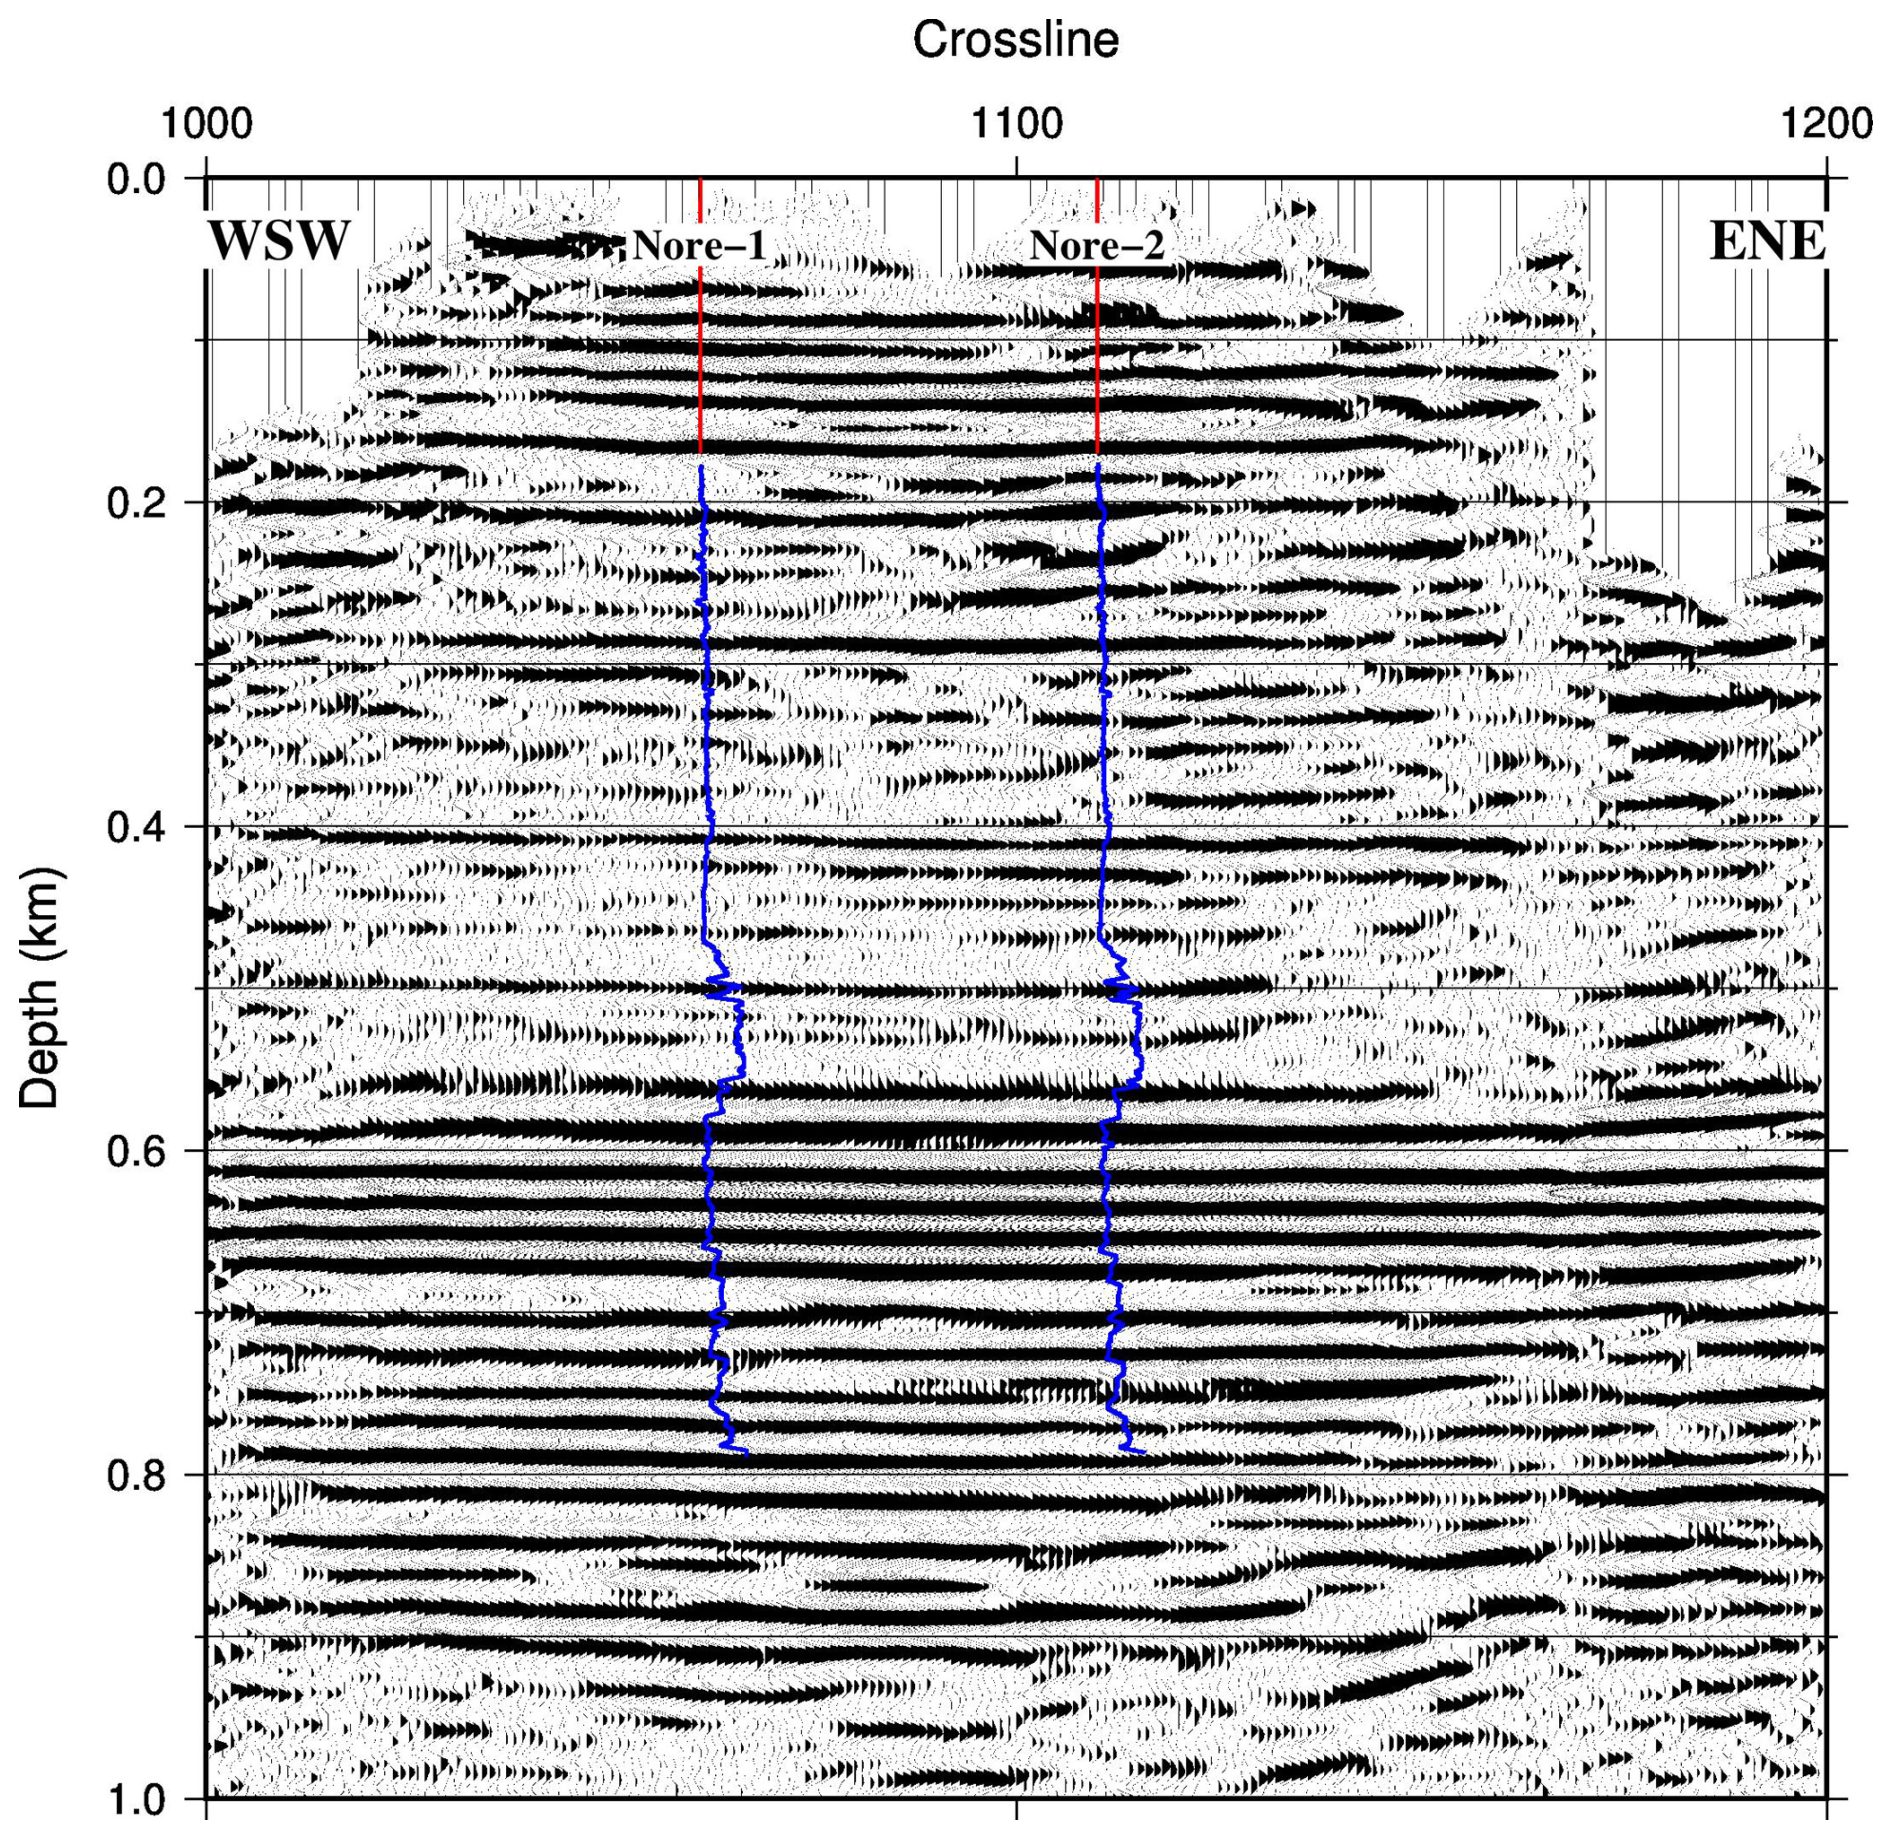
Figure 6Inline 1028 depth-converted using 3500 m s−1 compared with the sonic logs from Nore-1 and Nore-2 shown as blue curves. The red lines down to 170 m mark the cased sections of the boreholes that were not possible to log. The poor match between the sonic logs and the seismic section implies that the 3500 m s−1 depth conversion velocity is not optimal. A 5-point boxcar filter was applied to the raw sonic logs before plotting.
4.1 Distributed acoustic sensing data
Distributed acoustic sensing (DAS) measurements were performed in a multi-offset walk-away vertical seismic profile (VSP) manner in both the Nore-1 and Nore-2 boreholes using a fiber optic cable hanging loosely in the open hole. In Nore-1, data were recorded down to 492 m and in Nore-2 down to 737 m. Ideally, the fiber optic cable should be cemented in behind casing or in the borehole itself, but this was not an option for these wells since they were to be re-entered for further studies. The fiber optic cable was sampled at 2.45 m intervals, and data were recorded at a sampling frequency of 4000 Hz. A clear P-wave arrival is observed in Nore-1 on source gathers with the source points close to the wellhead, as well as significant tube wave energy (Fig. 7a). Data from Nore-2 are dominated by tube waves, and there are no clear P wave first arrivals on the near “zero-offset” raw source gathers, even after filtering tests at various frequencies. However, when the source is offset some 20 to 100 m, then P-wave first arrivals can be discerned down to about 420 m (Fig. 7b). Even though P-wave first arrivals cannot be identified deeper down, their arrival times can be determined at the locations where tube waves are generated. Given these tube wave generation depths, it is found that the average velocity is no greater than 3100 m s−1 down to about 580 m below the surface (Fig. 7), as can also be seen from the green line in Figure 8a for the calculated DAS interval velocities.
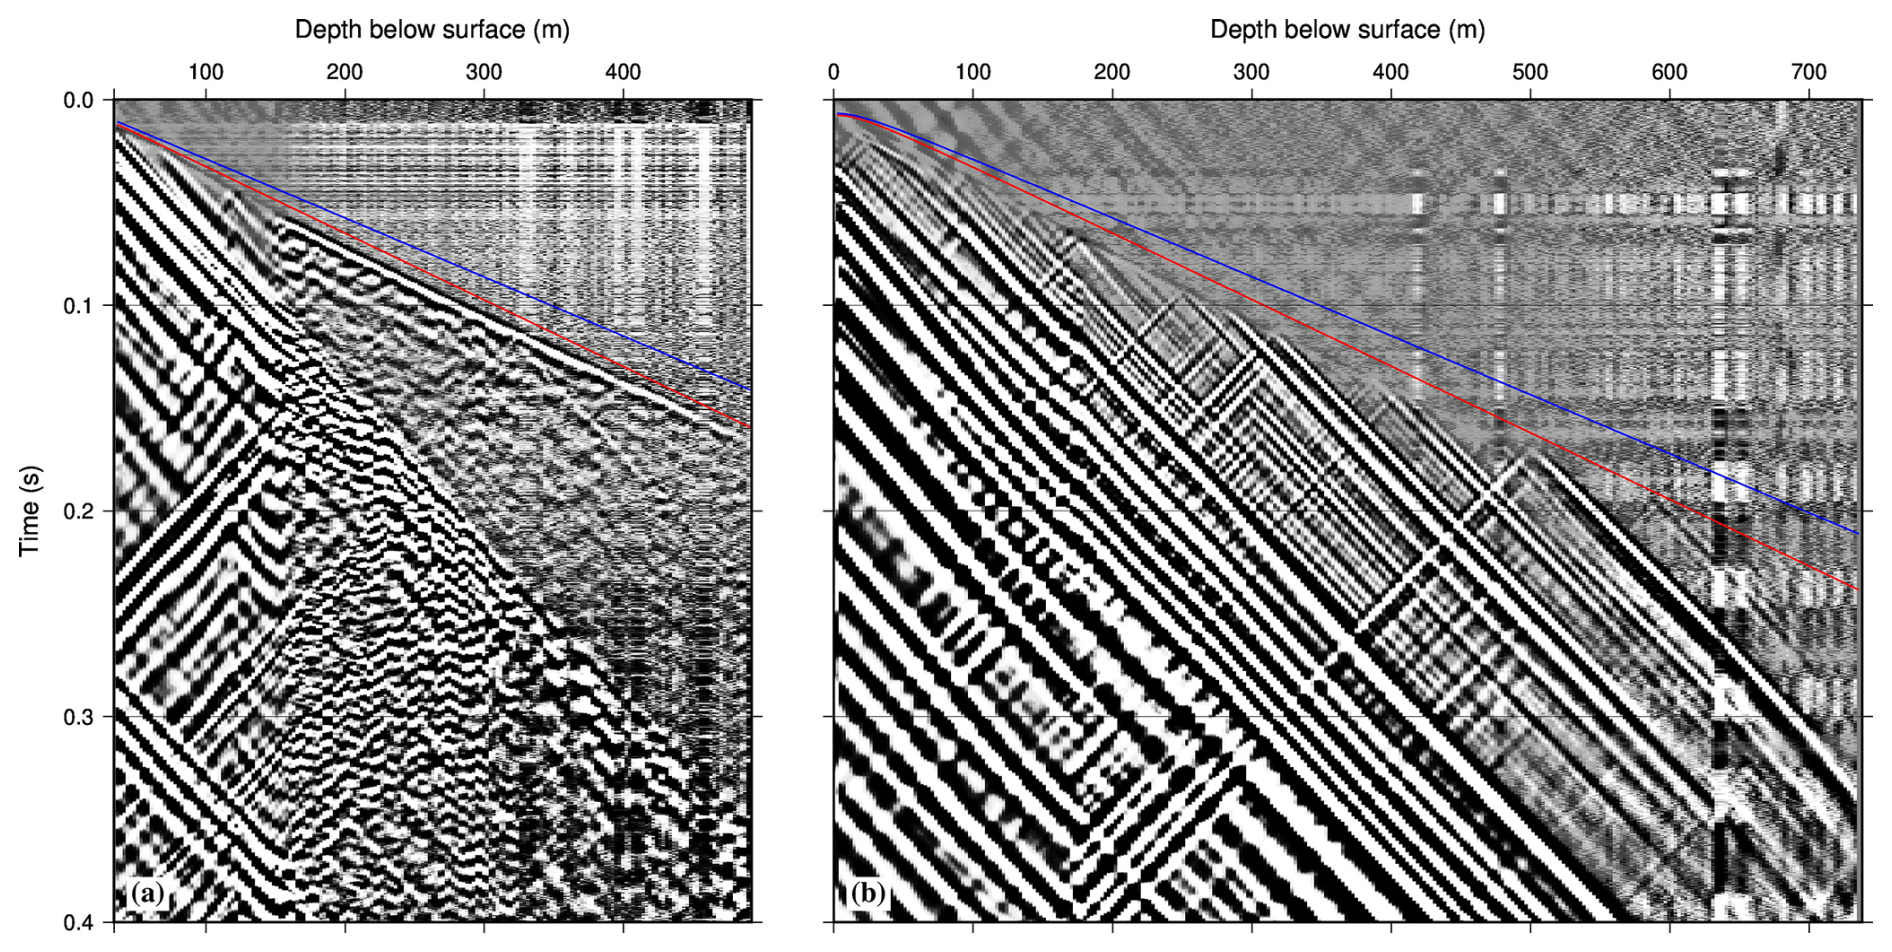
Figure 7(a) Near-offset source gather recorded in the Nore-1 borehole. (b) Offset DAS source gather recorded in the Nore-2 borehole with the source about 25 m from the wellhead. The red curve marks the expected first arrival time for a wave propagating through a 3100 m s−1 constant velocity medium, while the blue curve gives the arrival time for a wave propagating at 3500 m s−1.
It is well known that, for many anisotropic layered sedimentary rocks, the horizontal velocity is generally greater than the vertical velocity (e.g., Thomsen, 1986). Furthermore, in anisotropic media the NMO velocity will also depend upon the horizontal velocity, not only the vertical velocity. In the case of elliptical anisotropy, the NMO velocity will correspond to the horizontal velocity. Therefore, with the support of the DAS measurements, a depth conversion velocity of 3100 m s−1 can be justified as a better estimate of the vertical velocity than the average NMO velocity of 3500 m s−1. In the following section we show that an average velocity of 3100 m s−1 is also consistent with sonic velocity measurements in the boreholes.
4.2 Sonic log
After completion of drilling, geophysical logging data were acquired in the Nore-1 and Nore-2 boreholes. We focus here on the sonic logs (Fig. 8a). Due to the casing installations in the boreholes already mentioned, data are only available below about 170 m depth. The sonic velocities generally fall between the average NMO velocity of 3500 m s−1 and the interval velocities from the DAS measurements. It is well known that high-frequency sonic velocities are generally faster than those at seismic frequencies (Stewart et al., 1984). This can explain the discrepancy between the sonic and DAS velocity but cannot explain the difference between the sonic and NMO velocity. In order to compare the sonic log measurements with the surface seismic data, a synthetic seismogram was generated based on the sonic data from the two boreholes. Since no sonic velocity information was available for the upper 170 m, we used the DAS data as a guide for this interval. Furthermore, a high-velocity layer at the surface was included to account for the hard limestone found in the upper part of the borehole (Fig. 2). With the assumed velocity functions, a good match is obtained between the observed data and the synthetic seismograms on inline 1028 from the 3D survey (Fig. 8b). A more detailed comparison between the borehole data and the seismic data will be presented in the next section.
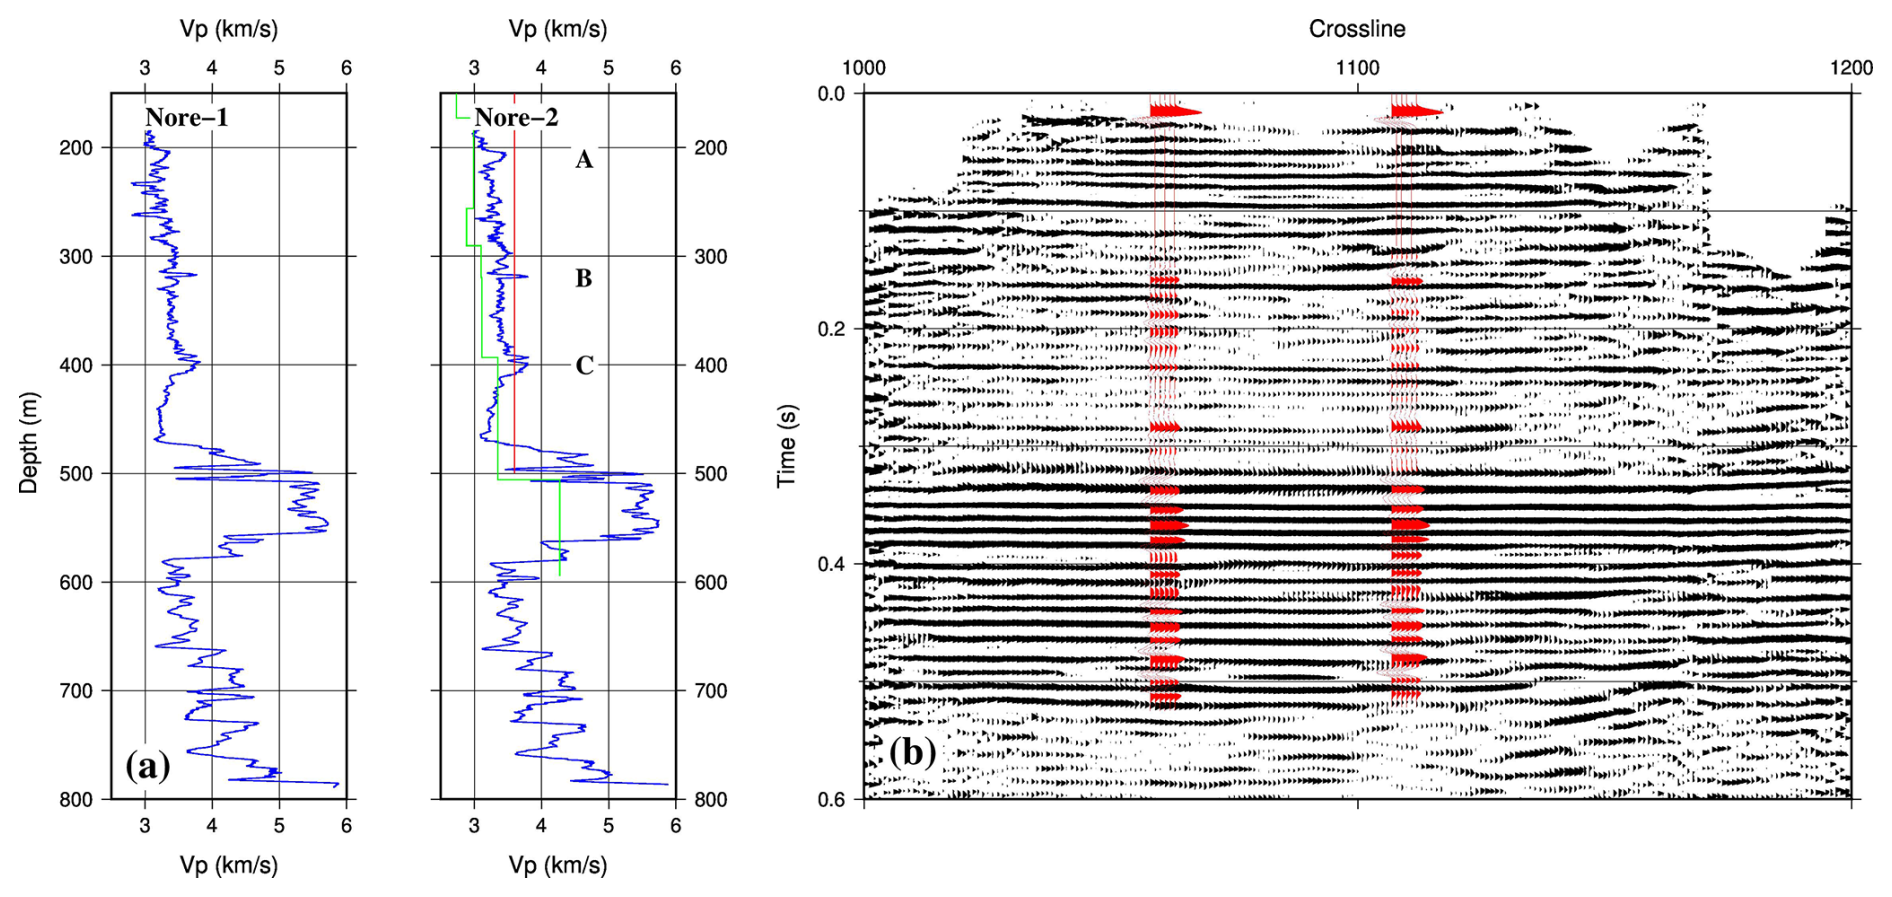
Figure 8(a) Sonic logs from the two boreholes. Green line in Nore-2 shows the velocities calculated from the DAS measurements, the red line shows the average NMO velocity to 500 m. A 5-point boxcar filter was applied to the raw sonic logs before plotting. (b) Synthetic seismograms from the two boreholes are plotted on inline 1028 as a series of red waveforms.
5.1 Depth conversion
In order to compare the seismic data with the information obtained from core drilling, it is more suitable to use a vertical velocity function based on the DAS data, rather than the NMO velocities. The deepest point on the DAS recording that provided a P-wave arrival time was at about 580 m (Fig. 7b). Lacking deeper DAS data, we assumed an average vertical velocity of 3100 m s−1 below 580 m. Using this new velocity function for depth conversion clearly shows that the seismic data match the sonic logs much better (Fig. 9b). In fact, a number of reflections on inline 1028 can be directly correlated to the borehole data. In particular the reflections at ca. 210, 320 and 400 m (coded A, B and C in Fig. 9b) are most likely generated by the relatively thin higher sonic velocity intervals at corresponding depths (coded A, B and C in Fig. 8). Reflections B and C probably correspond to the Mulde and Ireviken events, respectively, that have been identified in the core. The gradual increase in sonic velocity starting at 470 m (top of the Ordovician) that continues for 20 to 30 m is probably generating the low-frequency reflection that marks the start of the high-amplitude reflections below. Given that the high-velocity limestone appears to have a rather constant velocity, it is somewhat unexpected that several cycles of high-amplitude reflections are present. However, there are variations in velocity within this interval that may be enough to generate the cyclic response. Support for this is seen in the synthetic seismograms (Fig. 8b), which also show a cyclic response that agrees reasonably well with the observed data. Numerous reflections are present in the Cambrian sequence that contains the potential reservoirs. However, it is difficult to map a one-to-one correspondence between the well data (sonic or core logging) and the seismic depth section. This may be due to (i) impedance contrasts being low between the reservoir sandstones and the surrounding shales, (ii) interference or tuning between the reflections from the interfaces in the alternating sequence of sandstones and shales, (iii) higher lateral variability in the lithology within the Cambrian than in the overlying Ordovician and Silurian rocks, (iv) interference from internal multiples from the overlying Ordovician limestone, or (v) a combination of these factors. Inspection of the seismic data does indicate lateral variability in the seismic response in this interval, suggesting that there are some lateral variations, even if the two sonic logs are quite similar through the Cambrian. Note that there is no clear reflection off the top of the basement as might be expected based on the sonic logs.
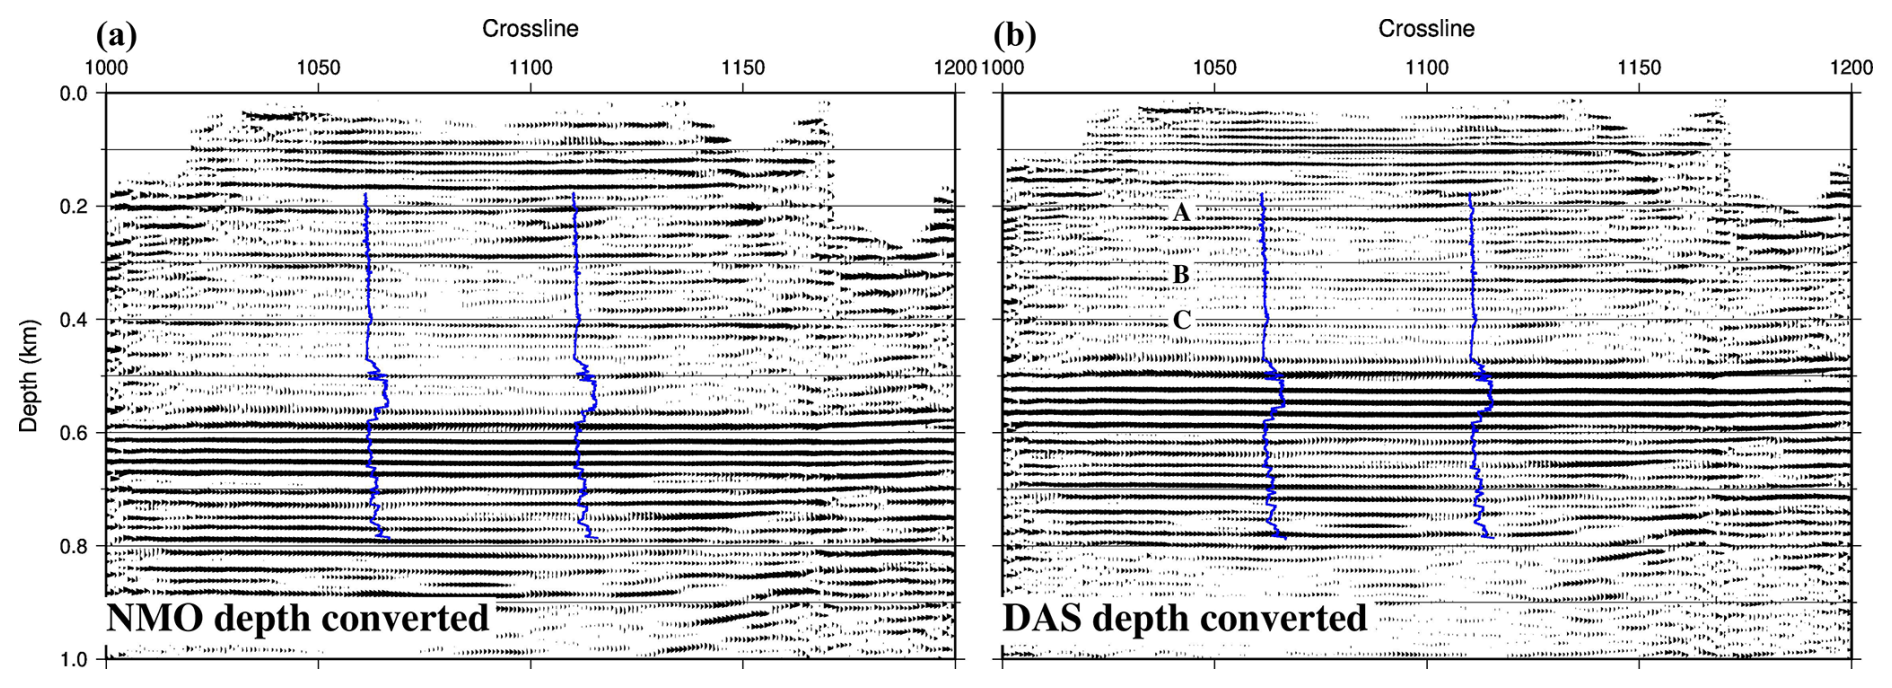
Figure 9Inline 1028 depth section depth-converted with the NMO velocity (a) and the DAS velocity (b). The DAS depth-converted section provides a better match with the sonic logs. A 5-point boxcar filter was applied to the raw sonic logs before plotting.
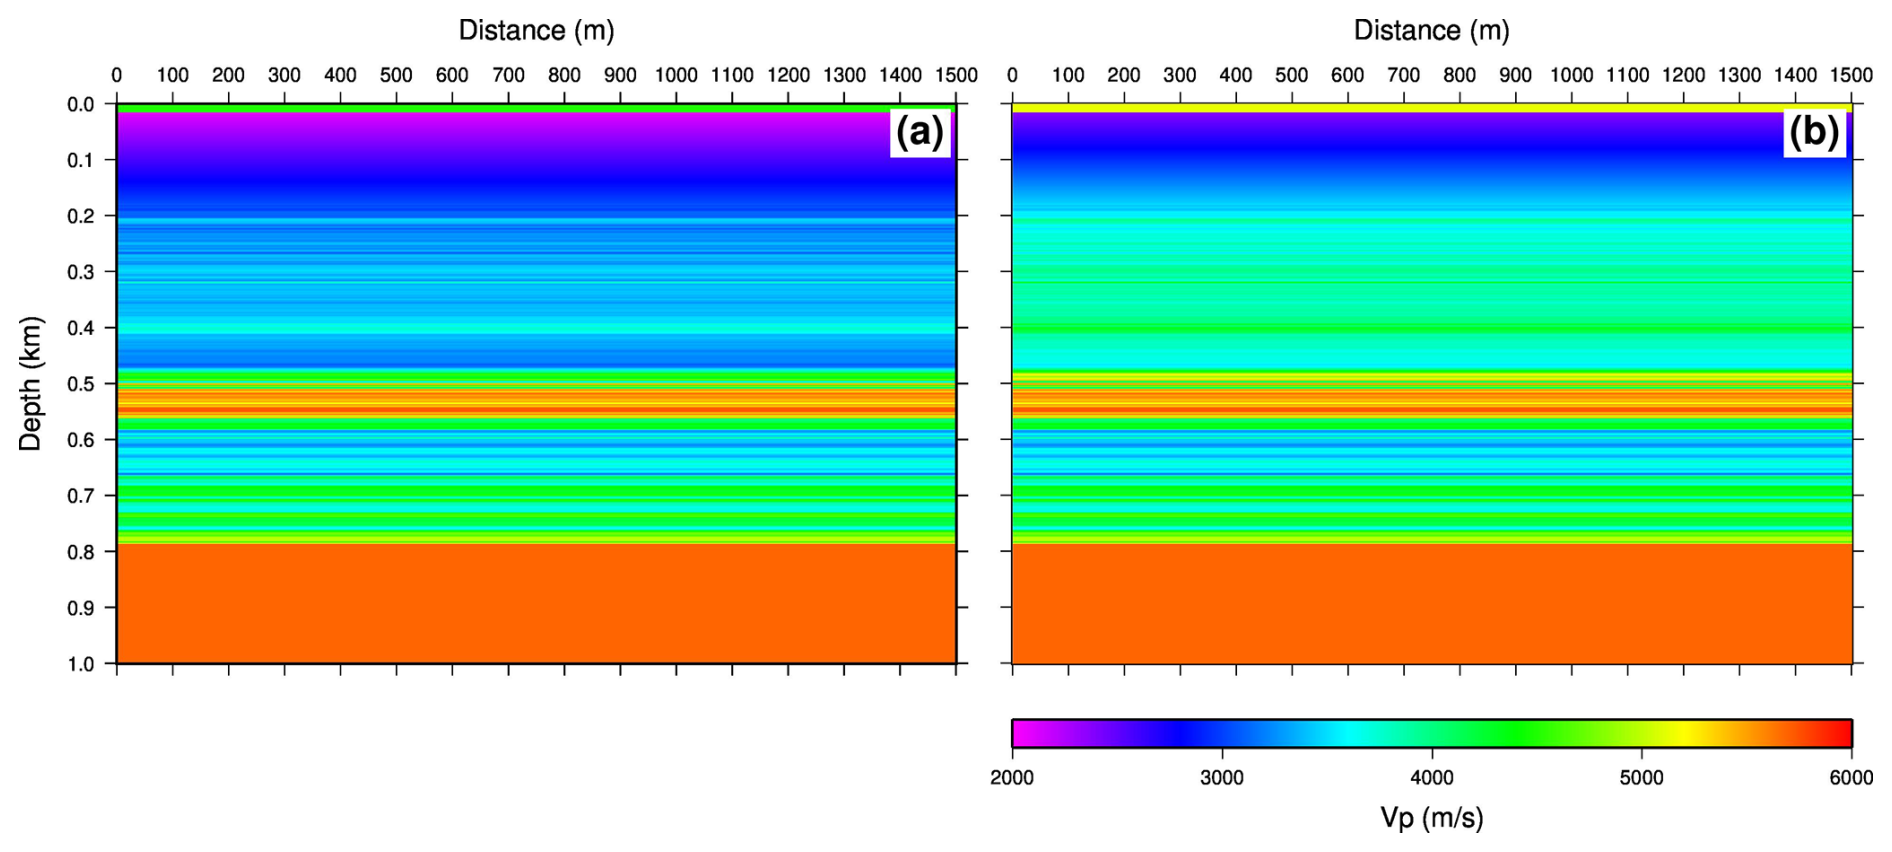
Figure 10Vertical (a) and horizontal (b) velocity models. For the isotropic model only the vertical velocity was used for producing the source gather shown in Fig. 11a. For Fig. 11b the vertical and horizontal velocities were used, assuming the upper 500 m is elliptically anisotropic, implying the vertical and horizontal velocities are equal below 500 m.
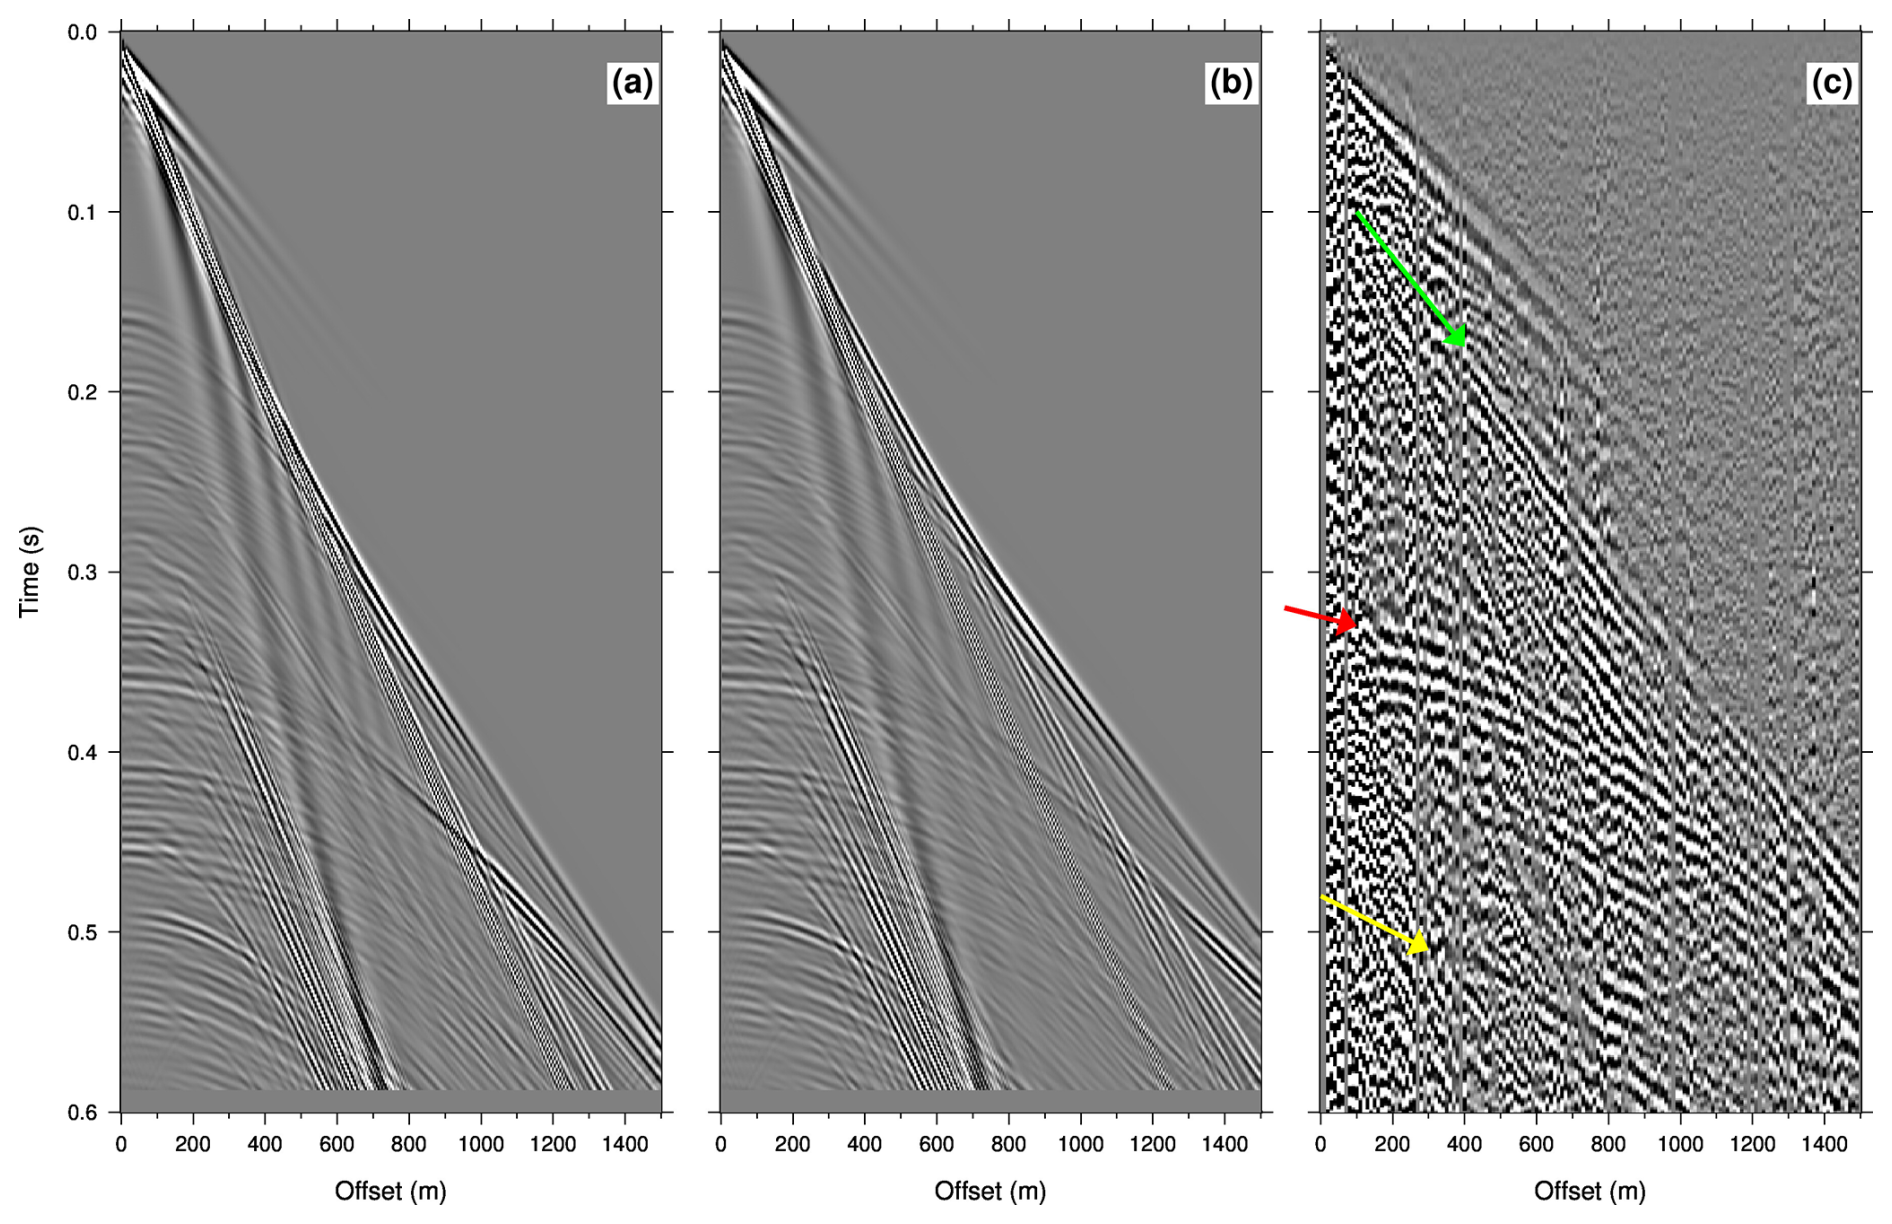
Figure 11Comparison between different synthetic results and real data. (a) Results from isotropic modeling. (b) Results from anisotropic modeling. (c) Real source gather from the 2D seismic profile. Red arrow marks the reflection off the top of the high-velocity Ordovician unit, yellow arrow marks the converted wave (P–S) reflection off the top of the Ordovician unit and green arrow marks the diving wave propagating through the rocks above the Ordovician unit.
5.2 Seismic modeling
In order to better understand the seismic response at the Sudret site, a number of seismic modeling tests were performed. As expected, we find that it is necessary to include anisotropy in the modeling to obtain a reasonable match between the real data and the modeled data. Here we show results from two models. In the first model we use a velocity model based on the sonic log. Due to the absence of sonic log data in the upper part of the boreholes, we assume a 20 m thick high-velocity layer at the surface and a DAS-based velocity down to 170 m, while the velocity is assumed to be constant in the crystalline basement. This first model is isotropic where the horizontal velocity is equal to the vertical velocity; in other words, only the vertical velocity is considered. Hence in the first model, both vertical and horizontal velocities are assumed to be those shown in Fig. 10a. The second model is equivalent to the first, with the exception that we assume the horizontal velocity is 13 % faster than the vertical velocity in the upper 500 m. Therefore, in the second model the vertical and horizontal velocities are assumed to be those shown in Fig. 10a and b, respectively. We did not test more complex forms of anisotropy that could also explain the reflection moveout since we cannot verify if they are present or not. Therefore, we have assumed elliptical anisotropy, which is the simplest form of anisotropy that can explain the data. The horizontal ratio is assumed to be 2. Below 500 m, we assume the rock is isotropic. Modeling was performed using the suea2df code, a 2D elastic anisotropic code available in Seismic Unix (Juhlin, 1995). Modeling results at offsets up to 1500 m are shown in Fig. 11, along with a filtered version of a typical source gather from the 2D profile. For producing the source gather shown in Fig. 11a, the isotropic velocity model with only vertical velocity variations was used. The gather shown in Fig. 11b was generated assuming the upper 500 m is elliptically anisotropic; hence both the vertical and horizontal velocities were used. Three prominent arrivals marked by arrows show that the anisotropic modeling agrees with the real data much better than the isotropic modeling. What we interpret as a diving wave (green arrow) propagating through the shaly/marly units above the Ordovician limestone arrives significantly earlier in the anisotropic modeling results (Fig. 11b). The reflected P–P (red arrow) and P–S (yellow arrow) waves have the same near-offset arrival times in the isotropic and anisotropic modeling, but the moveout in the anisotropic modeling matches the real data much better. We conclude that the anisotropic model used is consistent with the data, but forms of anisotropy other than elliptical cannot be ruled out.
5.3 Relevance to offshore CO2 storage
As shown in previous work (e.g., Sopher et al., 2016) the Ordovician limestone is a clear seismic marker that can be mapped over a wide area, both onshore and offshore. Below this unit we expect to find the Cambrian sandstones which are the most prospective for potential CO2 storage within Swedish waters below the Baltic Sea. Based on Sopher et al. (2016) the offshore stratigraphy south of Gotland is generally similar to that found in the Nore wells. However, the Faludden sandstone is interpreted to increase in thickness to the south. Lack of core does not allow the offshore properties to be investigated in detail, but we speculate that the properties of the potential reservoir sandstones and overlying caprock should be similar to what is found in the Nore wells. Our study shows that it is difficult to identify reflections directly from these sandstone units, even with the high-frequency data that we have obtained. It is therefore unlikely that the sandstone layers can easily be mapped directly with seismic methods offshore. However, given the presence of the strong reflection from the Ordovician limestone and information from previous offshore drilling (Sopher et al., 2016), we can obtain a good estimate of the depth to the sandstone units. This is provided that we know what velocity to use for depth conversion. It is likely that the offshore shaly/marly Silurian units are also anisotropic, and if seismic data are used where there is no well control, then this anisotropy should be considered prior to depth conversion. It could be worthwhile revisiting some of the more recent data acquired offshore in the Baltic Sea to investigate the presence of anisotropy and to allow better depth estimates to be made in those areas.
Reflection seismic data were acquired on southern Gotland in order to gain a better understanding of the geological structure in the area and to extrapolate results from core drilling away from the boreholes as part of a program to investigate the potential for geological storage of CO2 in the Baltic Sea area. During processing it became clear that there were significant discrepancies between the depth-converted seismic data and the borehole data when the normal moveout (NMO) velocity was used. The use of distributed acoustic sensing (DAS) data, along with sonic log measurements, led to a better understanding of the subsurface velocities, which improved the depth conversion and alignment with the core and sonic logs. Specifically, a vertical velocity function based on DAS measurements was shown to provide an image that better correlated with the borehole core and logs. In the case presented here, the structure is essentially 1D, and DAS measurements in a single borehole are sufficient. For areas which have more lateral variations, it may be necessary for DAS measurements in several boreholes to constrain the vertical velocities.
The discrepancy between the NMO and DAS velocities can be explained by the presence of anisotropy in the upper 500 m, with horizontal velocities being higher than vertical velocities. Seismic modeling showed that an elliptical anisotropic model with 13 % anisotropy and a ratio of 2 could explain the observations. However, there may be other anisotropic models that can also be consistent with the data. Nonetheless, several marker horizons are observed in the seismic data that can be correlated to the boreholes when the data are depth-converted using velocities based on the sonic and DAS data. These include the strong reflection package from the Ordovician limestones and the weaker reflections from the Mulde and Ireviken events. Although the target Cambrian reservoir sandstones show numerous reflections, it is not possible to correlate these on a one-to-one basis with the individual sandstone units. This may be due to low-impedance contrasts with the surrounding rocks, a complex interference pattern from thin sandstone layers and possible interference from internal multiples. Future processing of seismic data from the Baltic Sea area should take into account the presence of anisotropy and the complex reflection response from the Cambrian sandstones.
The suea2df code used for the seismic modeling is freely available in the Seismic Unix package, https://wiki.seismic-unix.org/start (last access: 18 September 2025).
The seismic data are available upon request from the Geological Survey of Sweden (https://www.sgu.se, last access: 18 September 2025). It is the long-term goal of SGU to make all seismic data available.
PH, DS and CJ conceptualized and designed the data acquisition. BB and CJ led the data acquisition, and CJ was responsible for the data processing. ME and DS provided borehole data. CJ and ME led the geological interpretation. CJ and ME wrote the initial draft, and all authors reviewed and contributed to it. All authors participated in the discussion of the results and approved the submission of this paper.
The contact author has declared that none of the authors has any competing interests.
Publisher’s note: Copernicus Publications remains neutral with regard to jurisdictional claims made in the text, published maps, institutional affiliations, or any other geographical representation in this paper. While Copernicus Publications makes every effort to include appropriate place names, the final responsibility lies with the authors.
This article is part of the special issue “Seismic imaging from the lithosphere to the near surface”. It is a result of the Seismix 2024 conference, Uppsala, Sweden, 24 to 28 June 2024.
This research was funded by the Geological Survey of Sweden. Globe Claritas™ under the academic license from Petrosys Ltd. and Seismic Unix was used for the data processing. We thank Niklas Kühne and an anonymous reviewer for their constructive comments, which helped improve this paper.
This paper was edited by Michal Malinowski and reviewed by Niklas Kühne and one anonymous referee.
Calner, M. and Eriksson, M.: Evidence for rapid environmental changes in low latitudes during the Late Silurian Lau Event: The Burgen-1 drillcore, Gotland, Sweden, Geol. Mag., 143, 15–24, 2006.
Calner, M., Jeppsson, L., and Munnecke, A.: The Silurian of Gotland – Part I: Review of the stratigraphic framework, event stratigraphy, and stable carbon and oxygen isotope developmentm in: Erlanger geologische Abhandlungen, Sonderband 5, 113–131, https://www.researchgate.net/publication/285850124 (last acces: 17 September 2025), 2004.
Dziejarski, B., Krzyżyńska, R., and Andersson, K.: Current status of carbon capture, utilization, and storage technologies in the global economy: A survey of technical assessment, Fuel, 342, 127776, https://doi.org/10.1016/j.fuel.2023.127776, 2023.
Erlström, M. and Sopher, D.: Geophysical well log-motifs, lithology, stratigraphical aspects and correlation of the Ordovician succession in the Swedish part of the Baltic Basin, Int. J. Earth Sci., 108, 1387–1407, https://doi.org/10.1007/s00531-019-01712-y, 2019.
Erlström, M., Fredriksson, D., Juhojuntti, N., Sivhed, U., and Wickström, L.: Lagring av koldioxid i berggrunden – krav, förutsättningar och möjligheter, Geological Survey of Sweden, Rapporter och meddelanden 131, ISBN 978-91-7403-098-3, 2011.
Erlström, M., Sopher, D., and Dahlqvist, P.: Berggrunden på Sudret, Gotland Underlag för bedömning av grundvattentillgångar, geoenergipotential samt koldioxidlagring, Geological Survey of Sweden, report 2022:11, 73 pp., https://resource.sgu.se/dokument/publikation/sgurapport/sgurapport202211rapport/s2211-rapport.pdf (last access: 17 September 2025), 2022 (in Swedish).
Förster, A., Norden, B., Zinck-Jørgensen, K., Frykman, P., Kulenkampff, J., Spangenberg, E., Erzinger, Zimmer, M., Kopp, J. Borm, Juhlin, C., Cosma, C., and Hurter, S.: Baseline characterization of the CO2SINK geological storage site at Ketzin, Germany, Environ. Geosci., 13, 145–160, 2006.
Juhlin, C.: Finite difference elastic wave propagation in 2-D heterogeneous transversely isotropic media, Geophys. Prospect., 43, 843–858, https://doi.org/10.1111/j.1365-2478.1995.tb00284.x, 1995.
Levendal, T., Sopher, D., Juhlin, C., and Lehnert, O.: Investigation of an Ordovician carbonate mound beneath Gotland, Sweden, using 3D seismic and well data, J. Appl. Geophys., 162, 22–34, https://doi.org/10.1016/j.palaeo.2019.109345, 2019.
Martin-Roberts, E., Scott, V., Flude, S., Johnson, G., Haszeldine, R. S., and Gilfillan, S.: Carbon capture and storage at the end of a lost decade, One Earth, 4, 1569–1584, https://doi.org/10.1016/j.oneear.2021.10.002, 2021.
Nielsen, A. T. and Schovsbo, N. H.: Cambrian to basal Ordovician lithostratigraphy in Southern Scandinavia, B. Geol. Soc. Denmark, 53, 47–92, https://doi.org/10.37570/bgsd-2006-53-04, 2007.
Nielsen, A. T. and Schovsbo, N. H.: The regressive Early–Mid Cambrian “Hawke Bay Event” in Baltoscandia: Epeirogenic uplift in concert with eustacy, Earth-Sci. Rev., 151, 288–350, https://doi.org/10.37570/bgsd-2006-53-04, 2015.
Sivhed, U., Erlström, M., Bojesen-Koefoed, J. A., and Löfgren, A.: Upper Ordovician carbonate mounds on Gotland, central Baltic Sea: distribution, composition and reservoir characteristics, J. Petrol. Geol., 27, 115–140, https://doi.org/10.1111/j.1747-5457.2004.tb00049.x, 2004.
Sopher, D., Erlström, M., Bell, N., and Juhlin, C.: The structure and stratigraphy of the sedimentary succession in the Swedish sector of the Baltic Basin: New insights from vintage 2D marine seismic data, Tectonophysics, 676, 90–111, https://doi.org/10.1016/j.tecto.2016.03.012, 2016.
Sopher, D., Juhlin, C., Levendal, T., Erlström, M., Nilsson, K., and Soares, J. P. S.: Evaluation of the subsurface compressed air energy storage (CAES) potential on Gotland, Sweden, Environ. Earth Sci., 78, 197, https://doi.org/10.1007/s12665-019-8196-1, 2019.
Stewart, R. R., Huddleston, P. D., and Kan, T. K.: Seismic versus sonic velocities; a vertical seismic profiling study, Geophysics, 49, 1153–1168, https://doi.org/10.1190/1.1441745, 1984.
Thomsen, L.: Weak Elastic Anisotropy, Geophysics, 51, 1954–1966, https://doi.org/10.1190/1.1442051, 1986.