the Creative Commons Attribution 4.0 License.
the Creative Commons Attribution 4.0 License.
 | 04 Mar 2026
Integrated geophysical analysis of Rangpur Saddle: insights on tectonics and magnetic mineral potential of north-western Bangladesh
Mohammad Tawhidur Rahman Tushar
Mohammad Mahfuz Alam
Mohammad Nasif Jamil
Saba Karim
Mohammad Shahjahan
Mohammad Anwar Hossain Bhuiyan
The northwestern region of Bangladesh holds untapped potential for magnetic mineral deposits at shallow depths. Unlike much of Bangladesh, characterized by thick sediments of the Bengal Basin, this area is an extension of the Indian Shield, often referred to as the Stable Platform. It is also geologically distinct, hosting structures related to the breakup of Pangea. The geology and tectonics of this region have remained largely understudied. To address this gap, this study integrates gravity, magnetic, seismic, and drilling data to investigate the subsurface structure and evaluate the resource potential of the area. We utilize advanced filtering and modeling techniques, including tilt derivatives and horizontal gradient methods, to understand the tectonic framework and geometry of the subsurface structures. Our spatial analysis, using multiple geophysical datasets, reveals dipolar magnetic anomalies, which we attribute to gabbroic intrusions along extensional faults that define the region's horst and graben structures. To validate our interpretations, we developed an integrated 2-D subsurface model that aligns with the observed geophysical data. However, the study is limited by the availability of high-resolution seismic data and the sparse distribution of drilling locations, which may affect the precision of our subsurface characterization. Our findings provide crucial insights into the tectonic evolution of the stable platform and underscore the economic potential of the Rangpur Saddle, the shallowest part of the stable platform, for mineral exploration. These insights pave the way for further exploration and development initiatives focused on uncovering the mineral wealth of this underexplored region.
- Article
(10777 KB) - Full-text XML
-
Supplement
(510 KB) - BibTeX
- EndNote


The northwestern part of Bangladesh is rich in potential mineral resources. The geological diversity of this area suggests the presence of other valuable minerals that remain largely unexplored (Akhtar, 2005; Hasan et al., 2023; Moon, 2022). In this area, basement rocks are present at relatively shallow depths of 128 m, hosting a spectrum of economic mineral resources, including coal, limestone, white clay, and hard rock (Khan and Rahman, 1992). Notably, Pirganj in the Rangpur district (Fig. 1) records the country's highest magnetic anomaly, suggesting the potential for magnetic mineral ore deposits. In the 1990s, drilling activities were conducted in the region after developing a 2D subsurface model by the Geological Survey of Bangladesh (GSB) in collaboration with the United States Geological Survey (USGS). Despite these efforts, no noteworthy ore body was identified during the drilling process (Rahman and Ullah, 2009). Moreover, the tectonic evolution of the Paleo-Proterozoic basement in the northwest region of the Bengal Basin still needs to be studied.
The study area is located in a region commonly referred to as the Rangpur platform or saddle (Masum et al., 2021), an eastern extension of the Indian Shield (Alam et al., 2003). The northern part of the Rangpur Saddle rests on a shallow Precambrian basement, ranging from 130 to 1000 m in depth. This area of Bangladesh is geologically stable, characterized predominantly by horsts and grabens, which were formed during the Cretaceous rifting of the Indian plate from the Antarctica-Australia section of Gondwanaland (Curray, 1991; Curray and Moore, 1974). Although the basement primarily consists of diorite, tonalite, and granodiorite, it is also intersected by pegmatite and mafic/ultramafic dykes (Hossain et al., 2007; Kabir et al., 2001).
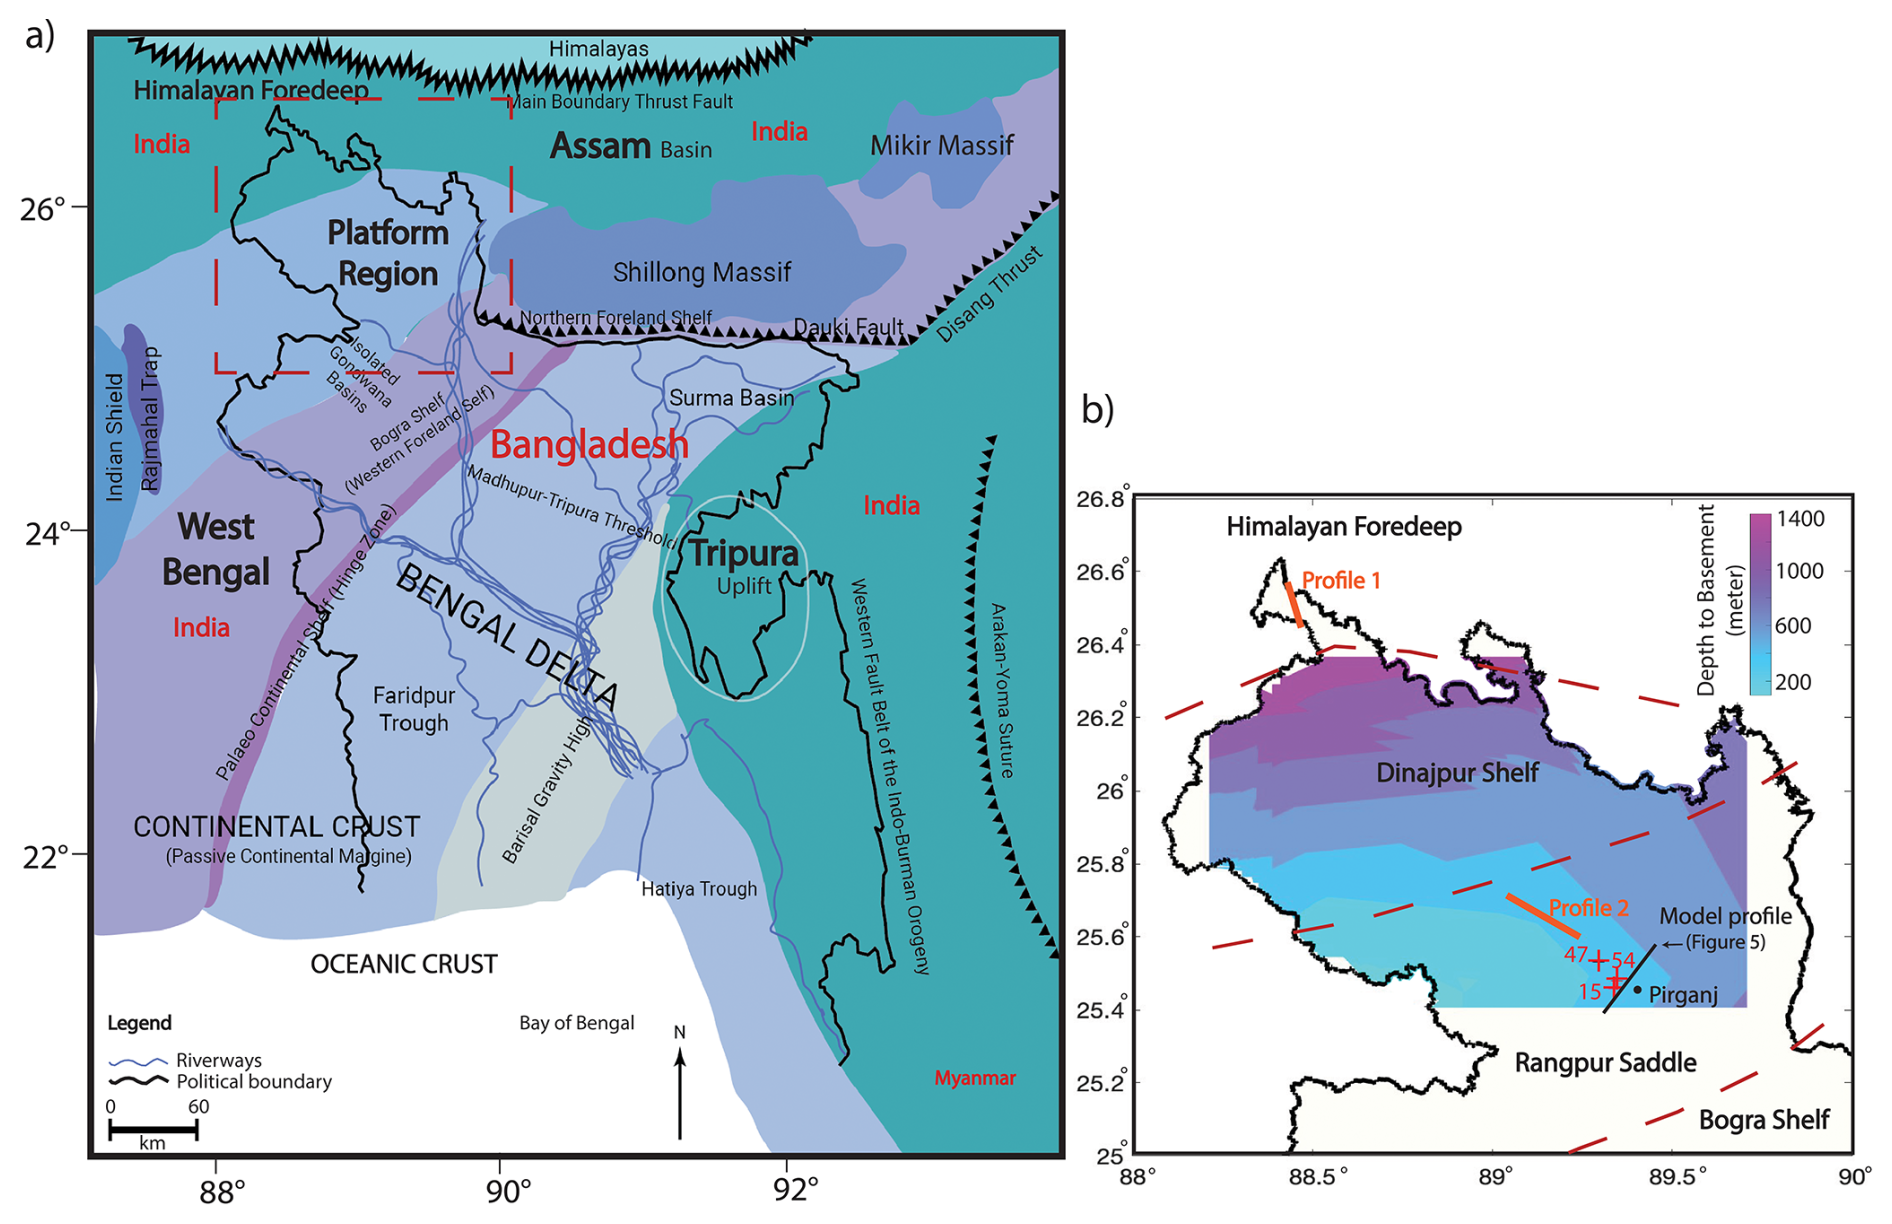
Figure 1(a) Regional geological map of Bangladesh adopted from Hossain et al. (2019), illustrating various geological and tectonic zones with distinct color coding. The names of neighboring countries are labeled in red. The red dashed box indicates the study area in the northwestern part of Bangladesh. (b) The map of the northwestern Bangladesh region shows basement depth with its tectonic subdivisions. Regional basement depths are collected from GSB and constructed from various seismic reflection surveys. Red dashed lines mark the approximate boundaries of the tectonic divisions. Seismic profiles (orange lines) and drilling locations (red plus signs) utilized in this study are also highlighted. Our specific study area, Pirganj, is also shown on the map, where the highest magnetic anomaly is observed. The integrated 2-D modeling profile of this study is also shown in this map with a solid black line.
In this study, we explore the possibility of mafic dykes as the source of high magnetic anomalies using multiple geophysical datasets while establishing the regional geological structure of this significantly understudied area. We aim to conduct integrated spatial analysis and develop subsurface models with gravity, magnetic, seismic, and drilling data to understand the regional geological features. Gravity and magnetic data are widely used to understand and characterize geological formations, particularly for identifying thin magnetic layers or faults (Adebiyi et al., 2023; Jaffal et al., 2010). High-resolution potential field data help identify structures related to local-scale mineralization that are covered by shallow alluvium or other unconsolidated sediments (Hendrickson, 2016; McCafferty et al., 2014). Since potential field data can yield multiple solutions (Filina et al., 2019), we also incorporate seismic and drilling data to constrain the subsurface framework and produce more reliable results (Sundararajan, 2012). Our study applies various filters to magnetic and gravity data to enhance and delineate regional crustal structures, with a focus on highlighting structure edges where metallic mineral deposits are likely to be found (Hildenbrand, 2000).
Bangladesh, though geographically compact, possesses a complex and diverse geological framework shaped largely by its position within the Bengal Basin (Roy and Chatterjee, 2015). This region is primarily divided into two major tectonic units (Morgan and McIntire, 1959). To the northwest of the hinge zone (see Fig. 1a for location), the stable platform region features a shallow basement composed predominantly of Precambrian-aged rocks (Uddin and Lundberg, 1998). Conversely, the southeastern portion of the Bengal Basin comprises a geosynclinal basin, distinguished by significant sediment accumulation, with sediment thicknesses exceeding 12 km (Alam, 1989). This tectonic configuration highlights the geological contrasts between the stable platform and the more dynamic, subsiding basin to the southeast.
The Bengal Basin, encompassing Bangladesh and parts of the neighboring Indian states of West Bengal, Assam, and Tripura, is situated at the northeastern edge of the Indian craton. It is one of South Asia's largest peripheral collisional foreland basins, with a sedimentary sequence spanning from the Early Cretaceous to the Holocene (DeCelles, 2011). The study area, located in the northwest part of the basin and known as the stable platform, consists of three geological components (Hossain et al., 2019): the Dinajpur Shelf, Rangpur Saddle, and the Bogra Shelf (Fig. 1b). The Himalayan Foredeep region, located just north of the Dinajpur Shelf, contains the deepest basement in the stable platform (Fig. 1b) and hosts numerous faults associated with extensional tectonics (Fig. 2a). South of the Foredeep region, the Dinajpur Shelf gently slopes northward toward the Himalayan Foredeep at an angle of 1–3° and is covered by recent sedimentary deposits. The Rangpur Saddle, the southern block of the Dinajpur Shelf, connects the Indian Shield to the Shillong Plateau and contains the shallowest basement in the Bengal Basin (Jain et al., 2020) (Fig. 1b). The Bogra Shelf, on the southern slope of the Rangpur Saddle, was formed during the Early Cretaceous rifting of the Indian plate from Gondwana (Alam, 1989; Alam et al., 2003). Both the Rangpur Saddle and Bogra Shelf host several horsts and graben, and half-graben basins (Fig. 2b).
The entire northwestern Bangladesh is geologically stable with minimal folding impact that can be traced back to Rodinia and Nuna or Columbia supercontinents (Ameen et al., 2007; Zhang et al., 2012). Ameen et al. (2007) suggest that the basement is a separate micro-continental fragment trapped during the northward migration of the Indian Plate, while Hossain et al. (2007) propose that it is a continuation of the central Indian tectonic zone. During the Precambrian, only the stable shelf of the Bengal basin was part of the Indian Plate within Gondwana. By the Middle Jurassic (∼170–175 Ma), the Indian Plate began drifting and became isolated by the end of the Paleocene (∼55.9 Ma) (Hossain et al., 2019). During the Late Paleozoic–Mid Mesozoic, the stable shelf was developed as an intra-cratonic rift basin with Gondwana sediments in graben structures, followed by Kerguelen igneous activity and widespread Rajmahal Trap volcanism (Hossain et al., 2019; Valdiya, 2016).
The basement in our study area is the shallowest part of the Stable Shelf, which is uplifted to a depth of 128 m from the surface, overlain by the Plio-Pleistocene Dupi Tila Sandstone and Madhupur Clay, and is mainly composed of crystalline rocks, including granite, granodiorite, and gneiss (Alam et al., 2003; Hossain et al., 2007). There is no outcrop of Precambrian basement in this area, and the commonly observed horst and graben structures control the stratigraphic subdivision. The Precambrian basement in this region lies beneath thick Cenozoic clastic deposits and is primarily felsic in composition, intersected by mafic-ultramafic and occasional felsic dykes (Chowdhury et al., 2022). Fault-bound graben basins within the basement contain Carboniferous rock units from the Permian Period (286 to 245 million years ago) called the Gondwana formation, marking the oldest sedimentary rocks in Bangladesh (Alam et al., 2003; Jain et al., 2020). Above the Permian Gondwana formation is the Jurassic Rajmahal Trap Formation, consisting of volcanic basalt strata (Alam, 1989; Roy and Chatterjee, 2015). The Shibganj Trapwash Formation overlays it, formed through weathering and erosion of the underlying igneous rocks (Khan, 1991).
The Rangpur Saddle serves as the subsurface extension of the Indian shield, stretching between the Shillong Plateau to the east and the Rajmahal Hills to the west. Geophysical studies have identified two major faults framing the Garo-Rajmahal gap: the Dhubri-Jamuna Fault (western edge of Garo Hills) and the Rajmahal Fault (eastern edge of Rajmahal Hills), which encloses the Rangpur saddle (Hossain et al., 2019). Tectonic activities, particularly extensional tectonics during continental rifting, have significantly disrupted the basement topography, forming numerous horsts and grabens (Ahamed et al., 2020; Khan and Rahman, 1992). Despite this, the study area remains predominantly flat with sediment covers (Khan, 1991) from the Pleistocene to the Holocene period (Reimann and Hiller, 1993). Near the Rangpur Saddle, the eastern part of the Indian Shield includes three major tectonic domains: Singhbhum Craton, Singhbhum Mobile Belt, and Chhotanagpur Gneissic Complex (Mukhopadhyay and Matin, 2020). Singhbhum Craton is characterized by prolonged crustal evolution during the Archean, comprising lithologies such as granitoids and metamorphic rocks. Singhbhum Mobile Belt underwent accretion and modification through volcanics, dyke swarms, and various intrusive bodies in the Proterozoic. Chhotanagpur Gneissic Complex comprises mainly of gneisses, amphibolites, and granulites with mafic dyke swarms, forming a structurally complex mobile belt. The tectonics of this region can be characterized by intra-cratonic structural depressions between the uplifted tectonic blocks. Seismic reflection studies indicate that the Moho in this region is complex and laminated, suggesting a history of tectonic and magmatic activity (Valdiya, 2016). In the West Bengal basin, the Moho is relatively shallow and horizontal (at a depth of 36 km), while other nearby regions (e.g., Kutch basin) have a dipping Moho influenced by tectonic processes (Rangin and Sibuet, 2017).
Magnetic minerals, particularly iron ore, are widely found across the Indian Shield. These iron deposits typically appear as metamorphosed banded iron or silica formations. In eastern India, the Precambrian iron ore of the Singhbhum-North Orissa region is a horseshoe-shaped synclinorium that contains the most significant iron deposits near Bangladesh. The first discovery of iron ore in Bangladesh is located on the Dinajpur slope of the Rangpur platform (Alam et al., 2003). Around 30 km southwest of our study area, Masum et al. (2021) report iron ore-bearing basement rock about 30 km southwest of our study area, with the iron ores occurring as a thin, metamorphosed laminated layer.
To understand the geological succession in Pirganj and its surroundings, we present a generalized lithological depiction using data from EDH-15 and GDH-54 drill holes (Table 1).
Table 1Stratigraphic Succession of Pirganj and its adjoining Areas according to drill holes EDH-15 and GDH-54.
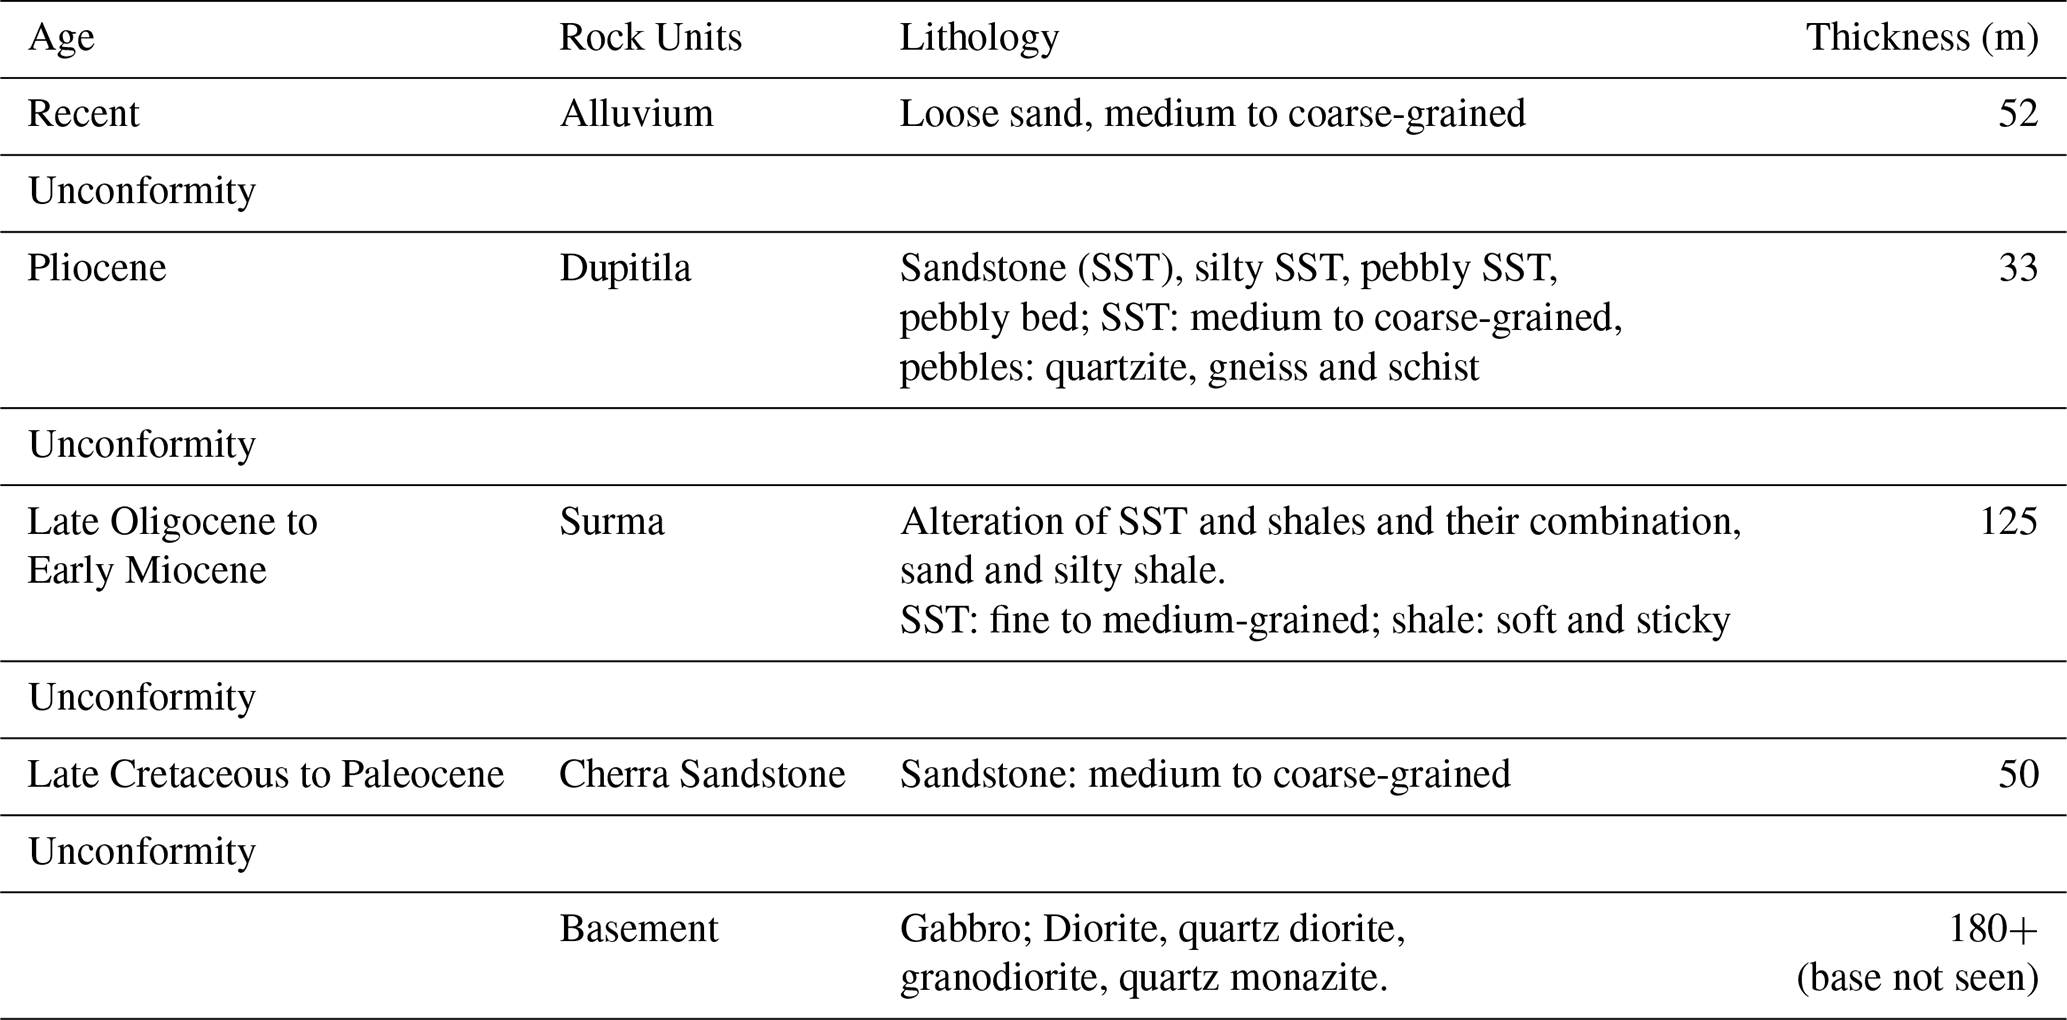
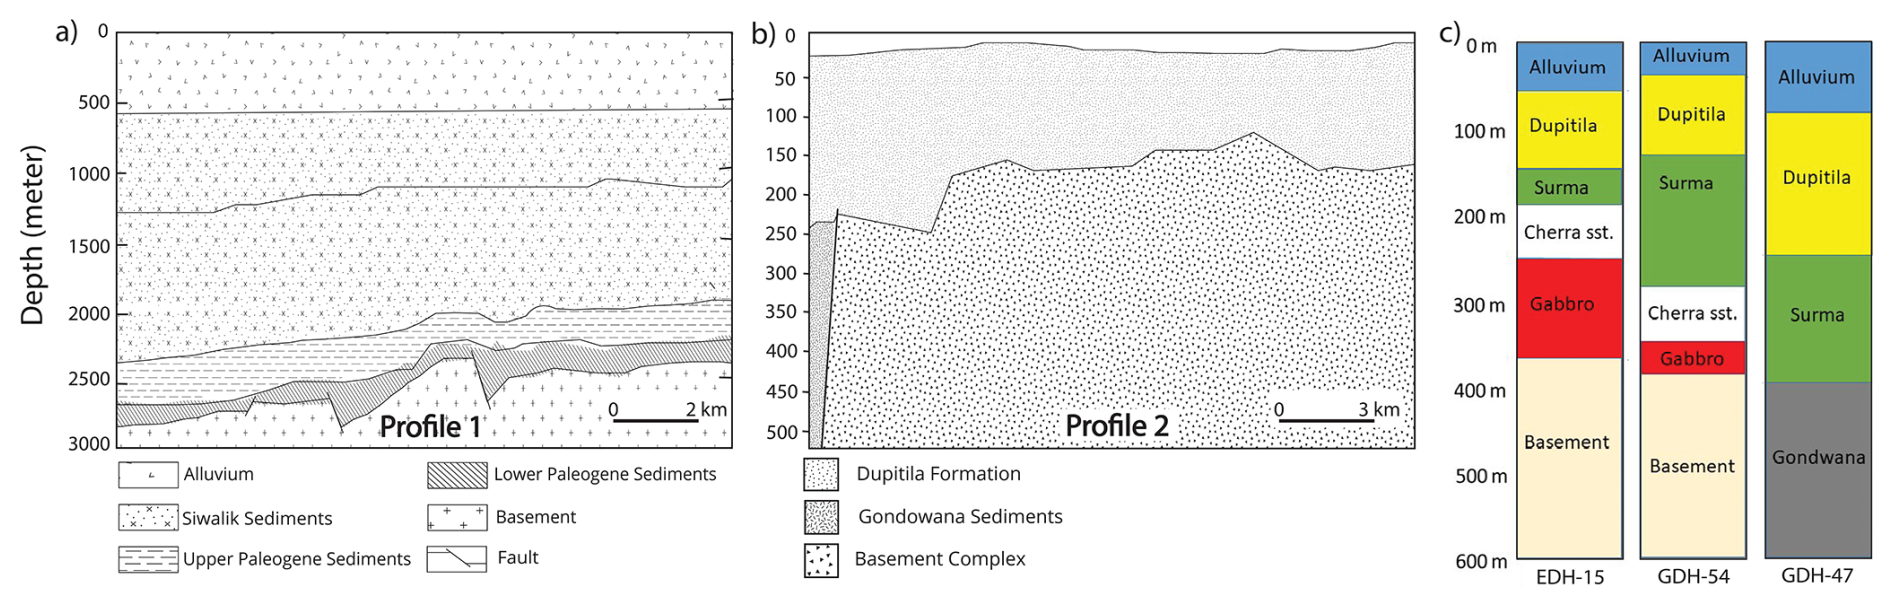
Figure 2Interpretation of seismic and drilling data used for integrated geophysical analysis in this study. (a) and (b) present interpretations of the two seismic profiles analyzed. (c) shows the drilling log data, which correlates with the 2D subsurface models and assists in spatial analysis. Refer to Fig. 1b for their locations. Seismic profile 1 is from Himalayan Foredeep region while profile 2 represents Rangpur Saddle. All the drilling logs are situated near the highest observed magnetic anomaly in Pirganj, located in Northwestern Bangladesh.
3.1 Geophysical Data
In this study, we apply an integrative analytical approach utilizing multiple geophysical datasets for spatial analysis and 2-D subsurface modeling. Our primary datasets are potential field data, specifically gravity and magnetic data, provided by the Geological Survey of Bangladesh (GSB). We use Bouguer gravity data and total magnetic intensity data for our analysis.
The gravity data presented in this paper represent a cumulative dataset acquired through successive land-based surveys initiated in the late 1970s and continuing to the present day. These surveys were primarily conducted during the dry season (November–April) to ensure accessibility, gradually covering approximately 8000 km2 in northwestern Bangladesh. Data acquisition methodology evolved over the decades to incorporate technological advancements. During the earlier campaigns (starting in the 1970s), gravity measurements were taken using an analog Sodin Worden gravimeter (Model WS 410), while surveys conducted after 2007 also deployed the digital Scintrex CG-5 AutoGrav. Cross-verification between the analog and digital instruments was performed regularly in later phases to ensure consistency across the historical dataset. Similarly, positioning methods were modernized over time; while earlier observation points relied on standard benchmarks from the Survey of Bangladesh, later campaigns utilized handheld GPS receivers and the CG-5's integrated GPS for precise coordinate determination.
Throughout the survey history, observation points were generally spaced 1–1.5 km apart. Elevations were determined using digital leveling referenced to benchmarks from the Survey of Bangladesh, maintaining high vertical accuracy crucial for gravity corrections. The Sylhet Gravity Base Station, connected to the IGSN 71 network, served as the primary national reference, with local sub-bases established to correct for instrument drift. Standard geophysical corrections – including those for instrumental drift, tidal and latitude variations, and elevation differences – were applied to the entire dataset. Bouguer corrections were calculated using a crustal density of 2.0 kg m−3.
Between 1979 and 1980, Hunting Geology & Geophysics Ltd. completed a nationwide aeromagnetic survey for the Government of Bangladesh, under the auspices of the Geological Survey of Bangladesh and Petrobangla. Flying a Geometrics G-803 proton magnetometer just 500 ft (≈152 m) above ground, the crew collected total-field data along flight lines oriented N 45° W on a nominal 3 km grid (locally tightened to 1 km) and crossed them with tie-lines oriented N 45° E at 5 km spacing. Measurements were recorded every two seconds with a resolution of ±0.05 nT, within a regional field that varied from 44 848 to 47 086 nT (inclinations 28°30′–38°30′, declinations 13–37° W). All readings were archived in both digital and analogue form, and the data were uniformly shifted upward by 900 nT so that every value is positive.
The topography data used in our geophysical modelling (Fig. S1 in the Supplement) are obtained from the online repository of the Scripps Institution of Oceanography, which are derived from satellite altimetry (Smith and Sandwell, 1997). Additionally, we incorporate interpretations of seismic images obtained from GSB to correlate our findings from gravity and magnetic data. However, raw seismic images are unavailable, as private entities originally collected them. To further refine our 2-D integrated modeling, we use drilling data from three boreholes near our study area, also provided by GSB (see Fig. 1b for the locations).
3.2 Methods
For geophysical spatial analysis, we use gravity and magnetic anomaly maps. The Bouguer gravity anomaly data are provided by GSB. For the total magnetic intensity map, we apply a differential reduction to the pole (RTP) to adjust the magnetic grid (Arkani-Hamed, 2007). This correction involves computing magnetic inclination, declination, and total magnetic field values based on the International Geomagnetic Reference Field (Alken et al., 2021) with a magnetic epoch of 1980.
The next step in our spatial analysis methodology involves removing the regional trend from both the gravity and magnetic data. This process, known as regional-residual separation, is essential for isolating local anomalies by filtering out the broader, long-wavelength trends associated with large-scale geological structures (Ashraf and Filina, 2023b; Kheyrollahi et al., 2021; Núñez-Demarco et al., 2023). Total magnetic intensity anomalies arise from the combined effect of induced and remanent magnetization in rocks. Induced magnetization is caused by the Earth's ambient field acting on magnetic minerals, so it is aligned parallel to the present field, whereas remanent magnetization is a permanent magnetization inherent to the rocks (acquired in the past) that often points in a different direction (reflecting the Earth's field at the time of rock formation). The total magnetization is the vector sum of the induced and remanent contributions. As a result, the direction and relative magnitude of each component strongly influence the observed anomaly. If the induced and remanent magnetization vectors are aligned, they reinforce each other to produce a stronger (high-amplitude) anomaly; if they are opposed or significantly misaligned, they partially cancel or reorient the net magnetization, which can weaken the anomaly or even yield one of opposite polarity compared to what an induced-only model would predict. This interplay complicates data interpretation, since assuming all magnetization is induced (parallel to today's field) can lead to errors in locating or characterizing sources.
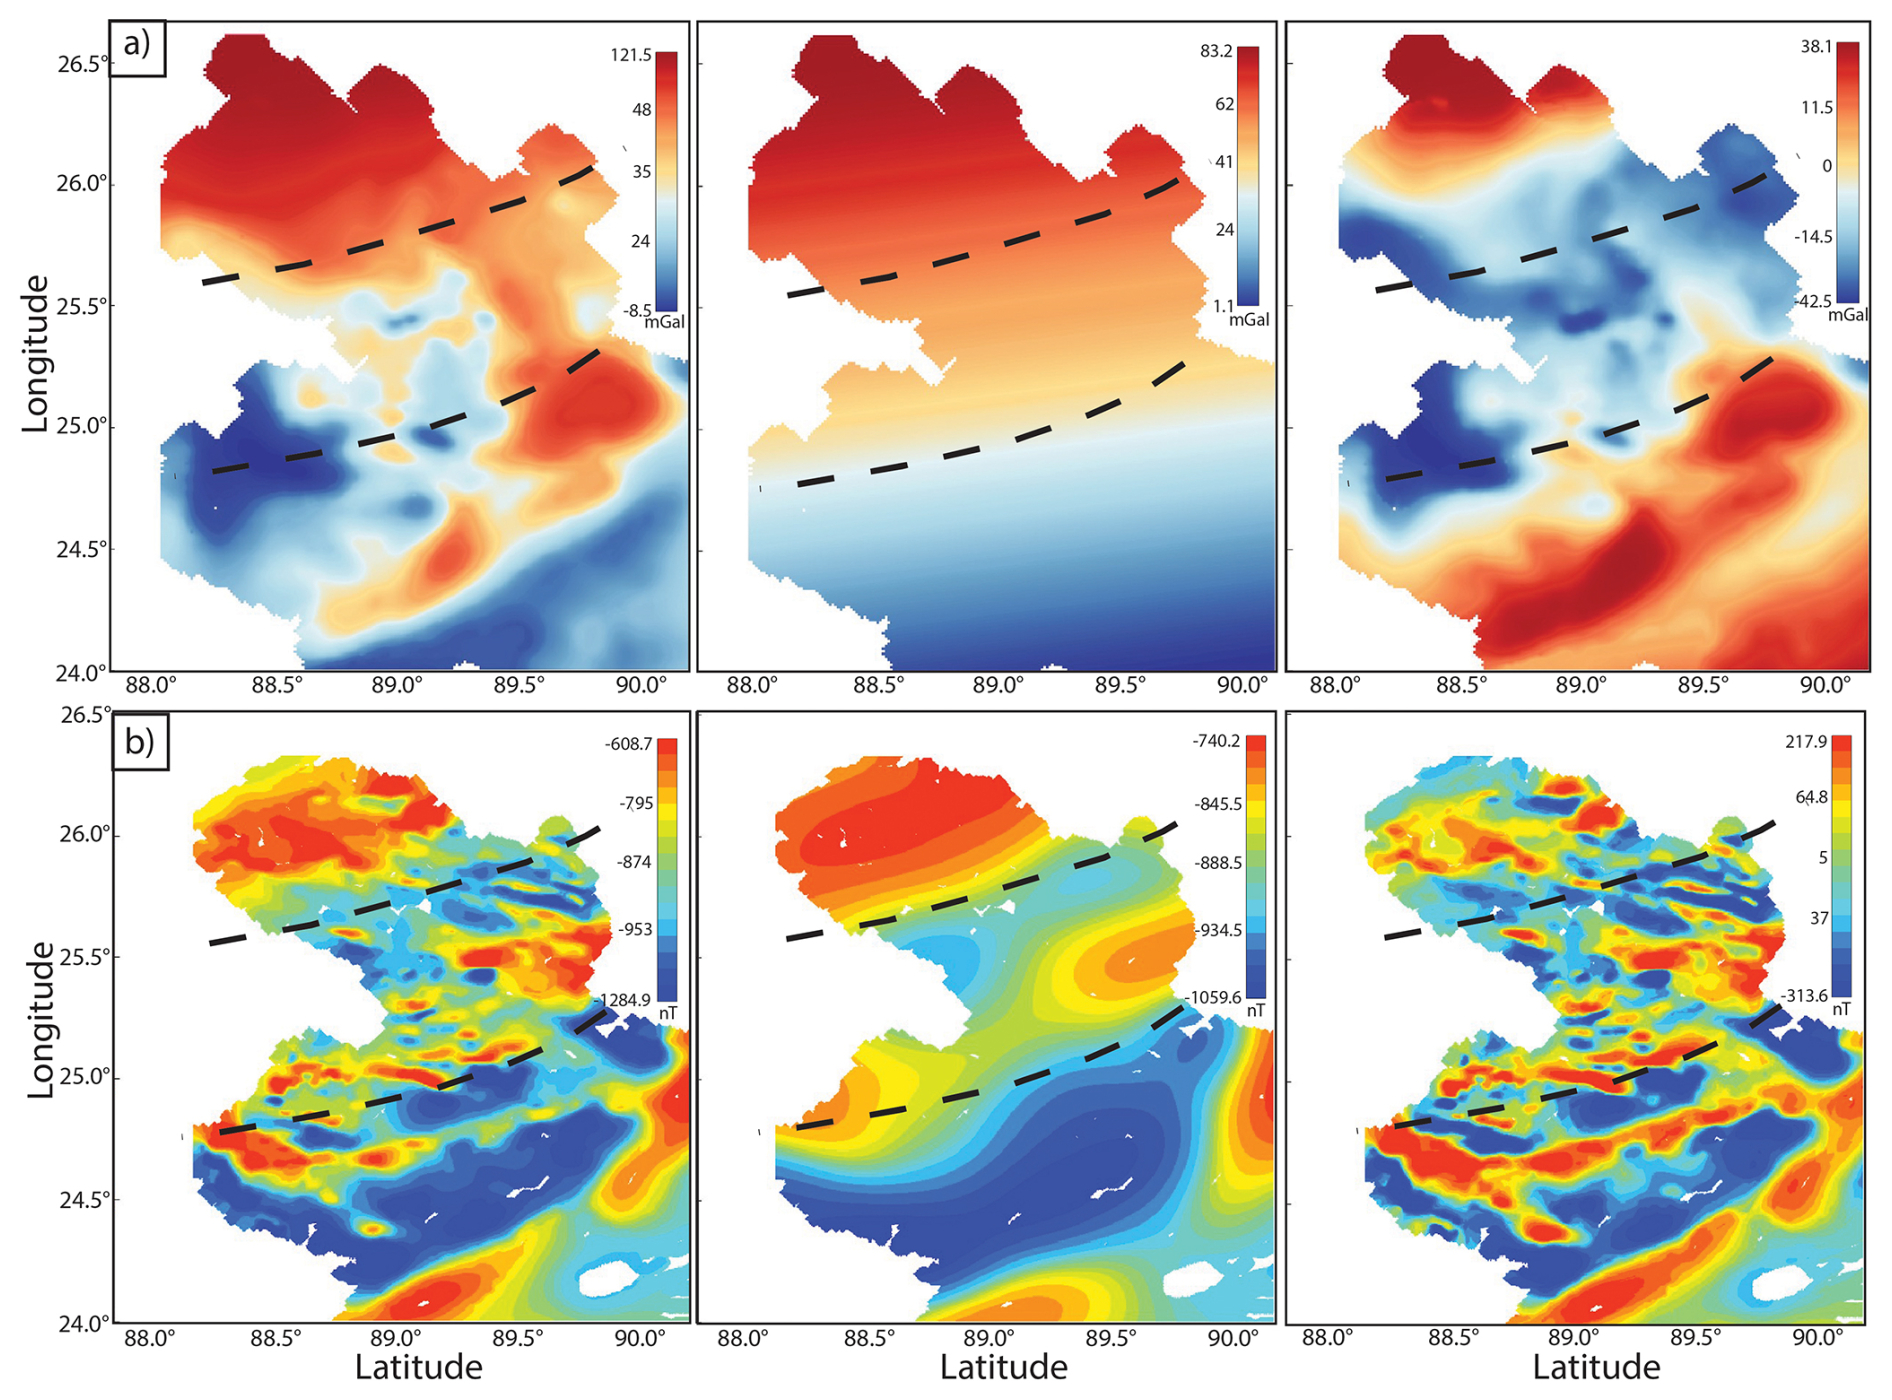
Figure 3Potential field data maps of northwestern Bangladesh used in this study to analyze geological and tectonic features. (a) Gravity anomaly maps: from left to right, the Bouguer gravity anomaly, regional Bouguer gravity anomaly with 1000 m upward continuation, and residual Bouguer gravity anomaly. (b) Magnetic anomaly maps: from left to right, the RTP total magnetic anomaly, regional magnetic anomaly after Gaussian filtering, and residual magnetic anomaly. The black dashed lines show the boundary of Rangpur Saddle.
By removing these regional trends, we enhance the visibility of smaller-scale or high-frequency anomalies, allowing subtle features and variations in the subsurface to be highlighted more effectively. To remove regional anomalies, we apply an upward continuation of 1000 m to the Bouguer gravity data (Fig. 3a). This approach simulates measuring the gravity field at a higher elevation – 1000 m in our case – effectively smoothing out high-frequency anomalies associated with shallow or near-surface geological features (Balogun et al., 2023). For RTP magnetic anomaly, we use a Gaussian filter to calculate the regional trend (Fig. 3b). This Gaussian filter acts as a low-pass filter, smoothing out high-frequency components in the dataset. After extracting the regional anomaly from the potential field, we subtract it from the unfiltered total anomaly, yielding the residual anomaly (Fig. 3).
We apply several filters to the residual potential field data to enhance specific features and improve interpretability (Fig. 3). Under the framework of Poisson's theorem in potential-field theory, taking a vertical derivative of gravity and performing a reduction-to-the-pole on magnetic data are mathematically analogous operations and are equivalent Fourier-domain operations: both sharpen source-edge contrasts while suppressing deep, long-wavelength signals, thus yielding mutually consistent structural imagery (Blakely, 1996). The filters we have used involve various forms of derivative operations, which help to highlight changes in the data that correspond to geological boundaries, faults, or other structural details (Ibraheem et al., 2023; Ma et al., 2016; Nasuti et al., 2019; Núñez-Demarco et al., 2023). For the residual RTP magnetic data, we apply and show two filters: the horizontal derivative and the tilt derivative. The horizontal derivative filter, applied in x-direction (i.e., across the longitudes) and y-direction (i.e., across the latitudes), accentuates lateral changes in the magnetic field, helping to reveal abrupt variations. The tilt derivative filter, however, is especially effective as an edge detector. It operates by combining both vertical and horizontal gradients, effectively highlighting the edges of anomalous bodies. The tilt derivative produces values that tend toward zero over magnetically flat regions, positive over rising areas, and negative over falling areas, creating a clear demarcation of the edges of magnetic sources. As a result, this filter enhances the boundaries of anomalies and helps pinpoint the locations and shapes of features with minimal distortion across varying depths (Ashraf and Filina, 2023b; Pham and Oliveira, 2023). We apply the lineament mapping techniques to map major structural boundaries from the filtered magnetic data (Ashraf and Filina, 2023a, b; Ogah and Abubakar, 2024; Zhang et al., 2024). Our approach focused on identifying gaps between magnetic stripes, changes in the stripe orientation, and a significant reduction in stripe width. We also calculate the analytical signals of the magnetic anomalies to highlight the areas with high magnetizing amplitude (Nabighian, 1972; Roest and Pilkington, 1993) that may illuminate magnetic mineral deposits (Mohamed et al., 2022). To calculate the analytical signal of the residual magnetic data, we first compute the horizontal and vertical derivatives of the magnetic field in the x, y, and z directions. The analytical signal was then derived by taking the square root of the sum of the squares of these derivatives, yielding a map that represents the amplitude of the magnetic field independent of direction and highlights the edges of magnetic sources. To validate our interpretations, we cross-reference the magnetic lineaments with gravity data. Before validating with gravity data, we filter the residual gravity data by applying the first vertical derivative and tilt derivative to map major tectonic structures and delineate their boundaries.
We also develop 2-D integrated models of the subsurface to examine the variations in the physical properties of the rocks (density and magnetic susceptibility). We build our models using the GM-SYS module within the Geosoft software suite, employing a 2-D approximation. The GM-SYS model is extended to ±30 000 km (i.e., infinity) along the X-axis and 90 km along the Z-axis to eliminate edge effects. Due to the absence of reliable magnetic susceptibility logs for the sedimentary cover and granitic basement, we treat these lithologies as a non-magnetic background (0 SI). This approximation reduces the non-uniqueness of the potential field problem, ensuring that the modeled response is driven primarily by the lateral susceptibility contrast of the target magnetic unit. By integrating gravity and magnetic data within this 2D context, we can delineate major geological boundaries and assess regional structural trends with sufficient accuracy for our research objectives. Our goal is to develop a simple subsurface structure that satisfactorily aligns with gravity, magnetic, and logging data without introducing excessive complexity that might overfit the potential field anomaly. Instead, we aim to replicate the general pattern of the observed anomaly in our 2D modeling, seeking to generate computed anomalies with comparable amplitude, wavelength, and phase to those observed in the potential fields.
4.1 Integrated spatial analysis
In this study, we first establish the regional tectonic structures of northwestern Bangladesh through spatial analysis of multiple geophysical datasets. We utilize gravity, magnetic, seismic image interpretations, and drilling log data to characterize the tectonic setup of this region. Our analysis of residual magnetic and gravity anomalies reveals that the Rangpur Saddle exhibits distinctly different geophysical characteristics compared to its northern counterpart, the Himalayan Foredeep region. These differences are discernible in the long-wavelength or broad-scale geophysical signatures across the two regions.
In the Himalayan Foredeep, north of 26° N latitude, we observe a high residual Bouguer gravity anomaly, ranging from approximately 5 to 30 mGal. In contrast, the Rangpur Saddle, located south of this latitude, is marked by a low residual Bouguer gravity anomaly, typically between −22 and 0 mGal. Similarly, the Rangpur Saddle shows lower residual RTP total magnetic anomalies, ranging from 0 to 260 nT compared to mostly high magnetic anomalies in north (∼0 to 215 nT). The spatial patterns of these anomalies also differ across the regions. South of 26° N latitude, in the Rangpur Saddle, the horizontal and tilt derivative magnetic anomalies show a predominance of NW–SE trending magnetic lineaments. North of this latitude, in the Himalayan Foredeep, the magnetic anomaly trend shifts predominantly to a SW–NE orientation. Additionally, in the vertical and tilt derivatives of the gravity data, we observe the most pronounced high gravity linear anomaly patch trends NW-SE south of 26° N latitude, consistent with the magnetic anomaly trend in this area. South of 26°30′ N latitude, we see another linear high-gravity patch in the filtered Bouguer gravity data trending NW–SE, indicating a different orientation than the other high-gravity patch of the Rangpur Saddle region. These two high-gravity patches are also traceable in the filtered magnetic anomalies, following the magnetic lineament mapping procedure. Notably, some areas exhibit strong inverse gravity and magnetic field trends, where high gravity coincides with low magnetic anomalies, or vice versa. One might expect a corresponding increase in the gravity signal due to the higher density of the gabbroic intrusions relative to the overlying rocks; however, this expected gravity anomaly is not observed in our data. We believe this discrepancy arises from two interconnected factors. First, gravity and magnetic methods are most sensitive to lateral variations in subsurface properties, and in our study area, the subsurface structures are predominantly flat-lying. At depth, the gabbroic intrusions are laterally adjacent to felsic basement rocks, and while the density contrast between these lithologies is modest (∼0.1 kg m−3), their magnetic susceptibilities differ significantly. This contrast produces a strong magnetic response but only a subtle gravity anomaly that may be indistinguishable from background variations. Also, the intrusions occur in fault-bounded graben fill that causes a localized low density (due to thick low-density Gondwana sediments in the graben). Second, the spatial resolution of our gravity survey, with a station spacing of approximately 3 km, is relatively coarse compared to the scale of the gabbroic intrusions. As a result, any high-frequency gravity signals associated with these smaller or more localized bodies are likely undersampled and thus not adequately captured in the final gravity dataset. In brief, the high gravity areas correspond to uplifted blocks of dense basement, whereas the magnetic highs occur on the flanks where intrusions have come up along faults and the graben is filled with lighter sediment, yielding a relative gravity low.
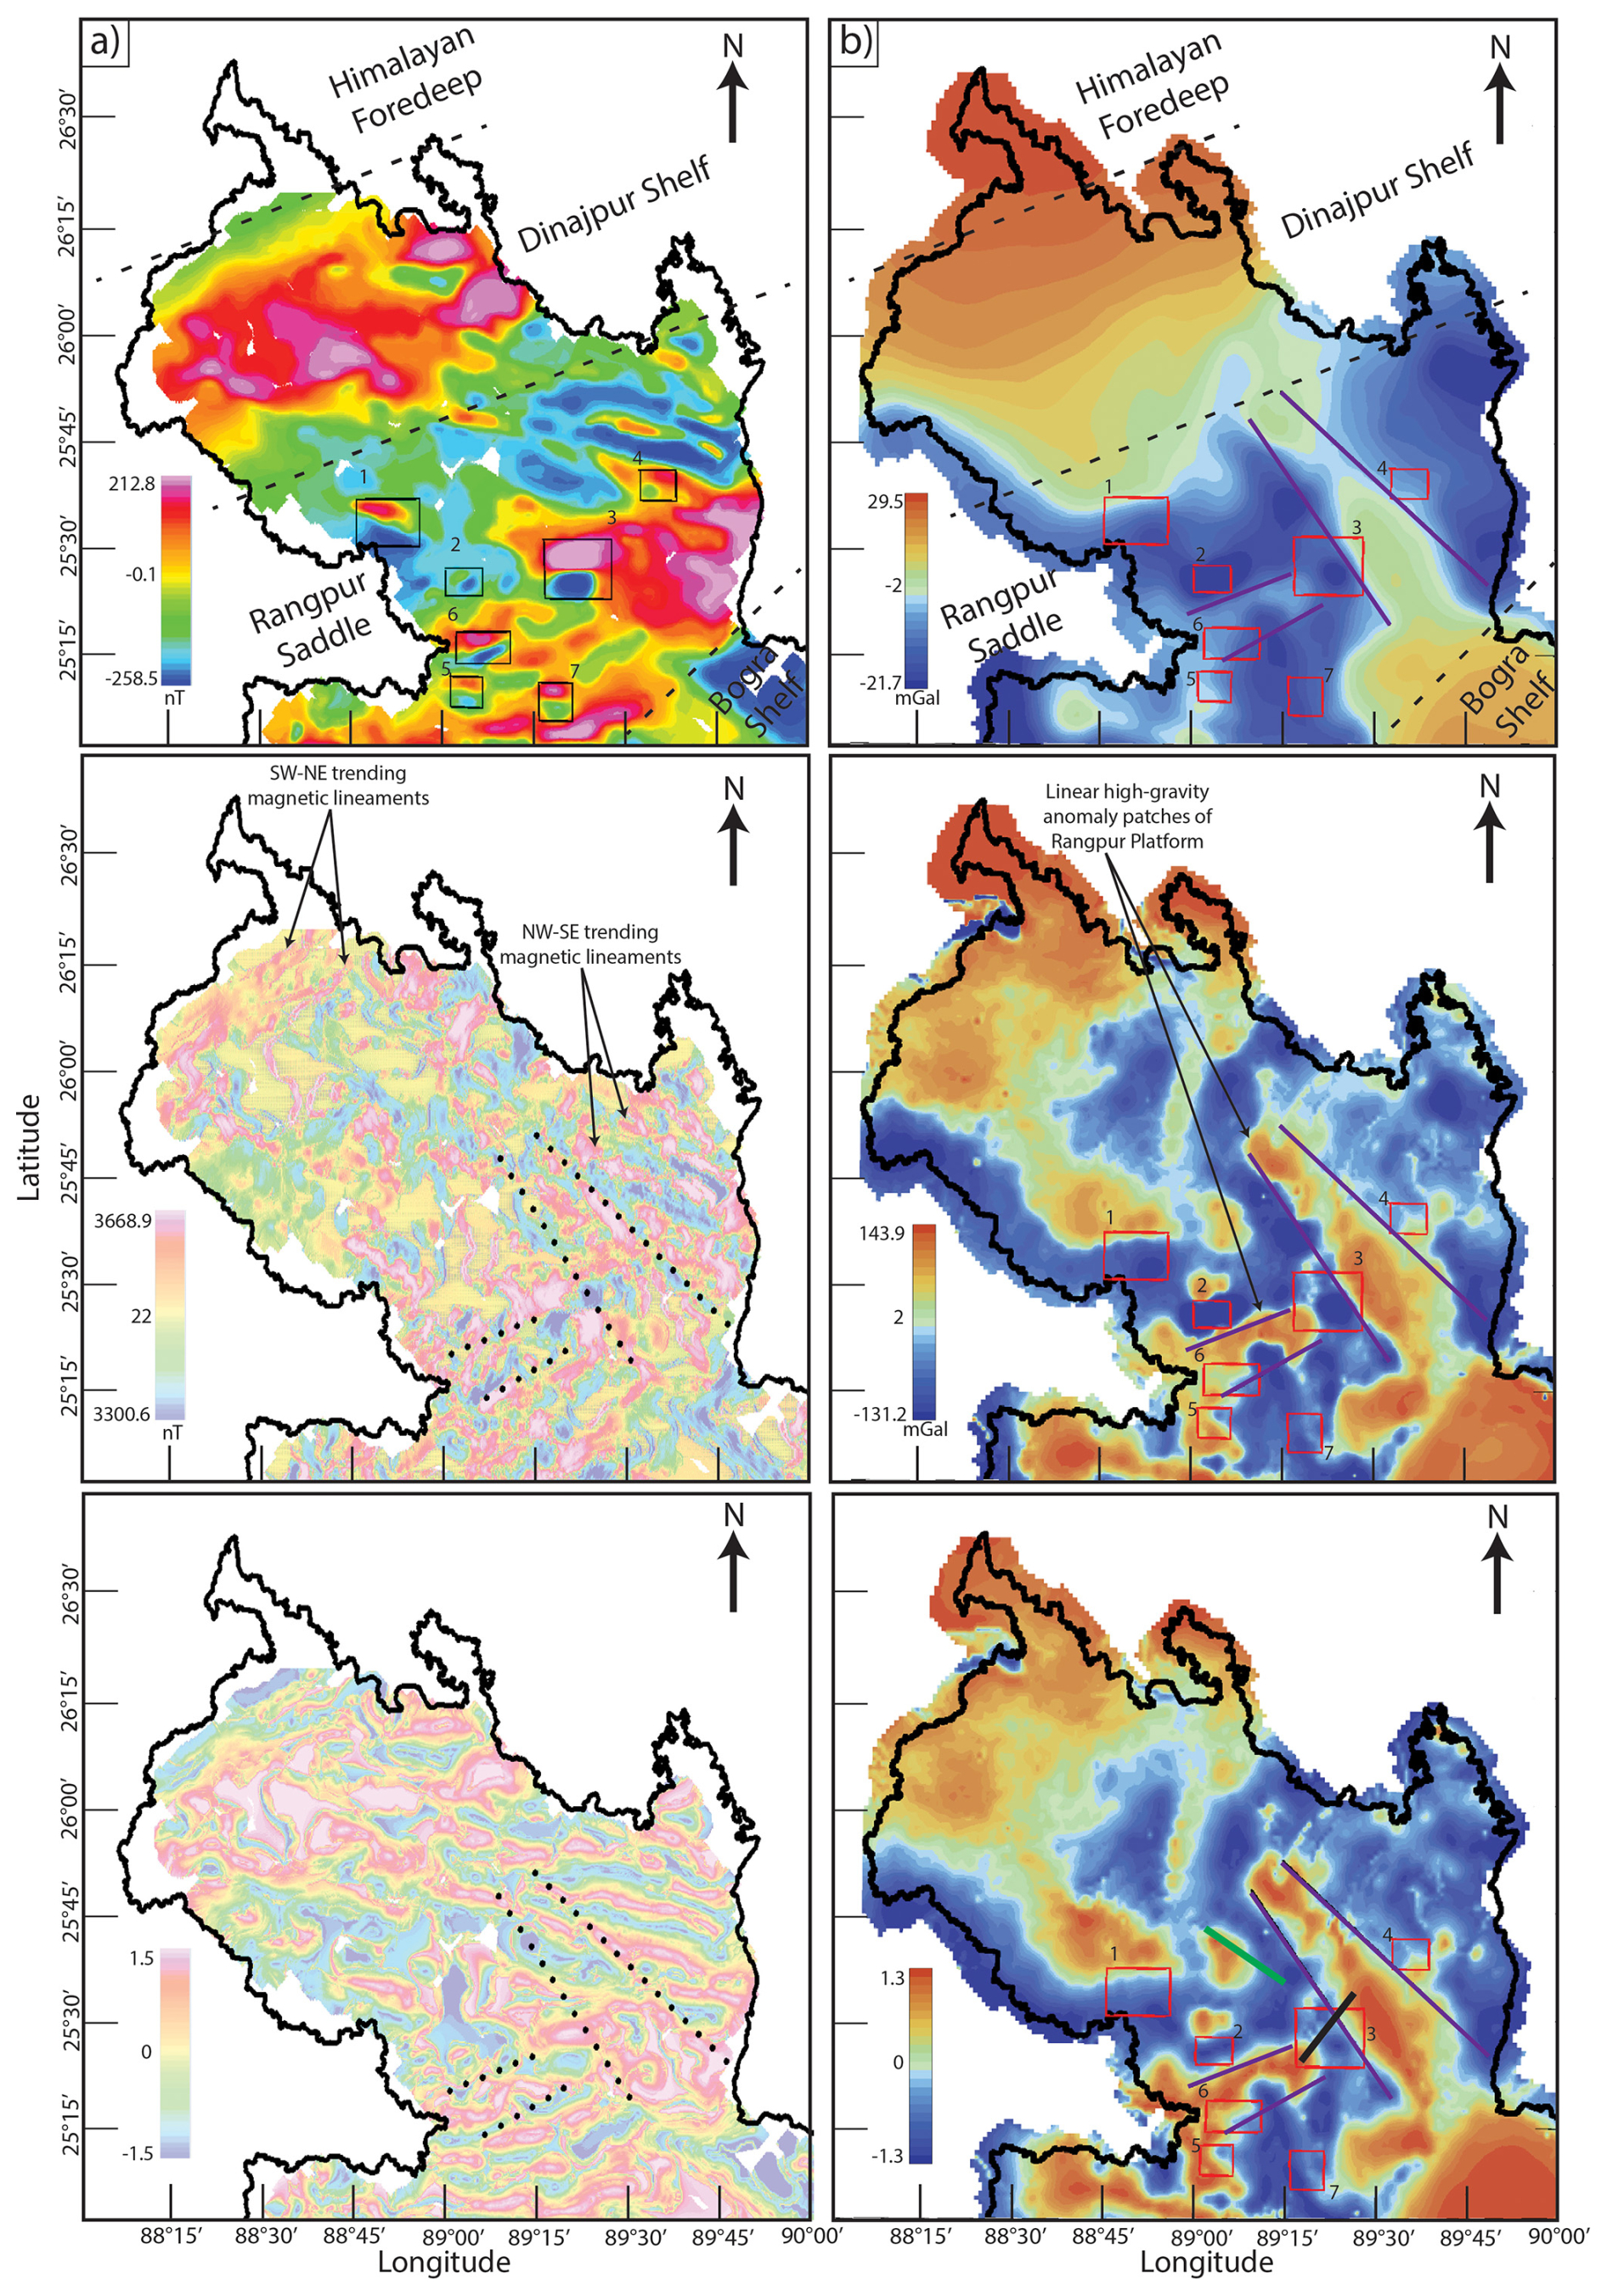
Figure 4(a) Magnetic anomaly maps of northwestern Bangladesh. The top panel displays the residual RTP total magnetic anomaly, the middle panel shows the first horizontal derivative in the x-direction (across longitudes), and the bottom panel illustrates the tilt derivative. Black boxes highlight areas where oval dipolar magnetic patterns are observed. Dotted black lines in the middle and bottom panels indicate boundaries of high gravity regions. (b) Bouguer gravity anomaly maps of northwestern Bangladesh. The top panel presents the residual Bouguer gravity anomaly, the middle panel shows the first vertical derivative, and the bottom panel displays the tilt derivative. High gravity regions are outlined by purple solid lines, and red boxes indicate areas with dipolar magnetic patterns. The solid green line in the bottom panel represents seismic profile 2 from Fig. 2. The thick solid black line shows the 2-D integrated modelling profile of Fig. 5.
Within the Rangpur Saddle region, we observe multiple oval dipolar patterns. From the RTP residual magnetic anomaly data, we identify seven distinct patterns. The identification of these patterns follows several consistent criteria. First, the dipolar magnetic anomalies are generally oriented in a north-south direction. Second, each pattern features a magnetic high in the northern section and a corresponding low to the south. Third, within each pattern, the size, area, and amplitude of the magnetic high and low anomalies are comparable, contributing to a symmetrical structure. The filtered magnetic data also reveals possible signatures of remanently magnetized sources, some of which may be reversely magnetized. At the Earth's magnetic field inclination of approximately 45° in northwestern Bangladesh (based on the IGRF 1980 epoch used for RTP correction), reversely magnetized sources such as gabbroic intrusions formed during past geomagnetic reversals produce negative anomalies after RTP where positive anomalies would align with the current field. Mapping these magnetic patterns onto the filtered gravity maps reveals that they consistently lie near the boundary between high and low gravity anomalies. While most of these magnetic patterns (patterns 1, 4, 5, 6, and 7) intersect only one boundary, a few patterns (specifically patterns 2 and 3) touch boundaries on both sides.
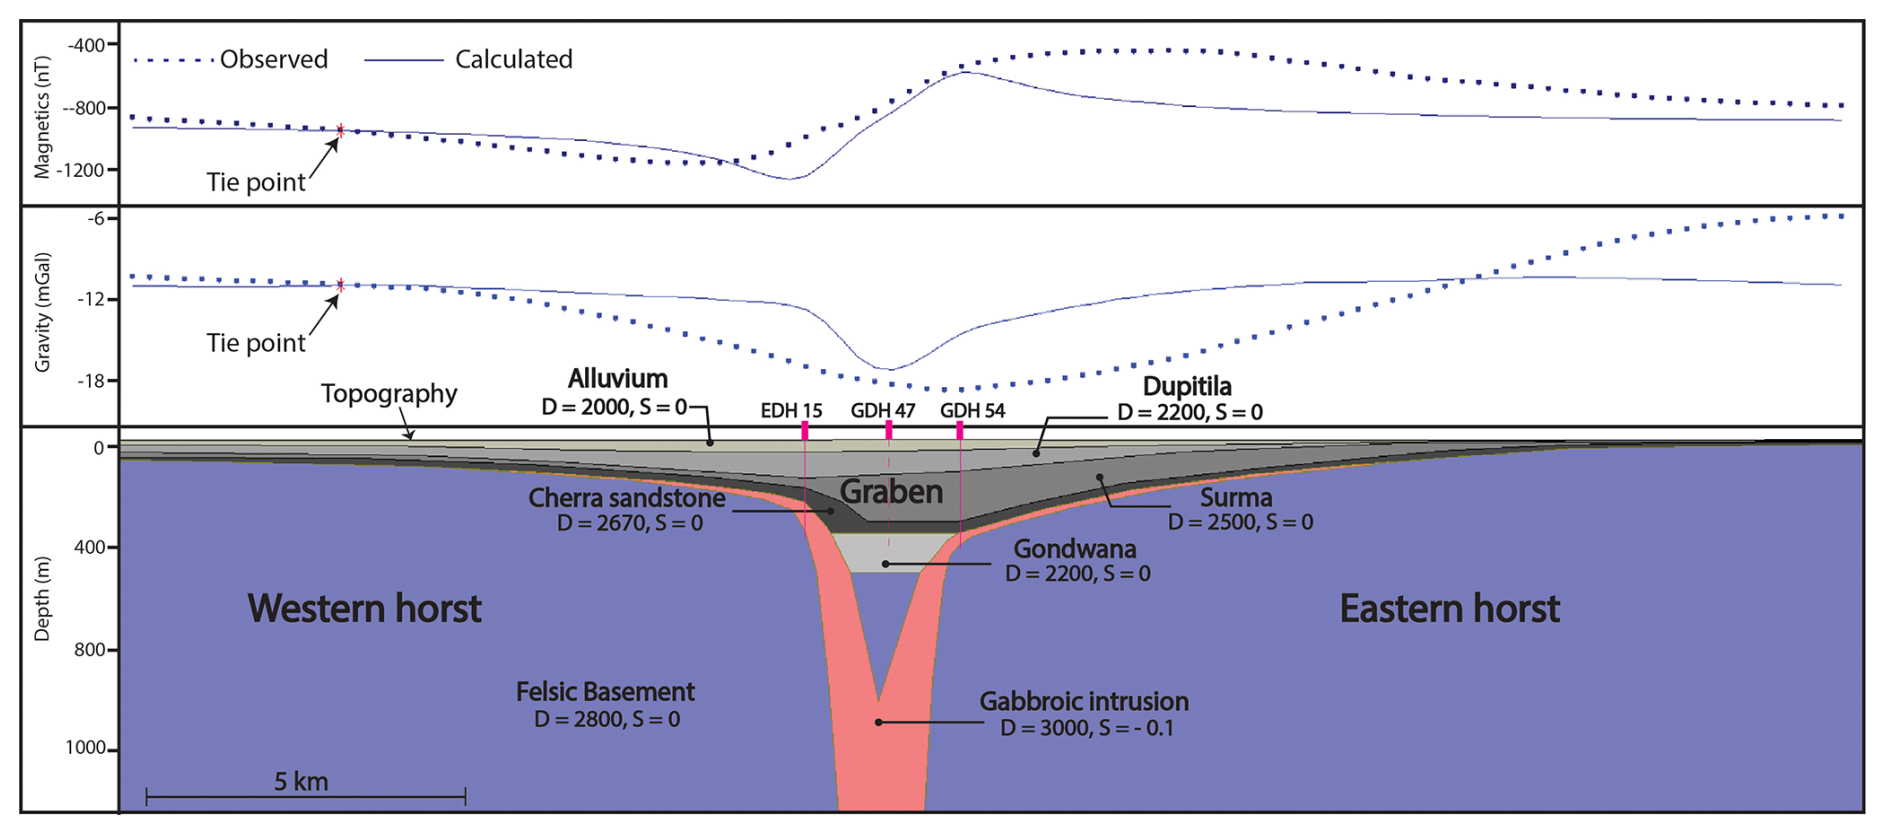
Figure 5Integrated 2D geophysical model over the highest magnetic anomaly in northwestern Bangladesh. See Figs. 1b and 4c for the location of the model profile. The top panel presents the total magnetic intensity anomaly, and the middle panel shows the gravity anomaly, with observed (dotted) and calculated (solid) data. Tie points, marked by red stars, indicate where the calculated anomalies are vertically shifted to align with the observed data. The bottom panel illustrates the subsurface model, with geological units represented by distinct colors. “D” denotes density (kg m−3), and “S” denotes magnetic susceptibility (SI units). Bold pink vertical dashes mark the locations of drilling logs used to constrain subsurface units. Thin vertical pink lines extend downward from these surface locations. Solid pink lines beneath EDH 15 and GDH 54 indicate where the forward model is directly tied to lithological boundaries from well logs. In contrast, the dashed pink line beneath GDH 47 reflects an interpretative connection, as this well does not lie directly along the modeling profile.
4.2 Integrated subsurface modeling
We develop a 2-D subsurface model utilizing gravity, magnetic, and drilling log data (Fig. 5). The goal of this model is to approximate the observed anomalies on a local scale while aligning with the available drilling log information (Fig. 2c). The magnetic anomaly modeled in Fig. 5 is the residual RTP anomaly, reflecting local high-frequency features after removing regional trends. Importantly, we do not aim to achieve a precise fit between the observed data and calculated anomalies. This decision is driven by the fact that the observed potential field data are influenced by regional structures, and without sufficient seismic information, constructing a reliable regional model is not feasible. Instead, we focus on developing a simplified version of the subsurface model that reasonably fits the observed anomalies and drilling data.
To ground the 2-D model in reality, we incorporated available drilling log information (Fig. 2). Based on these logs, the model includes five sedimentary layers above a crystalline basement. The shallowest layer is assigned as alluvium, extending to a depth of 50 m or less. Beneath the alluvium, we sequentially include the Dupitila, Surma, and Cherra sandstone layers. The variable thickness of these sedimentary layers comes from the drilling log information, except for the Gondwana layer. The thickness of Gondwana is approximated based on the gravity fit. Below these layers, we model a mafic intrusion of gabbro, which occurs within fault structures that have developed within the underlying felsic basement.
The resulting model indicates that a horst and graben structure is the most plausible configuration when considering the regional geological context. This structural interpretation also provides a reasonable match to the observed geophysical anomalies. Additionally, based on information from drilling log GDH 47, we assign a layer of Gondwana sediments within the graben basin, which is contributing to the low observed gravity in this region.
Densities in the model are derived from drilling data, reflecting the unique lithological characteristics of each unit. To get an initial guess on the density, we developed a gravity model for profile 1 that has seismic-derived subsurface information (Fig. S2). The alluvium, Dupitila, Surma, and Cherra Sandstone layers are modeled with densities of 2000, 2200, 2500, and 2670 kg m−3, capturing their progressive compaction and mineral composition. The Gondwana unit, enriched with coal deposits, exhibits a notably lower density of 2200 kg m−3, consistent with its organic-rich composition. Beneath these layers, the felsic basement and gabbroic intrusion stand out with densities of 2800 and 3000 kg m−3, highlighting their denser crystalline structure and mafic origins.
Between 400 and 800 m depth, the gabbroic intrusion begins to follow the fault plane. The thickness of both the Gondwana layer and the underlying felsic basement is determined from the amplitude of the calculated gravity and magnetic anomalies. The thickness of the Gondwana layer influences the minimum value of the calculated gravity anomaly, while the amplitude of the magnetic anomaly helps determine the depth of the gabbroic intrusion. Notably, our calculated anomalies are of high frequency. This occurs because our modeling does not incorporate all regional structures; instead, it focuses only on local structures. As a result, the calculated anomalies reflect primarily local or high-frequency potential field anomalies.
Our 2D subsurface model reveals two horst structures with a graben basin in the middle. We refer to these as the eastern and western horsts based on their geographic locations. In the model, the western horst structure is depicted as deeper, consistent with the observed gravity anomaly, which shows lower gravity in the western horst compared to the eastern horst. Our model does not include the broader horst structure on the eastern side, which likely explains the discrepancy between the calculated and observed anomalies over the eastern horst.
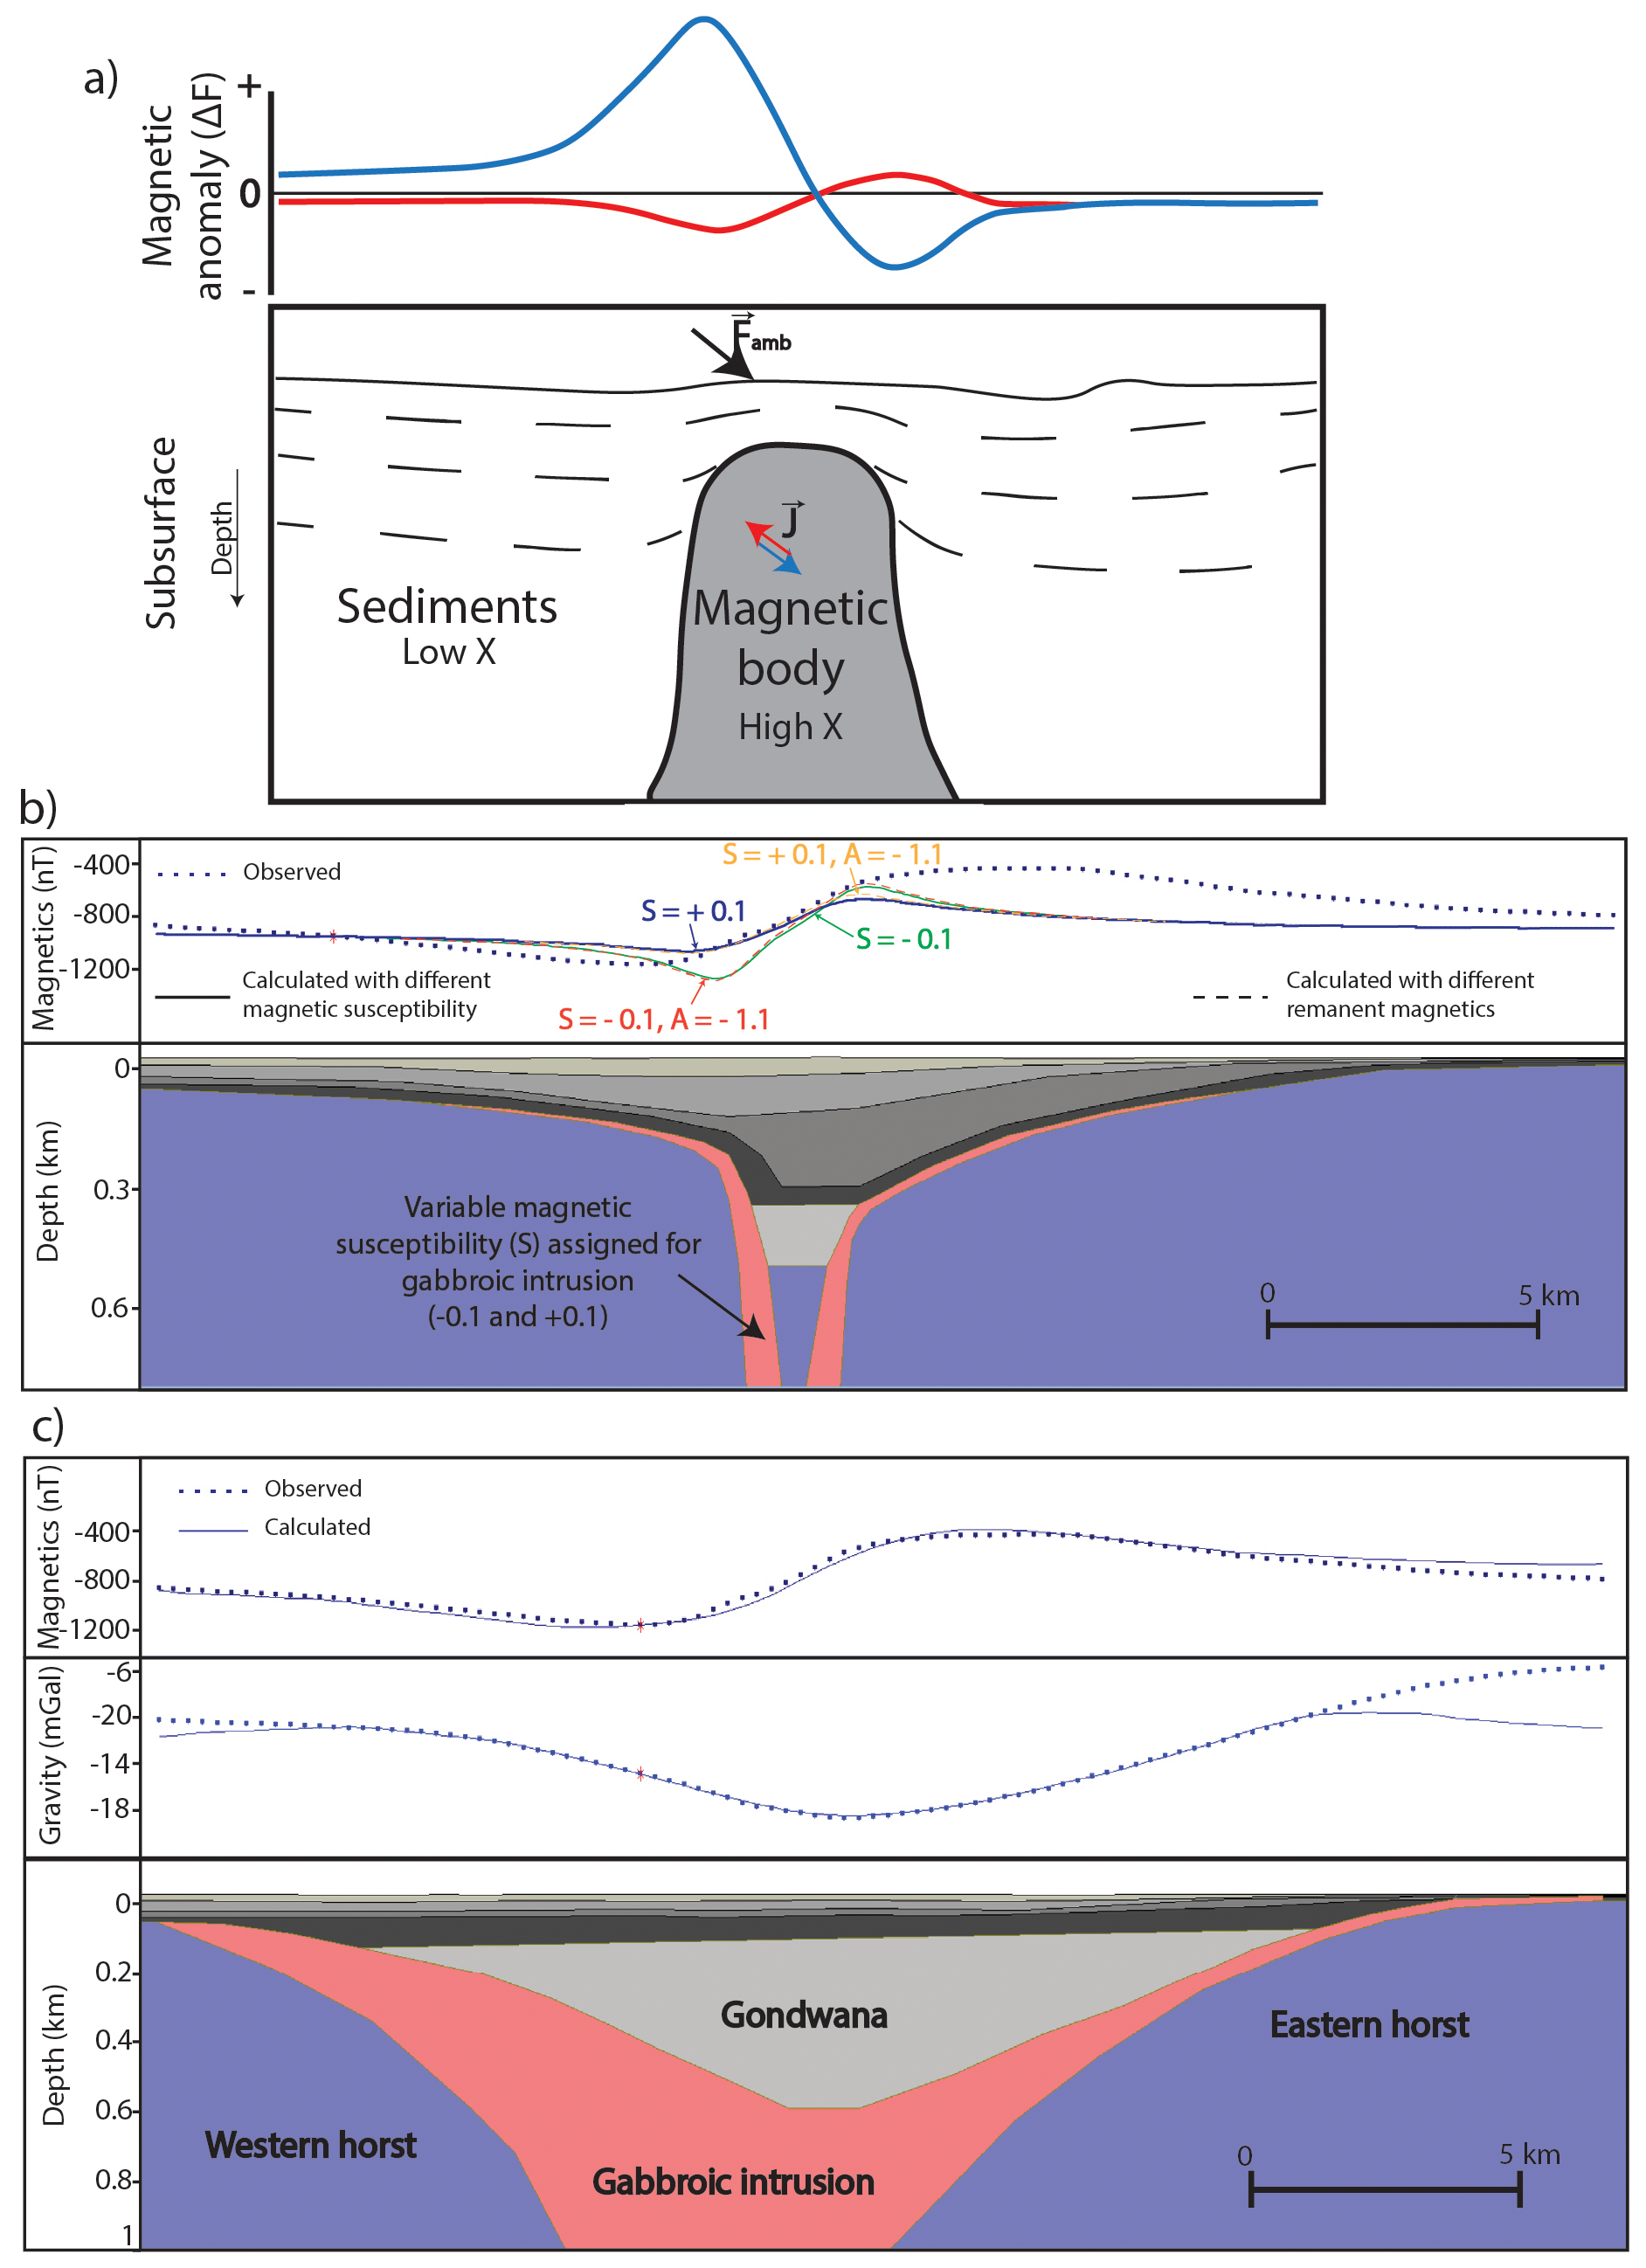
Figure 6(a) Conceptual illustration showing polarization direction of the remanent magnetization affecting the total magnetic intensity reading of a dome-shaped magnetic body. The synthetic total-field anomaly (ΔF) profiles are calculated for a concealed high-susceptibility intrusion beneath low-susceptibility sediments. The blue curve represents the response when magnetization is purely induced parallel to the present-day ambient field Famb, producing a simple positive–negative (dipolar) signature. The red curve shows how the anomaly shape and amplitude are modified when an oblique remanent magnetization component J is added to the induced vector. (b) Investigation on how incorporating both remanent magnetization (A) and magnetic susceptibility (S) in the forward model affects the total magnetic intensity and its polarity. (c) 2-D forward modelling along the same profile as Fig. 5, where we have achieved a perfect fit between the calculated and observed anomalies except for the model edges.
We acknowledge the mismatch between the observed and calculated anomalies in our forward model. We aim to adopt the simplest model that captures the essential features of the observed anomaly without introducing unnecessary complexity. While even basic 2-D models can yield multiple valid solutions, incorporating intricate structures without strong geological constraints would increase interpretive ambiguity. Additionally, our model is inherently two-dimensional and thus cannot fully represent the three-dimensional geological variations present in the study area, such as the broad, shallow eastern horst, whose lateral extent likely contributes to higher observed gravity values. Finally, our modeling profile spans a smaller area than the full potential field survey (refer to Sect. 3.1), resulting in calculated anomalies that emphasize localized, high-frequency features, whereas the observed data reflect broader, lower-frequency trends. Our forward model is calculated on 250 m spacing, whereas the gravity data were acquired every 1–1.5 km and the magnetic data every 5 km.
Furthermore, we also test alternative models, which further support that the presented version offers the most concise and geologically reasonable solution. First, we test how the polarization direction of the remanent magnetization affects the total magnetic intensity reading of a dome-shaped magnetic body (Fig. 6a). We incorporate both remanent magnetization (A) and magnetic susceptibility (S) in the forward model, which affects the total magnetic intensity and its polarity (Fig. 6b). When we assign only a positive susceptibility contrast ( SI) without remanence, the calculated anomaly captures the general shape of the observed data more accurately in terms of slope, but the amplitude (highs and lows) is notably lower than the observed values. In contrast, using a reverse-polarity remanent magnetization yields calculated amplitudes that closely match the observed highs and lows; however, the overall shape shows a poorer fit, with significant mismatches in the slopes. Because of the better match for the amplitudes, we prefer the reverse polarity for the magnetic body in our forward model. We also implemented an additional component of remanent magnetization (A) to the magnetic body, fixed at −1.1 A m−1, and tested combinations such as SI with A m−1 and SI with A m−1. These combinations yielded a similar response, primarily increasing the amplitude of the anomaly without changing the overall trend. In conclusion, while the additional remanent magnetization component amplifies the anomaly magnitude, it does not significantly affect the trend or alter the interpretation of the model. We have also developed a model that shows a perfect fit between the observed and calculated anomaly (Fig. 6c). However, to achieve that, we need to completely abandon the constraints from well-logs and regional structural context based on gravity and magnetic data. For these reasons, we adopt a simplified, geologically grounded model that balances interpretive clarity with structural realism.
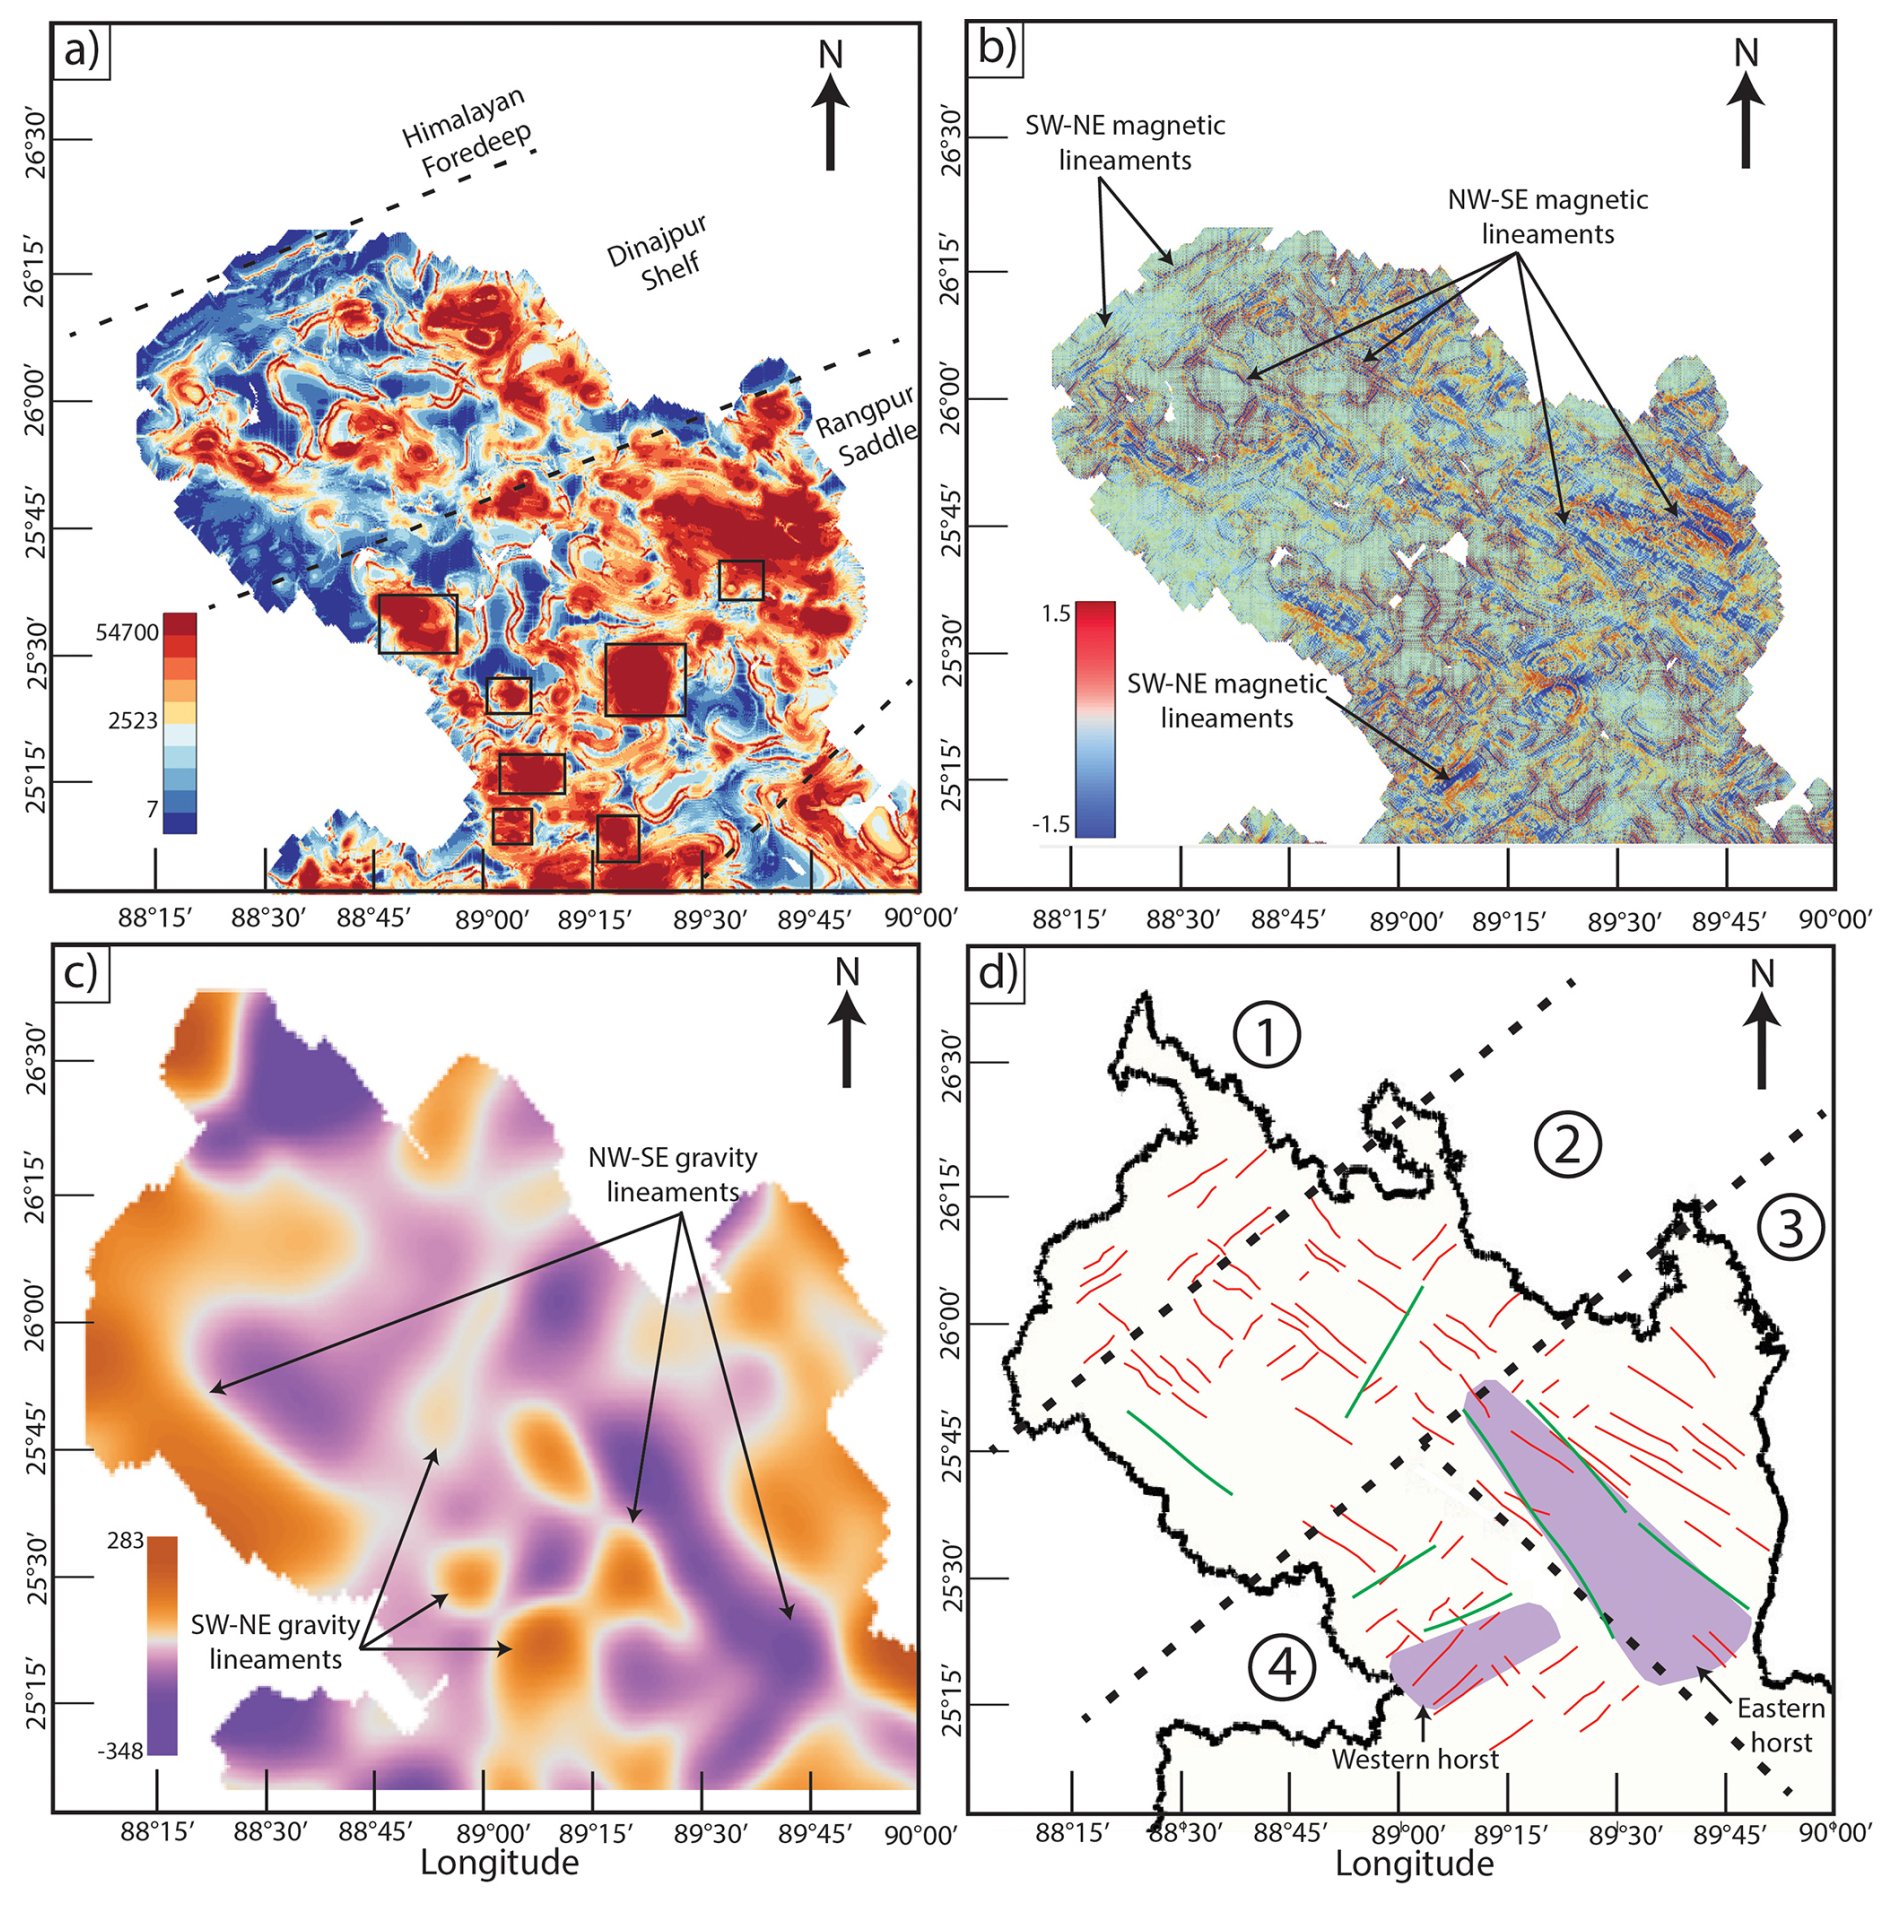
Figure 7Filtered potential field maps of the northwestern stable platform region of Bangladesh, highlighting major tectonic structures and boundaries. (a) Analytical signal map derived from the magnetic anomaly (methodology detailed in Sect. 3), showing magnetization amplitudes across the region. Black boxes indicate areas of oval dipolar magnetic patterns, as shown in Fig. 4a. Dashed lines represent boundaries between established tectonic subdivisions. (b) Total horizontal gradient map of the magnetic anomaly, calculated by applying a first horizontal derivative filter in the X-direction, followed by a first horizontal derivative filter in the Y-direction. (c) Total horizontal derivative (similar method as in b) of the residual gravity anomaly. This map is developed after applying upward continuation to the residual gravity data to a level where high-resolution artifacts are no longer present in the derivative map. (d) Map displaying traced magnetic lineaments (in red) from (b) and gravity lineaments (in green) from (c). Black dashed lines indicate regional subdivisions based on mapped tectonic lineaments. Purple polygons mark horst structures in the Rangpur Saddle, interpreted from filtered gravity data (refer to Fig. 4b).
5.1 Basement structure
One of the primary goals of this paper is to understand the basement structure and tectonic setup of the Rangpur Saddle. Our findings reveal significant differences in the basement structures of the Rangpur Saddle compared to its northern counterparts, evident in both gravity and magnetic data. A key distinction is the depth to basement between these regions (Fig. 1b). Previous studies consistently suggest that the basement depth in the Rangpur Saddle is shallower than in the Dinajpur Shelf. However, those studies were based on limited seismic and drilling data. Our results, however, indicate a more complex basement geometry than previously understood. Filtered gravity and seismic data presented here suggest that the Rangpur Saddle region contains both shallow and deep basement features (Fig. 4b). Considering regional tectonics, we propose that high gravity values correspond to shallow horst structures, while low gravity values indicate deeper graben structures. However, the frequency of horsts and grabens is significantly lower in the Rangpur Saddle compared to the northern Himalayan Foredeep and the Dinajpur Shelf (Fig. 2a and b). In the Rangpur region, we identified only two horsts of notable width and length. The boundaries of these horst structures also appear as lineaments in the filtered magnetic data (Fig. 4a), suggesting the presence of major structural boundaries. Furthermore, differences in the directions of magnetic lineaments between the Rangpur Saddle region and its northern counterparts – the Dinajpur Shelf and the Himalayan Foredeep – suggest variations in paleo-tectonic stress orientation (Figs. 4a, 7a and b). Existing literature characterizes northwestern Bangladesh predominantly with extensional tectonics (Gani and Alam, 2003). Near the Himalayan Foredeep boundary, SW–NE trending magnetic lineaments indicate a paleo-principal stress direction oriented NW–SE. Moving southward into the Dinajpur Shelf, NW–SE trending magnetic lineaments become more common (Fig. 7b), pointing to a shift in the principal stress direction associated with extensional tectonics. In the Rangpur Saddle, these NW–SE trending lineaments are even more frequent, especially in the eastern part, indicating a greater intensity of paleo-tectonic stress in this region compared to the Dinajpur Shelf. Based on traced magnetic and gravity lineaments, the stable platform can be divided into four distinct zones (Fig. 7d). In Zone 1, located in the northern part, lineaments predominantly trend SW–NE, with only a few exceptions. Moving southward into Zone 2, there is a mixture of two differently trending lineaments: SW–NE and NW–SE. In Zone 3, in the easternmost section of the stable platform, lineaments primarily trend NW-SE, aligning with the eastern horst. Finally, in Zone 4, the southernmost region, lineaments generally follow an SW–NE trend, corresponding with the western horst. This subdivision highlights the complex nature of past tectonic processes in this region.
We also identify seven oval dipolar patterns of magnetic highs and lows. When mapped onto gravity data, these patterns consistently align with the boundaries between high and low gravity patches, indicating the possible boundaries between horsts and grabens. Drilling log data near the most prominent magnetic anomaly reveals the presence of gabbro, which may explain these dipolar magnetic patterns. Furthermore, these regions of dipolar magnetic patterns also spatially correlate with overall high magnetization (Fig. 7a). We propose that these gabbro formations resulted from intrusions along normal faults, formed by extensional tectonics, which define the boundaries between horsts and grabens.
5.2 Economic mineral potential
Our integrated spatial analysis and 2-D modeling reveal that the Rangpur Saddle contains at least two prominent horst and graben structures. The 2-D model results (Fig. 5), supported by drilling log data, confirm the presence of gabbroic bodies along normal faults within these structures. This suggests that the most prominent oval-shaped dipolar magnetic signature has strong potential to host iron-bearing rocks such as gabbro. When the other similar patterns are mapped onto the gravity data, they consistently correspond to the boundaries between high and low gravity zones, marking the transitions between horsts and grabens. We interpret these gabbroic intrusions as products of magmatic emplacement along extensional faults (Fig. 8), consistent with processes associated with the early stages of continental rifting. Furthermore, analysis of lineament orientations (Fig. 7d) indicates that, except in the western horst region, most of the interpreted magmatic emplacement appears to be controlled by NW–SE oriented lineaments.
The breakup process involved rifting events that progressively separated the Indian subcontinent from the other Gondwanaland constituents (Veevers, 2004). The breakup of Gondwanaland involved multiple rifting episodes and magmatic activities. While the Central Atlantic Magmatic Province (CAMP) exemplifies rift-related magmatism during the Triassic-Jurassic breakup of Pangea, the Rangpur Saddle's tectonic evolution is more directly tied to the Cretaceous rifting of the Indian plate from Antarctica-Australia (Curray, 1991; Hossain et al., 2019). This rifting facilitated extensional faulting and mafic intrusions, analogous to processes observed in CAMP but occurring later in the Mesozoic. In such tectonic settings, normal faulting and rift-related subsidence create pathways for mafic magmas to ascend (Brune et al., 2023; Pirajno and Santosh, 2014; Ruppel, 1995), leading to the emplacement of gabbroic and other mafic intrusions within the crust (Magee et al., 2019).
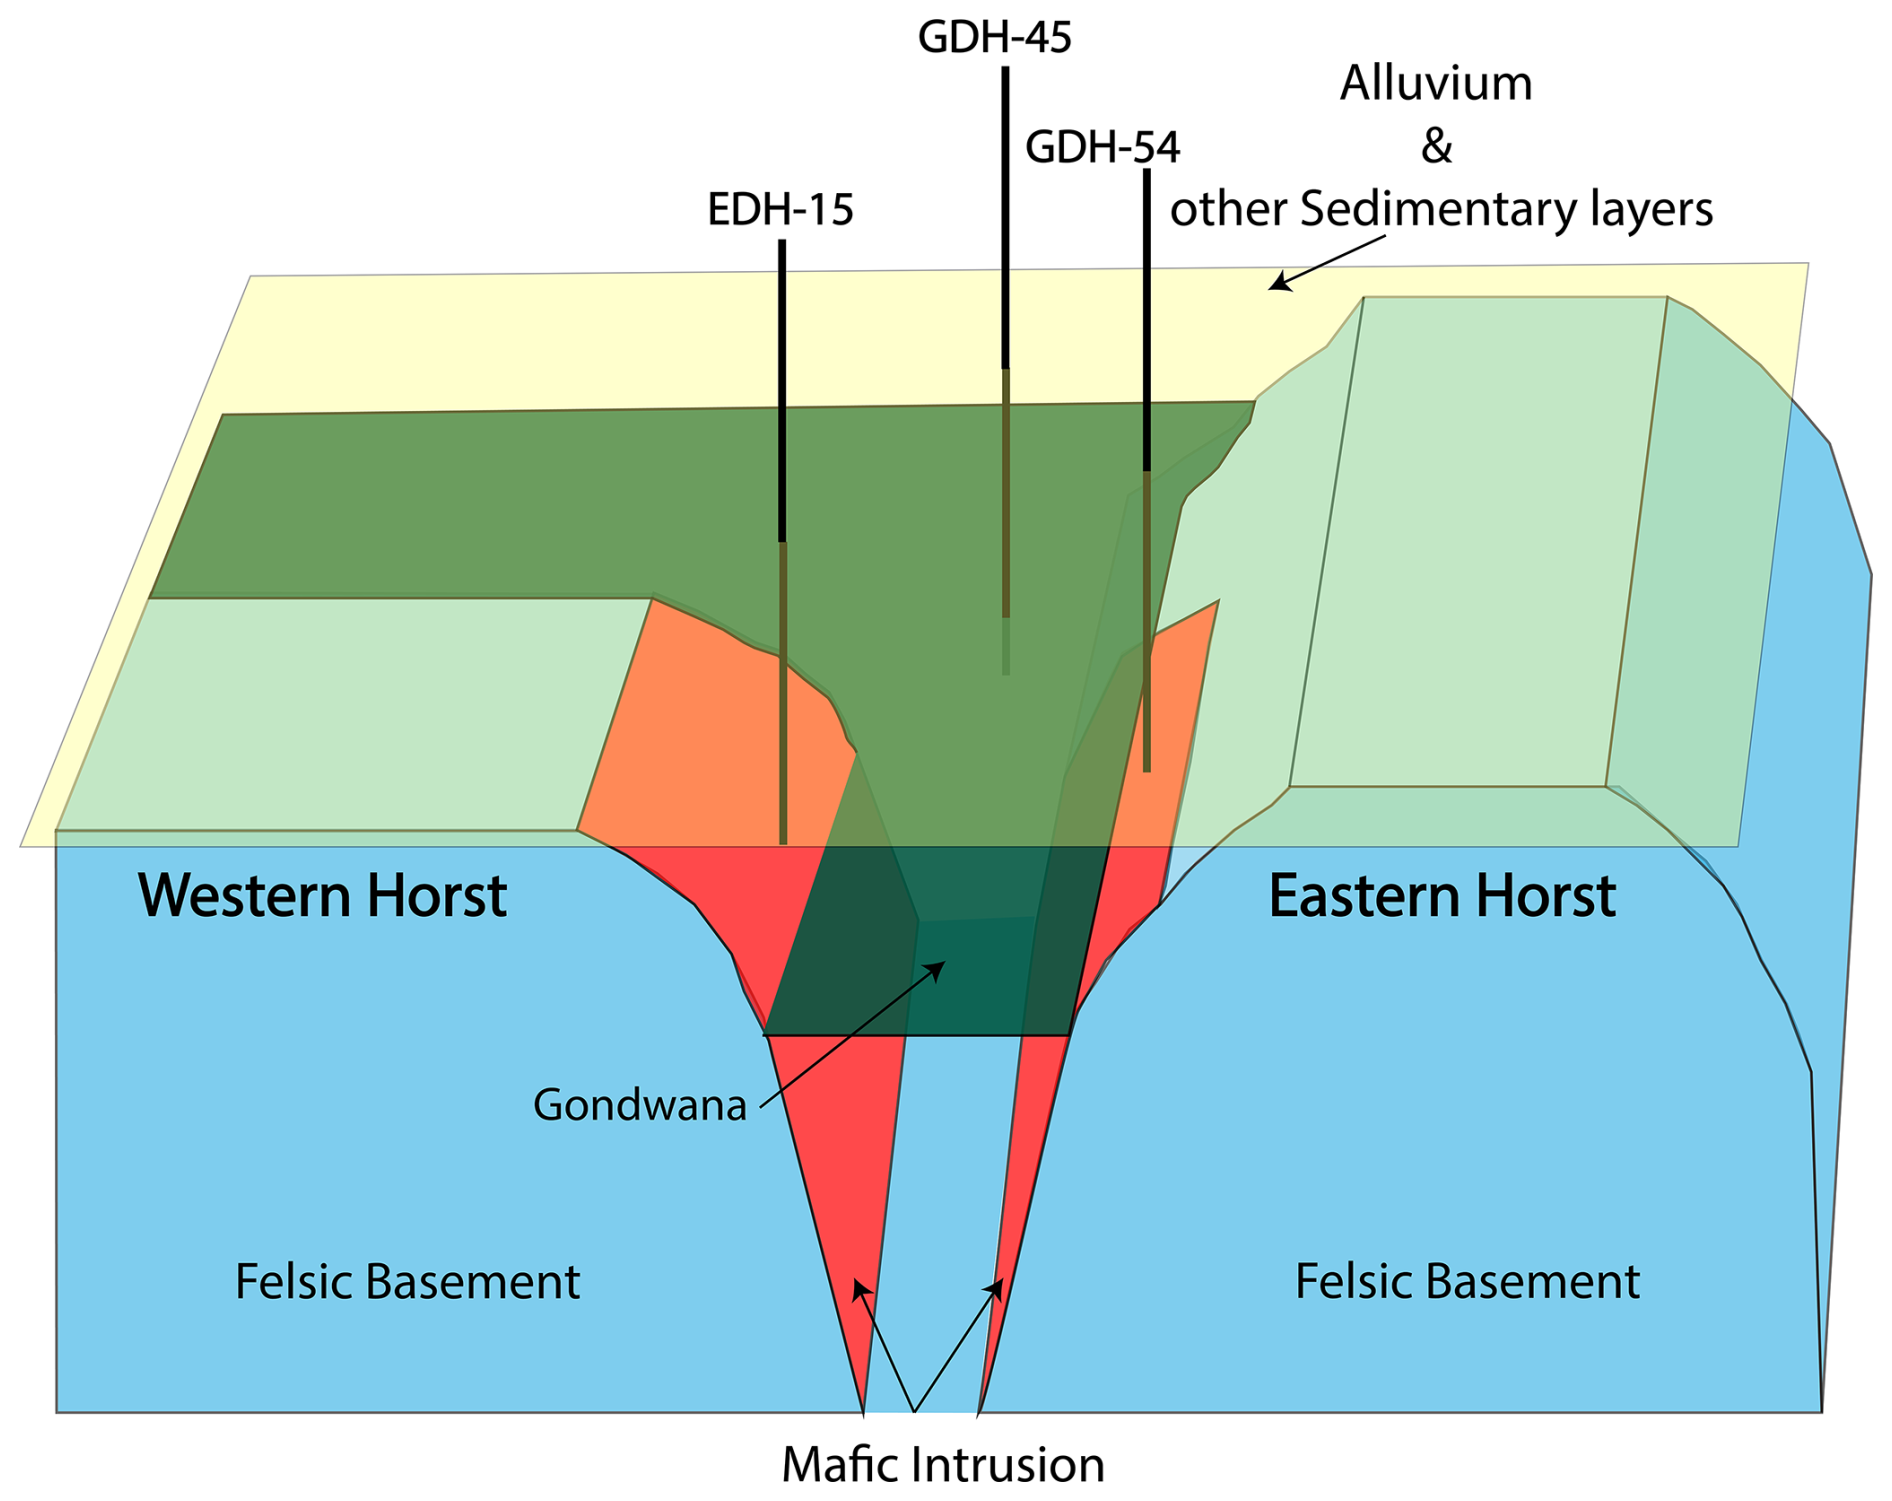
Figure 83D schematic diagram illustrating the tectonic structures in Pirganj, where the highest magnetic anomaly is observed in Bangladesh. The felsic basement, depicted in blue blocks, includes two horsts, as shown in Fig. 5d. Possible mafic intrusions along the faults are indicated in red. Sedimentary layers are represented by a single horizontal layer in specific colors, with the graben basin likely filled with Gondwana sediments shown in green, and other sedimentary layers, including alluvium, shown in yellow, which also represents the topography of the region. The approximate locations of the three drilling logs used in this study (refer to Fig. 1b for their locations) are also indicated.
Mafic magma intrusions are commonly observed along extensional fault planes in tectonically active regions worldwide. Troll et al. (2021) shows that in NW Scotland, Long Loch Fault acted as dynamic magma conduit with its movements facilitating the ascent of ultrabasic magmas. These magmas intruded along faults and fractures, leading to the destabilization and collapse of existing cumulate layers, forming extensive breccias. A study on Mesozoic gabbroic intrusions in the High Atlas Mountains highlights their emplacement along extensional faults during the rifting associated with the Central Atlantic Magmatic Province, where more than 50 % of gabbro samples exhibit stable magnetization from magnetite which is identified as the primary component (Calvín et al., 2017). Fuller and Waters (1929) have extensively studied horsts and graben structures in southern Oregon where they found emplacement of volcanic and intrusive rocks are closely associated with extensional faulting. These normal faults and the resulting grabens provide pathways for magma to ascend and intrude, which is evident from the prevalence of rhyolitic, dacitic, and andesitic vents as well as basaltic dikes aligned with the faults.
Mafic intrusions along fault zones are often associated with magnetic mineral deposits, which can be economically significant as ore bodies (Zhou et al., 2005). For instance, magnetite deposits are found within mafic intrusions along the fault planes in Egypt, which exhibit high magnetic anomalies, facilitating their detection and delineation (Kharbish et al., 2022; Mousa et al., 2020). Also, in Central Iran, iron-bearing magnetic mineral deposits are observed to exhibit high magnetic and gravity anomalies (Kheyrollahi et al., 2021).
Based on current geochemistry data, the Rangpur Saddle holds significant potential for magnetic mineral ore deposits, driven by its mafic-ultramafic sequences and iron-rich dykes (Ameen et al., 2021). High Fe2O3 content in hornblendites and associated minerals like magnetite and ilmenite indicate strong magnetization. The tectonic setting, with extensive magmatic intrusions, provides ideal conditions for mineralization. These findings highlight the region as a possible target for future geophysical exploration of magnetic ore bodies.
5.3 Limitations and Future Research
Compared to other regions globally, limited published research exists for our study area, restricting our ability to draw on established models and findings. Situated at the eastern edge of the Indian Shield, this area transitions into a different tectonic subdivision, creating a tectonic complexity that cannot be fully resolved with the available low-resolution data. The scarcity of high-resolution datasets, such as regional-scale seismic surveys, further limits our capacity to delineate regional structures accurately. Currently, no regional or localized high-resolution datasets from ground-based surveys are widely available, though such data could enhance future studies. Additionally, the available well log data are predominantly shallow, reaching depths of approximately 500 m, which limits insights into deeper geological and tectonic features beyond 2 km. Petrographic descriptions of the basement rocks are also rudimentary, as they are primarily based on a limited number of well logs, most of which were drilled before the 1990s, leaving significant gaps in our understanding of the area's deeper subsurface geology.
Future research in this region will focus on constructing detailed three-dimensional (3D) models of the subsurface to enhance our understanding of the geological framework. This will involve compiling a comprehensive dataset repository that integrates historical seismic reflection data, including those acquired by private entities. Given the shallow nature of the basement, which lies between approximately 128 and 1000 m depth, high-resolution gravity and magnetic data will be critical for resolving fine-scale structural features. To achieve the necessary spatial resolution, precision ground-based gravity and magnetic surveys are recommended. Specifically, we propose a targeted geophysical survey in areas exhibiting oval-shaped dipolar magnetic anomalies, using station spacing of 500 m or less. Such high-density measurements will improve our ability to detect and delineate narrow mafic intrusions at shallow depths. In addition, developing a regional tomographic model using either local earthquake data or ambient seismic noise will provide complementary constraints on subsurface structures and further refine interpretations of the geological setting.
The study area is characterized by complex tectonic structures shaped by a diverse tectonic history. While the current study has focused on the Rangpur Saddle, future research will expand to cover the entire northwestern part of Bangladesh, including the Himalayan Foredeep and the Eocene Hinge region, which represents a Paleocontinental shelf. Such expanded coverage will provide deeper insights into the tectonic evolution and geological complexity of the area.
This study provides a geophysical investigation of the northwestern region of Bangladesh, revealing its significant potential for mineral resource exploration. The integration of gravity, magnetic, seismic, and drilling data has allowed us to identify key tectonic features, such as gabbroic intrusions along extensional faults, some which may host of valuable magnetic mineral deposits. Despite the limitations in data resolution and coverage, our findings offer important insights into the region's geological evolution and resource potential. Future work should prioritize acquiring more detailed geophysical data and expanding drilling campaigns to refine the understanding of subsurface structures and evaluate the feasibility of mineral extraction. The Rangpur Saddle, as the shallowest part of the stable platform, emerges as a promising target for future mineral exploration endeavors.
All raw data can be provided by the corresponding authors upon request.
The supplement related to this article is available online at https://doi.org/10.5194/se-17-389-2026-supplement.
Mohammad Tawhidur Rahman Tushar was involved in conceptualization, methodology, software, validation, formal analysis, investigation, resources, data curation, writing – original draft, writing – review and editing, visualization. Asif Ashraf contributed to conceptualization, methodology, software, validation, formal analysis, investigation, resources, data curation, writing – original draft, writing – review and editing, and visualization. Md. Mahfuz Alam worked on software development, validation, and formal analysis. Md Nasif Jamil contributed to writing – review and editing and visualization. Saba Karim was involved in writing – review and editing and visualization. Md. Shahjahan contributed to conceptualization, investigation, resources, project administration, and supervision. Md. Anwar Hossain Bhuiyan was involved in writing – review and editing, project administration, supervision, and funding acquisition.
The contact author has declared that none of the authors has any competing interests.
Publisher's note: Copernicus Publications remains neutral with regard to jurisdictional claims made in the text, published maps, institutional affiliations, or any other geographical representation in this paper. The authors bear the ultimate responsibility for providing appropriate place names. Views expressed in the text are those of the authors and do not necessarily reflect the views of the publisher.
The gravity, magnetic, and seismic data, along with drilling information used in this study, were graciously provided by the Geological Survey of Bangladesh (GSB), and the authors deeply appreciate their support and collaboration. The authors also thank Asef Jamil Ajwad for his assistance with computational facilities during the research. Special acknowledgment is made for the Oasis Montaj classroom subscription and for the use of Geosoft Oasis Montaj v8.4 for data processing and modeling. Finally, gratitude is extended to the Department of Geology, University of Dhaka, for providing access to essential infrastructure and resources.
This research has been supported by the Ministry of Science and Technology, Government of the People's Republic of Bangladesh (National Science and Technology Fellowship).
This paper was edited by Elias Lewi and reviewed by Bernard Housen and two anonymous referees.
Adebiyi, L. S., Eluwole, A. B., Fajana, A. O., Salawu, N. B., and Saleh, A.: Contrasting structures of the Southern Benue trough and the contiguous crystalline basement as observed from high-resolution aeromagnetic data, Sci. Rep., 13, 21516, https://doi.org/10.1038/s41598-023-48639-8, 2023.
Ahamed, S., Hossain, D., and Alam, J.: Exploring Basement Surface relationship of north-west Bengal Basin using satellite images and tectonic modeling, arXiv [preprint], https://doi.org/10.48550/ARXIV.2004.02734, 2020.
Akhtar, A.: Mineral resources and their economic significance in national development: Bangladesh perspective, Geological Society, London, Special Publications, 250, 127–134, https://doi.org/10.1144/GSL.SP.2005.250.01.12, 2005.
Alam, M.: Geology and depositional history of Cenozoic sediments of the Bengal Basin of Bangladesh, Palaeogeogr. Palaeocl., 69, 125–139, https://doi.org/10.1016/0031-0182(89)90159-4, 1989.
Alam, M., Alam, M. M., Curray, J. R., Chowdhury, M. L. R., and Gani, M. R.: An overview of the sedimentary geology of the Bengal Basin in relation to the regional tectonic framework and basin-fill history, Sedimentary Geol., 155, 179–208, https://doi.org/10.1016/S0037-0738(02)00180-X, 2003.
Alken, P., Thébault, E., Beggan, C. D., Amit, H., Aubert, J., Baerenzung, J., Bondar, T. N., Brown, W. J., Califf, S., Chambodut, A., Chulliat, A., Cox, G. A., Finlay, C. C., Fournier, A., Gillet, N., Grayver, A., Hammer, M. D., Holschneider, M., Huder, L., Hulot, G., Jager, T., Kloss, C., Korte, M., Kuang, W., Kuvshinov, A., Langlais, B., Léger, J.-M., Lesur, V., Livermore, P. W., Lowes, F. J., Macmillan, S., Magnes, W., Mandea, M., Marsal, S., Matzka, J., Metman, M. C., Minami, T., Morschhauser, A., Mound, J. E., Nair, M., Nakano, S., Olsen, N., Pavón-Carrasco, F. J., Petrov, V. G., Ropp, G., Rother, M., Sabaka, T. J., Sanchez, S., Saturnino, D., Schnepf, N. R., Shen, X., Stolle, C., Tangborn, A., Tøffner-Clausen, L., Toh, H., Torta, J. M., Varner, J., Vervelidou, F., Vigneron, P., Wardinski, I., Wicht, J., Woods, A., Yang, Y., Zeren, Z., and Zhou, B.: International Geomagnetic Reference Field: the thirteenth generation, Earth Planet. Space, 73, 49, https://doi.org/10.1186/s40623-020-01288-x, 2021.
Ameen, S. M. M., Wilde, S. A., Kabir, Md. Z., Akon, E., Chowdhury, K. R., and Khan, Md. S. H.: Paleoproterozoic granitoids in the basement of Bangladesh: A piece of the Indian shield or an exotic fragment of the Gondwana jigsaw?, Gondwana Res., 12, 380–387, https://doi.org/10.1016/j.gr.2007.02.001, 2007.
Ameen, S. M. M., Tapu, A.-T., and Hossain, M. S.: Precambrian Basement Rock of Bangladesh and Its Metallic Minerals, in: Bangladesh geosciences and resources potential, CRC Press Books, 25–54, https://doi.org/10.1201/9781003080817, 2021.
Arkani-Hamed, J.: Differential reduction to the pole: Revisited, Geophysics, 72, L13–L20, https://doi.org/10.1190/1.2399370, 2007.
Ashraf, A. and Filina, I.: New 2.75-D gravity modeling reveals the low-density nature of propagator wakes in the Juan de Fuca plate, Tectonophysics, 869, 230127, https://doi.org/10.1016/j.tecto.2023.230127, 2023a.
Ashraf, A. and Filina, I.: Zones of Weakness Within the Juan de Fuca Plate Mapped From the Integration of Multiple Geophysical Data and Their Relation to Observed Seismicity, Geochem. Geophy. Geosys., 24, e2023GC010943, https://doi.org/10.1029/2023GC010943, 2023b.
Balogun, O. B., Akereke, O. F., and Nwobodo, A. D.: Understanding the Constraints to the Correct Application of the Upward Continuation Operation in Gravity Data Processing, Pure Appl. Geophys., 180, 3787–3811, https://doi.org/10.1007/s00024-023-03348-1, 2023.
Blakely, R. J.: Potential theory in gravity and magnetic applications, Cambridge University Press, https://doi.org/10.1017/CBO9780511549816, 1996.
Brune, S., Kolawole, F., Olive, J.-A., Stamps, D. S., Buck, W. R., Buiter, S. J. H., Furman, T., and Shillington, D. J.: Geodynamics of continental rift initiation and evolution, Nat. Rev. Earth Environ., 4, 235–253, https://doi.org/10.1038/s43017-023-00391-3, 2023.
Calvín, P., Ruiz-Martínez, V. C., Villalaín, J. J., Casas-Sainz, A. M., and Moussaid, B.: Emplacement and Deformation of Mesozoic Gabbros of the High Atlas (Morocco): Paleomagnetism and Magnetic Fabrics, Tectonics, 36, 3012–3037, https://doi.org/10.1002/2017TC004578, 2017.
Chowdhury, K. R., Hossain, M. S., and Khan, M. S. H. (Eds.): Bangladesh geosciences and resources potential, First edition, CRC Press, Boca Raton, 610 pp., https://doi.org/10.1201/9781003080817, 2022.
Curray, J. R.: Geological history of the Bengal geosyncline, Journal of Association of Exploration Geophysicists, 12, 209–219, 1991.
Curray, J. R. and Moore, D. G.: Sedimentary and Tectonic Processes in the Bengal Deep-Sea Fan and Geosyncline, in: The Geology of Continental Margins, edited by: Burk, C. A. and Drake, C. L., Springer Berlin Heidelberg, Berlin, Heidelberg, 617–627, https://doi.org/10.1007/978-3-662-01141-6_45, 1974.
DeCelles, P. G.: Foreland Basin Systems Revisited: Variations in Response to Tectonic Settings, in: Tectonics of Sedimentary Basins, edited by: Busby, C. and Azor, A., Wiley, 405–426, https://doi.org/10.1002/9781444347166.ch20, 2011.
Filina, I., Biegert, E. K., Sander, L., Tschirhart, V., Bundalo, N., and Schiek-Stewart, C.: Integrated imaging: A powerful but undervalued tool, Leading Edge, 38, 720–724, https://doi.org/10.1190/tle38090720.1, 2019.
Fuller, R. E. and Waters, A. C.: The Nature and Origin of the Horst and Graben Structure of Southern Oregon, J. Geol., 37, 204–238, 1929.
Gani, R. and Alam, M.: Sedimentation and basin-fill history of the Neogene clastic succession exposed in the southeastern fold belt of the Bengal Basin, Bangladesh: a high-resolution sequence stratigraphic approach, Sediment. Geol., 155, 227–270, https://doi.org/10.1016/S0037-0738(02)00182-3, 2003.
Hasan, M. M., Monir, A., and Hassan, M.: Evaluating the Energy and Mineral Resources Prospect and Future Development in Bangladesh: A Review, S&P Global Market Intelligence Research, https://doi.org/10.2139/ssrn.4484598, 2023.
Hendrickson, M. D.: Geologic interpretation of aeromagnetic and chemical data from the Oaks Belt, Wabigoon subprovince, Minnesota: implications for Au-rich VMS deposit exploration, Can. J. Earth Sci., 53, 176–188, https://doi.org/10.1139/cjes-2015-0141, 2016.
Hildenbrand, T. G.: Regional Crustal Structures and Their Relationship to the Distribution of Ore Deposits in the Western United States, Based on Magnetic and Gravity Data, Econ. Geol., 95, 1583–1603, https://doi.org/10.2113/gsecongeo.95.8.1583, 2000.
Hossain, I., Tsunogae, T., Rajesh, H. M., Chen, B., and Arakawa, Y.: Palaeoproterozoic U–Pb SHRIMP zircon age from basement rocks in Bangladesh: A possible remnant of the Columbia supercontinent, C. R. Geosci., 339, 979–986, https://doi.org/10.1016/j.crte.2007.09.014, 2007.
Hossain, Md. S., Khan, Md. S. H., Chowdhury, K. R., and Abdullah, R.: Synthesis of the Tectonic and Structural Elements of the Bengal Basin and Its Surroundings, in: Tectonics and Structural Geology: Indian Context, edited by: Mukherjee, S., Springer International Publishing, Cham, 135–218, https://doi.org/10.1007/978-3-319-99341-6_6, 2019.
Ibraheem, I. M., Tezkan, B., Ghazala, H., and Othman, A. A.: A New Edge Enhancement Filter for the Interpretation of Magnetic Field Data, Pure Appl. Geophys., 180, 2223–2240, https://doi.org/10.1007/s00024-023-03249-3, 2023.
Jaffal, M., Goumi, N. E., Kchikach, A., Aïfa, T., Khattach, D., and Manar, A.: Gravity and magnetic investigations in the Haouz basin, Morocco, Interpretation and mining implications, J. Afr. Earth Sci., 58, 331–340, https://doi.org/10.1016/j.jafrearsci.2010.03.012, 2010.
Jain, A. K., Banerjee, D. M., and Kale, V. S.: Tectonics of the Indian Subcontinent, Springer International Publishing, Cham, https://doi.org/10.1007/978-3-030-42845-7, 2020.
Kabir, Z. M., Chowdhury, K. R., Akon, E., Kazi, A. I., and Ameen, S. M. M.: Petrogenetic Study of Precambrian Basement Rocks from Maddhapara, Dinajpur, Bangladesh, Bangladesh Geoscience Journal, 7, 1–18, 2001.
Khan, A. A. and Rahman, T.: An analysis of the gravity field and tectonic evaluation of the northwestern part of Bangladesh, Tectonophysics, 206, 351–364, https://doi.org/10.1016/0040-1951(92)90386-K, 1992.
Khan, F. H.: Geology of Bangladesh, ISBN 9840511483, 1991.
Kharbish, S., Eldosouky, A. M., and Amer, O.: Integrating mineralogy, geochemistry and aeromagnetic data for detecting Fe–Ti ore deposits bearing layered mafic intrusion, Akab El-Negum, Eastern Desert, Egypt, Sci. Rep., 12, 15474, https://doi.org/10.1038/s41598-022-19760-x, 2022.
Kheyrollahi, H., Alinia, F., and Ghods, A.: Regional magnetic and gravity structures and distribution of mineral deposits in Central Iran: Implications for mineral exploration, J. Asian Earth Sci., 217, 104828, https://doi.org/10.1016/j.jseaes.2021.104828, 2021.
Ma, G., Huang, D., and Liu, C.: Step-Edge Detection Filters for the Interpretation of Potential Field Data, Pure Appl. Geophys., 173, 795–803, https://doi.org/10.1007/s00024-015-1053-6, 2016.
Magee, C., Ernst, R. E., Muirhead, J., Phillips, T., and Jackson, C. A.: Magma transport pathways in large igneous provinces: lessons from combining field observations and seismic reflection data, in: Dyke Swarms of the World: A Modern Perspective, Springer Geology, Springer, Singapore https://doi.org/10.1007/978-981-13-1666-1_2, 45–85, 2019.
Masum, M., Hoque, M. N., Akbar, M. A., Mahmud, Z., Rana, M. S., Razzaque, M. A., and Amin, M. A.: Geology and Precambrian Banded Iron Formation formed at Rangpur Platform in Bangladesh, International Journal Of Engineering Research And Development, 17, 43–57, 2021.
McCafferty, A. E., Stoeser, D. B., and Van Gosen, B. S.: Geophysical interpretation of U, Th, and rare earth element mineralization of the Bokan Mountain peralkaline granite complex, Prince of Wales Island, southeast Alaska, Interpretation, 2, SJ47–SJ63, https://doi.org/10.1190/INT-2014-0010.1, 2014.
Mohamed, A., Abdelrady, M., Alshehri, F., Mohammed, M. A., and Abdelrady, A.: Detection of Mineralization Zones Using Aeromagnetic Data, Appl. Sci., 12, 9078, https://doi.org/10.3390/app12189078, 2022.
Moon, J. W.: The Mineral Industry of Bangladesh, U.S. Geological Survey, https://pubs.usgs.gov/myb/vol3/2020-21/myb3-2020-21-bangladesh.pdf (last access: 4 March 2026), 2022.
Morgan, J. P. and McIntire, W. G.: Quaternary Geology of The Bengal Basin, East Pakistan And India, Geol. Soc. Am. Bull., 70, 319, https://doi.org/10.1130/0016-7606(1959)70[319:QGOTBB]2.0.CO;2, 1959.
Mousa, S. A. W., Abdel Nabi, S. H., Araffa, S. A. S., Mansour, S. A., and Al Deep, M. A. I.: Geophysical exploration of titanomagnetite ore deposits by geomagnetic and geoelectric methods, SN Appl. Sci., 2, 444, https://doi.org/10.1007/s42452-020-2206-5, 2020.
Mukhopadhyay, D. and Matin, A.: Recent Studies on the Singhbhum Craton, Pinsa, 86, https://doi.org/10.16943/ptinsa/2020/49788, 2020.
Nabighian, M. N.: The Analytic Signal of Two-Dimensional Magnetic Bodies With Polygonal Cross-Section: Its Properties And Use For Automated Anomaly Interpretation, Geophysics, 37, 507–517, https://doi.org/10.1190/1.1440276, 1972.
Nasuti, Y., Nasuti, A., and Moghadas, D.: STDR: A Novel Approach for Enhancing and Edge Detection of Potential Field Data, Pure Appl. Geophys., 176, 827–841, https://doi.org/10.1007/s00024-018-2016-5, 2019.
Núñez-Demarco, P., Bonilla, A., Sánchez-Bettucci, L., and Prezzi, C.: Potential-Field Filters for Gravity and Magnetic Interpretation: A Review, Surv. Geophys., 44, 603–664, https://doi.org/10.1007/s10712-022-09752-x, 2023.
Ogah, A. J. and Abubakar, F.: Solid mineral potential evaluation using integrated aeromagnetic and aeroradiometric datasets, Sci. Rep., 14, 1637, https://doi.org/10.1038/s41598-024-52270-6, 2024.
Pham, L. T. and Oliveira, S. P.: Edge Enhancement of Magnetic Sources Using the Tilt Angle and Derivatives of Directional Analytic Signals, Pure Appl. Geophys., 180, 4175–4189, https://doi.org/10.1007/s00024-023-03375-y, 2023.
Pirajno, F. and Santosh, M.: Rifting, intraplate magmatism, mineral systems and mantle dynamics in central-east Eurasia: An overview, Ore Geol. Rev., 63, 265–295, https://doi.org/10.1016/j.oregeorev.2014.05.014, 2014.
Rahman, Md. M. and Ullah, S. E.: Inversion of Gravity Data for Imaging of a Sediment-basement Interface: A Case Study in the Northwestern Part of Bangladesh, Pure Appl. Geophys., 166, 2007–2019, https://doi.org/10.1007/s00024-009-0530-1, 2009.
Rangin, C. and Sibuet, J. C.: Structure of the northern Bay of Bengal offshore Bangladesh: Evidences from new multi-channel seismic data, Mar. Petrol. Geol., 84, 64–75, https://doi.org/10.1016/j.marpetgeo.2017.03.020, 2017.
Reimann, K. U. and Hiller, K.: Geology of Bangladesh, Geol. Mag., 132, 754–755, https://doi.org/10.1017/S0016756800019130, 1993.
Roest, W. R. and Pilkington, M.: Identifying remanent magnetization effects in magnetic data, Geophysics, 58, 653–659, https://doi.org/10.1190/1.1443449, 1993.
Roy, A. B. and Chatterjee, A.: Tectonic framework and evolutionary history of the Bengal Basin in the Indian subcontinent, Curr. Sci., 109, 271–279, 2015.
Ruppel, C.: Extensional processes in continental lithosphere, J. Geophys. Res., 100, 24187–24215, https://doi.org/10.1029/95JB02955, 1995.
Smith, W. H. F. and Sandwell, D. T.: Global Sea Floor Topography from Satellite Altimetry and Ship Depth Soundings, Science, 277, 1956–1962, https://doi.org/10.1126/science.277.5334.1956, 1997.
Sundararajan, N.: A General Perspective on Geophysical Methods in Mineral Exploration, in: On a Sustainable Future of the Earth's Natural Resources, Springer Earth System Sciences, Springer, Berlin, Heidelberg, 53–83, https://doi.org/10.1007/978-3-642-32917-3_3, 2012.
Troll, V. R., Mattsson, T., Upton, B. G. J., Emeleus, C. H., Donaldson, C. H., Meyer, R., Weis, F., Dahrén, B., and Heimdal, T. H.: Fault-Controlled Magma Ascent Recorded in the Central Series of the Rum Layered Intrusion, NW Scotland, J. Petrol., 61, egaa093, https://doi.org/10.1093/petrology/egaa093, 2021.
Uddin, A. and Lundberg, N.: Unroofing history of the eastern Himalaya and the Indo-Burman ranges; heavy-mineral study of Cenozoic sediments from the Bengal Basin, Bangladesh, J. Sediment. Res., 68, 465–472, https://doi.org/10.2110/jsr.68.465, 1998.
Valdiya, K. S.: The Making of India, Springer International Publishing, Cham, https://doi.org/10.1007/978-3-319-25029-8, 2016.
Veevers, J. J.: Gondwanaland from 650–500 Ma assembly through 320 Ma merger in Pangea to 185–100 Ma breakup: supercontinental tectonics via stratigraphy and radiometric dating, Earth-Sci. Rev., 68, 1–132, https://doi.org/10.1016/j.earscirev.2004.05.002, 2004.
Zhang, H., Greco, F., Sacek, V., Geng, M., and Liu, P.: Editorial: Applications of gravity anomalies in geophysics, Front. Earth Sci., 12, 1349161, https://doi.org/10.3389/feart.2024.1349161, 2024.
Zhang, S., Li, Z.-X., Evans, D. A. D., Wu, H., Li, H., and Dong, J.: Pre-Rodinia supercontinent Nuna shaping up: A global synthesis with new paleomagnetic results from North China, Earth Planet. Sc. Lett., 353–354, 145–155, https://doi.org/10.1016/j.epsl.2012.07.034, 2012.
Zhou, M.-F., Robinson, P. T., Lesher, C. M., Keays, R. R., Zhang, C.-J., and Malpas, J.: Geochemistry, Petrogenesis and Metallogenesis of the Panzhihua Gabbroic Layered Intrusion and Associated Fe–Ti–V Oxide Deposits, Sichuan Province, SW China, J. Petrol., 46, 2253–2280, https://doi.org/10.1093/petrology/egi054, 2005.