the Creative Commons Attribution 4.0 License.
the Creative Commons Attribution 4.0 License.
 | 12 Mar 2026
Offshore crustal thickness variation along the Palu–Koro strike–slip fault in the Sulawesi region from OBS receiver function analysis
Tingwei Yang
ChuanChuan Lü
Tianyao Hao
Nicholas Rawlinson
Tao Xu
Pepen Supendi
Sri Widiyantoro
Muhammad Taufiq Rafie
Alfian Alfian
David Prambudi Sahara
The North Sulawesi Subduction Zone is one of the youngest active subduction systems in the western Pacific. In western Sulawesi, the Palu–Koro strike–slip fault connects with the westward-extending North Sulawesi Trench, forming a distinctive subduction–transform fault system. Understanding the crustal structure beneath the Celebes Sea and the geometry of the Palu–Koro fault is crucial for assessing regional deformation, rupture dynamics, and seismic hazards. In this study, we analyse data from nine ocean bottom seismometers (OBSs) deployed across the Palu–Koro fault using the receiver function H–κ stacking method to estimate crustal thickness. Our results reveal a shallow Moho (∼8 km depth) beneath the Celebes Sea, in contrast to significantly greater depths (∼25 km) beneath eastern Kalimantan and northern Sulawesi. Sharp variations in Moho depth near the Palu–Koro fault suggest the juxtaposition of two distinct crustal blocks. Combining S-wave velocity structures and local seismicity catalogue, we infer that the Palu–Koro fault is a left-lateral, through-going strike–slip fault extending into the Celebes Sea. These findings provide new geophysical constraints on the interplay between strike–slip faulting and subduction retreat, with implications for the generation of tsunamis by submarine earthquakes in this tectonically complex region.
- Article
(2008 KB) - Full-text XML
-
Supplement
(2114 KB) - BibTeX
- EndNote


The Celebes Sea region lies at the convergence of three major tectonic plates: the Indo-Australian, Pacific, and Eurasian plates (Hamilton, 1979) (Fig. 1). This tectonic setting has produced a highly complex lithospheric structure, with the Palu–Koro fault acting as a key boundary controlling regional deformation. As a major left-lateral strike–slip fault, the Palu–Koro fault accommodates the differential motion between the Makassar Block to the west and the North Sula Block to the east. These blocks exhibit opposing rotational patterns with respect to the Sunda Plate: the Makassar Block rotates counter-clockwise at ∼1° Ma−1, while the North Sula Block rotates clockwise at a faster rate of ∼ 4° Ma−1 (Vigny et al., 2002). This rotational divergence produces a strong sinistral shear zone along the Palu–Koro fault. Over the past ∼30 million years, the Palu–Koro fault has played a central role in crustal segmentation and block interactions in Sulawesi (Socquet et al., 2006; Spakman and Hall, 2010). It also forms a kinematic link between continental deformation in western Sulawesi and subduction at the North Sulawesi Trench. GPS observations show high present-day slip rates along the fault (30–46 mm yr−1), confirming its significance in the regional strain budget (Walpersdorf et al., 1998; Stevens et al., 1999). However, the offshore structure and geometry of the Palu–Koro fault – particularly in the Celebes Sea – remain poorly defined due to limited geophysical constraints.
Geodetic data, offset geomorphological features, and hydrothermal activity collectively demonstrate that the Palu–Koro fault is an actively deforming left-lateral strike–slip system (Hamilton, 1979; Walpersdorf et al., 1998; Cipta et al., 2021). On 28 September 2018, a Mw 7.5 earthquake nucleated along this fault and generated a tsunami that severely impacted western Sulawesi (Fox et al., 2021). Focal mechanism solutions indicate NNW-trending left lateral strike–slip events with a normal faulting component (Wang et al., 2019, Greenfield et al., 2021). Supershear rupture propagation was confirmed by both teleseismic waveform inversion and geodetic modelling, suggesting predominantly horizontal displacement (Bao et al., 2019; Song et al., 2019; Wu et al., 2021). Subsequent studies have refined the structural interpretation of the fault system. Song et al. (2019) identified rupture segmentation, with an onshore left-lateral segment and an offshore NW–SE-striking fault exhibiting oblique-slip characteristics. Coulomb stress modelling by Liu and Shi (2021) indicated enhanced static stress along adjacent fault segments, potentially contributing to aftershock activity and tsunami generation. Cui et al. (2021) interpreted the fault as occupying a regional strike–slip stress regime with a subordinate extensional component, favouring a supershear rupture initiation. The offshore continuity of the fault and its structural linkage to the North Sulawesi subduction zone remain critical for understanding rupture dynamics and associated tsunami hazards. The extension of the Palu–Koro fault offshore is likely to be one of the main causes of the tsunami produced by this earthquake. Therefore, it is vital for the science community to locate the extension of the Palu–Koro fault in the Celebes Sea and understand its characteristics to better assess the geohazard it poses to the region.
Given its tectonic importance and potential seismic hazard, characterising the offshore extent of the Palu–Koro fault and the crustal structure is essential. To address these, we utilise ocean-bottom seismometers (OBS) to record earthquakes offshore in the southern Celebes Sea and Makassar Strait to investigate the crustal structure, then use the receiver function method to estimate crustal thickness and the ratios beneath nine OBS stations crossing the Palu–Koro fault. Additionally, we integrate local seismicity to delineate fault geometry and assess its role in upper crustal deformation in the Celebes Sea region, thus we aim to provide new geophysical insights into the active tectonics of the Northwest Sulawesi region and the nature of fault–trench interaction at a complex plate boundary.
2.1 Earthquake data
A total of 27 OBSs, design by the Institute of Geology and Geophysics, Chinese Academy of Sciences (IGGCAS), were deployed across the study area from August 2019 to August 2020 as part of the collaboration project “The Sulawesi and the Celebes Sea Ocean-bottom Seismic Network (SCONE)” between the University of Cambridge, the Institut Teknologi Bandung and the Chinese Academy of Sciences. The instruments were spaced approximately 50–70 km apart. However, due to the premature ageing of the rubber valve on the pressurised glass cabin – attributed to changes in the supply chain – many OBS units experienced slow leakage. Compounded by delays in the recovery voyage caused by COVID-19 restrictions, only 12 OBSs were successfully recovered (Rawlinson et al., 2020). Of these, three OBSs have disk formatting issues affecting one of the three components, leaving only nine stations suitable for receiver function analysis (Fig. 1).
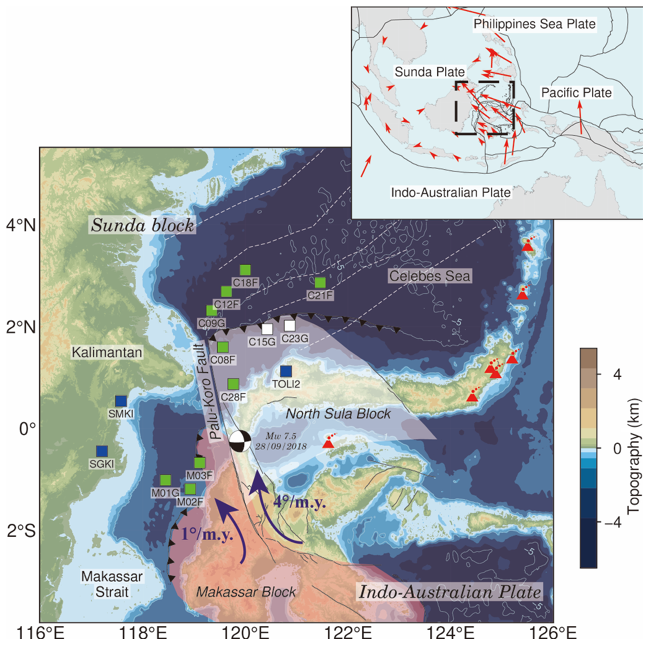
Figure 1Map of the OBSs and the land stations in the Celebes Sea and Makassar Strait The green squares represent OBSs and the blue square is broadband land station; the white and red pad represent two different geological microblocks as North Sula Block and Makassar Block; the purple arrow represents the direction of rotation of the block indicated by the GPS study; That figure in the upper left corner indicate the study area in Southeast Asia; the red arrows represent the motion of the plates; The black solid line represent the plate boundaries, white dashed lines indicate magnetic anomaly stripes that mark oceanic crust of equal age (data from Gaina and Müller, 2007), the focal mechanism represents the 2018 Mw 7.5 Palu earthquake (as reported by the U.S. Geological Survey Preliminary Determination of Epicenter).
All nine OBSs' site response has been evaluated using ambient seismic noise (Natafrisca et al., 2023). Unsurprisingly, the signal-to-noise ratio (SNR) of the OBS data is much lower than that of land stations, particularly in the low-frequency range. This SNR degradation is primarily attributed to poor coupling between the sensors and the seafloor, as well as elevated ambient noise levels in the marine environment (Collins et al., 2001). Due to seasonal variations in temperature and pressure, the OBS units are affected by two key issues: nonlinear internal clock drift and uncertainty of the instrument orientation.
The clock drift refers to the small but cumulative error in timekeeping caused by imperfections in a quartz crystal oscillator. In the case of OBS, our clock module's quartz oscillators vibrate at a specific nominal frequency (32 768 Hz), but the actual frequency of the specific device in the OBS is almost never exactly that value. Therefore, we first calculate the deviation of the quartz oscillator's nominal frequency to compensation the difference of oscillation. The second part of drift is due to the quartz aging which is non-linear and can be affected by many factors (temperature and pressure). In order to correct that, we estimate the clock drift (lag time) by using ambient noise cross-correlation between OBSs and the nearby land station TOLI2 (Hable et al., 2018). Specifically, we implemented the procedure proposed by Bensen et al. (2007) to compute cross-correlation functions from the ambient noise data. To validate our time correction result, we compare the cross-correlation result before and after the time correction in the case of OBS stations M01G and M02F (Fig. S1 in the Supplement), it demonstrates ensuring that both oscillator frequency offset and time drift caused by quartz ageing are fully corrected.
Azimuthal misalignment of the horizontal components was corrected by minimising energy on the transverse component of teleseismic P-waves (Sect. S2) (Niu and Li, 2011; Wang et al., 2016). An example of the horizontal orientation correction result is shown in Fig. S2. To validate these corrections, we used a Mw 6.5 teleseismic event with epicentral distance was 49.5° (Fig. 2b). The quality of the teleseismic waveforms recorded by the OBS stations can be assessed by a comparison with a nearby land station (Fig. 2c). By comparing the raw and pre-processed OBS records, it is clear that pre-processing – including time correction, azimuth correction, demeaning, detrending, and band-pass filtering – substantially improve the signal quality, making both the P- and S-wave phases more clearly identifiable (Fig. S3). The OBS noise signals, likely influenced by oceanic environmental factors such as currents, exhibit pronounced temporal fluctuations in the microseismic band (Fig. S4), with noise levels below 0.1 Hz significantly exceeding the high-noise limit of the global model (NHNM) (Collins et al., 2001; McNamara and Buland, 2004) (Fig. S5). Table 1 summarises the basic parameters and processing outcomes for the nine OBSs and two land-based stations used in this study.
Table 1Nine OBS and land stations geographic location and OBS timing errors (Hori represents the deviation of the azimuth of the East component; Time_Err represents the clock drift during the entire observation period; Dt_Err represents the drift designated to each sampling point).
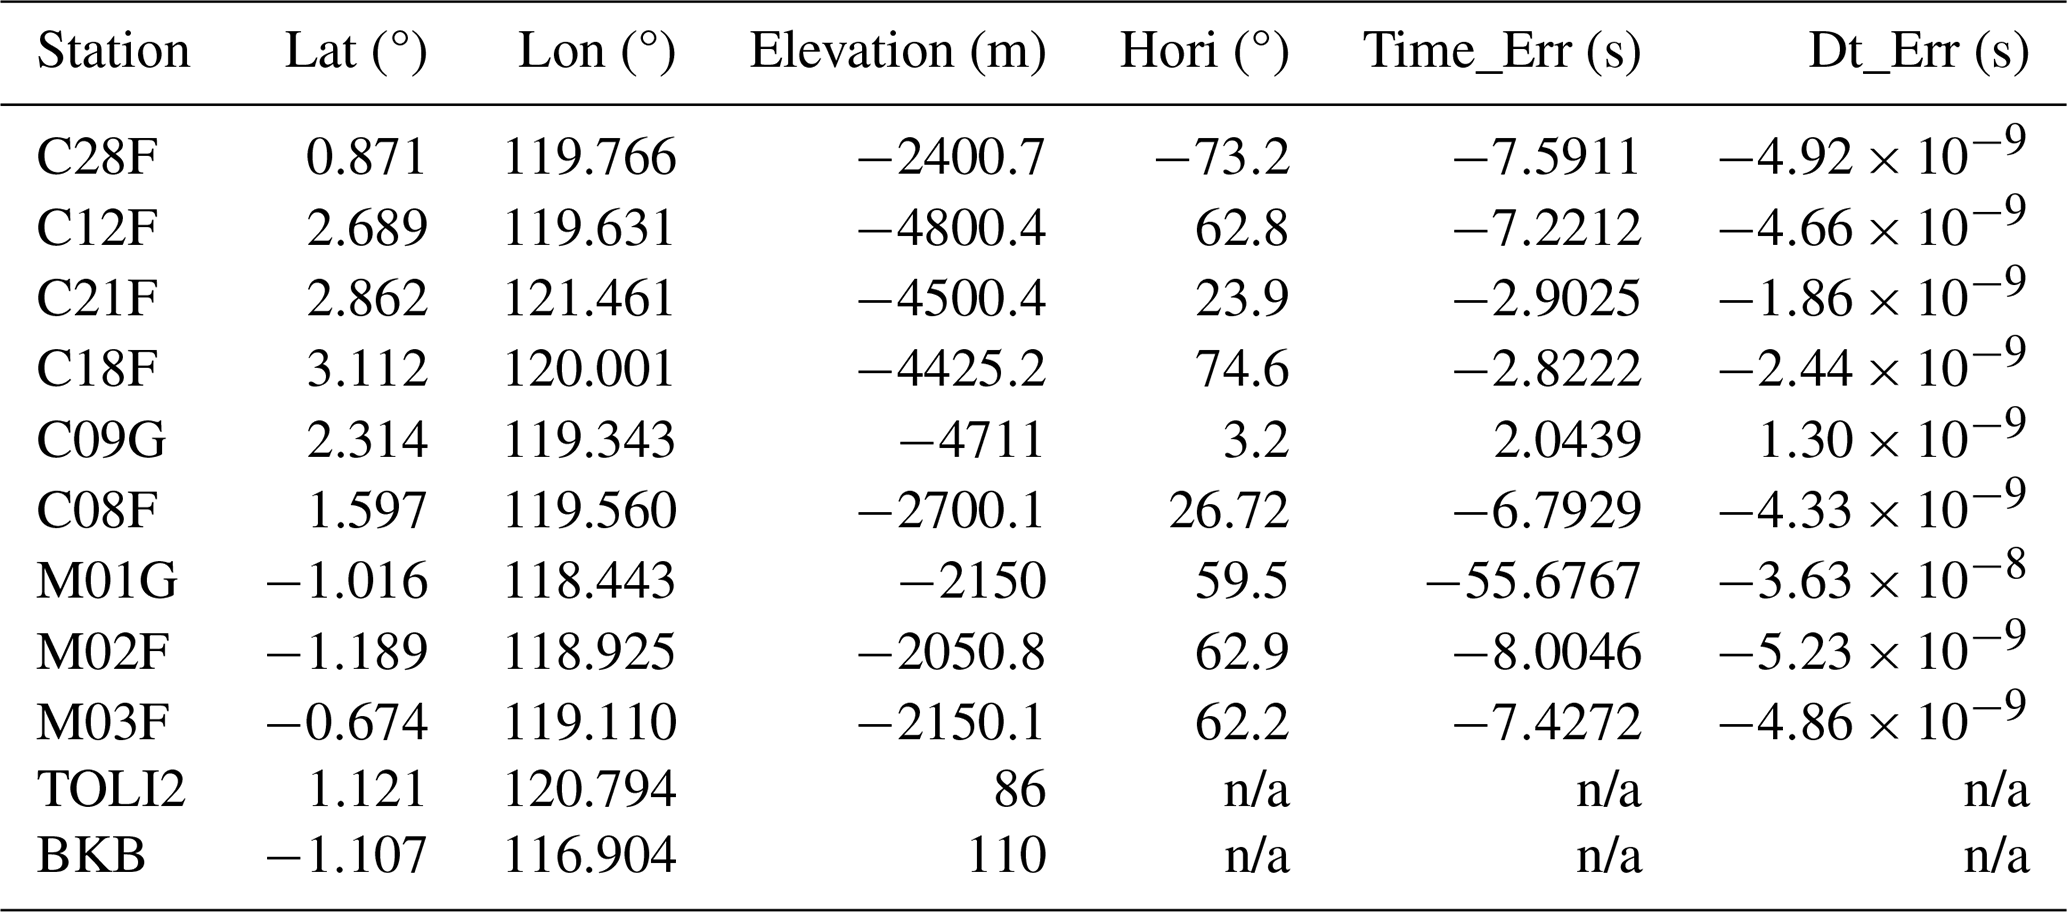
n/a: not applicable
2.2 Receiver function method
The teleseismic P-wave receiver function is an effective method to obtain the crustal structure beneath each seismic station (Langston, 1977). It is a time series obtained by deconvolution of the vertical component (Z) from the radial component (R) of the teleseismic waveform, which isolates converted and reflected wave responses generated by velocity discontinuities beneath the station. For the calculation of receiver functions, we use teleseismic events with magnitudes greater than 5.5 and epicentral distances from 30 to 90°. Using the catalogue of the International Seismological Centre (ISC), we obtain 316 seismic events from magnitudes 5.5 to 8.0 Mw (Fig. 2a).
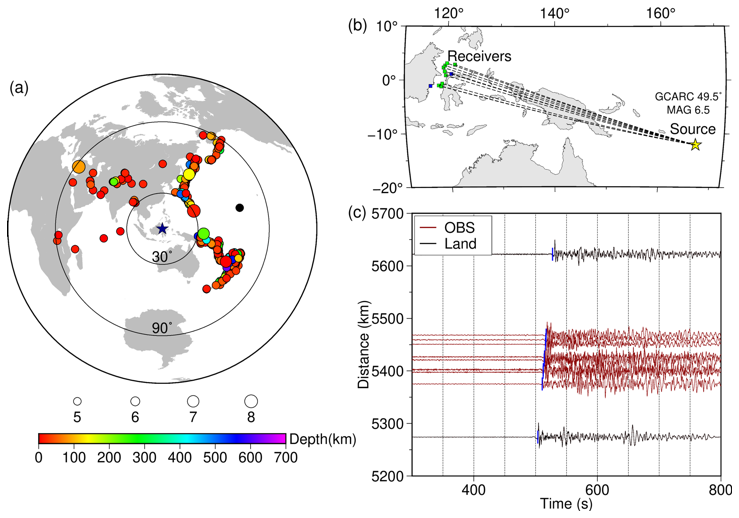
Figure 2(a) Distribution of teleseismic earthquake events (The circle diameter and colour represent the magnitude and depth of the sources, respectively) (b) Teleseismic propagation path in map view; (c) Teleseismic waveforms (black lines are from a broadband land station ,red lines are from nine OBSs, blue represents theoretical first arrival, GCARC in (b) denotes the great-circle arc distance between the event and the station).
Receiver functions were computed from pre-processed three-component waveforms in two steps: coordinate rotation and time-domain deconvolution. Each event was windowed from 10 s before to 120 s after the predicted P-wave arrival, estimated using the AK135 velocity model (Kennett et al., 1995), then we removed the mean and trend, applied a bandpass filter (0.02–2.0 Hz), and rotated the data from ENZ to RTZ coordinates based on events and station geometry. Radial receiver functions were subsequently derived for the P-wave arrivals using the time-domain iterative deconvolution technique of Ligorría and Ammon (1999), which has been widely applied in receiver function studies owing to its stability and robustness. Deconvolution was stabilised using a Gaussian filter with a width of 2.5 (corner frequency ∼1.0 Hz). Receiver functions were also computed with Gaussian widths of 1.0 to 3.0 to assess frequency-dependent crustal response, but we focus primarily on the Gaussian 2.5 results (Ligorría and Ammon, 1999). In total, 314 high-quality receiver functions were obtained (Fig. 3a, b), with manual selection guided by the quality control criteria of Shen et al. (2013).
3.1 Receiver Function H–κ Stacking
The H–κ stacking technique is a widely used method to estimate crustal thickness (H) and average crustal ratio (κ) beneath a seismic station, under the assumption of 1D crustal layering (Zhu and Kanamori, 2000). The method utilises the differential arrival times and amplitudes of the direct Ps phase and its crustal reverberations – PpPs and PsPs + PpSs – generated at the Moho discontinuity. By stacking the amplitudes of these phases across a grid of H and κ values, we identify the optimal crustal parameters at the point of maximum stacking coherence. In this study, we adopt stacking weights of 0.5, 0.3, and 0.2 for Ps, PpPs, and PsPs + PpSs phases, respectively, following standard practice to enhance signal sensitivity while suppressing noise. In the H–κ stacking, the choice of Vp was based on the average crustal Vp from nearby points in the CRUST1.0 model (Laske et al., 2013). Example H–κ stacks for stations TOLI2 and M03F are shown in Fig. 3c and d, while the complete results for the other OBSs are presented in Fig. S6. These results, presented in Fig. 5, show the crustal thickness and the ratios in the Sulawesi region.
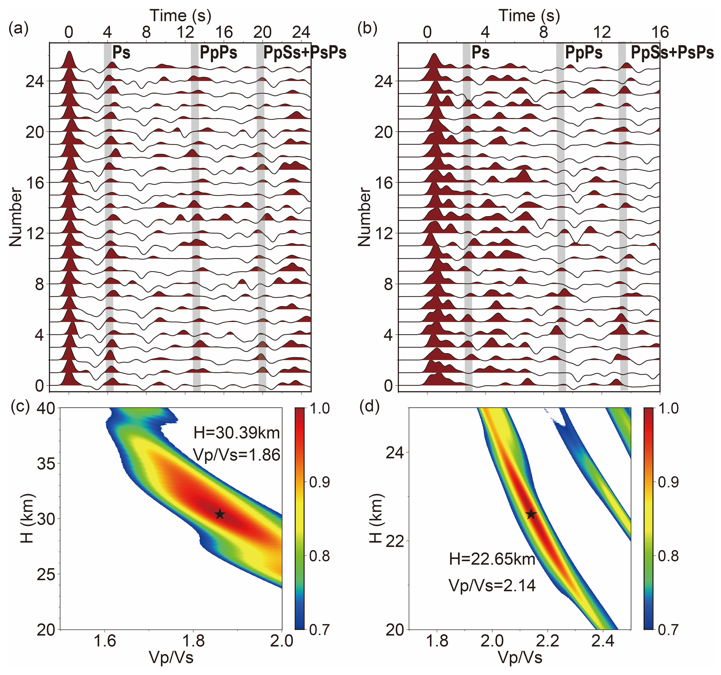
Figure 3(a) Receiver functions at the land station TOLI2; (b) Receiver functions at the OBS site M03F; (c) H–κ stacking result of TOLI2; (d) H–κ stacking result of M03F.
In this study, we also utilised prior information on crustal thickness, constrained by a nearby wide-angle seismic refraction profile (profile SO98-30 in Kopp et al., 1999), to guide our receiver function analysis. The oceanic station C21F is located near the seismic profile, where both the sedimentary layer and the oceanic crustal structure have been well constrained, revealing an oceanic crust with a thickness of approximately 8 km. Given that the oceanic crust of the Celebes Sea formed during the same spreading episode (magnetic isochrons C19–C18, ∼41.5–40 Ma; Gaina and Müller, 2007), we treat station C21F as representative of the regional oceanic crust and assume a constant igneous crustal thickness of 7.0 km at this location. Sedimentary layer thicknesses at the other OBS sites are then inferred by comparing their H–κ results with this reference crustal thickness. Based on these constraints, we estimated the thickness of the overlying terrigenous sedimentary sequences above the west Celebes Sea oceanic crust where C18F, C12F, and C09G locates and the thickness of the mélange in the accretionary wedge, particularly beneath stations C08F and C28F.
Our analysis reveals substantial lateral variation in crustal thickness across the study region. Beneath the Celebes Sea, the igneous crust is generally thin (∼7 km), consistent with the normal oceanic crust thickness (Kopp et al., 1999). In contrast, total crustal thickness beneath the Makassar Strait and northern Sulawesi reaches ∼25 and ∼30 km respectively, characteristic of extended continental or transitional crust. These contrasts delineate significant tectonic segmentation across the Palu–Koro Fault system.
Our results reveal a general inverse correlation between crustal thickness and surface topography, broadly consistent with isostatic compensation (Fig. S16). Moreover, the offshore ratios tend to be higher, which may reflect the presence of unconsolidated sediments (κ greater than 2.0) or mafic compositions (κ greater than 1.8) of the oceanic crust. These variations provide further evidence for complex crustal architecture influenced by active tectonism and sedimentation.
Table 2The crustal thickness H, and Moho depth measurements with their standard deviations of the OBSs and adjacent permanent land stations.
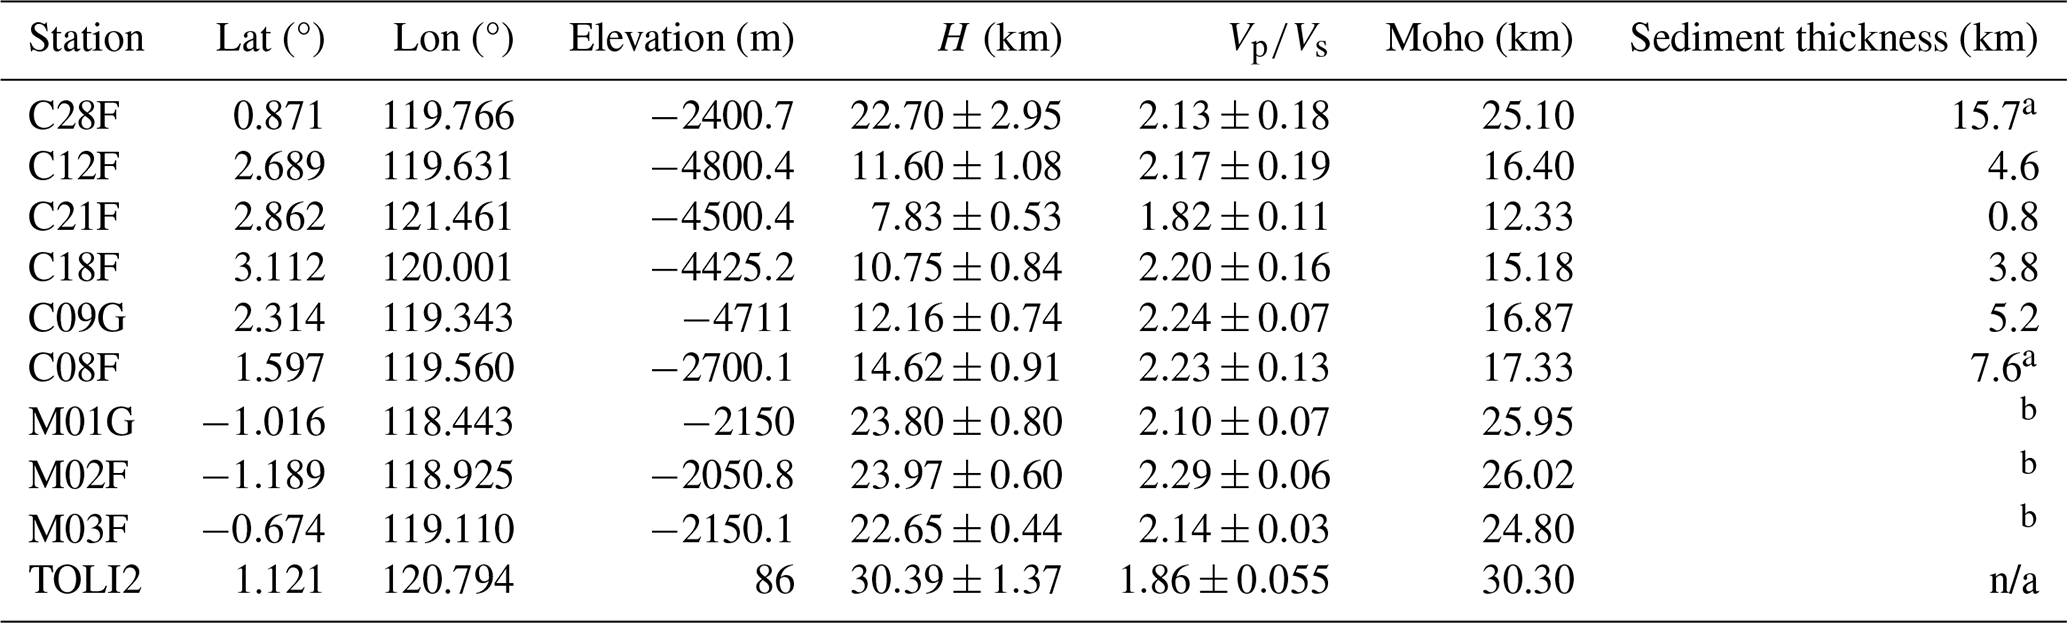
a Here the value represents the thickness of the upper plate (the accretionary wedge) underneath the OBSs. b Due to lack of trustworthy constraint in the Makassar Strait, we do not calculate the sediment thickness underneath those three OBSs. n/a: not applicable.
3.2 Receiver Function Waveform Inversion
To extract more detailed S-wave velocity profiles and assess vertical crustal heterogeneity, we perform waveform inversion of receiver functions using a neighbourhood algorithm (NA) approach (Sambridge, 1999a). This nonlinear global optimisation method allows exploration of high-dimensional model spaces without assuming a priori smoothness or linearity. The inversion is carried out in two stages. First, we randomly sample 2000 velocity models over the entire parameter space and compute their misfits to observed receiver functions. Misfit is quantified as the least-squares difference between observed and synthetic receiver functions, computed using reflectivity-based forward modelling. The ten best-fitting models are then used as seed points to generate 40 new models each via stochastic perturbation within Voronoi cells (Sect. S3), iterating this process for 200 generations. This strategy ensures both global coverage and local refinement in the model space (Sambridge, 1999b).
To validate the feasibility and stability of the inversion method, we have conducted synthetic tests using receiver function waveform comparisons for a crustal model, an oceanic crustal model, and an oceanic crustal model with sediment cover (Fig. S7). Figure S8a shows the synthetic receiver functions for different water depths and that the Moho-converted waves and multiples in the receiver function are visible. Although there is the air–water interface surface reflection Pwp with negative amplitude, the Pwp phase does not affect the arrival time of the relevant phase of the Moho. With increasing of water layer thickness, the arrival time of Pwp is regularly delayed. When the water depth is more than 2000 m, the main phases of the Moho in the receiver function will not directly interfere with Pwp (Fig. S8b). As shown in Fig. S9, we compared models with and without a 2.5 km water layer above a 6 km crust. Synthetic tests indicate that the Pwp phase from the water layer does not interfere with the Moho Ps conversions or their multiples. The H–κ stacking results are consistent with the model values, confirming that water-layer effects do not significantly influence the inversion results (Fig. S9c, f).
We used Vp and density values from the nearby global model CRUST1.0 (Laske et al., 2013) and kept them fixed during the inversions, as receiver functions are not highly sensitive to these parameters. The same Vp values were also applied in the H–κ method to ensure consistency. Linear stacking of all receiver function waveforms (stacked without moveout) from each station was applied before performing the waveform inversion. Example results for OBS stations C28F and M03F are presented in Fig. 4. The synthetic receiver functions derived from the optimal velocity models exhibit good agreement with the observed data, supporting the robustness of the inversion. The detailed fitting results of all OBS receiver function waveforms and the 1D S-wave velocity models are also presented in the Supplement (Figs. S10–S15). Notably, the S-wave velocity structure reveals a clear Moho step between southern M03F and northern C28F, suggesting a tectonic boundary or crustal offset across this region (Fig. 4a, b). The complete set of inversion results is summarised in Fig. 6c. The inferred Moho depths vary markedly across the network, with significant offsets observed across the Palu–Koro Fault zone. This crustal discontinuity provides strong geophysical evidence for block juxtaposition and active fault-related deformation beneath the Celebes Sea region.
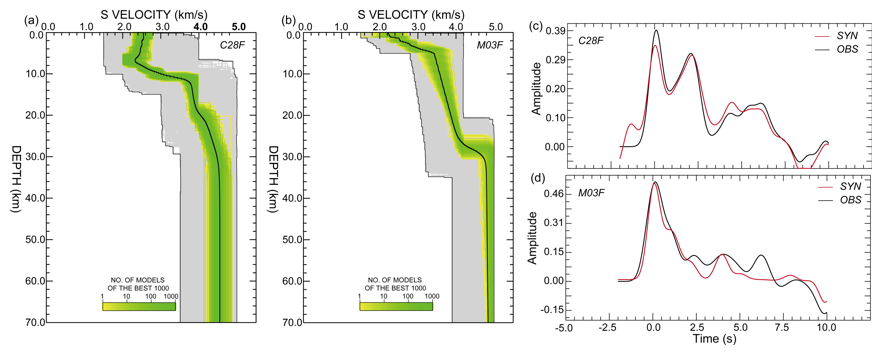
Figure 4Receiver function waveform inversion result at OBSs site C28F and M03F. (a) and (b) The S-wave velocity structure obtained by the NA inversion (The thin black line encloses the search area and the black curve is the average velocity structure of the 1000 best models). (c) and (d) Receiver function waveform comparison (the black line is the observed receiver function and the red line is the receiver function predicted by the optimal model).
4.1 Crustal Structure Characteristics in the Sulawesi Region
Our H–κ stacking results reveal significant lateral variation in Moho depth across the Sulawesi region, with particularly pronounced changes in the east–west direction across the Makassar Strait (Fig. 5a). The Moho beneath oceanic domains, such as the Celebes Sea, is relatively shallow, while the crust beneath north arm of the Sulawesi reaches thicknesses exceeding 30 km. Notably, the island crust is at least 5 km thicker than the crust in the Makassar Strait. This result is corresponding well with previous studies (Heryandoko et al., 2024), although our broader dataset and additional constraints lend greater robustness to the observed variations.
We interpret these results as evidence that continental crust dominates the region between Sulawesi and Borneo, particularly in the western part of the Makassar Strait, whereas crustal thinning and oceanic affinity appear more prominent toward the Celebes Sea. The sharp crustal contrast suggests the Makassar Strait marks a crustal boundary zone, with implications for the tectonic assembly of Sulawesi. In particular, our findings support that Sulawesi accreted to the eastern margin of Sundaland during the Late Miocene (Hall and Wilson, 2000), potentially along a pre-existing crustal suture.
A gradual thickening of the crust is also observed from the North Sulawesi Trench landward toward the northern arm of Sulawesi. This gradient may reflect differences in the nature and evolution of the overriding plate. Previous studies have proposed that the overriding plate in this region has experienced significant extensional deformation since the Miocene, as evidenced by the widespread distribution of Cenozoic normal faults in northern Sulawesi (Hall, 2012; Advokaat et al., 2017; Zhang et al., 2021). Despite evidence of active subduction along the North Sulawesi Trench from the Late Pliocene to Holocene, there is limited geologic evidence for compressional tectonics onshore (Advokaat et al., 2017; Hall, 2019).
Recent numerical modelling (Song et al., 2022) suggests differential trench rollback rate along the North Sulawesi Trench may explain the observed rotation of northern Sulawesi, and our Moho depth variations across this zone are consistent with such differential tectonic behaviour. As show in Table 2, we conclude that the ∼30 km Moho depth beneath northern Sulawesi reflects its origin as an ancient island arc terrane (corresponding station TOLI2), while the significantly thinner crust (∼15 km) beneath the Celebes Sea represents subducting oceanic lithosphere (corresponding OBS C21F, C18F, C12F, C09G and C08F). The Moho depth beneath the Makassar Strait is approximately 25 km (corresponding OBS M01F, M02F, and M03F). The thickness obtained in this region includes both the marine sediment and the underlying igneous crust above the Moho, and the ratio represents an average value over these two layers (Fig. 5 and Table 2). This feature aligns spatially with the Palu–Koro Fault zone, providing supporting geophysical evidence for its role as a major tectonic boundary separating the Sunda block to the west from micro blocks associated with the Indo-Australian Plate to the east (Socquet et al., 2019; Spakman and Hall, 2010).
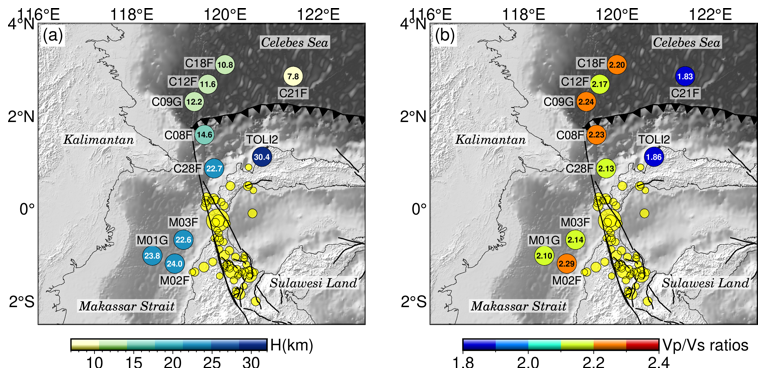
Figure 5(a) Crustal thickness in the study area; (b) ratios in the study area. The black solid line represents the Palu-Koro fault (Patria and Putra, 2020), and the yellow solid circles represent the epicentre distribution of the earthquake after relocation.
4.2 Velocity Structure and Seismicity Along the Palu–Koro Fault
The Palu–Koro fault is a major left-lateral strike–slip fault that originated during the Paleogene (ca. 65–23 Ma), transecting Sulawesi and effectively dividing the island into northern and southern tectonic domains. Presently, the northern arm of Sulawesi undergoes clockwise rotation at a rate of approximately 4° Ma−1, largely driven by the combined influence of subduction along the North Sulawesi Trench and strike–slip displacement along the Palu–Koro fault (Hall, 2019; Dong et al., 2022). Despite the fault's high slip rate, the historical record indicates a surprisingly low frequency of large earthquakes (Bellier et al., 2001).
On 28 September 2018, a Mw 7.5 earthquake ruptured the fault near Palu city, producing a devastating tsunami with run-ups exceeding 11 m. Back-projection and aftershock studies indicate rupture of at least two fault segments, including a submarine portion with near-ideal strike–slip behaviour. The fault appears to accommodate both trench retreat and oblique crustal deformation, which may help explain the complex rupture characteristics and tsunami generation (Song et al., 2019). Thus, several key questions remain unresolved, such as, where the submarine segment of the Palu–Koro fault lie relative to the seafloor, why this fault accumulated such significant strain with so few large seismic events and what factors contributed to the sudden onset of the 2018 rupture.
To better constrain the offshore fault geometry and rupture dynamics, we employed a two-pronged approach: relative aftershock relocation and back-projection of the mainshock rupture. We relocated all Mw≥4.0 aftershocks using waveform data from 817 broadband stations of the China Array network. After pre-processing with a bandpass filter (0.5–2.0 Hz) and correcting for station terms, we performed a grid search over a 40×40 node space (5 km spacing) in the source region, using 10 s time windows offset by 1 s. The location corresponding to the maximum stacking amplitude of P-wave arrivals was selected as the most probable hypocentre.
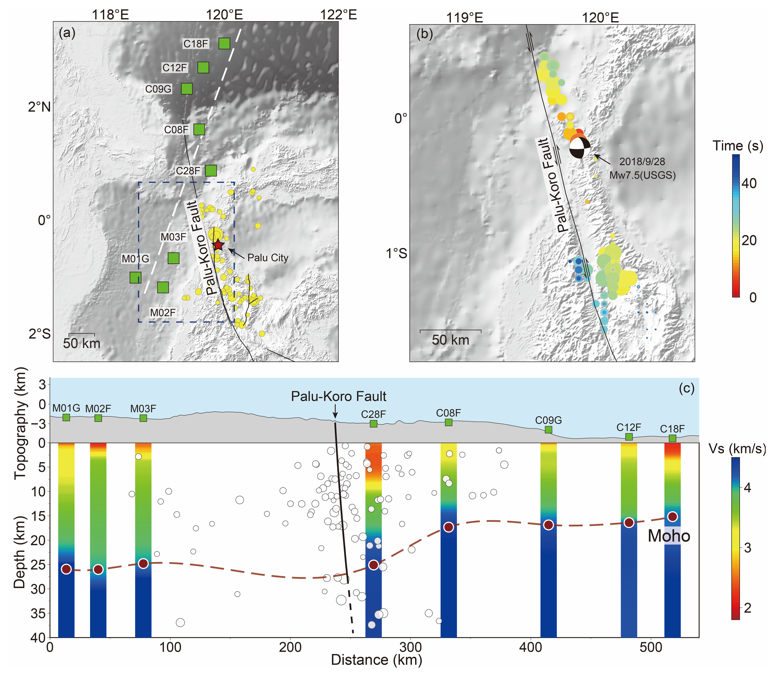
Figure 6S-wave velocity structure and seismicity near the Palu–Koro fault. (a) aftershocks distribution after relocation (the black solid line represents the location of the Palu–Koro fault, and the yellow solid circles denote the aftershocks). (b) Back projection by the Mw 7.5 Palu earthquake (the size of the circle indicates the magnitude of the earthquake, while the colour indicates the origin time of aftershocks after the mainshock). (c) The S-wave velocity structure near the Palu–Koro fault (the velocity structure is obtained by receiver function inversion results. The white circle represents Mw>3 earthquakes and the black line is the Palu–Koro fault; The red line indicates the Moho depth obtained by the H–κ stacking results).
Back-projection was also used to track the mainshock rupture front. By aligning the high-frequency P-wave energy and identifying the grid nodes that produce the strongest coherent stacking (Wang et al., 2018), we traced the rupture propagation from the hypocentre northward. Our results suggest that rupture rapidly advanced toward the NNW, reaching the northern fault segment shortly after the initial rupture, and propagating southward with a ∼20 s delay (Fig. 6b). This asymmetric rupture behaviour is consistent with field-mapped fault traces on land and their inferred offshore extensions (Hall and Wilson, 2000; Hamilton, 1979; Rangin et al., 1999).
Additionally, we integrated our receiver function inversion results to characterize the S-wave velocity structure across the fault zone. The interpolated S-velocity profile (Fig. 6c), taken along the cross-section marked by the dashed white line in Fig. 6a, reveals a prominent low-velocity anomaly extending beneath OBS C28F in the Celebes Sea. This feature, interpreted as a zone of fractured or fluid–rock interaction in the crust, aligns spatially with the fault trace inferred from seismicity.
Low-velocity anomalies or abrupt lateral velocity gradients are commonly associated with fault zones in seismic imaging studies (Thurber et al., 1997). The pronounced lateral change in crustal thickness between stations C28F and C08F at mid- to lower-crustal depths supports the interpretation that the Palu–Koro fault extends through the entire crust and offsets the Moho discontinuity. The geometry of the anomaly suggests that the fault dips gently with increasing depth, characteristic of a lithospheric-scale submarine fault system. Together with the relocated aftershocks, these findings provide strong evidence that the Palu–Koro fault is a deep, through-going structure that accommodates both strike-slip motion and vertical crustal deformation offshore.
In this study, we present new insight into the crustal structure and tectonic framework of the Sulawesi region based on nine OBSs and two land stations. Using receiver function analysis and waveform inversion, we obtain the crustal thickness, ratios, and S-wave velocity below the OBSs and land stations in the Celebes Sea and Makassar Strait area. The results show that:
-
A pronounced lateral variation in crustal thickness is seen: the crust beneath the Celebes Basin is relatively thin (∼8 km) with a sediment layer gradually thickens toward the west, by as much as ∼15 km, whereas crustal thickness increases significantly toward the Makassar Strait (∼25 km) and reaches over 30 km beneath North Sulawesi. These findings suggest that the Makassar Strait may be underlain by transitional or modified continental crust, rather than oceanic. The elevated ratios offshore may reflect the presence of water-saturated sediments or fractured crustal material.
-
It appears that the two sides of the fault represent separate crustal blocks. The H–κ stacking and receiver function inversion results provide robust constraints on the geometry of the Moho across the study area, revealing uplifted crustal blocks and sharp crust–mantle transitions. Analysis of the S-wave velocity structure and seismicity indicates that the NNW offshore extension of the Palu–Koro fault is marked by a deep-reaching, low-velocity zone, likely corresponding to a lithospheric-scale strike-slip system. This interpretation is further supported by the distribution of relocated aftershocks and the back-projection analysis of the 2018 Mw 7.5 Palu earthquake, which reveal rapid rupture propagation and segmentation along the fault.
This study suggests that the Palu–Koro fault is a major lithospheric boundary that facilitates both lateral shear and vertical deformation in response to regional tectonic forces. Our findings support that the fault accommodates oblique convergence and trench retreat processes, and that the crustal architecture of Sulawesi is shaped by the interaction of microplate fragments within the broader Indo–Australian–Eurasian plate system. Further seismological investigations are needed to aim at refining models of crustal evolution that will provide deeper insight into tectonic interactions and seismic hazards in this complex region and help explain the occurrence of earthquakes along extensive strike-slip faults.
Receiver function calculations and H–κ stacking in this study were performed using the hk1.3 software package developed by Zhu (2009). The software is publicly available from the developer's website at https://www.eas.slu.edu/People/LZhu/home.html (last access: January 2025), which provides access to the package and related documentation. The version used in this study is hk1.3. In addition, the inversion procedure adopted in this study was based on the Neighbourhood Algorithm developed by Rickwood and Sambridge (2006). The implementation used follows the original methodology described in their publication. This algorithm is a third-party method and was employed as described in the literature.
The ocean-bottom seismometer (OBS) data used in this study were obtained from the Sulawesi and Celebes Sea Ocean-bottom Seismic Network, provided by the International Federation of Digital Seismograph Networks (FDSN). The dataset is publicly available at https://doi.org/10.7914/SN/5R_2019 (Rawlinson et al., 2020).
The supplement related to this article is available online at https://doi.org/10.5194/se-17-453-2026-supplement.
TY performed the receiver function analysis and manuscript writing. CL led the research, conducted the fieldwork, curated the data, and assisted with manuscript writing. TH, NR and SW secured funding and supported the fieldwork. TX and PS contributed to the interpretation. AA, MTR and DPS supported fieldwork and data recovery. All authors reviewed and approved the final manuscript.
The contact author has declared that none of the authors has any competing interests.
Publisher's note: Copernicus Publications remains neutral with regard to jurisdictional claims made in the text, published maps, institutional affiliations, or any other geographical representation in this paper. The authors bear the ultimate responsibility for providing appropriate place names. Views expressed in the text are those of the authors and do not necessarily reflect the views of the publisher.
This article is part of the special issue “Seismic imaging from the lithosphere to the near surface”. It is not associated with a conference.
We gratefully acknowledge the captain and crew of the RV GEOMARIN III for their assistance in deploying the OBS. we would also like to thank the associate editor, David Snyder, reviewer Andrew Frederiksen, and one anonymous reviewer for their constructive comments. This work was supported by the NSFC (Major Research Plan on West-Pacific Earth System Multispheric Interactions project 91858212, the NSFC International Cooperation and Exchange Project E511511801, the NSFC general grant 42276072, 41888101, and the University of Cambridge GCRF project G102642. CL was funded through the Isaac Newton Trust in Cambridge and International Partnership of the Chinese Academy of Sciences (project 132A11KYSB20180020). The OBS waveform data is available upon reasonable request due to institutional agreements. Processed data and modelling results are available from the corresponding author. The hk1.3 software package was used for calculating receiver functions and performing H–κ stacking (https://www.eas.slu.edu/People/LZhu/home.html, last access: January 2025). The Neighbourhood Algorithm na_sampler package was used for receiver function inversion (https://iearth.edu.au/codes/NA/NA_sampler.php, last access: January 2025). Many of the figures are plotted by the Generic Mapping Tools software package (Wessel et al., 2019).
This research has been supported by the National Natural Science Foundation of China, Key Programme (grant no. 91858212), the Global Challenges Research Fund (grant no. G102642), and the National Natural Science Foundation of China (grant nos. 42276072 and 42306084).
This paper was edited by David Snyder and reviewed by Andrew Frederiksen and one anonymous referee.
Advokaat, E. L., Hall, R., White, L. T., Watkinson, I. M., Rudyawan, A., and BouDagher-Fadel, M. K.: Miocene to recent extension in NW Sulawesi, Indonesia, Journal of Asian Earth Sciences, 147, 378–401, https://doi.org/10.1016/j.jseaes.2017.07.023, 2017.
Bao, H., Ampuero, J. P., Meng, L. S., Fielding, E. J., Liang, C., Milliner, C. W. D., Feng, T., and Huang, H.: Early and persistent supershear rupture of the 2018 magnitude 7.5 Palu earthquake, Nature Geoscience, 12, 200–205, https://doi.org/10.1038/s41561-018-0297-z, 2019.
Bensen, G. D., Ritzwoller, M. H., Barmin, M. P., Levshin, A. L., Lin, F., Moschetti, M. P., Shapiro, N. M., and Yang, Y.: Processing seismic ambient noise data to obtain reliable broad-band surface wave dispersion measurements, Geophysical journal international, 169, 1239–1260, https://doi.org/10.1111/j.1365-246X.2007.03374.x, 2007.
Bellier, O., Sebrier, M., Beaudouin, T., Villeneuve, M., Braucher, R., Bourles, D., Siame, L., Putranto, E., and Pratomo, I.: High slip rate for a low seismicity along the Palu-Koro active fault in central Sulawesi (Indonesia), Terra Nova, 13, 463–470, https://doi.org/10.1046/j.1365-3121.2001.00382.x, 2001.
Cipta, A., Rudyanto, A., Afif, H., Robiana, R., Solikhin, A., Omang, A., Supartoyo, and Hidayati, S.: Unearthing the buried Palu–Koro Fault and the pattern of damage caused by the 2018 Sulawesi Earthquake using HVSR inversion, Geological Society, London, Special Publications, 501, 185–203, https://doi.org/10.1144/SP501-2019-70, 2021.
Collins, J. A., Vernon, F. L., Orcutt, J. A., Stephen, R. A., Peal, K. R., Wooding, F. B., Spiess, F. N., and Hildebrand, J. A.: Broadband seismology in the oceans: Lessons from the Ocean Seismic Network Pilot Experiment, Geophysical Research Letters, 28, 49–52, https://doi.org/10.1029/2000GL011638, 2001.
Cui, H. W., Wan, Y. G., Wang, X. S., Huang, J. C., and Jin, Z. T.: Characteristic of tectonic stress field in source region of 2018 Mw7.6 Palu Earthquake and Sulawesi area, Science China Earth Sciences, 46, 2657–2674, https://doi.org/10.3799/dqkx.2020.243, 2021.
Dong, M., Lü, C., Zhang, J., and Hao, T. Downgoing Plate-Buoyancy Driven Retreat of North Sulawesi Trench: Transition of a Passive Margin Into a Subduction Zone, Geophysical Research Letters, 49, https://doi.org/10.1029/2022GL101130, 2022.
Fox, M. J., Pettigrew, T., and Baird, A.: Post-earthquake building safety evaluation training, NZSEE 2021 Annual Conference, Palu, Indonesia, 64–64, https://www.researchgate.net/publication/350950895_Post-earthquake_building_safety_evaluation_training_Palu_Indonesia (last access: 23 February 2026), 2021.
Gaina, C. and Müller, D.: Cenozoic tectonic and depth/age evolution of the Indonesian gateway and associated back-arc basins, Earth-Science Reviews., 83, 177–203, https://doi.org/10.1016/j.earscirev.2007.04.004, 2007.
Greenfield, T., Copley, A. C., Caplan, C., Supendi, P., Widiyantoro, S., and Rawlinson, N.: Crustal deformation and fault strength of the Sulawesi subduction zone, Tectonics, 40, https://doi.org/10.1029/2020TC006573, 2021.
Hable, S., Sigloch, K., Barruol, G., Stähler, S. C., and Hadziioannou, C.: Clock errors in land and ocean bottom seismograms: high-accuracy estimates from multiple-component noise cross-correlations, Geophysical Journal International, 214, 2014–2034, https://doi.org/10.1093/gji/ggy236, 2018.
Hall, R.: Late Jurassic–Cenozoic reconstructions of the Indonesian region and the Indian Ocean, Tectonophysics, 570, 1–41, https://doi.org/10.1016/j.tecto.2012.04.021, 2012.
Hall, R.: The subduction initiation stage of the Wilson cycle, Geological Society, London, Special Publications, 470, 415–437, https://doi.org/10.1144/SP470.3, 2019.
Hall, R. and Wilson, M. E. J.: Neogene sutures in eastern Indonesia, Journal of Asian Earth Sciences, 18, 781–808, https://doi.org/10.1016/S1367-9120(00)00040-7, 2000.
Hamilton, W. B.: Tectonics of the Indonesian region, U.S. Government Printing Office, Professional Paper 1078, https://doi.org/10.3133/pp1078, 1979.
Heryandoko, N., Nugraha, A. D., Zulfakriza, Z., Rosalia, S., Yudistira, T., Rohadi, S., Daryono, D., and Widiyantoro, S.: Crustal thickness variation of Kalimantan and Sulawesi Region from Teleseismic receiver function, Journal of Seismology, 28, 879–898, https://doi.org/10.1007/s10950-024-10220-9, 2024.
Kopp, C., Flueh, E. R., and Neben, S.: Rupture and accretion of the Celebes Sea crustrelated to the North–Sulawesi subduction: combinedinterpretation of reflection and refraction seismicmeasurements, Journal of Geodynamics, 27, 309–325, https://doi.org/10.1016/S0264-3707(98)00004-0, 1999.
Kennett, B. L. N., Engdahl, E. R., and Buland, R.: Constraints on seismic velocities in the Earth from travel-times, Geophysical Journal International, 122, 108–124, https://doi.org/10.1111/j.1365-246X.1995.tb03540.x, 1995.
Langston, C. A.: Corvallis, Oregon, crustal and upper mantle receiver structure from teleseismic P and S waves, Bulletin of the Seismological Society of America, 67, 713–724, https://doi.org/10.1785/bssa0670030713, 1977.
Laske, G., Masters., G., Ma, Z., and Pasyanos, M.: Update on CRUST1.0–A 1–degree Global Model of Earth's Crust, Geophys. Res. Abstracts, 15, Abstract EGU2013–2658, 2013.
Ligorría, J. P. and Ammon, C. J.: Iterative deconvolution and receiver-function estimation, Bulletin of the Seismological Society of America, 89, 1395–1400, https://doi.org/10.1785/BSSA0890051395, 1999.
Liu, C. and Shi, Y. L.: Space-time stress variations on the Palu-Koro Fault impacting the 2018 Mw 7.5 Palu Earthquake and its seismic hazards, Geochemistry, Geophysics, Geosystems, 22, e2020GC009552, https://doi.org/10.1029/2020GC009552, 2021.
McNamara, D. E. and Buland, R. P.: Ambient noise levels in the continental United States, Bulletin of the seismological society of America, 94, 1517–1527, https://doi.org/10.1785/012003001, 2004.
Natafrisca, W. C. C., Zulfakriza, and Widiyantoro, S.: Noise and site response characterization in Makassar Strait and Celebes Sea based on Ocean Bottom Seismometer. IOP Conference Series: Earth and Environmental Science, 1288, 012027, https://doi.org/10.1088/1755-1315/1288/1/012027, 2023.
Niu, F. and Li, J.: Component azimuths of the CEArray stations estimated from P-wave particle motion, Earthquake Science, 24, 3–13, https://doi.org/10.1007/s11589-011-0764-8, 2011.
Patria, A. and Putra, P. S.: Development of the Palu-Koro Fault in NW Palu Valley, Indonesia, Geoscience Letters, 7, https://doi.org/10.1186/s40562-020-0150-2, 2020.
Rangin, C., Le Pichon, X., Mazzotti, S., Pubellier, M., Chamotrooke, N., Aurelio, M., Walpersdorf, A., and Quebral, R.: Plate convergence measured by GPS across the Sundaland/Philippine Sea plate deformed boundary: the Philippines and eastern Indonesia, Geophysical Journal International, 139, 296–316, https://doi.org/10.1046/j.1365-246X.1999.00969.x, 1999.
Rawlinson, N., Hao, T. Y., Widiyantoro, S., and Lü, C. C.: Sulawesi and Celebes Sea Ocean-bottom Seismic Network, International Federation of Digital Seismograph Networks [data set], https://doi.org/10.7914/SN/5R_2019, 2020.
Rickwood, P. and Sambridge, M.: Efficient parallel inversion using the Neighbourhood Algorithm, Geochem. Geophys. Geosyst., 7, Q11007, https://doi.org/10.1029/2006GC001246, 2006.
Sambridge, M.: Geophysical inversion with a neighbourhood algorithm–I. Searching a parameter space, Geophysical Journal International, 138, 479–494, https://doi.org/10.1046/j.1365-246X.1999.00876.x, 1999a.
Sambridge, M.: Geophysical inversion with a neighbourhood algorithm–II. Appraising the ensemble, Geophysical Journal International, 138, 727–746, https://doi.org/10.1046/j.1365-246X.1999.00900.x, 1999b.
Shen, W., Ritzwoller, M. H., Schulte-Pelkum, V., and Lin, F. C.: Joint inversion of surface wave dispersion and receiver functions: a Bayesian Monte-Carlo approach, Geophysical Journal International, 192, 807–836, https://doi.org/10.1093/gji/ggs050, 2013.
Socquet, A., Simons, W., Vigny, C., McCaffrey, R., Subarya, C., Sarsito, D., Ambrosius, B., and Spakman, W.: Microblock rotations and fault coupling in SE Asia triple junction (Sulawesi, Indonesia) from GPS and earthquake slip vector data, Journal of Geophysical Research: Solid Earth, 111, https://doi.org/10.1029/2005JB003963, 2006.
Socquet, A., Hollingsworth, J., Pathier, E., and Bouchon, M.: Evidence of supershear during the 2018 magnitude 7.5 Palu earthquake from space geodesy, Nature Geoscience, 12, 307, https://doi.org/10.1038/s41561-019-0337-3, 2019.
Song, T. R., Hao, T. Y., Zhang, J., Cao, L. M., and Dong, M.: Numerical modeling of North Sulawesi subduction zone: Implications for the east-west differential evolution, Tectonophysics, 822, https://doi.org/10.1016/j.tecto.2021.229172, 2022.
Song, X. G., Zhang, Y. F., Shan, X. J., Liu, Y. H., Gong, W. Y., and Qu, C. Y.: Geodetic observations of the 2018 Mw 7.5 Sulawesi earthquake and its implications for the kinematics of the Palu fault, Geophysical Research Letters, 46, 4212–4220, https://doi.org/10.1029/2019GL082045, 2019.
Spakman, W. and Hall, R.: Surface deformation and slab-mantle interaction during Banda arc subduction rollback, Nature Geoscience, 3, 562–566, https://doi.org/10.1038/ngeo917, 2010.
Stevens, C., McCaffrey, R., Bock, Y., Genrich, J., Endang, Subarya, C., Puntodewo, S. S. O., Fauzi, and Vigny, C.: Rapid rotations about a vertical axis in a collisional setting revealed by the Palu fault, Sulawesi, Indonesia, Geophys. Res. Lett., 26, 2677–2680, https://doi.org/10.1029/1999GL008344, 1999.
Thurber, C., Roecker, S., Ellsworth, W., Chen, Y., Lutter, W., and Sessions, R.: Two-dimensional seismic image of the San Andreas fault in the northern Gabilan range, central California: Evidence for fluids in the fault zone, Geophysical Research Letters, 24, 1591–1594, https://doi.org/10.1029/97GL01435, 1997.
Vigny, C., Perfettini, H., Walpersdorf, A., Lemoine, A., Simons, W., van Loon, D., Ambrosius, B., Stevens, C., McCaffrey, R., Morgan, P., Bock, Y., Subarya, C., Manurung, P., Kahar, J., Abidin, H. Z., and Abu, S. H.: Migration of seismicity and earthquake interactions monitored by GPS in SE Asia triple junction: Sulawesi, Indonesia, Journal of Geophysical Research: Solid Earth, 107, https://doi.org/10.1029/2001JB000377, 2002.
Walpersdorf, A., Vigny, C., Subarya, C., and Manurung, P.: Monitoring of the Palu-Koro fault (Sulawesi) by GPS, Geophysical Research Letters, 25, 2313–2316, https://doi.org/10.1029/98GL01799, 1998.
Wang, D., Chen, Y. G., Wang, Q., and Mori, J.: Complex rupture of the 13 November 2016 Mw 7.8 Kaikoura, New Zealand earthquake: Comparison of high-frequency and low-frequency observations, Tectonophysics, 733, 100–107, https://doi.org/10.1016/j.tecto.2018.02.004, 2018.
Wang, X., Chen, Q. F., Li, J., and Wei, S. J.: Seismic sensor misorientation measurement using P-wave particle motion: An application to the NECsaids Array, Seismological Research Letters, 87, 901–911, https://doi.org/10.1785/0220160005, 2016.
Wang, Y. Z., Feng, W. P., Chen, K., and Samsonov, S.: Source characteristics of the 28 September 2018 Mw 7.4 Palu, Indonesia, earthquake derived from the Advanced Land Observation Satellite 2 data, Remote Sensing, 11, https://doi.org/10.3390/rs11171999, 2019.
Wessel, P., Luis, J. F., Uieda, L., Scharroo, R., Wobbe, F., Smith, W. H. F., and Tian, D: The generic mapping Tools version 6, Geochemistry, Geophysics, Geosystems, 20, 5556–5564, https://doi.org/10.1029/2019GC008515, 2019.
Wu, D. Y., Ren, Z. K., Liu, J. R., Chen, J., Guo, P., Yin, G. M., Ran, H. L., Li, C. A. Y., and Yang, X. D.: Coseismic surface rupture during the 2018 Mw 7.5 Palu earthquake, Sulawesi Island, Indonesia, GSA Bulletin, 133, 1157–1166, https://doi.org/10.1130/B35597.1, 2021.
Zhang, J., Hao, T., Dong, M., Xu, Y., Wang, B., Ai, Y., and Fang, G.: Investigation of geothermal structure of Sulawesi using gravity and magnetic methods, Science China Earth Sciences, 64, 278–293, https://doi.org/10.1007/s11430-020-9659-3, 2021.
Zhu, L.: Receiver function package (deconvolution and H–κ stacking) hk1.3 (Version 1.3), https://www.eas.slu.edu/People/LZhu/home.html (last access: January 2025), 2009.
Zhu, L. P. and Kanamori, H.: Moho depth variation in southern California from teleseismic receiver functions, Journal of Geophysical Research: Solid Earth, 105, 2969–2980, https://doi.org/10.1029/1999JB900322, 2000.