the Creative Commons Attribution 4.0 License.
the Creative Commons Attribution 4.0 License.
 | 10 Apr 2026
Interpreting the cause of bound earthquakes at underground injection experiments
Linus Villiger
Valentin Gischig
Stefan Wiemer
Constraining the maximum possible magnitude (MMAX) of an induced earthquake sequence is a challenging process with important implications for managing risks. CAP-tests are a suite of statistical tests that can infer, quantify, and select best-fitting MMAX models via an earthquake catalogue's magnitudes. We use CAP-tests to discern between bound/unbound earthquake sequences at underground laboratories, where high-resolution and near-field geophysical observations are abundant. There, we find clear evidence for bound sequences, where magnitude growth was restricted during stimulation. Furthermore, bound sequences tend to be associated with stimulations that occurred within intact rock. On the other hand, unbound sequences tended to be associated with stimulations where hydraulic fractures interacted with relatively large pre-existing faults/fractures. We further examine bound sequences by fitting magnitude growth to a generalized family of MMAX functions. This process appears to be able to aggregate bound sequences into categories consistent with theoretical considerations (e.g., tectonic, tensile-crack, or shear-crack). These results provide a basis for validating and interpreting bound sequences in controlled experiments, which is important for extrapolating to larger-scale observations. Overall, CAP-tests appear to be a promising avenue for constraining MMAX from earthquake catalogue data.
- Article
(11531 KB) - Full-text XML
-
Supplement
(1690 KB) - BibTeX
- EndNote


-
Bound earthquake sequences (i.e., physically restricted maximum magnitudes) were unambiguously identified in underground laboratories.
-
Bound sequences tend to be associated with stimulation stages, while unbound sequences tend to inject into pre-existing faults/fractures.
-
Maximum magnitudes aggregate into four categories that are consistent with theoretical expectations.
Any process that has the potential to alter stresses in the subsurface also has the potential to trigger earthquakes (Moein et al., 2023). To date, many types of anthropogenic operations have induced earthquakes including wastewater disposal, hydraulic fracturing, enhanced geothermal systems, geological carbon sequestration, reservoir impoundment, and mining (Majer et al., 2007; Foulger et al., 2018; Schultz et al., 2020). In some cases, these events have grown large enough to be felt, damaging, or even harmful (Atkinson et al., 2016; Grigoli et al., 2018). In reaction to some of these cases, social concerns have resulted in subsurface development moratoriums (Kettlety et al., 2021; Muntendam-Bos et al., 2022).
The need to manage the risks of induced earthquakes has been recognized (Bommer, 2022; Zhou et al., 2024). The de facto approach to risk management centralizes around the traffic light protocol (Bommer et al., 2006), which delineates when an operation must stop (i.e., the red-light). Typically, red-lights are designed as magnitude thresholds (Schultz et al., 2021a, b, 2023a). Despite the widespread adoption of traffic light protocols, relatively little is understood about the growth of induced earthquake magnitudes. Some recent papers have begun examining this topic; for example, by attempting to forecast the next largest event (Mendecki, 2016; Cao et al., 2020, 2024; Schultz et al., 2023b; Verdon et al., 2023; Verdon and Eisner, 2024; Yin et al., 2024). However, these approaches are unable to discern the adequacy of input models. These topics are important for understanding trailing earthquakes (Schultz et al., 2022) and magnitude jumps (Verdon and Bommer, 2021), which are among the most important factors for designing risk-informed red-lights (Schultz et al., 2021a).
A common theme underlying these efforts is constraining the maximum possible magnitude (MMAX), given its prominence for induced seismicity hazard quantification (Bommer and Verdon, 2024). While there are numerous theoretical models that could possibly limit MMAX (McGarr, 2014; Hallo et al., 2014; Galis et al., 2017; Elsworth, et al., 2025; Im and Avouac, 2025; Sáez et al., 2025), there are relatively few methods available to reliably validate them with empirical data (Holschneider et al., 2014; Pisarenko and Rodkin, 2022; Kijko, 2025). In fact, empirically constraining MMAX from a catalogue is known to be a challenging task that is usually only possible in special circumstances (Holschneider et al., 2011; Zöller et al., 2016). Given the conflict between needing MMAX constraints against the lack of robust approaches, expert solicitation is often used as a substitute (DeDontney et al., 2016). Thus, there is a need to replace subjective/opinion-based methods with more quantitative measures for MMAX.
Based on this need, CAP-tests were designed as a suite of statistical tests to infer and quantify the presence of MMAX within a catalogue of data. Specifically, this approach compares the distribution of earthquake magnitudes (M) against the distribution of jumps in the largest magnitude events (ΔMLRG): when they are the same distribution, the catalogue is unbound and there is no MMAX (and vice versa) (Schultz, 2024). Synthetic testing suggests that this problem reformulation can be more sensitive to MMAX than traditional approaches (Schultz, 2024, 2026a). CAP-tests are broken into three component parts: the KS-test (Kolmogorov-Smirnov test) as a hypothesis test to infer the presence of MMAX, the MLE-test (Maximum Likelihood Estimation test) to quantify the value of MMAX, and the EW-test (Ensemble Weighting test) to select the theoretical MMAX model that explains the catalogue data best. We provide the full methodological details of CAP-tests in Sect. 2.
The application of CAP-tests to relatively larger magnitude induced seismicity cases found that these cases behaved in an unbound manner (Schultz, 2024) – suggesting that the use of theoretical MMAX models (McGarr, 2014; Hallo et al., 2014; Galis et al., 2017; Elsworth, et al., 2025; Im and Avouac, 2025; Sáez et al., 2025) are not appropriate during these fault reactivations. On the other hand, smaller-scale cases of induced seismicity (e.g., Utah FORGE, Preston New Road, Helsinki St1) from hydraulic stimulation indicated strong evidence for bound magnitude growth via an MMAX (Schultz et al., 2025). Furthermore, some stimulation stages transitioned from a bound process into an unbound one; this was interpreted as these particular stages reactivating pre-existing faults instead of stimulating new fractures. That said, subsurface unknowns/uncertainties hamper an unambiguous interpretation for these field-scale cases.
To better address subsurface unknowns/uncertainties, several underground laboratories (UGLs) have performed hydraulic fracturing experiments with varying scales/scopes. These intermediate-scale experiments aim to fill a gap between laboratory studies and field-scale observations: accessing near-field geophysical observations (that are infeasible at the field-scale) in a semi-realistic in situ setting. Said another way, UGL data was collected with the intention of delineating and interpreting fracture stimulation. Thus, the complementary data from UGLs is ideal for better interpreting bound sequences (found via CAP-tests). This comparison has the potential to elucidate an underlying mechanism for bound induced seismicity sequences. This is significant, since it starts to link statistical inferences of MMAX to physical processes.
In this study, we collect data from three UGLs: the Äspö Hard Rock Laboratory (Zang et al., 2019, 2021), the Sanford Underground Research Facility (Dobson et al., 2018; Kneafsey et al., 2018; Morris et al., 2018), and the Grimsel Test Site (Gischig et al., 2016; Amann et al., 2018). We perform CAP-tests on these UGL datasets and observe both bound and unbound stimulation stages. We cross-reference these observations against the wealth of geophysical observations and interpretations from prior multi-disciplinary studies. Bound cases tend to occur when stimulation is restricted to the growth of new fractures, while unbound cases tend to reactivate (relatively large) pre-existing faults/fractures. Furthermore, we empirically search for the functional form of MMAX models; we delineate four categories that are predominantly consistent with theoretical expectations. Finally, we discuss how these results create a consistent picture with field-scale results.
2.1 Methodological Overview
The methods of this paper concern the robust inference and estimation of MMAX from a catalogue of earthquakes. To do so, we have composed a suite of statistical tests. First, simple-tests can be used to pre-screen cases and provide qualitative or semi-quantitative inferences of MMAX bounds. Candidate catalogues can then be examined more deeply using CAP-tests, which use a series of statistical tests to robustly discern the presence of MMAX and quantify the best model hypothesis. Last, we outline criteria for assessing the absence of MMAX. These tests are used to logically guide interpretations amongst the three possibilities: that MMAX bounds a catalogue, that MMAX is not bounding a catalogue, or that the catalogue is not well-resolved enough to make an interpretation either way. An overview of this workflow's logical sequencing has been provided (Fig. 1).
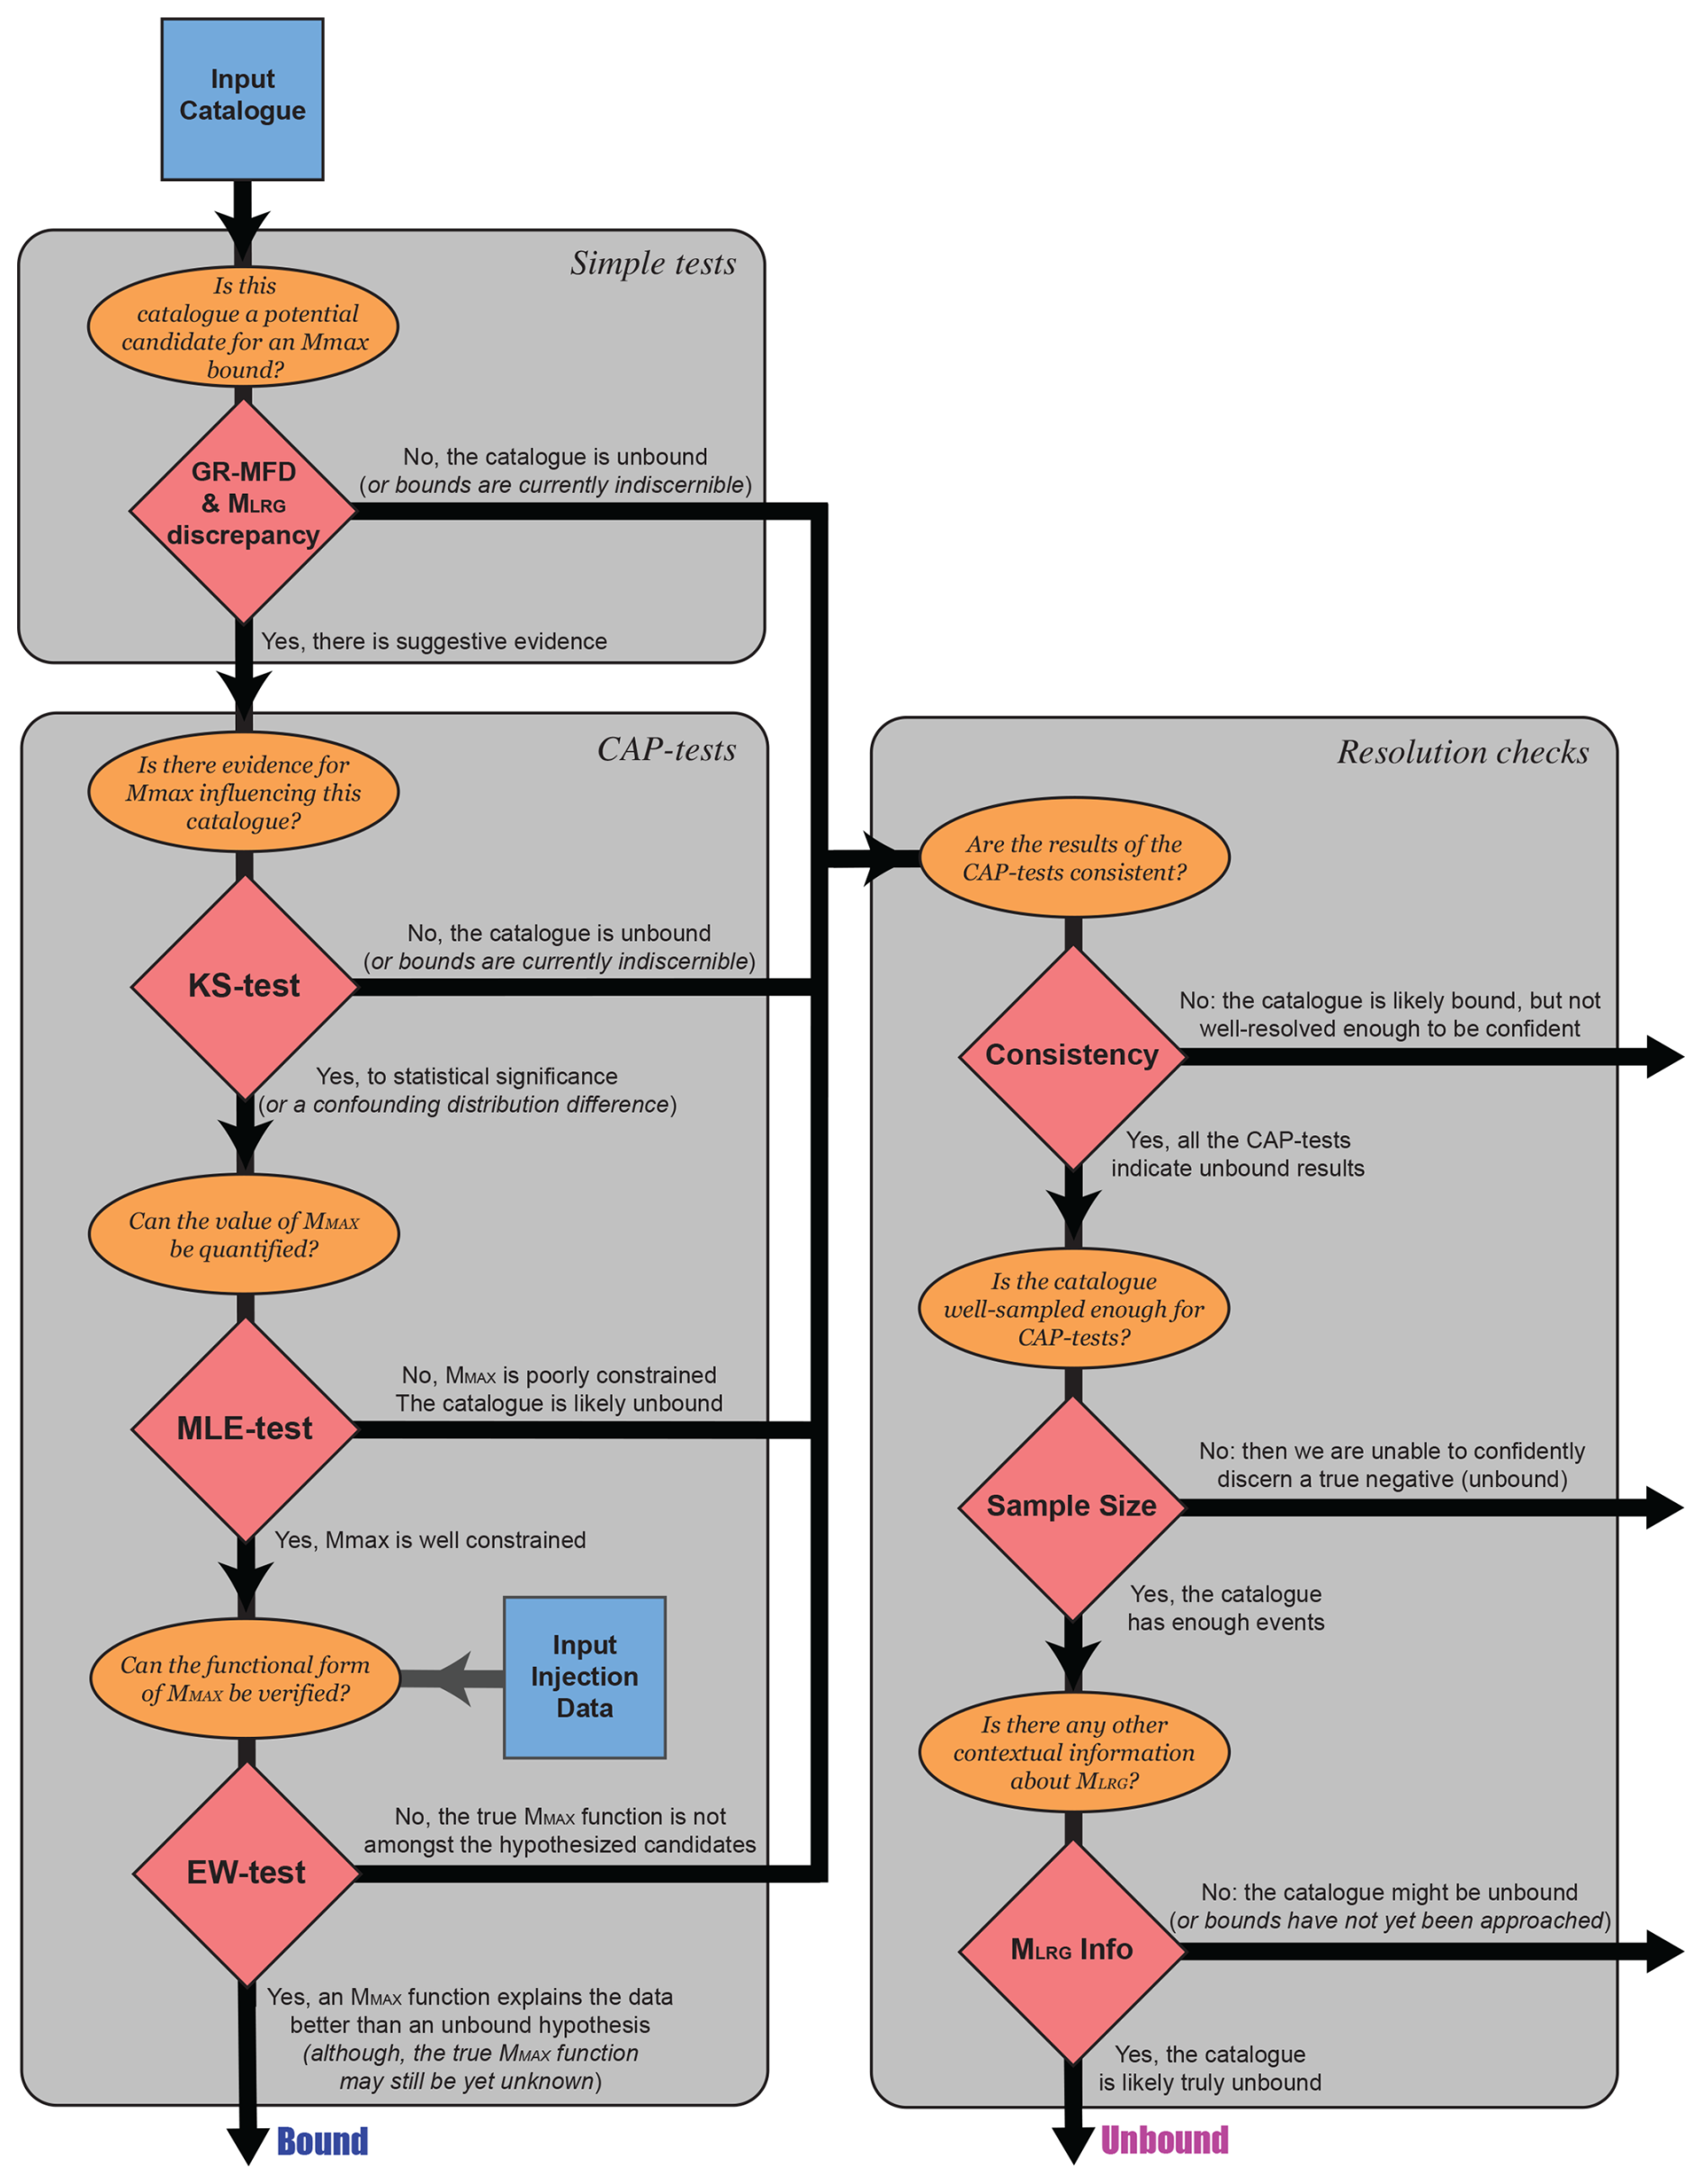
Figure 1Workflow to discern MMAX bounds. Simple-tests are used to pre-screen for potentially bound catalogues. Afterwards, CAP-tests can more rigorously identify bound cases.
2.2 Simple-tests
Here, we briefly define some simple-tests to provide an initial assessment of MMAX. This is accomplished through an examination of the Gutenberg-Richter magnitude frequency distribution (GR-MFD) (Ishimoto and Iida, 1939; Gutenberg and Richter, 1944) and discrepancies between observed largest event minus the expected largest events. This sub-section constitutes the first step in our overall workflow (Fig. 1).
2.2.1 Fitting the Gutenberg-Richter Magnitude Frequency Distribution
The GR-MFD is a relationship that describes the amount and frequency of earthquake magnitudes: . The a-value describes the scaling to the total amount of earthquakes N, while the b-value is the proportionality of big-to-small events. Given a catalogue of earthquake magnitudes M, this relationship can be fit through Maximum Likelihood Estimators (Marzocchi and Sandri, 2003). For real datasets, a lower bound truncation called the magnitude-of-completeness (Mc) is introduced to account for detection incompleteness. Many methods exist to evaluate Mc robustly, to account for the incompleteness in the detection of low magnitude events, thusly to avoid biases during the GR-MFD fitting process. In this study, Mc is selected by searching for the value that maximizes the goodness-of-fit metrics like R2 (Schultz et al., 2018) or minimizes the negative log-likelihood of the GR-MFD. In cases with a goodness-of-fit plateaus/valleys, we select the value of Mc closest to plateau start. Sometimes we are conservative in our Mc choice by selecting a value slightly larger than optimal. Note that this conservativism will have a detrimental effect on finding bound cases. The Mc value selected by this process is typically near (but skewed right-ward of) the peak bin of the non-cumulative GR-MFD.
As part of the simple indicators of MMAX, a visual comparison of the GR-MFD fit against the observed data is used to qualitatively examine for the presence of MMAX. Catalogues that are relatively deficient in large magnitudes (compared to their fits) are possible candidates for an MMAX. We note that this deficiency in large magnitude events is a key metric for identifying if/when MMAX can be constrained (Holschneider et al., 2011; Schultz, 2024, 2026a).
2.2.2 Appraising the deficiency of large events
To provide additional semi-quantitative assessments of an MMAX, we examine the empirical degree-of-truncation (δMLRG), which is the discrepancy between the largest observed event minus the largest expected event. The expected MLRG can be estimated: if a GR-MFD is assumed, then order statistics suggests a modal value of (van der Elst et al., 2016). Where N is the total number of events larger than the magnitude-of-completeness Mc and b is the previously described b-value. We can use the prior GR-MFD fits to determine the expected value of MLRG and then compare that against the observed value (i.e., δMLRG). We also use the inverted cumulative distribution function (van der Elst et al., 2016) to determine the percentile of the δMLRG discrepancy – or the likelihood of this degree-of-truncation occurring, assuming an unbound catalogue.
As part of the simple indicators of MMAX, catalogues that exhibit negative δMLRG suggest the presence of an MMAX. We note that the δMLRG discrepancy is a proxy metric for the resolvability of CAP-tests. Usually values of −0.5M (or less) for MLRG−MMAX are required to confidently assert the presence of an MMAX (Schultz, 2024, 2026a). Note that this MLRG−MMAX difference is the expected value where quantitative inferences of MMAX can start being made with 95 % confidence, from theoretical considerations (Eq. 15; Holschneider et al., 2011).
2.3 CAP-tests
The CAP-tests are a suite of statistical methods aimed at discerning the influence of MMAX on a catalogue; each test is rooted in fundamentally different statistical frameworks, to ensure the robust validation of results. In this sense, when all the CAP/simple-tests suggest a similar bound/unbound result, we can be (more) confident that we have reached the right interpretation – even if there might be data/method issues.
In this sub-section, we explicitly define each of the CAP-tests. We also refer readers to a past study that defines the CAP-tests in detail, provides comprehensive sensitivity tests, and highlight real-data applications (Schultz, 2024; Schultz et al., 2025; Verdon and Schultz, 2026). These tests build upon the simple pre-screening assessments (Sect. 2.2), logically answering a sequence of questions to discern the influence of MMAX more rigorously (Fig. 1).
2.3.1 The Kolmogorov-Smirnov test (KS-test)
The first test is rooted in the statistical framework of hypothesis testing. Here, we take advantage of the fact that the distribution of magnitudes (M) and the distribution of jumps in the sequence of large events (ΔMLRG) is the same if unbound, but differ when there is an MMAX upper bound (Schultz, 2024, 2026a). This fact ideally lends itself to hypothesis testing via the KS-test (Berger and Zhou, 2014). Given a catalogue, both M and ΔMLRG can be observed. We can then compare these two observations against each other to test if they are drawn from the same distribution (or not), via the KS-test. This approach is advantageous in that it is non-parametric – i.e., it is completely data-driven and imposes no assumptions about the kind of distributions M or ΔMLRG were drawn from. Because of this, we do not need to fit the data to a GR-MFD or have any knowledge/estimates of the b-value to perform our KS-test. Confidence in the KS-test is reported as compliments of standard p-values, where 95 % is a common threshold used to declare statistical significance.
Since this test is only interested in discerning the existence of an MMAX, additional catalogue realizations can be drawn through reshuffling the order of events. In this sense, bootstrapping can be employed to generate numerous catalogue realizations in which the KS-test is repeated. This provides more robust p-value estimates. Testing on both synthetic and real datasets suggests that the KS-test is significantly more sensitive to discerning MMAX than approaches that attempt to appraise GR-MFD fits (Schultz, 2024, 2026a). As well, synthetic testing on unbound cases shows that this KS-test produces false-positives at the rate expected for a p-value distribution (Schultz, 2024). To be able to discern the influence of MMAX, MLRG−MMAX discrepancies of −0.5M or better are usually required, consistent with theoretical expectation (Holschneider et al., 2011).
While this formulation of the KS-test is powerful, we also provide a word of caution towards a potential interpretation pitfall: this method is testing for differences between the distributions M and ΔMLRG. The presence of an MMAX is one possible reason for this difference, but others may also confound a clear interpretation (e.g., temporal changes in b-value, kinked distributions, tapered distributions). Thus, the KS-test should be suitably pre-processed or complemented with other tests to increase the certainty of an MMAX interpretation.
2.3.2 The Maximum Likelihood Estimator (MLE-test)
The next test is rooted in the statistical framework of Maximum Likelihood Estimation. If there is some suggestive evidence for the existence of an MMAX, the next natural step is to quantify this value. The log-likelihood function is defined as follows:
where the probability density function of the GR-MFD is given by fM(M), with a set of model parameters θ (Schultz, 2024). This function essentially entails two parts: the log-likelihood for the catalogue magnitudes M (right-hand side of equation, first term) and the log-likelihood of the jumps in largest events ΔMLRG (right-hand side of equation, second term). The optimal set of model parameters θ are then solved for via numerical methods to maximize the log-likelihood, given the observed catalogue data M and ΔMLRG. We perform this optimization in two-steps: the first using the standard log-likelihood constrain the b-value (Marzocchi and Sandri, 2003) (with the optimal Mc estimates) and then using the composite log-likelihood to constrain MMAX. In this study, we consider the simplest MMAX variant for fM(M), which is a truncated GR-MFD (Schultz, 2024).
If this test is only interested in discerning a stationary value of MMAX, additional catalogue realizations can be drawn through reshuffling the order of events. Similar to the KS-test, bootstrapping can be employed to generate numerous catalogue realizations in which the MLE-test is repeated. This provides more robust MMAX estimates. Testing on both synthetic and real datasets suggests that the MLE-test is sensitive to quantifying MMAX within a hundredth of a magnitude unit when MLRG-MMAX discrepancies are −0.5M or better. In cases where the MLE-test is applied to unbound catalogues, bootstrapped estimates of MMAX will be much larger than MLRG and standard deviations can be on the order of 1 magnitude unit or greater.
2.3.3 The Ensemble Weighting test (EW-test)
The third and final CAP-test is rooted in the statistical framework of likelihood inference. Together, the two prior tests provide suitable evidence for the existence of MMAX. However, MMAX may be a function of time or injected volume, becoming some non-stationary value throughout the catalogue duration. Certainly, MMAX processes relevant for induced seismicity and hydraulic fracturing have been proposed in the past (McGarr, 2014; Hallo et al., 2014; Galis et al., 2017; Elsworth et al., 2025; Im and Avouac, 2025; Sáez et al., 2025). In this sense, having an approach that can distinguish the best proposed MMAX model (given the data) would be insightful.
The EW-test starts by considering an ensemble of proposed MMAX models to explain the catalogue data (Schultz, 2024). Using the previously defined log-likelihood function, both Akaike Information Criterion (AIC) and Bayesian Information Criterion (BIC) can be defined for each MMAX model (Schwarz, 1978; Akaike, 1998); note that we have used the small sample size corrections for AIC/BIC (Sugiura, 1978; McQuarrie, 1999). Next, we compute the differences in AIC/BIC scores, by subtracting the score of the best MMAX model. These score differences can be translated into relative model weights by an exponential function (Wagenmakers and Farrell, 2004). We combine AIC/BIC weights into a single weight by taking an average between the two. In this study we will consider four standard MMAX models: McGarr-like (i.e., log-proportional to injected volume; MMAX∝log 10(V1)) (McGarr, 2014; Hallo et al., 2014; Elsworth et al., 2025), Galis-like (i.e., (Galis et al., 2017), a constant tectonic upper bound (Kanamori and Anderson, 1975), and the unbound null hypothesis. The unbound null hypothesis consists of three model parameters (Mc, b-value, GR-MFD variance), while all bound models have one additional model parameter (i.e., K=4) to account for the slope of the volume-based relationship.
The interpretation of the MMAX model weights is straightforward: larger model weights indicate a better explanation of the data. The model with the largest weight is the best explanation of the data (within the ensemble). To quantify the statistical significance of weight differences between two models, the relative odds ratio can be computed as the ratio of the two model weights (larger/smaller). Ratios of 1+ are insignificant, 3+ are substantial/positive, 10+ are strong, and 100+ is decisive (Kass and Raftery, 1995). We note that the best model in an ensemble does not necessarily imply the veracity of the model; there could be another (unknown) model that explains the data better than all of those yet considered.
In synthetic testing, the EW-test can accurately and confidently discern the true MMAX model (Schultz, 2024). Usually, only a handful of ΔMLRG observations are required to confidently identify the true model (i.e., with odds ratios of 3–10 or better). However, like the prior CAP-tests, MMAX must be influencing the catalogue for meaningful inferences to be made. Said another way, if the MMAX is much larger than MLRG, then the EW-test will not be able to distinguish between bound/unbound hypotheses. A schematic diagram explaining the EW-test has been provided (Fig. 2).
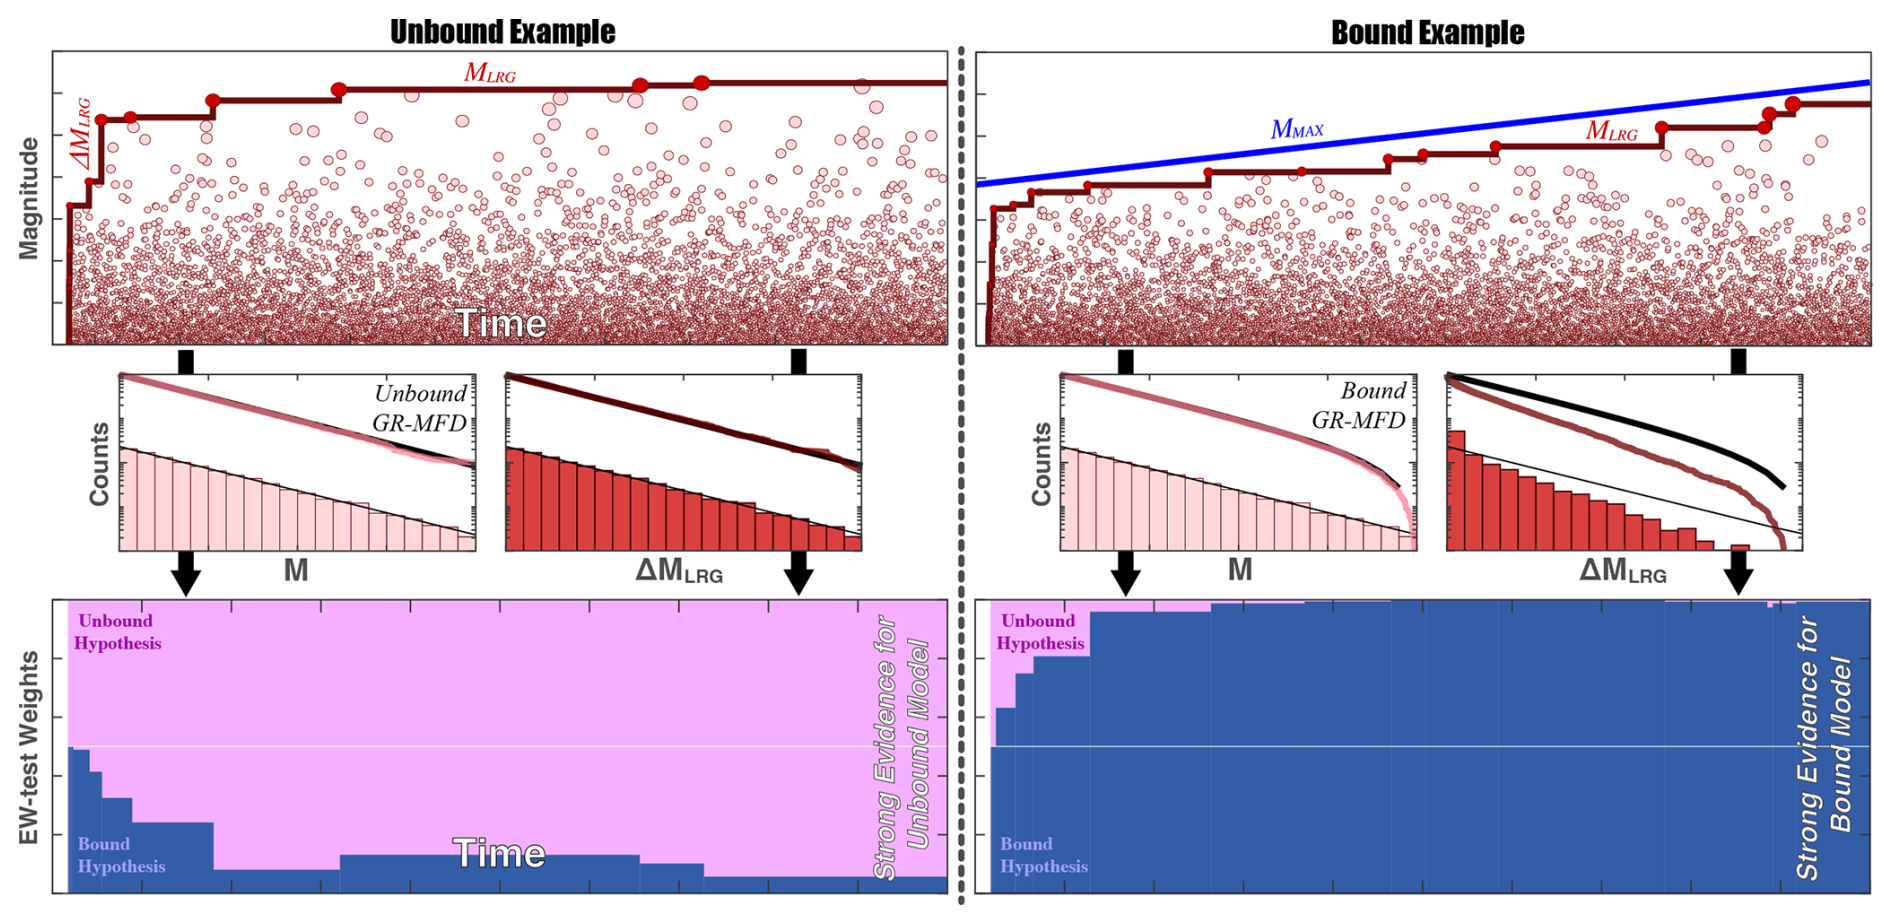
Figure 2Schematic demonstration of the EW-test. The upper panels show hypothetical catalogues of earthquakes. Earthquake magnitudes (M, pink circles), the sequence of largest events (MLRG, red line), and jumps in the largest event magnitudes (ΔMLRG) can be directly observed. Potentially, some unobservable physical process could be bounding these catalogues (MMAX, blue line). Left and right panels detail contrasting concepts for a bound and unbound catalogue, respectively. If there is an MMAX, then it can be statistically inferred from the observables. Middle panels show the differences between distributions of M and MLRG, when bounded by MMAX (or not). The distribution of M follows a GR-MFD: analytical cumulative (thick black line) and non-cumulative (thin black line) agree with numerical cumulative (pink line) and non-cumulative (pink bars) distributions. The distribution of ΔMLRG will differ from the GR-MFD when bounded by MMAX. Bottom panels show the results of EW-tests using these concepts. Weights of two hypothesized models, an unbound MMAX (pink area) and a bound MMAX (blue area), change as new values of MLRG are observed. EW-tests can quickly infer the presence of the true MMAX model, from the equivocal a priori assumption (white horizontal line).
2.4 Truly unbound or just lacking data?
In an ideal experiment, injection would continue indefinitely, providing excellent resolving power for MMAX by sampling infinitely many large events near MMAX. Obviously, real-data cases are sample/time-limited, however. CAP-tests have the potential to discern influence from MMAX in a (sample-limited but still) well-resolved catalogue. However, an issue arises when attempting to perform these tests on poorly-resolved catalogues, since CAP-tests cannot distinguish an MMAX in this case. For example, if CAP-tests fail to indicate a bound catalogue, then this could be because the catalogue is either truly unbound or simply is not well-resolved enough (i.e., it has a low degree-of-truncation). Distinguishing between these two possibilities can be nebulous. We outline some guiding metrics to assist in making this assessment, which is our last workflow step in discerning the (apparent) absence of MMAX more rigorously (Fig. 1).
The first consideration is the consistency among simple/CAP-test results. Cases that are truly bound tend to have all tests unanimously indicate a bound process, and vice versa. For reference, sensitivity testing on bound real-data that was sequentially decimated indicated a loss of resolving power, consistent with the degree of decimation (Schultz et al., 2025). Specifically, the EW-test tends to lose resolving power first, followed by the KS-test, with the MLE-test generally being the most sensitive. In fact, the use of multiple sub-tests rooted in disparate statistical methods was an intentional design choice to cover strength/deficiencies of each individual approach (Schultz, 2024). Note that this consistency indicator is only relevant for semi-well-resolved cases that are truly bound; very-poorly-resolved cases would still appear as unbound.
The second metric considered is the size of the catalogue N, within 1–2 magnitude units of the current MLRG. Synthetic tests indicate that catalogues between 101–102 (above the Mc) are usually required to confidently assert MMAX (Schultz, 2024). Similarly, real-data cases also noted that EW-tests can confidently assert an MMAX model after observing 30–200 events – although most cases required ∼ 50–100 events (Schultz et al., 2025). Thus, we can use catalogue size as another rough indicator for how well-resolved MMAX is.
The third metric we will consider is the currently observed MLRG. Specifically, we will consider MLRG in a contextual comparison against relevant cases that are already known to be bound. For example, if two independent neighbouring stages (with similarly sized catalogues) give diverging bound/unbound responses, then the observed MLRG can be used to make inferences. Scenarios where the unbound stage has an observed MLRG greater than the bound stage is more likely to be truly unbound. On the other hand, scenarios where the unbound stage has an observed MLRG significantly less than the bound stage is potentially just a poorly-resolved case.
We apply this workflow to data collected at a few UGLs that were aimed at better understanding the hydraulic fracturing process (Fig. 3). UGLs include the Äspö Hard Rock Laboratory (Äspö HRL), Sanford Underground Research Facility (SURF), and the Grimsel Test Site (GTS). Each of these UGLs had differing scopes, scales, and aims. Here, we will cover each UGL in a parallel style: we introduce each UGL, examine CAP-test results at the UGL, and then briefly interprets those results. We will start with the simpler UGLs and then transition into more complex cases, to pedagogically build upon the complexity of interpretations.
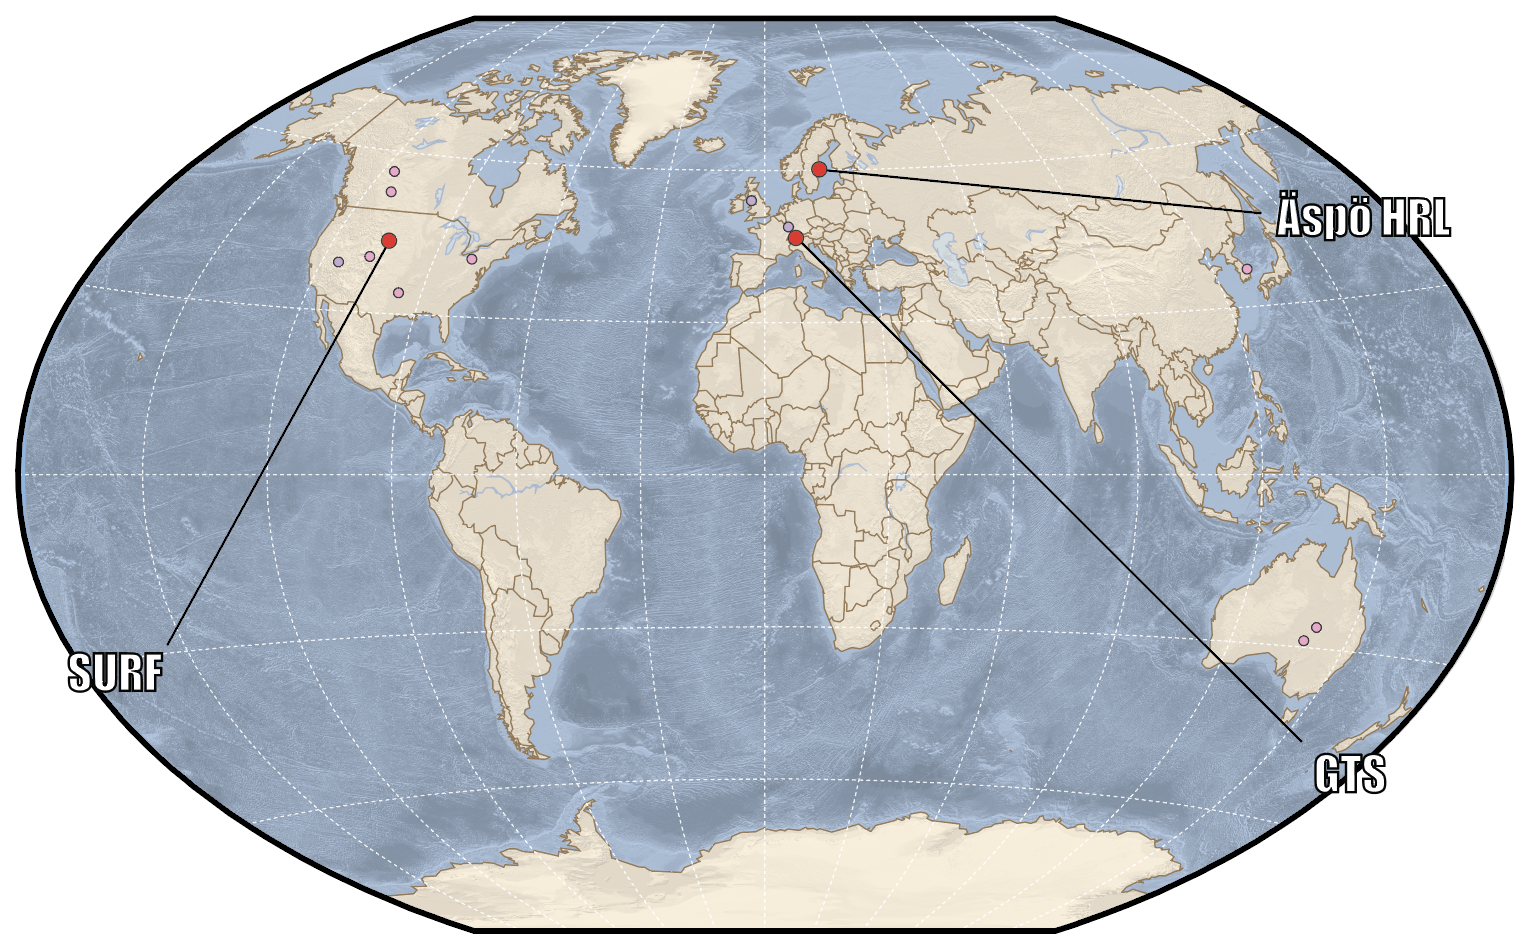
Figure 3Global locations of datasets. Locations of the test sites considered: the Äspö Hard Rock Laboratory (Sweden), Sanford Underground Research Facility (South Dakota, USA), and the Grimsel Test Site (Switzerland). Supporting locations from past studies (Schultz, 2024; Schultz et al., 2025), are also shown.
3.1 The Äspö Hard Rock Laboratory
3.1.1 Overview of the Äspö HRL
The Äspö HRL is located on the Baltic east coast of Sweden, near the Simpevarp Peninsula (Fig. 3). This UGL was constructed as a testbed to study the potential for nuclear waste storage by the Swedish Nuclear Fuel and Waste Management Company starting in 1986. By 1995, construction efforts reached the 450 m target depth into the granitoids of the Trans-Scandinavian Igneous Belt (Stanfors et al., 1999).
The intention of recent (June 2015) injection experiments at the Äspö HRL was to test the feasibility of cyclic stimulation as an alternative means to enhance subsurface permeability, while also reducing the severity of induced seis micity (Zang et al., 2019, 2021). Six injection stages (HF1–HF6) were conducted in a single borehole (28 m long at 410 m depth), with an average stage spacing of ∼ 3 m, and encountering either Ävrö granodiorite or fine-grained diorite-gabbro. Stage locations were chosen to avoid natural fractures (Zimmerman et al., 2019). Each stage used between 4.1-27.2 L of injected fluid, spread between 4–6 injection sub-cycles (Zang et al., 2019). Some stages (HF1, HF2, HF4, and HF6) used traditional hydraulic fracturing techniques, while other stages (HF3 and HF5) employed cyclic stimulation (Zang et al., 2019). Resulting microseismicity was predominantly recorded in stages HF1-HF2 (López-Comino et al., 2017; Niemz et al., 2020, 2021), with events reaching up to Mw−3.5 (Kwiatek et al., 2018) and slipping with reverse or strike-slip motions (López-Comino et al., 2021). Cyclic stimulations tended to produce less seismicity (Zang et al., 2019) and more complex fracture networks (Stephansson et al., 2019; Zhuang et al., 2019), albeit with less permeability enhancement (Zimmerman et al., 2019). Data for the Äspö HRL is publicly available (Zang et al., 2024) and a spatiotemporal summary of stimulation events is plotted (Fig. 4).
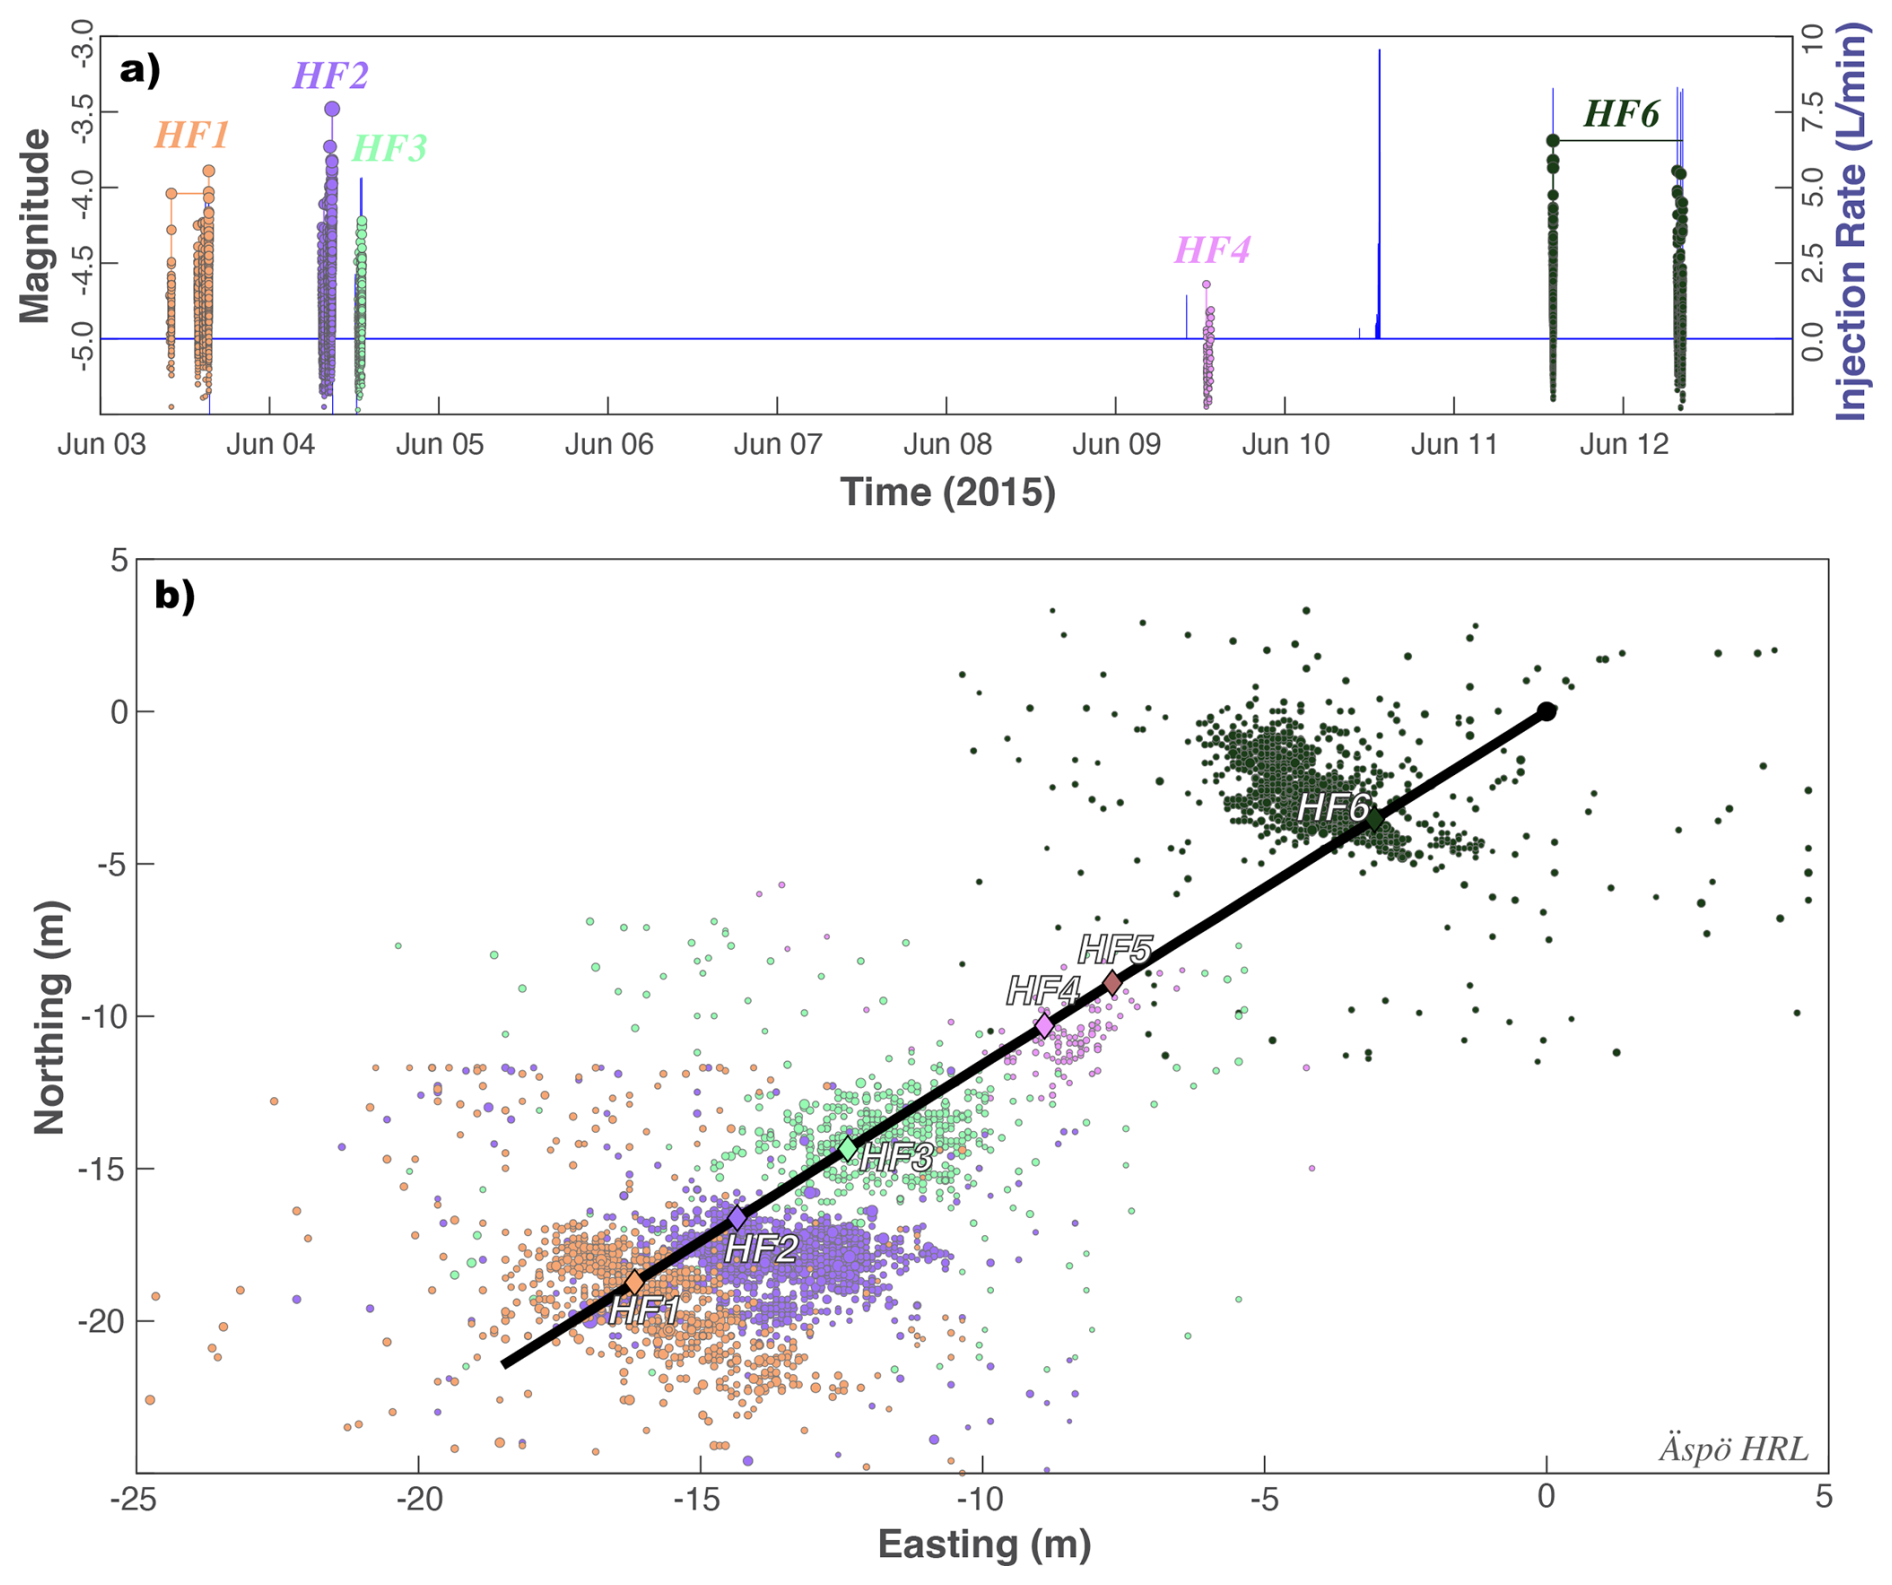
Figure 4Hydraulic stimulation and earthquake response at the Äspö HRL. (a) Timings and injection rates of six stages (blue line) are compared against induced earthquake magnitudes (circles). (b) Locations of six stages (diamonds; HF1-HF6), along the well bore (black line), and the resultant earthquakes (circles). Injection stages and corresponding earthquakes are colour coordinated in all panels.
3.1.2 CAP-tests results at the Äspö HRL
To begin assessing if some process might be restricting magnitude growth at the Äspö HRL, we fit the GR-MFD to the catalogue data from each injection stage (i.e., HF1-HF6). To account for magnitude errors, we employ a 50-trial bootstrap process in which the catalogue magnitudes are dithered by ±0.1 (this includes a dithered Mc). Only four of the stages (HF1-HF3, and HF6) have enough data to examine. Overall, the earthquakes here appear to be deficient in large-magnitude events (Fig. 5). Correspondingly, the δMLRG discrepancies range between −0.2 to −0.4 for all stages. Assuming an unbound catalogue, these degrees-of-truncation (δMLRG) would be < 1st, 3rd, < 1st, and 6th percentile events, respectively. These initial assessments are suggestive of some MMAX upper bound restricting catalogue growth at the Äspö HRL.
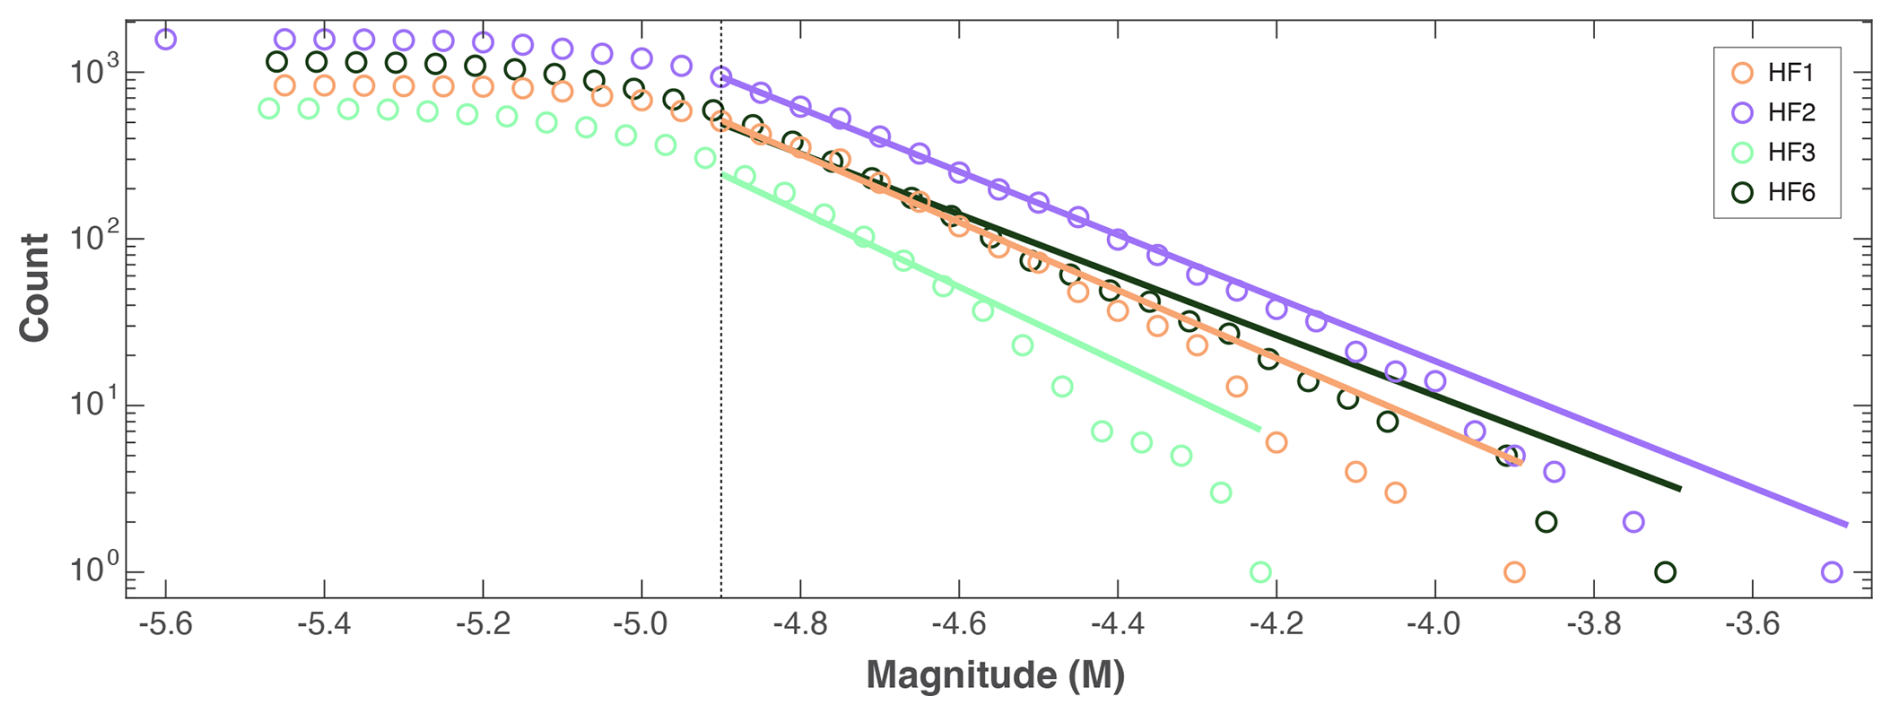
Figure 5Simple magnitude statistics for the Äspö HRL. GR-MFD of cumulative events (circles), alongside best fit to the data (solid lines) and the magnitude-of-completeness (dashed line). Data is colour coordinated according to injection stages (i.e., HF1–HF6).
Next, we use the CAP-tests to detect and assess the potential for MMAX more rigorously. The KS-test is performed 50 times, in which the catalogue magnitudes are dithered (including a dithered truncation magnitude). The KS-test also performs 100 reshuffles within each trial. Average KS-test confidences are > 99.99 %, > 99.99 %, 99.87 %, and 68.85 % for stages HF1-HF3 and HF6, respectively. We perform 50 MLE-tests using dithered catalogues and 100 reshuffles within each trial. Similarly, MLE-tests suggest the standard error in fitted MMAX values is 0.02, < 0.01, 0.02, and 0.18 for stages HF1-HF3 and HF6, respectively. Next, we seek test hypotheses for the functional form of MMAX: our EW-tests focus on McGarr-like (McGarr, 2014; Hallo et al., 2014; Elsworth, et al., 2025), the Galis-like model (Galis et al., 2017), a constant tectonic upper bound (Kanamori and Anderson, 1975), and the unbound null hypothesis. Similarly, EW-tests also show evidence for an MMAX bound process, most strongly evidenced with stage HF2 (Figs. 6 and S1–S3). By the end of HF2 stimulation, the Galis-like model is > 100 times more likely than the unbound model (Fig. 6).
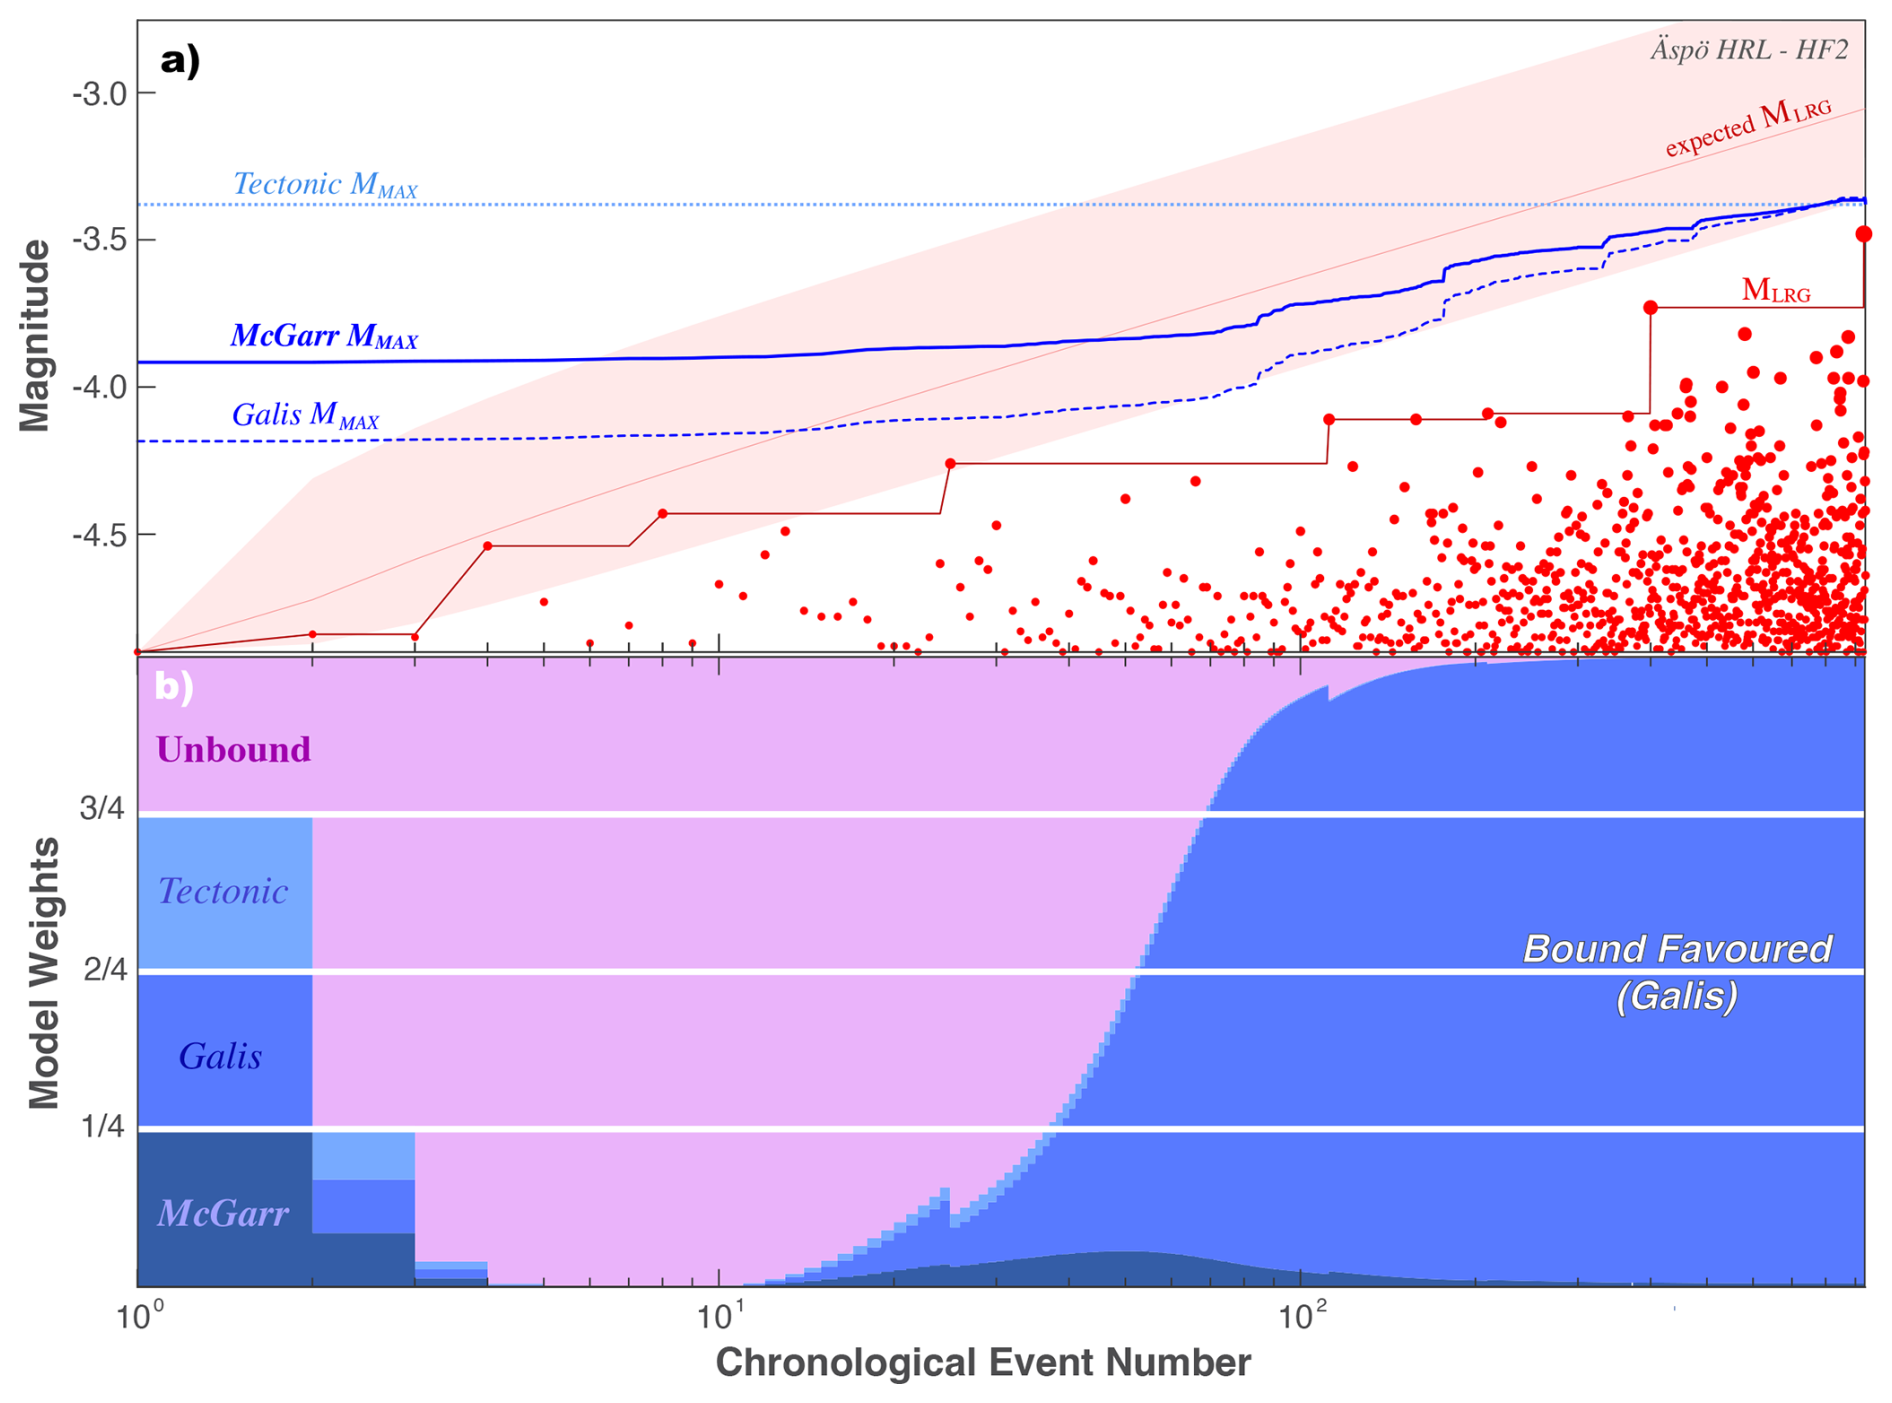
Figure 6Using the EW-test to discern between MMAX models for HF2 at the Äspö HRL. (a) The chronological sequence of earthquake magnitudes (red circles), the observed MLRG (red line), and the expected MLRG at the 10/50/90 percentiles (red area) are compared against MMAX hypotheses (blue lines). (b) The corresponding ensemble weights update as new data is encountered.
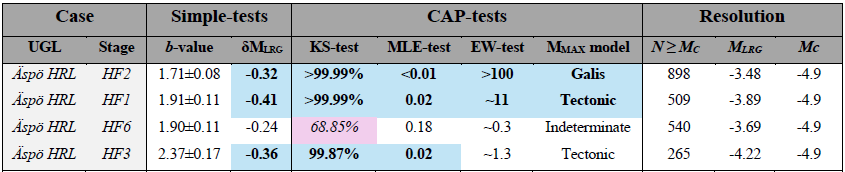
Last, we organize our results for all injection stages at the Äspö HRL – for convenience to the reader. These results are summarized below (Table 1).
Table 1Summary of results at the Äspö HRL. All the prior results of our simple-tests and CAP-tests are compiled here for convenience. Additionally, we have coordinated individual entries according to their interpretation: blue/bold for bound, pink/italic for unbound, and uncoloured/regular for indeterminate.
3.1.3 Interpretations for the Äspö HRL
All the stages at the Äspö HRL appear to have some evidence of a bound process restricting the growth of earthquake magnitudes. The most convincing of the cases is also the most well-resolved one: for HF2, all the simple/CAP-tests unanimously indicate a bound process with strong statistical significance. As the cases become less well-resolved, the statistical confidence also diminishes. For example, the HF1 and HF3 stages have most CAP-tests indicating a bound process, only the EW-test of HF3 narrowly falls short of statistical significance. The HF6 stage produces the most mixed results: simple-tests, MLE-test, and EW-test are indeterminate, while the KS-test is unbound. It is worthwhile to mention that HF6 differed in stimulation approach in two ways: the first sub-stage of HF6 was the largest injected volume (with reduced volume for later sub-stages) and the last three sub-stages were performed on a different day.
Overall, we interpret stage HF2 as certainly being bound. Stages HF1 and HF3 as likely to be bound, but likely needing more well-resolved catalogues to better discern MMAX. We hesitate to make a clear statement for HF6, which appears indeterminate due to data limitations.
The interpretation that all the Äspö HRL stages were (likely) bound corresponds with the geophysical interpretations from relevant studies. The intention of the Äspö HRL was to test various stimulation programs against the complexity/growth of hydraulic fractures (Zang et al., 2019, 2021). Stage intervals were chosen to avoid natural fractures, and impression packers noted the generation of new hydraulic fractures (Zimmerman et al., 2019). Furthermore, the progressive growth of the HF2 hydraulic fracture plane was inferred jointly from the microseismic and deformation constraints (Niemz et al., 2020, 2021). In this sense, a progressively growing fracture aligns well with the bound interpretation: the finite extent of a fracture limits MMAX via geometric considerations (Kanamori and Anderson, 1975). As stimulation continues, the fracture continues to grow; thus, the value of MMAX would increase alongside the injected volume. Correspondingly, each of the Äspö stages indicated bound growth (albeit with varying degrees of confidence).
These interpretations at the Äspö HRL constitute the simplest interpretation. We describe a scenario as to how hydraulic fracturing would be linked to a bound MMAX interpretation. Regardless of the fracture network's complexity, the finite spatial extent of stimulated fractures ultimately restricts magnitude growth.
3.2 The Sanford Underground Research Facility
3.2.1 Overview of the EGS Collab Experiment 1
The SURF is located near Lead, South Dakota, and has repurposed the Homestake gold mine (Fig. 3). The SURF is a research facility operated by the South Dakota Science and Technology Authority to study rare-process physics (Heise, 2015). The EGS Collab takes advantage of the SURF, by using this facility to host hydraulic stimulation experiments at field-scale depths of ∼ 1.5 km (Dobson et a., 2018; Kneafsey et al., 2018; Morris et al., 2018).
The EGS Collab Experiment #1 intended to connect injection and production boreholes via stimulated fractures in a controlled environment (Kneafsey et al., 2020; Morris et al., 2018). Injection and production boreholes were drilled subparallel to the estimated minimum principal stress direction (Oldenburg et al., 2017) in the phyllites of the Precambrian-aged Poorman Formation (Kneafsey et al., 2020). These metamorphic rocks are strongly foliated and highly anisotropic (Frash et al., 2019; Vigilante et al., 2017). The rock mass is generally thought to be low permeability ( m2), with a thermally altered stress field (Singh et al., 2019). Some natural fractures were noted in borehole cores (Fu et al., 2021), with at least one noteworthy fracture that is naturally/actively flowing (Wu et al., 2021a). Starting in May 2018, stimulation stages took place at three wellbore intervals (N164, N142, N128), covering both hydraulic stimulation and hydraulic characterization programs; stimulation programs injected on the order of 10 s L of water per interval (Morris et al., 2018; White et al., 2019). Resulting microseismicity was recorded for each interval, with ∼ 2000 located events (Schoenball et al., 2019, 2020; Chai et al., 2020; Qin et al., 2024). Studies have covered topics including modeling heat transport (Wu et al., 2021b), strain/deformation (Guglielmi et al., 2021), and hydraulic fracture propagation (Li and Zhang, 2023). Data for the EGS Collab Experiment #1 is publicly available (https://gdr.openei.org/, last access: July 2025) and a spatiotemporal summary of stimulation events is plotted (Fig. 7).
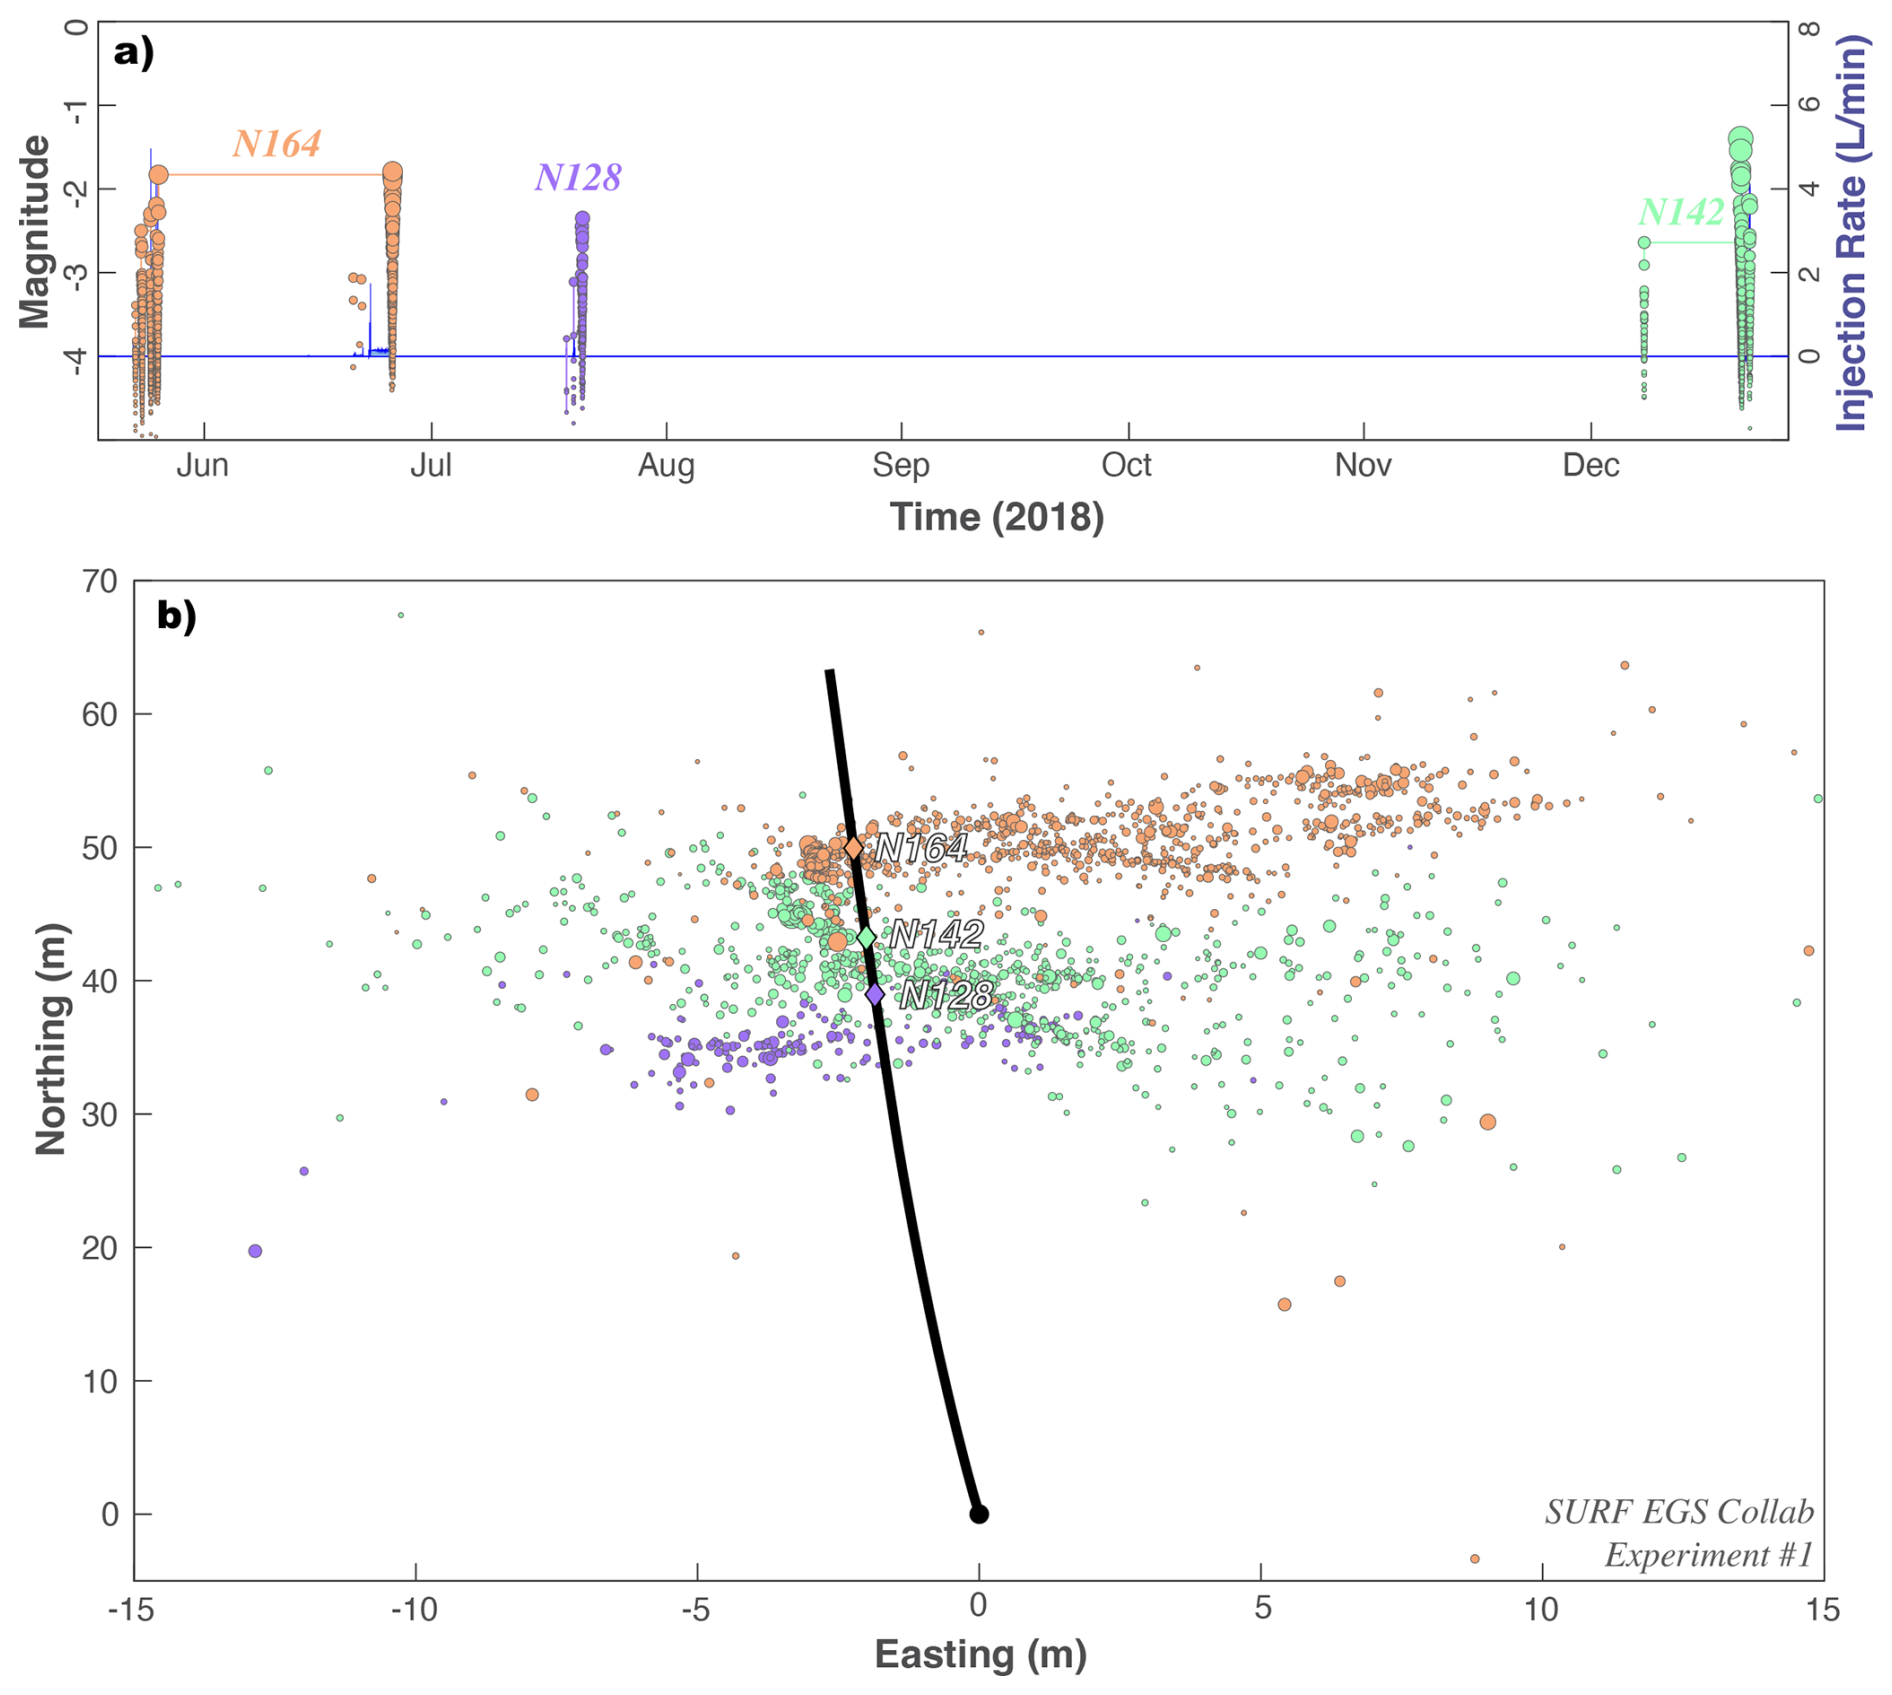
Figure 7Hydraulic stimulation and earthquake response for SURF Experiment #1. (a) Timings and injection rates of three stages (blue line) are compared against induced earthquake magnitudes (circles). (b) Locations of three stages (diamonds; N164, N142, N128), along the well bore (black line), and the resultant earthquakes (circles). Injection stages and corresponding earthquakes are colour coordinated in all panels.
3.2.2 CAP-tests results from the EGS Collab Experiment 1
To begin assessing if some process might be restricting magnitude growth at SURF Experiment #1, we fit the GR-MFD to the catalogue data from each injection stage (i.e., N164, N142, N128). To account for magnitude errors, we employ a 50-trial bootstrap process in which the catalogue magnitudes are dithered by ± 0.1 (this includes a dithered Mc). Only one of the stages (N164) appear to be appreciably deficient in large magnitude events (Fig. 8). Correspondingly, the δMLRG discrepancy is significant for N164 (−1.15M), but fairly small for N142 (−0.05M) and N128 (−0.28M). Assuming an unbound catalogue, the δMLRG discrepancy for N164 would be a < 1st percentile event; stages N142 (10th percentile) and N128 (33rd percentile) are more commonly expected occurrences. These initial assessments are suggestive of some MMAX upper bound restricting catalogue growth for one stage at SURF Experiment #1.
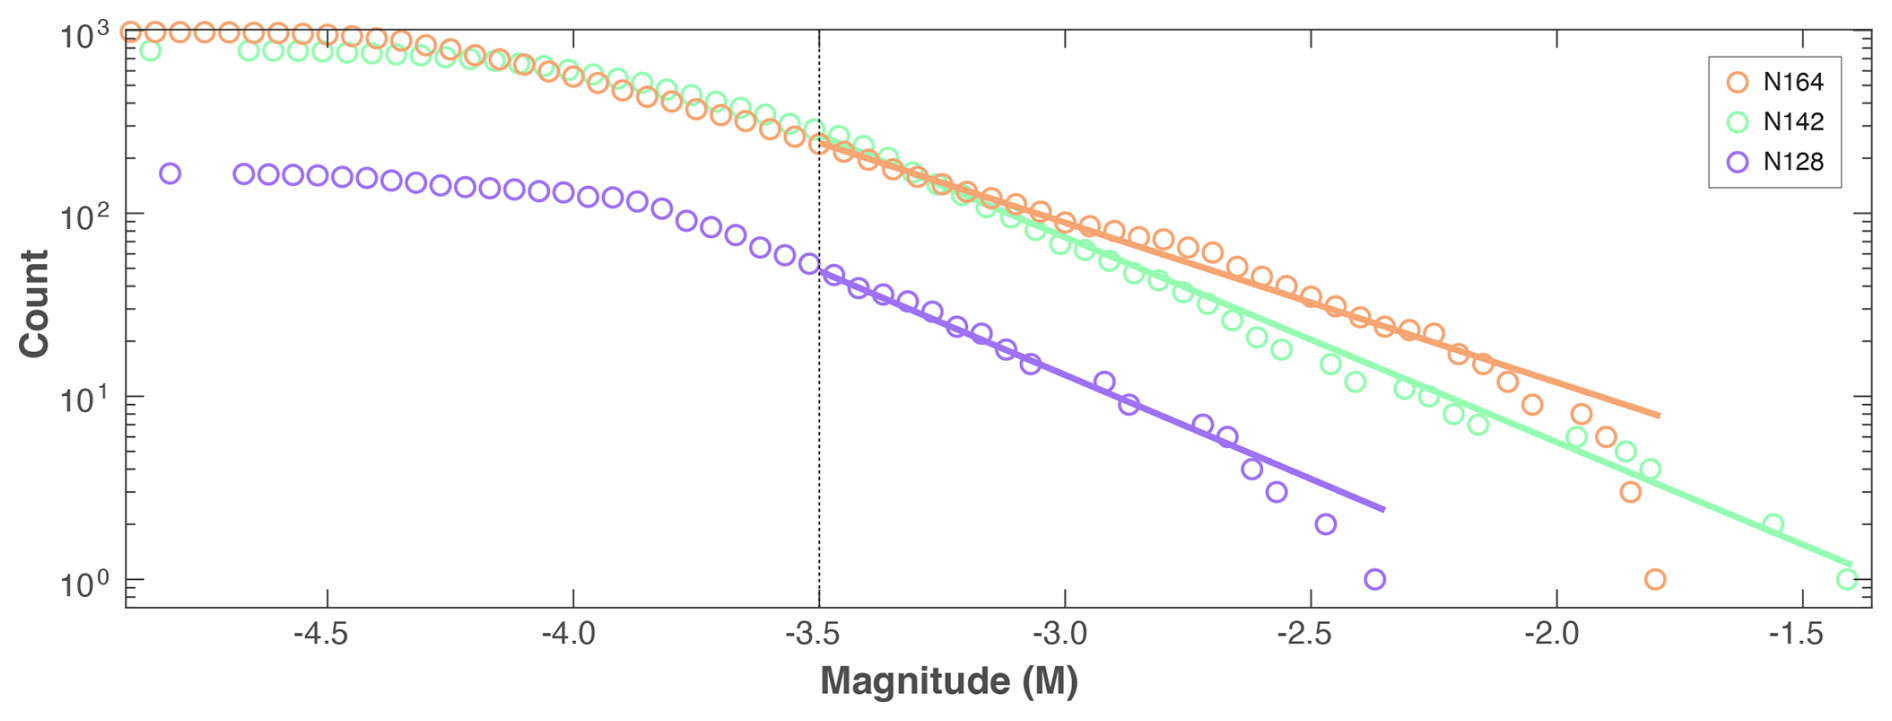
Figure 8Simple magnitude statistics for SURF Experiment #1. GR-MFD of cumulative events (circles), alongside best fit to the data (solid lines) and the magnitude-of-completeness (dashed line). Data is colour coordinated according to injection stage (i.e., N164, N142, N128).
Next, we use the CAP-tests to detect and assess the potential for MMAX more rigorously. The KS-test is performed 50 times, in which the catalogue magnitudes are dithered (including a dithered truncation magnitude). The KS-test also performs 100 reshuffles within each trial. Again, KS-test results are split, with average confidences of 99.96 % for stage N164, but 34.23 % and 74.39 % for stages N142 and N128, respectively. We perform 50 MLE-tests using dithered catalogues and 100 reshuffles within each trial. MLE-tests are also split: standard error in fitted MMAX values are 0.10, 2.18, and 1.31 for stages N164, N142, and N128, respectively. Similarly, EW-tests also shows suggestive evidence for an MMAX bound process with N164 (Fig. 9), but certainly not for stages N142 and N128 (Figs. S4–S5 in the Supplement).
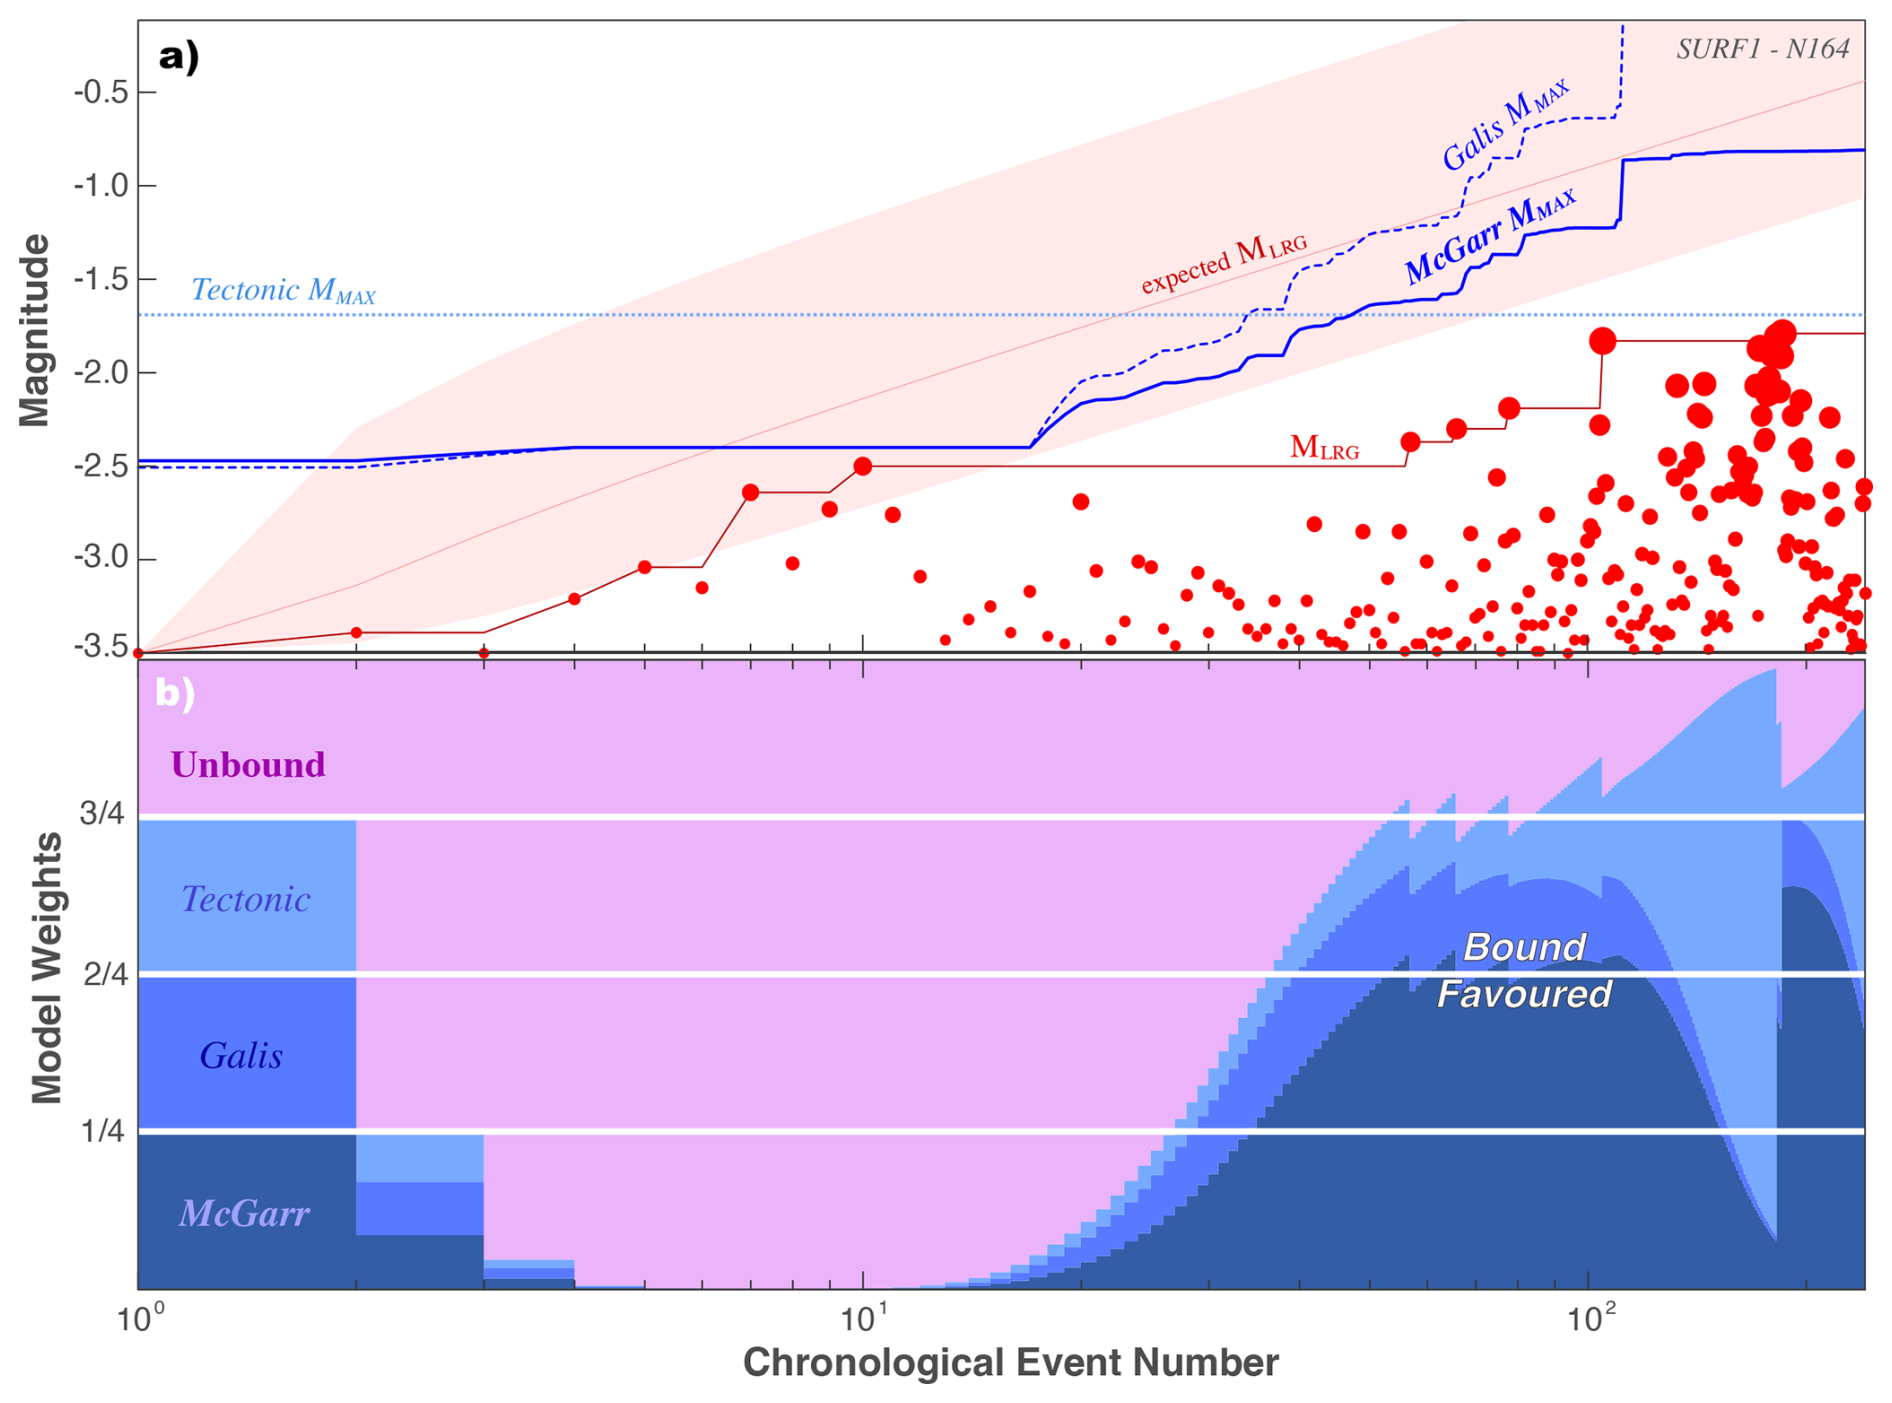
Figure 9Using the EW-test to discern between MMAX models for N164 for SURF Experiment #1. (a) The chronological sequence of earthquake magnitudes (red circles), the observed MLRG (red line), and the expected MLRG at the 10/50/90 percentiles (red area) are compared against MMAX hypotheses (blue lines). (b) The corresponding ensemble weights update as new data is encountered.
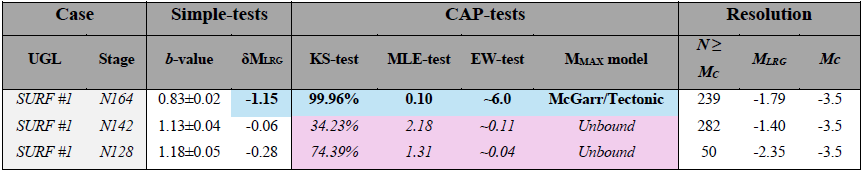
Last, we organize our results for all injection stages at SURF Experiment #1 – for convenience to the reader. These results are summarized below (Table 2).
Table 2Summary of results for the SURF EGS Collab Experiment #1. All the prior results of our simple-tests and CAP-tests are compiled here for convenience. Additionally, we have coordinated individual entries according to their interpretation: blue/bold for bound, pink/italic for unbound, and uncoloured/regular for indeterminate.
3.2.3 Interpretations for the EGS Collab Experiment 1
CAP-test results at SURF Experiment #1 have similarities and differences from those at the Äspö HRL. For example, stage N164 is similar to the stages at the Äspö HRL: both simple-tests and CAP-tests unanimously agree on an MMAX bound – with varying degrees of confidence. On the other hand, stages N142 and N128 differ in that they produce strong and unambiguous unbound inferences. Because of this, we interpret stages N142 and N128 to be truly unbound.
The interest in considering UGL cases is the wealth of complementary geophysical information to cross-examine against the results of CAP-tests. The stimulation at stage N164 is predominantly understood to be the creation of a new fracture network. This interpretation comes from multiple lines of evidence: the orientation of microseismic fault planes with respect to the ambient stress field (Schoenball et al., 2020), deformation constraints on fracture motion (Guglielmi et al., 2021), significant recovery of injected fluid (White et al., 2019), and direct evidence of new fluid jets intersecting the producing well (Fu et al., 2021). The later N164 injections (i.e., June 2018) were performed from the producing well side, into the newly created fracture network. That said, some complexity in the N164 stimulation suggested limited interaction with natural fractures, via either arrests or redirected continuation of fracture growth (Schoenball et al., 2020; Fu et al., 2021). Overall, these inferences are consistent with finite hydraulic fractures bounding the growth of earthquake magnitudes – which are the same interpretations made for the Äspö HRL.
On the other hand, stages N142 and N128 had significant interactions with natural pre-existing fractures, and likely reactivated them in shear rather than creating a new fracture network. These inferences/interpretations come from the orientation of microseismic fault planes with respect to the ambient stress field, corroboration with well image logs, and observations of shear deformation (Schoenball et al., 2020). The connection to fractures/faults allows for seemingly unbound magnitude growth, as the spatial extent of these pre-existing structures have the potential to host larger events.
These interpretations at SURF Experiment #1 constitute the next level of complexity in interpretation. We describe a scenario where hydraulic stimulation could interact with natural fractures/faults to produce an unbound process. Said another way, the interaction with natural fractures/faults (of sufficient size) can facilitate unbound magnitude growth.
3.3 The Grimsel Test Site
3.3.1 Overview of the GTS
The GTS is located near the Grimsel pass in the central Swiss Alps (Fig. 3), ∼ 450 m below the Juchlistock in the Varsican-aged Aar Massif granites (Schneeberger et al., 2019). The GTS was established in 1984 as an underground research facility to study the safe disposal of nuclear waste. It is owned and operated by the National Cooperation for Radioactive Waste Disposal (Nagra; https://www.grimsel.com/, last access: March 2025).
The intention of recent (February–May 2017) injection experiments at the GTS was to demonstrate the stimulation of fractures at the decameter scale and to better understand how to manage induced seismicity (Gischig et al., 2016; Amann et al., 2018). Twelve injection stages spanning ∼ 1 m intervals were situated in two boreholes (∼ 45 m long) (Gischig et al., 2020): six related to stimulation via hydraulic fracturing (HF1-HF8) (Dutler et al., 2019) and six more via hydroshearing (HS1-HS8) (Krietsch et al., 2020b). Each stage used (on the order of) ∼ 1000 L of injected fluid, spread between 4 injection sub-cycles. The role of natural faults and fractures are a prominent focus of the GTS injection experiments, which injected into either brittle-ductile shear zones, ductile shear zones, or intact rock (Doetsch et al., 2018a). The degree of seismic response for individual stages was strongly heterogeneous in space, with stages HS4, HS5, and HF2 being both the most seismically active and hosting the large events (M−3.0, M−2.8, and M−3.9) (Villiger et al., 2020). Studies at the GTS were diverse, covering topics like geological characterization (Krietsch et al., 2018), stress inversion (Krietsch et al., 2019), tomographic velocity changes (Doetsch et al., 2018b; Schopper et al., 2020), permeability changes (Jalali et al., 2018; Brixel et al., 2020a, b), and inferring fracture propagation from hydromechanical response (Dutler et al., 2019; Krietsch et al., 2020a, b). Data for the GTS is publicly available (https://doi.org/10.3929/ethz-b-000276170, Doetsch et al., 2018c) and a spatiotemporal summary is plotted (Fig. 10).
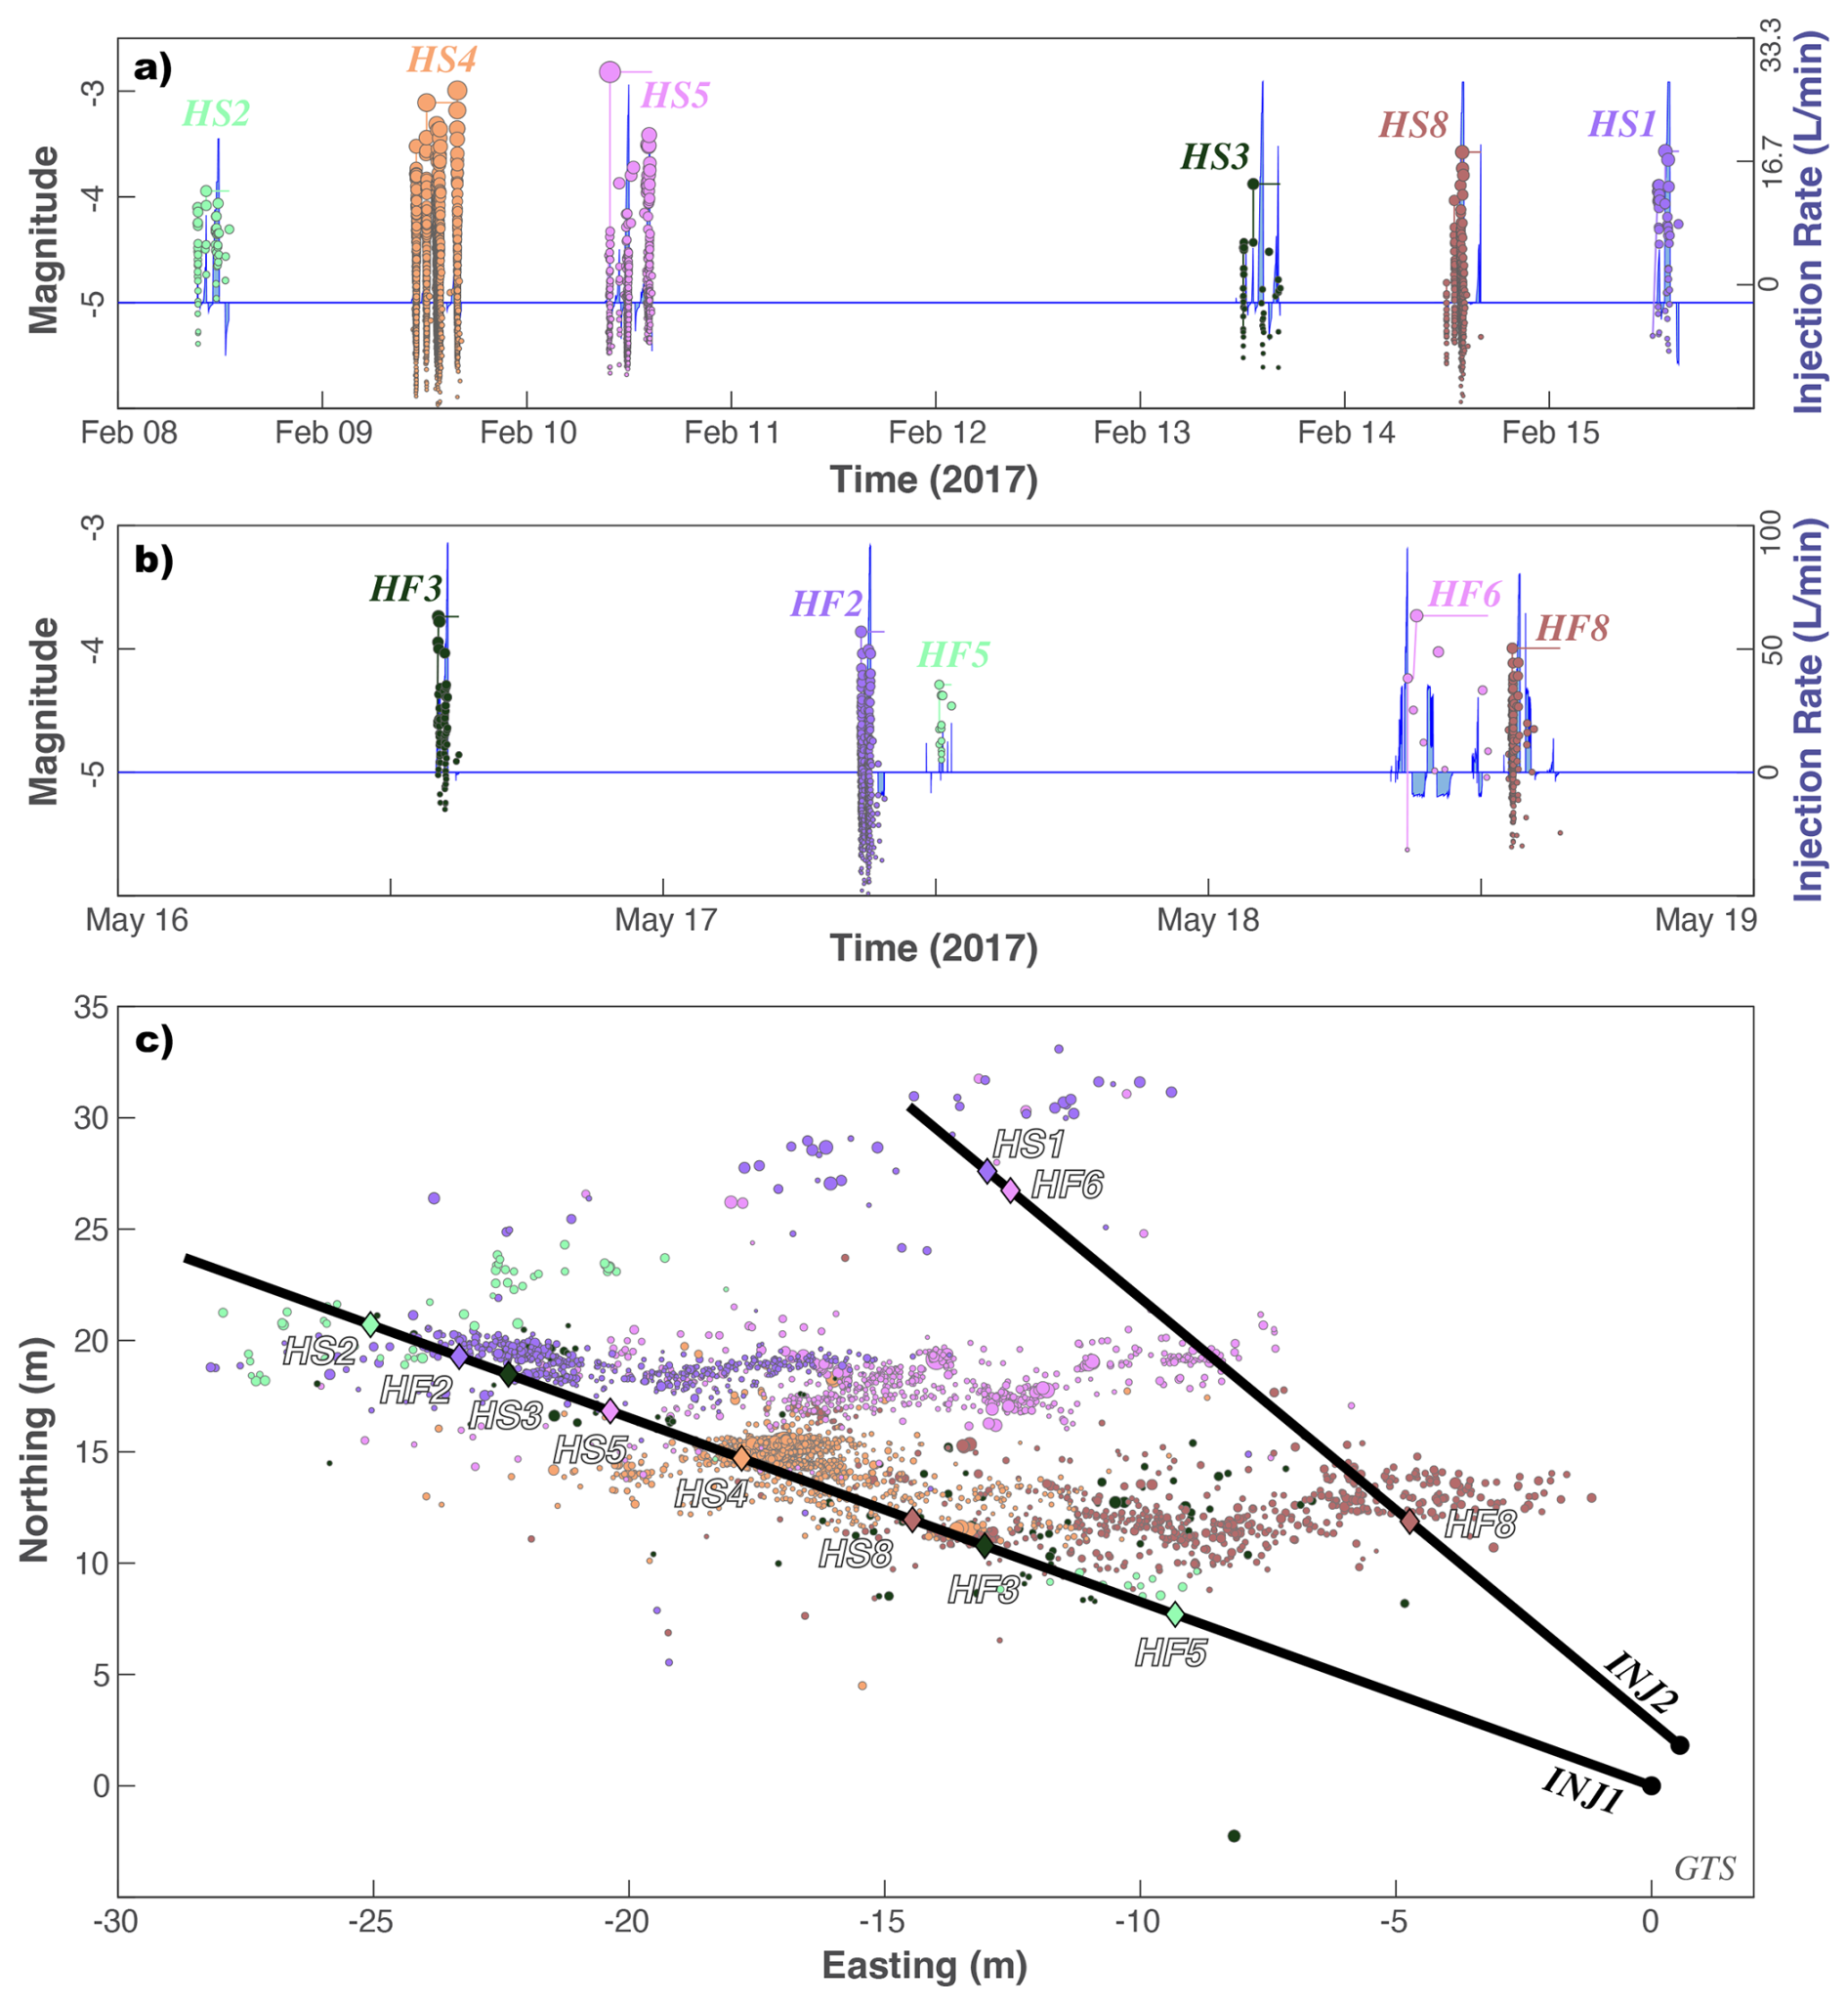
Figure 10Hydraulic stimulation and earthquake response at the GTS. (a, b) Timings and injection rates of twelve stages (blue line) are compared against induced earthquake magnitudes (circles). (c) Locations of twelve stages (diamonds; HFX and HSX), along the well bore (black line), and the resultant earthquakes (circles). Injection stages and corresponding earthquakes are colour coordinated in all panels.
3.3.2 CAP-tests results at the GTS
To begin assessing if some process might be restricting magnitude growth at the GTS, we fit the GR-MFD to the catalogue data from each injection stage (i.e., HSX & HFX). To account for magnitude errors, we employ a 50-trial bootstrap process in which the catalogue magnitudes are dithered by ±0.1 (this includes a dithered Mc). Note that many of the stages recorded here have too few events for a meaningful analysis; thus, we predominantly focus our discussions to a subset of stages. Only two of the stages (HS4 and HF2) appear to be appreciably deficient in large magnitude events (Fig. 11). Correspondingly, the δMLRG discrepancy is large for HS4 and HF2 (−1.31M and −0.61M), but fairly small for the other viable stages (between −0.19M and +0.08M). Assuming an unbound catalogue, the δMLRG discrepancy for HS4 and HF2 would both be < 1st percentile events; all other stages are commonly expected occurrences. These initial assessments are suggestive of some MMAX upper bound restricting catalogue growth for just two stages at the GTS.
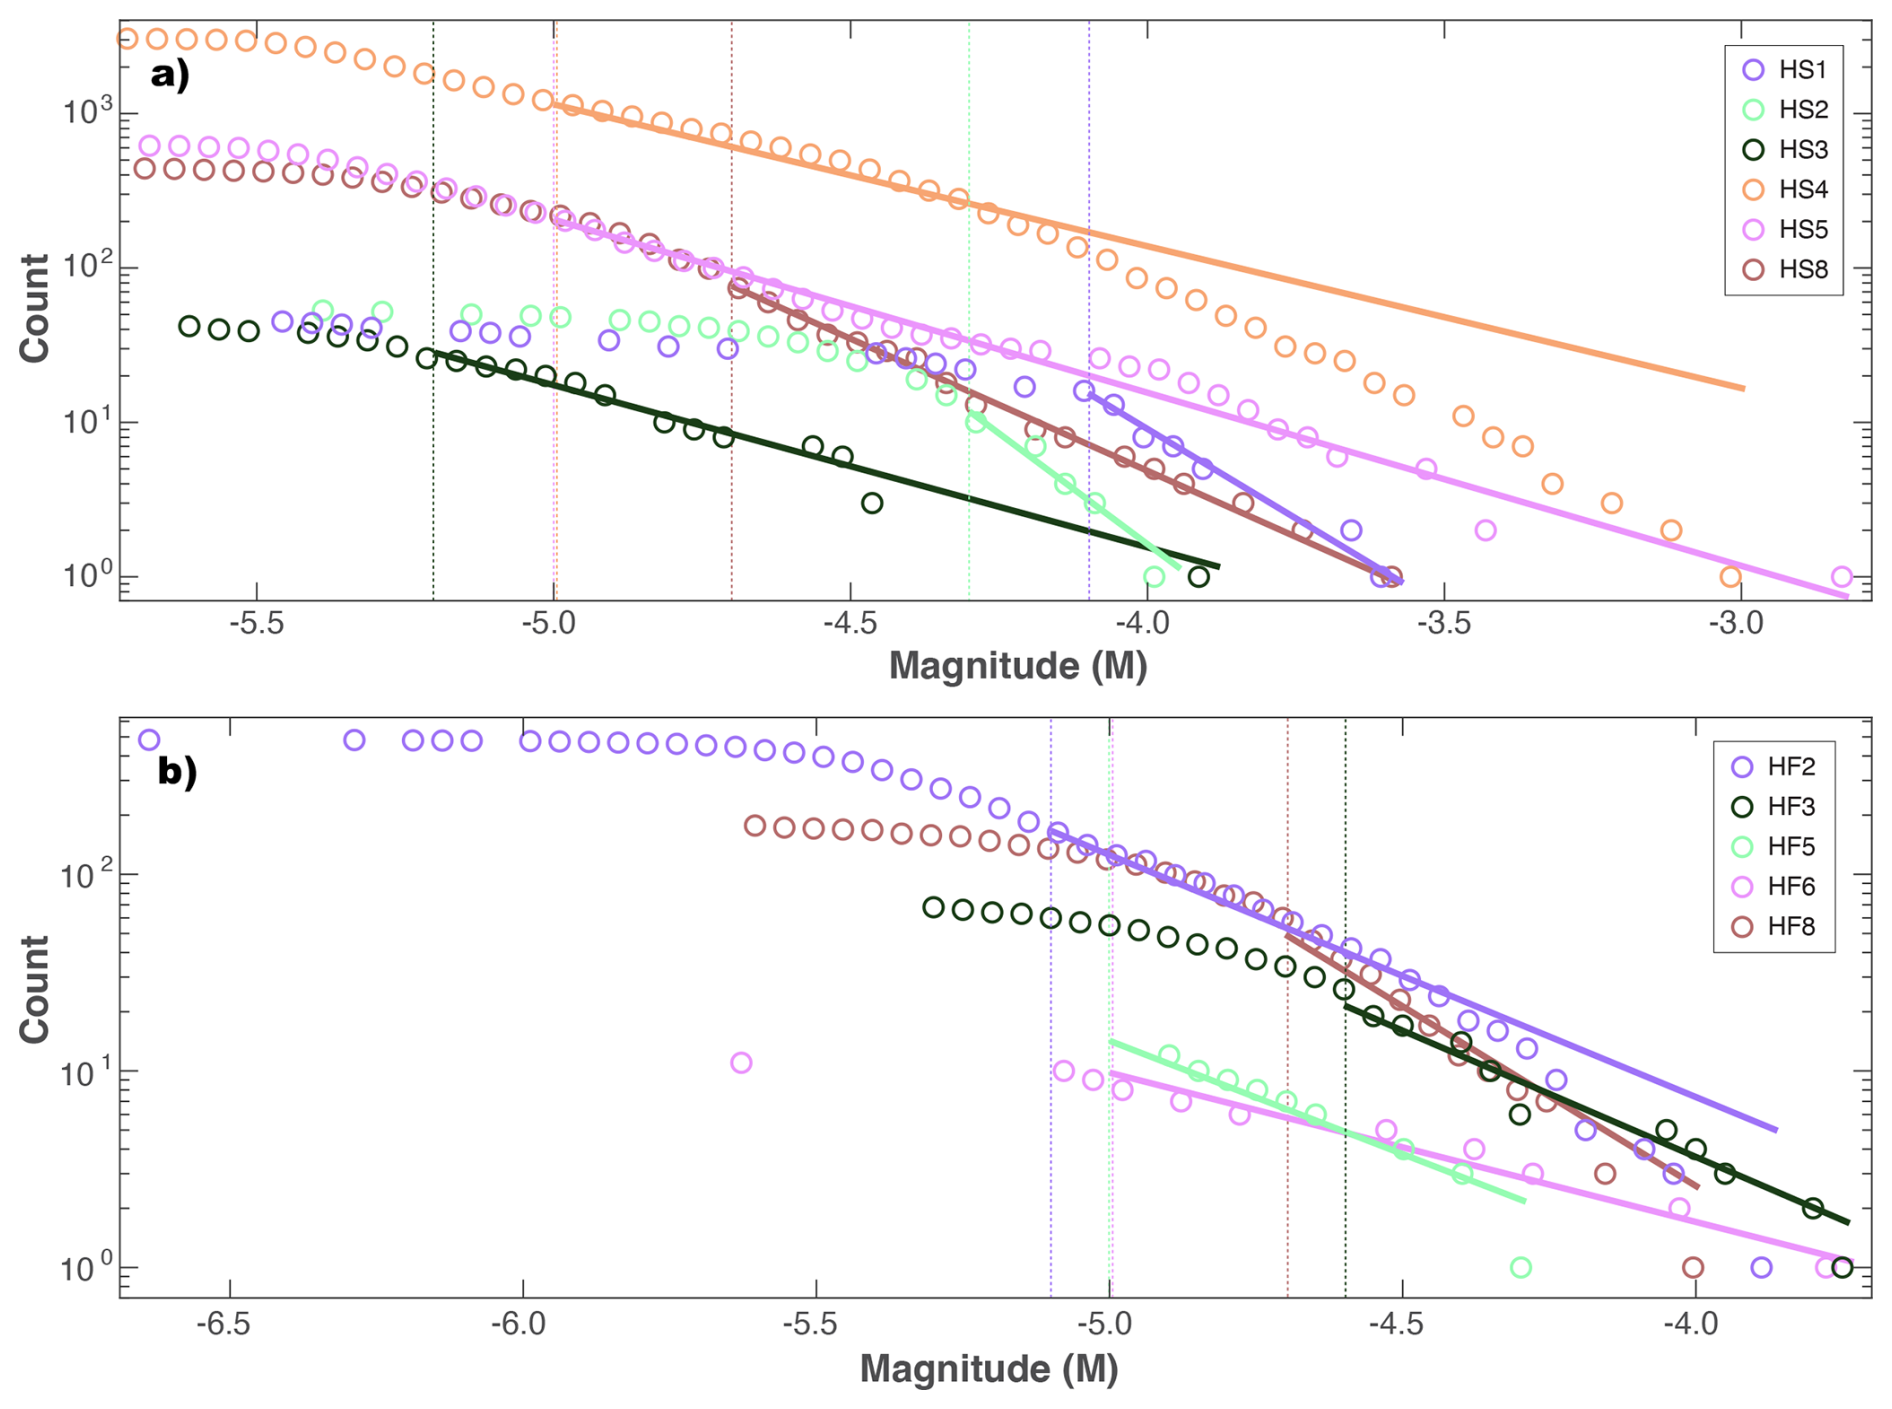
Figure 11Simple magnitude statistics at the GTS. GR-MFD of cumulative events (circles), alongside best fit to the data (solid lines) and the magnitude-of-completeness (dashed lines). Data is colour coordinated according to injection stage (i.e., HSX and HFX) and separated into hydroshearing (a; HSX) or hydrofracturing experiments (b; HFX).
Next, we use the CAP-tests to detect and assess the potential for MMAX more rigorously. The KS-test is performed 50 times, in which the catalogue magnitudes are dithered (including a dithered truncation magnitude). The KS-test also performs 100 reshuffles within each trial. KS-test results are split, with strong confidences of > 99.99 % for stages HS4 and HF2, but unconvincing values for all other stages. We perform 50 MLE-tests using dithered catalogues and 100 reshuffles within each trial. MLE-tests are also split: standard error in fitted MMAX values are < 0.01 and 0.02 for stages HS4 and HF2, but values are large (0.34–1.92) for all other stages. The EW-tests shows decisive evidence for an MMAX bound process with HS4 (Fig. 12), and strong evidence for HF2 (Fig. S6). All other stages have substantial-to-strong evidence for an unbound process via EW-tests (Figs. S7–S10).
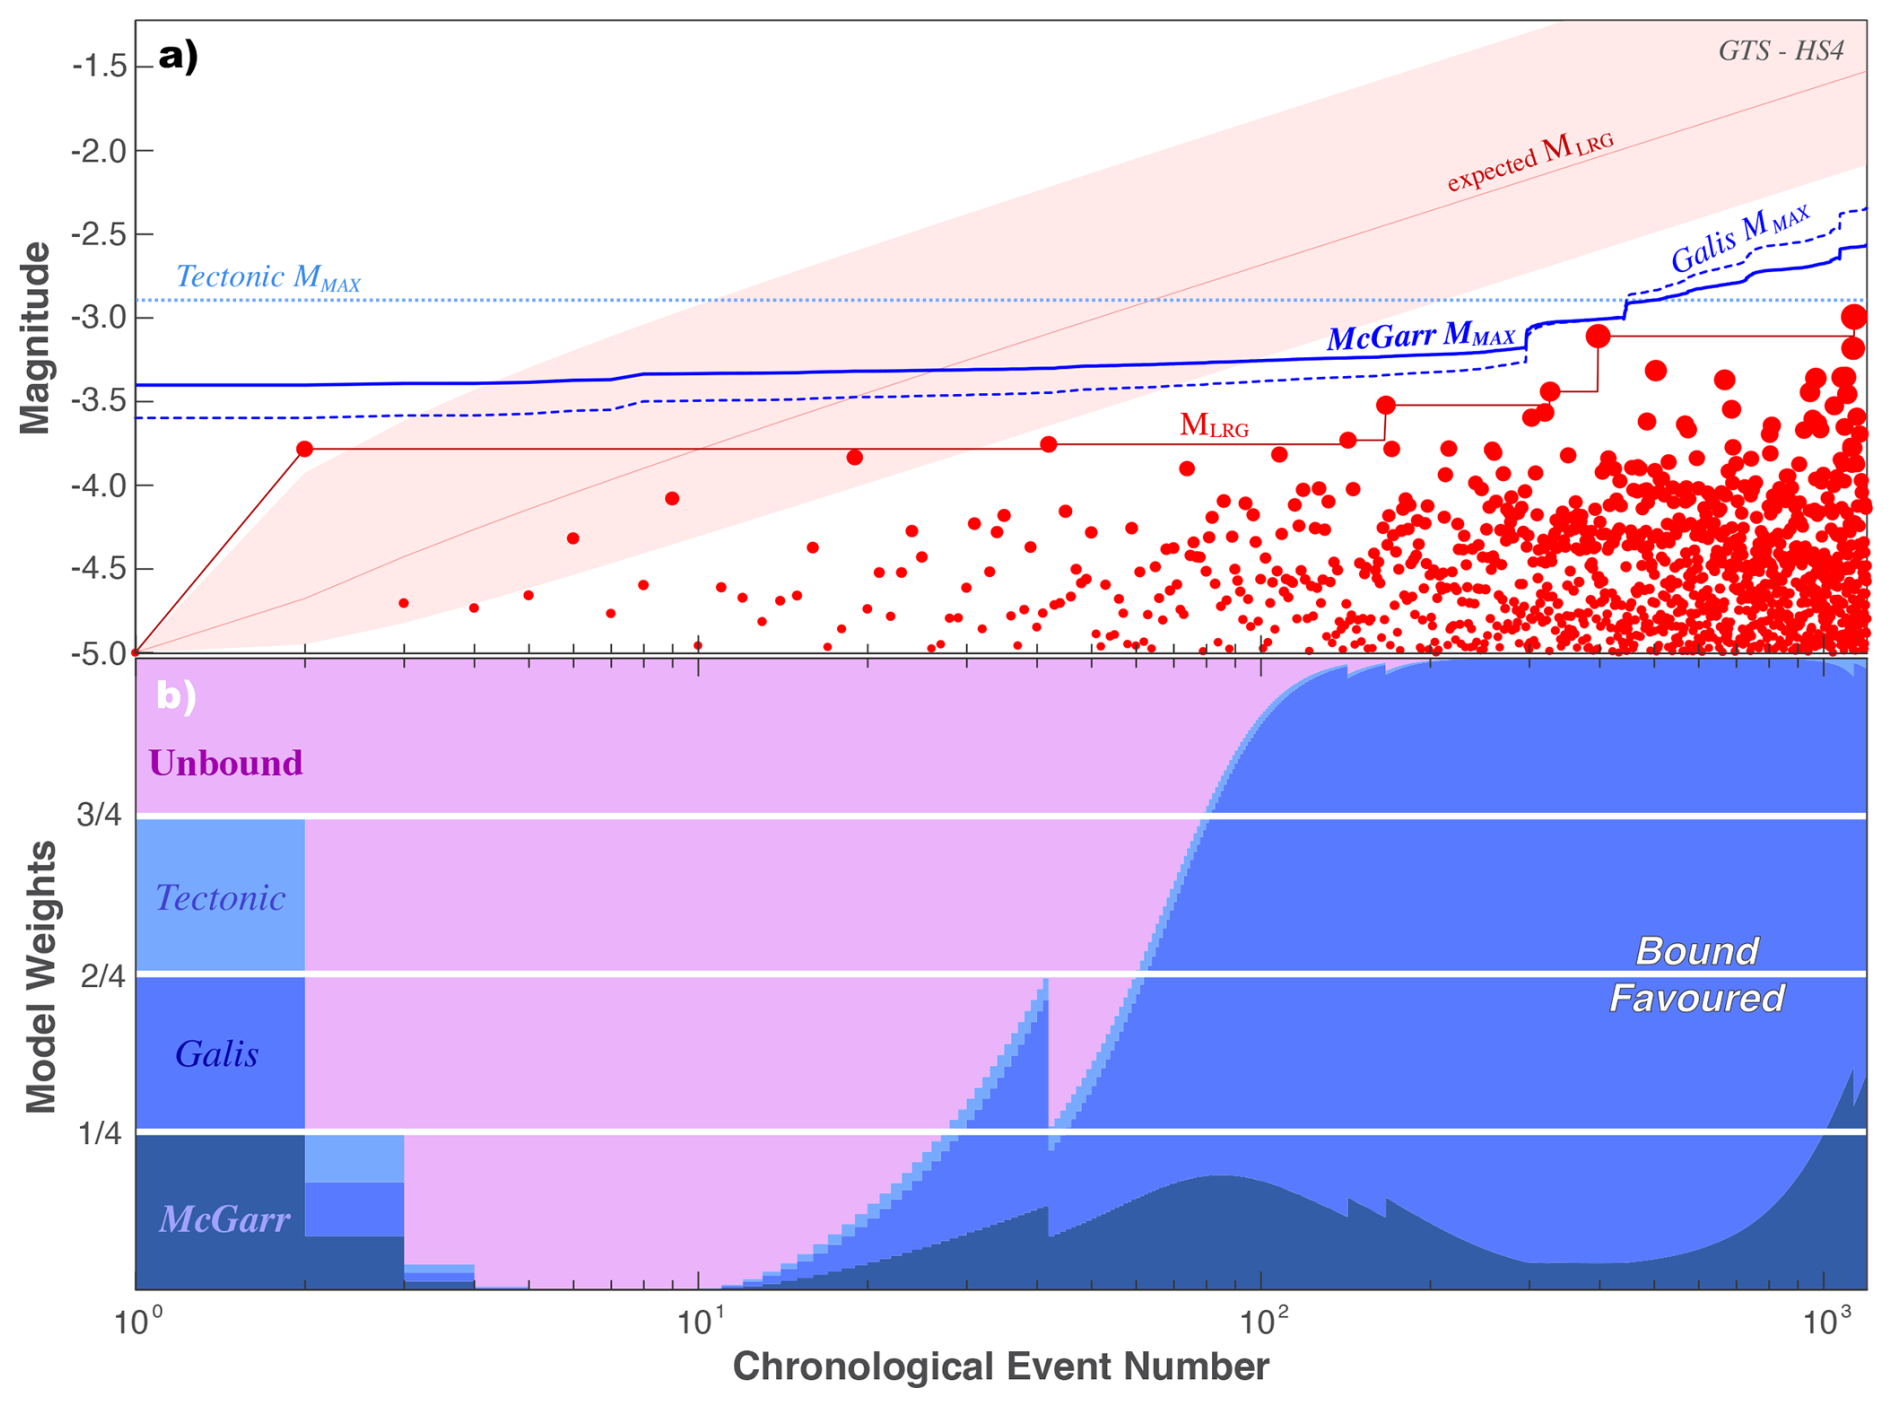
Figure 12Using the EW-test to discern between MMAX models for HS4 at the GTS. (a) The chronological sequence of earthquake magnitudes (red circles), the observed MLRG (red line), and the expected MLRG at the 10/50/90 percentiles (red area) are compared against MMAX hypotheses (blue lines). (b) The corresponding ensemble weights update as new data is encountered.
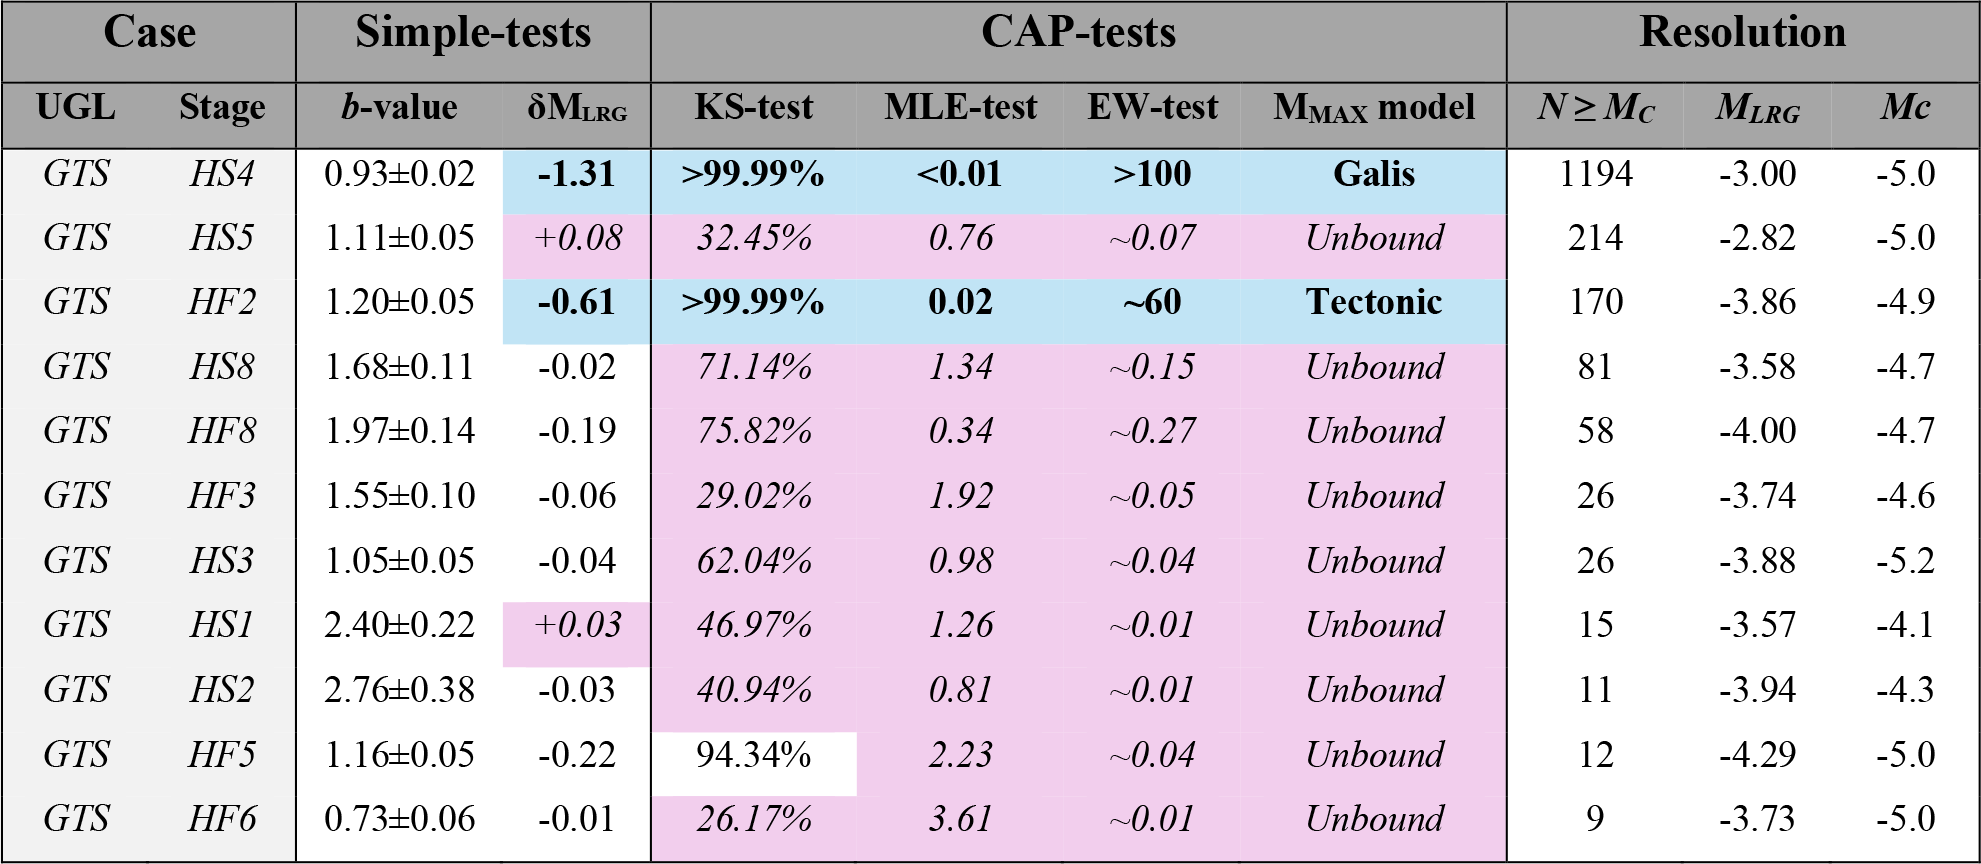
Last, we organize our results for all injection stages at the GTS – for convenience to the reader. These results are summarized below (Table 3).
Table 3Summary of results at the GTS. All the prior results of our simple-tests and CAP-tests are compiled here for convenience. Additionally, we have coordinated individual entries according to their interpretation: blue/bold for bound, pink/italic for unbound, and uncoloured/regular for indeterminate.
3.3.3 Interpretations for the GTS
In summary, most of the GTS stages appear to exhibit unbound growth of earthquake magnitudes. Although, this interpretation varies in confidence, depending on the specific stage in question, since many of the stages had relatively few events recorded. The most confidently unbound case is HS5, which fails all of the simple-tests and CAP-tests. On the other hand, there are two exceptions to this general trend: HS4 shows clear and definitive evidence for a bound process, while HF2 shows strong evidence for a bound process. That said, stages with fewer than 50 events are difficult to arrive at a clear interpretation between truly unbound or simply lacking data.
The aims and scope of the GTS were to investigate the response of injection into faults/fractures at the intermediate scale (Gischig et al., 2016; Amann et al., 2018). For example, all HSX stages intentionally injected into previously known fractures of shear damage zones (Krietsch et al., 2018); thus, micro-seismically delineated fault planes were generally consistent with fracture/fault orientations (Villiger et al., 2020), near-field hydromechanical effects were consistent with pre-existing fracture dislocation (Krietsch et al., 2020b), and many stages were hydraulically connected to other boreholes via these stimulated fractures (Brixel et al., 2020b). In particular to HS5, seismicity was well fit to a single fault plane (∼ 16 m diameter) oriented subparallel to the targeted fracture (Villiger et al., 2020), significant pressure increases (∼ 70 %–75 % of injection pressure) were observed in boreholes 7–8 m away (Krietsch et al., 2020a), likely due to transient permeability increases driven by fracture aperture changes (Krietsch et al., 2020b). Furthermore, the diameter of the HS5 fault plane (∼ 16 m) is appreciably larger than the largest event diameter (∼ 0.65 m), assuming a circular crack. HFX stages started hydraulically fracturing intact rock and subsequently propagated/stimulated new fractures (Dutler et al., 2019). However, the newly propagating fractures were inferred to have significant interactions with pre-existing fractures, which served as pressure sinks that arrested further growth (Dutler et al., 2019; Villiger et al., 2020). Note that HF6 is unique, since it injected directly into a pre-existing fracture (by mistake) and thus can be considered a hydroshearing experiment. Furthermore, the propagation of microseismic events along pipe-like geometries was thought to be formed via the intersection with natural fractures (Dutler et al., 2019). Given the prior interpretations of CAP-test results at SURF Experiment #1, we would anticipate that all GTS stimulations should be unbound – because of their prominent connection to pre-existing fractures. Bound cases would require special exceptions to this generalization.
On the other hand, the HS4 stage is a clear exception to this generalization. The HS4 seismicity is not well-fit by a single plane. Instead, it is best fit by four intersecting planes (C1–C4), where C1–C3 are oriented subparallel with pre-existing fractures and C4 is likely a new tensile failure (Villiger et al., 2020, 2021). Clustering in focal mechanism slip style also corresponds to spatial clusters (Villiger et al., 2021). Each cluster has seismicity spatially restricted along discrete linear streaks (Villiger et al., 2021); these streaks grow/propagate alongside injection, although their spatial extent (∼ 1–2 m) is much smaller than other HSX fault planes. In tectonic contexts, streaks are often interpretated as rheological boundaries between seismic and creeping/locked fault segments (Rubin et al., 1999; Waldhauser et al., 2004). In other hydraulic fracturing contexts, streaks have also been observed and analogously interpreted (Rutledge et al., 2004; Evans et al., 2005). Thus, the streaks and clustering at HS4 have been interpreted as fractures channelizing fluid-flow towards highly seismogenic asperities that slip perpendicular to the fluid migration direction (Villiger et al., 2021). In this sense, we argue that HS4 seismicity is spatially bound to these asperities/streaks, giving rise to the bound growth of magnitudes. Correspondingly, the GR-MFD for HS4 (Fig. 11a) starts to roll-off around M−4.3 and M−3.0 was the final MLRG value; note that M−3.0 roughly corresponds to a circular crack diameter of ∼ 0.5–1.0 m, which is comparable to the spatial extent of the streaks (∼ 1–2 m).
Similarly, HF2 is also an exception to this generalization. The HF2 seismicity was best fit by two intersecting planes, the first which resembles a newly created hydraulic fracture and then a deflection to a more E–W orientation (Dutler et al., 2019; Villiger et al., 2020). It has been suggested that this stage is exceptional in that it potentially has limited interaction with pre-existing structures, being able to propagate fracture growth before leak-off into potential fracture connections (Dutler et al., 2019; Villiger et al., 2020). In fact, the growing hydraulic fracture intersected monitoring boreholes, reaching further than suggested by the microseismic events (Dutler et al., 2019). In this sense, we would argue that HF2 is most similar to the N164 stage at SURF Experiment #1. Correspondingly, both HF2 and N164 express a bound process via CAP-tests.
These interpretations at the GTS constitute the greatest level of interpretive complexity we will consider in this study. We have reiterated scenarios where hydraulic stimulation could interact with natural fractures/faults to produce an unbound process. Regardless of the stimulation program, the interaction with natural fractures/faults (of sufficient size) can facilitate unbound magnitude growth. Exceptions come in the form of hydraulic fracturing with limited interactions to natural fractures (HF2) and shear reactivation with seismicity limited to streaks/asperities (HS4).
4.1 Consolidating MMAX interpretations
In this sub-section, we synthesize the results and interpretations of this study in comparison with relevant literature. We begin to jointly interpret the physical rationale behind bound/unbound earthquake sequences. We start by reiterating the interpretations of CAP-tests results at the UGLs and then discuss the correspondence with CAP-tests at the field-scale.
In the simplest case of the Äspö HRL (Sect. 3.1), stages were stimulated among intact rock, creating new hydraulic pathways via stimulated fractures. The finite geometric extent of these stimulated fractures limits the size of the largest events that can occur, at any given instant (Fig. 13). Although, the spatial extent of this fracture-bound MMAX will change with time/injection. Correspondingly, all Äspö HRL cases indicated a bound MMAX process via CAP-tests. While newly stimulated fractures were the intention of the Äspö HRL, bound cases were also observed for analogous stages at SURF Experiment #1 (N164; Sect. 3.2) and the GTS (HF2; Sect. 3.3), despite their different experiment objectives.
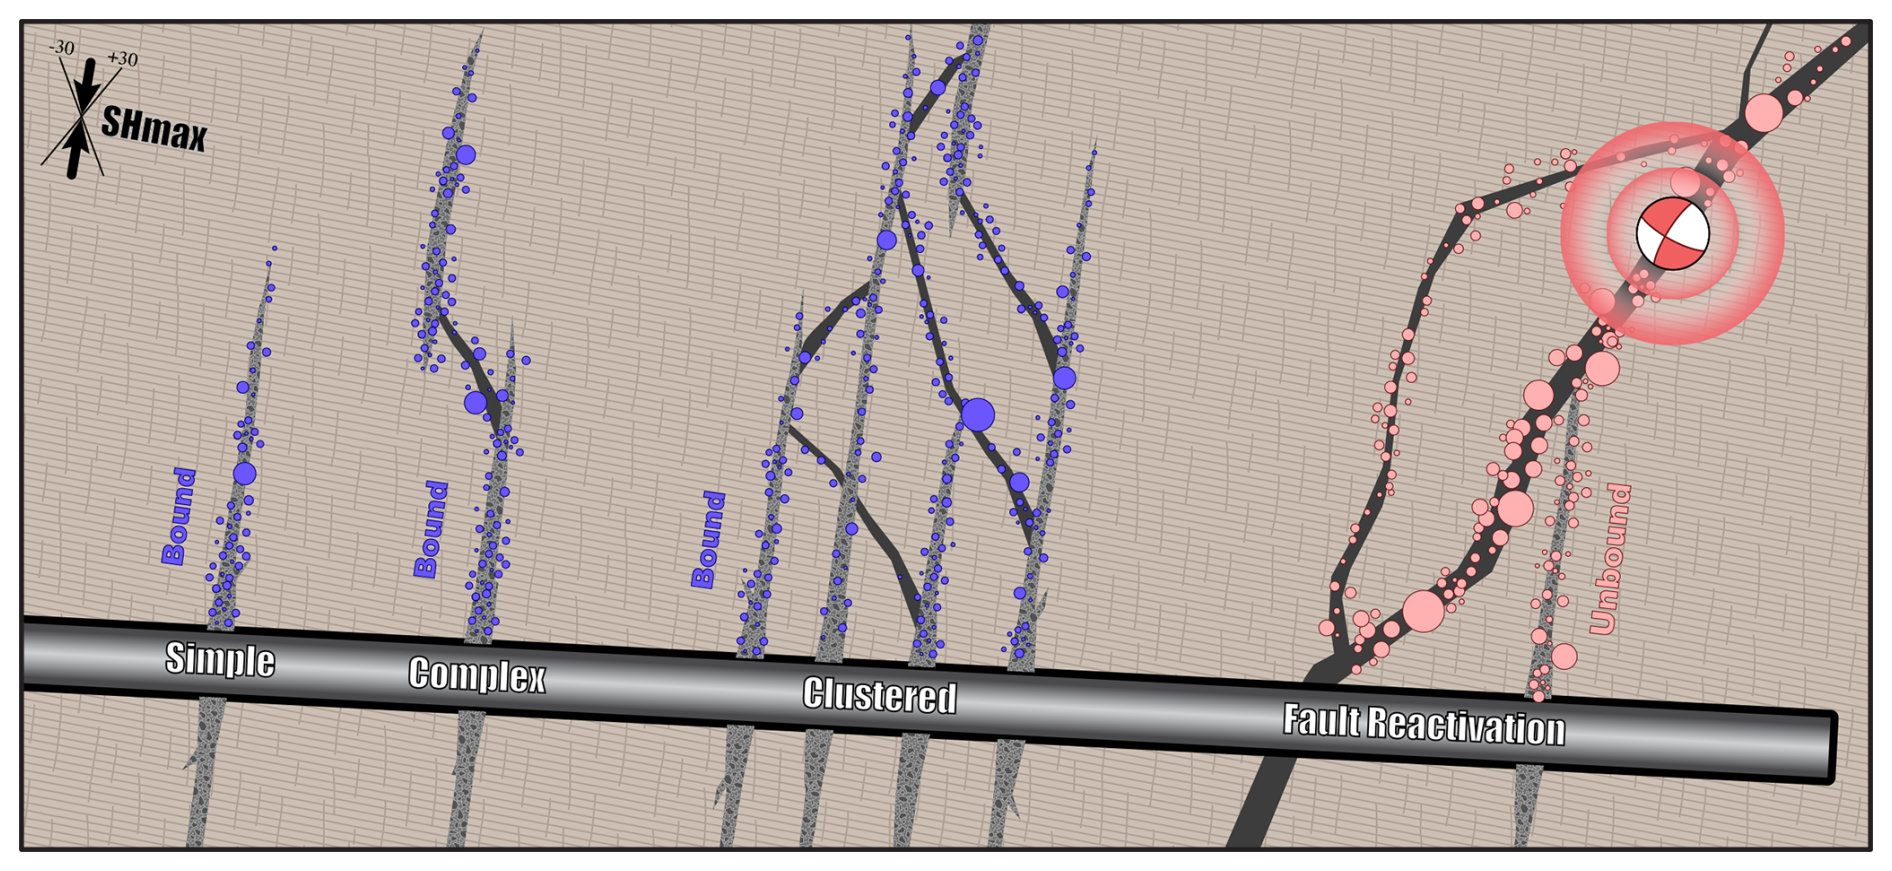
Figure 13Interactions between stimulated fractures and reactivated faults during hydraulic fracturing. A series of stages of increasing complexity (text labels) are considered alongside a hypothetical well (black and grey rectangle). In the simple case, the host rock is split in tension via stimulated fractures (grey polygons). In the complex case, small pre-existing faults (black polygons) can also be reactivated in shear slip. The clustered case hydraulically connects a series of stages/perforations into a single fracture/fault network. In the last case, stimulated fractures intersect a large fault system that is critically-stressed for slip. By watching the growth of earthquake magnitudes, CAP-tests can discern between bound cases (blue circles) and unbound cases (pink circles).
On the other hand, stages encountering more complicated interactions with pre-existing fractures/faults tended to exhibit an unbound catalogue. For example, the simplest case of fracture interaction was noted at SURF Experiment #1 (Sect. 3.2): the two stages (N142 and N128) that intersected a natural fracture were also unbound via CAP-tests. Furthermore, injection into faults/fractures was an aim of the GTS (Sect. 3.3), and these stages predominantly exhibited an unbound process. We interpret this correspondence via geometrical considerations again (Fig. 13): an immediate hydraulic connection to a relatively large-scale fracture system provides an opportunity for (apparently) unrestricted magnitude growth. While we have not observed it at these three UGLs (to our knowledge), interactions with smaller-scale pre-existing fractures would be expected to produce a bound sequence.
It is worth emphasizing that stage HS4 at the GTS is exceptional (Sect. 3.3), in that a bound MMAX process was observed for a case with strong natural fracture interactions. Thus, this stage is an outlier to the general interpretive theme regarding natural faults/fractures. That said, there is also good evidence for an alternative bounding mechanism at HS4. Earthquakes were restricted to smaller streaks along larger fault plane trends (Villiger et al., 2021); these streaks grew in spatial extent with increased injection volume. Streaks are interpreted as fault heterogeneity, where seismic asperities are surrounded by a broader creeping/locked fault segment (Rubin et al., 1999; Waldhauser et al., 2004; Rutledge et al., 2004; Evans et al., 2005). Furthermore, the spatial extent of these streaks is comparable to the fault plane area of the largest events observed. In this sense, HS4 seismicity is likely bound to these asperities/streaks, giving rise to the bound growth of magnitudes. Following this logic, it should be possible to test seismic asperities for a bound MMAX process (via CAP-tests) in tectonic settings too.
A recent study performed CAP-tests on field-scale experiments (Schultz et al., 2025), including both shale gas hydraulic fracturing at Preston New Road in the UK (Clarke et al., 2019; Kettlety et al., 2021) and the enhanced geothermal system at Utah FORGE (Moore et al., 2019; Niemz et al., 2025). CAP-tests indicated that many clustered stages followed a bound process, while the more hazardous stages were unbound. Interpretations in these field-scale cases followed a similar interpretation to UGL stages in this study (Sect. 4.1.1), albeit with larger uncertainties. This interpretation was partly driven by clustering sensitivity tests that showed omitting/ignoring earlier bound stages tended to diminish statistical confidence (Schultz et al., 2025) – providing an inference to the importance of accurate clustering and hydraulic connectivity for bound sequences. Certainly, natural fractures have demonstrably influenced the propagation of stimulated fractures (Jin et al., 2024). In this sense, the verification of this interpretation at UGLs provides a potential conceptual linkage to the field-scale, given their observational similarities. Prior results for bound processes are consistent with stimulating a fracture system with a restricted extent, while unbound cases likely have reactivated larger fault systems (Schultz, 2024).
4.2 Empirically constraining the functional form of MMAX vs. V
Up to this point, our study has focused on discerning between bound/unbound sequences – and establishing the importance of natural fault/fracture systems within this dichotomy. However, our discussion has neglected the underlying physical mechanisms responsible for creating this bound MMAX process. Here, we further discuss the underlying physical mechanisms, for all the known bound sequences with data available (Fig. 3) – both in this study and past studies (Schultz et al., 2025).
Numerous theoretical models of MMAX and fracture propagation have been proposed in the literature (Eaton and Igonin, 2018). The simplest model considers a physical limitation based on the geometry of the finite fault extent (Kanamori and Anderson, 1975); For a circular fault with radius R and constant stress drop Δσ, the seismic moment release is given via the equation . Seismic moment can then be translated into an MMAX magnitude via the moment magnitude relationship (Hanks and Kanamori, 1979). Non-stationary MMAX models have been proposed for induced seismicity based on the footprint of stress perturbation along a fault (Shapiro et al., 2011), the evolution of seismic moment (McGarr, 2014; Hallo et al., 2014; Elsworth et al., 2025), self-arrested rupture dynamics (Galis et al., 2017), or time-dependent pressure diffusion (Shapiro et al., 2021). Additionally, we can consider the finite extent of fracture propagation via an aseismic shear crack (Danré et al., 2024) or a tensile crack (Davis et al., 2020). These two models suggest time-varying fracture radii based on the equations and , respectively. Here, sd and k are injection propagation coefficients. MMAX models have been investigated in numerous prior studies (Kwiatek et al., 2018; Li et al., 2021; Yu et al., 2024; Langenbruch et al., 2024; Lanza et al., 2026).
Examining the theoretical models illustrates a common mathematical theme: seismic moment release (M0) is proportional to injected volume, raised to some exponent. For example, the McGarr-like model considers M0∝V1 (McGarr, 2014), while the Galis-like model considers (Galis et al., 2017). Similarly, a growing tensile crack is equivalent to M0∝V1 (Kanamori and Anderson, 1975; Davis et al., 2020), while a growing aseismic shear crack is (Kanamori and Anderson, 1975; Danré et al., 2024; Im and Avouac, 2025; Sáez et al., 2025). Even purely tectonic/geometric limitations can be cast into this form as M0∝V0. Given this commonality, we consider a generic family of MMAX models that have a functional form of MMAX∝log 10(Vn). This generalization is advantageous, as the EW-test can consider any arbitrary MMAX function. Following this logic, we use these arbitrary functions within the EW-test to find the best-fitting n-exponent for each bound case. To ensure a fair comparison, each competing/candidate MMAX model is first fit to the case data before the EW-test selects the best model.
This investigation indicates that the underlying physical mechanisms are varied among cases (Fig. 14). However, the results tend to aggregate into four distinct categories: geometric/streak-like (n 0.0–0.3), X-like (n 0.5–0.7), McGarr/tensile-like (n 0.9–1.1), and aseismic/shear-like (n 1.4–1.7). Bounding mechanisms can be varied, even between similar stages (e.g., Äspö HRL, HF1-HF3). Higher n-exponents tend to be less confident, likely because aseismic/shear-like exponents emulate/approach unbound-like magnitude growth (van der Elst et al., 2016; Galis et al., 2017). Other geophysical data/studies to corroborate the inferences of physical mechanisms are generally limited to a few cases. For example, the propagation of microseismic events at Utah FORGE stages 1–3 were best-fit by tensile-like models (Clarkson et al., 2025; Lanza et al., 2026; Niemz et al., 2026), which independently corresponds to our best-fit n-exponents (0.97 and 1.06) for clusters 1 (stages 1–2) and 2 (stages 3–6) (Fig. 14), as defined in Schultz et al. (2025). Interestingly, the low n-exponent associated with HS4 at the GTS is consistent with the observation of tectonic streaks/asperities that exhibited limited spatial growth during injection (Villiger et al., 2021). The X-like category is exceptional, since there is (to our knowledge) no previously suggested model for this n-exponent. This could be potentially explained by MMAX models that do not fit the Vn generalization (Shapiro et al., 2011, 2021), an as-of-yet undiscovered MMAX model, or observational biases for encountering a relatively large pre-existing fracture network (V0) that also starts growing alongside injection (V1 or ). Currently, we favour the observational bias interpretation for the X-like category, based on the results of drop-out tests that demonstrate how an intermediate sized pre-existing fracture network that also grows alongside injection can produce a mixed n-exponent with poorly-resolved data (Supplement Sect. S1 and S16). We consider it likely that these considerations were a factor for the SURF N164 and Äspö HF3 cases, which indicated the next closest MMAX model when restricting choices to our three bound options (Tables 1 and 2). Accounting for some prior growth appears to be an important consideration for discerning the true MMAX model.
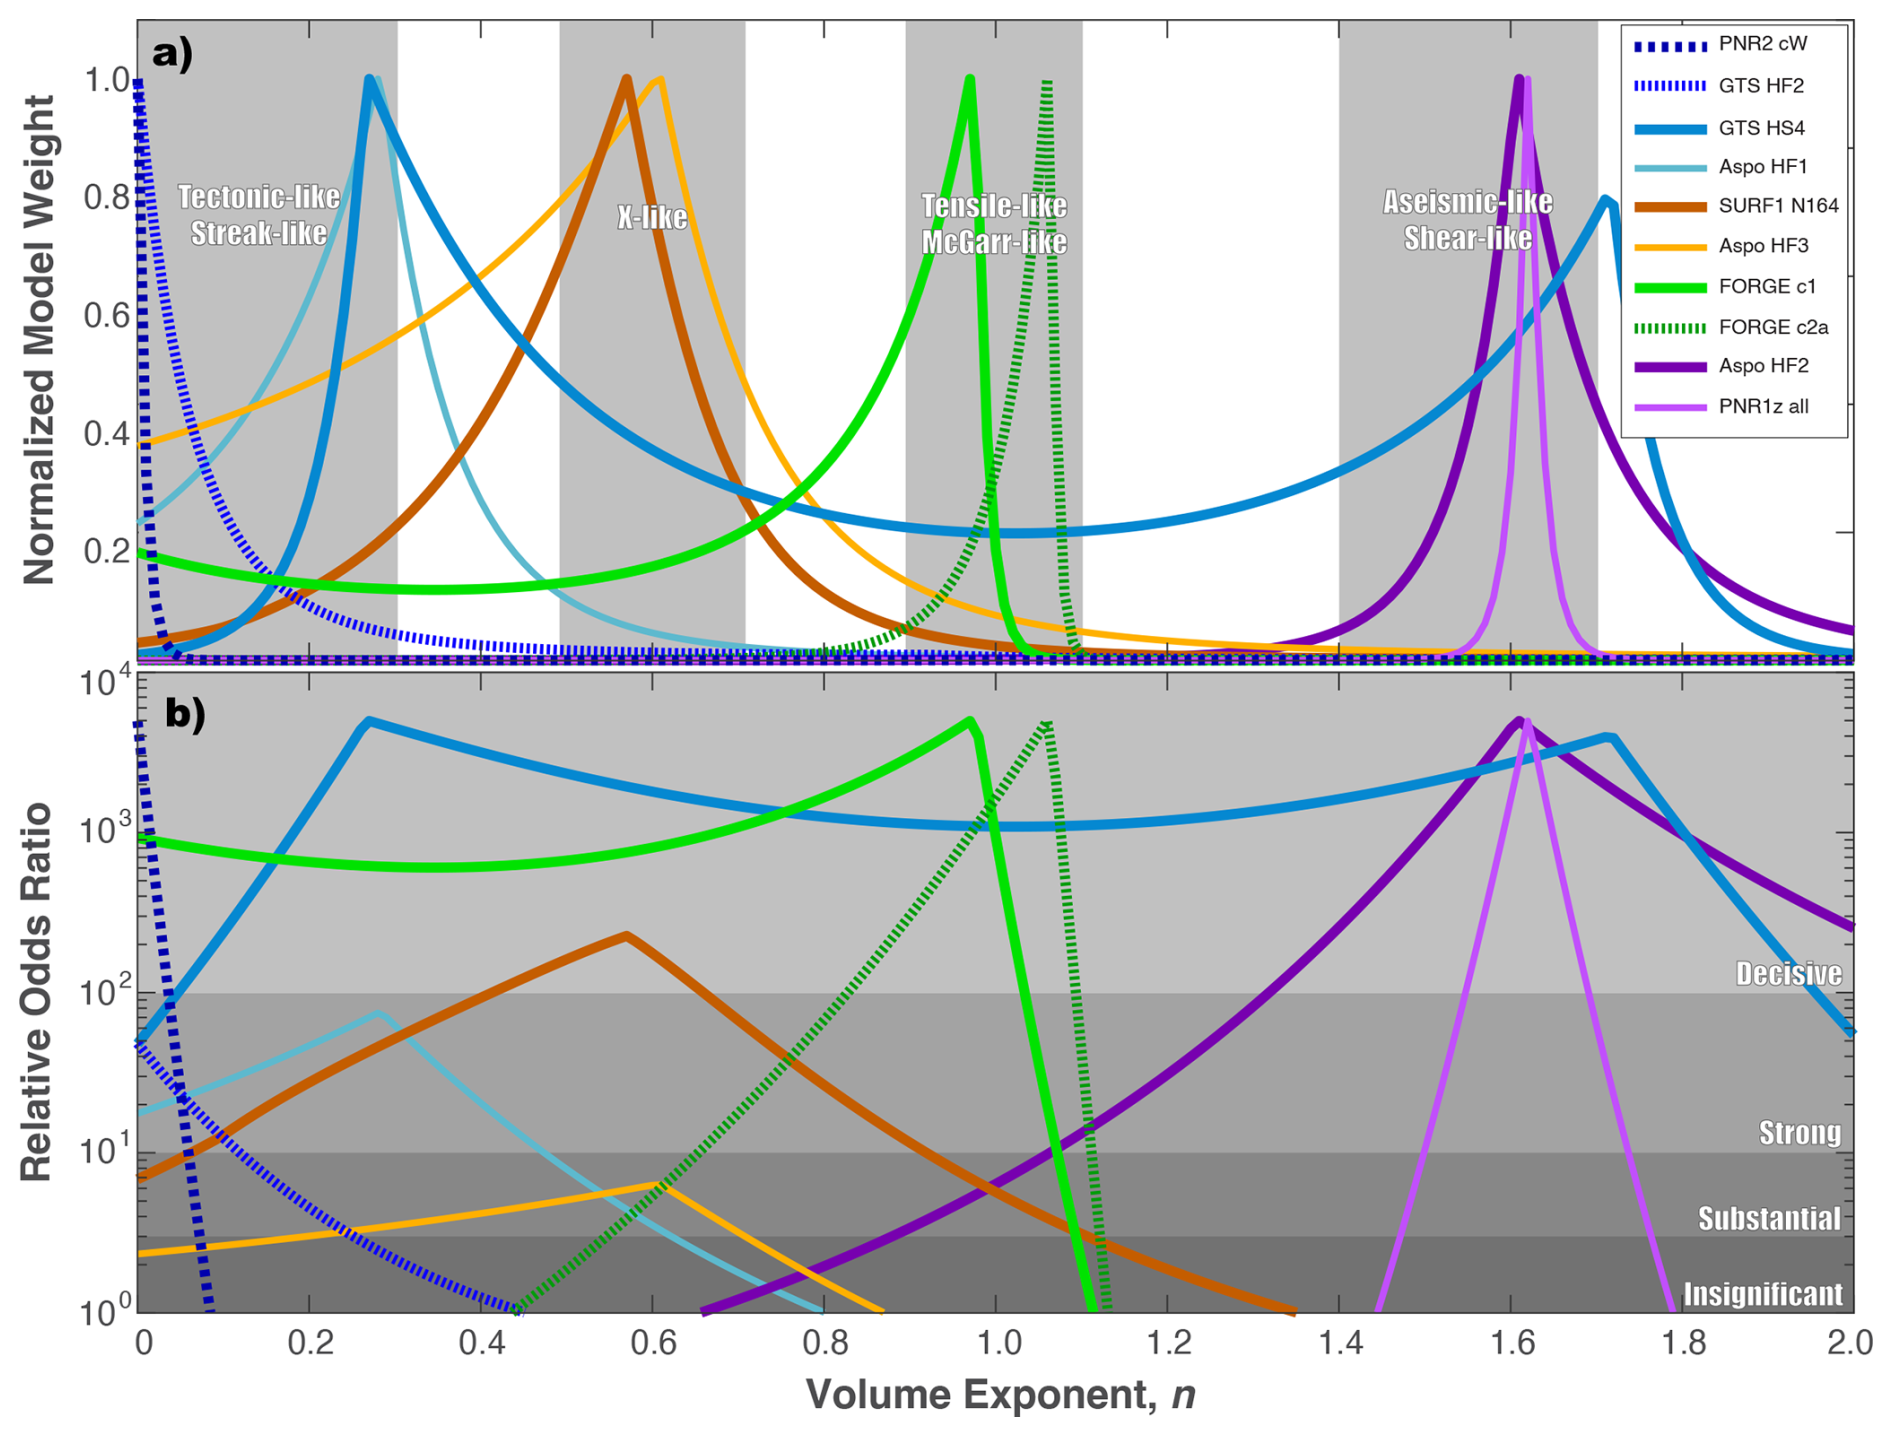
Figure 14Searching for volume-exponents. The EW-test fit to case data (lines) for both (a) normalized model weights and (b) odds ratios (relative to the unbound null hypothesis). Strength of statistical confidence and n-exponent categories are shown with grey shaded areas (and text callouts). Note that relative odds ratios are capped at 5000 to facilitate easier comparison via plotting.
Additional UGL study alongside refinements to CAP-tests (potentially also considering other candidate MMAX models) will likely shed light on the physical processes underlying bound sequences. For example, CAP-tests could be used to systematically search for MMAX models in other datasets. We note that this approach could be straightforwardly adapted to forecast the “next largest event” (Cao et al., 2020), using these weights as part of either a logic-tree (Bommer and Verdon, 2024) or an ensemble of models (Schultz et al., 2023c).
4.3 Exceptions to bound/unbound interpretations
Thus far, we have predominantly interpreted the difference between bound/unbound sequences via distinctions between fracture stimulation and fault reactivation (Fig. 13). While this appears to capture the first-order effects, there likely exists subtleties that can deviate from this conjecture.
4.3.1 Exceptions to the bound-fracture interpretation
We have predominantly interpreted bound sequences arising from the finite (and time/volume dependent) extent of a propagating fracture restricting available slip area. While this interpretation matches both expectation and observation, we can still envision a scenario in which a finite fracture could produce an unbound sequence. For example, in the case that the finite extent of the fracture grows faster than the equivalent area of an unbound MLRG. In this sense, while the sequence is technically bound, it would never be empirically inferable by magnitude information. Criteria for this condition are given below: for the Vn generalization of MMAX as well as the tensile-like and shear-like fractures. There, the expected MLRG formulation is a combination of the population expectation (van der Elst et al., 2016) coupled with a proportionality between injected volume and event counts (Shapiro et al., 2010). Note that Σ is the seismogenic index, a parameter indicating a fault's potential to induce earthquakes per unit of injected fluid volume (Shapiro et al., 2010).
As a reminder of terms: V(t) is the injection volume time-series, n is the volume exponent, b is the b-value, Δσ is the stress drop, while c, sd and k are injection propagation coefficients for different growth.
4.3.2 Exceptions to the unbound-fault interpretation
We have predominantly interpreted unbound sequences arising from fractures interacting with relatively-large pre-existing faults. While this matches our expectation and observations, we can still envision scenarios where pre-existing faults could produce bound sequences. For example, MLRG could be limited by the pre-existing faults being too small, the in situ stress resolved on the fault (Gischig, 2015; Norbeck and Horne, 2018), time-dependence of stress perturbations (Segall and Lu, 2015), fault geometry/complexity (Lee et al., 2024), fault roughness (Maurer et al., 2020; Wang et al., 2024), material/stress heterogeneity (Kroll and Cochran, 2021), rheology, or the extent of asperities. In fact, HS4 at the GTS is one such exception: where streaks outlined the rheological boundary between seismic asperities hosted within an aseismic fault. If these factors are limiting MLRG, CAP-tests should be able to discern their effects.
In summary, we have rigorously tested CAP-tests against data from controlled injection experiments at three underground laboratories. Bound sequences are consistent with observations of new hydraulic fracturing growth, while unbound typically reactivate larger pre-existing structures. Furthermore, the EW-test appears to be able aggregate generalized MMAX functions into categories consistent with theoretical considerations for tectonic/geometric limits, tensile/McGarr-like growth, or aseismic/shear-like growth. This process is potentially able to identify the underlying physical mechanism responsible for MMAX, specific to an individual earthquake sequence. Overall, the ability to robustly identify and constrain MMAX will likely be important for both induced seismicity and natural/tectonic earthquake sequences.
The codes (and data) used to derive our results are available online at GitHub (https://github.com/RyanJamesSchultz/CAPugl, last access: March 2026) and at Zenodo (https://doi.org/10.5281/zenodo.19390588, Schultz, 2026b). The catalogue and hydraulic datasets are also available online, from their source: for the Äspö HRL (Zang et al., 2024), SURF EGS Collab Experiment #1 (https://gdr.openei.org/, last access: July 2025), and the GTS (https://doi.org/10.3929/ethz-b-000276170, Doetsch et al., 2018c).
The supplement related to this article is available online at https://doi.org/10.5194/se-17-617-2026-supplement.
R.S. created the CAP-tests, gathered the data, analysed the cases, and wrote the manuscript. L.V., and V.G. were involved in the curation of GTS catalogue and interpretation of the results. S.W. provided project management. All authors were involved in manuscript editing and review.
The contact author has declared that none of the authors has any competing interests.
Publisher's note: Copernicus Publications remains neutral with regard to jurisdictional claims made in the text, published maps, institutional affiliations, or any other geographical representation in this paper. The authors bear the ultimate responsibility for providing appropriate place names. Views expressed in the text are those of the authors and do not necessarily reflect the views of the publisher.
We would like to thank Luigi Passarelli for insightful conversations that helped the interpretation of this study. We also thank Peter Niemz and an anonymous reviewer, whose comments helped to improve this manuscript. We are grateful for the high-quality UGL studies that facilitated our CAP-test interpretations, which would have been impossible otherwise.
This work is supported by the Seismogenic Fault Injection Test (SFIT), which is funded by the Swiss National Science Foundation, under project number TMPFP2_224393. This work is also supported by the CETPartnership, which is funded by the Clean Energy Transition Partnership under the 2023 joint call for research proposals, co-funded by the European Commission (GA no. 101069750) and with the funding organizations detailed on https://cetpartnership.eu/funding-agencies-and-call-modules (last access: January 2025).
This paper was edited by Michal Malinowski and reviewed by Peter Niemz and one anonymous referee.
Akaike, H: Information theory and an extension of the maximum likelihood principle, in: Selected papers of hirotugu akaike, 199–213, New York, NY, Springer New York, 1998.
Amann, F., Gischig, V., Evans, K., Doetsch, J., Jalali, R., Valley, B., Krietsch, H., Dutler, N., Villiger, L., Brixel, B., Klepikova, M., Kittilä, A., Madonna, C., Wiemer, S., Saar, M. O., Loew, S., Driesner, T., Maurer, H., and Giardini, D.: The seismo-hydromechanical behavior during deep geothermal reservoir stimulations: open questions tackled in a decameter-scale in situ stimulation experiment, Solid Earth, 9, 115–137, https://doi.org/10.5194/se-9-115-2018, 2018.
Atkinson, G. M., Eaton, D. W., Ghofrani, H., Walker, D., Cheadle, B., Schultz, R., Shcherbakov, R., Tiampo, K., Gu, J., Harrington, R. H., Liu, Y., van der Baan, M., and Kao, H.: Hydraulic Fracturing and Seismicity in the Western Canada Sedimentary Basin, Seismol. Res. Lett., 87, 631–647, https://doi.org/10.1785/0220150263, 2016.
Berger, V. W. and Zhou, Y.: Kolmogorov–Smirnov test: Overview, Wiley StatsRef: Statistics Reference Online, https://doi.org/10.1002/9781118445112.stat06558, 2014.
Bommer, J. and Verdon, J. P.: The maximum magnitude of natural and induced earthquakes, Geomechanics and Geophysics for Geo-Energy and Geo-Resources, 10, 172, https://doi.org/10.1007/s40948-024-00895-2, 2024.
Bommer, J. J., Oates, S., Cepeda, J. M., Lindholm, C., Bird, J., Torres, R., Marroquín, G., and Rivas, J.: Control of hazard due to seismicity induced by a hot fractured rock geothermal project, Eng. Geol., 83, 287–306, https://doi.org/10.1016/j.enggeo.2005.11.002, 2006.
Bommer, J. J.: Earthquake hazard and risk analysis for natural and induced seismicity: towards objective assessments in the face of uncertainty, B. Earthq. Eng., 20, 2825–3069, https://doi.org/10.1007/s10518-022-01357-4, 2022.
Brixel, B., Klepikova, M., Jalali, M. R., Lei, Q., Roques, C., Krietsch, H., and Loew, S.: Tracking fluid flow in shallow crustal fault zones: 1. Insights from single-hole permeability estimates, J. Geophys. Res.-Sol. Ea., 125, e2019JB018200, https://doi.org/10.1029/2019JB018200, 2020a.
Brixel, B., Klepikova, M., Lei, Q., Roques, C., Jalali, M. R., Krietsch, H., and Loew, S.: Tracking fluid flow in shallow crustal fault zones: 2. Insights from cross-hole forced flow experiments in damage zones, J. Geophys. Res.-Sol. Ea., 125, e2019JB019108, https://doi.org/10.1029/2019JB019108, 2020b.
Cao, N. T., Eisner, L., and Jechumtálová, Z.: Next record breaking magnitude for injection induced seismicity, First Break, 38, 53–57, https://doi.org/10.3997/1365-2397.fb2020010, 2020.
Cao, N. T., Eisner, L., Jechumtálová, Z., Verdon, J., and Waheed, U. B.: Upper limit magnitudes for induced seismicity in energy industries, Geophys. Prospect., https://doi.org/10.1111/1365-2478.13553, 2024.
Chai, C., Maceira, M., Santos-Villalobos, H. J., Venkatakrishnan, S. V., Schoenball, M., Zhu, W., Beroza, G. C., Thurber, C., and EGS Collab Team: Using a deep neural network and transfer learning to bridge scales for seismic phase picking, Geophys. Res. Lett., 47, e2020GL088651, https://doi.org/10.1029/2020GL088651, 2020.
Clarke, H., Verdon, J. P., Kettlety, T., Baird, A. F., and Kendall, J. M.: Real-time imaging, forecasting, and management of human-induced seismicity at Preston New Road, Lancashire, England, Seismol. Res. Lett., 90, 1902–1915, https://doi.org/10.1785/0220190110, 2019.
Clarkson, C. R., Alkhayyali, W., and Zeinabady, D.: Characterization and modeling of enhanced geothermal systems using methods developed for unconventional hydrocarbon reservoirs, SPE Annual Technical Conference and Exhibition, SPE-228230, https://doi.org/10.2118/228230-MS, 2025.
Danré, P., Garagash, D., De Barros, L., Cappa, F., and Ampuero, J. P.: Control of seismicity migration in earthquake swarms by injected fluid volume and aseismic crack propagation, J. Geophys. Res.-Sol. Ea., 129, e2023JB027276, https://doi.org/10.1029/2023JB027276, 2024.
Davis, T., Rivalta, E., and Dahm, T.: Critical fluid injection volumes for uncontrolled fracture ascent, Geophys. Res. Lett., 47, e2020GL087774, https://doi.org/10.1029/2020GL087774, 2020.
DeDontney, N., Gans, C., Burnett, W., Burch, D., Garzon, J., Gist, G., Hsu, S., Lele, S., Pais, D., Rehermann, P. S., Searles, K., Symington, B., Tomic, J., Terell, M., and Younan, A.: Maximum magnitude of induced earthquakes in the Groningen gas field, ExxonMobil URC External Report, https://nam-onderzoeksrapporten.data-app.nl/reports/download/groningen/en/36dea690-c7eb-4164-9d94-d9725381c426 (last access: July 2025), 2016.
Dobson, P., Kneafsey, T., Morris, J., Singh, A., Zoback, M., Roggenthen, W., Doe, T., Neupane, G., Podgorney, R., Wang, H., Knox, H., Scwering, P., Blankenship, D., Ulrich, C., Johnson, T., White, M., and EGS Collab Team: The EGS Collab hydroshear experiment at the Sanford Underground Research Facility–Siting criteria and evaluation of candidate sites, Geoth. Res. T., 42, 708–723, 2018.
Doetsch, J., Gischig, V., Krietsch, H., Villiger, L., Amann, F., Dutler, N., Jalali, M., Brixel, B., Roques, C., Giertzuch, P., Kittilä, A., and Hochreutener, R.: Grimsel ISC Experimental Description, ETH Zurich Report, https://doi.org/10.3929/ethz-b-000310581, 2018a.
Doetsch, J., Gischig, V. S., Villiger, L., Krietsch, H., Nejati, M., Amann, F., Jalali, M., Madonna, C., Maurer, H., Wiemer, S., Driesner, T., and Giardini, D.: Subsurface fluid pressure and rock deformation monitoring using seismic velocity observations, Geophys. Res. Lett., 45, 10389–10397, https://doi.org/10.1029/2018GL079009, 2018b.
Doetsch, J., Gischig, V., Amman, F., Jalali, M., Krietsch, H., and Giardini, D.: Data collection for the Grimsel In-Situ Stimulation and Circulation (ISC) experiment, ETH Zurich [data set], https://doi.org/10.3929/ethz-b-000276170, 2018c.
Dutler, N., Valley, B., Gischig, V., Villiger, L., Krietsch, H., Doetsch, J., Brixel, B., Jalali, M., and Amann, F.: Hydraulic fracture propagation in a heterogeneous stress field in a crystalline rock mass, Solid Earth, 10, 1877–1904, https://doi.org/10.5194/se-10-1877-2019, 2019.
Eaton, D. W. and Igonin, N.: What controls the maximum magnitude of injection-induced earthquakes?, The Leading Edge, 37, 135–140, https://doi.org/10.1190/tle37020135.1, 2018.
Elsworth, D., Li, Z., Yu, P., An, M., Zhang, F., Huang, R., Sun, Z., Cui, G., Chen, T., Gan, Q., Zhao, Y., Liu, J. and Liu, S.: Constraints on triggered seismicity and its control on permeability evolution, Journal of Rock Mechanics and Geotechnical Engineering, 17, 20–30, https://doi.org/10.1016/j.jrmge.2024.11.035, 2025.
Evans, K. F., Moriya, H., Niitsuma, H., Jones, R. H., Phillips, W. S., Genter, A., Sausse, J., Jung, R, and Baria, R.: Microseismicity and permeability enhancement of hydrogeologic structures during massive fluid injections into granite at 3 km depth at the Soultz HDR site, Geophys. J. Int., 160, 388–412, https://doi.org/10.1111/j.1365-246X.2004.02474.x, 2005.
Foulger, G. R., Wilson, M. P., Gluyas, J. G., Julian, B. R., and Davies, R. J.: Global review of human-induced earthquakes, Earth-Sci. Rev., 178, 438–514, https://doi.org/10.1016/j.earscirev.2017.07.008, 2018.
Frash, L. P., Carey, J. W., and Welch, N. J.: EGS collab experiment 1 geomechanical and hydrological properties by triaxial direct shear, in: 44th Workshop on Geothermal Reservoir Engineering, 2019.
Fu, P., Schoenball, M., Ajo-Franklin, J. B., Chai, C., Maceira, M., Morris, J. P., Wu, H., Knox, H., Schwering, P. C., White, M. D. Burghardt, J. A., Strickland, C. D., Johnson, T. C., Vermeul, V. R., Sprinkle, P., Roberts, B., Ulrich, C., Guglielmi, Y., Cook, P. J., Dobson, P. F., Wood, T., Frash, L. P., Lianjie, H., Ingraham, M. D., Pope, J. S., Smith, M. M., Neupane, G., Doe, T. W., Roggenthen, W. M. Horne, R., Singh, A., Zoback, M. D., Wang, H., Condon, K., Ghassemi, A., Chen, H., McClure, M. W. Vandine, G., Blankenship, D. Kneafsey, T. J., and EGS Collab Team: Close observation of hydraulic fracturing at EGS Collab Experiment 1: Fracture trajectory, microseismic interpretations, and the role of natural fractures, J. Geophys. Res.-Sol. Ea., 126, e2020JB020840, https://doi.org/10.1029/2020JB020840, 2021.
Galis, M., Ampuero, J. P., Mai, P. M., and Cappa, F.: Induced seismicity provides insight into why earthquake ruptures stop, Science Advances, 3, eaap7528, https://doi.org/10.1126/sciadv.aap7528, 2017.
Grigoli, F., Cesca, S., Rinaldi, A. P., Manconi, A., Lopez-Comino, J. A., Clinton, J. F., Westaway, R., Cauzzi, C., Dahm, T., and Wiemer, S.: The November 2017 Mw 5.5 Pohang earthquake: A possible case of induced seismicity in South Korea, Science, 360, 1003–1006, https://doi.org/10.1126/science.aat2010, 2018.
Gischig, V., Jalali, R., Amann, F., Krietsch, H., Klepikova, M., Esposito, S., Broccardo, M., Obermann, A., Arnaud, M., Doetsch, J., and Madonna, C.: Impact of the ISC Experiment at the Grimsel Test Site–Assessment of Potential Seismic Hazard and Disturbances to Nearby Experiments and KWO Infrastructure, ETH Zurich Report, https://doi.org/10.3929/ethz-b-000189973, 2016.
Gischig, V. S.: Rupture propagation behavior and the largest possible earthquake induced by fluid injection into deep reservoirs, Geophys. Res. Lett., 42, 7420–7428, https://doi.org/10.1002/2015GL065072, 2015.
Gischig, V. S., Giardini, D., Amann, F., Hertrich, M., Krietsch, H., Loew, S., Maurer, H., Villiger, L., Wiemer, S., Bethmann, F., Brixel, B., Doetsch, J., Doonechaly, N.G., Driesner, T., Dutler, N., Evans, K.F., Jalali, M., Jordan, D., Kittilä, Ma, X., and Valley, B.: Hydraulic stimulation and fluid circulation experiments in underground laboratories: Stepping up the scale towards engineered geothermal systems, Geomechanics for Energy and the Environment, 24, 100175, https://doi.org/10.1016/j.gete.2019.100175, 2020.
Guglielmi, Y., Cook, P., Soom, F., Schoenball, M., Dobson, P., and Kneafsey, T.: In situ continuous monitoring of borehole displacements induced by stimulated hydrofracture growth, Geophys. Res. Lett., 48, e2020GL090782, https://doi.org/10.1029/2020GL090782, 2021.
Gutenberg, B. and Richter, C. F.: Frequency of earthquakes in California, B. Seismol. Soc. Am., 34, 185–188, https://doi.org/10.1785/BSSA0340040185, 1944.
Hanks, T. C. and Kanamori, H.: A moment magnitude scale, J. Geophys. Res.-Sol. Ea., 84, 2348–2350, https://doi.org/10.1029/JB084iB05p02348, 1979.
Hallo, M., Oprsal, I., Eisner, L., and Ali, M. Y.: Prediction of magnitude of the largest potentially induced seismic event, J. Seismol., 18, 421–431, https://doi.org/10.1007/s10950-014-9417-4, 2014.
Heise, J.: The Sanford underground research facility at Homestake, J. Phys. Conf. Ser., 606, 012015, https://doi.org/10.1088/1742-6596/606/1/012015, 2015.
Holschneider, M., Zöller, G., and Hainzl, S.: Estimation of the maximum possible magnitude in the framework of a doubly truncated Gutenberg–Richter model, B. Seismol. Soc. Am., 101, 1649–1659, https://doi.org/10.1785/0120100289, 2011.
Holschneider, M., Zöller, G., Clements, R., and Schorlemmer, D.: Can we test for the maximum possible earthquake magnitude?, J. Geophys. Res.-Sol. Ea., 119, 2019–2028, https://doi.org/10.1002/2013JB010319, 2014.
Im, K. and Avouac, J. P.: Maximum Magnitude of Induced Earthquakes in Rate and State Friction Framework, Seismol. Res. Lett., 96, 1654–1664, https://doi.org/10.1785/0220240382, 2025.
Ishimoto, M. and Iida, K.: Observations of earthquakes registered with the microseismograph constructed recently, B. Earthq. Res. I. Tokyo, 17, 443–478, 1939.
Jalali, M., Gischig, V., Doetsch, J., Näf, R., Krietsch, H., Klepikova, M., Amann, F., and Giardini, D.: Transmissivity changes and microseismicity induced by small-scale hydraulic fracturing tests in crystalline rock, Geophys. Res. Lett., 45, 2265–2273, https://doi.org/10.1002/2017GL076781, 2018.
Jin, G., Ning, Y., Gale, M., Simmons, J., and Tura, A.: Impact of natural fractures on hydraulic fracture propagation in Denver-Julesburg Basin: Insights from a decade of research, The Leading Edge, 43, 806–814, https://doi.org/10.1190/tle43120806.1, 2024.
Kanamori, H. and Anderson, D. L.: Theoretical basis of some empirical relations in seismology, B. Seismol. Soc. Am., 65, 1073–1095, 1975.
Kass, R. E. and Raftery, A. E.: Bayes factors, J. Am. Stat. Assoc., 90, 773–795, https://doi.org/10.1080/01621459.1995.10476572, 1995.
Kettlety, T., Verdon, J. P., Butcher, A., Hampson, M., and Craddock, L.: High-resolution imaging of the ML 2.9 August 2019 earthquake in Lancashire, United Kingdom, induced by hydraulic fracturing during Preston New Road PNR-2 operations, Seismol. Res. Lett., 92, 151–169, https://doi.org/10.1785/0220200187, 2021.
Kijko, A.: Bayesian Assessment of the Maximum Possible Earthquake Magnitude m max, J. Geol. Soc. India, 101, 764–769, https://doi.org/10.17491/jgsi/2025/174157, 2025.
Krietsch, H., Doetsch, J., Dutler, N., Jalali, M., Gischig, V., Loew, S., and Amann, F.: Comprehensive geological dataset describing a crystalline rock mass for hydraulic stimulation experiments, Scientific Data, 5, 1–12, https://doi.org/10.1038/sdata.2018.269, 2018.
Krietsch, H., Gischig, V., Evans, K., Doetsch, J., Dutler, N. O., Valley, B., and Amann, F.: Stress measurements for an in situ stimulation experiment in crystalline rock: integration of induced seismicity, stress relief and hydraulic methods, Rock Mech. Rock Eng., 52, 517–542, https://doi.org/10.1007/s00603-018-1597-8, 2019.
Krietsch, H., Villiger, L., Doetsch, J., Gischig, V., Evans, K. F., Brixel, B., Jalali, M. R., Loew, S., Giardini, D., and Amann, F.: Changing flow paths caused by simultaneous shearing and fracturing observed during hydraulic stimulation, Geophys. Res. Lett., 47, e2019GL086135, https://doi.org/10.1029/2019GL086135, 2020a.
Krietsch, H., Gischig, V. S., Doetsch, J., Evans, K. F., Villiger, L., Jalali, M., Valley, B., Löw, S., and Amann, F.: Hydromechanical processes and their influence on the stimulation effected volume: observations from a decameter-scale hydraulic stimulation project, Solid Earth, 11, 1699–1729, https://doi.org/10.5194/se-11-1699-2020, 2020b.
Kroll, K. A. and Cochran, E. S.: Stress controls rupture extent and maximum magnitude of induced earthquakes, Geophys. Res. Lett., 48, e2020GL092148, https://doi.org/10.1029/2020GL092148, 2021.
Kneafsey, T. J., Dobson, P., Blankenship, D., Morris, J., Knox, H., Schwering, P., White, M., Doe, T., Roggenthen, W., Mattson, E., Podgorney, R., Johnson, T., Ajo-Franklin, J., Valladao, C., and EGS Collab Team: An overview of the EGS Collab project: field validation of coupled process modeling of fracturing and fluid flow at the Sanford Underground Research Facility, Lead, SD, in: 43rd Workshop on Geothermal Reservoir Engineering, 2018.
Kneafsey, T. J., Blankenship, D., Dobson, P. F., Morris, J. P., White, M. D., Fu, P., Schwering, P. C., Ajo-Franklin, J.B., Huang, L., Schoenball, M., Johnson, T. C., Knox, H. A., Neupane, G., Weers, J., Horne, R., Zhang, Y., Roggenthen, W., Doe, T., Mattson, E., Valladao, C., and EGS Collab Team: The EGS collab project: Learnings from Experiment 1, in: Proceedings of the 45th Workshop on Geothermal Reservoir Engineering, 10–12, Stanford University, 2020.
Kwiatek, G., Martínez-Garzón, P., Plenkers, K., Leonhardt, M., Zang, A., von Specht, S., Dresen, G., and Bohnhoff, M.: Insights into complex subdecimeter fracturing processes occurring during a water injection experiment at depth in Äspö Hard Rock Laboratory, Sweden, J. Geophys. Res.-Sol. Ea., 123, 6616–6635, https://doi.org/10.1029/2017JB014715, 2018.
Langenbruch, C., Moein, M. J., and Shapiro, S. A.: Are maximum magnitudes of induced earthquakes controlled by pressure diffusion?, Philosophical Transactions A, 382, 20230184, https://doi.org/10.1098/rsta.2023.0184, 2024.
Lanza, F., Rinaldi, A. P., Passarelli, L., Ritz, V. A., Repollés, V. C., Schultz, R., Ciardo, F., Dyer, B., Ermert, L., Grigoratos, I., Karvounis, D., Meier, P., Mignan, A., Moore, J., Pankow, K., Scarabello, L., Schmid, N., Shi, P., Tuinstra, K., and Wiemer, S.: The 2022 hydraulic stimulation at Utah FORGE: investigating fracturing mechanisms and testing forecasting approaches, Seismica, accepted, 2026.
Lee, J., Tsai, V. C., Hirth, G., Chatterjee, A., and Trugman, D. T.: Fault-network geometry influences earthquake frictional behaviour, Nature, 1–5, https://doi.org/10.1038/s41586-024-07518-6, 2024.
Li, Z., Elsworth, D., and Wang, C.: Constraining maximum event magnitude during injection-triggered seismicity, Nat. Commun., 12, 1528, https://doi.org/10.1038/s41467-020-20700-4, 2021.
Li, S. and Zhang, D.: Three-dimensional thermoporoelastic modeling of hydrofracturing and fluid circulation in hot dry rock, J. Geophys. Res.-Sol. Ea., 128, e2022JB025673, https://doi.org/10.1029/2022JB025673, 2023.
López-Comino, J. Á., Cesca, S., Heimann, S., Grigoli, F., Milkereit, C., Dahm, T., and Zang, A.: Characterization of hydraulic fractures growth during the Äspö Hard Rock Laboratory experiment (Sweden), Rock Mech. Rock Eng., 50, 2985–3001, https://doi.org/10.1007/s00603-017-1285-0, 2017.
López-Comino, J. Á., Cesca, S., Niemz, P., Dahm, T., and Zang, A.: Rupture directivity in 3D inferred from acoustic emissions events in a mine-scale hydraulic fracturing experiment, Frontiers in Earth Science, 9, 670757, https://doi.org/10.3389/feart.2021.670757, 2021.
Majer, E. L., Baria, R., Stark, M., Oates, S., Bommer, J., Smith, B., and Asanuma, H.: Induced seismicity associated with enhanced geothermal systems, Geothermics, 36, 185–222, https://doi.org/10.1016/j.geothermics.2007.03.003, 2007.
Marzocchi, W. and Sandri, L.: A review and new insights on the estimation of the b-value and its uncertainty, Ann. Geophys., 46, 1271–1282, 2003.
Maurer, J., Dunham, E. M., and Segall, P.: Role of fluid injection on earthquake size in dynamic rupture simulations on rough faults, Geophys. Res. Lett., 47, e2020GL088377, https://doi.org/10.1029/2020GL088377, 2020.
McGarr, A.: Maximum magnitude earthquakes induced by fluid injection, J. Geophys. Res.-Sol. Ea., 119, 1008–1019, https://doi.org/10.1002/2013JB010597, 2014.
McQuarrie, A. D.: A small-sample correction for the Schwarz SIC model selection criterion, Stat. Probabil. Lett., 44, 79–86, https://doi.org/10.1016/S0167-7152(98)00294-6, 1999.
Mendecki, A. J.: Mine Seismology Reference Book: Seismic Hazard, Institute of Mine Seismology, Tasmania, Australia, 88 pp., ISBN 978-0-9942943-0-2, 2016.
Moein, M. J., Langenbruch, C., Schultz, R., Grigoli, F., Ellsworth, W. L., Wang, R., Rinaldi, A. P., and Shapiro, S.: The physical mechanisms of induced earthquakes, Nature Reviews Earth & Environment, 4, 847–863, https://doi.org/10.1038/s43017-023-00497-8, 2023.
Moore, J., McLennan, J., Allis, R., Pankow, K., Simmons, S., Podgorney, R., Wannamaker, P., Bartley, J., Jones, C., and Rickard, W.: The Utah Frontier Observatory for Research in Geothermal Energy (FORGE): an international laboratory for enhanced geothermal system technology development, in: 44th Workshop on Geothermal Reservoir Engineering, 11–13, Stanford University, 2019.
Morris, J. P., Fu, P., Dobson, P., Ajo-Franklin, J., Kneafsey, T. J., Knox, H., Blankenship, D., White, M.D., Burghardt, J., Doe, T. W., and EGS Collab Team: Experimental design for hydrofracturing and fluid flow at the DOE EGS collab testbed, in: ARMA US Rock Mechanics/Geomechanics Symposium, ARMA-2018, 2018.
Muntendam-Bos, A. G., Hoedeman, G., Polychronopoulou, K., Draganov, D., Weemstra, C., van der Zee, W., Bakker, R. R., and Roest, H.: An overview of induced seismicity in the Netherlands, Neth. J. Geosci., 101, e1, https://doi.org/10.1017/njg.2021.14, 2022.
Niemz, P., Cesca, S., Heimann, S., Grigoli, F., von Specht, S., Hammer, C., Zang, A., and Dahm, T.: Full-waveform-based characterization of acoustic emission activity in a mine-scale experiment: a comparison of conventional and advanced hydraulic fracturing schemes, Geophys. J. Int., 222, 189–206, https://doi.org/10.1093/gji/ggaa127, 2020.
Niemz, P., Dahm, T., Milkereit, C., Cesca, S., Petersen, G., and Zang, A.: Insights into hydraulic fracture growth gained from a joint analysis of seismometer-derived tilt signals and acoustic emissions, J. Geophys. Res.-Sol. Ea., 126, e2021JB023057, https://doi.org/10.1029/2021JB023057, 2021.
Niemz, P., Pankow, K., Isken, M. P., Whidden, K., McLennan, J., and Moore, J.: Mapping fracture zones with nodal geophone patches: Insights from induced microseismicity during the 2024 stimulations at Utah FORGE, Seismol. Res. Lett., https://doi.org/10.1785/0220240300, 2025.
Niemz, P., Petersen, G., Rutledge, J., Whidden, K., and Pankow, K.: Isotropic components of microseismic moment tensors at Utah FORGE reveal a diversity of fluid pathway creation processes in EGS development, Sci. Rep., https://doi.org/10.1038/s41598-026-42493-0, 2026.
Norbeck, J. H. and Horne, R. N.: Maximum magnitude of injection-induced earthquakes: A criterion to assess the influence of pressure migration along faults, Tectonophysics, 733, 108–118, https://doi.org/10.1016/j.tecto.2018.01.028, 2018.
Oldenburg, C., Dobson, P., Wu, Y., Cook, P., Kneafsey, T., Nakagawa, S., Ulrich, C., Siler, D., Guglielmi, Y., Ajo-Franklin, J., Rutqvist, J., Daley, T., Birkholzer, J., Wang, H. F., Lord, N. E., Haimson, B. C., Sone, H., Vigiliante, P., Roggenthen, W. M., Doe, T. W., Lee, M. Y., Ingraham, M., Huang, H., Mattson, E. D., Zhou, J., Johnson, T. J., Zoback, M. D., Morris, J. P., White, J. A., Johnson, P. A., and Heise, J.: Hydraulic fracturing experiments at 1500 m depth in a deep mine: Highlights from the kISMET project, in: 42nd Workshop on Geothermal Reservoir Engineering, 9, Stanford University, 2017.
Pisarenko, V. F. and Rodkin, M. V.: Approaches to solving the maximum possible earthquake magnitude (Mmax) problem, Surv. Geophys., https://doi.org/10.1007/s10712-021-09673-1, 2022.
Qin, Y., Li, J., Huang, L., Schoenball, M., Ajo-Franklin, J., Blankenship, D., Kneafsey, T. J., and EGS Collab Team: Source mechanism of kHz microseismic events recorded in multiple boreholes at the first EGS Collab testbed, Geothermics, 120, 102994, https://doi.org/10.1016/j.geothermics.2024.102994, 2024.
Rubin, A. M., Gillard, D., and Got, J. L.: Streaks of microearthquakes along creeping faults, Nature, 400, 635–641, https://doi.org/10.1038/23196, 1999.
Rutledge, J. T., Phillips, W. S., and Mayerhofer, M. J.: Faulting induced by forced fluid injection and fluid flow forced by faulting: An interpretation of hydraulic-fracture microseismicity, Carthage Cotton Valley gas field, Texas, B. Seismol. Soc. Am., 94, 1817–1830, https://doi.org/10.1785/012003257, 2004.
Sáez, A., Passelègue, F., and Lecampion, B.: Maximum size and magnitude of injection-induced slow slip events, Science Advances, 11, eadq0662, https://doi.org/10.1126/sciadv.adq0662, 2025.
Schneeberger, R., Kober, F., Spillmann, T., Blechschmidt, I., Lanyon, G. W., and Mäder, U. K.: Grimsel Test Site: Revisiting the site-specific geoscientific knowledge, Nagra Technical Report 19-01, https://nagra.ch/en/downloads/technical-report-ntb-19-01-2/ (last access: January 2026), 2019.
Schoenball, M., Ajo-Franklin, J., Fu, P., and Templeton, D.: Microseismic monitoring of meso-scale stimulations for the DOE EGS Collab project at the Sanford Underground Research Facility, LLNL-CONF-767025, Lawrence Livermore National Laboratory, 2019.
Schoenball, M., Ajo-Franklin, J. B., Blankenship, D., Chai, C., Chakravarty, A., Dobson, P., Hopp, C., Kneafsey, T., Knox, H. A., Maceira, M. Robertson, M. C., Sprinkle, P., Strickland, C., Templeton, D., Chwering, P. C., Ulrich, C., Wood, T., and EGS Collab Team: Creation of a mixed-mode fracture network at mesoscale through hydraulic fracturing and shear stimulation, J. Geophys. Res.-Sol. Ea., 125, e2020JB019807, https://doi.org/10.1029/2020JB019807, 2020.
Schopper, F., Doetsch, J., Villiger, L., Krietsch, H., Gischig, V. S., Jalali, M., Amann, F., Dutler, N., and Maurer, H.: On the variability of pressure propagation during hydraulic stimulation based on seismic velocity observations, J. Geophys. Res.-Sol. Ea., 125, e2019JB018801, https://doi.org/10.1029/2019JB018801, 2020.
Schultz, R.: Inferring maximum magnitudes from the ordered sequence of large earthquakes, Philosophical Transactions A, 382, 20230185, https://doi.org/10.1098/rsta.2023.0185, 2024.
Schultz, R.: Improving the resolvability of MMAX truncation via deeper order statistics, Geophys. J. Int., ggag110, https://doi.org/10.1093/gji/ggag110, 2026a.
Schultz, R.: RyanJamesSchultz/CAPugl: v1 (Version v1), Zenodo [code, data set], https://doi.org/10.5281/zenodo.19390588, 2026b.
Schultz, R., Atkinson, G., Eaton, D. W., Gu, Y. J., and Kao, H.: Hydraulic fracturing volume is associated with induced earthquake productivity in the Duvernay play, Science, 359, 304–308, https://doi.org/10.1126/science.aao0159, 2018.
Schultz, R., Skoumal, R. J., Brudzinski, M. R., Eaton, D., Baptie, B., and Ellsworth, W.: Hydraulic fracturing-induced seismicity, Rev. Geophys., 58, e2019RG000695, https://doi.org/10.1029/2019RG000695, 2020.
Schultz, R., Beroza, G. C., and Ellsworth, W. L.: A risk-based approach for managing hydraulic fracturing–induced seismicity, Science, 372, 504–507, https://doi.org/10.1126/science.abg5451, 2021a.
Schultz, R., Beroza, G. C., and Ellsworth, W. L.: A strategy for choosing red-light thresholds to manage hydraulic fracturing induced seismicity in North America, J. Geophys. Res.-Sol. Ea., 126, e2021JB022340, https://doi.org/10.1029/2021JB022340, 2021b.
Schultz, R., Ellsworth, W. L., and Beroza, G. C.: Statistical bounds on how induced seismicity stops, Sci. Rep., 12, 1184, https://doi.org/10.1038/s41598-022-05216-9, 2022.
Schultz, R., Baptie, B., Edwards, B., and Wiemer, S.: Red-light thresholds for induced seismicity in the UK, Seismica, 2, https://doi.org/10.26443/seismica.v2i2.1086, 2023a.
Schultz, R., Park, Y., Aguilar Suarez, A. L., Ellsworth, W. L., and Beroza, G. C.: En echelon faults reactivated by wastewater disposal near Musreau Lake, Alberta, Geophys. J. Int., 235, 417–429, https://doi.org/10.1093/gji/ggad226, 2023b.
Schultz, R., Ellsworth, W. L., and Beroza, G. C.: An ensemble approach to characterizing trailing-induced seismicity, Seismol. Res. Lett., 94, 699–707, https://doi.org/10.1785/0220220352, 2023c.
Schultz, R., Lanza, F., Dyer, B., Karvounis, D., Fiori, R., Shi, P., Ritz, V., Villiger, L., Meier, P., and Wiemer, S.: The bound growth of induced earthquakes could de-risk hydraulic fracturing, Commun. Earth Environ., https://doi.org/10.1038/s43247-025-02881-2, 2025.
Schwarz, G.: Estimating the dimension of a model, Ann. Stat., 461–464, 1978.
Segall, P. and Lu, S.: Injection-induced seismicity: Poroelastic and earthquake nucleation effects, J. Geophys. Res.-Sol. Ea., 120, 5082–5103, https://doi.org/10.1002/2015JB012060, 2015.
Shapiro, S. A., Dinske, C., Langenbruch, C., and Wenzel, F.: Seismogenic index and magnitude probability of earthquakes induced during reservoir fluid stimulations, The Leading Edge, 29, 304–309, https://doi.org/10.1190/1.3353727, 2010.
Shapiro, S. A., Krüger, O. S., Dinske, C., and Langenbruch, C.: Magnitudes of induced earthquakes and geometric scales of fluid-stimulated rock volumes, Geophysics, 76, WC55–WC63, https://doi.org/10.1190/geo2010-0349.1, 2011.
Shapiro, S. A., Kim, K. H., and Ree, J. H.: Magnitude and nucleation time of the 2017 Pohang Earthquake point to its predictable artificial triggering, Nat. Commun., 12, 6397, https://doi.org/10.1038/s41467-021-26679-w, 2021.
Singh, A., Neupane, G., Dobson, P., Zoback, M., Morris, J., Fu, P., Schwering, P., William, R., Luke, F., Time, Kneafsey, Schoenball, M., Guglielmi, Y., Knox, H., Ulrich, C., Nuri, U., Doe, T., Wang, H., Condon, K., and Johnston, B.: Slip tendency analysis of fracture networks to determine suitability of candidate testbeds for the EGS Collab hydroshear experiment, INL/CON-19-53585-Rev001, Idaho National Laboratory, https://www.osti.gov/biblio/1564264 (last access: January 2025), 2019.
Stanfors, R., Rhén, I., Tullborg, E. L., and Wikberg, P.: Overview of geological and hydrogeological conditions of the Äspö hard rock laboratory site, Appl. Geochem., 14, 819–834, https://doi.org/10.1016/S0883-2927(99)00022-0, 1999.
Stephansson, O., Semikova, H., Zimmermann, G., and Zang, A.: Laboratory pulse test of hydraulic fracturing on granitic sample cores from Äspö HRL, Sweden, Rock Mech. Rock Eng., 52, 629–633, https://doi.org/10.1007/s00603-018-1421-5, 2019.
Sugiura, N.: Further analysis of the data by Akaike's information criterion and the finite corrections, Commun. Stat.-Theor. M., 7, 13–26, https://doi.org/10.1080/03610927808827599, 1978.
van der Elst, N. J., Page, M. T., Weiser, D. A., Goebel, T. H., and Hosseini, S. M.: Induced earthquake magnitudes are as large as (statistically) expected, J. Geophys. Res.-Sol. Ea., 121, 4575–4590, https://doi.org/10.1002/2016JB012818, 2016.
Verdon, J. P. and Eisner, L.: An Empirically Constrained Forecasting Strategy for Induced Earthquake Magnitudes Using Extreme Value Theory, Seismol. Res. Lett., https://doi.org/10.1785/0220240061, 2024.
Verdon, J. P. and Bommer, J. J.: Green, yellow, red, or out of the blue? An assessment of Traffic Light Schemes to mitigate the impact of hydraulic fracturing-induced seismicity, J. Seismol., 25, 301–326, https://doi.org/10.1007/s10950-020-09966-9, 2021.
Verdon, J. P., Pullen, B., and Rodríguez-Pradilla, G.: Growth and stabilisation of induced seismicity rates during long-term, low pressure fluid injection, Philosophical Transactions A, 382, 20230183, https://doi.org/10.1098/rsta.2023.0183, 2023.
Verdon, J. P. and Schultz, R.: Induced earthquakes in the southern Delaware Basin, Texas, are bound by a geomechanically controlled maximum magnitude, Geophys. Res. Lett., 53, e2025GL117419, https://doi.org/10.1029/2025GL117419, 2026.
Vigilante, P. J., Sone, H., Wang, H. F., Haimson, B., and Doe, T. W.: Anisotropic strength of Poorman Formation rocks, kISMET project, in: ARMA US Rock Mechanics/Geomechanics Symposium, ARMA-2017, 2017.
Villiger, L., Gischig, V. S., Doetsch, J., Krietsch, H., Dutler, N. O., Jalali, M., Valley, B., Selvadurai, P. A., Mignan, A., Plenkers, K., Giardini, D., Amann, F., and Wiemer, S.: Influence of reservoir geology on seismic response during decameter-scale hydraulic stimulations in crystalline rock, Solid Earth, 11, 627–655, https://doi.org/10.5194/se-11-627-2020, 2020.
Villiger, L., Gischig, V. S., Kwiatek, G., Krietsch, H., Doetsch, J., Jalali, M., Amann, F., Giardini, D., and Wiemer, S.: Metre-scale stress heterogeneities and stress redistribution drive complex fracture slip and fracture growth during a hydraulic stimulation experiment, Geophys. J. Int., 225, 1689–1703, https://doi.org/10.1093/gji/ggab057, 2021.
Wagenmakers, E. J. and Farrell, S.: AIC model selection using Akaike weights, Psychon. B. Rev., 11, 192–196, https://doi.org/10.3758/BF03206482, 2004.
Waldhauser, F., Ellsworth, W. L., Schaff, D. P., and Cole, A.: Streaks, multiplets, and holes: High-resolution spatio-temporal behavior of Parkfield seismicity, Geophys. Res. Lett., 31, https://doi.org/10.1029/2004GL020649, 2004.
Wang, L., Kwiatek, G., Renard, F., Guérin-Marthe, S., Rybacki, E., Bohnhoff, M., Naumann, M., and Dresen, G.: Fault roughness controls injection-induced seismicity, P. Natl. Acad. Sci. USA, 121, e2310039121, https://doi.org/10.1073/pnas.2310039121, 2024.
White, M., Johnson, T., Kneafsey, T., Blankenship, D., Fu, P., Wu, H., Ghassemi, A., Lu, J., Huang, H., Neupane, G., Oldenburg, C., Doughty, C., Johnston, B., Winterfled, P., Pollyea, R., Jayne, R., Hawkins, A., Zhang, Y., and EGS Collab Team: The necessity for iteration in the application of numerical simulation to EGS: Examples from the EGS Collab test bed 1, in: 44th Workshop on Geothermal Reservoir Engineering, 2019.
Wu, H., Fu, P., Morris, J. P., Mattson, E. D., Neupane, G., Smith, M. M., Hawkins, A. J., Zhang, Y., Keanfsey, T., and EGS Collab Team: Characterization of flow and transport in a fracture network at the EGS Collab field experiment through stochastic modeling of tracer recovery, J. Hydrol., 593, 125888, https://doi.org/10.1016/j.jhydrol.2020.125888, 2021a.
Wu, H., Fu, P., Frone, Z., White, M. D., Ajo-Franklin, J. B., Morris, J. P., Knox, H. A., Schwering, P. C., Strickland, C. E., Roberts, B. Q., Vermeul, V. R., Mattson, E. D., Ingraham, M. D., Kneafsey, T. J., Blankenship, D. A., and EGS Collab Team: Modeling heat transport processes in enhanced geothermal systems: A validation study from EGS Collab Experiment 1, Geothermics, 97, 102254, https://doi.org/10.1016/j.geothermics.2021.102254, 2021b.
Yin, X., Jiang, C., Yin, F., Zhai, H., Zheng, Y., Wu, H., Niu, X., Zhang, Y., Jiang, C., and Li, J.: Assessment and optimization of maximum magnitude forecasting models for induced seismicity in enhanced geothermal systems: The Gonghe EGS project in Qinghai, China, Tectonophysics, 886, 230438, https://doi.org/10.1016/j.tecto.2024.230438, 2024.
Yu, J., Eijsink, A., Marone, C., Rivière, J., Shokouhi, P., and Elsworth, D.: Role of critical stress in quantifying the magnitude of fluid-injection triggered earthquakes, Nat. Commun., 15, 7893, https://doi.org/10.1038/s41467-024-52089-9, 2024.
Zang, A., Zimmermann, G., Hofmann, H., Stephansson, O., Min, K. B., and Kim, K. Y.: How to reduce fluid-injection-induced seismicity, Rock Mech. Rock Eng., 52, 475–493, https://doi.org/10.1007/s00603-018-1467-4, 2019.
Zang, A., Zimmermann, G., Hofmann, H., Niemz, P., Kim, K. Y., Diaz, M., Zhuang, L., and Yoon, J. S.: Relaxation damage control via fatigue-hydraulic fracturing in granitic rock as inferred from laboratory-, mine-, and field-scale experiments, Sci. Rep., 11, 6780, https://doi.org/10.1038/s41598-021-86094-5, 2021.
Zang, A., Niemz, P., von Specht, S., Zimmermann, G., Milkereit, C., Plenkers, K., and Klee, G.: Comprehensive data set of in situ hydraulic stimulation experiments for geothermal purposes at the Äspö Hard Rock Laboratory (Sweden), Earth Syst. Sci. Data, 16, 295–310, https://doi.org/10.5194/essd-16-295-2024, 2024.
Zhou, W., Lanza, F., Grigoratos, I., Schultz, R., Cousse, J., Trutnevyte, E., Muntendam-Bos, A., and Wiemer, S.: Managing induced seismicity risks from enhanced geothermal systems: A good practice guideline, Rev. Geophys., https://doi.org/10.1029/2024RG000849, 2024.
Zhuang, L., Kim, K. Y., Jung, S. G., Diaz, M., Min, K. B., Zang, A., Stephansson, O., Zimmermann, G., Yoon, J., and Hofmann, H.: Cyclic hydraulic fracturing of pocheon granite cores and its impact on breakdown pressure, acoustic emission amplitudes and injectivity, Int. J. Rock Mech. Min., 122, 104065, https://doi.org/10.1016/j.ijrmms.2019.104065, 2019.
Zimmermann, G., Zang, A., Stephansson, O., Klee, G., and Semiková, H.: Permeability enhancement and fracture development of hydraulic in situ experiments in the Äspö Hard Rock Laboratory, Sweden, Rock Mech. Rock Eng., 52, 495–515, https://doi.org/10.1007/s00603-018-1499-9, 2019.
Zöller, G. and Holschneider, M.: The earthquake history in a fault zone tells us almost nothing about Mmax, Seismol. Res. Lett., 87, 132–137, https://doi.org/10.1785/0220150176, 2016.