the Creative Commons Attribution 4.0 License.
the Creative Commons Attribution 4.0 License.
 | 23 Apr 2026
Enhancing 2D deep seismic reflection imaging using shot domain regularization: a case study from the Jiangnan Orogenic Belt, South China
Hui Zhang
Zhendong Liu
Jianguang Han
Hao Wang
Jiahao Liu
Deep seismic reflection is a key method for investigating plate tectonics, as it enables detailed imaging of lithospheric structures – particularly within the crust and upper mantle. It plays a crucial role in understanding crustal evolution and identifying mineral enrichment zones. However, during data acquisition, deviations from the planned shot and receiver locations often occur due to surface constraints or other logistical challenges. These deviations result in irregular seismic data that can introduce significant migration artifacts during processing, ultimately reducing data quality and hindering the interpretation of deep geological structures. To address this issue, we evaluated four data regularization strategies based on anti-aliasing Matching Pursuit Fourier Interpolation using a 2D deep seismic reflection dataset from the central Jiangnan Orogenic Belt. Among these, the method that involves regularizing and infilling shot gathers at 100 m intervals produced the most effective results. Compared to legacy contractor-processed data, this method achieved a higher signal-to-noise ratio and improved seismic resolution. The superiority of that method was further confirmed through enhanced imaging in the pre-stack time migration results. These findings highlight the importance of shot domain regularization prior to migration in deep seismic reflection surveys.
- Article
(29017 KB) - Full-text XML
- BibTeX
- EndNote


Deep seismic reflection has been recognized as an effective means to explore the continental basement and identify subtle lithospheric structures, which has been gradually applied to study the deep crustal structure and metallogenic processes (Krishna and Rao, 2005; Lü et al., 2013; Gao et al., 2014; Ahmadi et al., 2015; Naghizadeh et al., 2019; Liu et al., 2021). Because of this, a deep seismic reflection profile is often acquired in areas with rough topography, varying surface conditions, and complex tectonic geology. Consequently, deep seismic reflection data are often sparsely and irregularly sampled across spatial coordinates due to both economic constraints and surface access limitations. This results in several processing challenges including uneven offset distribution, large offset intervals, and significant aliasing (Lan et al., 2021; Zappalá et al., 2025). In many cases, deep seismic reflection profiles exhibit poor stack quality in the shallow section, largely due to sparse shot and receiver sampling and low signal-to-noise ratios (S N). Therefore, migration of these data will inevitably generate unwanted migration artifacts, which adversely affect the interpretation of deep geological structures. Although deep seismic reflections primarily target deep structures, high-quality shallow seismic reflections are also crucial, as they provide valuable insights into the integrated relationship between shallow and deep structures.
Numerous researchers have conducted extensive studies on deep seismic reflection data pre-processing, time domain velocity analysis, and migration methods to enhance image quality (Snyder et al., 2008; Markovic et al., 2019; Ding and Malehmir, 2021; Liu et al., 2021; Lu et al., 2022). However, limited research has been conducted on the irregular sampling of deep seismic reflection data, and regularization of such data is rarely performed. The fold-based amplitude normalization method during migration was used to reduce unwanted migration noises and energy inequality (Zhu et al., 2014). Panea et al. (2017) used 2.5D acoustic finite-difference modelling to analyse the effect of a crooked line geometry on the S N of deep seismic reflection data, which indicated that irregular shot and receiver spacing introduced static time shifts into the arrival times of the reflected and head waves, lower S N and some geologic interfaces of interest are not well-imaged. Interpolation of conventional seismic data on land allows under-sampled data to compensate for sparse acquisition, which could help to improve image quality (Bezerra et al., 2023). Nevertheless, interpolation of sparsely sampled deep seismic reflection data was often suboptimal using conventional frequency domain methods, as the aliased energy is likely to be chosen as signal (Wu and Xu, 2022). The anti-aliasing Fourier interpolation method was applied to regularize and infill shot gathers. The anti-aliasing capability of the method was achieved by first computing priors (spectral weights), which are typically derived from the lower frequencies of seismic data, and then used the computed weights to de-alias the higher frequencies (Schonewille et al., 2009). With the priors, real signals are much easier to select from the aliased data.
In 2019, a 2D deep seismic reflection crooked line was acquired by the China Geological Survey Project in the middle segment of the Jiangnan Orogenic Belt (JOB) (Liu et al., 2022). The intent of the project was to obtain a good subsurface structural image that can help understand the process of multi-stage collision, collage, breakup, and reconstruction of the South China continent (Jahn et al., 1990; Zhou and Li, 2000; Li et al., 2016; Gan et al., 2020; Hou et al., 2022; Hu et al., 2024; Lu et al., 2025). Meanwhile, it also helps determine the location of the underground metal abundance zones containing copper, tungsten, gold, and others (Xu et al., 2017; Yan et al., 2022). The survey line starts from Wuning, Hubei Province in the North and ends in Ji'an, Jiangxi Province in the South, with a total length of 200 km full-fold spread. Previously, both infield and in-house seismic data processing without seismic data regularization were performed by the contractors to obtain stack sections. And, the two results show low S N overall, and the absence of clear reflections about major faults, the mountain area and its contact with the basin that is the main target of the project.
In this paper, we proposed a target-oriented seismic pre-processing sequence and introduced anti-aliasing data regularization into the workflow. Four different data regularization strategies were tested and compared. The results demonstrate that the method of regularizing and infilling the shot gathers yields in a more regular and denser shot positioning as well as a more even offset distribution, which leads to higher fold, higher S N, and better stack energy. Some dipping diffraction energy was better reconstructed with fewer artifacts. Benefits from the revised processing sequence, image quality of the new pre-stack time migration provided less migration artifacts, and clearer images of shallow and deep underground geological structures in the middle segment of the JOB.
The Yangtze Block and the Cathaysian Block merged in the early Neoproterozoic orogeny, forming the JOB (Li et al., 2019). The JOB can be divided into three major segments: the northeastern segment (Huaiyu or Shuangxiwu terrane), the middle segment (Jiuling terrane), and the southwestern segment (Xiangbei and Guibei terranes) (Wang et al., 2017). It is primarily composed of Meso-Neoproterozoic epimetamorphic strata, Neoproterozoic granite, minor mafic rocks, and contains two recognized Serpentinite belts (Fig. 1) (Yao et al., 2014; Yan et al., 2024). The formation of this geological unit is intimately associated with the amalgamation and subsequent breakup of the Rodinia supercontinent, representing a pivotal stratigraphic component within the South China Block (Mao et al., 2021; Chen et al., 2022). The JOB strata from the early to middle Neoproterozoic can be divided into two structural layers. The lower structural layer is the fold substrate, mainly composed of the Sibao Group, Fanjingshan Group, Lengjiaxi Group, Shuangqiaoshan Group, Shuangxiwu Group, and Xikou Group (Geng, 2015; Li et al., 2016). The upper structural layer is composed of the Heshangzhen Group, Dengshan Group, Likou Group, Banxi Group, Xiajiang Group, and Danzhou Group (Yao et al., 2019; Liu et al., 2025). The type of sedimentary construction is flysch formation, composed of greenschist facies metamorphic schist, argillaceous rocks, intercalated felsic tuff, spilite, and base-ultrabasic rocks (Zhang et al., 2021). The igneous rocks include a large number of peraluminous granites, as well as a small amount of mafic-ultramafic rocks and siliceous basalts (Wang and Li, 2003).
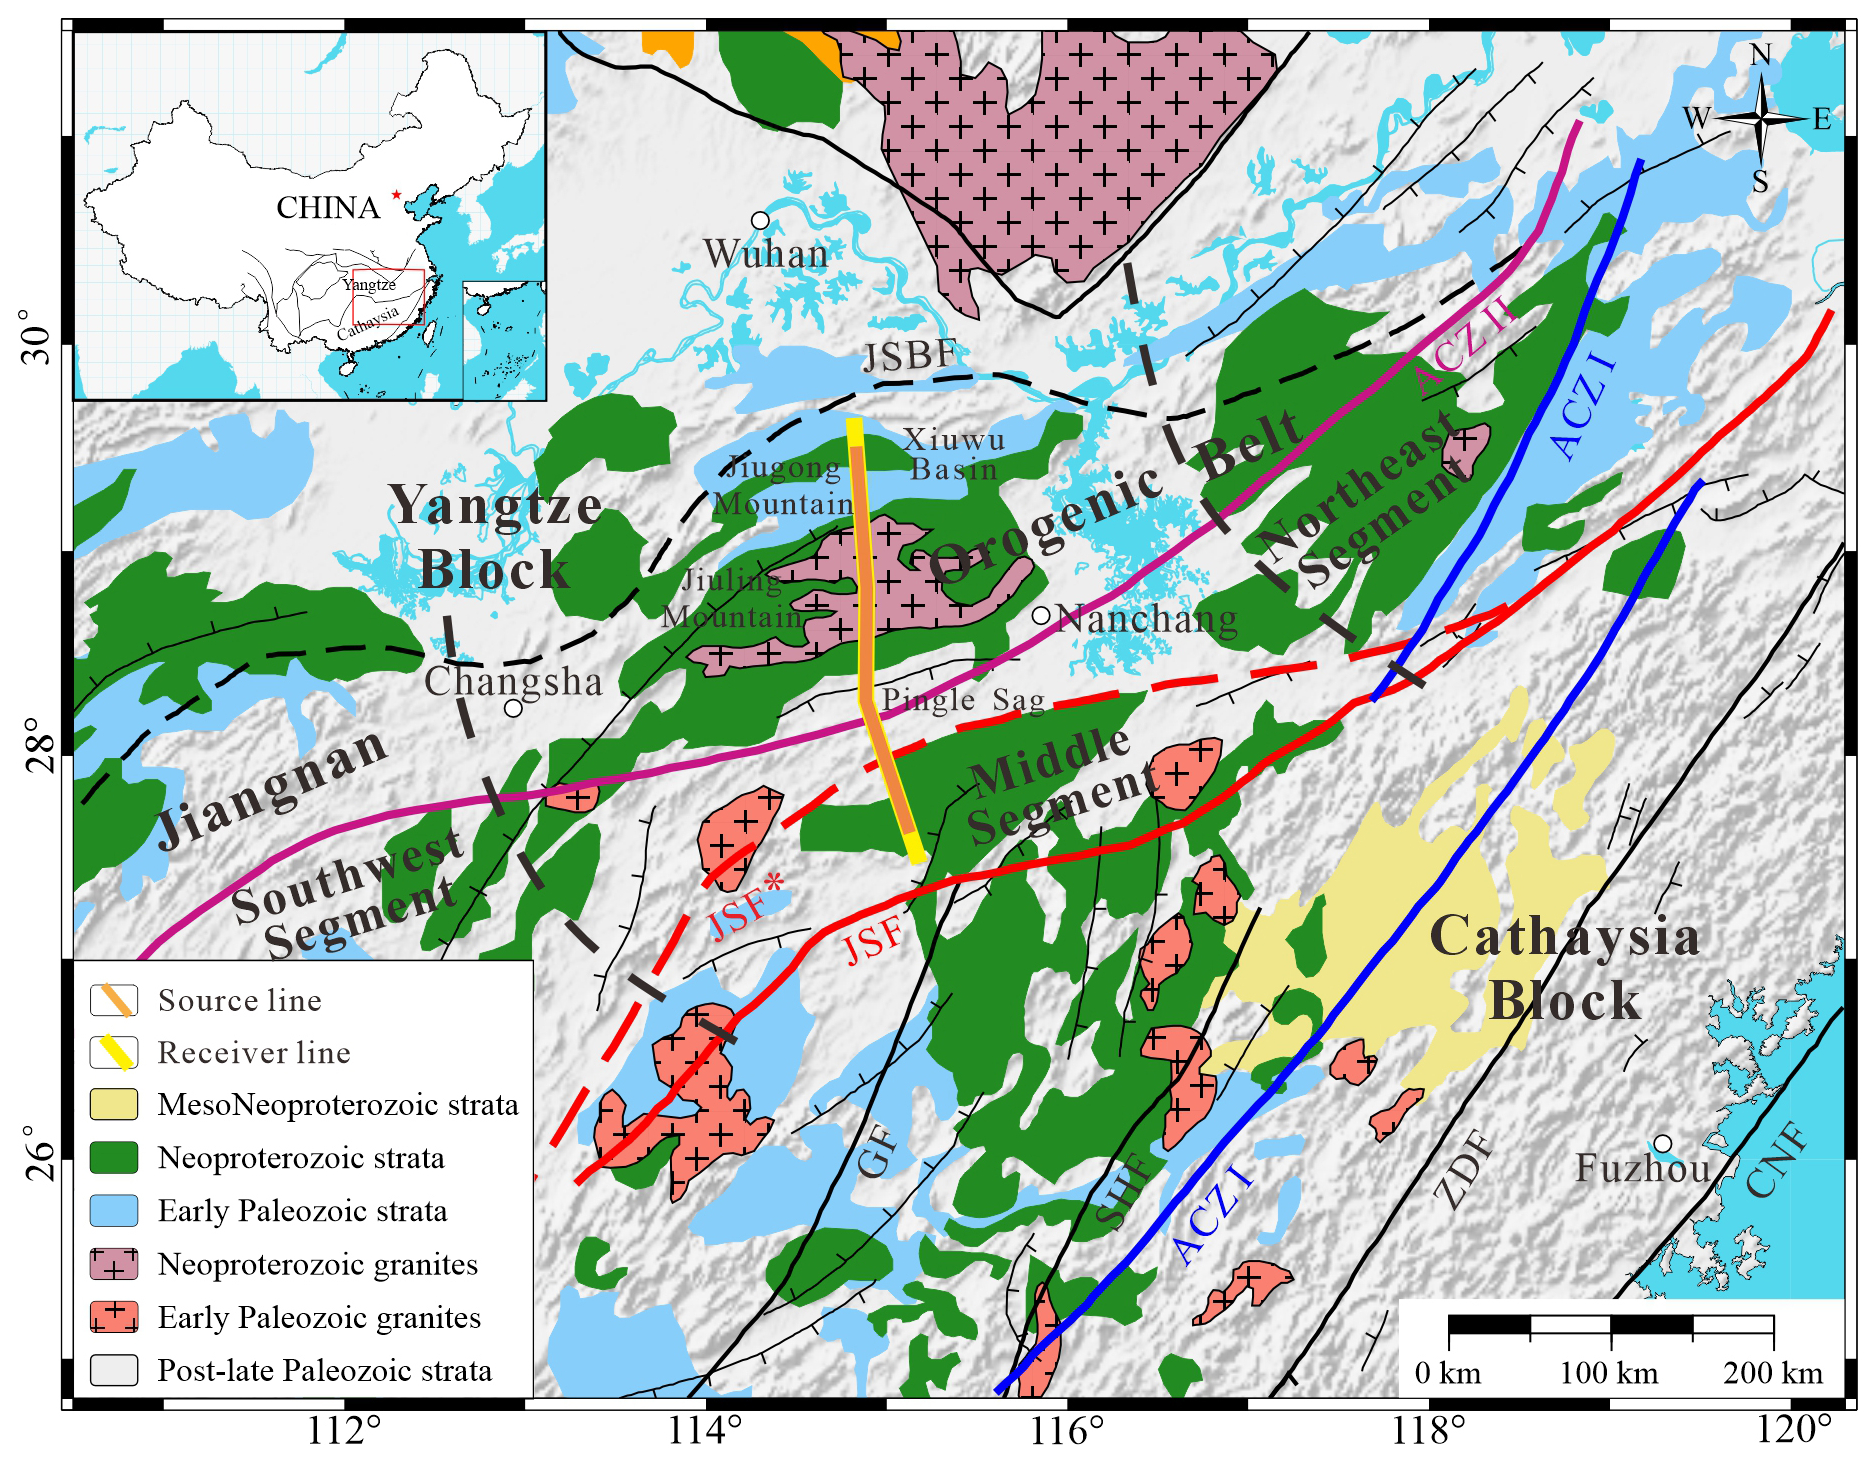
Figure 1The location of survey line and geological sketch map of the study area (Yan et al., 2024). ACZ I: Ancient collisional zone of the Jinning period I, ACZ II: Ancient collisional zone of the Jinning period II, JSBF: Jiujiang-Shitai buried Fault, JSF/ JSF*: Jiangshan-Shaoxing Fault, GF: Ganjiang Fault, SHF: Shaowu-Heyuan Fault, ZDF: Zhenghe-Dapu Fault, CNF: Changle-Nanao Fault.
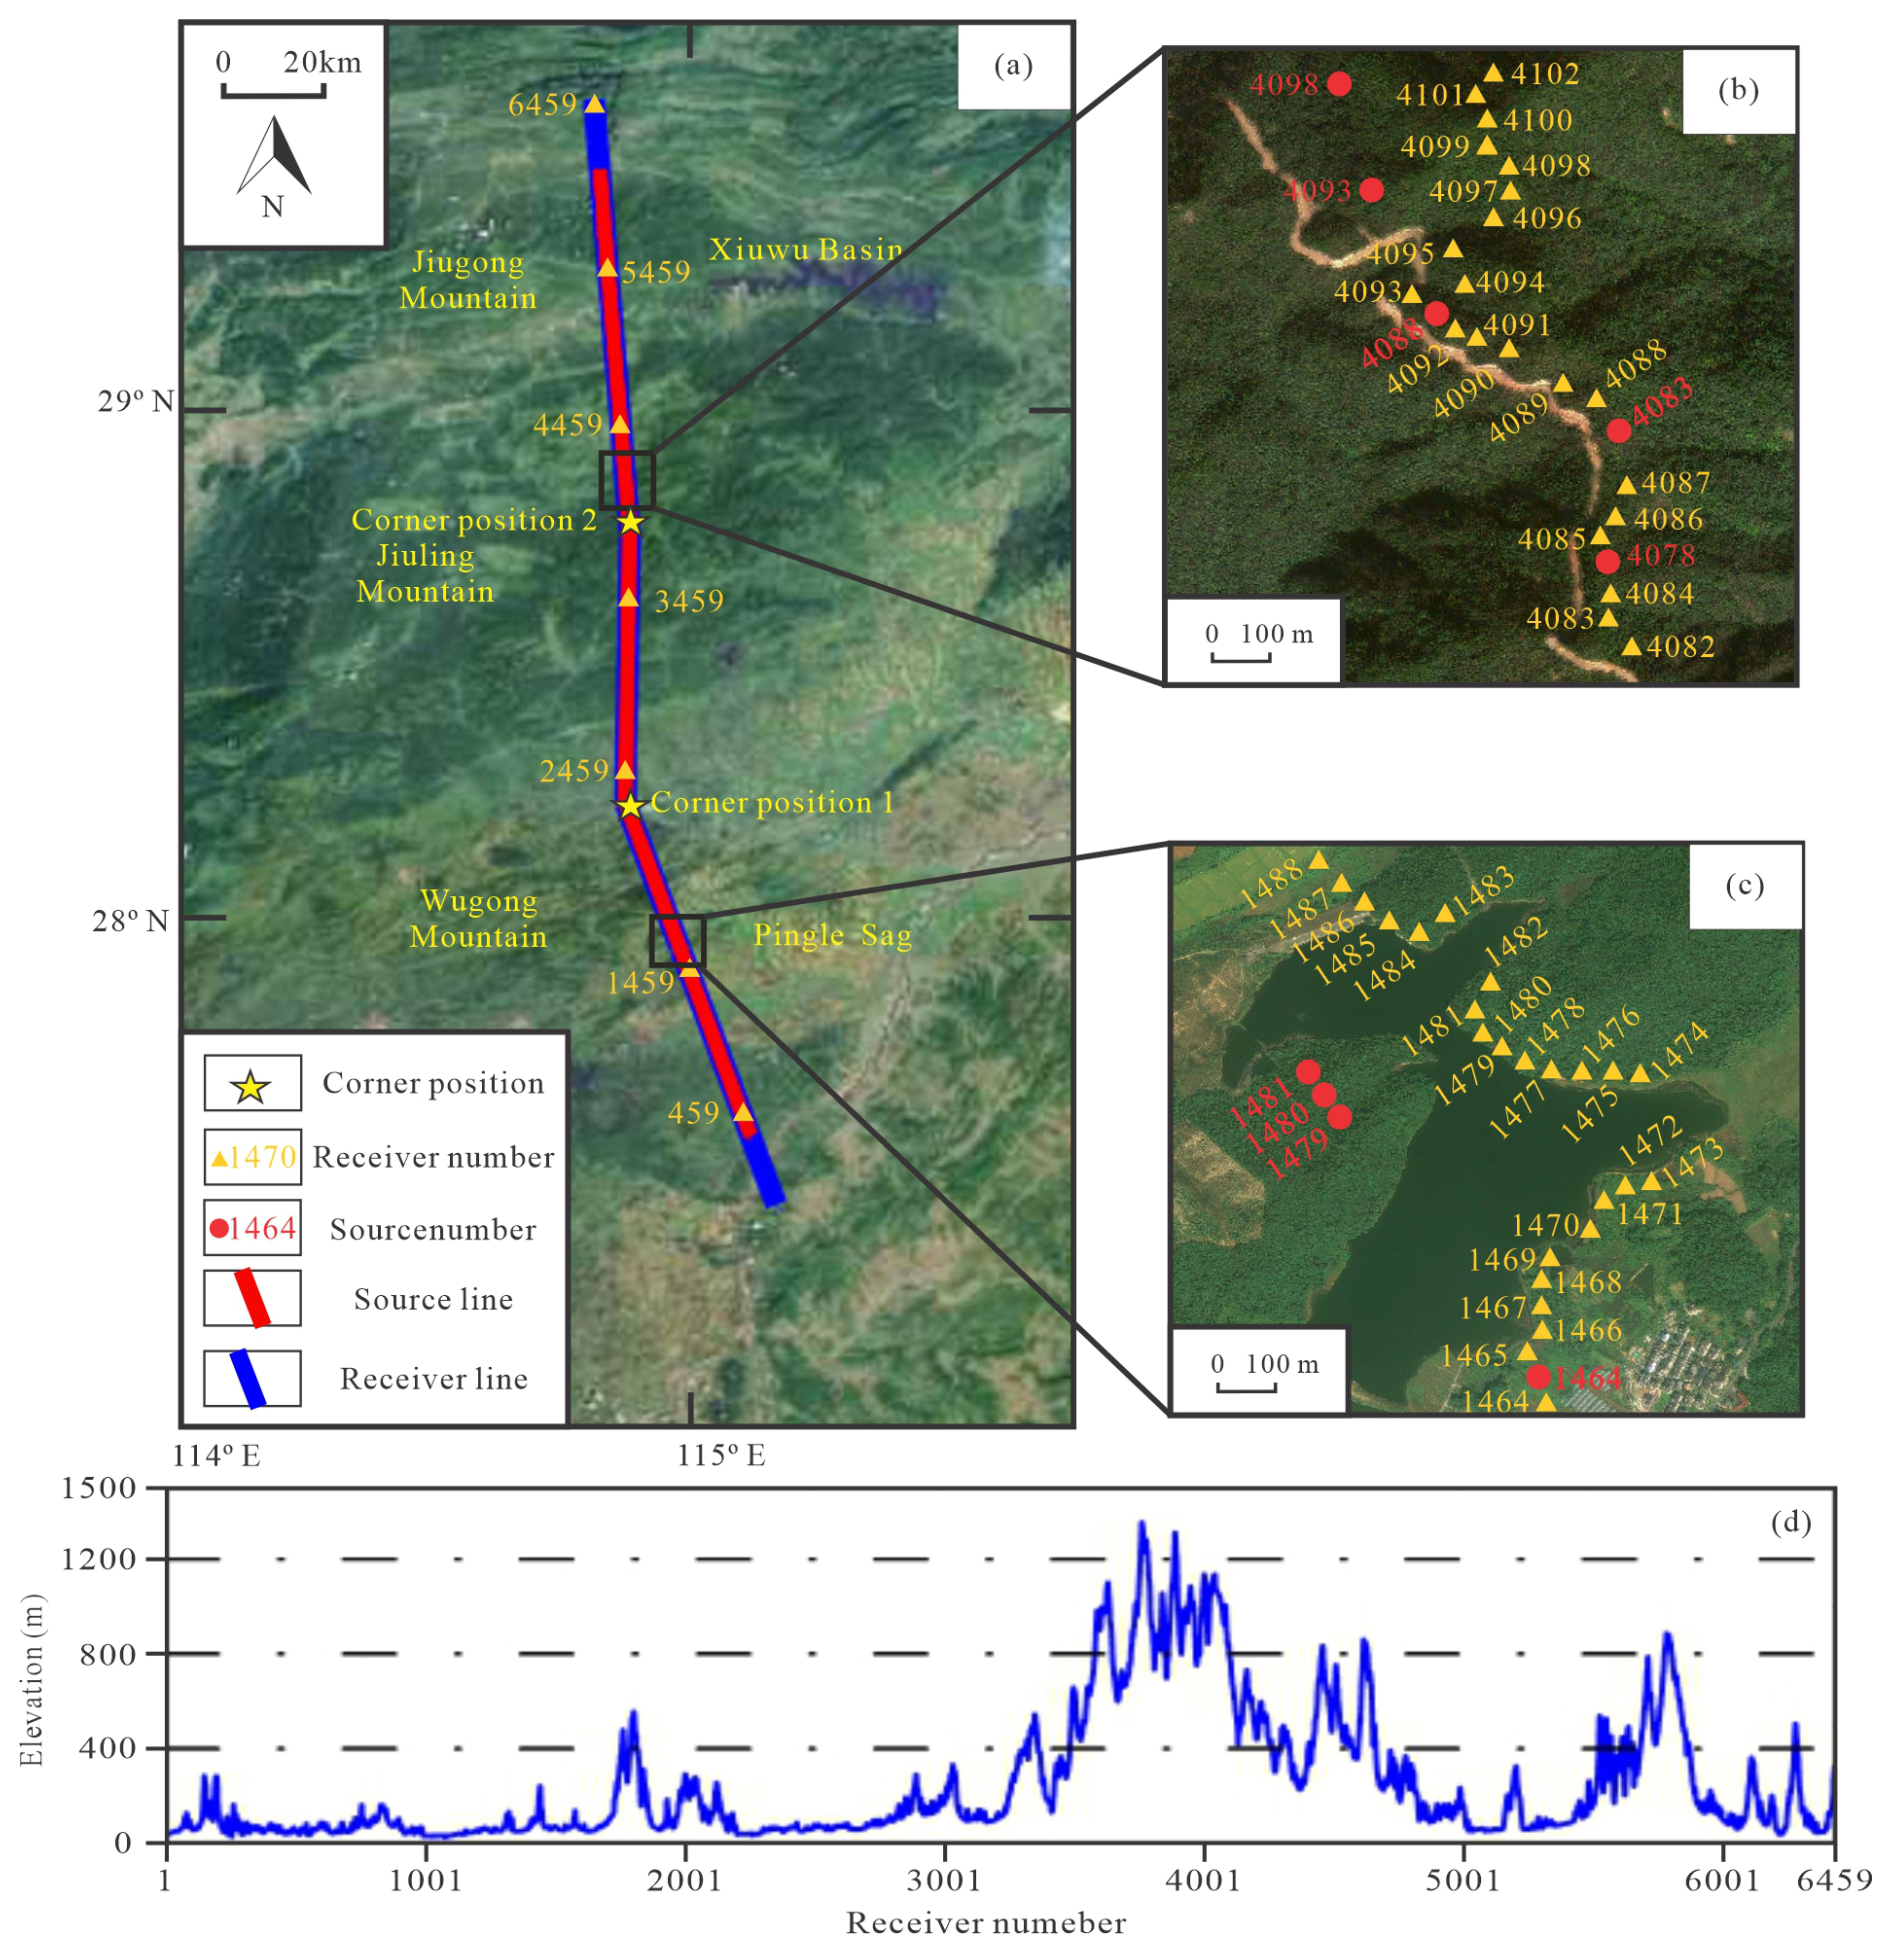
Figure 2Deep reflection survey line location map (a), local maps (b, c), and elevation map (d) (from 91weitu Maps).
The present tectonic framework of the JOB since the Middle-Late Jurassic was formed under the combined effects of the Paleo-Pacific tectonic and intra-continental deep-seated structures, which is specifically manifested by the development of regional deep-seated faults and the presence of uplifted and depressed blocks segmented by these faults (Liu et al., 2022). The JOB has been shaped by multi-phase tectonism, resulting in a series of fault systems with distinct structural characteristics. The dominant faults in this region include the Pingxiang-Guangfeng Fault and the Yifeng-Jingdezhenn Fault. The Pingxiang-Guangfeng Fault is part of the Jiangshao Fault, which is the southern boundary of the JOB (Sun et al., 2018; Yao et al., 2019; Luo et al., 2022).
The survey line of the Wuning-Ji'an section is part of the middle segment of the JOB. It extends 200 km, starting from Jiugong Mountain Upheaval in the north, passing through the Xiushui-Wuning Basin, Jiuling Upheaval, Pingle Depression, and Wugongshan Upheaval in the south (Fig. 2) (Liu et al., 2022). The terrain along the survey line is characterized by a high northern section and a low southern section. The north of the survey line passes through Jiuling Mountain and Jiugong Mountain, which are mountainous regions with steep peaks, cliffs, and large lateral fluctuations, resulting in significant stratigraphic deformation. The relative elevation difference of Jiuling Mountain is 1000 m, with slopes generally greater than 45°. The south of Jiuling Mountain is a typical plain and hilly area with densely distributed towns, villages, and factories, and convenient transportation. These surface conditions posed challenges: the mountainous northern section made it difficult to deploy a drilling rig and shots, while the densely developed southern section required modifications to the observation system.
The Sercel Lite 428 and the 20DX-10 Hz geophones were used for field seismic data acquisition, and a single group of 12 geophones was combined to receive seismic signals. The 20–24 kg shots were spaced at 200 m and performed in wells at depths of 20–30 m. The receivers were spaced at 40 m, totaling 800 channels with a full fold of 80. The trace spacing in a 12 km section of only the Xiuwu Basin was 20 m, and the shot spacing and maximum offset were unchanged. Data were recorded with a 1 ms sampling interval over a 30 s record length. The survey line is crooked, it has two major corner points with angles of 19° (corner position 1) and 4° (corner position 2). Although information such as satellite remote sensing, GIS information, and geological reconnaissance was comprehensively referred to in the design of the positions of the shots and receivers, the actual distribution of the shots and receivers still showed great irregularity and sparsity.
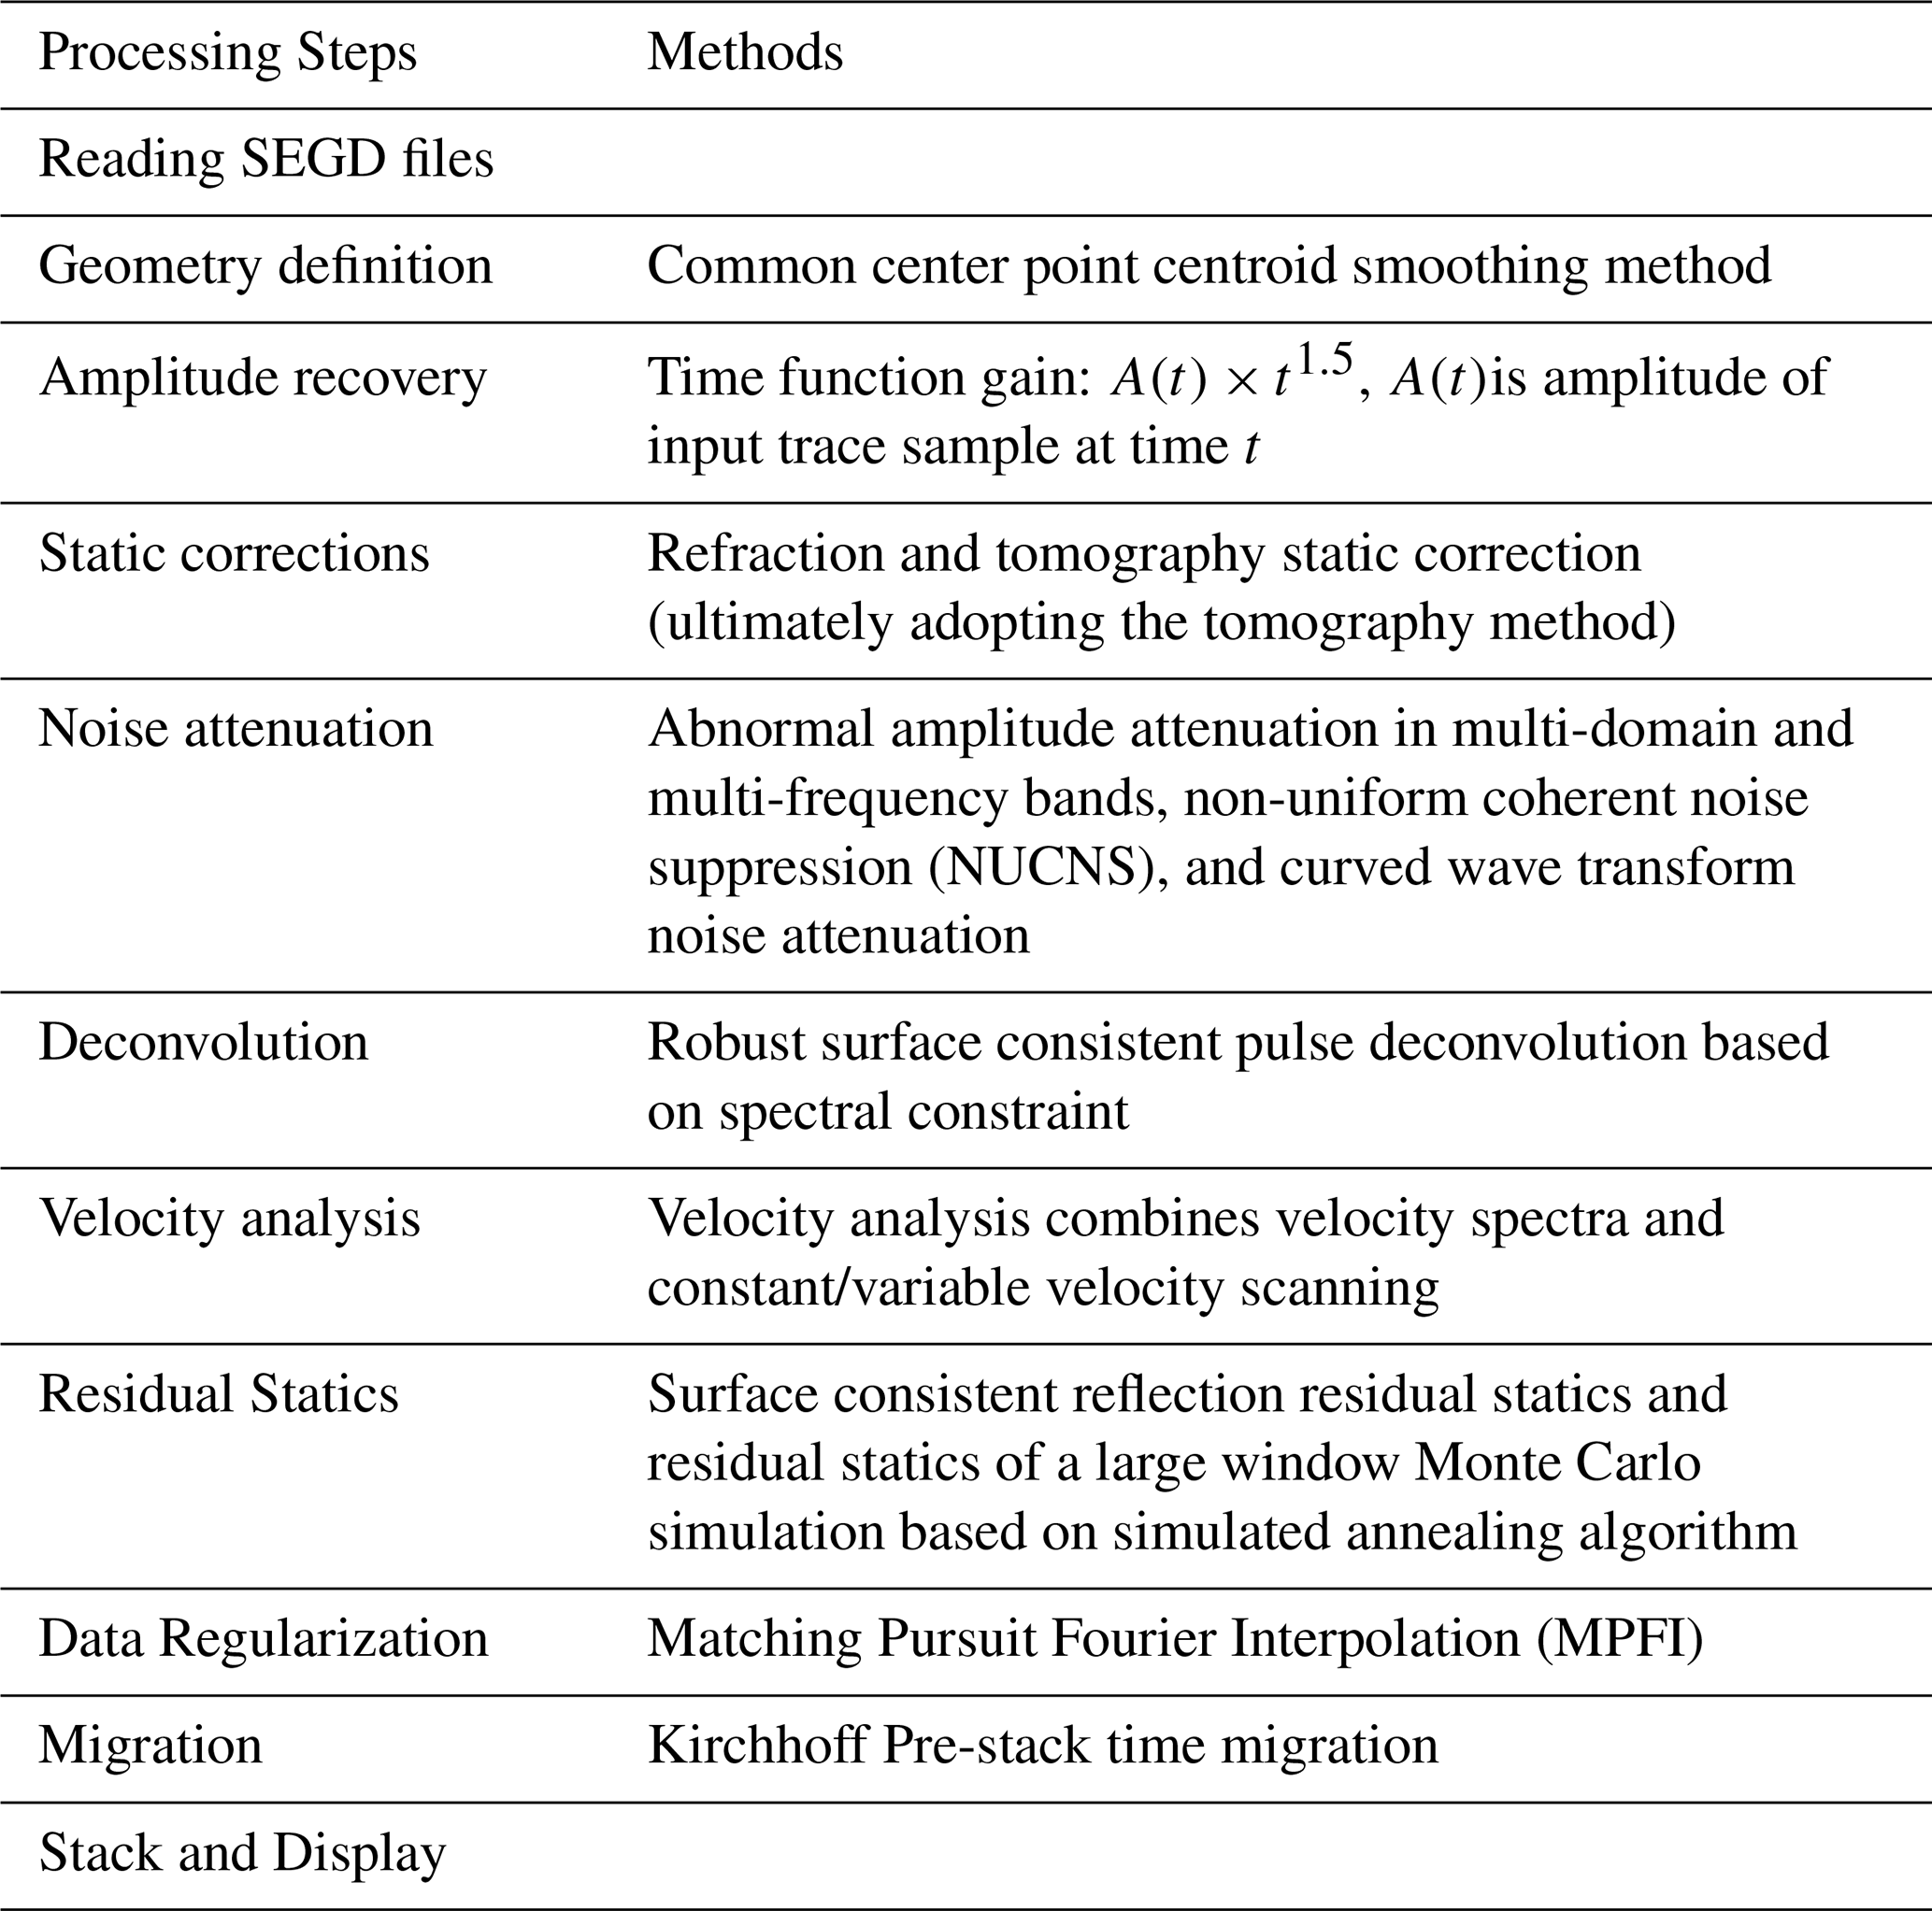
The primary goal of deep seismic reflection exploration is to reveal complex underground tectonic structures. Generally, near-surface conditions in these target areas are highly complex. The targets of exploration are located 30–100 km beneath the surface or even deeper, making seismic wave propagation paths considerably long and wave fields extremely complex. Field acquisition for deep seismic reflection is primarily conducted along 2D survey lines. This typically involves long arrays with large offsets, ranging from 16–20 km, and offsets for larger shots can extend up to 50 km. Receivers spacing is relatively large, generally 40–50 m, while shot spacing is typically 200–300 m. The distribution of the shots and the receivers is irregular. The acquired data often exhibit inconsistent amplitude energy and weak effective reflection energy. Moreover, significantly high-frequency attenuation of deeper signals coupled with the pervasive presence of background noise results in a low S N. Therefore, it is necessary to adopt targeted processing technology for deep seismic reflection data. In this study, targeted processing was applied to a 2D deep seismic reflection data located in the middle segment of the JOB (Wuning-Ji'an section). Table 1 outlines the main processing steps employed in this work.
3.1 Geometry Definition
In a regular 2D linear seismic observation system, the spacing between shots and receivers is uniform. They are deployed along a straight line. Consequently, the locations of common midpoints (CMP) converge into cell centers of linear observation system. However, the deep seismic reflection survey line in this study was deployed using crooked lines with two main corner positions, and the shot and receiver distribution was irregular. These resulted in the dispersion of CMP, forming a planar distribution. Therefore, the CMP gathers represent reflection surfaces in the subsurface rather than reflection points. As shown in Fig. 3, yellow marks the receivers, red marks the shots, and black indicates the dispersed CMP. While defining a crooked line observation system does not directly reduce the dispersion of CMP, suitable cell center positions can effectively attenuate CMP dispersion effects. The cell center positions for the crooked-line observation system were determined using the Common center point centroid smoothing method to completely solve this problem. Initially, cell center positions were established based on a fixed CMP spacing, typically half the receiver spacing. Next, the centroid of the CMP near each initial cell center position was calculated, and the centroid positions were smoothed according to a specified scale, resulting in a crooked line. Finally, the appropriate starting position for the cell center was selected, typically the midpoint between the shot and the receiver. The final cell center positions were then determined along the crooked line using equal CMP spacing (as shown in purple in Fig. 3). This method ensured that the CMP strike was aligned along the survey line, better representing the distribution of CMP and the actual position of subsurface reflections.
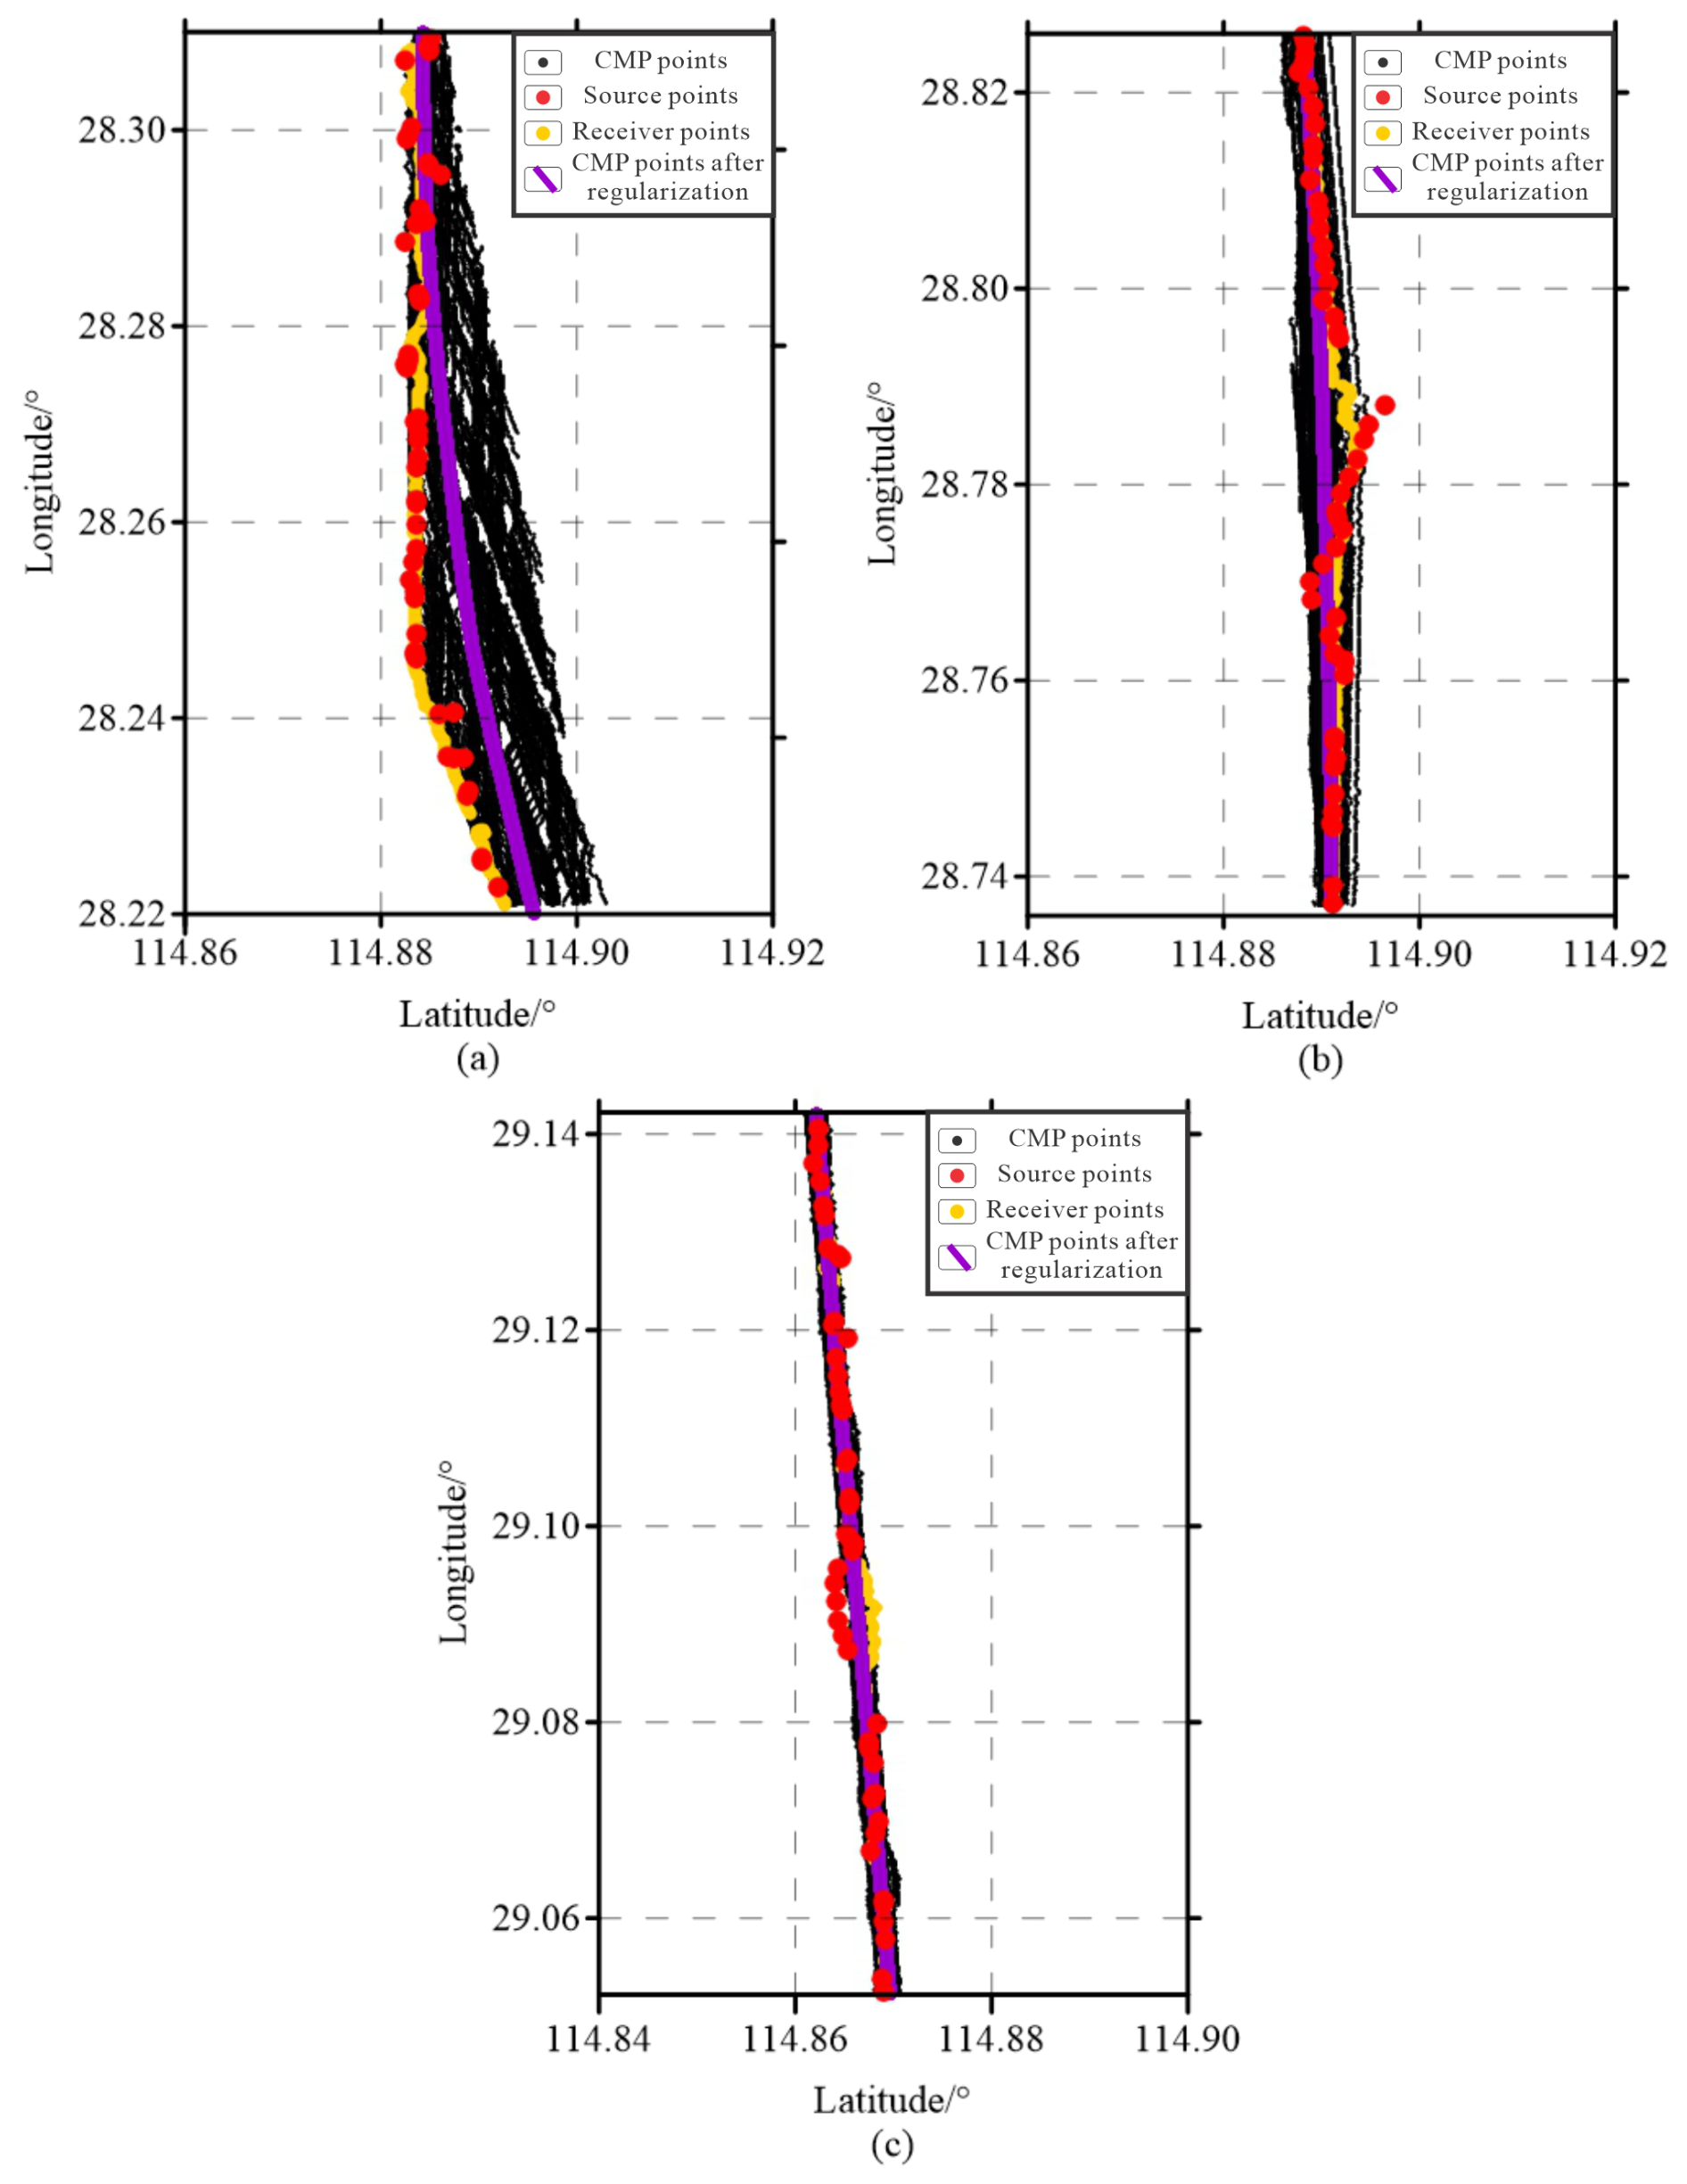
Figure 3Crooked line geometry definition. (a) Corner position 1, (b) corner position 2, (c) linear position 3.
3.2 Static Correction
Static corrections are very important in land data processing because they improved quality in subsequent processing steps and enhanced the resolution of the seismic image of geological structures. P-wave velocity tomography inversion is employed to derive the near-surface velocity structure using the first-arrival wave travel times from deep seismic reflection. The method has been extensively applied in both oil exploration and deep seismic reflection data processing, owing to its ability to provide high-resolution models of complex near-surface conditions (Zhu et al., 2014; Gonçalves and Garabito, 2021). Both delay-time refraction static correction and refraction tomography static correction methods were tested to evaluate the effectiveness of tomography static correction (as shown in Fig. 4). The delay-time refraction static correction is a traditional method for simple layered media with fast computational speed and low resolution. We assumed three layers and utilized the full offset range of 0 to 16 000 m in this study. The parameters were selected including a final datum of 1500 m and a replacement velocity of 5000 m s−1. The refraction tomography method is an advanced inversion technique based on ray tracing, formulated as an iterative Gauss-Newton algorithm that minimizes the difference between observed travel times and those predicted by ray tracing through a velocity-depth model (Bishop et al., 1985). The results indicate that tomography static correction (Fig. 4c). outperform refraction static correction (Fig. 4b), particularly in regions characterized by significant surface elevation variability. Based on these findings, tomography static correction was selected for further application in this study. The method addressed medium short and long wavelength static anomalies caused by near-surface irregularities. It effectively corrected distortions in first-arrival times and in-phase axes, which were critical for enhancing the continuity and accuracy of seismic reflection data.
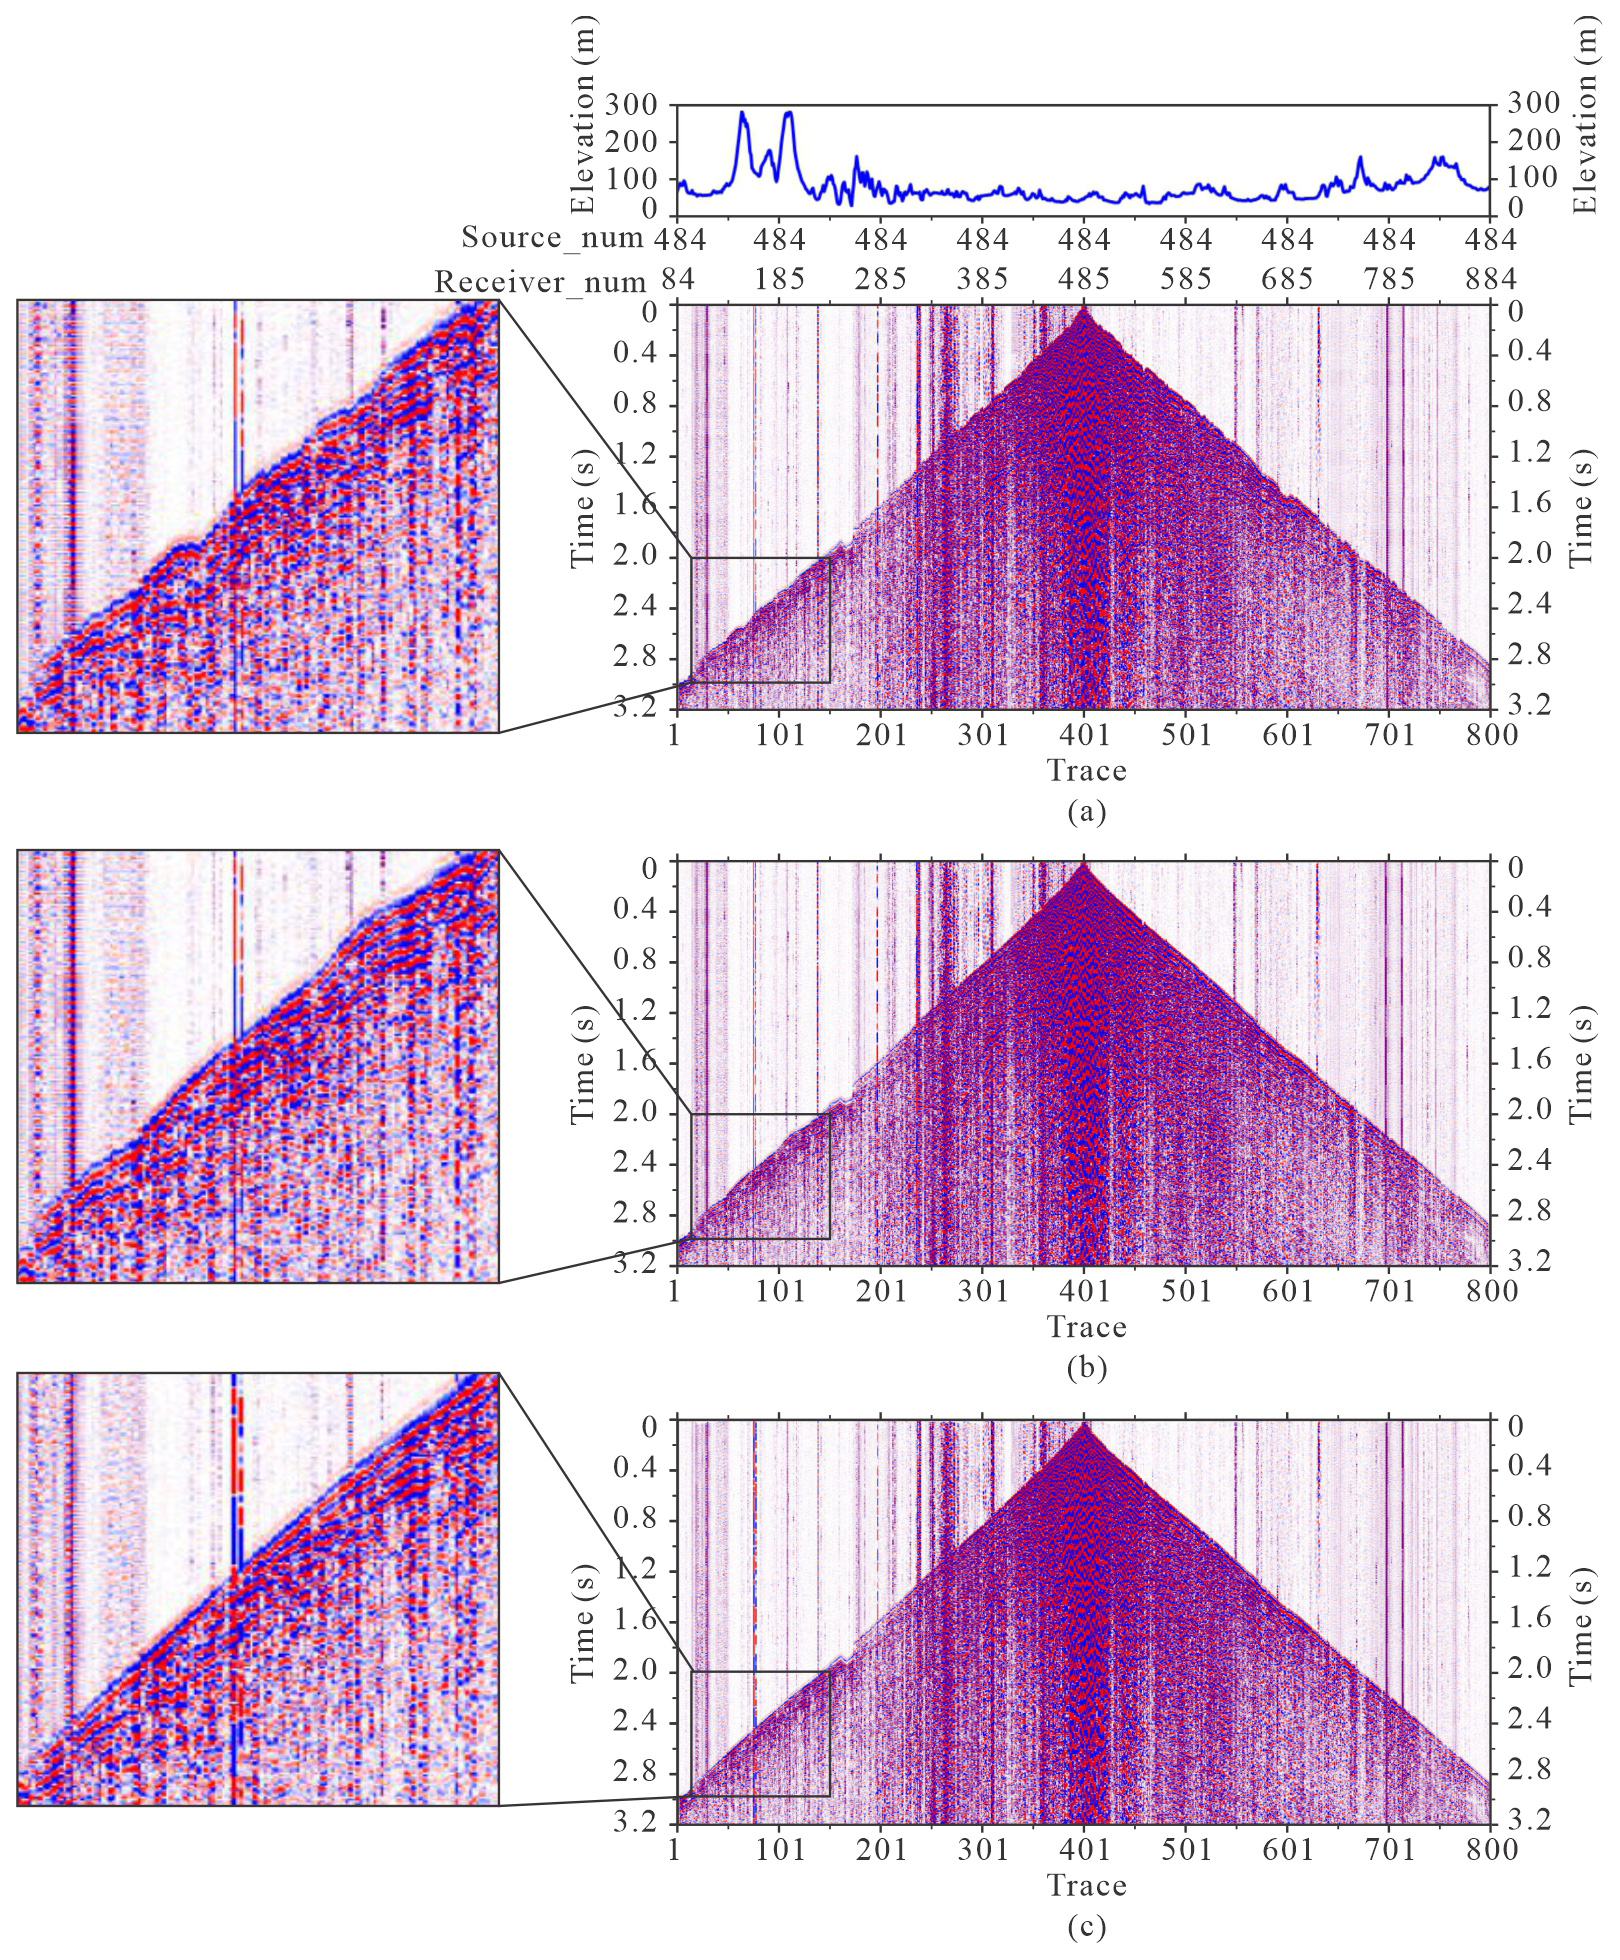
Figure 4The shot gathers before and after static correction. (a) The original shot gather, (b) the shot gather after refraction static, (c) the shot gather after tomography static
3.3 Noise Attenuation
Deep seismic reflection data were affected by a variety of noise, including surface waves, linear interference, and background noise (Fig. 5a). A comprehensive multi-step noise attenuation approach was employed to mitigate these noise components and enhance the quality of the data. First, amplitude attenuation was applied to abnormal signals in three domains: the shot domain, the receiver domain, and the CMP domain. This step focused on safeguarding the effective seismic signal while eliminating abnormal noise at boundaries. Specifically, the median energy was calculated by counting the amplitudes across multiple frequency bands within a specified time window. Amplitudes exceeding a predefined threshold in any frequency band were identified as abnormal noise and appropriately attenuated. Next, NUCNS that combines with the least-squares optimization method and F-X sector filter in the frequency domain, was used to suppress local coherent noise. For each receiver, a linear interference model was independently estimated within a specified velocity range, allowing for precise noise reduction tailored to local conditions. Finally, advanced analysis in the curvelet wave domain was conducted to differentiate between effective reflection waves and interference waves. This process involved decomposing seismic signals into 6 frequency bands, 50 angles, and the spatial domain to isolate and preserve effective wave information. As a result of these denoising processes, surface waves and other noise were significantly attenuated, improving S N. This enhancement not only facilitated clearer imaging but also ensured the data are well-prepared for subsequent processing (Fig. 5a, b). The power spectra before and after denoising (Fig. 5c, d) indicated that the strong low-frequency noise has been successfully attenuated. It was particularly pronounced within the shallow sections (time window: 0.5–6.5 s), as compared to the deep sections (time window: 5.5–11.5 s).
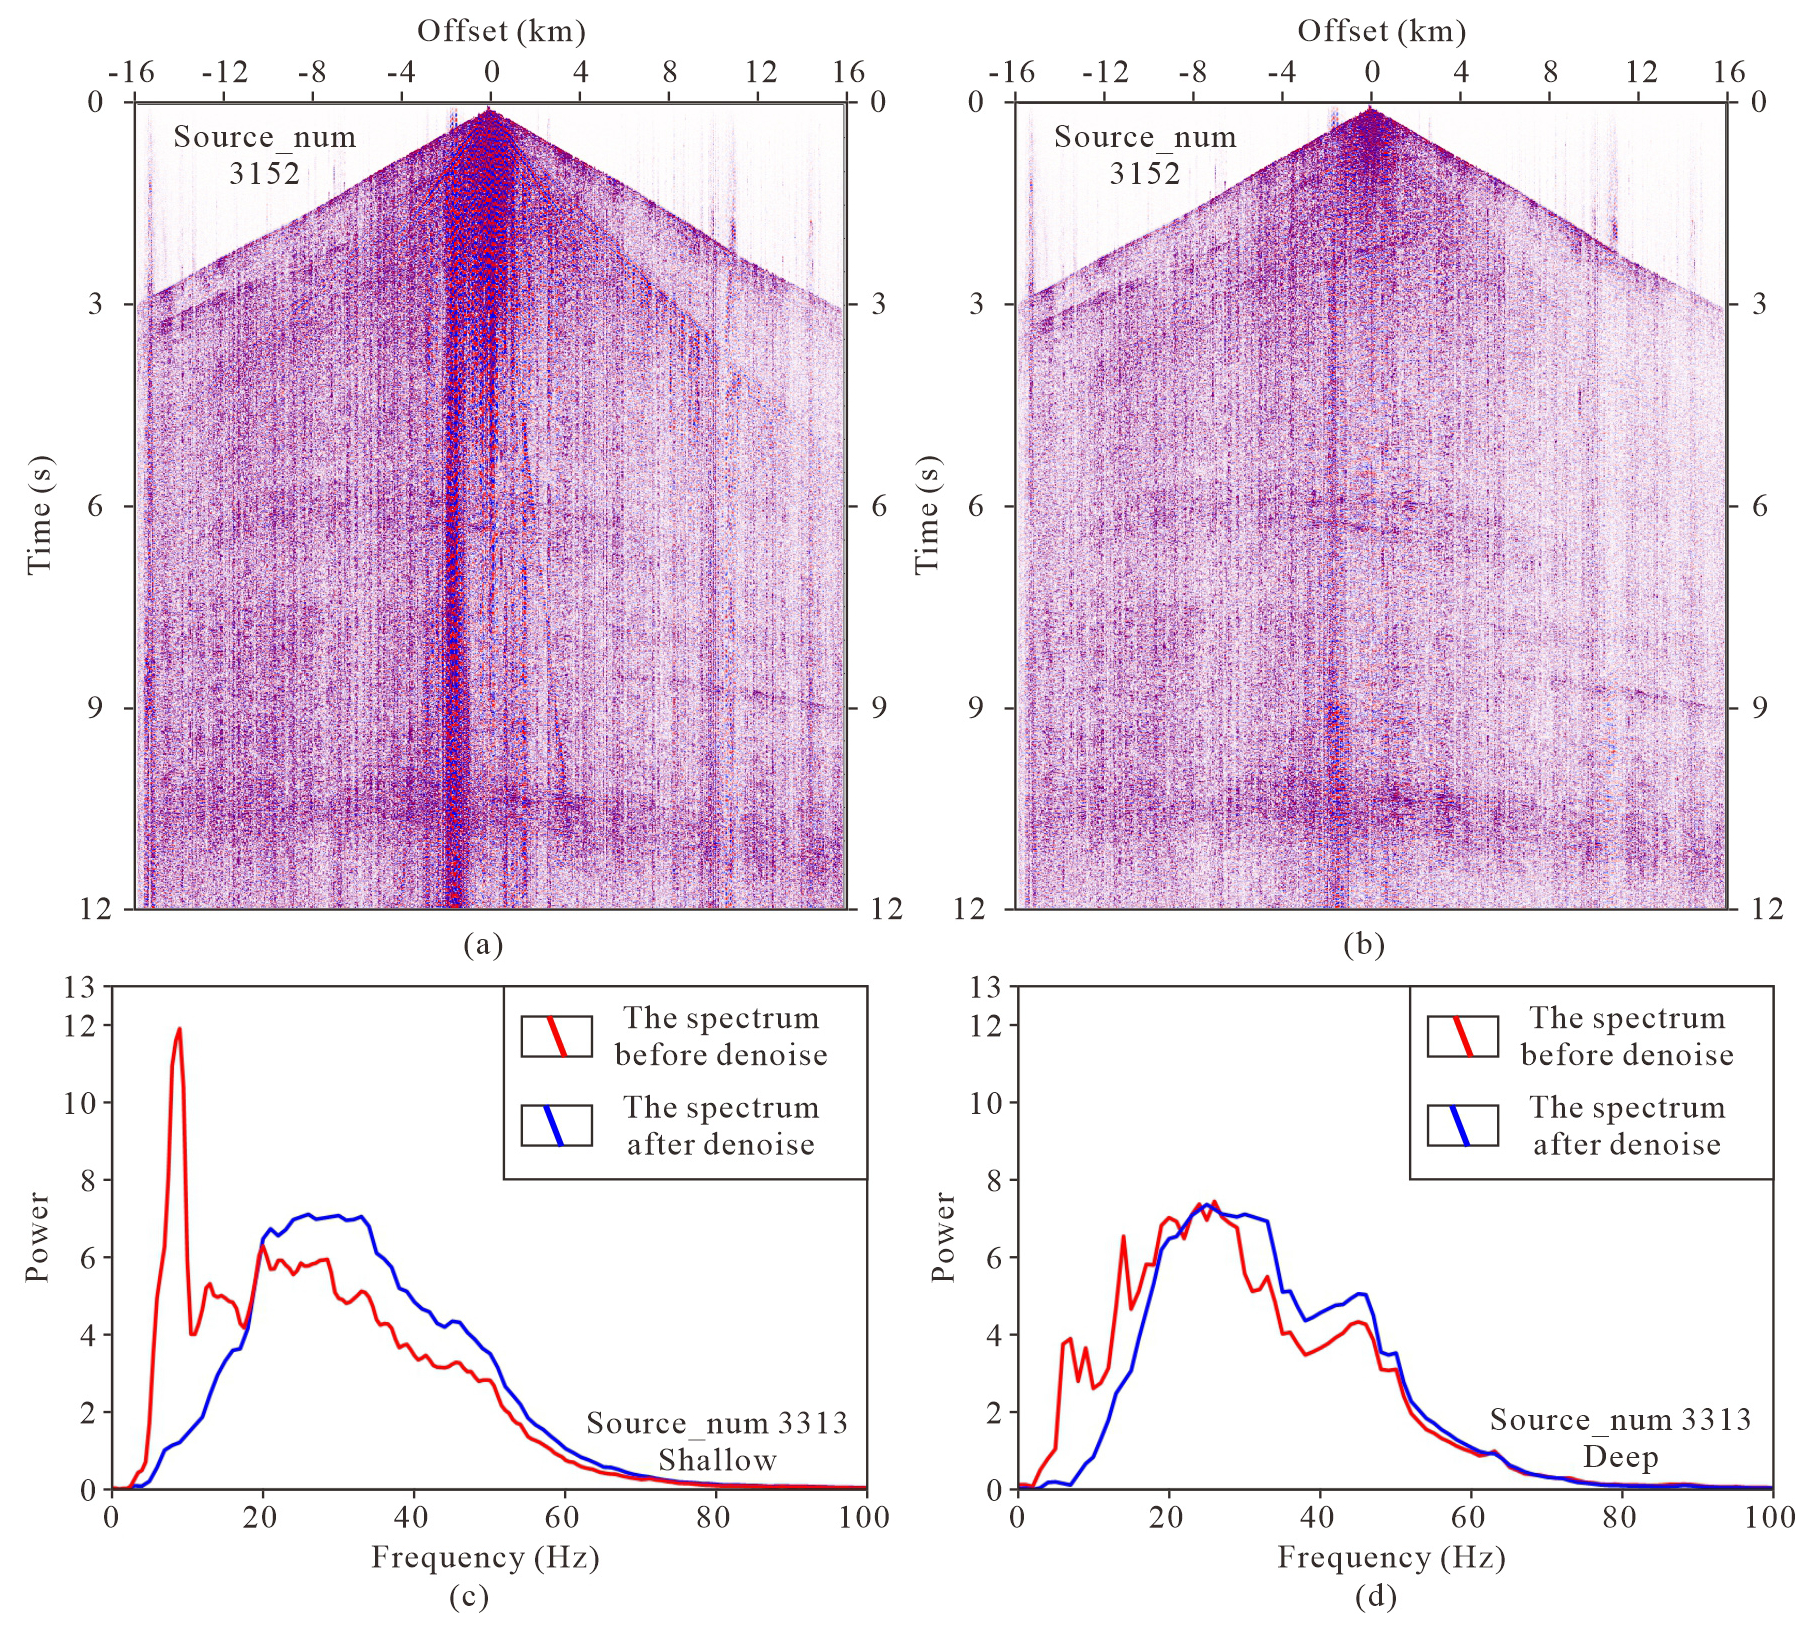
Figure 5The shot gathers before (a) and after (b) noise attenuation, the power spectra before and after noise atteunation in shallow (c) section and deep (d) sections.
3.4 Deconvolution and Residual Statics
The lateral heterogeneity of near-surface conditions, coupled with the variability introduced by excitation and reception factors, leads to significant differences in seismic data energy and wavelet consistency. Surface-inconsistent noise can cause phase instability, making it difficult for conventional deconvolution to yield satisfactory processing results (Zhuravko et al., 2015). This study employed robust surface-consistent deconvolution (RSCD) to mitigate such effects via a robust solver (Kirchheimer and Ferber, 2001; Hootman, 2011). The key parameters were set as follows: a predictive distance of 1 ms, an operator length of 240 ms, and a white noise percentage of 0.01. The robust solver can detect surface-inconsistent outlier spectra during the decomposition step and then reduce the weights of the affected traces. It is robust to strong outliers caused by inconsistent noise and generates unbiased results (Wang et al., 2014). Meanwhile, this method integrates an amplitude and phase-constrained signal processing workflow, which can simultaneously derive the surface-consistent amplitude compensation factor and deconvolution operator to provide relative amplitude-preserved data. Deep seismic reflection data often emphasize low-frequency information, which is critical for capturing the true response of deep strata (Taner and Koehler, 1981; Cary and Lorentz, 1993; Kazemi et al., 2016). We conducted power spectrum analysis of the data before and after deconvolution, which reveals an effective broadening of the frequency bandwidth – particularly in the low-frequency range, which is critical for deep seismic reflection data (Fig. 6e, f). With RSCD processing, not only was the issue of lateral surface amplitude inconsistency resolved (Fig. 6a–d), but the frequency bandwidth was also effectively broadened, especially achieving remarkable results in the low-frequency range. (Fig. 6e, f). The shallow and deep time window of spectra are 0.5–6.5 and 5.5–11.5 s.
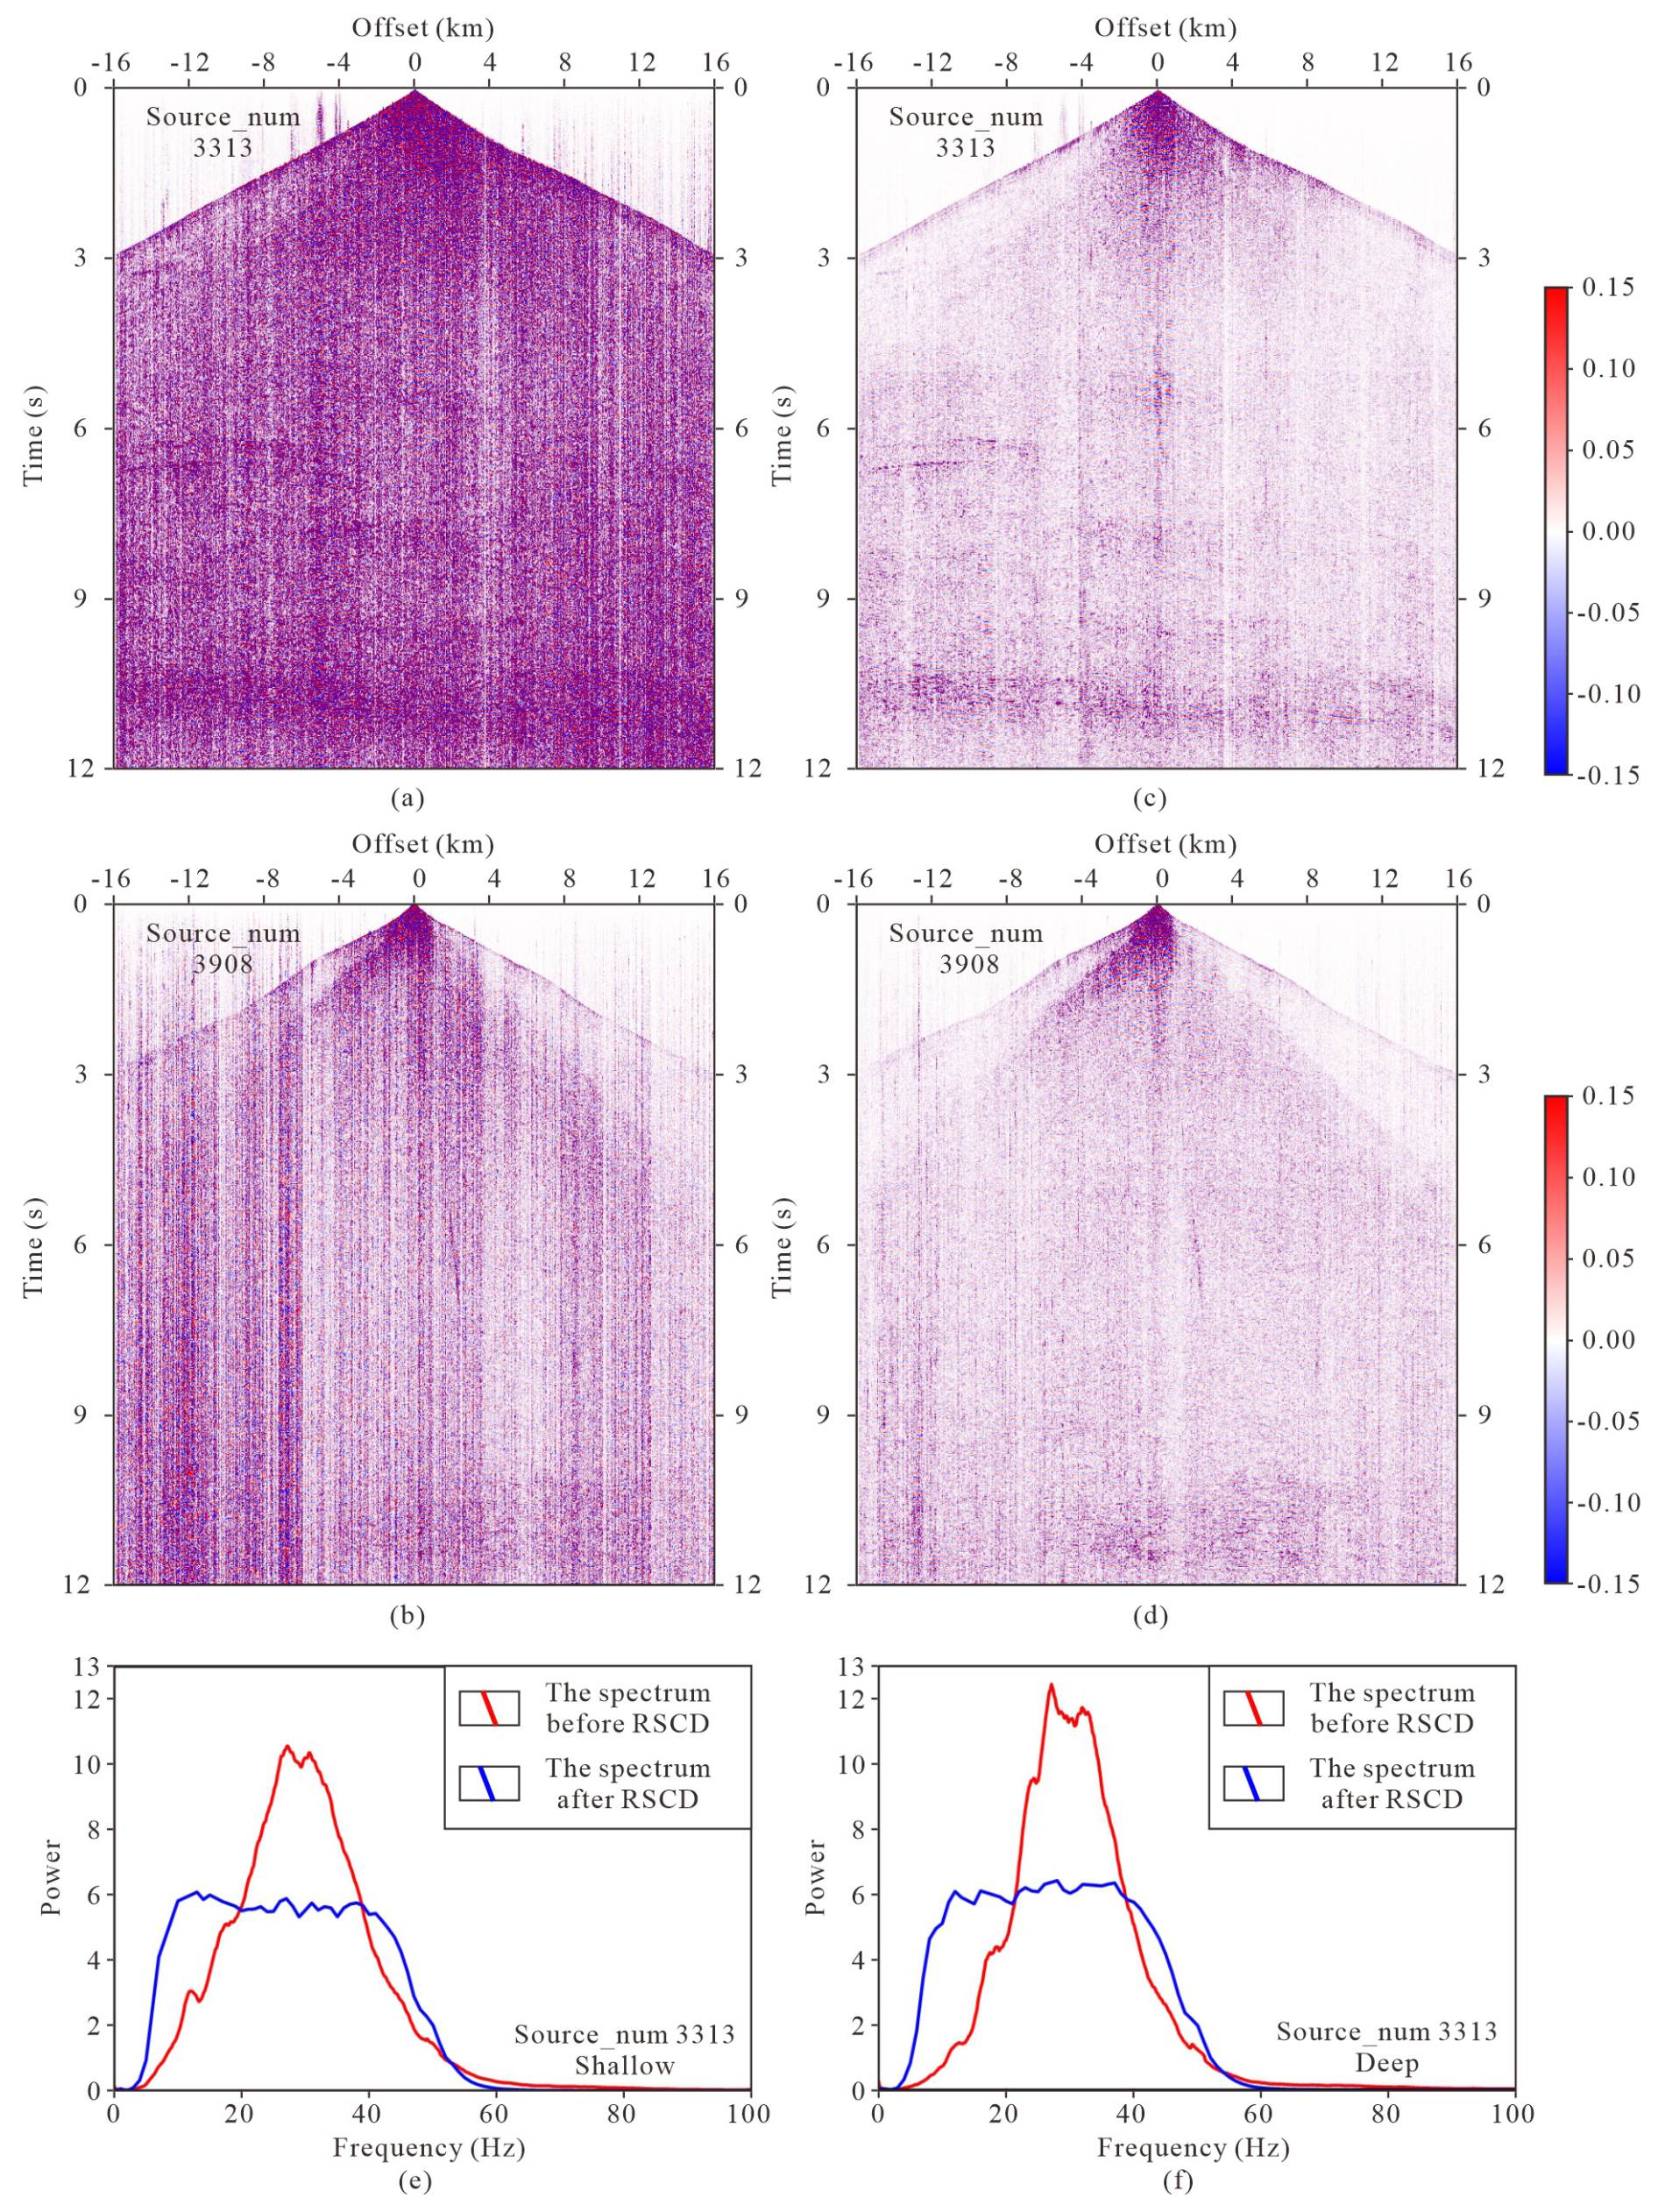
Figure 6The shot gathers before (a, b) and after (c, d) robust surface consistent deconvolution, the power spectra before and after RSCD in shallow (e) section and deep (f) sections.
Surface consistent reflection residual statics and residual statics of large window Monte Carlo simulation based on simulated annealing algorithm were utilized to solve the residual short-wave length statics after noise attenuation and surface consistent deconvolution. The residual static correction and velocity analysis were iterated 5 times. The final iteration residual statistics converged more than 95% in one sample, and the continuity of the reflection wave in the phase axis was improved. Furthermore, the stacking process benefited substantially from the modified statics.
The Matching Pursuit Fourier Interpolation (MPFI) is a frequency-domain method that employs Fourier transforms as the dictionary or basis functions. The data are transformed from the space-time domain to the space-frequency domain by fast Fourier transform (FFT) (Schonewille et al., 2013). This approach enables the decomposition and analysis of seismic signals in the frequency domain, effectively extracting characteristic information from the reflection signal. The conventional MPFI algorithm iterates over irregular seismic data multiple times, redistributing leaked energy from other Fourier coefficients back to the original ones. If aliasing energy exceeds effective wave energy, it may be incorrectly chosen as the best atom, thereby affecting the interpolation result. To address this issue, the energy at various dips in the low-frequency band of seismic signals is calculated and used these values as weights (prior value) for the Fourier spectrum of the high-frequency band. Higher weights are assigned to genuine seismic signals, while lower weights are given to alias frequency signals (Fig. 7). Consequently, alias frequency energy exceeding real signal energy is not erroneously selected as the maximum in each iteration, effectively eliminating spatial alias frequencies (Schonewille et al., 2013). The specific steps of the algorithm are as follows:
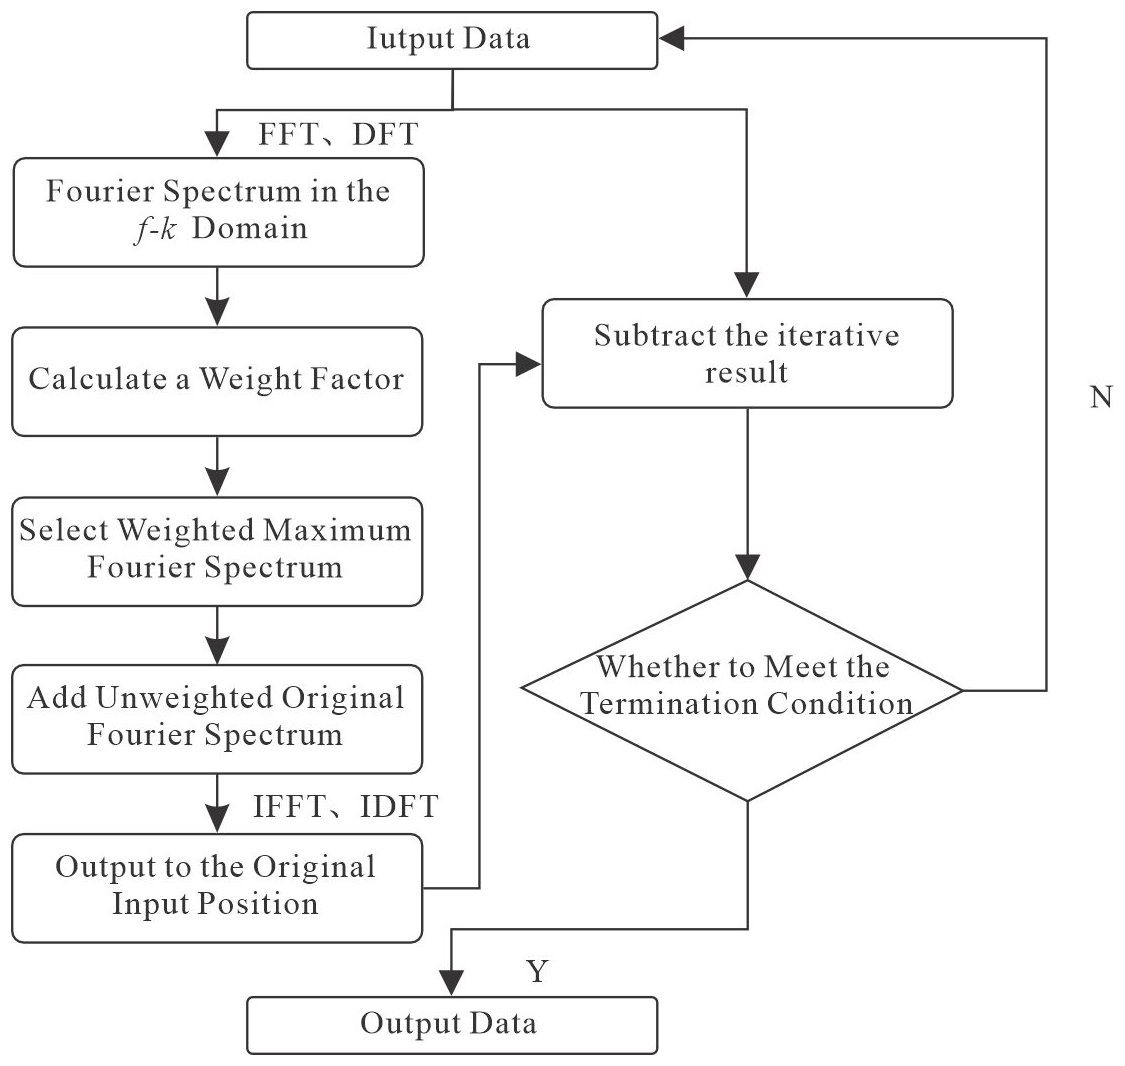
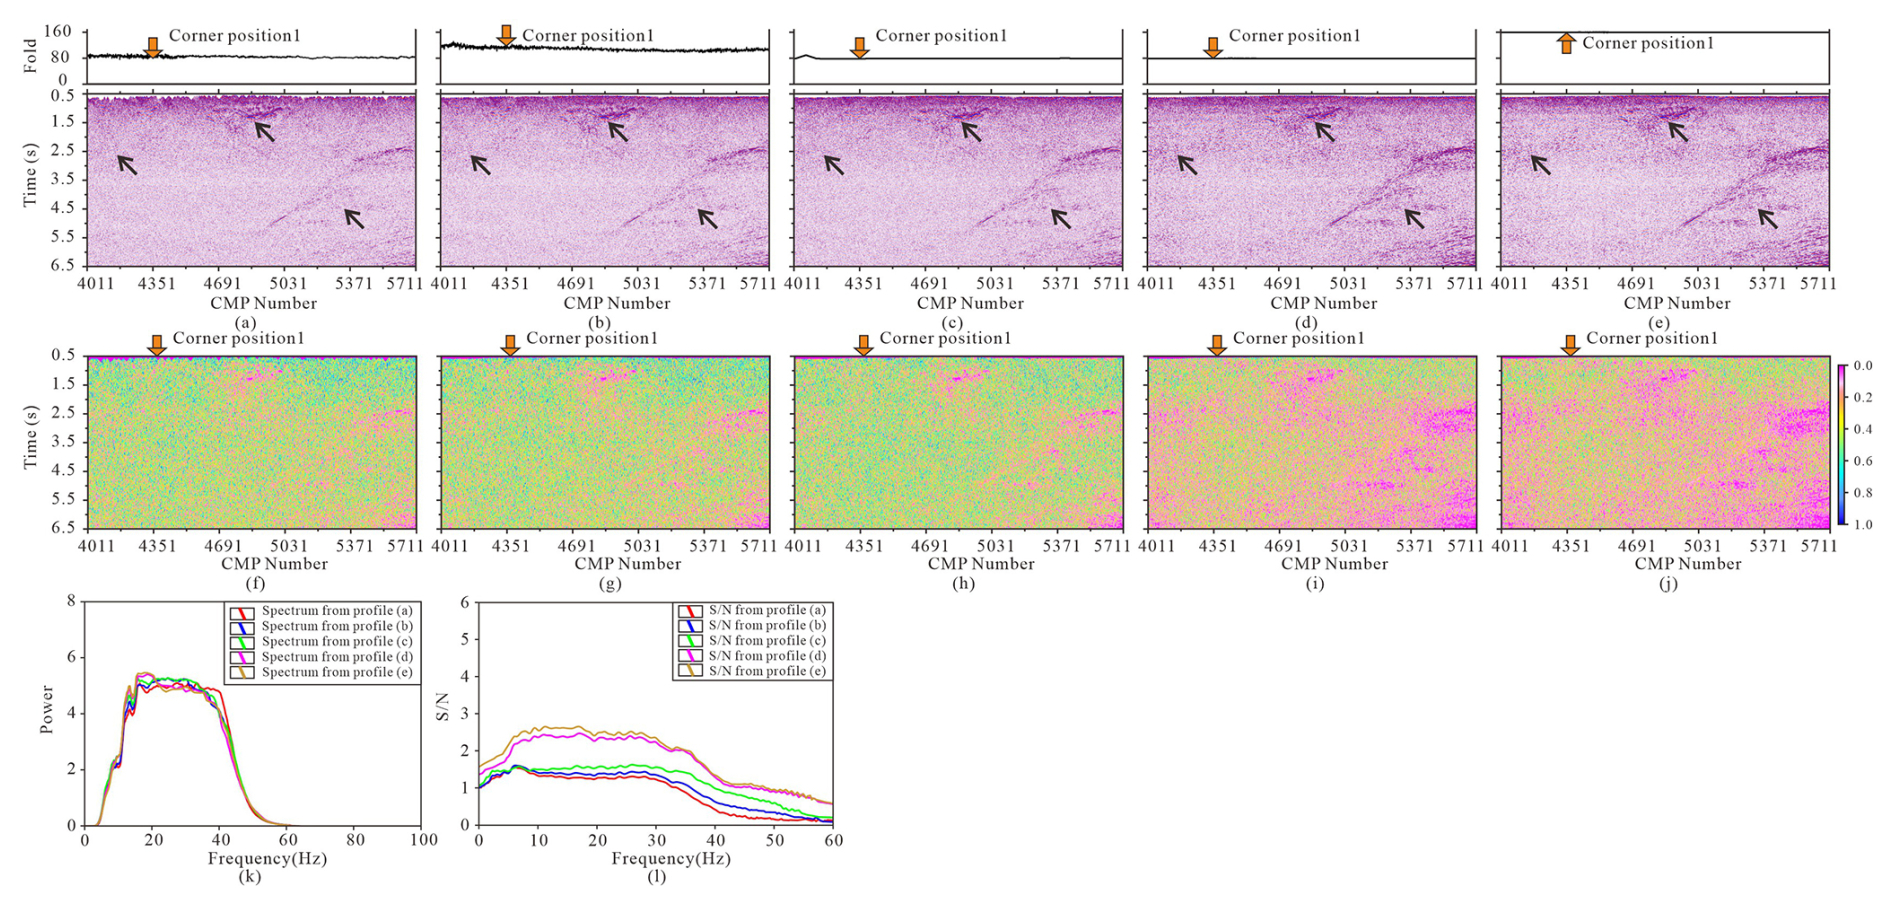
Figure 8(a) The shallow stack profile without migration before regularization, (b) the shallow stack profile without migration after infilling gaps in the offset domain, (c) the shallow stack profile without migration after full regularization in the offset domain, (d) the shallow stack profile without migration after regularization in the shot domain, (e) the shallow stack profile without migration after regularization and infilling shot gathers in the shot domain, panels (f)–(j) are the variance attribute images derived from panels (a)–(e), (k) the power spectra from panels (a)–(e), (l) the S N estimation derived from panels (a)–(e). The black arrows indicate the obvious improvement areas, the orange arrows indicate corner position 1.
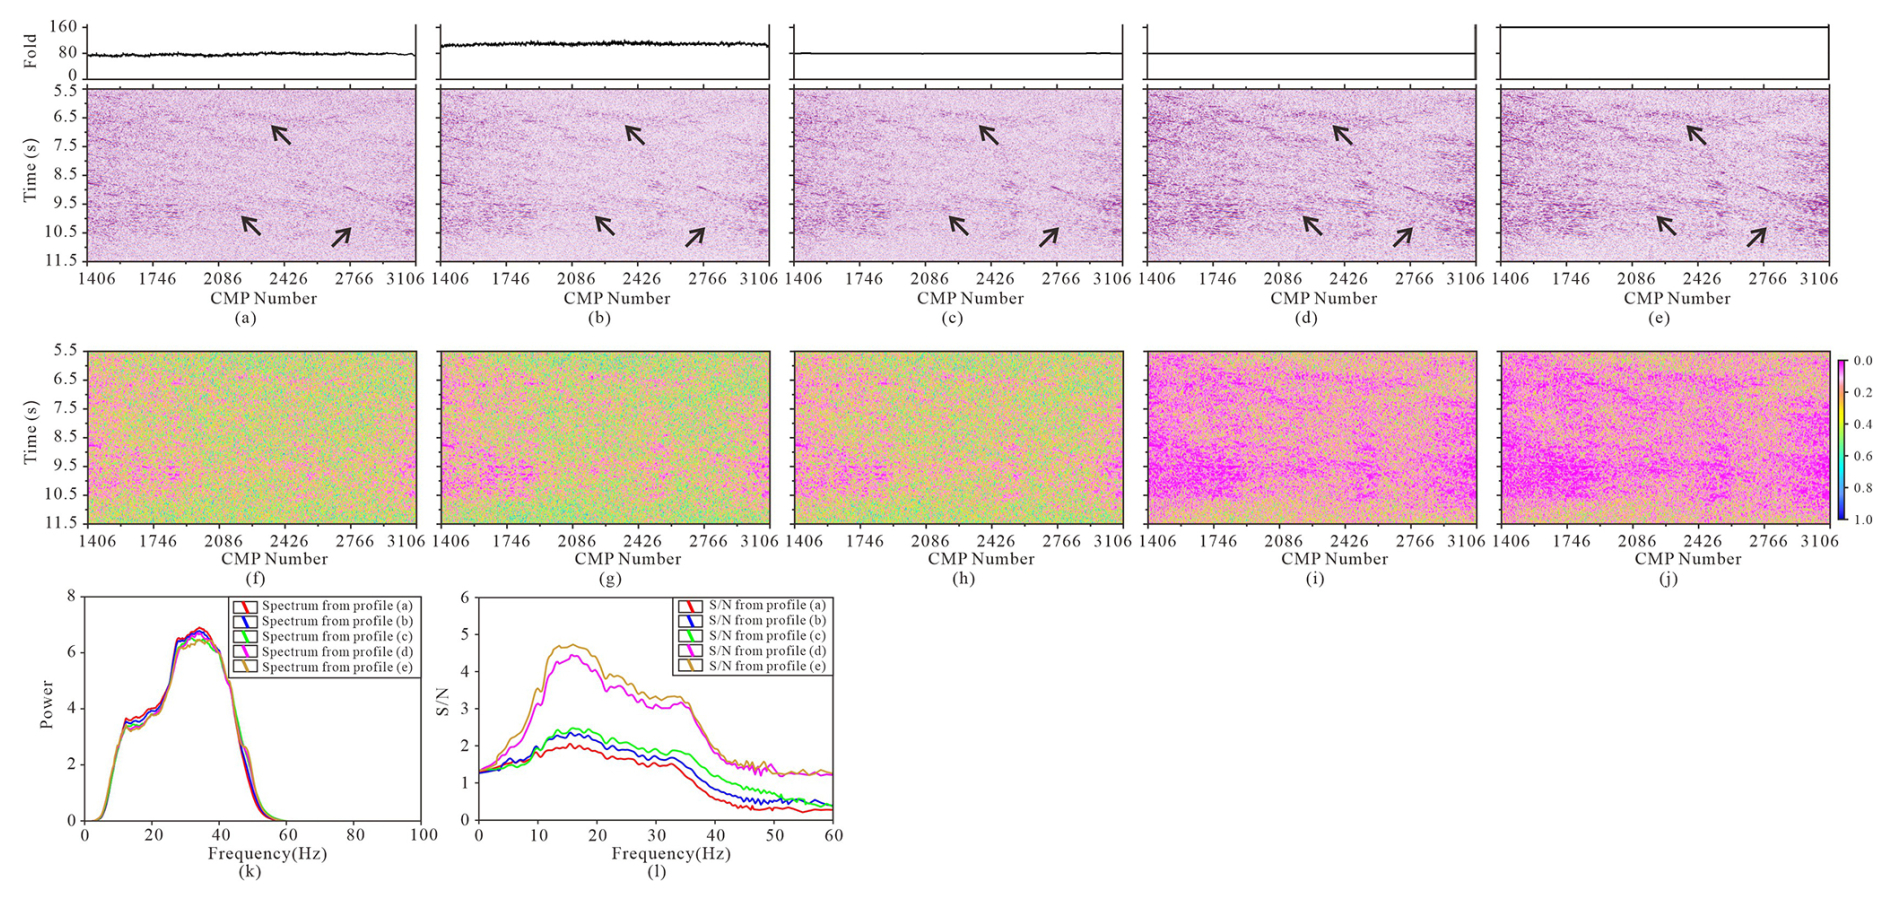
Figure 9(a) The deep stack profile without migration before regularization, (b) the deep stack profile without migration after infilling gaps in the offset domain, (c) the deep stack profile without migration after full regularization in the offset domain, (d) the deep stack profile without migration after regularization in the shot domain, (e) the deep stack profile without migration after regularization and infilling shot gathers in the shot domain, panels (f)–(j) are the variance attribute images derived from panels (a)–(e), (k) the power spectra from profiles (a)–(e), (l) the S N estimation derived from profiles (a)–(e). The black arrows indicate the obvious improvement areas.
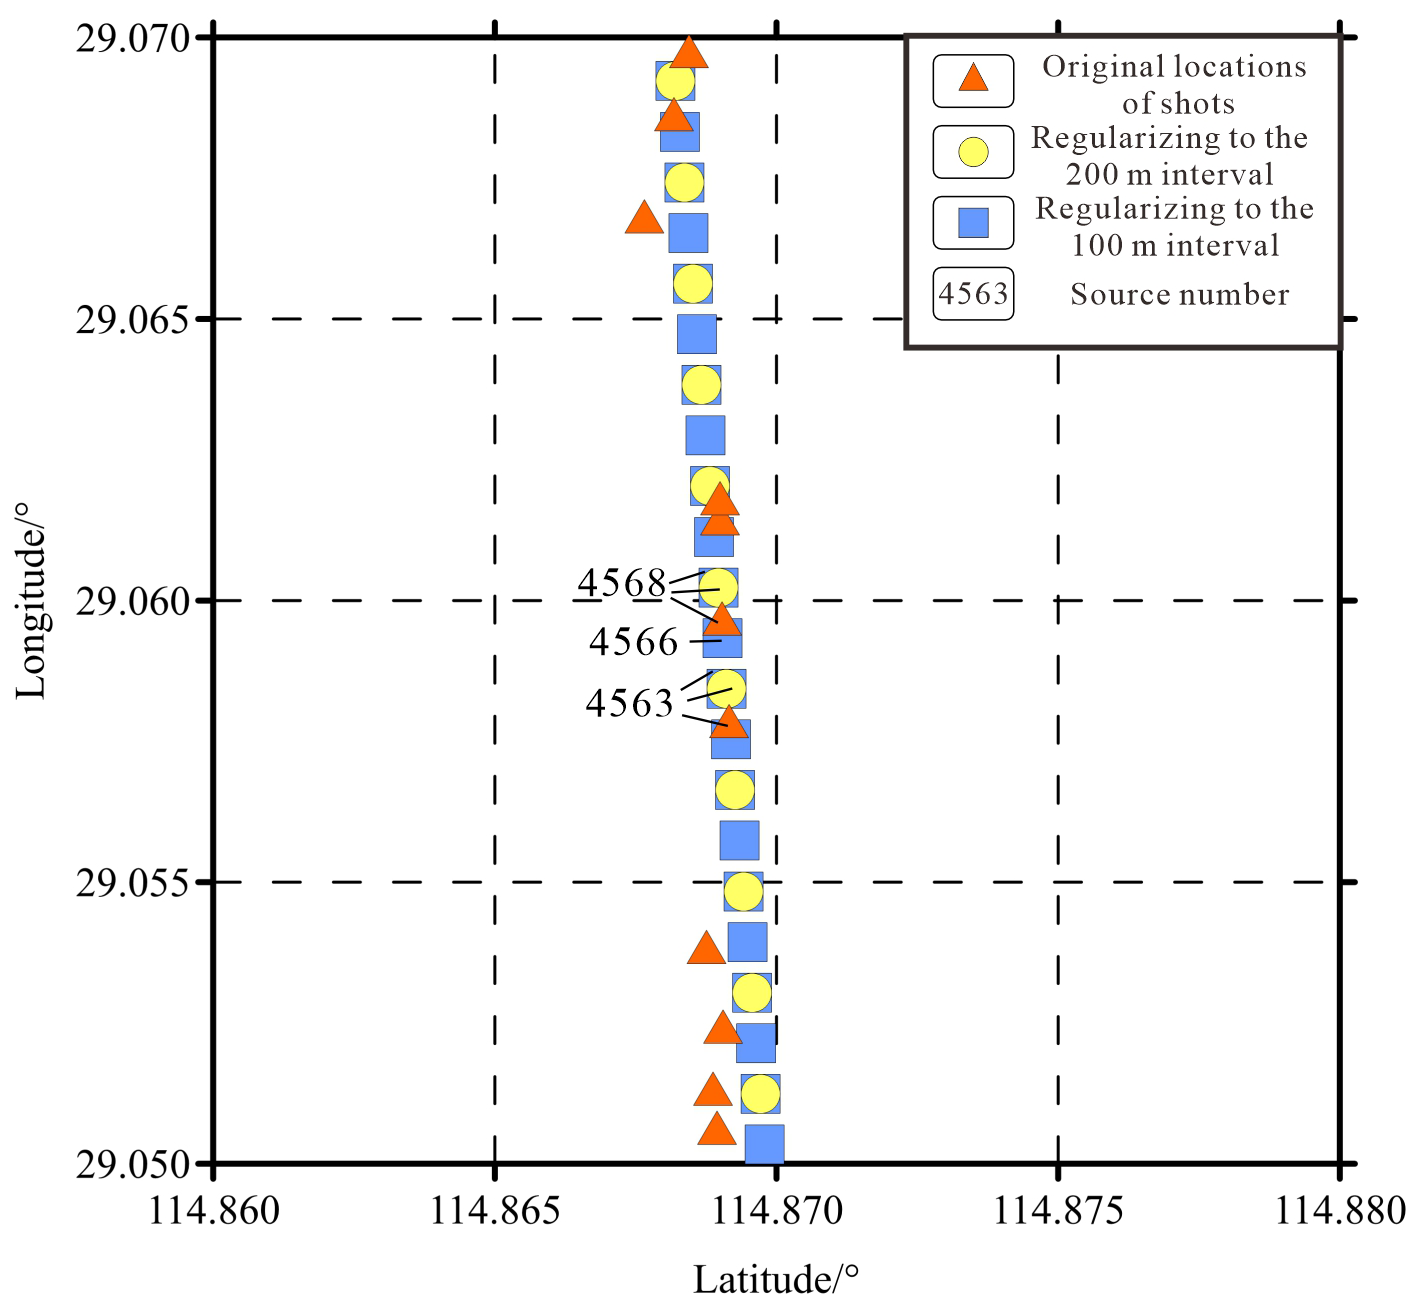
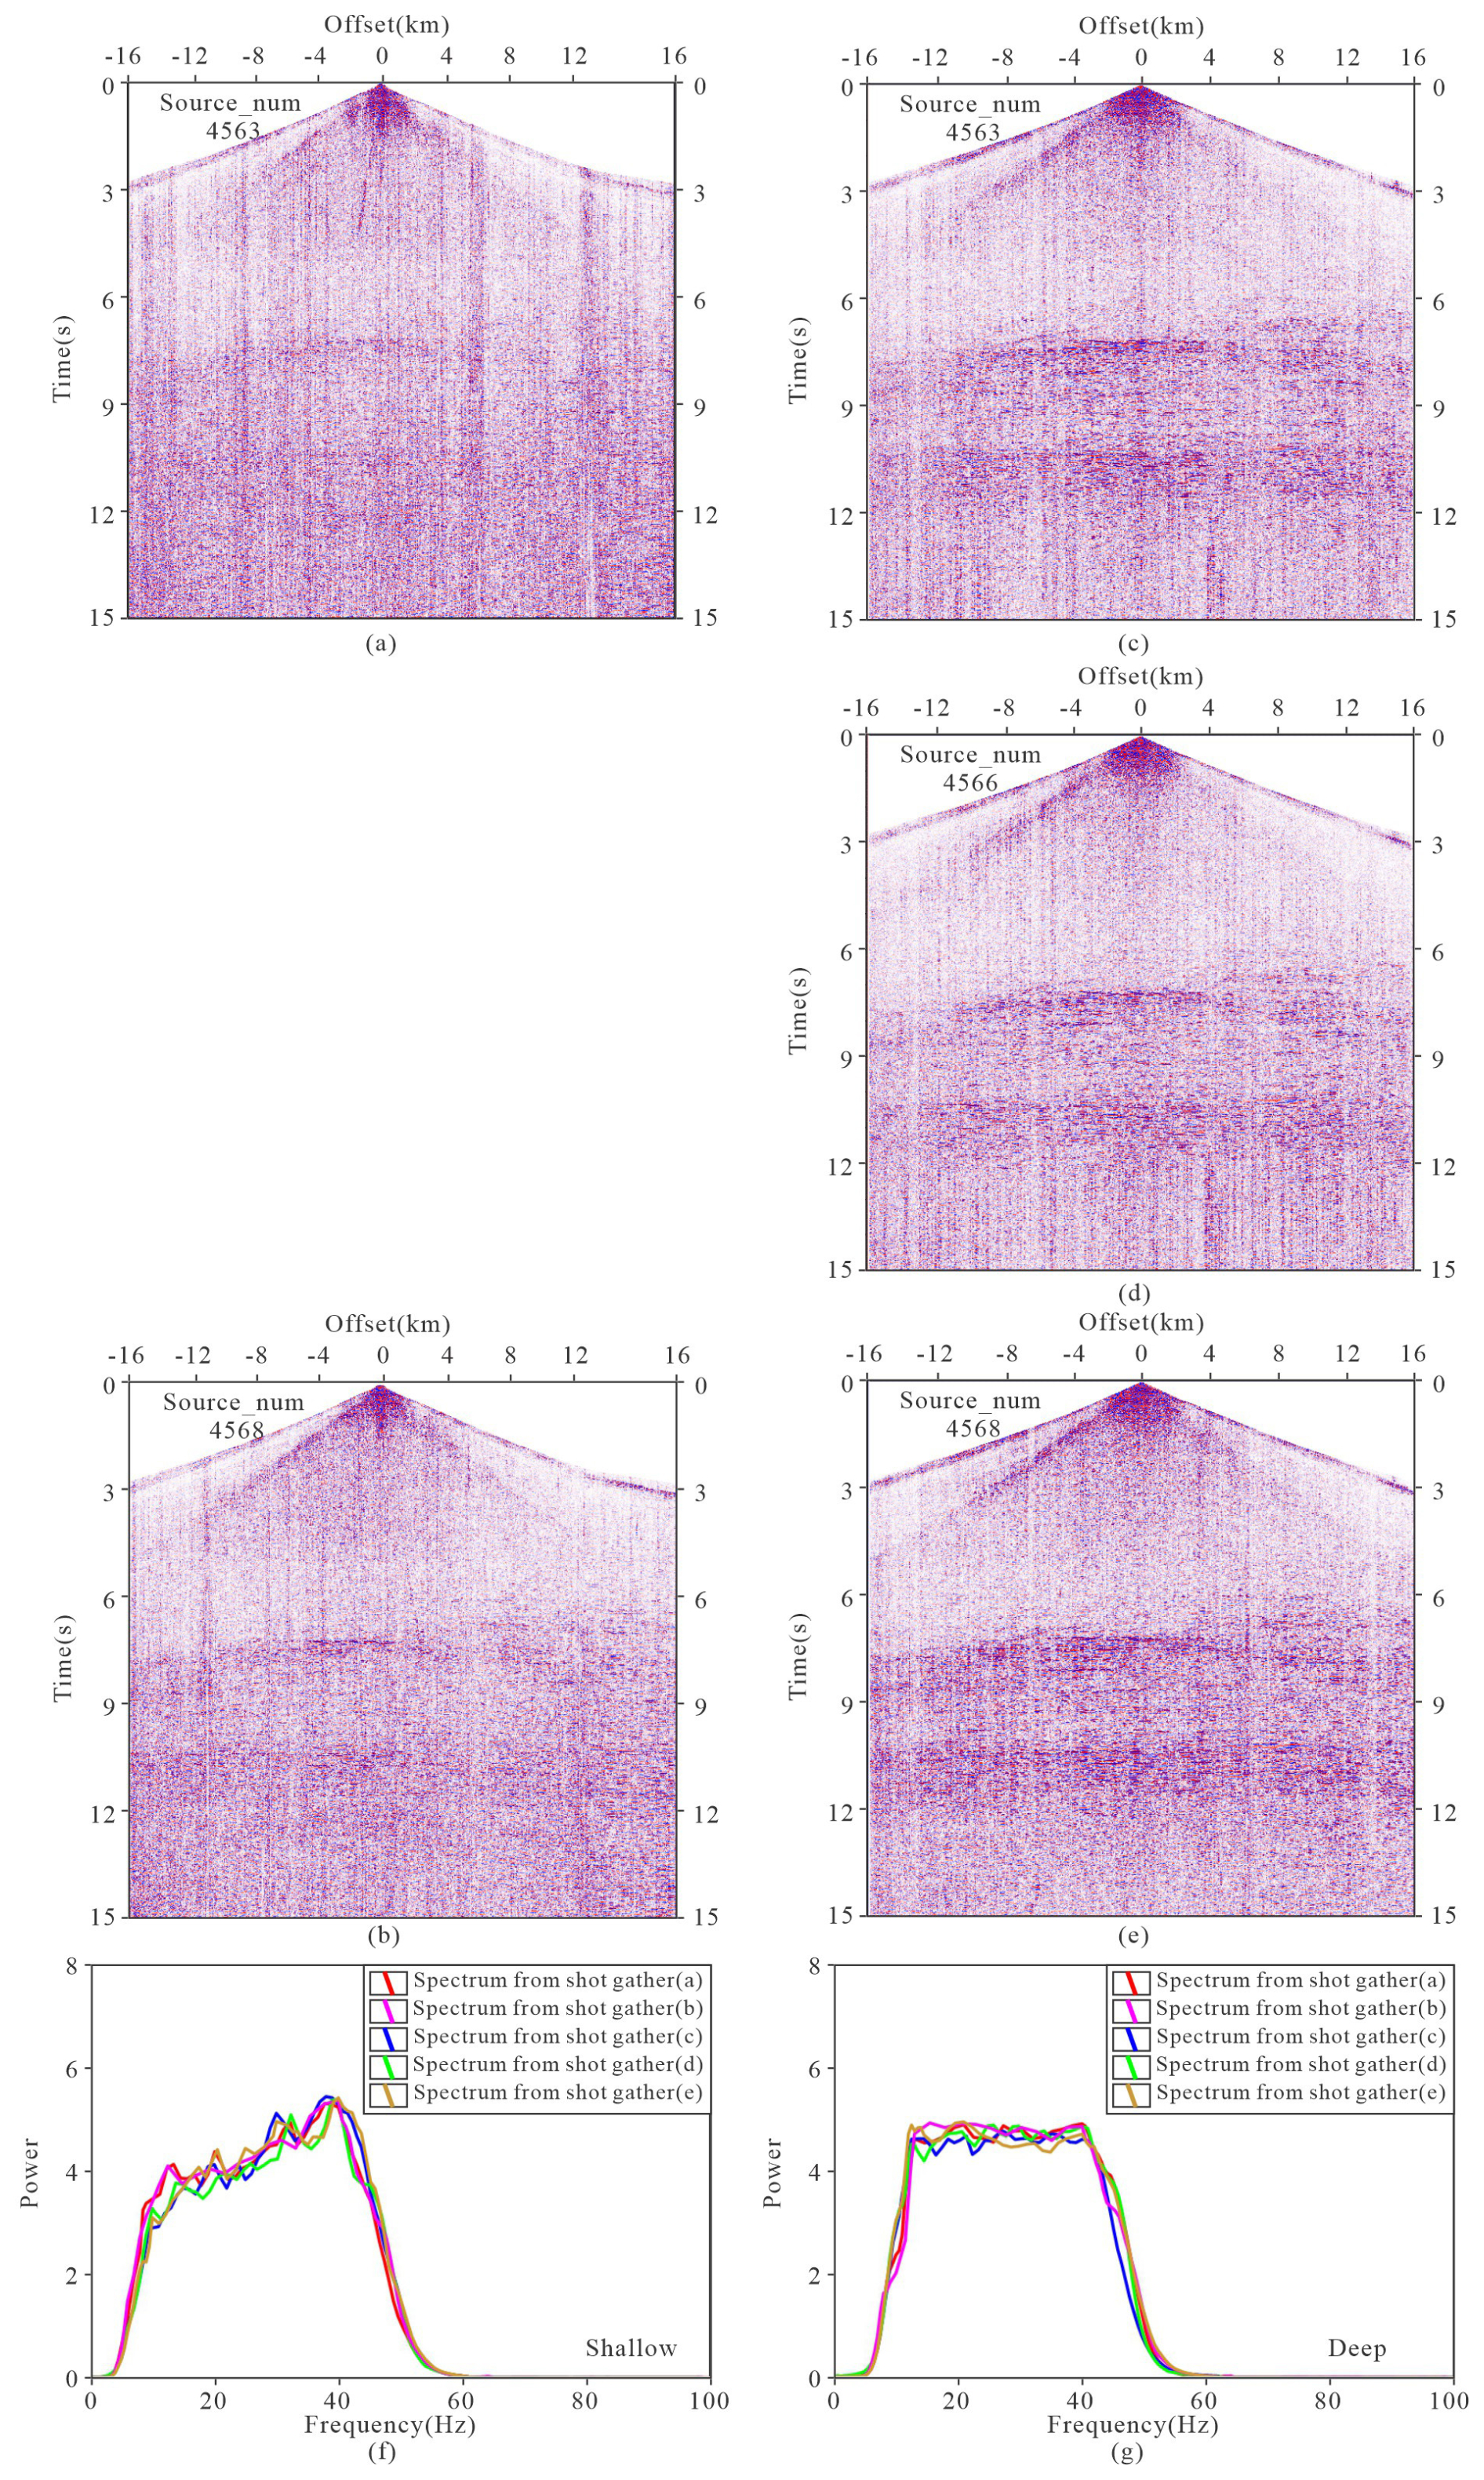
Figure 11The shot gathers before (a), (b), and after (c), (d), (e) MPFI, the shallow (f) and deep (g) power spectra from shot gathers (a) to (e).
- a.
The FFT and the Discrete Fourier transform (DFT) are used to convert irregular deep seismic reflection data from the space-time domain to the frequency-wavenumber domain;
- b.
The energy curves at various dips in the low-frequency band for the Fourier spectrum are computed and utilized as weighting factors applied to the entire Fourier spectrum;
- c.
Identify the Fourier spectrum component with the highest energy after weighting (effective signal);
- d.
Integrate this component into the original Fourier spectrum without weighting;
- e.
Perform an inverse Fourier transform on the Fourier spectrum component obtained in the preceding step and output the result to the corresponding original input positions;
- f.
Subtract the iterative result from step (5) from the original input data to proceed with the next iteration;
According to the set number of iterations or threshold, repeat steps (2)–(6), and get the expected results.
The above method is not only suitable for two-dimensional seismic data, but also can get a better processing effect for high-dimensional seismic data. In this study, the signals of 15–35 Hz band were adopted as the prior values to compute angle-dependent energy curves from the low-frequency Fourier spectrum, which are subsequently constrained to the signals of 35–100 Hz range. The iteration number was set to 200, and result was output upon reaching the condition. To evaluate the degree of improvement that regularization can bring to deep seismic reflection imaging, four regularization methods were designed using the MPFI algorithm. The details are as follows:
-
Infilling “gaps” in the offset domain while shot locations remain irregular: In the method, seismic data were sorted according to the common offset to generate a data volume within the offset domain. Due to the irregular distribution of shots and receivers, certain portions of the data volume contained “gaps”, where seismic traces were missing. These “gaps”, caused by irregular sampling, were infilled by interpolating the missing seismic trace positions. Comparing with stack sections before regularization (shallow Fig. 8a; deep: Fig. 9a), the “infilling gaps” results showed moderate improvement in the seismic profiles in shallow (Fig. 8b) and deep section (Fig. 9b), with fold increasing from 80 to around 100.
-
Full regularization in the offset domain: The method involved fully regularizing all data within the offset domain, where the CMP locations were restored to their pre-designated positions (the cell center locations). This ensured a uniform distribution of seismic traces across each offset. The results (Figs. 8c, 9c) showed an improvement over the “infilling gaps” method (Figs. 8b, 9b), with better alignment and consistency in the seismic profiles. The fold was generally around 80, with local areas slightly exceeding 80.
-
Regularizing shot positions to a 200 m interval in the shot domain: In the method, the seismic data were sorted according to the same shot gathers to create a data volume within the shot domain. The irregularly distributed shots were adjusted and restored to their pre-designed positions by the method (Fig. 10). The results (Figs. 8d, 9d) demonstrated that regularization in the shot domain yields improvements over previous methods. The processed profiles exhibited a higher S N and clearer imaging. Additionally, the uniformity of fold was maintained at 80.
-
Regularizing shot positions and infilling shot gathers to a 100 m interval in the shot domain: The method infilled shot gathers to a 100 m interval based on Method 3). As shown in Fig. 11, the infilled shot gather (Fig. 11c–e) was similar to the adjacent original shot gathers (Fig. 11a, b). It was evident that the shot gathers after regularizing and infilling (Fig. 11c–e) exhibit better quality than the original shot gathers (Fig. 11a, b), with more prominent effective waves. Moreover, the stacked profiles of both shallow and deep areas (Figs. 8e, 9e) were better than those without infilling shot gathers. The uniformity of fold was increased from 80 to around 160.
We made the following quantitative analysis including: power spectra analysis, signal-to-noise ratio estimation, and variance attributes analysis. The time windows used for power spectra analysis and signal-to-noise ratio estimation were assigned as 0.5–6.5 s for shallow sections and 5.5–11.5 s for deep sections. The shallow and deep power spectra (Figs. 8k, 9k) show that the frequency content remained nearly unchanged before and after MPFI, with a slight loss of high-frequency components observed in shallow sections after MPFI. Nevertheless, the S N ratio was significantly improved after MPFI, particularly when using the shot-domain infilling method (Figs. 8l, 9l).
The shallow (Fig. 11f) and deep (Fig. 11g) power spectra from shot gathers also indicated that the effective frequency band is essentially unchanged before and after shot-domain interpolation. The variance attribute images (Figs. 8f–j and 9f–j) indicated that variance slightly decreased for offset-domain MPFI and decreased significantly for shot-domain MPFI, indicating enhanced coherence of seismic reflections after MPFI. The S N increased from approximately 1.5 to 2.5 in shallow profiles (Fig. 8l) and from approximately 2.0 to 3.5 in deep sections after MPFI implementation (Fig. 9l).
The results presented in Figs. 8 and 9 demonstrate that regularization enhanced the image quality of seismic profiles in both shallow and deep regions. Among the methods tested, the regularization in the shot domain consistently outperformed that in the offset domain, obtaining higher S N and clearer profiles. Although regularization in the offset domain can reposition the CMP locations onto the pre-designed curved line, the actual spatial coordinates of the corresponding shot and receiver positions still shift during the CMP spatial adjustment. In contrast, regularization in the shot domain physically relocates the shot points directly to their designed acquisition coordinates, making it more “physically” meaningful in implementation. Therefore, the processing in the shot domain obtained superior results, particularly when regularizing and infilling shot gathers to a 100 m interval.
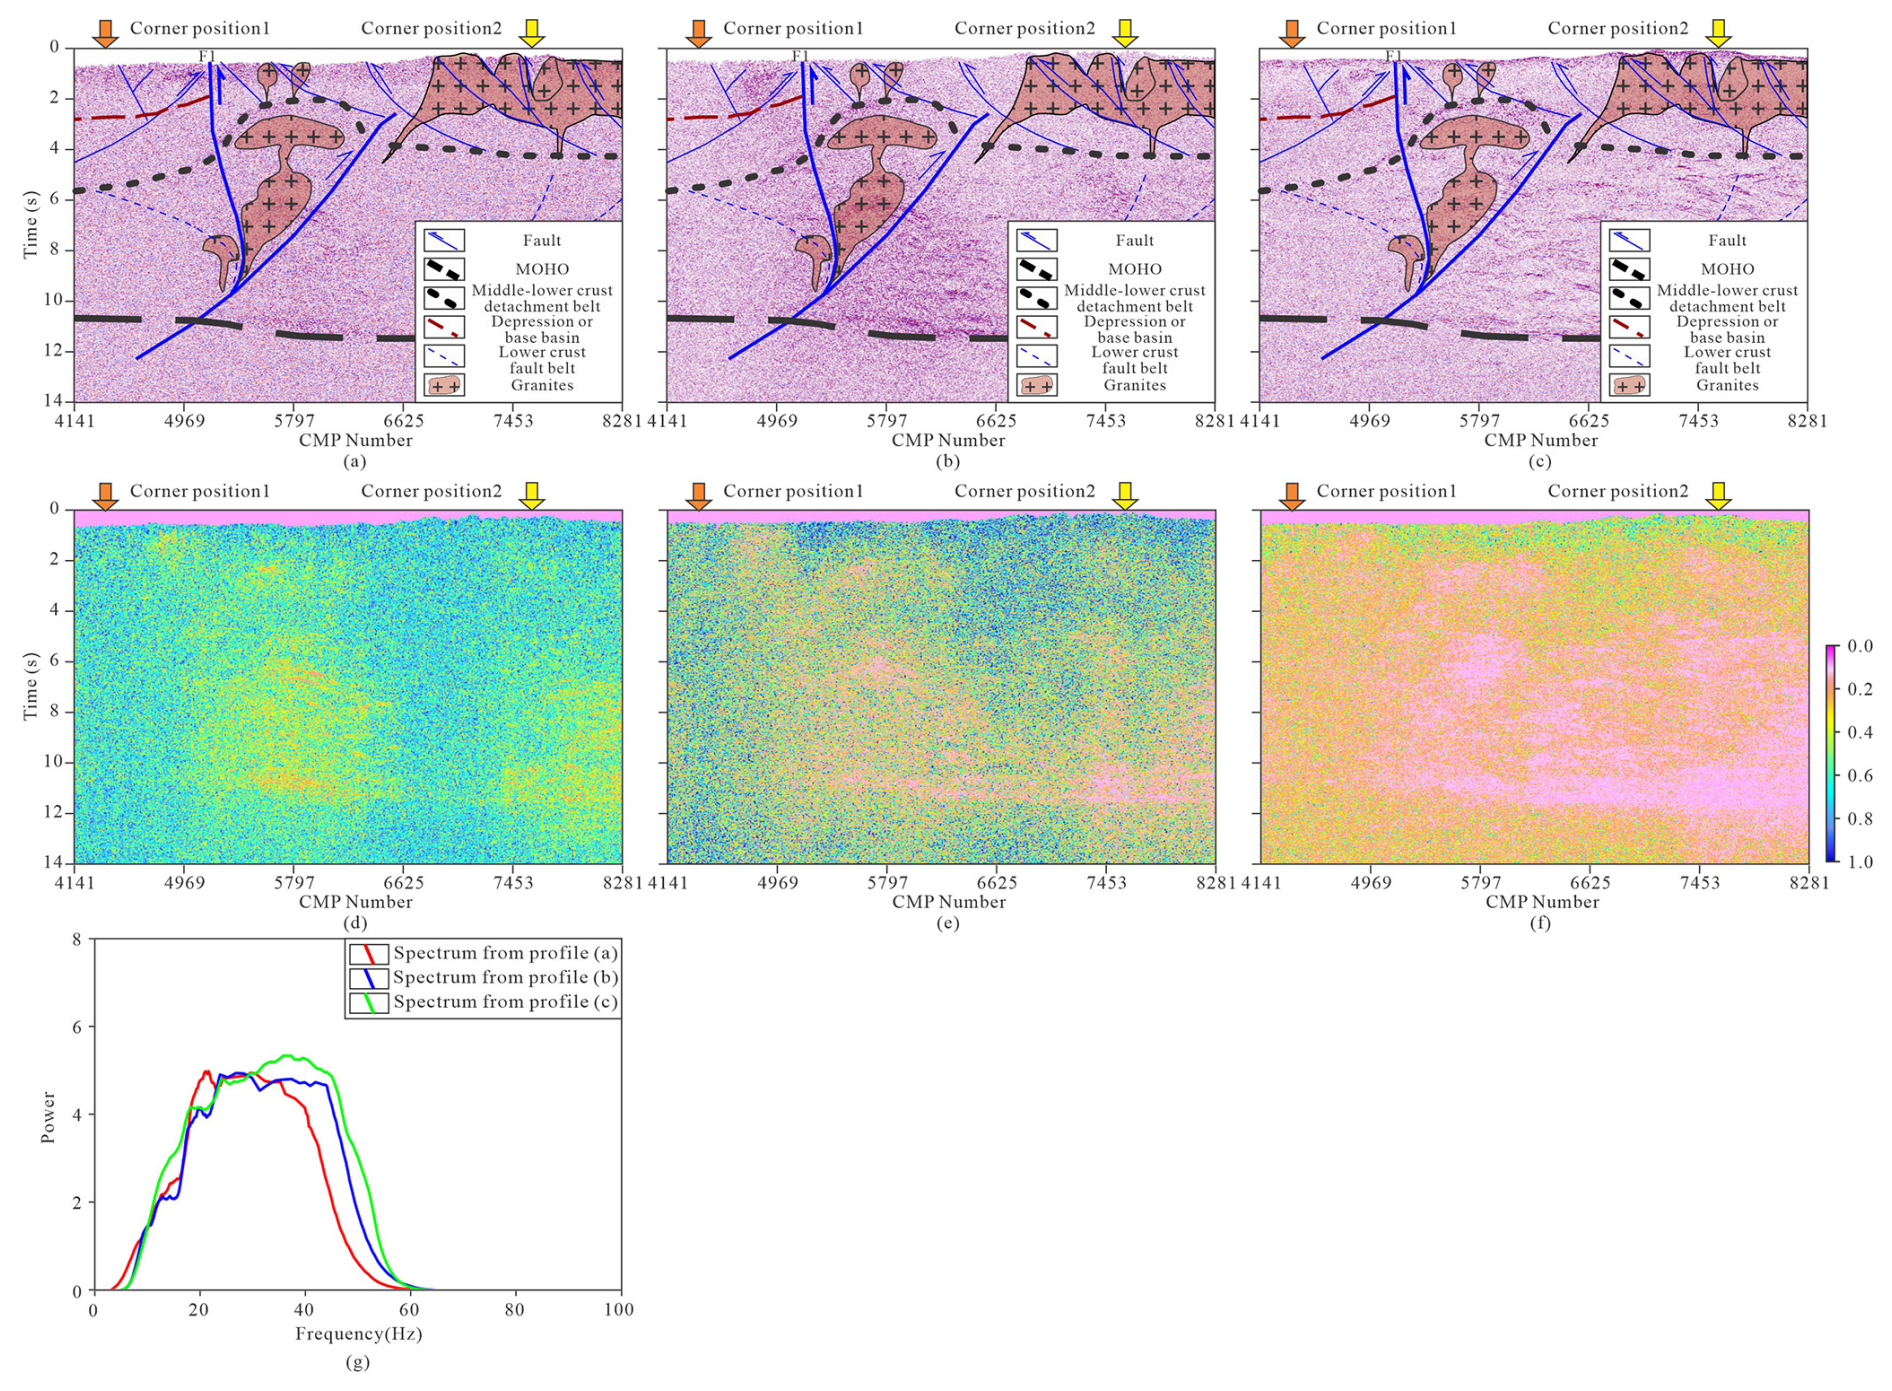
Figure 12(a) The stack profile without migration of the in-field data processing, (b) the stack profile without migration of the in-house data processing, (c) the newly processed stack profile without migration, panels (d)–(f) are the variance attribute images derived from panels (a)–(c), (g) the power spectra from profiles (a)–(c). F1: Yifeng-Jingdezhen Fault, the orange arrows indicate corner position 1, the yellow arrows indicate corner position 2.
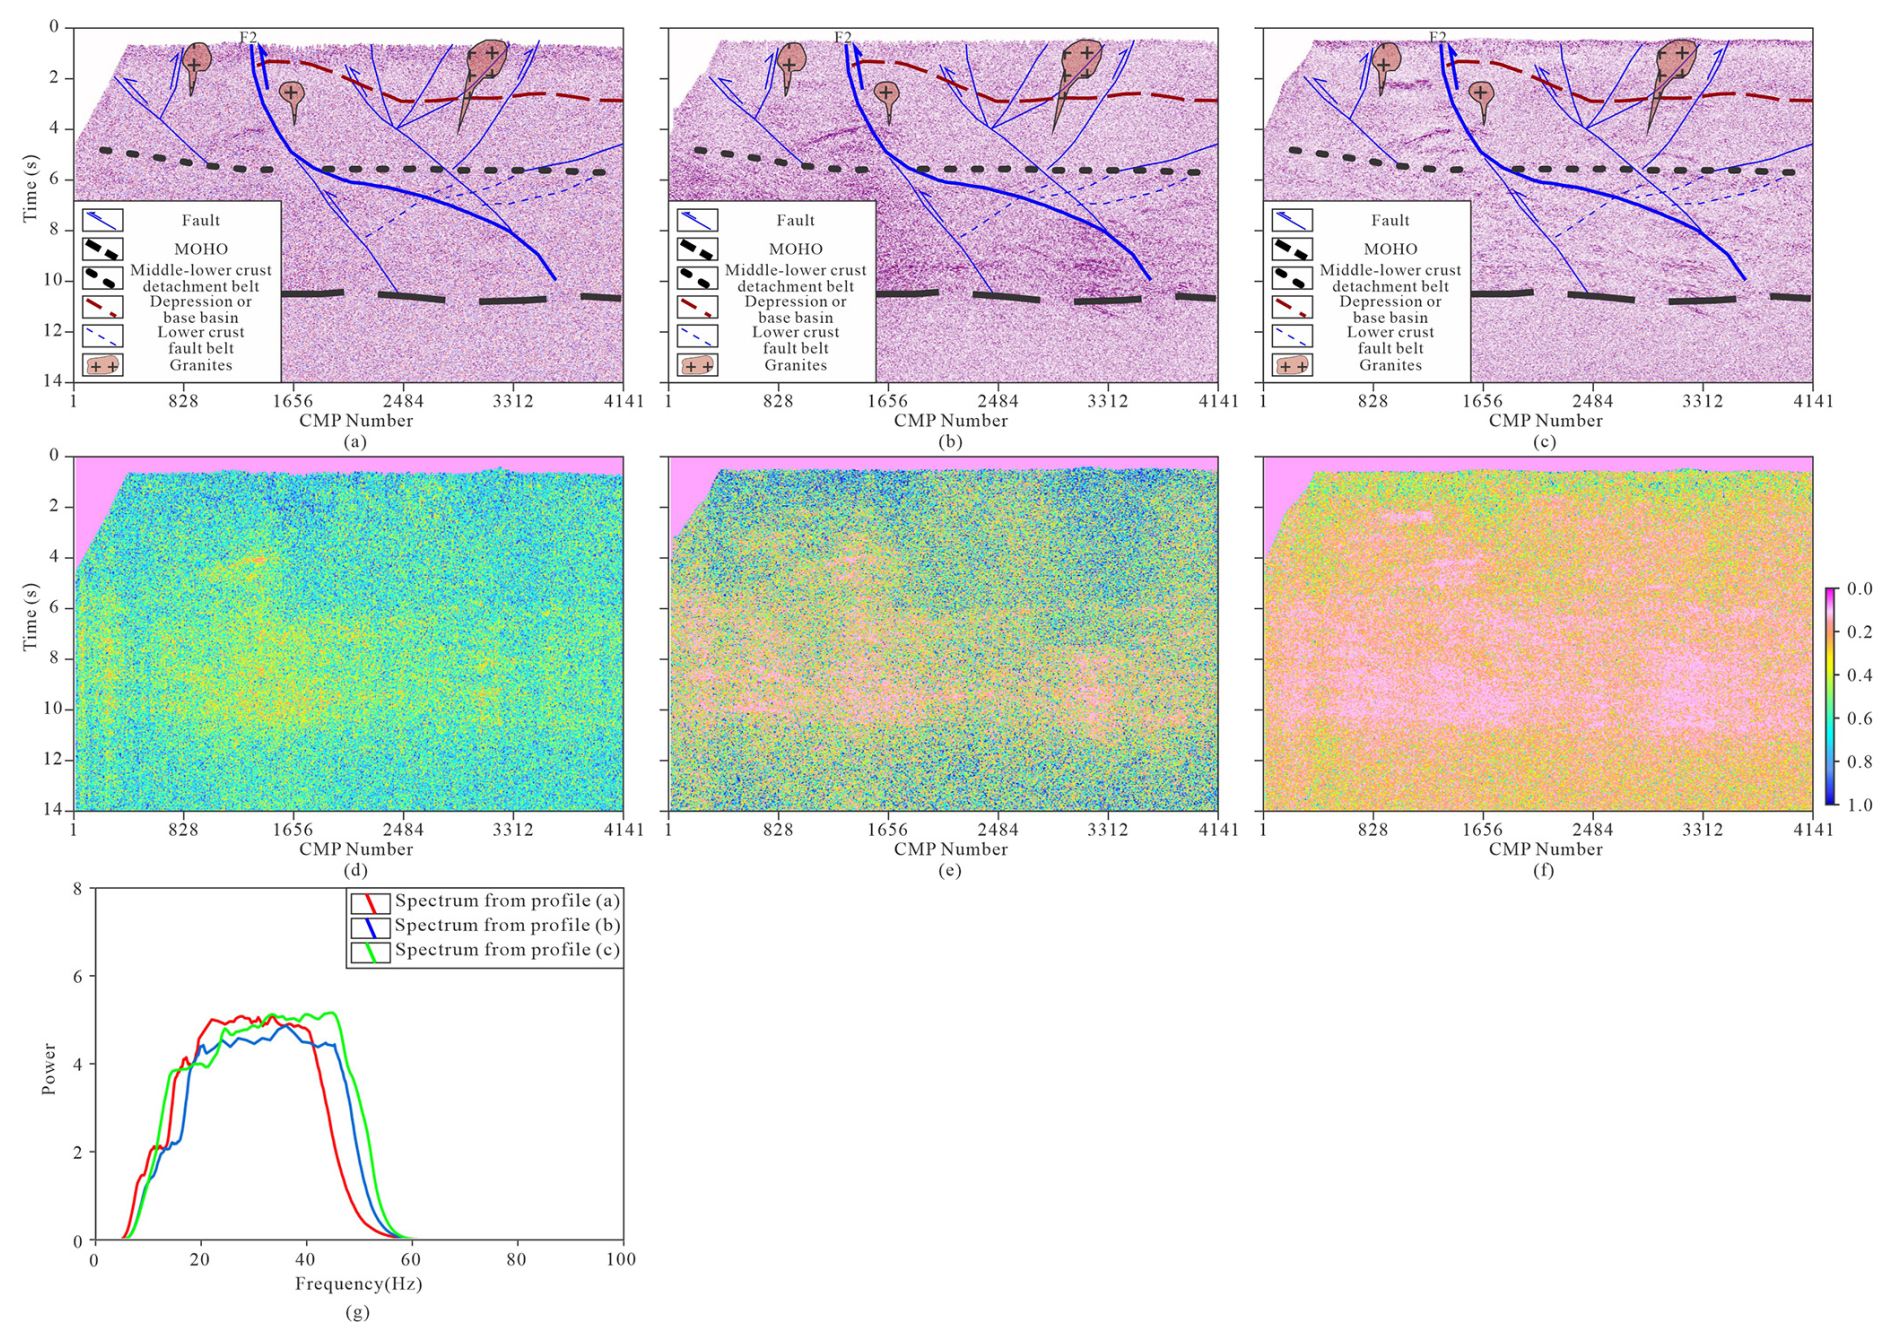
Figure 13(a) The stack profile without migration of the in-field data processing, (b) the stack profile without migration of the in-house data processing, (c) the newly processed stack profile without migration, panels (d)–(f) are the variance attribute images derived from panels (a)–(c), (g) the power spectra from profiles (a)–(c). F2: Pingxiang-Guangfeng Fault.
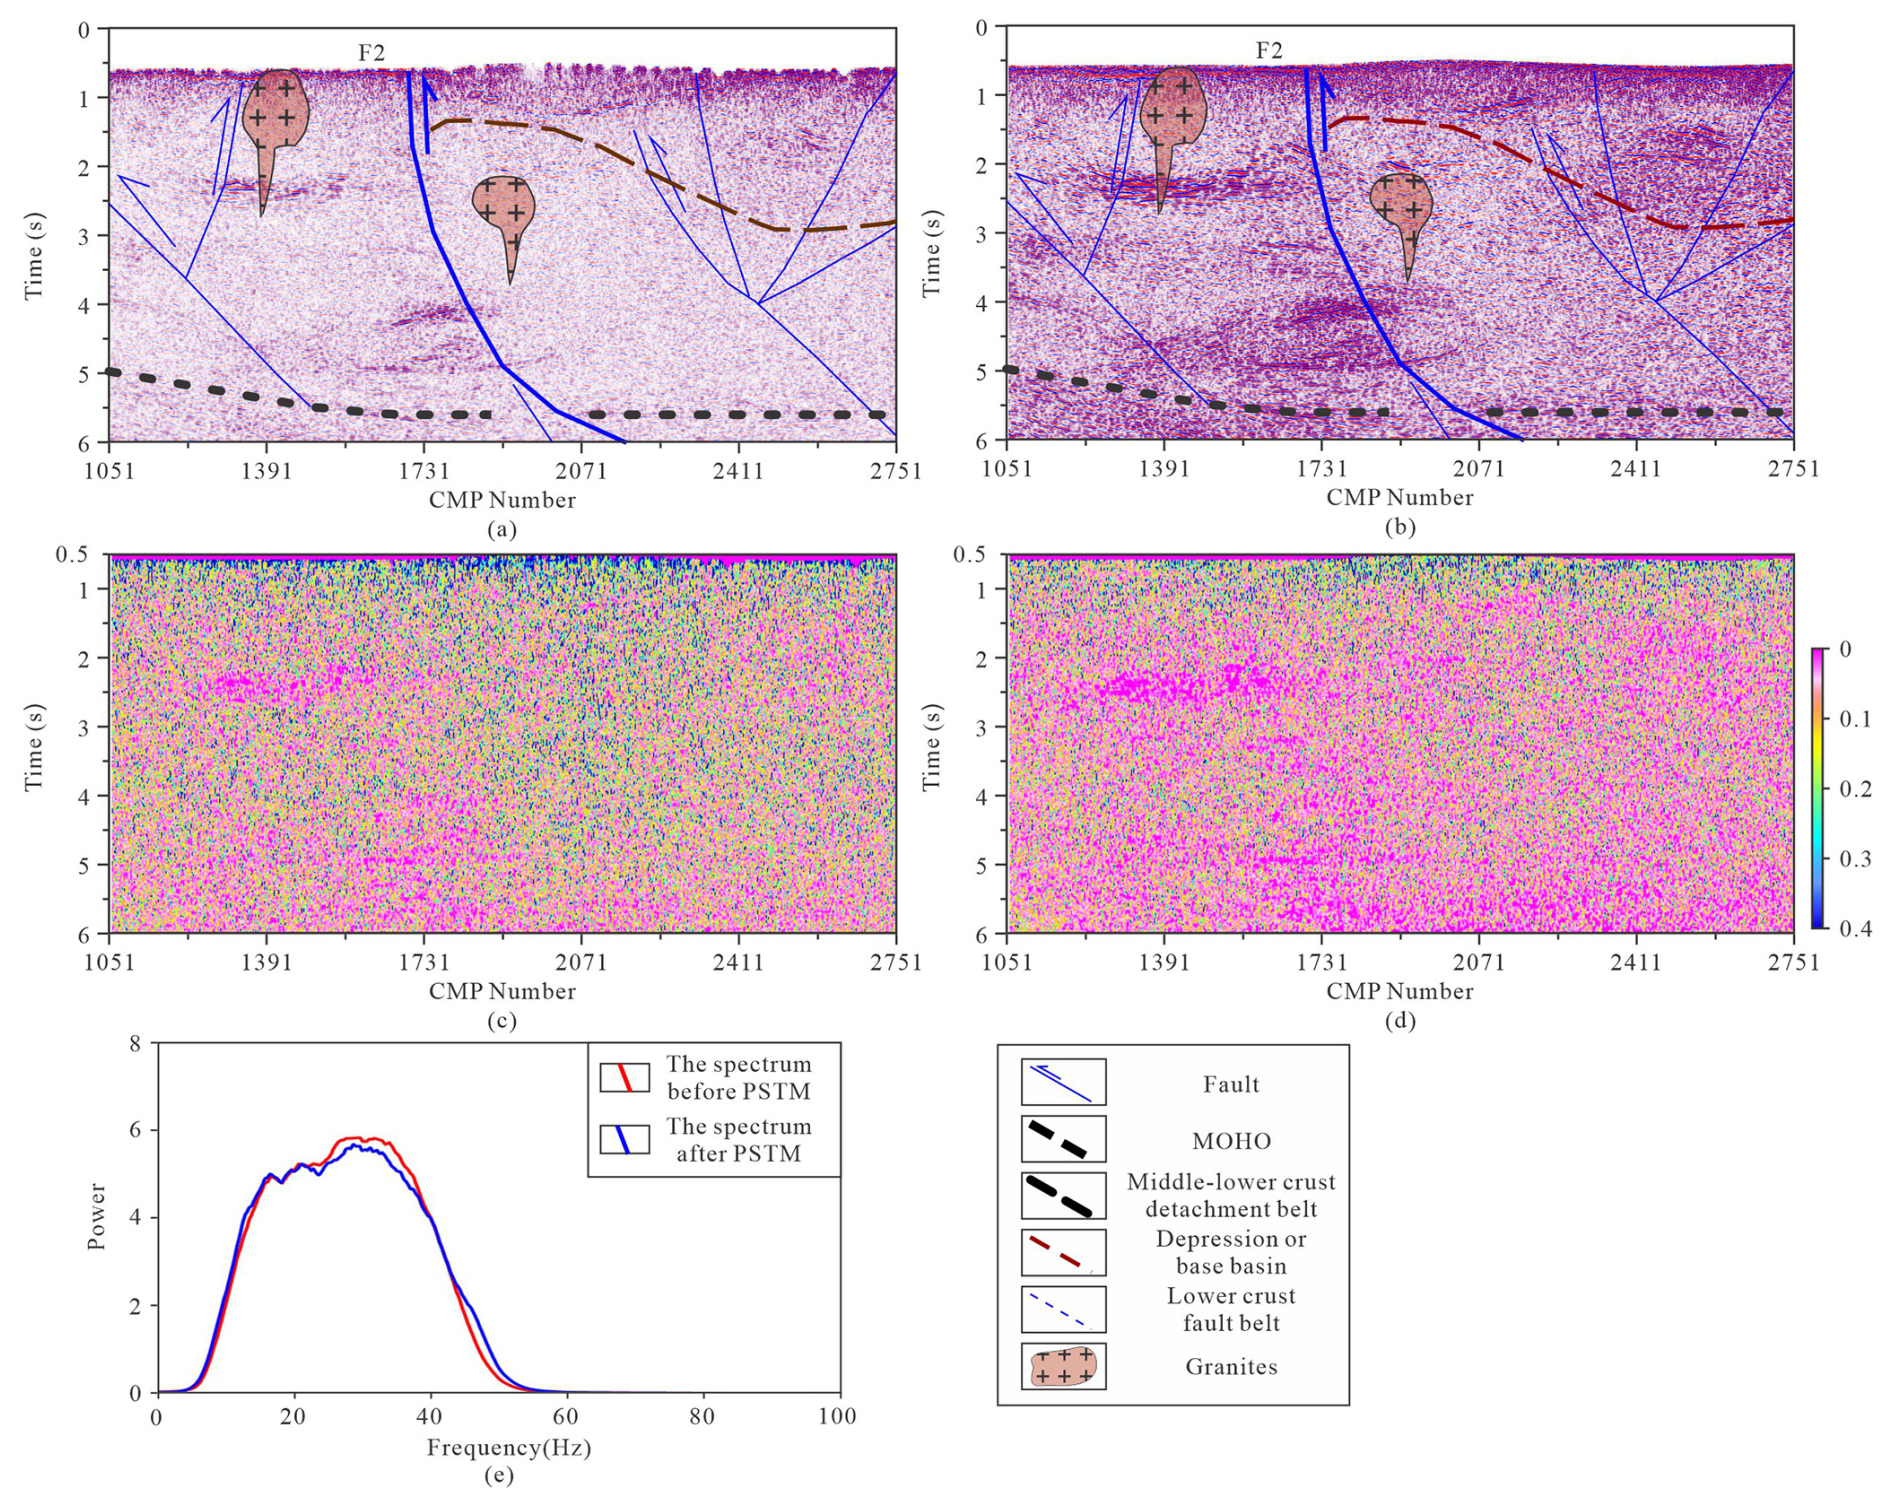
Figure 14(a) The shallow migration image without regularization, (b) the shallow migration image after regularization and infilling shot gathers in the shot domain, panels (c) and (d) are the variance attribute images derived from panels (a) and (b), (e) the power spectra from images (a) and (b).
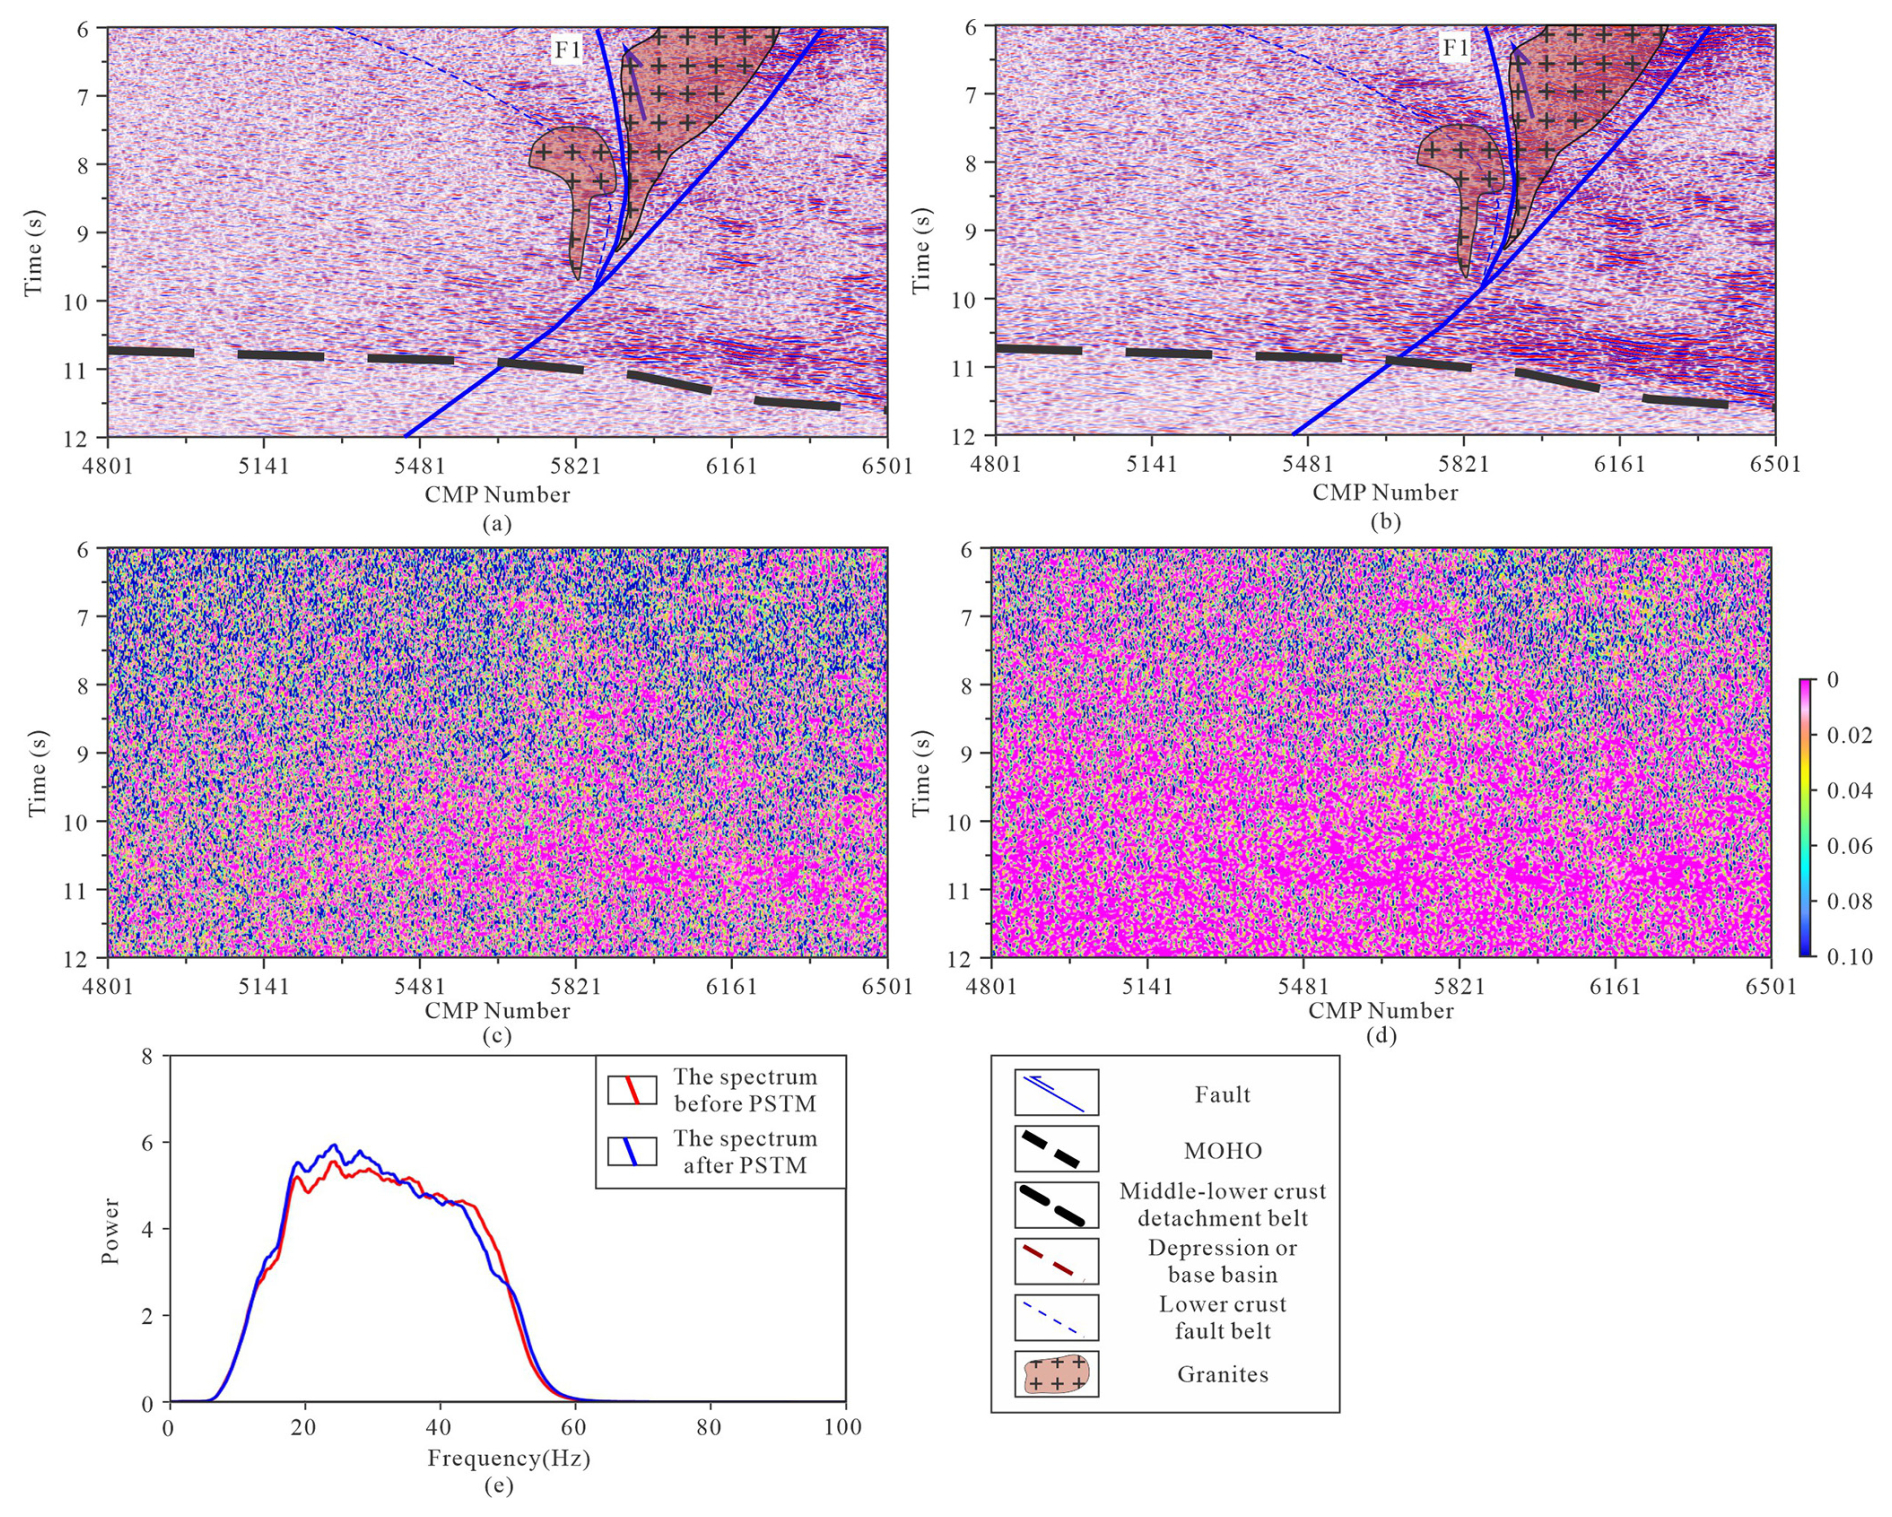
Figure 15(a) The deep migration image without regularization, (b) the deep migration image after regularization and infilling shot gathers in the shot domain, panels (c) and (d) are the variance attribute images derived from profiles (a) and (b), (e) the power spectra from images (a) and (b).
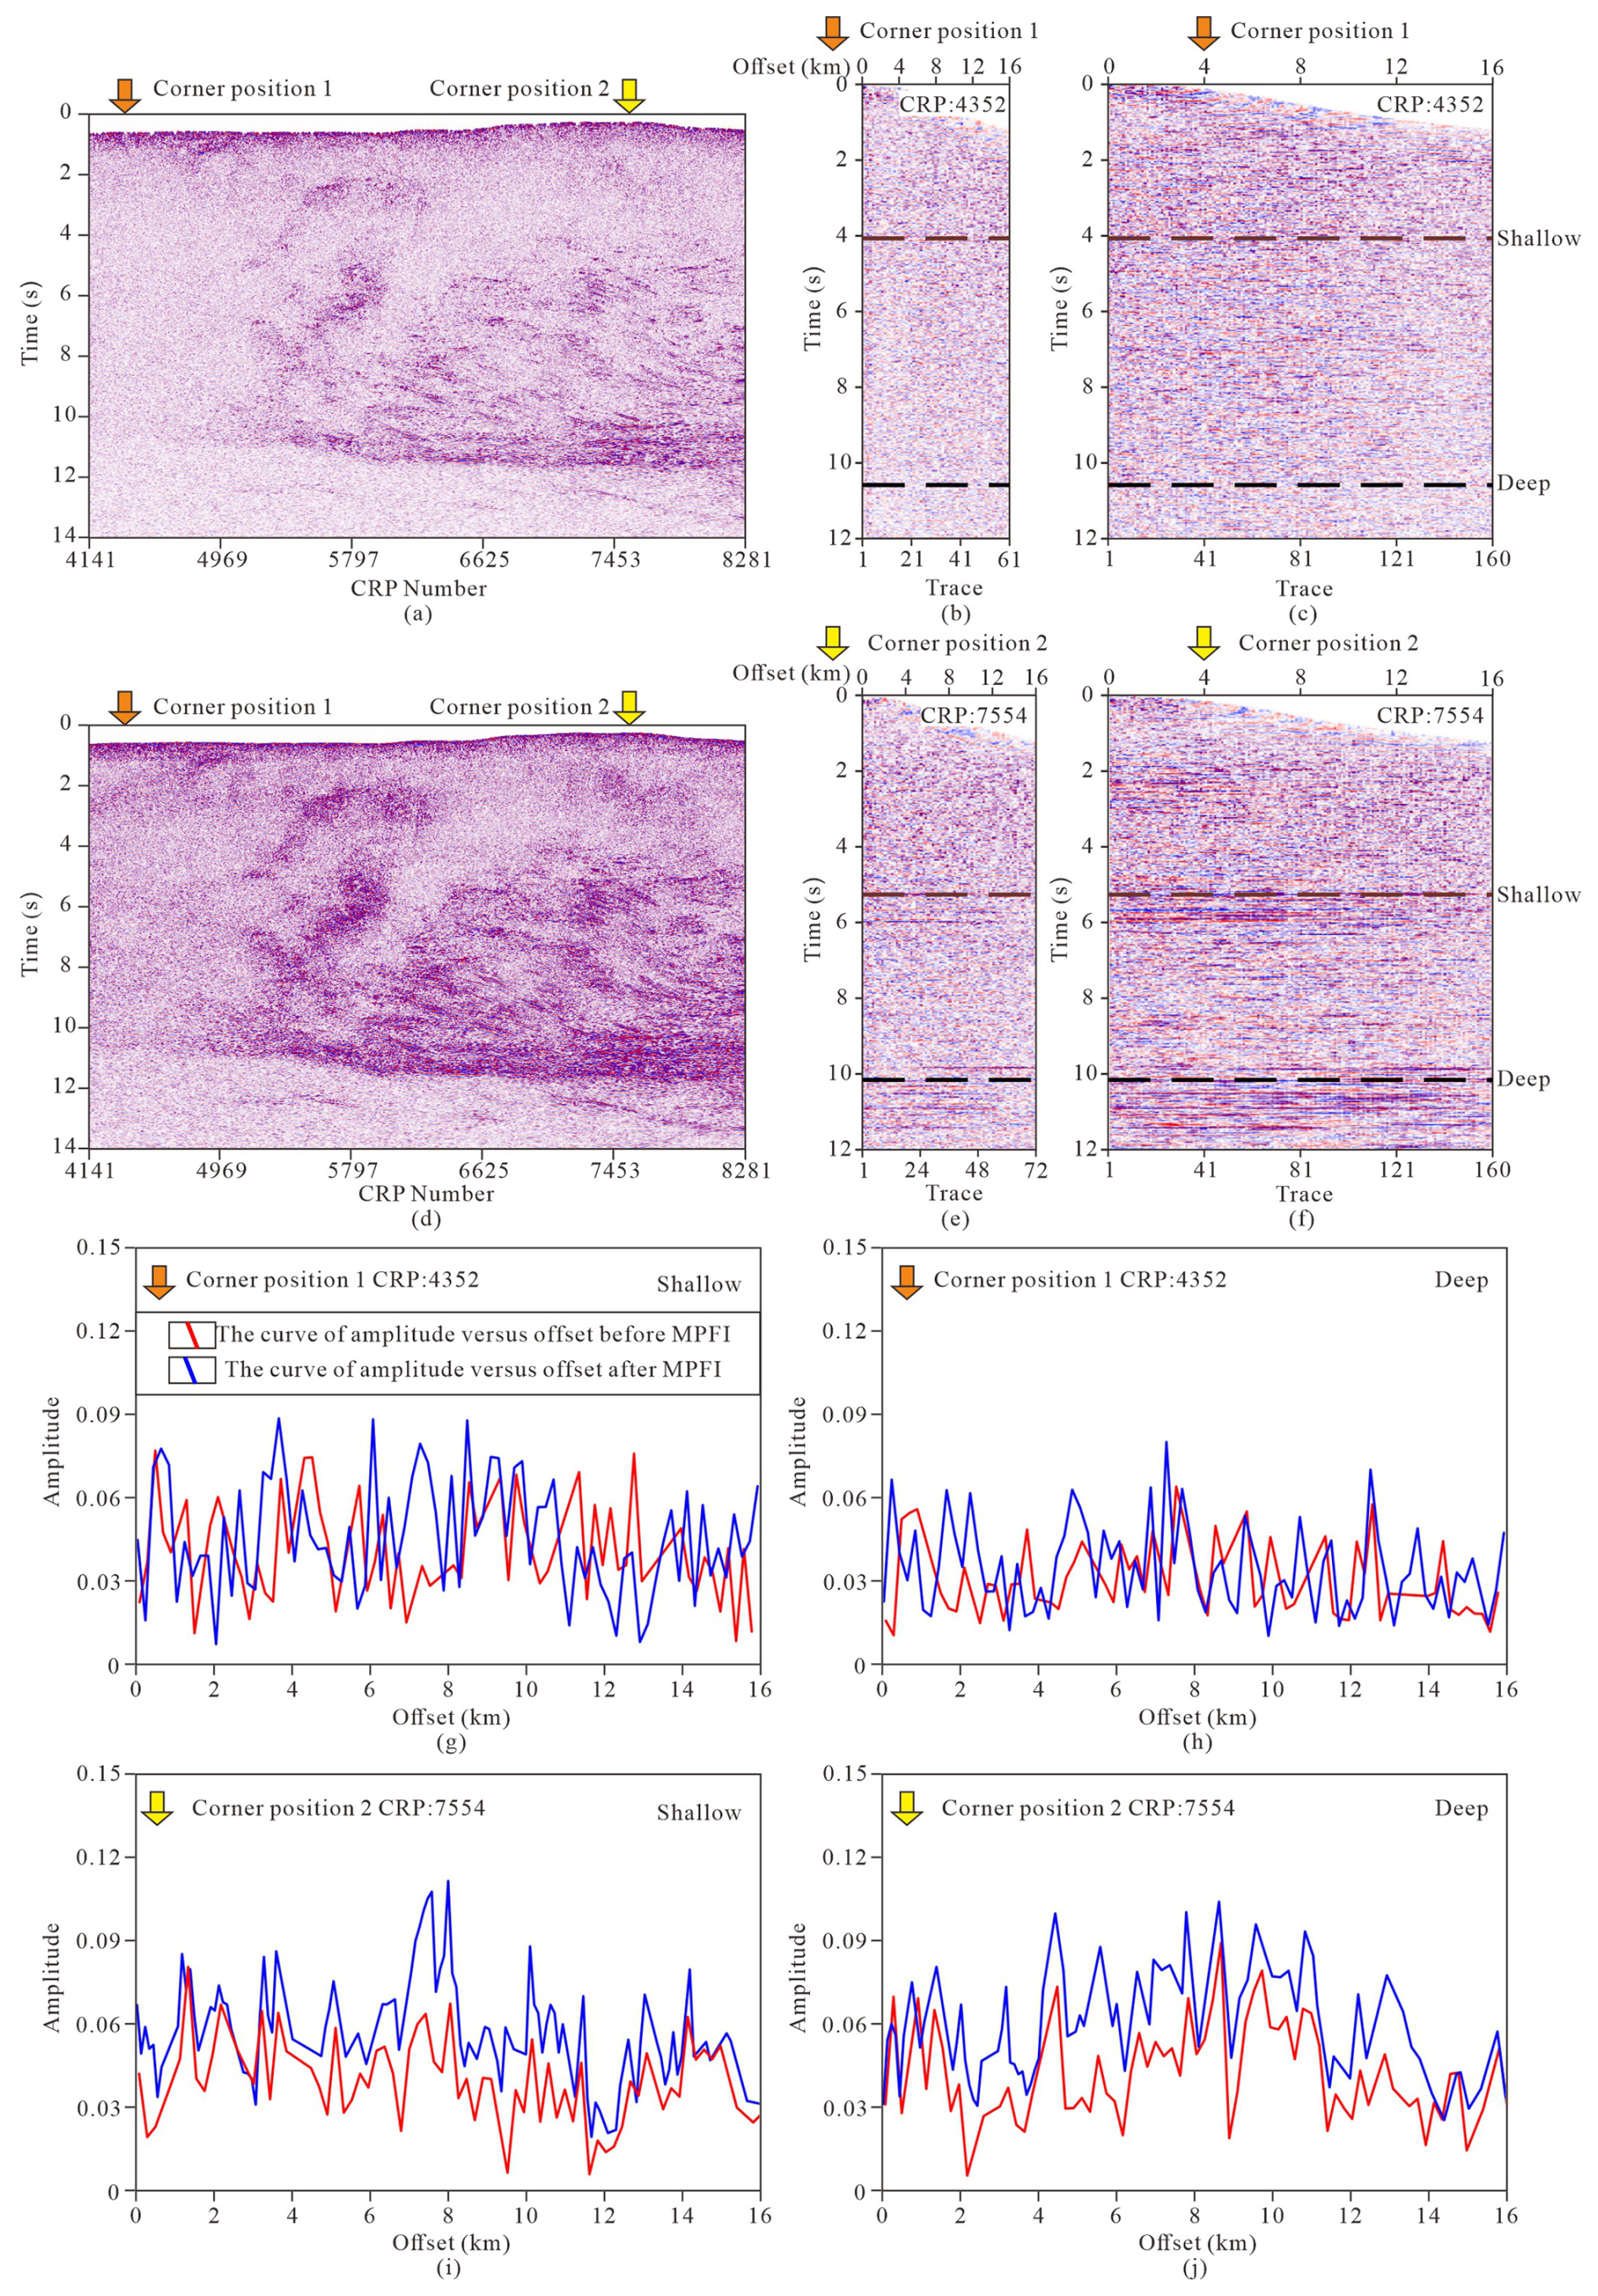
Figure 16(a) The migration images without regularization, (b) CRP of corner position 1 without regularization, (c) CRP of corner position 1 after regularization, (d) the migration images after regularization, (e) CRP of corner position 2 without regularization, (f) CRP of corner position 2 after regularization, (g) the curves of amplitude versus offset at shallow layer of corner position 1, (h) the curves of amplitude versus offset at deep layer of corner position 1, (i) the curves of amplitude versus offset at shallow layer of corner position 2, (j) the curves of amplitude versus offset at deep layer of corner position 2. The arrows indicate corner positions, the dashed lines indicate the layers based on the curves of amplitude versus offset.
In this study, the Method 4 was ultimately adopted to perform regularization processing. The newly processed stack profiles without migration (Figs. 12c, 13c) have better quality than the previous in-field (Figs. 12a, 13a) and in-house processed profiles (Figs. 12b, 13b), which are enabled clearer identification of major structures within the study area. The in-field processed profile from Contractor A has a low S N, and the reflections of the main faults and rock masses are not prominent. Although the in-house processed profile from Contractor B displays the target reflection wave group, the resolution of specific features is notably inferior to newly processed results that achieved through regularization-based processing. From the variance attribute images of three processing results (Figs. 12d–f and 13d–f), the newly processed results with shot-domain MPFI show a statistically significant reduction in variance, indicating improved coherence of seismic reflections. Moreover, the frequency bandwidth of the new processing was broadened in comparison to the results of previous results (Figs. 12g, 13g). The time windows of spectra analysis were assigned as 2–11 s.
The newly processed seismic profile has improved the imaging quality of two major faults the Yifeng–Jingdezhen fault (F1) and Pingxiang–Guangfeng fault (F2), which contributes to understand mineralization processes better in the study area. F1 is nearly vertical, extending westward to central Hunan and eastward to connect with the Shexian–Suzhou fault zone, with its middle segment obscured by the Poyang Lake Basin. Distinct differences in reflection characteristics, as well as crustal structure and physical properties, are observed between the southern and northern sides of F1. F2 represents the middle segment of the Beihai–Pingxiang–Jiangshan–Shaoxing fault zone, a crust-scale deep fault dipping northward that cuts through the detachment surface down to the Moho and causes its offset. It acts as a critical channel for magma upwelling, and obvious differences in crustal reflection features exist on its two sides. According to the reflection characteristics, distribution, surface geology and other data, F2 may be identified as the southern boundary of the Qin-Hang belt and the northern boundary of the South China Block. The major faults and associated secondary fractures provided conduits for deep-source magmas and ore-forming fluids, while subsequent tectonic reactivation of these structures promoted mineralization.
This improvement was most evident in the profiles of pre-stack time migration (Figs. 14a–b and 15a–b), where the structural clarity and continuity were enhanced following regularization with infilling shot gathers to a 100 m interval. The variance attribute images further validate the improved quality of migration images after regularization. The variance values after regularization (Figs. 14d, 15d) are smaller than values without regularization (Figs. 14c, 15c). Additionally, the frequency bandwidth of the pre-stack time migration data (Figs. 14e, 15e) was unchanged after regularization. The time windows of dominant frequency analysis were assigned as 0.5–6.0 s for shallow sections and 6.0–11.5 s for deep sections. It is worth noting that the effects of regularization were slightly less in the deep regions compared to the shallow areas. This may be attributed to the attenuation of seismic signals with increasing depth, which weakens the effective signal and limits the improvements achievable through regularization. In summary, regularization in the shot domain, with infilling shot gathers to a 100 m interval, proved to be the most effective approach for improving seismic imaging quality. These findings highlight the importance of tailored regularization strategies in addressing specific challenges associated with deep seismic reflection data.
Matching Pursuit Fourier Interpolation (MPFI) iteratively extracts the maximum values of the wavenumber-domain spectrum and continuously subtracts them from the original data. Through multiple iterations, coherent signals – characterized by relatively large values in the wavenumber domain – are sequentially identified. In essence, MPFI constitutes a data reconstruction process. For 2D seismic data, MPFI transforms the data into the frequency-wavenumber domain along the time, common midpoint (CMP), and offset directions to identify coherent signals and attenuate random noise. MPFI regularization demonstrates greater stability for 3D data than for 2D data, and out-of-plane energy is treated as noise by 2D regularization methods. The method generally exhibits robust performance for crooked profiles. Regarding amplitude implications and alterations after regularization, the algorithm only modulates amplitudes in the frequency-wavenumber domain to suppress random noise and enhance coherent signal continuity. Amplitude scaling is strictly constrained by the spectral energy of the original coherent signals, with no arbitrary amplitude gain or attenuation (Trad et al., 2009; Poole et al., 2015).
We analyzed and compared pre-stack time migration stack images (Fig. 16a, d) and their corresponding migrated common reflection point (CRP) gathers at two major corner positions with curvature angles of 19° and 4° (Fig. 16b, c, e, f), respectively. The amplitude trends at the corner position 2 remain essentially consistent for both shallow and deep sections (Fig. 16i, j). The amplitude trends at the corner position 1 were also generally consistent for both shallow and deep sections (Fig. 16g, h), but the result may not be reliable because seismic reflections form an imaging blank zone both before and after regularization.
In practice, the Fresnel zone radius serves as a fundamental geophysical constraint governing the method's performance threshold, and the maximum allowable profile crookedness before regularization degrades is quantitatively defined by the Fresnel radius of target reflectors at the dominant seismic frequency. For shallow targets (0.5–5 km) and a dominant frequency band of 10–50 Hz in conventional seismic surveys, the Fresnel radius ranges from approximately 100 to 700 m; for deep targets (15–30 km) and a dominant frequency band of 10–30 Hz, this radius increases to 700–1750 m. The regularization method maintains optimal performance when the lateral deviation of any segment of the crooked profile is less than one-quarter of the Fresnel radius of the corresponding target. If the lateral deviation exceeds the Fresnel radius, the regularization may fail to match the kinematic and dynamic characteristics of the coherent wavefield, leading to signal distortion, loss of small-scale geological features, and invalidation of the regularization constraints. Amplitude-based analysis confirms that the relative amplitude variation trend with offset is preserved, ensuring the reliability of amplitude-dependent attributes for lithologic and fluid interpretation.
This study evaluated four data regularization methods based on anti-aliasing MPFI to address seismic image degradation caused by irregular sampling in deep seismic reflection acquisition: (1) Infilling gaps in the offset domain; (2) Full offset-domain regularization; (3) Regularizing shot positions to 200 m intervals; and (4) Regularizing shot positions and infilling shot gathers to 100 m intervals. These methods were applied to deep seismic profiles from the middle segment of the JOB (Wuning–Ji'an section). All four approaches improved seismic image quality, with Method 4 delivering the most significant enhancement. It produced more regular shot and receiver spacing, a more uniform offset distribution, and doubled the fold, leading to better S N and clearer imaging of both shallow and deep structures. Compared to contractor-processed stack profiles, Method 4 also yielded superior results in pre-stack time migration, with reduced migration noise and sharper structural images. These outcomes highlight the importance of regularization in deep seismic reflection workflows. Overall, regularization of Method 4 proves to be an effective preprocessing step that enhances image quality, facilitates reliable data migration, and supports accurate interpretation of deep subsurface structures, contributing to more precise prediction of metal-rich zones.
To request the data associated with this research, contact the corresponding author of the article after the publication of this work.
HZ and JY: conceptualized and designed this study. HZ, ZL and JH took part in data analysis. JY, JL and HW led the geological interpretation. HZ wrote the initial manuscript draft. All authors participated to the results discussion and approved the submission of this paper.
The contact author has declared that none of the authors has any competing interests.
Publisher's note: Copernicus Publications remains neutral with regard to jurisdictional claims made in the text, published maps, institutional affiliations, or any other geographical representation in this paper. The authors bear the ultimate responsibility for providing appropriate place names. Views expressed in the text are those of the authors and do not necessarily reflect the views of the publisher.
We gratefully acknowledge the valuable feedback provided by anonymous reviewers and the strong support from the editorial team.
This study is supported by Deep Earth Probe and Mineral Resources Exploration – National Science and Technology Major Project (grant nos. 2024ZD1001202 and 2024ZD1002201), National Natural Science Foundation of China (grant nos. 42004179 and U2344220) and the Deep Geological Survey Project of the China Geological Survey (grant nos. DD20230008, DD20221656, and DD20240079).
This paper was edited by Michal Malinowski and reviewed by two anonymous referees.
Ahmadi, O., Juhlin, C., Ask, M., and Lund, B.: Revealing the deeper structure of the end-glacial Pärvie fault system in northern Sweden by seismic reflection profiling, Solid Earth, 6, 621–632, https://doi.org/10.5194/se-6-621-2015, 2015.
Bezerra, Y. S. F., Garabito, G., Sacchi, M., and Caldeira, J.: Data reconstruction combining MWNI and CRS-based interpolation methods, J. Appl. Geophys., 209, 104912, https://doi.org/10.1016/j.jappgeo.2022.104912, 2023.
Bishop, T. N., Bube, K. P., Cutler, R. T., Langan, R. T., Love, P. L., Resnick, J. R., Shuey, R. T., Spindler, D. A., and Wyld, H. W.: Tomographic determination of velocity and depth in laterally varying media, Geophysics, 50, 903–923, https://doi.org/10.1190/1.1441970, 1985.
Cary, P. W. and Lorentz, G. A.: Four-component surface-consistent deconvolution, Geophysics, 58, 383–392, https://doi.org/10.1190/1.1443421, 1993.
Chen, C. X., Yan, J. Y., Liu, W. Q., Luo, F., Zhang, C., Xu, Y., Cheng, Z. Z., and Wang, Y.: Differences in Crustal Structure and Composition in Wuling – Middle Part of Jiangnan Orogenic Belt: Based on Geochemical and Geophysical Anomalies, Acta Geosci. Sin., 43, 785–802, https://doi.org/10.3975/cagsb.2022.063001, 2022.
Ding, Y. S. and Malehmir, A.: Reverse time migration (RTM) imaging of iron oxide deposits in the Ludvika mining area, Sweden, Solid Earth, 12, 1707–1718, https://doi.org/10.5194/se-12-1707-2021, 2021.
Gan, C. S., Wang, Y. J., Barry, T. L., Zhang, Y. Z., and Qian, X.: Late Jurassic high-Mg andesites in the Youjiang Basin and their significance for the southward continuation of the Jiangnan Orogen, South China, Gondwana Res., 77, 260–273, https://doi.org/10.1016/j.gr.2019.06.018, 2020.
Gao, R., Wang, H. Y., Zeng, L. S., Zhang, J. S., Guo, T. L., Li, Q. S., Li, W. H., Li, P. W., and Guan, Y.: The crust structures and the connection of the Songpan block and West Qinling orogen revealed by the Hezuo-Tangke deep seismic reflection profiling, Tectonophysics, 634, 227–236, https://doi.org/10.1016/j.tecto.2014.08.014, 2014.
Geng, Y. S.: Neoproterozoic Era of South China Craton, in: Precambrian Geology of China, edited by: Zhai, M., Springer Berlin Heidelberg, Berlin, Heidelberg, 263–301, https://doi.org/10.1007/978-3-662-47885-1_7, 2015.
Gonçalves, B. F. and Garabito, G.: Flexible layer-based 2D refraction tomography method for statics corrections, J. Appl. Geophys., 185, 104254, https://doi.org/10.1016/j.jappgeo.2021.104254, 2021.
Hootman, B. W.: Robust Surface-Consistent Deconvolution: Creating Inversion Ready Land Data, 73rd EAGE Conference and Exhibition – Workshops, https://doi.org/10.3997/2214-4609.20144670, 2011.
Hou, Q., Zhou, W. J., Yu, Z. Q., Hu, T. Y., Zhao, G. C., Yang, X. Y., Zhao, T. P., Tang, C., Fu, J. M., Liu, L., and Lu, Y. Y.: Geochronology, petrogenesis and tectonic significance of two episodes of Neoproterozoic diabasic magmatism in South China: from orogenesis to intracontinental rifting, Int. Geol. Rev., 64, 3074–3098, https://doi.org/10.1080/00206814.2021.2012718, 2022.
Hu, J., Yu, X. Q., Xiao, W. J., and Li, W.: Transpression in the Eastern Jiangnan Orogen and its implications for ductile deformation process and regional Tectonics of the South China block, J. Struct. Geol., 186, 105199, https://doi.org/10.1016/j.jsg.2024.105199, 2024.
Jahn, B. M., Zhou, X. H., and Li, J. L.: Formation and tectonic evolution of Southeastern China and Taiwan: Isotopic and geochemical constraints, Tectonophysics, 183, 145–160, https://doi.org/10.1016/0040-1951(90)90413-3, 1990.
Kazemi, N., Bongajum, E., and Sacchi, M. D.: Surface-Consistent Sparse Multichannel Blind Deconvolution of Seismic Signals, IEEE Trans. Geosci. Remote Sens., 54, 3200–3207, https://doi.org/10.1109/TGRS.2015.2513417, 2016.
Kirchheimer, F. and Ferber, R.: Robust surface-consistent deconvolution with noise suppression, SEG Technical Program Expanded Abstracts 2001, 1831–1834, https://doi.org/10.1190/1.1816486, 2001.
Krishna, V. G. and Rao, V. V.: Processing and modelling of short-offset seismic refraction-coincident deep seismic reflection data sets in sedimentary basins: an approach for exploring the underlying deep crustal structures, Geophys. J. Int., 163, 1112–1122, https://doi.org/10.1111/j.1365-246X.2005.02792.x, 2005.
Lan, N. Y., Zhang, F. C., and Li, C. H.: Robust high-dimensional seismic data interpolation based on elastic half norm regularization and tensor dictionary learning, Geophysics, 86, V431–V444, https://doi.org/10.1190/geo2020-0784.1, 2021.
Li, L. M., Lin, S. F., Xing, G. F., Davis, D. W., Jiang, Y., Davis, W., and Zhang, Y. J.: Ca. 830 Ma back-arc type volcanic rocks in the eastern part of the Jiangnan orogen: Implications for the Neoproterozoic tectonic evolution of South China Block, Precambrian Res., 275, 209–224, https://doi.org/10.1016/j.precamres.2016.01.016, 2016.
Li, X. H., Li, Y. X., Wang, J. Y., Zhang, C. K., Wang, Y., and Liu, L.: Temporospatial variation in the late Mesozoic volcanism in southeast China, Solid Earth, 10, 2089–2101, https://doi.org/10.5194/se-10-2089-2019, 2019.
Liu, G. F., Meng, X. H., and Sea, J. G.: Case study: Improving the quality of the seismic reflection image for a Fujian mineral exploration data set with offset-domain common-image gathers, Geophysics, 86, B277–B289, https://doi.org/10.1190/geo2019-0770.1, 2021.
Liu, J. H., Yong, F., Liu, Z. D., Zhang, H., and Yan, J. Y.: Crustal Structure Characteristics of the Middle Part of Jiangnan Orogenic Belt: Insights from Random Medium Correlation Length Analysis of Wuning–Ji'an Deep Seismic Reflection Profile, Acta Geosci. Sin., 43, 803–816, https://doi.org/10.3975/cagsb.2022.062601, 2022.
Liu, J. N., Huang, X. L., Xia, X. Y., and Li, X. P.: U-Pb and Hf Isotopic Analyses for Detrital Zircon of the Danzhou Group in the Western Jiangnan Orogenic Belt and Tectonic Implications, Minerals, 15, https://doi.org/10.3390/min15010070, 2025.
Lü, Q. T., Yan, J. Y., Shi, D. N., Dong, S. W., Tang, J. T., Wu, M. A., and Chang, Y. F.: Reflection seismic imaging of the Lujiang–Zongyang volcanic basin, Yangtze Metallogenic Belt: An insight into the crustal structure and geodynamics of an ore district, Tectonophysics, 606, 60-77, https://doi.org/10.1016/j.tecto.2013.04.006, 2013.
Lu, Z. W., Guo, X. Y., Gao, R., Murphy, M. A., Huang, X. F., Xu, X., Li, S. Z., Li, W. H., Zhao, J. M., Li, C. S., and Xiang, B.: Active construction of southernmost Tibet revealed by deep seismic imaging, Nat. Commun., 13, 3143, https://doi.org/10.1038/s41467-022-30887-3, 2022.
Lu, Z. W., Gao, R., Guo, X. Y., Li, W. H., Xu, X., Shi, Z. X., Cheng, Y. Z., Wu, G. W., and Cai, Y. G.: The funnel-shaped crustal architecture in central Tibet and its insights into the progression of lithospheric removal, Geology, 53, 587–591, https://doi.org/10.1130/g52955.1, 2025.
Luo, F., Lü, Q. T., Zhang, K., Yan, J. Y., Farquharson, C. G., Zhang, C., and Fu, G. M.: Crustal Electrical Structure and Deep Metallogenic Potential in Northern Wuyi Area (South China), based on Magnetotelluric Data, Acta Geosci. Sin., 96, 791–805, https://doi.org/10.1111/1755-6724.14864, 2022.
Mao, X., Ye, G. F., Zhang, Y. X., Jin, S., and Wei, W. B.: Electric structure of the southern section of the Jiangnan orogenic belt and its tectonic implications, Chin. J. Geophys., 64, 4043–4059, https://doi.org/10.6038/cjg2021O0424, 2021.
Markovic, M., Maries, G., Malehmir, A., von Ketelhodt, J., Bäckström, E., Schön, M., and Marsden, P.: Deep reflection seismic imaging of iron-oxide deposits in the Ludvika mining area of central Sweden, Geophys. Prospect., 68, 7–23, https://doi.org/10.1111/1365-2478.12855, 2019.
Naghizadeh, M., Snyder, D., Cheraghi, S., Foster, S., Cilensek, S., Floreani, E., and Mackie, J.: Acquisition and Processing of Wider Bandwidth Seismic Data in Crystalline Crust: Progress with the Metal Earth Project, Minerals, 9, 145–158, https://doi.org/10.3390/min9030145, 2019.
Panea, I., Prisacari, S., Mocanu, V., Micu, M., and Paraschivoiu, M.: The use of seismic modeling for the geologic interpretation of deep seismic reflection data with low signal-to-noise ratios, Interpretation, 5, T23–T31, https://doi.org/10.1190/int-2016-0046.1, 2017.
Poole, A., Bilsby, P., Giles, M., and Morgan, G.: Wide Azimuth Acquisition with Radial Domain Interpolation for Fluvial Morphology Interpretation, 77th EAGE Conference and Exhibition 2015, https://doi.org/10.3997/2214-4609.201413182, 2015.
Schonewille, M., Klaedtke, A., Vigner, A., Brittan, J., and Martin, T.: Seismic data regularization with the anti-alias anti-leakage Fourier transform, First Break, 27, 85–92, https://doi.org/10.3997/1365-2397.27.1304.32570, 2009.
Schonewille, M., Yan, Z., Bayly, M., and Bisley, R.: Matching pursuit Fourier interpolation using priors derived from a second data set, SEG Tech. Prog. Expanded Abstr., 2013, https://doi.org/10.1190/segam2013-0956.1, 2013.
Snyder, D. B., Bleeker, W., Reed, L. E., Ayer, J. A., Houle, M. G., and Bateman, R.: Tectonic and Metallogenic Implications of Regional Seismic Profiles in the Timmins Mining Camp, Econ. Geol., 103, 1135–1150, https://doi.org/10.2113/gsecongeo.103.6.1135, 2008.
Sun, J. J., Shu, L. S., Santosh, M., and Wang, L. S.: Precambrian crustal evolution of the central Jiangnan Orogen (South China): Evidence from detrital zircon U-Pb ages and Hf isotopic compositions of Neoproterozoic metasedimentary rocks, Precambrian Res., 318, 1–24, https://doi.org/10.1016/j.precamres.2018.09.008, 2018.
Taner, M. T. and Koehler, F.: Surface consistent corrections, Geophysics, 46, 17–22, https://doi.org/10.1190/1.1441133, 1981.
Trad, D.: Five-dimensional interpolation: Recovering from acquisition constraints, Geophysics, 74, V123–V132, https://doi.org/10.1190/1.3245216, 2009.
Wang, J. and Li, Z. X.: History of Neoproterozoic rift basins in South China: implications for Rodinia break-up, Precambrian Res., 122, 141-158, https://doi.org/10.1016/S0301-9268(02)00209-7, 2003.
Wang, X. L., Zhou, J. C., Chen, X., Zhang, F. F., and Sun, Z. M.: Formation and Evolution of the Jiangnan Orogen, Bull. Mineral. Petrol. Geochem., 36, 714–735, https://doi.org/10.3969/j.issn.1007-2802.2017.05.003, 2017.
Wang, X. Z., Zhang, L. X., Liang, Q. S., Jiang, C. F., Wang, W., Yao, X. L., Shi, H., Zhao, C. L., Hinz, C., Liu, Q. L., van Barren, P., Zhang, M., Zou, X., and Liang, B.: Full-azimuth, high-density, 3D point-source/point-receiver seismic survey for shale gas exploration in a loess plateau: a case study from the Ordos basin, China, First Break, 32, https://doi.org/10.3997/1365-2397.32.9.77970, 2014.
Wu, T. T. and Xu, Y. S.: Inverting Incomplete Fourier Transforms by a Sparse Regularization Model and Applications in Seismic Wavefield Modeling, J. Sci. Comput., 92, 48, 10.1007/s10915-022-01906-8, 2022.
Xu, D. R., Deng, T., Chi, G. X., Wang, Z. L., Zou, F. H., Zhang, J. L., and Zou, S. H.: Gold mineralization in the Jiangnan Orogenic Belt of South China: Geological, geochemical and geochronological characteristics, ore deposit-type and geodynamic setting, Ore Geol. Rev., 88, 565–618, https://doi.org/10.1016/j.oregeorev.2017.02.004, 2017.
Yan, J. Y., Lü, Q. T., Zhang, Y. Q., Liu, W. Q., Wang, X., Chen, C. X., Xu, Y., and Liu, J. H.: The deep boundaries of Jiangnan orogenic belt and its constraints on metallogenic : From the understanding of integrated geophysics, Acta Petrol. Sin., 38, 544–558, https://doi.org/10.18654/1000-0569/2022.02.16, 2022.
Yan, J. Y., Chen, H., Deng, J. Z., Yu, H., You, Y. X., Wen, Y. D., and Feng, M.: Lithospheric Conductivity Structure in the Middle Segment of the Jiangnan Orogenic Belt: Insights into Neoproterozoic Tectonic–Magmatic Processes, Lithosphere, 2024, 2325, https://doi.org/10.2113/2024/lithosphere_2023_325, 2024.
Yao, J. L., Shu, L. S., and Santosh, M.: Neoproterozoic arc-trench system and breakup of the South China Craton: Constraints from N-MORB type and arc-related mafic rocks, and anorogenic granite in the Jiangnan orogenic belt, Precambrian Res., 247, 187–207, https://doi.org/10.1016/j.precamres.2014.04.008, 2014.
Yao, J. L., Cawood, P. A., Shu, L. S., and Zhao, G. C.: Jiangnan Orogen, South China: A ∼970–820 Ma Rodinia margin accretionary belt, Earth-Sci. Rev., 196, 102872, https://doi.org/10.1016/j.earscirev.2019.05.016, 2019.
Zappalá, S., Malehmir, A., Kranis, H., Apostolopoulos, G., and Papadopoulou, M.: Reflection seismic imaging across the Thinia valley (Greece), Solid Earth, 16, 409–423, https://doi.org/10.5194/se-16-409-2025, 2025.
Zhang, Z. H., Zhang, D., He, X. L., Hu, B. J., Zhu, X. Y., Du, Z. Z., JIia, W. B., and Gong, X. D.: Biotite granodiorite age of Jiuling complex in Jiangxi Province and its limitation on the collision and splicing time of the Yangtze and Cathay plates, China Geol., 48, 1562–1579, https://doi.org/10.12029/gc20210518, 2021.
Zhou, X. M. and Li, W. X.: Origin of Late Mesozoic igneous rocks in Southeastern China: implications for lithosphere subduction and underplating of mafic magmas, Tectonophysics, 326, 269–287, https://doi.org/10.1016/S0040-1951(00)00120-7, 2000.
Zhu, X. S., Gao, R., Li, Q. S., Guan, Y., Lu, Z. W., and Wang, H. Y.: Static corrections methods in the processing of deep reflection seismic data, J. Earth Sci., 25, 299–308, https://doi.org/10.1007/s12583-014-0422-x, 2014.
Zhuravko, N. S., Laptev, Y. V., Adamovich, O. O., and Tinakin, A. O.: Application of Robust Surface-Consistent Deconvolution, Geomodel 2015 – 17th science and applied research conference on oil and gas geological exploration and development, https://doi.org/10.3997/2214-4609.201413916, 2015.
- Abstract
- Introduction
- Geological and Geophysical Settings
- Target-oriented Seismic Data Pre-processing
- Deep Seismic Reflection Data Regularization
- Discussion
- Conclusions
- Data availability
- Author contributions
- Competing interests
- Disclaimer
- Acknowledgements
- Financial support
- Review statement
- References