the Creative Commons Attribution 4.0 License.
the Creative Commons Attribution 4.0 License.
 | 21 May 2026
Distributed right-lateral strain at the northern boundary of the Quito-Latacunga microblock
Nicolas Harrichhausen
Léo Marconato
Laurence Audin
Pierre Lacan
Stéphane Baize
Hervé Jomard
Alexandra Alvarado
James Hollingsworth
Pierre-Henri Blard
Patricia Ann Mothes
Frédérique Rolandone
Iván Dario Ortiz Martin
Remote sensing and field data suggest distributed right-lateral faulting at the northern edge of the Quito-Latacunga microblock in northern Ecuador and southern Colombia. Off the west coast of Ecuador and Colombia, oblique subduction of the Nazca Plate beneath the South America plate induces NE-motion of the Northern Andean Sliver relative to stable South America. Recent geodetic studies show this sliver comprises several independent microblocks, with strain accommodated at each of their boundaries. The Quito-Latacunga microblock, located in the densely populated Inter-Andean valley, shows approximately 3 mm yr−1 of right-lateral strain at its northern boundary. However, which structures accommodate this deformation is unclear. Using available digital terrain models (DTMs), local DTMs derived from Pleiades satellite stereo-imagery, InSAR, Google Earth imagery, and field surveys, we demonstrate deformation at the northern boundary is distributed across several NE-striking right-lateral faults in Ecuador and Colombia. InSAR shows that a recent 2022 M 5.6 earthquake resulted in line-of-sight displacement of 5 to 13 cm along one of the ENE-striking, right-lateral faults. Offset sediments and glacial features indicate recent earthquakes on two other faults (the Reservoir and Polylepis faults) north of and subparallel with this rupture. Displaced glacial landforms along the Reservoir fault show slip rates between 0.8 and 6.1 mm yr−1, suggesting geologic slip rates that could be higher than geodetic ones. Exposures of the Reservoir fault also show evidence for at least three surface rupturing earthquakes with magnitudes between M 6.3 and M 7.0. Inflation at the nearby Chile-Cerro Negro volcano may influence earthquakes on these faults, enhancing slip and earthquake rates. The Polylepis, Reservoir, and 25 July earthquake faults all overlap with the proposed area for the 15 August 1868, M 6.4–6.8 El Angel earthquake, indicating they could be associated with this damaging event.
- Article
(15507 KB) - Full-text XML
- BibTeX
- EndNote


Geodetic block models help show where crustal strain is concentrated, and thus have been used to delineate faults and help determine seismic hazard in regions where active faults are difficult to map (e.g., McCaffrey et al., 2007; Allmendinger et al., 2009; Benford et al., 2012; Evans, 2022). The high strain regions between geodetically defined elastic blocks, however, vary in width, and either can be composed of a single or a few discrete structures, or distributed deformation on many structures across a wider area (e.g., Loveless and Meade, 2011; Elliott and Freymueller, 2020). These different boundary types can be considered in earthquake source models for seismic hazard assessment as area sources if fault locations are very uncertain, as single through-going faults capable of hosting very large earthquakes, or as many smaller structures, which may limit rupture size. Given the spacing of Global Navigation Satellite System (GNSS) stations in many parts of the world is often >>10 km (e.g., Mothes et al., 2013; Geirsson et al., 2017), the block models alone cannot predict whether deformation is focused or more distributed, and where it is focused onto faults. Thus, while highly useful in targeting areas where crustal deformation is occurring, other methods are required to further characterize the distribution of faulting that accommodates deformation in the upper crust.
A geodetic block model of northwestern South America has shown that the Northern Andean forearc Sliver (NAS), which moves NE relative to stable South America, actually comprises several independently moving tectonic blocks (Fig. 1, Jarrin et al., 2023). In the northern Andes of Ecuador and southern Colombia, one of these independent blocks, the Quito-Latacunga microblock, is defined on parts of its western and eastern boundaries by mapped fold and thrust belts, and oblique shear zones (Eguez et al., 2003; Alvarado et al., 2016; Marinière et al., 2020). Which structures accommodate deformation at the northern boundary, however, is less clear. Active faults have been identified in southern Colombia (e.g., Tibaldi and Leon, 2000; Rovida and Tibaldi, 2005) and northern Ecuador (e.g., Alvarado, 2012; Veloza et al., 2012). Nonetheless, these structures are not aligned with, or that close to, the predicted location of the northern edge of the microblock or their slip rates and earthquake activity have not been confirmed on them with field studies. This region, centered on the Ecuador–Colombia border, has hosted destructive historical earthquakes (Beauval et al., 2010) and also contains several active volcanoes (Hall et al., 2008). Therefore, mapping active structures is important for hazard assessment and for exploring the interactions between crustal deformation, inherited structures, and volcanism.
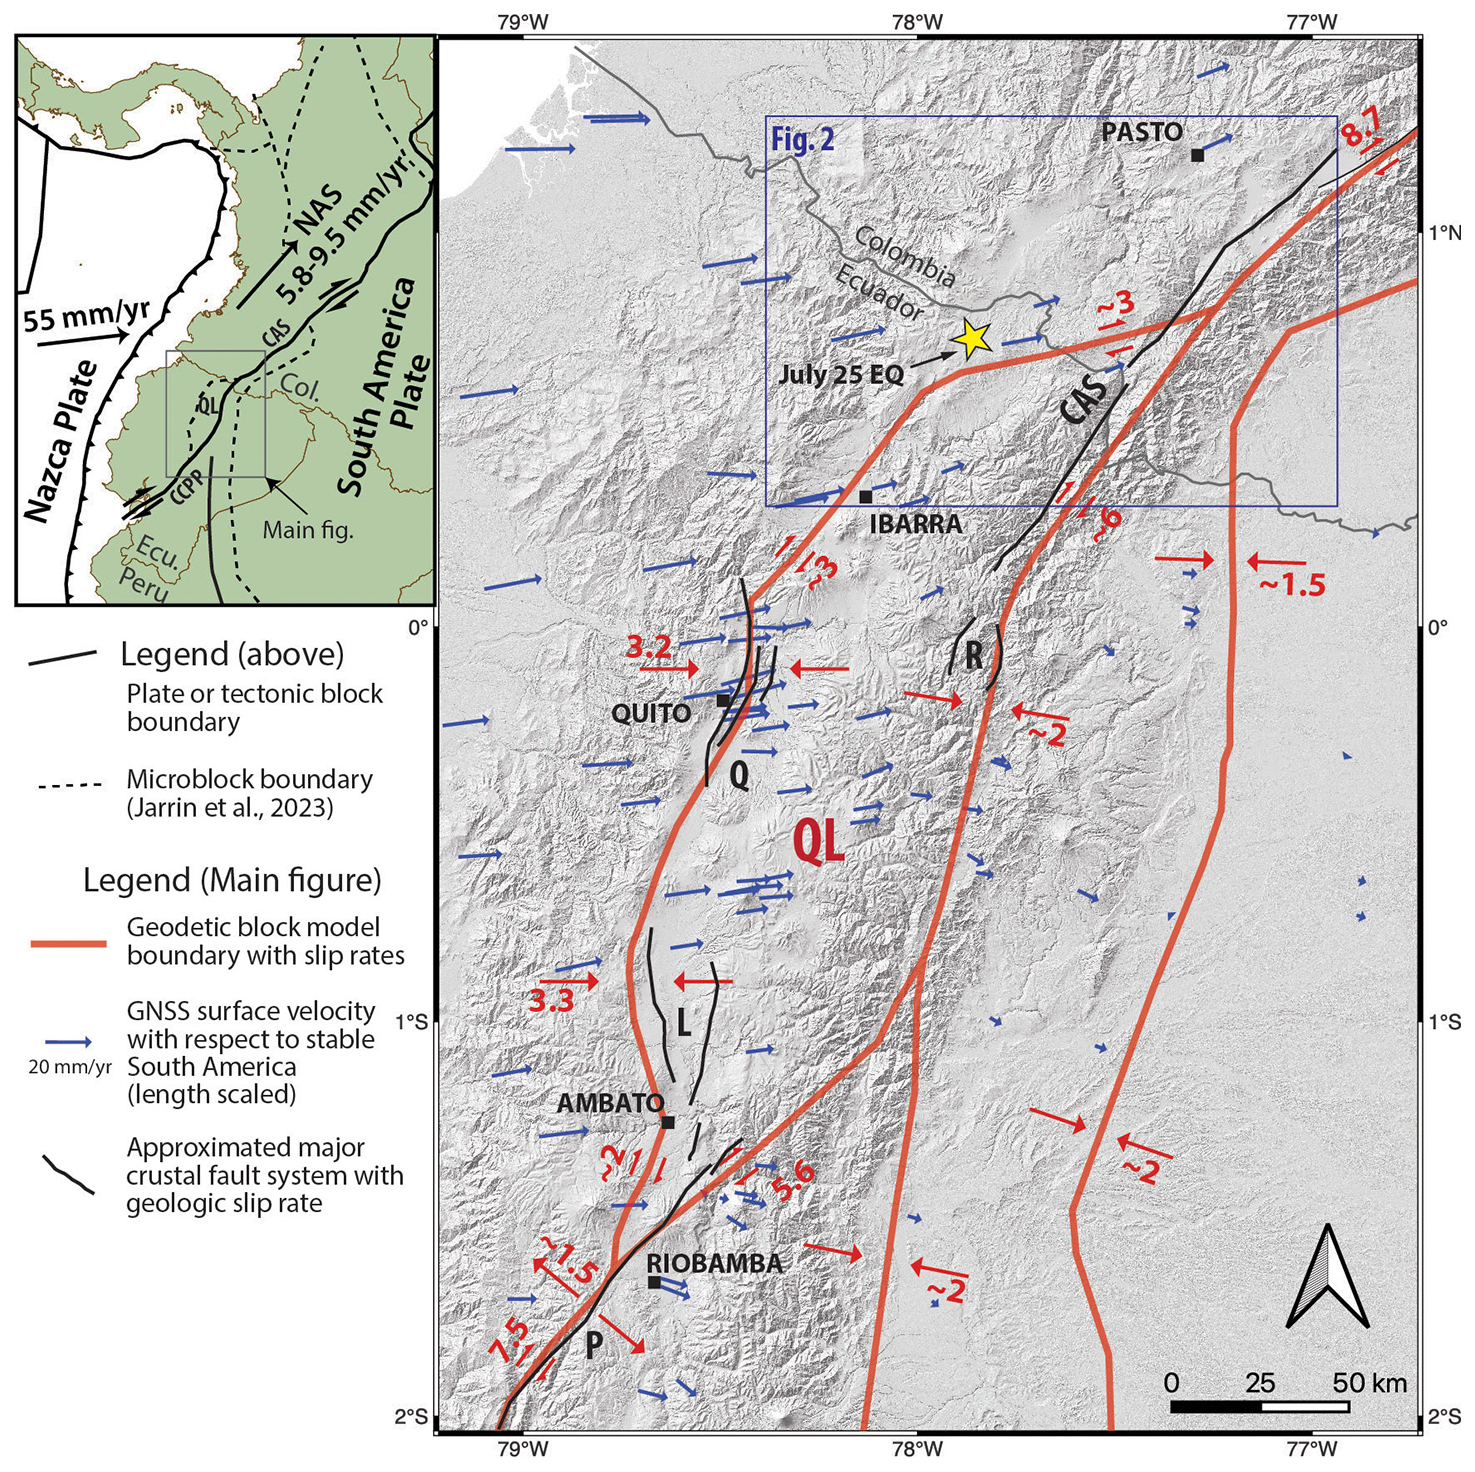
Figure 1Tectonic setting of the Quito-Latacunga microblock (QL); and GNSS velocities, geodetic block model boundaries, and deformation rates from Jarrin et al. (2023). QL boundaries with geologically constrained slip rates are the Quito fault system (Q), the Latacunga fault system (L), the Pallatanga fault (P), the Reventador thrust faults (R), and the Cayambe-Afiladores-Sibundoy fault (CAS). The inset shows the broader tectonic context of the Northern Andean Sliver (NAS) and its main eastern boundary fault, the Chingual-Cosanga-Pallatanga-Puná fault (CCPP) and the CAS fault. Location of Fig. 2 at the northern boundary of the microblock is also shown. Hillshaded DTM in main figure is a Copernicus 30 m DTM from https://dataspace.copernicus.eu/ (last access: January 2022).
On 25 July 2022 a Mw 5.6 right-lateral strike-slip earthquake ruptured a WSW to ENE striking fault close to the northern boundary of the geodetically defined Quito-Latacunga microblock (Fig. 1, IG-EPN, 2022). In this study, we used InSAR to investigate the coseismic surface deformation of this surface rupture, and we used field studies to place it in a tectonic context with nearby faults and volcanic centers. By using a combination of remote sensing and field data, we show that the earthquake ruptured one of several parallel right-lateral strike slip faults south of the Chiles-Cerro Negro volcanic complex, which cross-cut glacial moraines. We use cosmogenic dating to estimate the formation ages of the moraines and right-lateral slip rates of one of the faults. Excavations across one of the faults parallel with the recent rupture reveals at least three Holocene earthquakes offsetting volcanic soils. These faults lie within the proposed epicentral area and could be responsible for the 1868 M 6.8 earthquake that damaged the city of El Angel. By placing these results in context with parallel right-lateral faults in Colombia (e.g., Tibaldi and Leon, 2000; Rovida and Tibaldi, 2005) and regional deformation revealed by InSAR (Marconato et al., 2024a), we show that the northern boundary of the Quito-Latacunga microblock is an up to ∼ 70-km-wide zone of distributed deformation.
Oblique subduction of the Nazca plate and collision of the Carnegie Ridge off the west coast of northern South America results in 5.8 to 9.5 mm yr−1 of northeastward motion of the NAS with respect to stable South America (Fig. 1; e.g., Pennington, 1981; Kellogg et al., 1995; Nocquet et al., 2014; Mora-Páez et al., 2019; Jarrin et al., 2023). This sliver motion was originally thought to be mostly taken up by large strike-slip and oblique-slip faults along its eastern margin (Pennington, 1981); primarily the Chingual-Cosanga-Pallatanga-Puná fault (CCPP) in Ecuador and the Cayambe-Afiladores-Sibundoy (CAS) fault and Eastern Frontal fault (EFF) system in Colombia (Velandia et al., 2005; Tibaldi et al., 2007; Alvarado et al., 2016). However, more recent work suggests that the NAS can be broken down into several smaller, independently moving, microblocks accommodating strain along each of their boundaries (e.g., Audemard et al., 2014; Alvarado et al., 2016; Audemard M et al., 2021; Jarrin et al., 2023). These studies highlight several regions where unmapped active faults accommodating the strain between the microblocks may be capable of hosting large damaging earthquakes.
2.1 Geodetic block model
A region where the Jarrin et al. (2023) geodetic block model suggests substantial deformation is at the northern edge of the Quito-Latacunga microblock near the border between Ecuador and Colombia (Figs. 1 and 2). The Quito-Latacunga microblock is located at a large (∼ 250 km N–S) left-stepping section of the right-lateral eastern boundary of the NAS (Fig. 1, Alvarado et al., 2016). The contractional left-stepping geometry results in ∼2 to 3.3 mm yr−1 of W–E compression along the more northerly trending eastern and western boundaries of the microblock and ∼ 3 to 6 mm yr−1 right-lateral strain along the more NE-trending southern and northern boundaries (e.g., Jarrin et al., 2023). Along the western boundary, the Quito and the Latacunga thrust fault systems have been shown to accommodate much of the predicted compression (Tibaldi and Ferrari, 1992; Lavenu et al., 1995; Fiorini and Tibaldi, 2012; Alvarado et al., 2016; Marinière et al., 2020). On the southeast boundary, 0.45–6.6 mm yr−1 of active right-lateral slip has been observed along the Pallatanga fault (Winter et al., 1993; Baize et al., 2015, 2020; Harrichhausen et al., 2023a) and faults along strike to the northeast that traverse the eastern Cordillera of the Andes (Alvarado et al., 2016; Champenois et al., 2017). At the eastern boundary, ∼ 10 mm yr−1 of right-lateral slip has been observed along the CAS (a part of the CCPP), and ∼ 4 mm yr−1 of W–E shortening has been observed on thrust faults near Reventador Volcano (Tibaldi et al., 2007). Along the northern boundary of the microblock, where the ∼ 3 mm yr−1 of predicted right-lateral strain is accommodated is not clear. NE-striking right-lateral Quaternary faults have been documented near the city of Pasto and on the flanks of the Galeras volcano in Colombia (Rovida and Tibaldi, 2005). Geologic and geomorphic studies of two of these structures, the Buesaco and Aranda faults, show 0.7–1.6 and 1.1–2.6 mm yr−1 of right-lateral reverse slip, respectively (Tibaldi and Leon, 2000). However, these faults are >45 km north of the northern boundary of the Quito-Latacunga microblock (Fig. 2, Jarrin et al., 2023). Historic and instrumental seismicity suggest active faulting further south in Ecuador as well, suggesting a wide zone of deformation distributed across several fault zones.
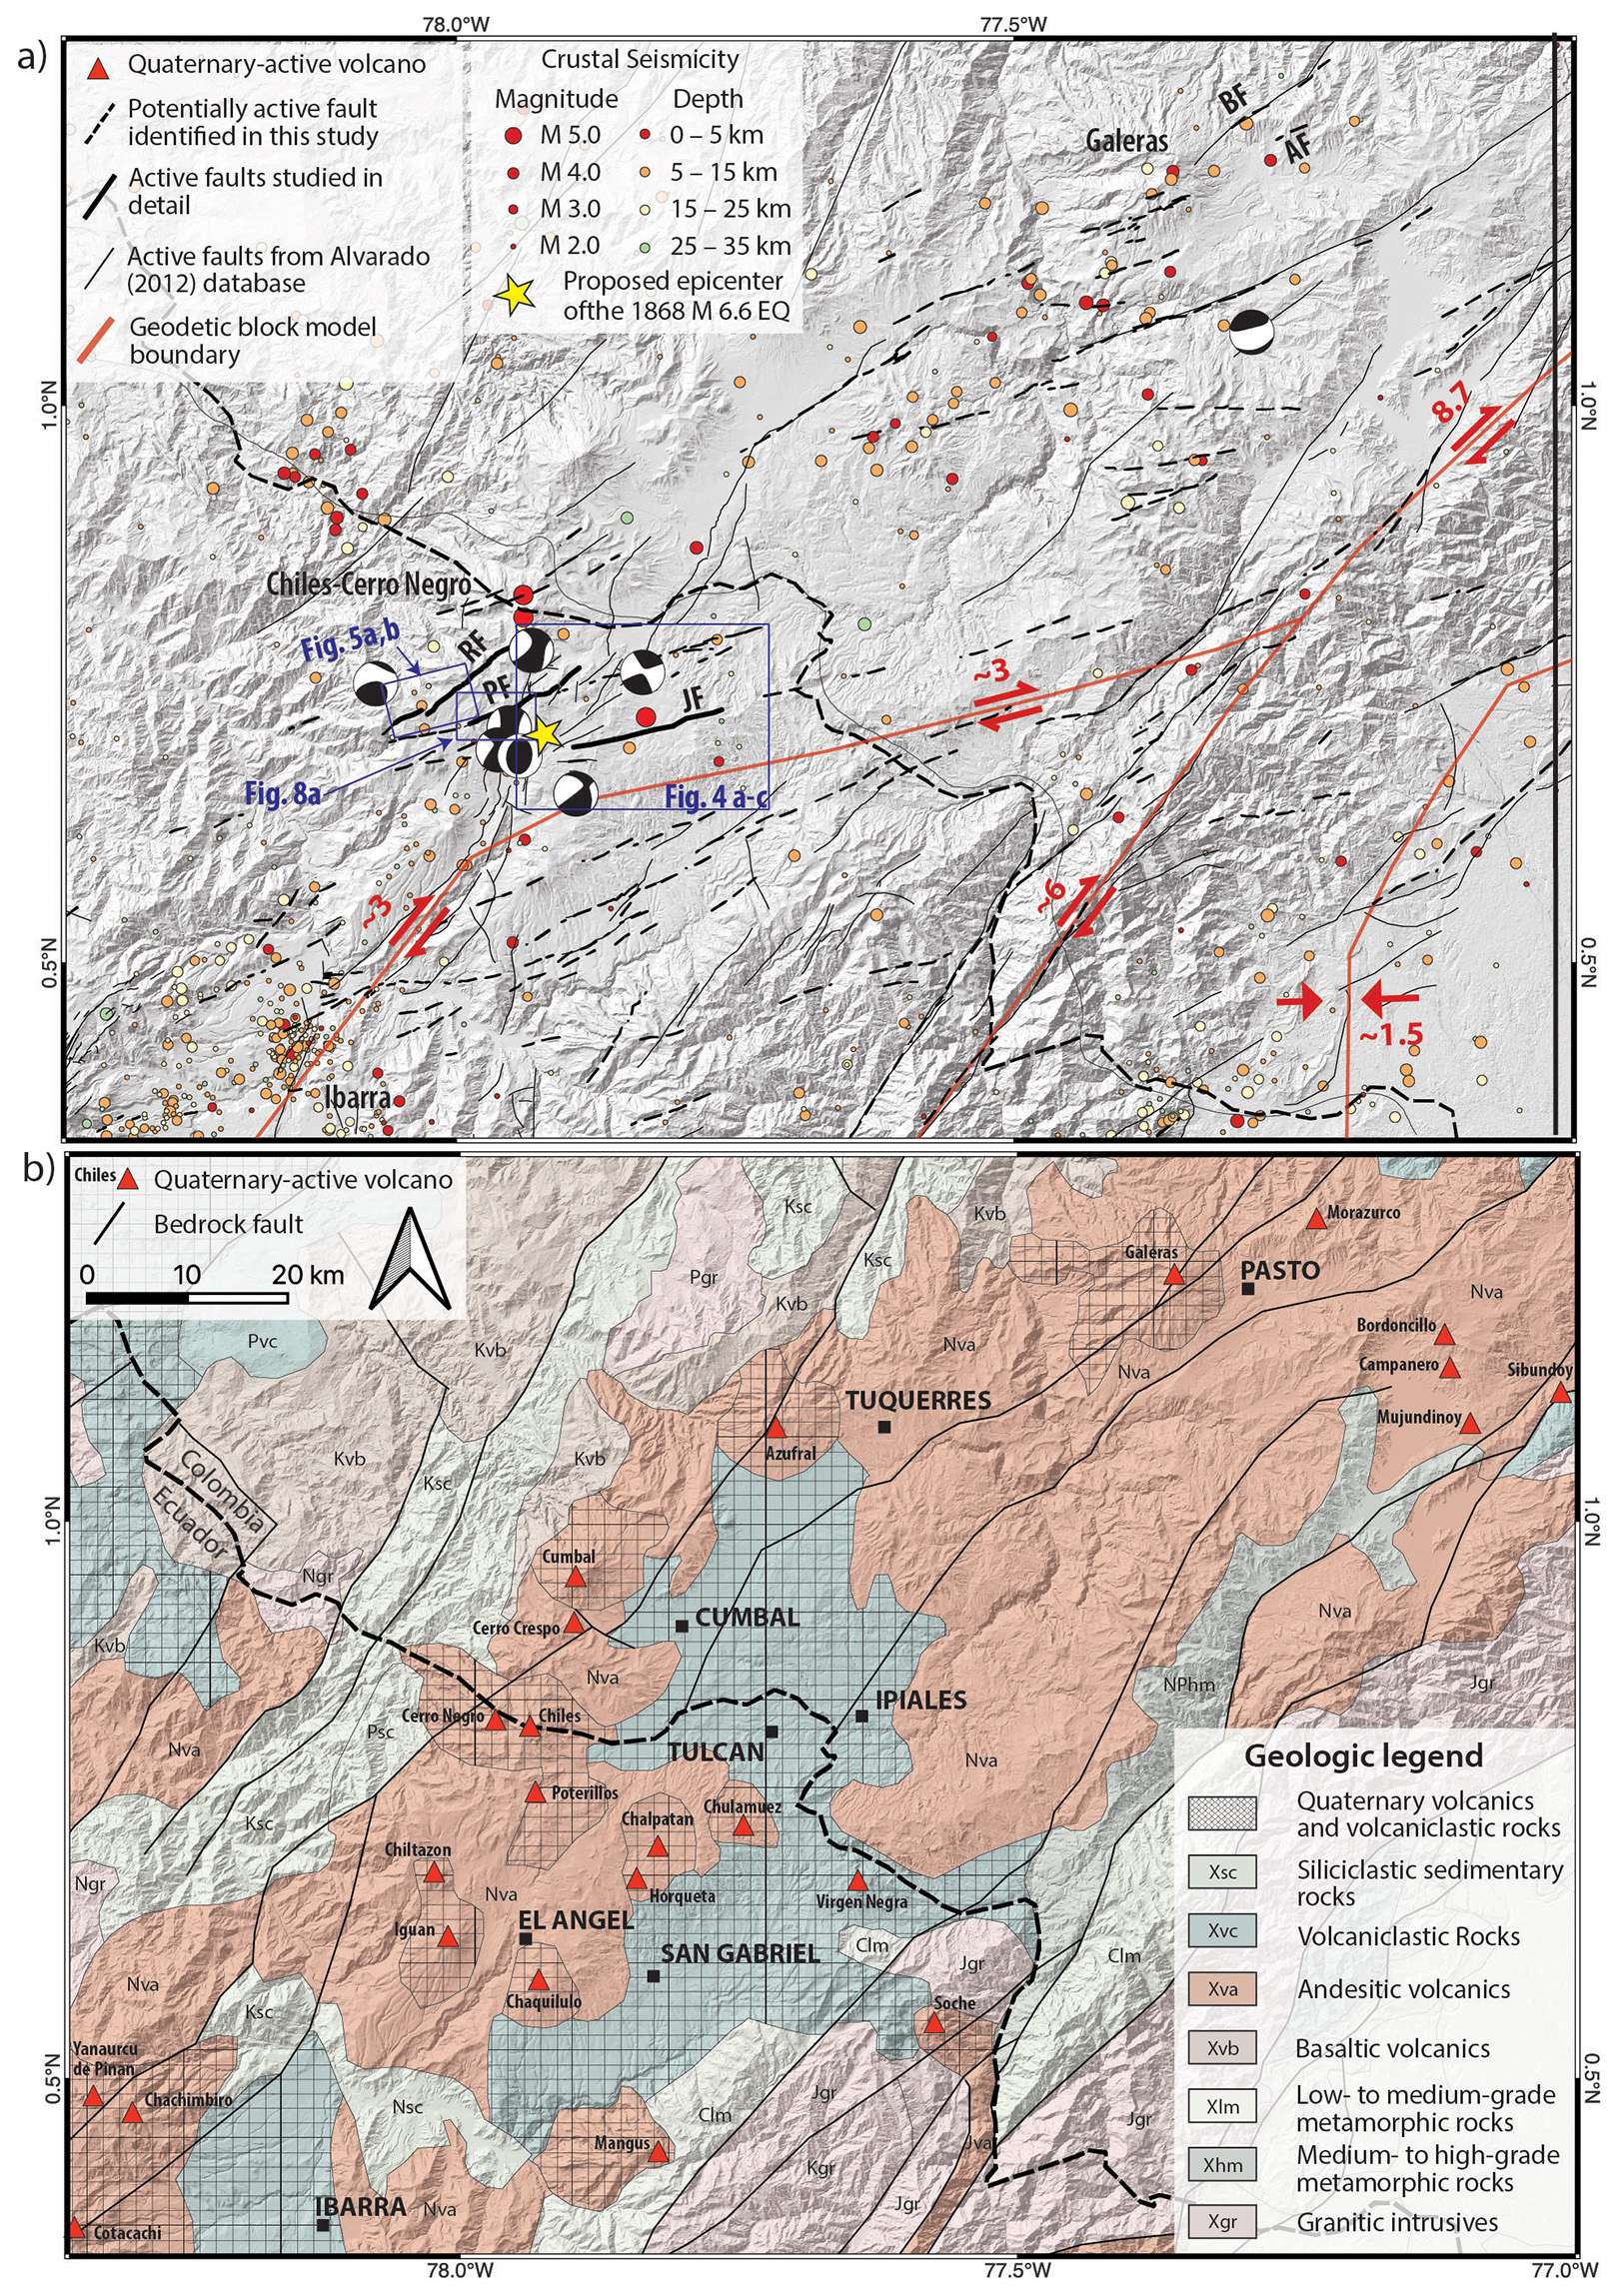
Figure 2(a) Hillshaded Copernicus 30 m DEM showing: the Jarrin et al. (2023) block model boundaries and their slip rates; crustal seismicity between 1993 and 2016 (before the 2016, M 7.8 Pedernales earthquake; IG-EPN); focal mechanisms of Mw>4.5 earthquakes from 1980–2024 from the International Seismological Center (ISC) catalogue (Lentas, 2017-11; Lentas et al., 2019); the proposed location of the 1868 M 6.6 earthquake (Beauval et al., 2010); the locations of the 25 July fault (JF), the Reservoir fault (RF), the Polylepis fault (PF), the Aranda fault (AF), and the Buesaco fault (BF); potentially active faults mapped in this study; and active faults from Alvarado (2012). The approximate locations of the Chiles-Cerro Negro and Galeras seismic swarms are also shown by their names. (b) Geologic map of the study area showing major bedrock faults and Quaternary-active volcanoes. Geologic compilation from Gómez et al. (2019). Copernicus DEM available at: https://dataspace.copernicus.eu/.
A southward decrease in the eastward component of the GNSS velocities across the northern boundary of the Quito-Latacunga microblock is consistent with the right-lateral strain predicted on ENE-WSW striking planes in the Jarrin et al. (2023) block model. GNSS stations near Tulcan, and ∼ 5 km north of the boundary observe 7.1 and 10.6 mm yr−1, respectively, of ENE motion relative to stable South America, while a station in Pasto, Colombia ∼ 40 km to the north indicates 8.4 mm yr−1 of NE motion (Fig. 1). Although no stations are located directly south of the boundary, stations ∼ 25 km SSE of the boundary in Ibarra and Pimampiro show 6.7 and 6.3 mm yr−1, respectively, of ENE motion with respect to stable South America. Thus, given the wide spacing of the GNSS stations, the location of the northern boundary of the Quito-Latacunga microblock (Jarrin et al., 2023) and whether strain here is localized on a single structure, or is distributed along several structures or as off-fault deformation, cannot be discerned from the GNSS data alone. This distinction is important for seismic hazard because if all of the strain is concentrated along a single fault, this fault will likely be longer, more mature, have a higher slip rate, and be capable of producing larger earthquakes with shorter recurrence intervals. Additionally, GNSS velocities may capture magmatic processes related to recent volcanic activity at the Chiles-Cerro Negro volcanic complex (Ebmeier et al., 2016) and Galeras volcano.
2.2 InSAR
Recent analysis of the interseismic InSAR velocity field in northern Ecuador and southern Colombia shows a better spatial resolution of deformation across the northern boundary of the Quito-Latacunga microblock, and supports a hypothesis that right-lateral deformation is distributed (Fig. 3, Marconato et al., 2024a). The eastward velocity field here shows no sharp gradient in velocities across the geodetic block boundary. Instead there is a N-to-S gentle reduction in eastward velocities from ∼ 1.3 to ∼ 0.8 mm yr−1 over ∼ 60 km (Fig. 3b). These estimates, however, may be influenced by ongoing inflation at Chiles-Cerro Negro and could be capturing transient volcanic deformation rather than being representative of long-term tectonic deformation (e.g., Ebmeier et al., 2016; Espín Bedón et al., 2025). This local deformation is illustrated by the substantial increase in the eastward velocity field across an axis that extends to the SSE from Chiles-Cerro Negro (Fig. 3a) along with a maximum uplift rate of 2.9 cm yr−1 southeast of the volcano. Another InSAR analysis by Espín Bedón et al. (2025) shows even greater eastward velocities east of Chiles-Cerro Negro (6 mm yr−1), and uplift rates of 15 mm yr−1.
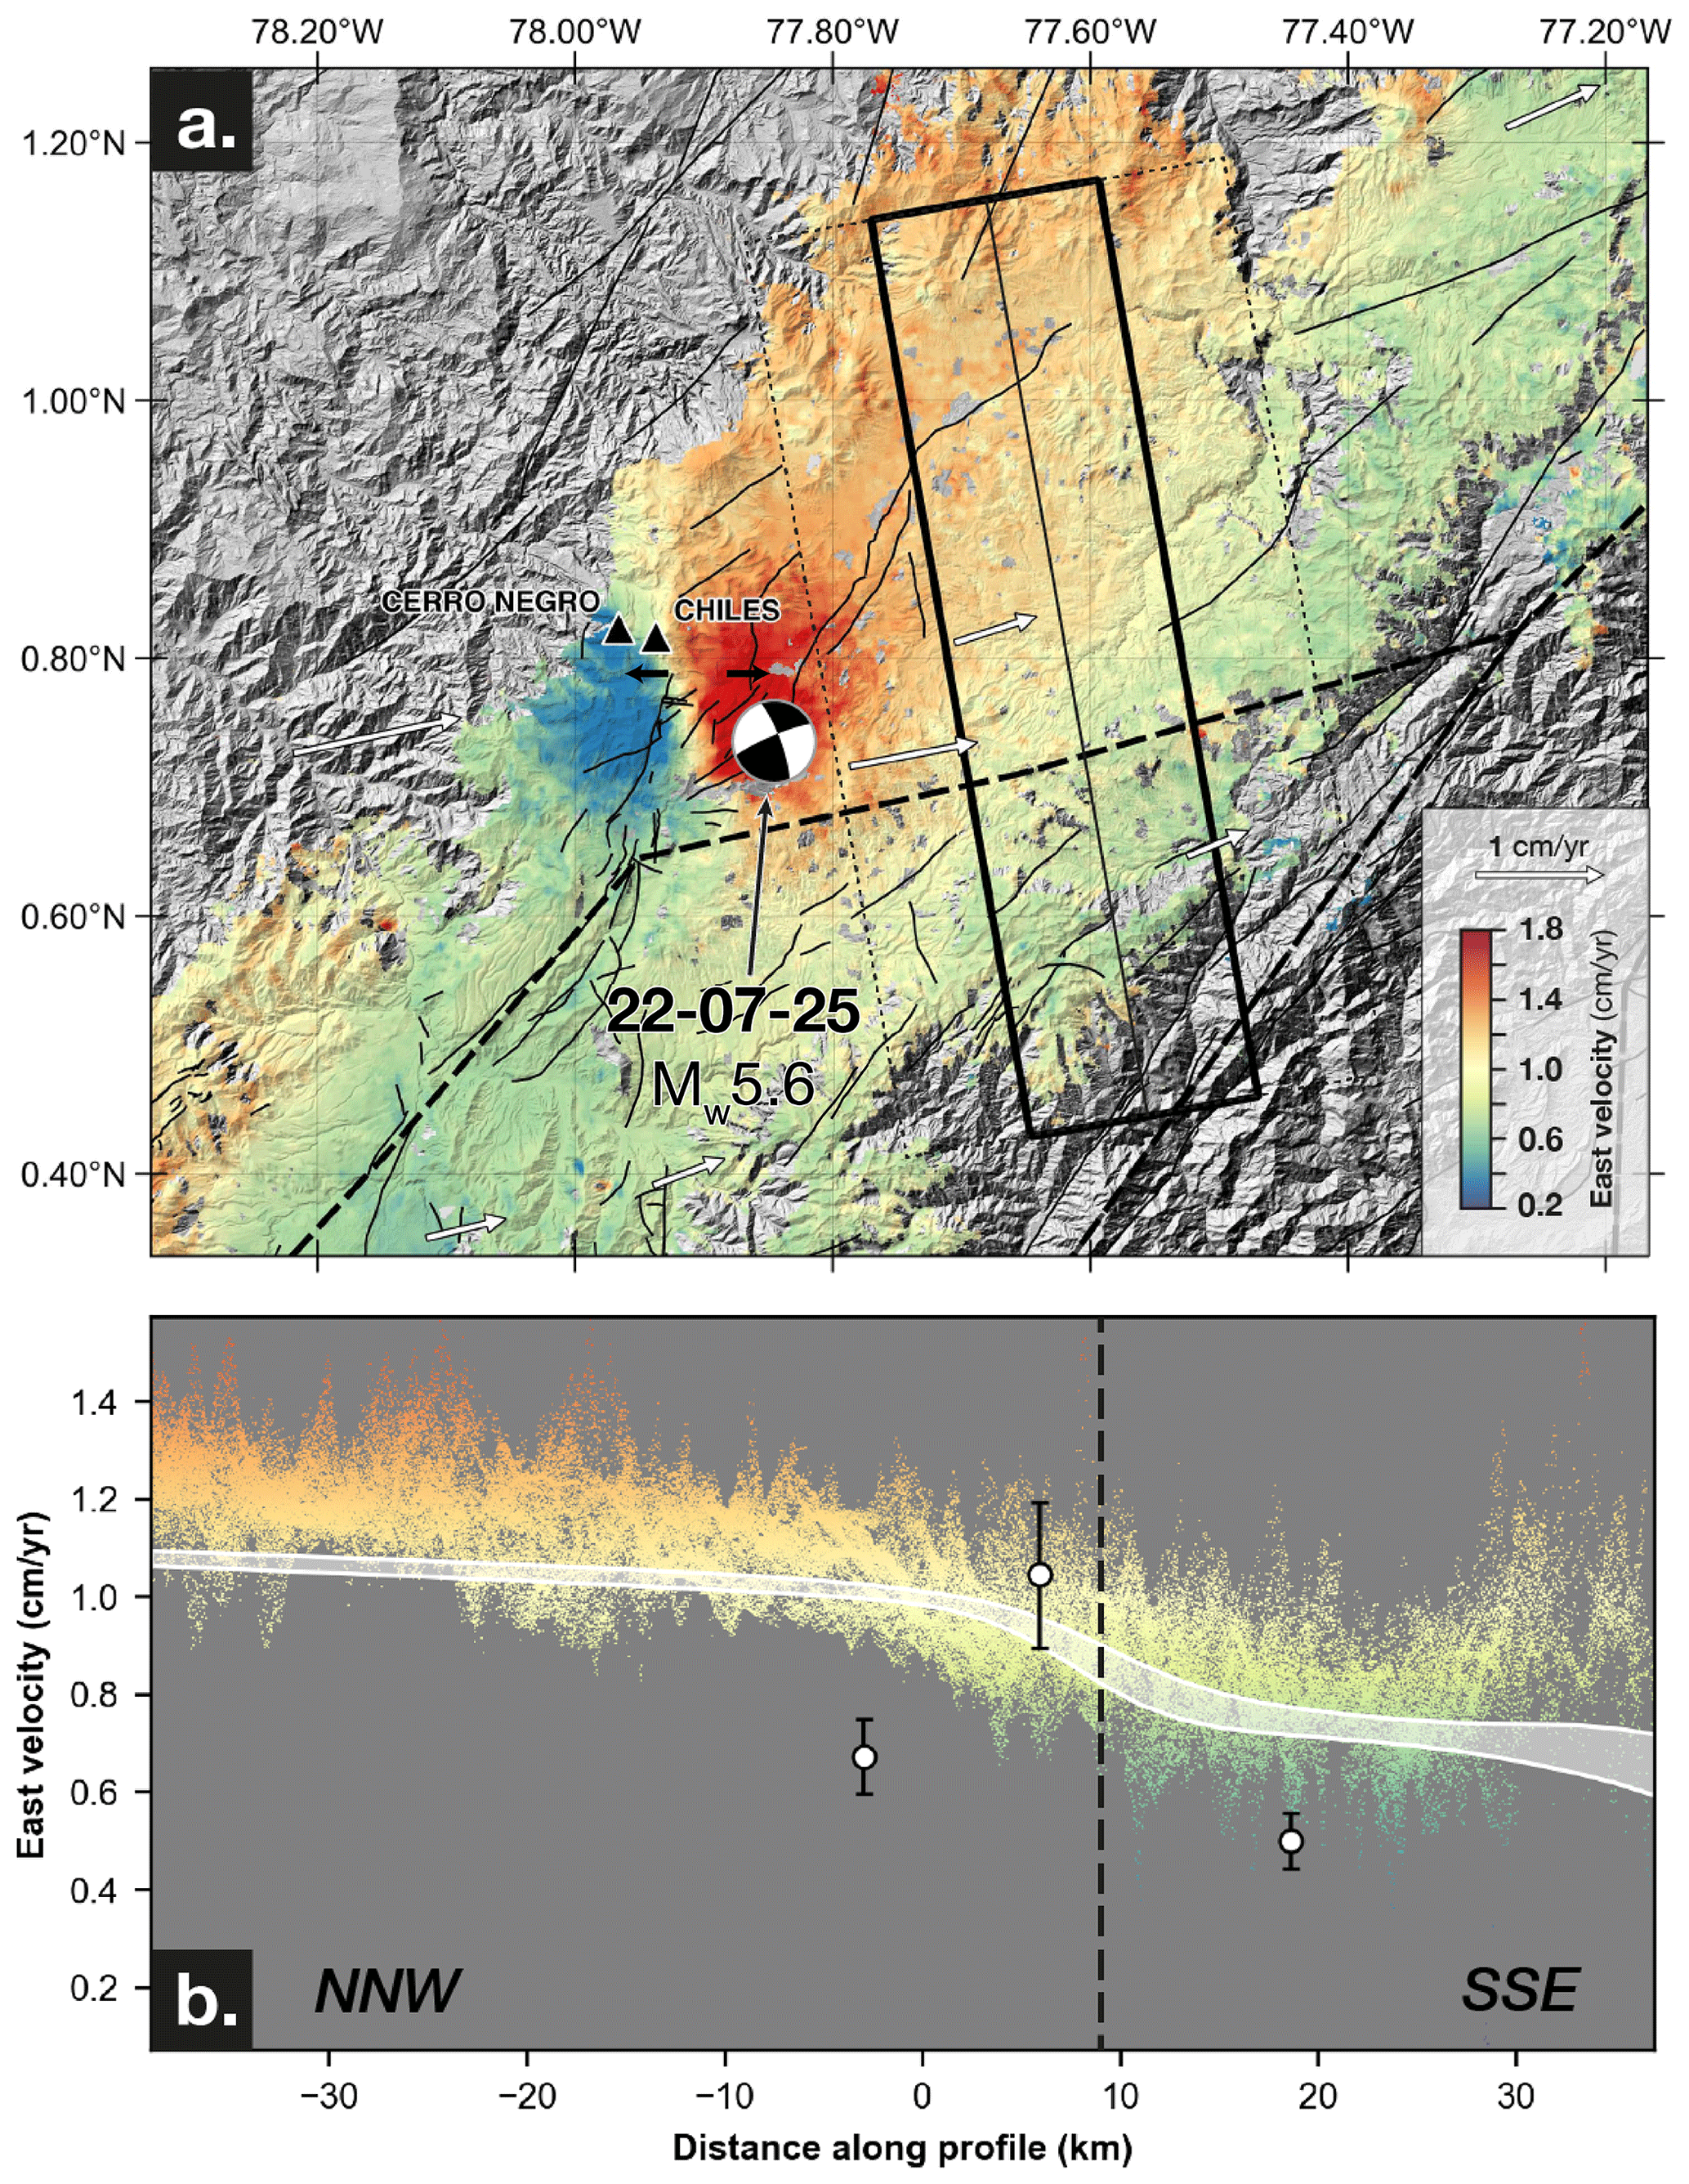
Figure 3(a) Interseismic InSAR velocity field for east component derived from Sentinel-1 time-series from Marconato et al. (2024a). The velocities are computed between 2017 and 2023 and corrected from the long-wavelength post-seismic effect of the 2016 Pedernales megathrust earthquake. Black arrows show westward and eastward extension away from a roughly N–S axis aligned with Chiles-Cerro Negro. White arrows show the GNSS velocity field from Jarrin et al. (2023), computed before 2016. The focal mechanism of the 25 July 2022 earthquake is shown (IG-EPN), however, the deformation shown does not include coseismic deformation associated with the earthquake. (b) Swath-profile of InSAR velocities (colored dots), GNSS velocities (white circles) and block model prediction (transparent white swath, Jarrin et al., 2023). The extent of the swath-profile is shown in (a) for InSAR and GNSS by solid and dashed rectangles, respectively.
2.3 Seismicity
Crustal seismicity at the northern boundary of the Quito-Latacunga microblock (1993 to 2016, IG-EPN) also shows diffuse strike-slip and compressive strain. Small (M 2.0) to moderate (M 5.0) earthquakes are dispersed throughout the region and are not clustered along the boundary defined by the Jarrin et al. (2023) block model. Instead, clusters are located near the Chile-Cerro Negro and Galeras volcanic systems, and near the city of Ibarra (Fig. 2). These earthquake swarms have been attributed to volcanic processes at Chiles-Cerro Negro in 2014 (Ebmeier et al., 2016) and Galeras in 1989 (Jiménez et al., 2009), while the swarms near Galeras in 1993 and 1995 have been suggested to have at least a partially tectonic origin (Jiménez et al., 2009). Focal mechanism analyses of this crustal seismicity indicates a S-to-N transition approximately at the Ecuador-Colombia border from compressive to strike-slip faulting with a relatively consistent W–E shortening direction (Arcila and Muñoz Martín, 2020). Focal mechanisms in this region of earthquakes with M>4.5 from the ISC catalogue (Fig. 2a Lentas, 2017-11; Lentas et al., 2019) show predominantly right-lateral slip on W–E trending faults, however some show a substantial non-double component indicating a volcanic source (e.g., Miller et al., 1998).
Instrumentally recorded and historical earthquakes with M>5.0, including the recent Mw 5.6 event that is analyzed in this study, have also occurred along the modeled northern boundary of the Quito-Latacunga block. In 1868, a sequence of two large M ∼6.6 and M ∼7.25 earthquakes separated by 10 h occurred in northern Ecuador (Beauval et al., 2010). Damage intensity data for the first M ∼6.6 earthquake suggests an epicentre in a region between El Angel and the Chiles-Cerro Negro volcanic system (Fig. 2a). The subsequent M 7.25 earthquake, which destroyed the city of Ibarra, is thought to have occurred either south or west of Ibarra and along the western boundary of the microblock. In Colombia, eight M∼5.6 to 6.3 earthquakes occurred between 1923 and 1947, causing substantial damage to communities such as Cumbal, Pasto and Túquerres (https://sish.sgc.gov.co/visor/, last access: August 2025). More recently, at the end of the 2014 earthquake swarm a M 5.6 right-lateral earthquake occurred on a moderately-dipping SW-striking fault plane ∼ 15 to 20 km south of Chiles-Cerro Negro. InSAR and Coulomb stress modeling suggest that this earthquake could be attributed to a pore fluid pressure increase resulting from volcanic inflation. However, its focal mechanism is consistent with tectonic stress and volcanism could potentially be just a trigger of the earthquake (Ebmeier et al., 2016). Finally, on 25 July 2022 a M 5.6 earthquake occurred 9 km north of San Gabriel, causing damage to this and several other nearby cities such as Tulcan and El Angel.
3.1 Bedrock geology
The northern boundary of the Quito-Latacunga microblock is located within the Inter-Andean Valley, a large depression filled with Pliocene to Quaternary volcanic and volcanosedimentary rocks, which overlie and obscure a major terrane boundary between oceanic terranes to the west and metamorphic basement rocks to the east (Fig. 2a). The metamorphosed sediments to the east are believed to represent the ancestral western margin of South America (Aspden and Litherland, 1992; Pratt et al., 2005), while the Jurassic to Cretaceous plutons that intrude into these sediments may represent a continental arc (e.g., Aspden and Litherland, 1992; Villagómez and Spikings, 2013; Bustamante et al., 2016; Zapata et al., 2016), or intrusions in an intracontinental rift (e.g., Cediel et al., 2003).
Three oceanic plateaus, which subsquently accreted to the ancient margin from late Cretaceous through to the Paleocene, comprise the basement rocks west of the terrane boundary in the Inter-Andean Valley. The San Juan terrane, which accreted to the South American margin at ∼75 Ma, and the Guaranda Terrane, which then accreted to the new margin outboard the San Juan terrane at ∼68 Ma, are exposed in our study area (Boland et al., 2000; Hughes and Pilatasig, 2002; Jaillard et al., 2004, 2009). These basement rocks are overlain by siliciclastic sediments likely derived from exhumation during accretion (Jaillard et al., 2004, 2009), and by younger volcanic rocks related to the modern arc (Boland et al., 2000). The two oceanic terranes are bounded by major, steeply-dipping, SW to NE-trending suture zones (Fig. 2a, Boland et al., 2000; Hughes and Pilatasig, 2002; Alvarado et al., 2016). These suture zones have been thought to have been reactivated (Guillier et al., 2001) and may accommodate the right-lateral shear and compression resulting from the NE motion of the NAS. Alvarado et al. (2016) have shown that many of these SSW to NNE trending structures in central Ecuador have been abandoned and are now cross-cut by more recent faulting. However, in southern Colombia near Pasto, the SW–NE trending Romeral shear zone separating the accreted terranes from the continental paleomargin (Aspden and McCourt, 1986; Vinasco, 2019) and parallel related structures have been shown to be reactivated as active right-lateral reverse faults (Tibaldi and Leon, 2000; Rovida and Tibaldi, 2005).
3.2 Miocene-Quaternary volcanism and glaciation
The basement lithologies and associated suture zones are overlain by thick deposits of Miocene to Quaternary volcanic and associated volcano-sedimentary rocks deposited by the numerous volcanic centers in the study area (Fig. 2). Several of these volcanic centers are clustered around the active Chiles-Cerro Negro complex, which hosted minor eruptive activity in the 19th century (Monsalve-Bustamante et al., 2020). Two other active volcanoes are located to the north in Colombia near the cities of Tuquerres and Pasto (Fig. 2). The Azufral volcano near Tuquerres has had 6 periods of eruptive activity over the last 220 thousand years, with the most recent being ∼ 280 years BP. The Galeras volano is located 9 km west of Pasto, Colombia, and has seen continuous activity since the 16th century (Monsalve-Bustamante et al., 2020). This volcanic activity at the northern edge of the Quito-Latacunga microblock could play a role in the location of deformation and in the onset of earthquakes (e.g., Ebmeier et al., 2016).
Along with recent volcanism, Quaternary glaciations have shaped much of the high-elevation landscape in the Andes of northern Ecuador and southern Colombia. Glaciations in this region occurred several times throughout the Pleistocene (>130 ka BP) with a maximum extent of ice that may have reached down to 2700 m (Smith et al., 2008; Angel et al., 2017). The last glacial maximum (LGM) occurred in this region 20–12 ka BP, resulting in ice caps and valley glaciers extending down to elevations between 3000 and 3800 m a.s.l. (Schubert and Clapperton, 1990). On the plateau surrounding the Chiles-Cerro Negro volcanic complex, U-shaped valleys, cirques, and terminal moraines that are indicative of recent glaciation (e.g., Taussi et al., 2023) are observed at elevations just below 3500 m a.s.l. Simlarly, Calvache and Duque-Trujillo (2016) recognize glacial landforms on the flanks of the Galeras Volcano in southern Colombia that terminate elevations just below 3400 m a.s.l. Although no ice caps remain on either of these volcanoes, the landscape suggests substantial glacial influence up to the beginning of the Holocene.
4.1 InSAR
To analyze the surface deformation associated with the 25 July 2022 earthquake, we computed coseismic SAR interferograms near El Angel using both Sentinel-1 (C-band) and ALOS-2 ScanSAR (L-band) SAR data. Two Sentinel-1 interferograms, from descending track 142 (17–29 July 2022; Fig. 4a) and ascending track 120 (15–27 July 2022; Fig. 4b) were produced using the ForM@Ter GDM-SAR-In service (https://www.poleterresolide.fr/le-service-gdm-sar-in/, last access: June 2024) based on the NSBAS processing chain (Doin et al., 2011; Thollard et al., 2021). One ALOS-2 ScanSAR interferogram, from descending track 139 (10 July–21 August 2022; Fig. 4c) was also computed using the GMTSAR software (Sandwell et al., 2011). Note that an ionospheric phase screen obtained using the split-spectrum technique was removed from the ALOS-2 interferogram (Gomba et al., 2015). All interferograms were filtered using a sliding window removing the phase gradient before filtering and reintroducing it afterwards (e.g., Marconato et al., 2024b). The ALOS-2 interferogram being very coherent and containing few fringes caused by coseismic displacements, could be unwrapped easily even close to the rupture using a region growing algorithm (Fig. 4d, Doin et al., 2023). An unwrapped Sentinel-1 interferogram is also provided in the data repository (Fig. S2, Harrichhausen et al., 2026).
4.2 Geomorphic mapping
Reconnaissance geomorphic mapping to map potentially active faults was conducted using GoogleEarth Pro (version: 7.3.6.10201), a hillshaded 4 m-resolution lidar- and photogrammetry-derived digital terrain model (DTM) of selected areas in Ecuador from SigTierras of the Ecuadorian Ministry of Agriculture, Quito (http://ide.sigtierras.gob.ec/geoportal/, last access: July 2023), and a 5 m resolution GeoSAR acquired DTM of southern Colombia from the Geological Survey of Colmbia GeoSAR project (2020) that is available in a data repository (Harrichhausen et al., 2026). Potentially active faults were mapped using QGIS software v. 3.22 (QGIS Association, 2018), by identifying continuous lineaments in the landscape with horizontal or vertical offsets of Quaternary-aged geomorphic features (e.g. glacial moraines and channels). Often, the expected offsets of slowly-slipping faults in young recently-glaciated landscapes would be expected to be lower than the resolution of the DTMs we used (e.g., Harrichhausen et al., 2023b). Therefore, we also considered lineaments where clear offsets were not visible but there was evidence of topographic benches and associated landslides seen in satellite imagery.
To further assess the potentially active faults we mapped using the lower-resolution DTMs, we conducted detailed geomorphic/geologic mapping using higher resolution Pleiades satellite derived DTMs and field studies. High-resolution (<2 m) DTMs were constructed using three Pleiades 0.5 m-resolution tri-stereo panchromatic tiff images acquired northwest of El Angel, Ecuador in August 2023 (https://dinamis.data-terra.org/en/imagery/, last access: August 2023). The images and their corresponding Rational Polynomial Coefficient (RPC) models were processed using the open-source NASA Ames Stereo Pipeline (ASP) software, which uses stereogrammetry to derive topography (Beyer et al., 2018). We first projected the three images onto an existing Copernicus 30 m-resolution DEM (https://dataspace.copernicus.eu/), and then generated three point clouds based on the three possible different stereo pairs of the photos. We then transformed these point clouds to DTMs and created a mosaic of those DTMs for final model. The code we used for the generation of our DTM with AMES and our DTM are available in the data repository (Harrichhausen et al., 2026).
Using the Pleiades DTM, we mapped fault scarps, and offset lateral moraines and landslides along these scarps. In particular, lateral moraine crests and one channel were delineated using breaks in slope identified in 5 and 10 m contour maps extracted from our Pleaides DTM. We estimated horizontal offset of the lateral moraine ridges by estimating where the projections of the undeformed moraine crests and channels intersect the fault plane, and measuring the horizontal distance between those projections (e.g., Zielke et al., 2012). Multiple projection interpretations were possible, thus we used reasonable projections with the most, and least amount of offset, to determine a range of horizontal offsets of the lateral moraines and channel, and establish uncertainty. A shapefile containing our moraine crest and glacial stream projections are located in the data repository (Harrichhausen et al., 2026). We attempted to use the LaDiCaoz MatLab code (Zielke and Arrowsmith, 2012) to backslip and match moraine ridge and stream topography across a fault to better assess slip. However, the subtle topography and the variability of the topographic features perpendicular to the fault zones (e.g., ridge width, channel morphology) led to extremely variable offset estimations that were unrealistic.
We conducted a field investigation in October and November 2022, to ground-truth and describe geomorphic features and evidence of active faulting. Where accessible, we surveyed the 25 July 2022 earthquake surface rupture that was delineated by InSAR, noting any surface deformation. We surveyed scarps, sag ponds, and landslides along other potentially active faults identified using remote sensing. We also located roadcuts that exposed active faults. To examine the earthquake history of these structures, we conducted a detailed analysis of the fault and sediments in the exposures. After cleaning and cutting the exposures to produce a vertical face, we used Agisoft Metashape software (Agisoft, 2021) to create orthophotomosaics from overlapping digital photos of the exposure (e.g., Reitman et al., 2015). These photomosaics were used to map the exposure on a digital tablet. A very high-resolution photomosaic and trench log of the primary exposure is provided in a dataset (Harrichhausen et al., 2026).
4.3 Cosmogenic dating
In order to date offset glacial landforms, we collected samples of large (>2 m diameter) andesitic boulders, embedded in glacial till, that were exposed on the crest of glacial ridges/lateral moraines for cosmogenic 3He exposure dating (e.g., Blard et al., 2007; Eaves et al., 2016). By dating the exposure time of these boulders, we are estimating the time elapsed since they were transported and deposited by a glacier, assuming no exposure before this transport (Blard, 2021). The selected boulders were fresh, with little to no visible alteration near the surface, therefore we assume there is negligible erosion of the boulders.
Samples of 2 cm-thickness were collected at the top of flat exposed surfaces of three different andesite and basalt boulders, whose coordinates and elevations were precisely noted and are available in the data repository (Table S1, Harrichhausen et al., 2026). Given their location on the ridge crests, the samples experienced negligible mask shielding. Samples were crushed and sieved, and pure pyroxene grains of 100–500 µm were extracted by hand at the Institut des Sciences de la Terre (ISTerre) at the Université Grenoble Alpes in France. 3He and 4He concentrations in the pyroxene grains were then measured at the Centre de Recherches Pétrographiques et Géochimiques (CRPG) in Nancy, France. Pyroxenes were fused in high vacuum at 1500 °C using a home designed induction furnace (Zimmermann et al., 2018). After gas purification, helium isotope abundances were measured with a tuned Split Flight Tube mass spectrometer, following methods described in Blard (2021). 4He furnace blanks were (4.2 ± 0.2) × 10−15 mol and represented from 3 % to 15 % of the sample signal, while 3He blanks were undetectable. Table S1 in the data repository (Harrichhausen et al., 2026) shows the He isotope abundances. During the same analytical session, we analyzed a CRONUS-P standard material, that yielded an 3He concentration compatible with the certified value, within analytical uncertainties (Blard et al., 2015).
Given that these volcanic rocks have a Pleistocene age, we assume that both the nucleogenic 3He and the radiogenic 4He build ups are negligible. We considered that the measured 4He is magmatic and used a ratio of 5 Ra (Ra = 1.384 ± 10−6 being the atmospheric ratio) to correct the measured 3He concentrations (Blard et al., 2013). This magmatic 3He correction represents less than 10 % of the total 3He measured in the three samples. Ages were then calculated using the online CREp calculator (Martin et al., 2017) incorporating various 3He production rate models and scaling factors. Such approach permits to encompass all the sources of uncertainties associated with this cosmogenic 3He exposure dating.
4.4 Radiocarbon dating
We collected 14 bulk sediment samples for radiocarbon dating to constrain the sediment deposition and earthquake event ages exposed in the roadcuts. The majority of our samples were collected from Páramo soils (Andisol), which have very high organic carbon content. Their low bulk density, high porosity, and humic/dark nature make them comparable to peat-like soils or organic-rich soils. Because of these properties, small-volume, focused sampling can retrieve sufficient organic carbon for radiocarbon dating, reducing the risk of time-averaging or mixing compared to bulk sampling in low-organic, mineral sediments. The high organic content and relative stability of organic matter in Andisol under cold, humid conditions at ∼ 4000 m reduces decomposition and thus preserves carbon, making them good candidates for radiocarbon dating. These types of samples have been shown to provide reliable radiocarbon ages in previous paleoseismic studies in similar environments along the Pallatanga fault zone (Baize et al., 2015, 2020) and the Billecocha fault system (Jomard et al., 2021). An identical sampling strategy resulted in precise historical ages matching with the 1797 earthquake in Pallatanga area (Baize et al., 2015). Nevertheless, we acknowledge that post-depositional processes such as bioturbation and root penetration could introduce additional uncertainty that is not fully captured by the laboratory-reported analytical errors (e.g., Grützner et al., 2015). Additionally, our samples could be detrital giving ages that are older than the unit they are located within. This is especially the case for samples from colluvial wedges (e.g., DuRoss et al., 2022). Therefore, we assessed each sample and date and discounted dates that were likely to be affected by bioturbation and re-sedimentation.
Radiocarbon samples were dated at the Artemis AMS-French National facility (CEA Saclay, LMC14; Moreau et al., 2020). We used OxCal version 4.4.4 (Bronk Ramsey, 2009) for radiocarbon calibration with the IntCal20 14C production curve (Reimer et al., 2020) and report our results as calendar calibrated ages before 1950 (cal BP) or thousands of calendar calibrated years before 1950 (ka). We then used OxCal to incorporate all available chronological constraints into a model that uses Monte Carlo routines and Bayesian statistics to determine the probability distribution function (PDF) of geologic unit and earthquake event ages (e.g., Lienkaemper and Ramsey, 2009). OxCal codes are available in an archived dataset (Harrichhausen et al., 2026).
5.1 25 July Earthquake
On 25 July 2022 a Mw 5.6 earthquake occurred ∼ 10 km northeast of El Angel and ∼ 15 km southeast of the Chiles-Cerro Negro volcanic complex near 0.743° N, −77.844° E (Fig. 3). This earthquake was shallow, with a hypocentral depth of <5 km (IG-EPN). The focal mechanism computed by IG-EPN indicates almost purely strike-slip kinematics on a sub-vertical fault, with either right-lateral slip on a 250°-striking fault or left-lateral slip on a 345°-striking fault.
The Sentinel-1 and ALOS-2 coseismic SAR interferograms computed for this earthquake show a clear surface deformation pattern near the epicenter of the 2022 earthquake (Fig. 4). A comparative interpretation of these complementary (ascending and descending, C-band and L-band) datasets thus allows us to map precisely the coseismic surface rupture. Overall, the rupture is oriented 80° and produced right-lateral slip. The opposed signs of the Line-of-Sight (LOS) deformation lobes between ascending and descending interferograms indicate that the earthquake produced mostly horizontal motion, consistent with the almost purely strike-slip focal mechanism. In the eastern part of the rupture, close to the epicenter, a distinct surface rupture over 5 km length can be observed (solid black line in Fig. 4), with up to 8 cm of localized deformation in the LOS and up to 13 cm of total surface deformation in the LOS. This 13 cm of total surface deformation (profile H-H', Fig. 4h) includes any deformation along the fault that did not rupture the surface, and/or inelastic, off-fault, deformation in the area around the fault (e.g., Collettini et al., 2022). In contrast to the eastern part of the rupture, the western part shows more off-fault deformation over about 5 more kilometers. There, the rupture divides into two strands, each of them accommodating about 5 cm of LOS deformation without clear localized offset (profile FF'). Further west, the rupture splits into more en-echelon segments with a decreasing amount of total surface deformation. Therefore, InSAR shows that the surface rupture produced by this earthquake is complex and characterized by a large amount of distributed deformation across the fault zone, which we term the 25 July fault (JF, Fig. 2).
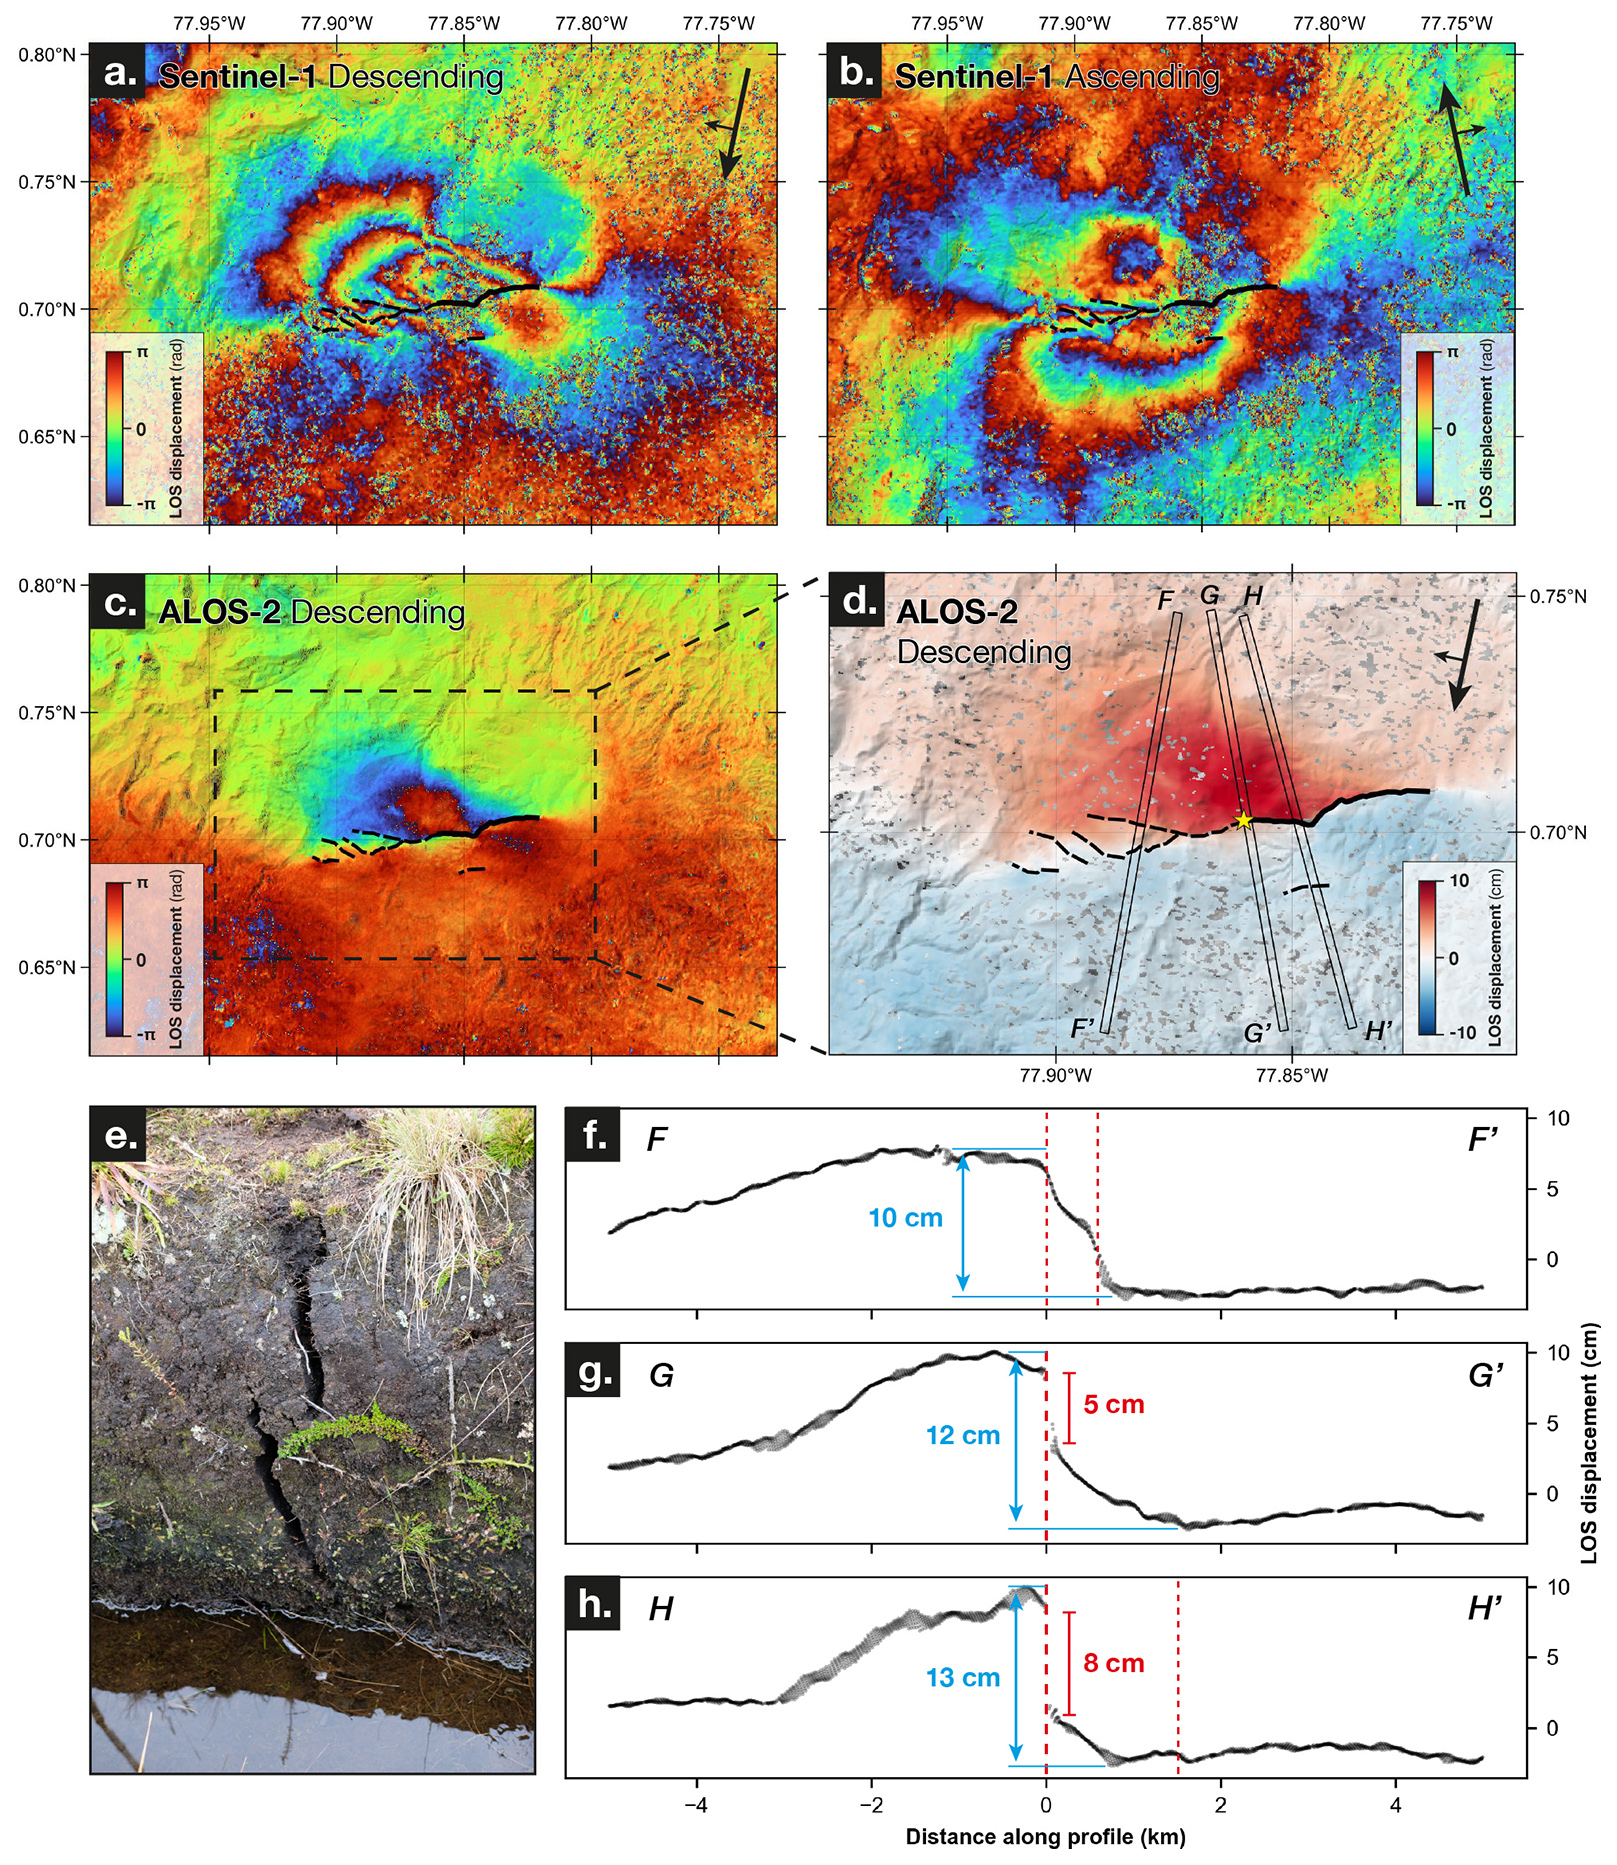
Figure 4Coseismic deformation during the 25 July 2022 earthquake. (a, b, c) Sentinel-1 descending, ascending and ALOS-2 descending wrapped interferograms. Line-of-Sight convention is positive when away from satellite. (d) ALOS-2 unwrapped interferogram. Line-of-Sight convention is positive when towards satellite. Sentinel-1 unwrapped interferogram is available in the data repository (Fig. S2, Harrichhausen et al., 2026). (e) Field picture of cracks found close to the surface rupture observed on interferograms, located by the yellow star in (d). (f, g, h) Profiles of the Line-of-Sight coseismic displacement from the ALOS-2 unwrapped interferogram. Profiles are located in (d). Blue and red numbers indicates the total amount of deformation and the offset at the surface rupture, respectively.
Field reconnaissance was carried out three months after the earthquake, in October 2022, aiming to study the surface rupture using InSAR maps as guides. However, the area turned out to be difficult to explore owing to the dense vegetation cover in the El Angel reserve, together with a large number of landslides closing the main road crossing the reserve. The only possible evidence of surface rupture that could be observed are sub-vertical cracks on the walls of a man-made irrigation channel, displaying a few centimeters of opening (Fig. 4e), and located exactly on the surface rupture inferred from InSAR (yellow star in Fig. 4d). However, no horizontal offsets could be observed on this channel. The organic rich Andisol soil covering the El Angel reserve (e.g., Fig. 4e), which may behave more ductile, coupled with the low magnitude of the 25 July earthquake may explain the low amount of localized deformation during this earthquake.
5.2 Reconnaissance mapping
Lower resolution 4 and 5 m hillshaded DEMs and satellite imagery show a number of SW to NE lineations within a ∼ 70 km-wide zone across the northern boundary of the Quito-Latacunga microblock (Fig. 2a). These lineations are generally continuous between 5 and 25 km and are oblique to the previously mapped more northerly trending active faults (Alvarado, 2012). The lineations are formed at all elevations in the map area and cut recent volcanics, glacial sediments, and bedrock. Two lineations located north of the city of El Angel, which we have termed the Reservoir and Polylepis faults, show the clearest signs of active deformation (RF and PF in Fig. 2a).
5.3 Reservoir fault zone
Pleiades-derived DTMs show two parallel fault segments offsetting glacial moraines ∼20 km west of the epicenter of the 25 July earthquake, and ∼12 km southwest of the Chiles-Cerro Negro volcanic complex (Fig. 5). Both faults are subvertical, and the northern fault strikes ∼060 to 070° while the southern fault strikes ∼070°. The surface expression of the northern fault is relatively continuous and crosses the entire width of the Pleiades DTM (10.5 km). It also may continue up to 15 km to the northeast where the low-resolution Copernicus DEM shows NE-striking lineaments along the southern flank of the Chiles volcano. The visible surface trace of the second, southern fault is less continuous, consisting of up to ∼2 km-long segments that are likely connected at depth. Topographic lineaments visible in the low-resolution Copernicus DEM suggest this southern fault continues to the northeast for up to 10 km from the edge of Fig. 5b. To the southwest, the projection of the more W-striking southern fault merges with the northern fault.
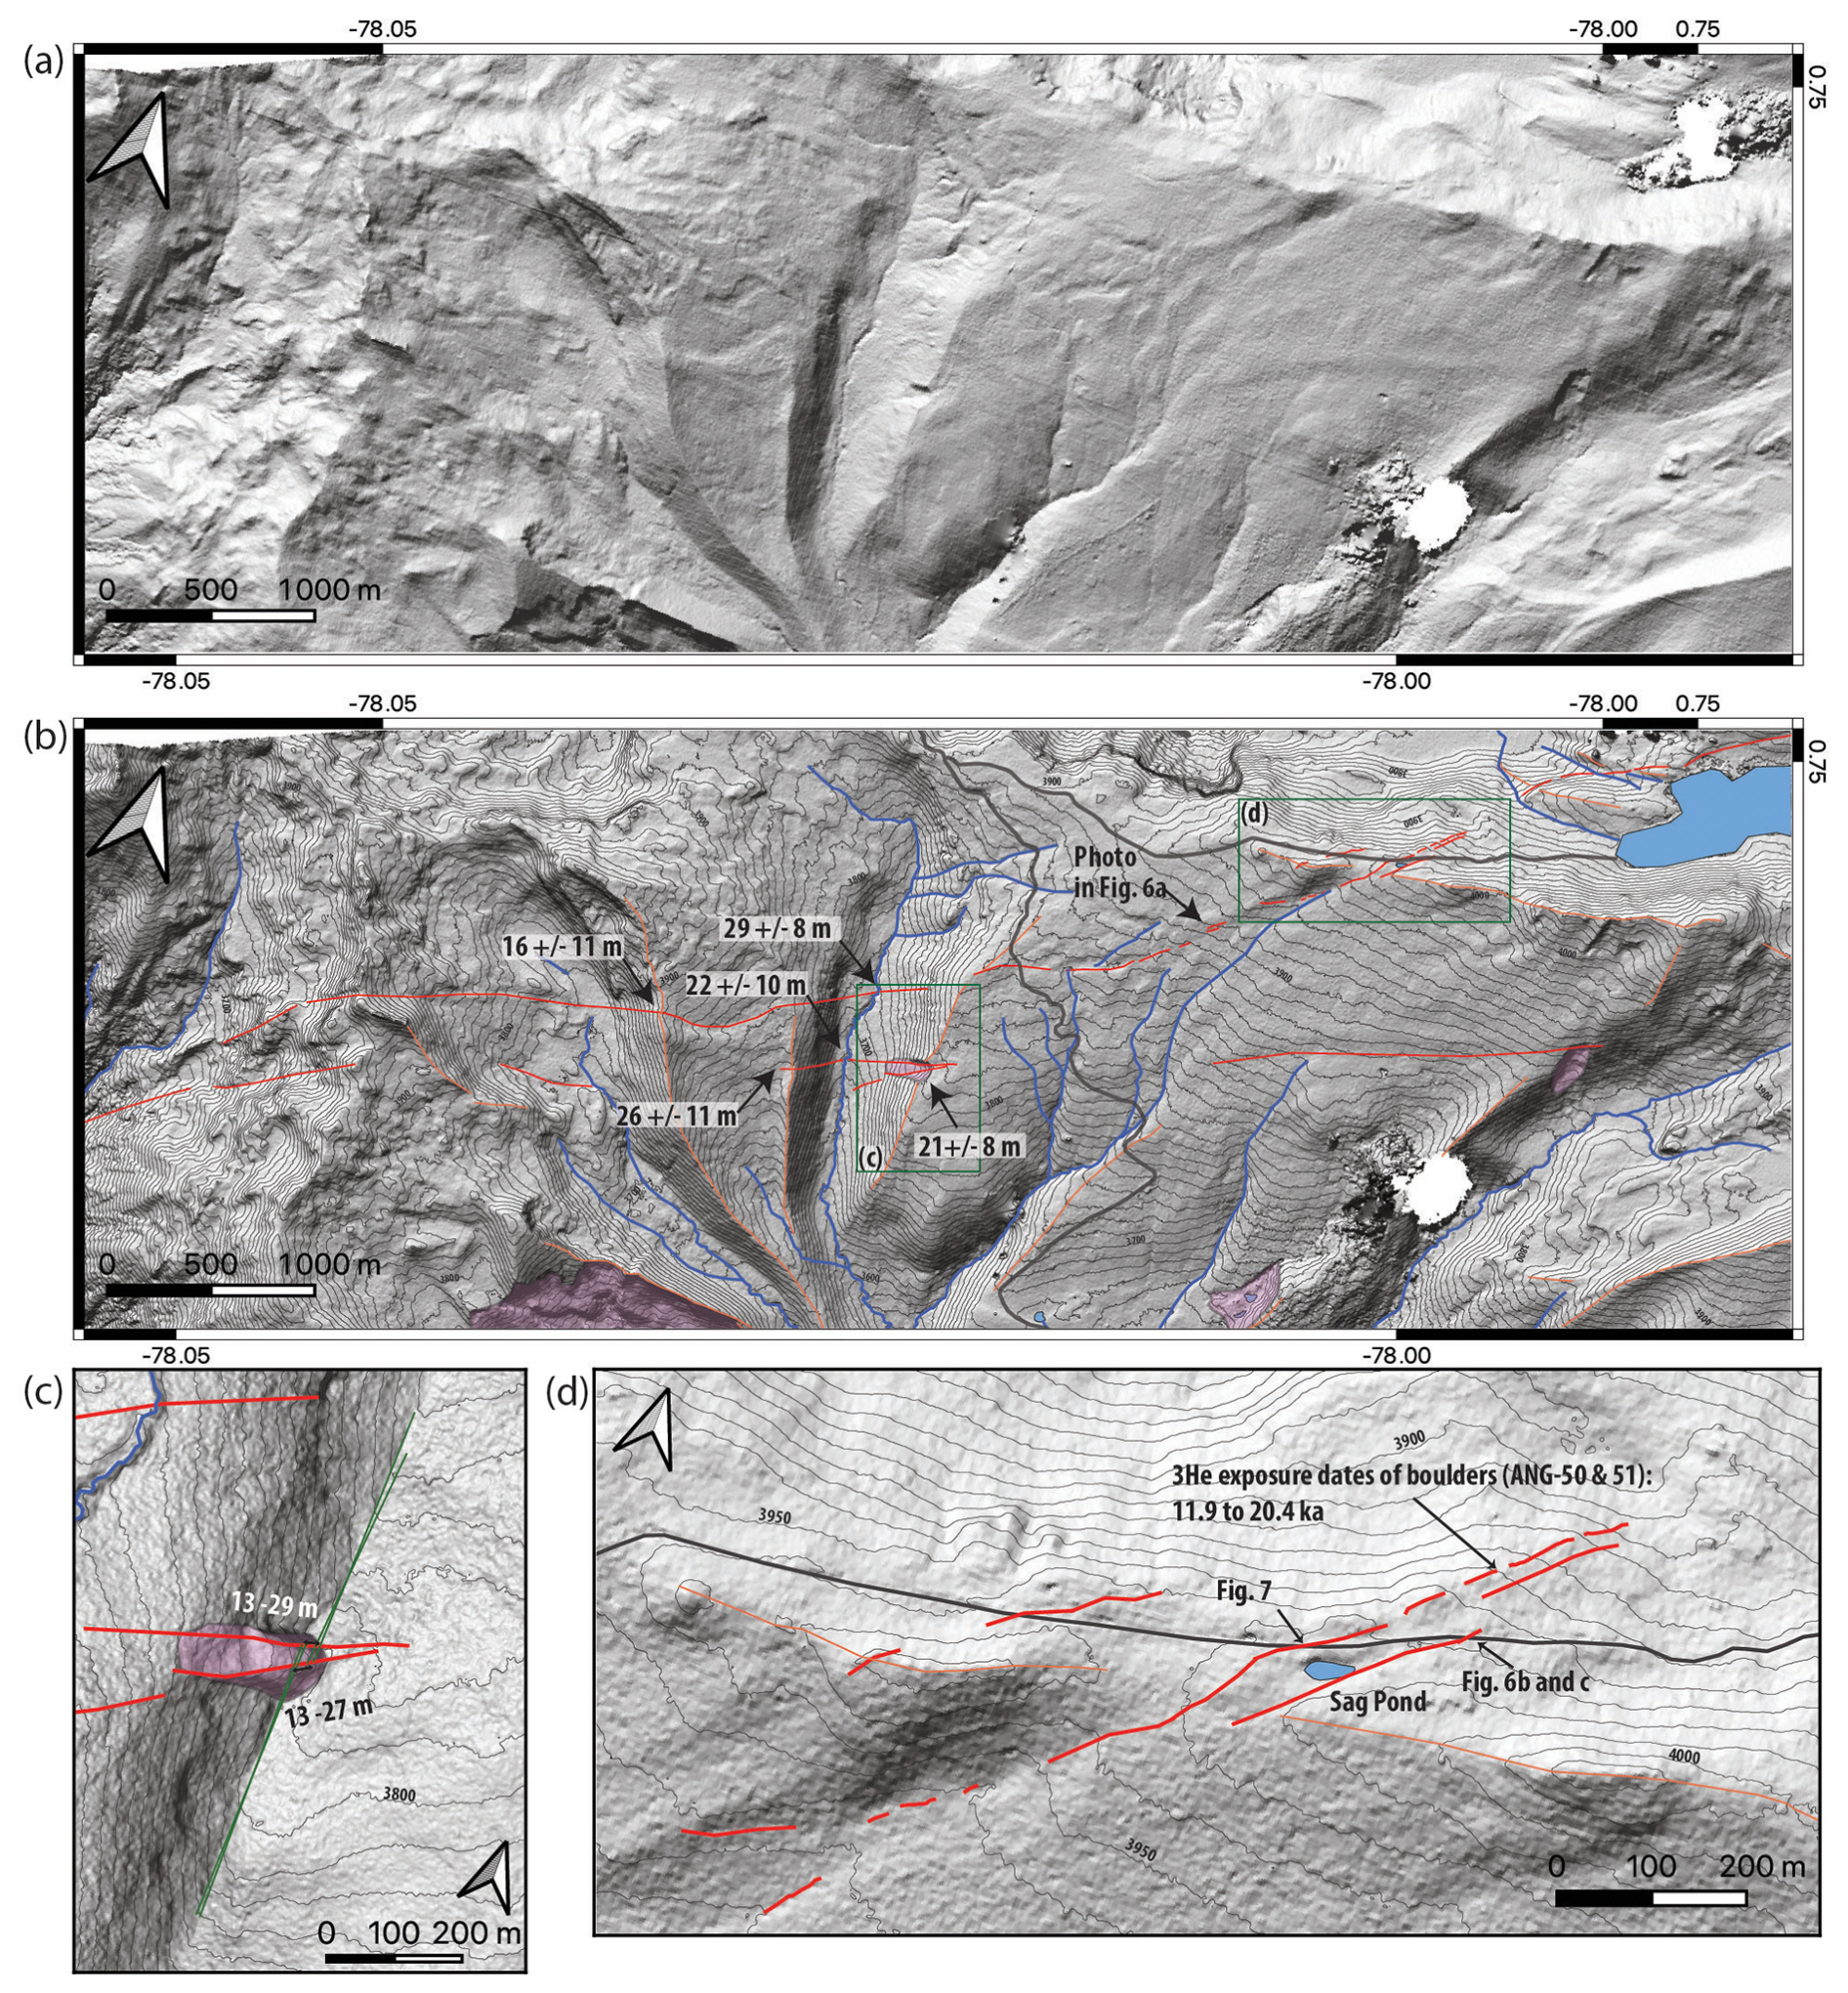
Figure 5(a) Unannotated hillshaded Pleiades-derived DTM of the Reservoir fault zone northwest of El Angel, and south of Chiles-Cerro Negro. (b) Annotated version of (a) showing surface traces of the faults visible in the DTM and/or the field (red), right-lateral offsets of glacial lateral moraine ridges (orange), landslides (pink shading), and the largest channels (blue). The road to the reservoir is shown in dark grey, locations of (c) and (d) are shown by green boxes, and the contour intervals are 10 m. (c) Slope map the southern strand of the Reservoir fault zone where it cross cuts and offsets a lateral moraine, and has formed a small landslide. Green lines show the different extrapolated moraine lineations, their intersections with the fault strands on either side of the landslide, and the associated offset measurements. (d) Slope map of the northern Reservoir fault zone where it is crossed by the road to the reservoir. Three parallel segments (north, middle, and south branches) form the northern fault. Locations of the sag pond and the fault exposures shown in Figs. 6 and 7 are shown.
Along both fault traces, field reconnaissance and the Pleiades DTMs show up to 3 m-high N- and S-facing scarps and benches, along with sag ponds and marshes where streams crossed and were dammed by the fault (Figs. 5; 6). Small (<30 m-wide) slumps and landslides were recognized in the field and two ∼100 m-wide landslides are visible in the DTM in Fig. 5a, b, c, where the southern fault cross-cuts lateral moraines. Additionally, both faults offset lateral glacial moraines. The northern fault right-laterally offsets a pronounced ridge above SW-facing lateral moraine by 16±11 m, and it may offset the two adjacent lateral moraines to the east. However, where these offsets are projected, less pronounced ridge crests along the top of the moraine, or a change in strike of the moraine do not allow accurate estimations of the displaced landforms. The northern strand also offsets a creek at the base of the glacial valley in the center of Fig. 5a, b by 29±8 m right-laterally. A change in strike of the ridgeline where the northern fault crosses the road in Fig. 5d, does not allow for an accurate offset estimation, however a sag pond between the main fault branch and right-stepping branch ∼ 50 m to the south indicates extension along a right-lateral fault. The southern fault displaces both the E- and W-facing lateral moraines of a glacial valley in the center of Fig. 5a, by 26±11 and 21±8 m, respectively, and then displaces the stream along the basal moraine of the glacial valley by 22±10 m. Where the southern fault offsets the E-facing moraine, we have identified two fault strands on the northern and southern side of a 100 m-wide landslide and used offset measurements on both strands to determine the overall right-lateral displacement (Fig. 5c).
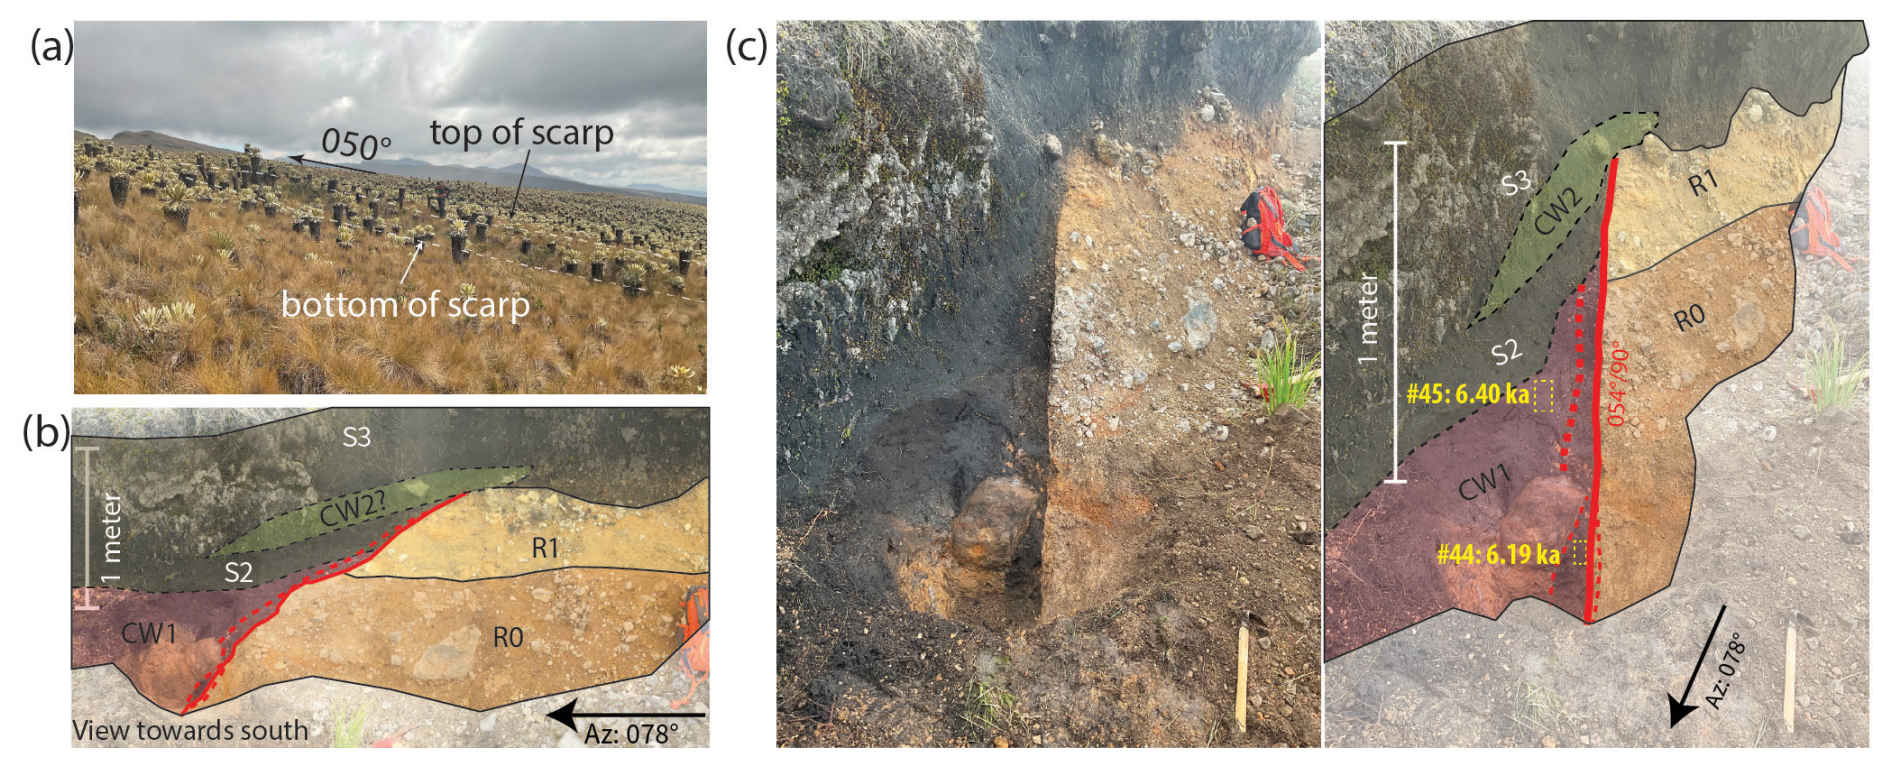
Figure 6(a) Photo looking SE at a north, uphill-facing scarp that is ∼2 m high (see person for approximate scale) on the northern Reservoir fault zone. Location of photo shown in Fig. 5b. (b) Interpreted photo (looking south) of roadcut exposure of the southern segment of the northern Reservoir fault (location in Fig. 5d). Geologic legend in Fig. 7. (c) Unannoted (left) and interpreted oblique view (right) of the same fault shown in (b). This view shows the vertical fault offsetting Andisol (S1 and S2) and a colluvial wedge (CW2) against massive and poorly bedded, matrix supported diamict (R0 and R1). Bulk radiocarbon sample locations shown with yellow boxes and ages are mean calibrated ages before present (in thousands of years before 1950). See Table 2 for the full dataset of uncalibrated and calibrated radiocarbon ages.
All of the scarps have minor vertical offsets along them, however, the change from N- to S-facing scarps along the fault suggest largely strike-slip deformation. The surface trace of the fault segments across the glacial valleys suggest sub-vertical to steeply N-dipping faults, also suggesting strike-slip faulting. The undulating terrain and relatively minor vertical offsets preclude viable estimates of vertical separation.
5.3.1 Reservoir fault exposures
In the NE corner of Fig. 5b, three segments of the northern fault are crossed by a dirt road accessing a reservoir in the El Angel ecological reserve (Fig. 5d). The roadcuts provide exposure of three branches of the northern fault cross-cutting post-glacial (∼20 ka) sediments and volcanic soils.
The fault strand south of the sag pond is exposed on the southern side of the road to the reservoir (Fig. 5d). At the 2 m-high roadcut (Fig. 6b, c), the basal unit is a massive, poorly-sorted, matrix-supported diamict with sub-angular to sub-rounded pebbles to boulders (R0). The matrix of this unit is primarily sand and is cemented by calcite. R0 is overlain by a ∼40 to 60 cm-thick layer of silt and sand with minor pebbles (R1), which in turn is overlain by ∼0.5 to 1 m of Andisol. A vertical, SW–NE-striking planar fault obliquely crosses the roadcut offsetting units R1 and R0 against the Andisol (S2–S3) and a colluvial wedge (CW1). Small tension fractures in the cemented R0 matrix are subvertical and parallel with the road, suggesting right-lateral motion (e.g., Doblas, 1998). Colluvium from R0 and R1, including a large boulder have been deposited on the northern side of the fault (CW1). This colluvial wedge is at least 1 m-thick and is cross-cut by the fault implying a second colluvial wedge overlying the fault. We have approximated the location of the second colluvial wedge (CW2) by the increased cobble abundance in the Andisol at this location, however, its thickness and true extent are unknown. Vertical separation across the southern strand of the fault is unknown because the basal contact of the Andisol is not exposed north of the fault. The N-side-up offset exposed at this location is at odds with its location on the southern side of a sag pond, suggesting that the offset exposed here is apparent.
The middle branch of the northern fault, located immediately north of a ∼50 m-wide sag pond, is exposed on the northern side of the road (Figs. 5d; 7). Three main stratigraphic units are visible here. The oldest unit, R1, is composed of 1 to 10 cm-thick interbedded layers of silt, coarse sand, and minor sub-rounded pebbles within a silt matrix. R2 is a 30 to 50 cm-thick layer of clast-supported sub-rounded to sub-angular pebbles, cobbles, and rare boulders deposited on top of R1. The matrix of this unit is cemented with calcite. Finally, the youngest units, S1–S4 are a 0.3 to 1.5 m-thick layer of massive Andisol, organic rich soil formed on Andesitic volcanic ash (e.g., Poulenard et al., 2001).
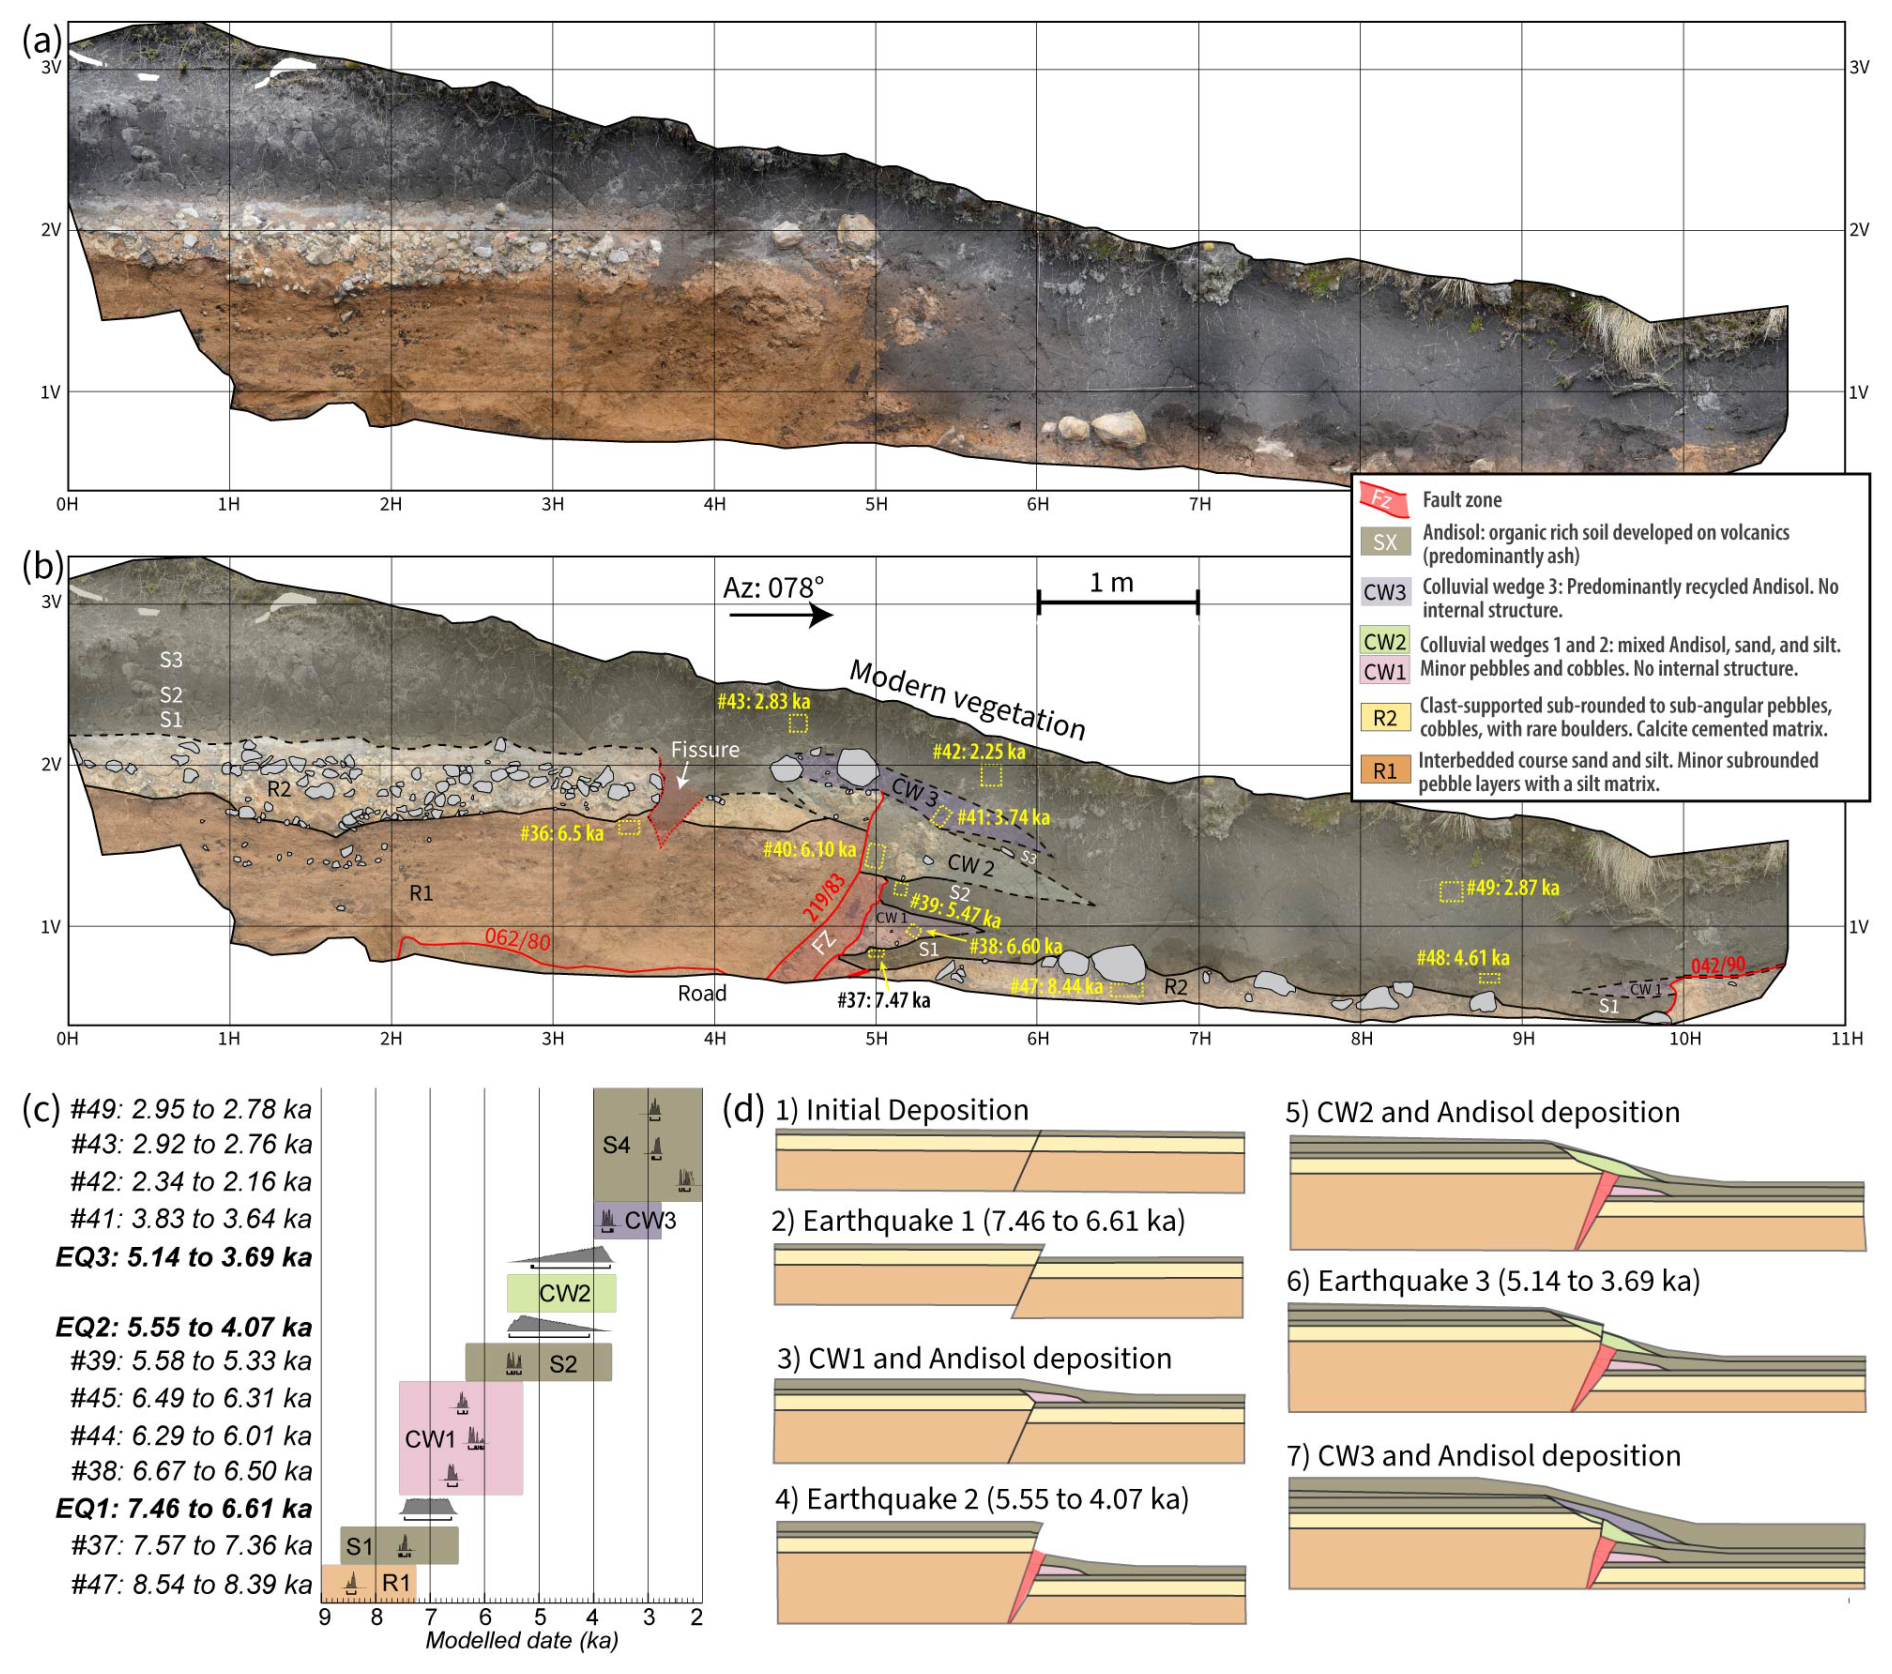
Figure 7Unannotated (a) and interpreted (b) orthophotomosaics of an exposure of the middle segment of the northern Reservoir fault. Local grid coordinates are 1 m by 1 m. Outcrop location shown in Fig. 5d. Bulk radiocarbon sample locations shown with yellow boxes and ages are mean calibrated ages before present (in thousands of years before 1950). (c) Results of Bayesian model of radiocarbon dates showing age ranges for sedimentary units and three earthquakes. The coloured boxes show the maximum possible time range for each stratigraphic unit based on the model. The ages of sample #36 and sample #40 are anomalous as they are out of stratigraphic order likely due to recycling or bioturbation, and the stratigraphic position of sample #48 relative to CW1 is unclear. These sample were not used in the model. Two radiocarbon dates from CW1 are from the exposure of the southern fault branch in Fig. 6c. See Table 2 for the full dataset of uncalibrated and calibrated radiocarbon ages. (d) Cartoon illustrating the stratigraphic evolution of the exposed deposits and faults in the exposure shown in (a) and (b).
Each of these stratigraphic units have been deformed by an up-to 30 cm-thick, subvertical WSW–ENE-striking fault zone, which obliquely cross-cuts the roadcut (4.5H, Fig. 7b). This fault is also visible near the bottom of the exposure between 2H and 4H, highlighting its irregular geometry. The fault zone narrows to a single strand above 1.5V and is finally truncated by overlying sediments between 1.8V and 1.9V. The base of the Andisol (S1) is vertically offset ∼ 1 to 1.4 m by this fault zone. We observe a sequence of 3 colluvial wedges overlying 10 to 15 cm of Andisol (S1) and Unit R2 in the northern down-thrown block. The oldest colluvial wedge, CW1, is ∼30 cm thick and is overlain by ∼15 cm of Andisol (S2) and CW2 is ∼50 cm thick and overlain by a thin Andisol layer (S3). Both CW1 and CW2 are composed of a mixture of colluvium derived from units R1, R2, and the Andisol (S1–S3); and both wedges are cross-cut by the fault. CW2 is offset vertically by ∼30 cm, indicating there is a third colluvial wedge deposited above it. The location of this colluvial wedge (CW3) is approximate, based on slight discolouration of the Andisol and the presence of large boulders within the Andisol.
In addition to the main fault zone, a SW–NE-striking subvertical fault offets unit S1 vertically, N-side-up, by ∼30 cm at the northeastern end of the exposure (10H, Fig. 7b). A small colluvial wedge (CW1) has also formed here and based on the same thickness of Andisol (S1) that underlies this colluvial wedge, it is likely coeval with CW1 on the main fault zone. Finally, in the southern up-thrown block of the main fault zone at 3.75H, a ∼30 cm wide, ∼60 cm-deep fissure cross-cuts Units R2 and R1 and is filled with Andisol (S1–S3).
The northern most strand of the northern fault is exposed ∼300 m east of the middle strand in a ∼3 m-high roadcut (Fig. 5d). Approximately 0.3 to 1.0 m-thick layers of massive, cemented diamict (R0 and R2 observed in the other roadcuts) is interbedded with sand and silt (R1) in the bottom 2.5 m of the outcrop. Andisol overlies these units along an erosional disconformity, which also separates the Andisol from the basal units (R0–R2) in the other two roadcuts (Figs. 6b, c; 7a, b), however, the scale of those outcrops made this observation less obvious. The northern most fault strand is subvertical, strikes SW, and is less than 20 cm thick. There is ∼20 cm of vertical separation of an R0–R1 contact across the fault, however the fault does not cross-cut the Andisol or offset the disconformity.
5.3.2 Dating
To estimate slip rates and earthquake ages on the Reservoir fault zone we collected 13 bulk sediment samples for radiocarbon dating and two samples from fresh unaltered basalt boulders exposed on glacial moraines or landforms for surface exposure dating. The cold climate and unaltered appearance of the basalt boulders suggest little chemical weathering allowing us to assume that sample erosion is negligible. The cosmogenic 3He ages confirm if the offset moraines in Fig. 5 were formed during the LGM, and the radiocarbon ages bracket the ages of the three earthquakes observed in the roadcuts (Figs. 6 and 7).
3He ages shows that the exposure of two basalt boulder surfaces located at an elevation of 3925 m a.s.l. along the northern Reservoir fault, ∼200 m NE of the roadcut in Fig. 7, and ∼200 m N of the ridgecrest (Fig. 5d) occurred between 11.9 and 20.4 ka (Samples ANG-50 and ANG-51, Table 1). This age range is based on the 95 % intervals of ages calculated using three different production rate models for 3He and scaling models. Slightly younger exposure ages (mean: 14.7 ka) of the basalt boulders are calculated using a high Andes local production rate (Blard et al., 2013; Delunel et al., 2016) compared to ages (mean: 16.4 ka) calculated using a global production rate (Martin et al., 2017). All of these ages compare well with the timing of glacial advance and subsequent retreat in the tropical Andes during Marine Isotope Stage 2 (MIS2), leaving areas below 4000 m a.s.l. ice free by ∼15 ka (e.g., Rodbell et al., 2009; Blard et al., 2013; Angel et al., 2017; Martin et al., 2018).
Table 13He ages from the Reservoir and Polyepis faults computed using the CREp (Martin et al., 2017) calculator.
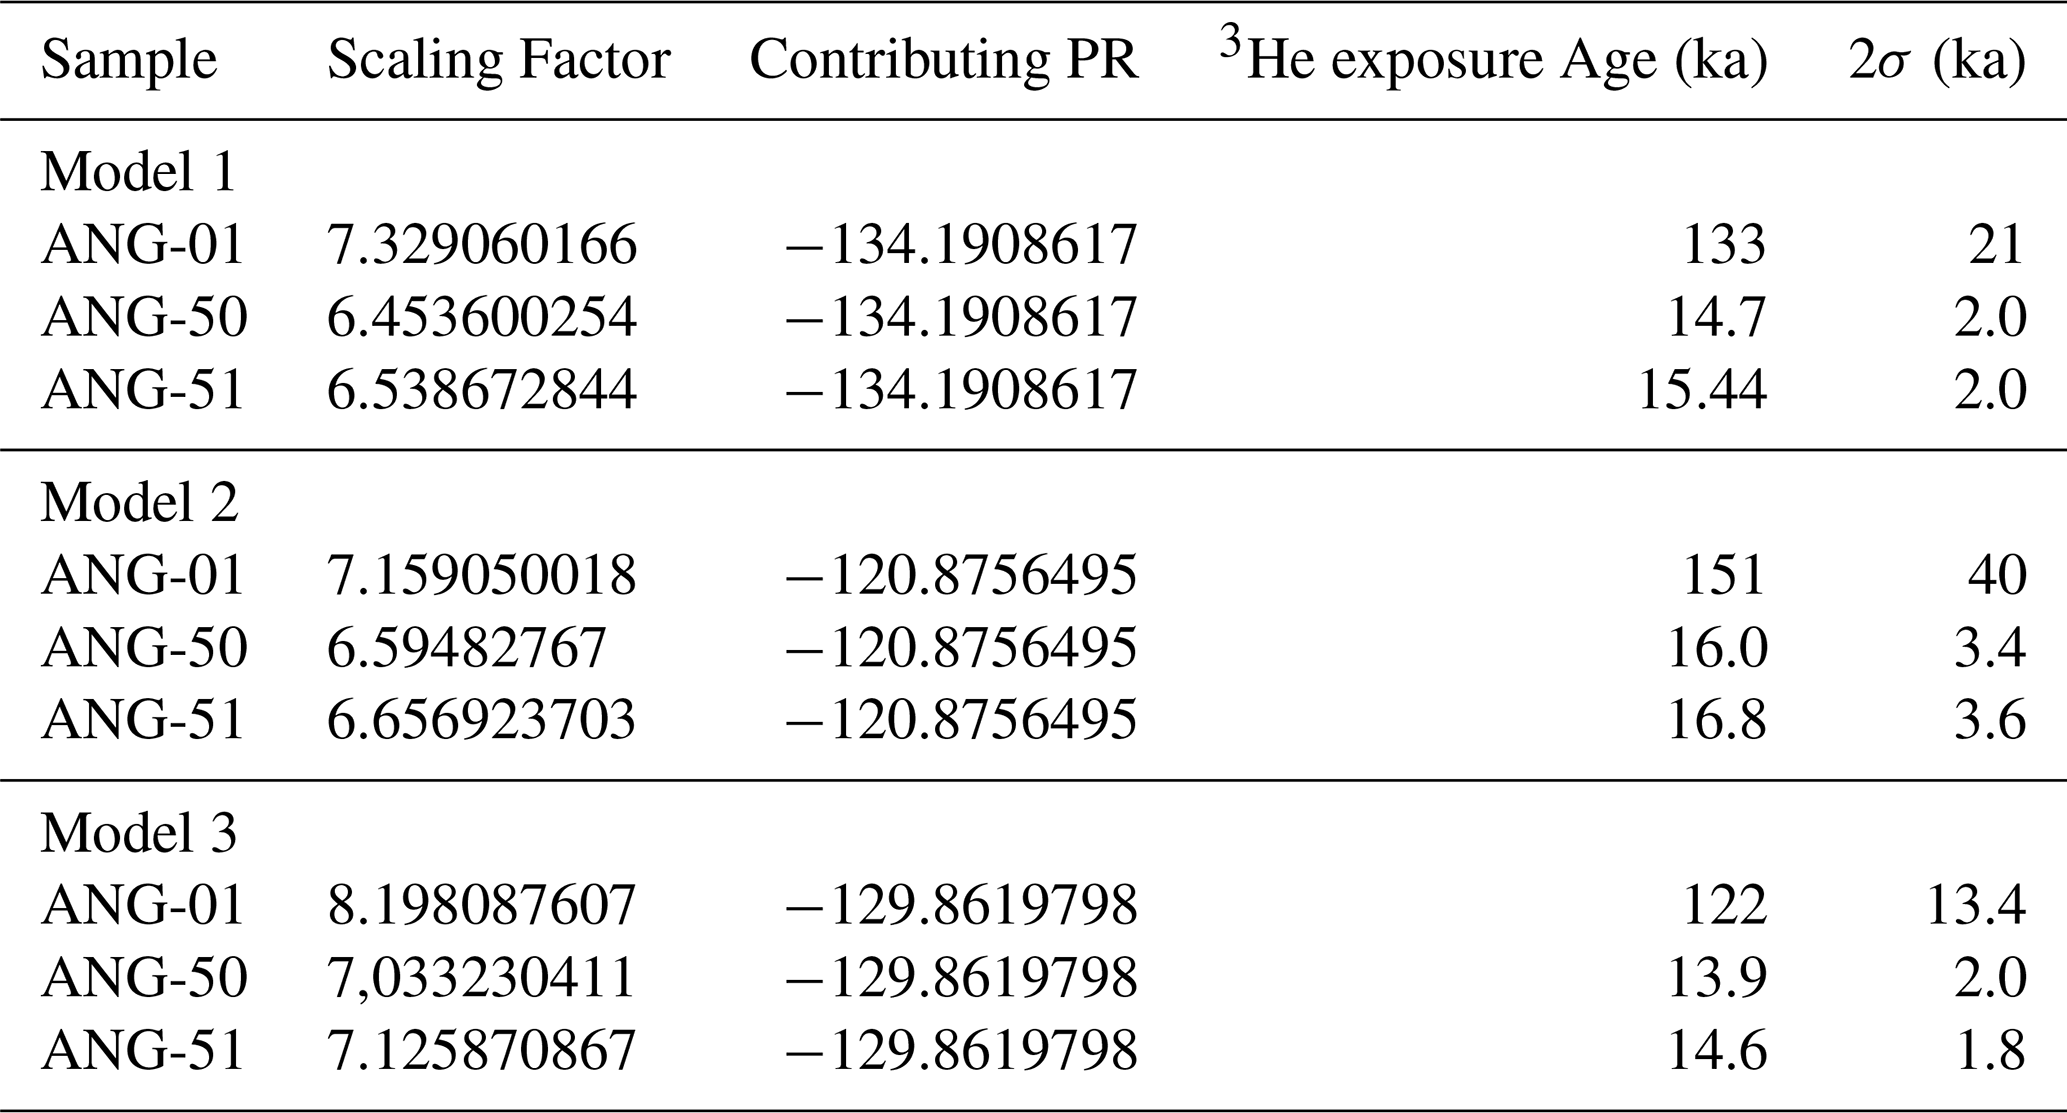
Model 1 uses a local high Andes production rate (PR) (Blard et al., 2013; Delunel et al., 2016) and the Lal Stone time dependent scaling scheme (Balco et al., 2008). Model 2 uses a Global PR (Martin et al., 2017) and the Lal Stone scaling scheme (Balco et al., 2008). Model 3 uses a local high Andes PR (Blard et al., 2013; Delunel et al., 2016) and the LSD scaling scheme (Balco et al., 2008).
Sediment collected from the exposures of the middle and southern branches of the northern Reservoir fault zone (Figs. 6; 6b) yield mean radiocarbon ages between 2.95 and 8.39 ka (Table 2). We use 10 of these ages to build a chronological model of sediment deposition and deformation that brackets the earthquake ages (Fig. 7c).
Table 2Uncalibrated and calibrated radiocarbon ages from the Reservoir and Polyepis faults.
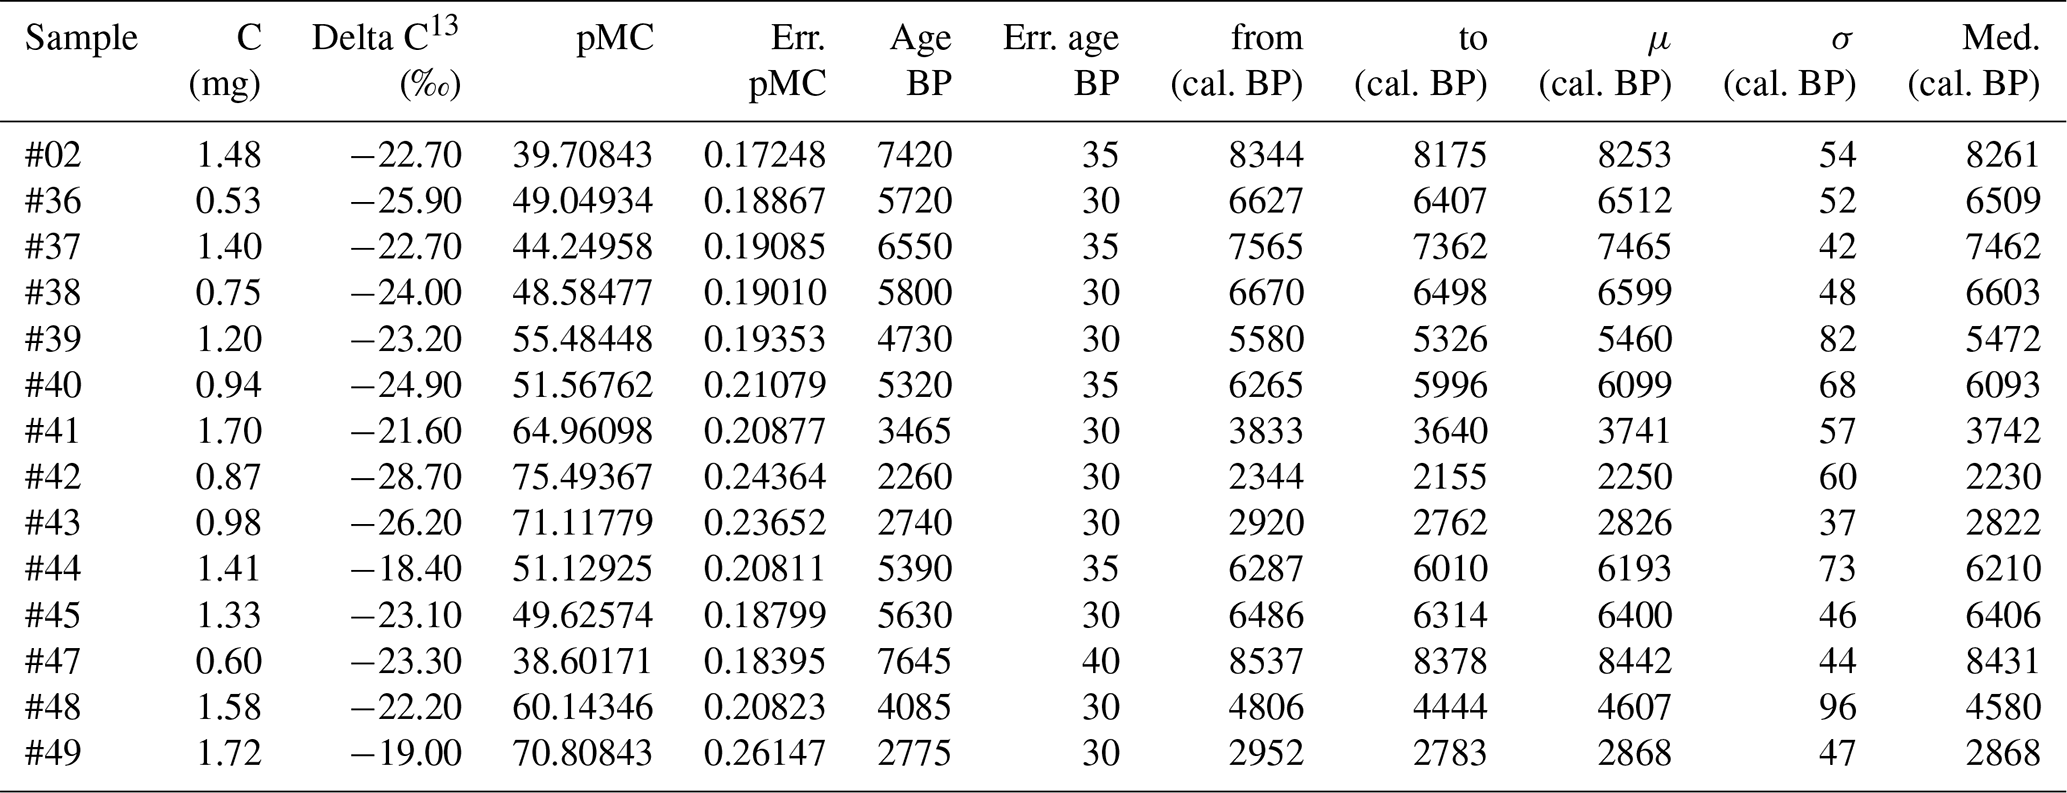
pMC refers to percent Modern Carbon. BP refers to years Before Present (1950). Cal refers to radicarbon ages calibrated using OxCal version 4.4.4 (Bronk Ramsey, 2009) with the IntCal20 14C production curve (Reimer et al., 2020).
We have removed samples #36, #40, and #48 from the chronological model (Fig. 7c) for the following reasons. Sample #36 (6.51±0.10 ka), is located at the very top of unit R1 (Fig. 7). This sample is younger than samples from three units that are stratigraphically above it including: #47 (8.44±0.09 ka) from R2, #37 (7.47±0.08 ka) from S1, and #38(6.60±0.10 ka) from CW1. Given that the age of #36 is out of stratigraphic order, and is located immediately next to a fissure, it is likely younger organic material introduced through bioturbation. Sample #40 (6.10±0.14 ka) from unit CW2, is older than #39 (5.46±0.16 ka) taken from the Andisol unit (S1) stratigraphically below it. Because of this age discrepancy and the observation that #39 is part of a colluvial wedge (CW2), we assume that this sample has been recycled and has been transported into a fracture. Finally, we remove sample #48 (4.61±0.19 ka) due to its relatively unknown stratigraphic position relative to the colluvial wedges (Fig. 7b).
Based on the 10 remaining samples, collected from both outcrops of the middle and southern strands of the northern Reservoir fault zone, we estimate the ages of the three earthquakes (EQ1–EQ3, Fig. 7c, d). The first event occurred at 7.03±0.51 ka, and two subsequent events occurred at 4.89±0.83 and 4.32±0.83 ka. Because we have no reliable date of the colluvial wedge (CW2) that formed after EQ2, EQ2 and EQ3 have overlapping age distributions. However, given the complete degradation of the scarp that formed CW2 (Fig. 7), we assume a substantial time span occurred between EQ2 and EQ3, during the formation of the upper facies of CW2 (e.g., hundreds of years, Gray et al., 2022).
5.4 Polylepis fault
5.4.1 Fault trace
A subparallel-striking fault ∼ 3.5 km southeast of the fault exposures of the Reservoir fault also shows evidence of a recent rupture. This structure, which we have termed the Polylepis fault, has been previously mapped by Alvarado (2012) as a network of NE-striking faults that continue for ∼17 km (Fig. 2). Satellite imagery show surface deformation indicative of surface rupture along this structure for ∼ 11 km. This evidence includes a major visible lineament and a shorter (∼ 1 km) subparallel southern lineament cutting across glacial moraines, ridges, and hillslopes (Fig. 8). Fresh landslides, sag ponds, and small scarps along the lineaments are visible in the satellite images and were also observed in the field.
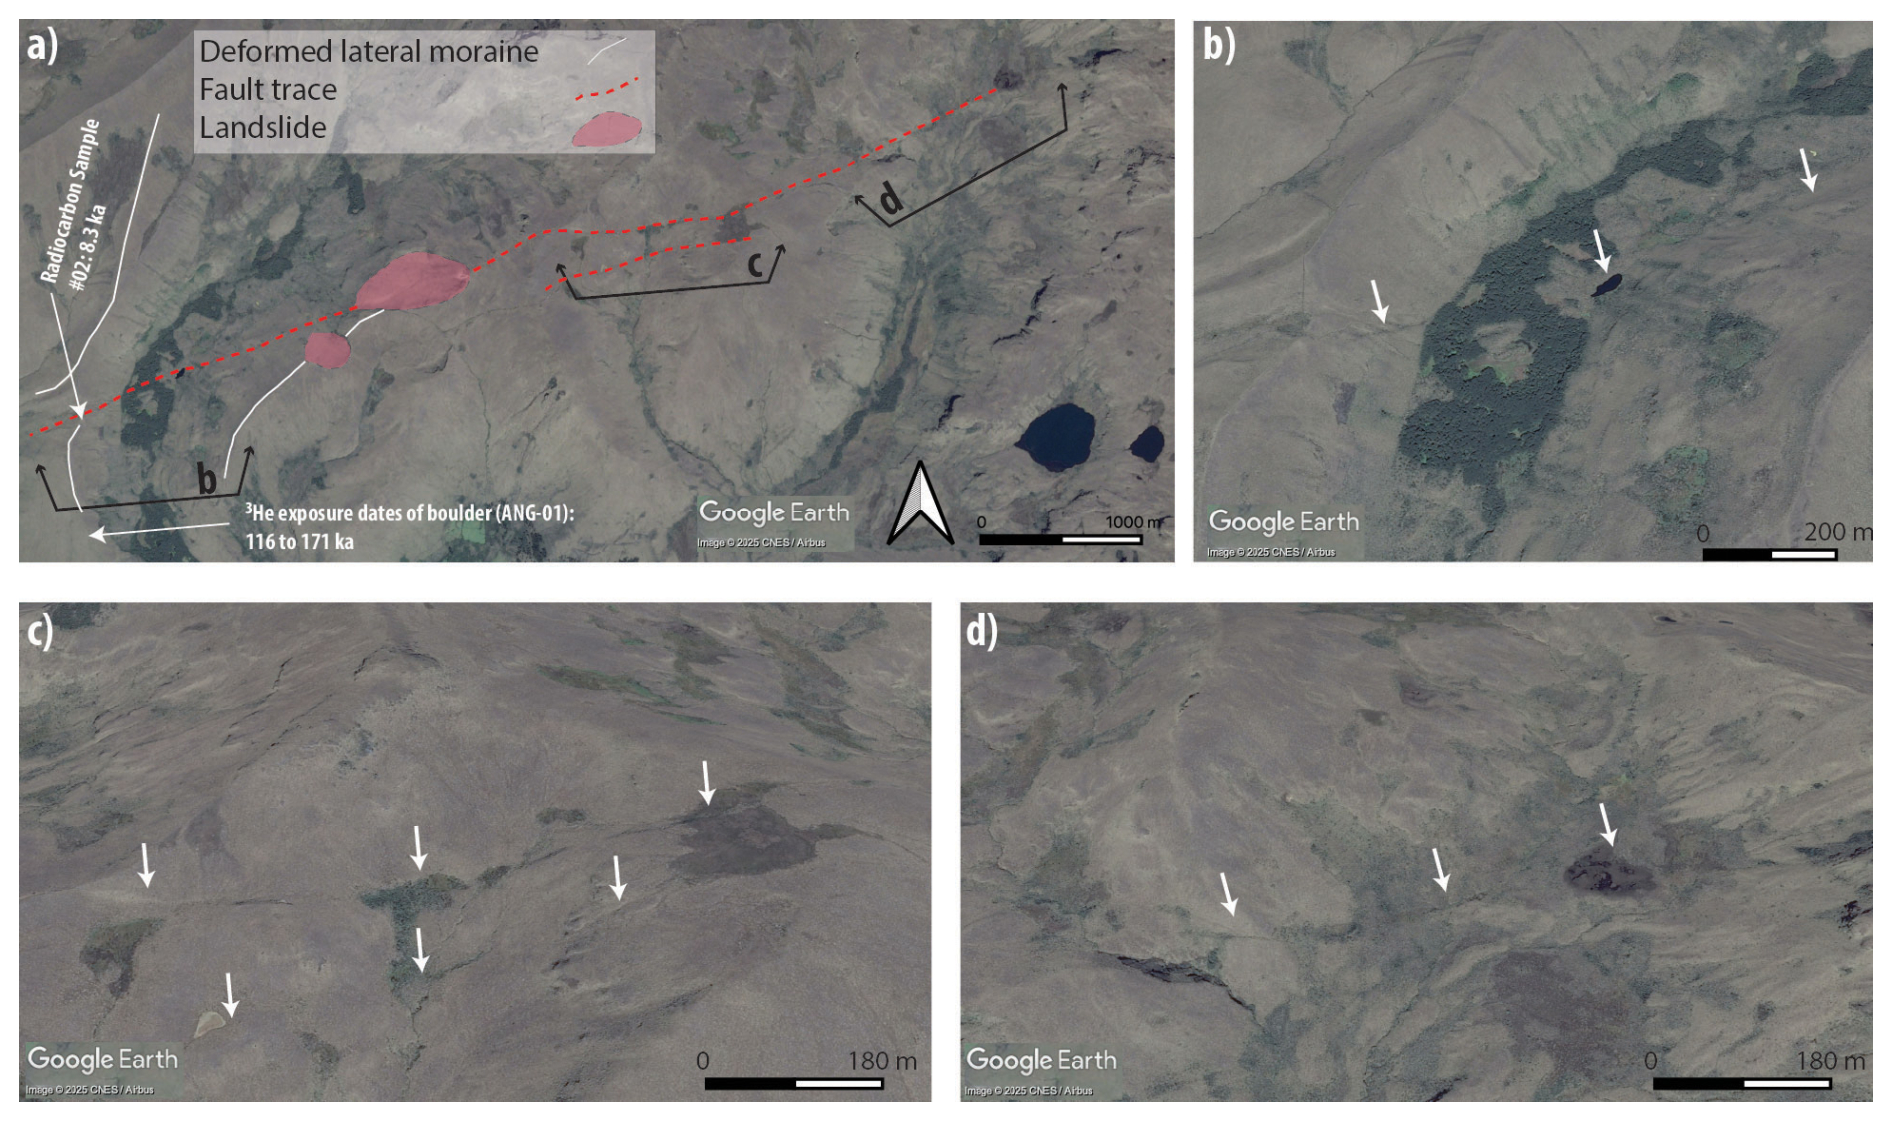
Figure 811 November 2016 satellite images of the Polylepis fault (Google, Image © CNES/Airbus). (a) Overview image showing trace of the fault trace, landslides, offset moraines, and locations of oblique views. (b) Trace of the Polylepis fault crossing lateral and ground moraine. Fault trace aligns with the southern edge of a small pond and the scarp here may form a dam. (c) and (d) show clear lineaments east of the offset moraine in (b).
Continuous cloud cover in the region prevented the acquisition of Pleiades satellite imagery suitable for DTM construction, but field excursions allowed analyses of a N-facing scarp cross cutting a lateral moraine and collection of samples from the moraine for dating (Fig. 8a). The scarp is ∼ 1 m high at the top of the lateral moraine, and shows no clear lateral displacement. A N-facing scarp is consistent with the small ponds at the valley bottom immediately east of the moraine (Fig. 8b), however, these ponds may be also have formed from damming by a recessional moraine.
5.4.2 Dating
Our 3He ages shows that the exposure of a large (∼ 5 m diameter) basalt boulder surface located on the lateral moraine ∼ 650 m south of the scarp at an elevation of 3710 m a.s.l., occurred between 116 and 171 ka (Sample ANG-01, Table 1). This age is significantly older than the exposure ages we determined at a higher elevation near the Reservoir fault (Table 1), and the LGM between 20 and 12 ka BP (Schubert and Clapperton, 1990). Due to the anomalously old age, we interpret this boulder may have been exposed during or before glacial plucking, transport, and deposition during the last glacial maximum. A radiocarbon sample from the base of the Andisol on the same moraine (Sample #02, Table 2, Fig. 8a) had an age of 8.26 ± 0.54 ka, slightly older than the oldest Andisol age along the Reservoir fault (Sample #37, 7.47 ± 0.08 ka), but also indicating soil formation after the LGM and that the moraine is likely a result of glaciation between 20 and 12 ka BP.
6.1 Distributed deformation
Our analyses of the 25 July 2022 Mw 5.6 earthquake and fault, geomorphic mapping, and paleoseismic surveys indicate that there are several SW–NE striking active faults that accommodate right-lateral slip south of the Chiles-Cerro Negro volcanic complex. The Reservoir fault and the InSAR analyses of the earthquake on the 25 July fault both show clear evidence of right-lateral Holocene fault ruptures. The best explanation for the linear scarps, landslides, and sag ponds along the Polylepis fault is also Holocene fault rupture, however further detailed studies are required to prove this hypothesis. Nonetheless, right-lateral slip on these three parallel faults is consistent with the right-lateral strain at the northern boundary of the Quito-Latacunga microblock that is predicted by the Jarrin et al. (2023) geodetic block model (Figs. 1; 2b). Additionally, distributed strain across these three parallel faults, which are spread over ∼ 10 km, is consistent with the lack of a sharp gradient in eastward velocities across the block boundary seen in InSAR (Fig. 3 Marconato et al., 2024a) and the distributed instrumental seismicity (Fig. 2b).
Based on our geomorphic mapping, a substantial portion of the geodetically modeled 3 mm yr−1 of right-lateral strain at the northern edge of the Quito-Latacunga microblock (Jarrin et al., 2023) is taken up by slip on the Reservoir fault. Considering the range of offsets of the glacial moraines and creeks (Fig. 5), the range of ages of these features from our cosmogenic 3He dating, and published ages we can estimate a slip rate on both the northern and southern strands of the fault. Assuming a maximum of 37 m of slip on both the northern and southern strands (26+11, 29+8 m, Fig. 5b), and a minimum age of 11.9 ka of the moraines (Table 1, Model 3, ANG-50), we calculate a maximum slip rate of 3.1 mm yr−1 on both of these strands or a combined rate of 6.2 mm yr−1 for both strands. Given a minimum offset of 5 m on the northern strand (16–11 m, Fig. 5b), 13 m on the southern strand (21–8 m, Fig. 5b), and a maximum deglaciation age of 20.4 ka (Table 1, Model 2, ANG-51), we estimate a minimum slip rate of 0.2 and 0.6 mm yr−1 on the northern and southern strands respectively. The combined minimum slip rate of both fault strands is 0.8 mm yr−1. Using a mean offset of 23 m for both the northern and southern strands, and an ice-free age of 15 ka (Rodbell et al., 2009; Blard et al., 2013; Angel et al., 2017), we obtain slip rates of 1.5 mm yr−1 for both strands and 3 mm yr−1 for the combined faults. Given these rates, slip on just the Reservoir fault could account for between one third to over double the total 3 mm yr−1 deformation rate observed in the block model (Jarrin et al., 2023). Because we observe active deformation on the 25 July fault, and most likely on the Polylepis fault, we argue that deformation is distributed across several faults and that slip on the Reservoir fault takes up substantially less than 100 % of the right-lateral strain at the north edge of the Quito-Latacunga block. This argument entails that either the minimum combined slip rate of the Reservoir fault (0.8 mm yr−1) is more accurate than the higher rates (>6 mm yr−1), or that the geodetic instantaneous deformation rate is lesser than the geologic slip rate.
The minimum and mean slip rates we determine for the Reservoir fault are similar to right lateral slip rates determined on the NE to ENE-trending Buesaco (0.65 to 1.6 mm yr−1) and Aranda (1.11 to 2.6 mm yr−1) faults near Pasto, Colombia (Fig. 9). These active structures, which are located >50 km north of the block model boundary, show that the deformation zone may be even more spread out and distributed (e.g., ∼ 70 km), or that it steps northward towards the east. Regional scale mapping (e.g., Veloza et al., 2012; Alvarado, 2012) also suggest numerous more northerly trending faults with a greater dip-slip component within this region of distributed deformation. If these structures can be shown to be active, the N-stepping strike-slip faults shown in this study may act as tear faults in a eastward stepping northerly-trending thrust belt system (Fig. 9). However, field studies of these structures are required to determine if they are active and how they relate to the strike-slip faults mapped here. The Buesaco and Aranda faults are also proximal to the active Galeras volcano, similar to our study area's proximity to the Chiles-Cerro Negro volcano complex (Fig. 2), suggesting that the volcanic centers may be influencing where deformation is focused (see below for more discussion, e.g., Ebmeier et al., 2016; Ruch et al., 2016).
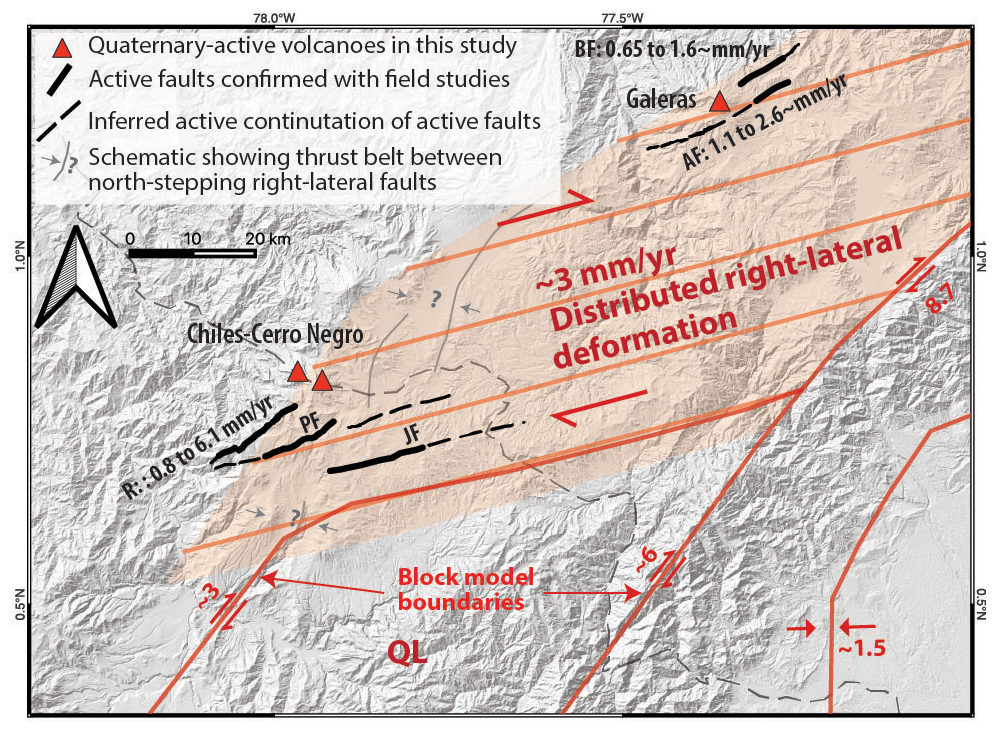
Figure 9Active strike-slip faults mapped in this study and active stike-slip faults near Galeras with known slip rates. These faults are part of the proposed wide zone of distributed right-lateral deformation at the northern boundary of the Quito-Latacunga microblock (QL). The seemingly N-stepping right-lateral faults may act as tear faults in a E-stepping thrust fault system. Slip rates of the Reservoir fault (this study) and slip rates from the Buesaca and Aranda faults (Tibaldi and Leon, 2000) are shown as are the locations of active volcanoes with recent documented seismic swarms and inflation (Chiles-Cerro Negro and Galeras). RF: Reservoir fault, PF: Polylepis fault, JF: 25 July fault, BF: Buesaco fault, AF: Aranda fault.
6.2 Interaction with the Chiles-Cerro Negro Volcano complex
The proximity of our study area to recent inflation at the Chiles-Cerro Negro volcanic complex suggests that volcanism may not only localize deformation, but it also could account for a difference between geodetic and geologic slip rates. Shallow seismicity (Ebmeier et al., 2016), uplift, and westward and eastward expansion away from a N–S axis centered on Chiles-Cerro Negro visible in InSAR (Fig. 3a), document volcanic inflation that has been undergoing since 2014. The 25 July 2022 right-lateral M 5.6 rupture along a ENE-striking fault we document with InSAR (Fig. 4) could be triggered by this inflation, similar to inflation-triggered strike-slip earthquakes at Makushkin Volcano in Alaska (Cheng and Grapenthin, 2024). We suggest this trigger because there is a N-to-S reduction across the 25 July fault in the eastward interseismic InSAR velocities resulting from inflation (Fig. 3a). Inflation northwest of the fault should induce a horizontal stress in a NE–SE direction and induce right-lateral shear on the 25 July fault, which is compatible with the observed right-lateral slip in the 25 July earthquake. This hypothesis needs further testing, however, potentially with a model calculating Coulomb stress changes resulting from inflation (e.g., Ebmeier et al., 2016; Cheng and Grapenthin, 2024). We speculate that the larger M 6.6 1868 earthquake could have also been related to volcanism at Chiles-Cerro Negro as volcanic activity was reported around that time (Monsalve and Laverde, 2016).
The influence that the Chiles-Cerro Negro volcano has on faults in the area may explain why combined right-lateral slip rates of the Reservoir, Polylepis, and 25 July faults could potentially be higher than geodetic slip rates at the northern boundary of the Quito-Latacunga microblock. The calculated slip rate using mean offsets along the Reservoir fault alone is ∼ 3 mm yr−1, and given the evidence for recent activity on the other two faults it is very plausible that the combined geologic slip rate of these three faults is greater than the 3 mm yr−1 predicted in the Jarrin et al. (2023) block model. The geodetic block model uses GNSS velocities from a wide area across northwestern South America and southern Central America. A model that is consistent with all of these velocities may, by definition, ignore local high strain gradients like the one caused by inflation of the Chiles-Cerro Negro volcanic complex. Additionally, volcanic unrest could trigger ruptures on critically stressed faults via pore fluid pressure increase (e.g., Ebmeier et al., 2016). Pore-fluid pressure increase could be a better explanation for triggering earthquakes on the Reservoir and Polylepis faults as they are positioned different relatively to the zone of recent inflation than the 25 July fault (Figs. 3, 9). A period of high volcanic activity could decrease the average earthquake recurrence interval and increase the short-term slip rate. Therefore, the faults in our study area could have greater earthquake rates and slip rates over the Holocene, resulting in part from volcanic inflation, than the geodetic block model predicts. The long-term slip rate are probably not affected by changes in volcanic activity and more likely controlled by the larger scale tectonics forces. But, the dynamic stresses at the volcanic centers (Chiles-Cerro Negro and Galeras) could be triggering ruptures and localizing deformation around them. Therefore, they could be a partial control on the location of the northern edge of the Quito-Latacunga microblock.
6.3 Reactivation of basement faults
The Polylepis and 25 July faults, and most of the lineations mapped in this study, are oriented oblique (more W–E) to the bedrock structures near Chiles-Cerro-Negro (Fig. 2b). The Reservoir fault, which trends northeast, however, may be more well aligned with some of these faults, for example the SW–NE trending structure immediately east of Cerro-Negro. Thick deposits of Quaternary volcanic and volcaniclastic rocks in the study area prevented us from mapping of older bedrock faults in the immediate vicinity of these faults. But, based on the orientation of previously mapped bedrock geology maps and the orientation of most of our mapped active faults, bedrock structures south of Chiles-Cerro Negro are mostly not reactivated and are therefore probably not favorably aligned with the crustal stress conditions. This result is similar to studies at the southern edge of the Quito Latacunga microblock where Alvarado et al. (2016) show that ancient terrane bounding faults are not being reactivated by more recent and active faults. In contrast, along the eastern boundary of the microblock, active faults are parallel with and likely reactivate bedrock structures (Tibaldi et al., 2007; Alvarado et al., 2016). As mentioned previously, inflation of Chiles-Cerro Negro may change stress conditions at the northern edge of the Quito-Latacunga microblock, aligning them in a way that favors new fault formation. At the larger scale, the northern edge of the block is aligned with the northern side of a large constraining step-over of the entire eastern boundary of the NAS. This major change in geometry may indicate that principal stress orientations are rotating and the overall tectonic regime may also plays a role in changing stress conditions at this location.
To the north in Colombia near the Galeras volcano, the Romeral Shear zone is being reactivated along the Buesaco and Aranda faults (Tibaldi and Leon, 2000; Rovida and Tibaldi, 2005). Our preliminary mapping shows lineaments southwest of Galeras that also may be aligned with the Cauca-Patía fault system (Fig. 2; Veloza et al., 2012). These bedrock structures are oriented slightly more W–E than the bedrock faults mapped immediately south of Chiles-Cerro Negro, and therefore they also could be more favorably aligned for reactivation.
6.4 Earthquake hazard
A slip rate, and earthquake recurrence and magnitudes are required to include crustal faults as seismic sources in probabilistic seismic hazard assessment (PSHA) models. For the Reservoir fault, we have determined slip rates above. Based on the earthquake history observed in the exposures of the Reservoir fault (Figs. 6 and 7) we can also estimate the recurrence interval for large surface rupturing earthquakes. Smaller earthquakes often do not rupture to surface, or may cause only small offset that may not be discernible in the stratigraphy (e.g., Canora et al., 2012). For example, we did not observe surface offsets from the 25 July earthquake in this study, even though there was up to 8 cm of discrete offset observed with InSAR (Fig. 4). Even if there was surface offset, an offset of this magnitude in a paramo environment would likely only offset Andisol against Andisol, making it impossible to perceive in trench or roadcut exposures. Therefore, we may only be observing the largest earthquakes in the exposures (e.g., M>6.5, Canora et al., 2012). The average time interval between earthquakes (or between the latest earthquake and present) we observe in the Reservoir fault outcrop (Fig. 7c) is 2.3 ± 0.5 ka. However, given that the one of these intervals was calculated using the present-day as a minimum interval, the uncertainty is greater than we calculate.
Using fault scaling relations between overall rupture length and magnitude we can estimate magnitudes of the observed paleo-earthquakes. Considering ruptures of the entire estimated length of the northern branch of the Reservoir fault of 10.5 to 25.5 km, the Wesnousky (2008) length scaling relation suggests a magnitude between M 6.3 and 6.7. Using a similar Leonard (2010) scaling relation, we estimate paleo-earthquake magnitudes between M 5.9 and M 6.5. A rupture of just the ∼ 10 to 15 km long southern branch would also fall within this magnitude range. Given the observation of parallel coeval fault ruptures during the 25 July earthquake (Fig. 4d), and during other earthquakes (e.g., 2016 M 7.8 Kaikoura, Hamling et al., 2017; Morishita et al., 2017; Williams et al., 2018), we must consider that both north and south segments of the Reservoir fault have ruptured during a single event. If these faults were not connected at depth we would consider them as separate faults and consider their total summed length (20 to 50 km) in a magnitude estimation. These lengths would predict paleo-earthquake magnitudes between M 6.6 and M 7.0 using the Wesnousky (2008) relation and between M 6.3 and M 6.9 using the Leonard (2010) relation.
We can also roughly estimate paleo-earthquake magnitudes using the offsets along the northern branch of the Reservoir fault in Fig. 5 assuming the earthquakes observed in Fig. 7 account for the majority of the displacement. If there have only been three large earthquakes since the LGM, and using a total offset between 5 and 37 m of the glacial stream and lateral moraine, we estimate 1.7 to 12.3 m of horizontal slip during each earthquake. With the Wesnousky (2008) relation between displacement and rupture length, rupture lengths would be between 28 and 205 km corresponding to magnitudes of M 6.8 and M 7.7. Using the Leonard (2010) relation we estimate rupture lengths between 75 and 830 km corresponding to magnitudes of M 7.2 and M 8.8. Only the 28 km rupture length estimation using the minimum average slip of 1.7 m and the Wesnousky (2008) scaling relation falls within the range of what we observe in the field (10 to 50 km). We therefore exclude any estimates of magnitude using the Leonard (2010) relation. We also assume that if the total summed slip is greater than 5 m (three ∼ 1.7 m earthquakes), it must represent earthquakes we do not observe in the fault exposure, or fault creep. These earthquakes may be older than the oldest sediments offset in the exposures (8.54 to 8.39 ka), which is likely given the long time between deglaciation and the oldest event. The unaccounted for earthquakes could also have ruptured other fault segments (e.g., just the southern branch), not ruptured to surface, or have been smaller and not observable. In conclusion, based on the assumption of ∼ 1.7 m of horizontal slip per earthquake, or 10.5 to 50 km of rupture length, and using the Wesnousky (2008) scaling relation, we estimate that the paleo-earthquake magnitudes were likely between M 6.3 and M 7.0 (for either a single fault strand rupture or a coeval rupture of both strands).
We note there may be additional uncertainty resulting from shallow earthquake depths in the study area. The 2014 M5.6 and the 2022 M 5.6 earthquake both have depths <5 km, and therefore may have a lesser rupture area for a given rupture length. The smaller rupture area would result in a lower magnitude and the magnitudes we determined above may be overestimated.
Our estimated paleo-earthquake magnitudes overlap with the proposed magnitude of the 15 August 1868 M 6.4 to M 6.8 earthquake that was determined to have a likely epicenter between El Angel and Chiles-Cerro Negro and close to the Reservoir, Polylepis, and 25 July faults (Fig. 2a, Beauval et al., 2010). We do not see evidence for a large earthquake as recent as 1868 in the exposure of the northern branch of the Reservoir fault, but this earthquake may have ruptured the southern branch of the Reservoir fault, or another structure in the area such as the Polylepis fault. The clear surface expression and recent landslides along the Polylepis fault (Fig. 8) leads us to speculate that it may have been the host of the 1868 earthquake, but detailed paleoseismic studies of this fault are needed to test this hypothesis.
Using remote sensing and field-based studies, we have been able to determine where some of the right-lateral deformation at the northern boundary of the geodetically defined Quito-Latacunga microblock is accommodated by active faulting. InSAR analyses of a recent 25 July 2022 Mw 5.6 right-lateral strike-slip earthquake, along with geomorphic mapping and field studies, show that some or all of the geodetically observed strain is accommodated by a >10 km wide zone of sub-parallel and discontinuous NE-SW trending faults in northern Ecuador. This zone of distributed faulting may in fact be much wider and include previously studied active faults in southern Colombia near Galeras volcano. The structures we documented lack a coherent through-going geometry, are likely influenced by volcanism (notably the Chiles-Cerro Negro volcanic complex), and show a wide range of potential Holocene slip rates (0.8 to 6.2 mm yr−1) that could cumulatively match or exceed the block model slip rate predictions. Seismicity and geodetic data further support this faulting pattern, as neither seismic clusters nor GNSS velocity gradients align with a singular fault trace. Instead, the region resembles a crustal-scale distributed shear zone that transfers strain across a mechanically heterogeneous domain, modulated by volcanic, and lithospheric controls.
Volcanic inflation at Chile-Cerro Negro may increase earthquake recurrence and may result in Holocene geologic slip rates that exceed geodetic ones. The stress conditions imparted by volcanic inflation may also result in whether basement faults are reactivated at the northern boundary of the microblock. In the case of Chiles-Cerro Negro inflation, we observe that the basement sutures are not being reactivated and new faults parallel with the geodetic block boundary have been formed. Conversely in southern Colombia, basement sutures have been shown to be reactivated, potentially due to them having a different orientation. Given our observations, it is possible that active volcanism plays a part in where the microblock boundaries have formed.
The observed distributed deformation still poses a substantial seismic hazard to communities in northern Ecuador and southern Colombia (e.g. El Angel and Pasto). Despite lesser fault lengths and significant segmentation, we show that these structures are capable of, and could have hosted the destructive 1868 M 6.4–6.8 earthquake near El Angel. Further detailed geomorphic mapping and paleoseismic studies along the northern boundary of the Quito-Latacunga microblock could further constrain earthquake recurrences and slip rates on the Reservoir, Polylepis and 25 July fault, and find more active faults and further define seismic hazard in this region.
Codes used for OxCal version 4.4.4 (Bronk Ramsey, 2009) and the shell script used to build a Digital Terrain Model (DTM) from the Pleiades satellite tri-stereo imagery using NASA Ames Stereoipeline (Beyer et al., 2018) are provided a data repository (https://doi.org/10.5281/zenodo.18356947, Harrichhausen et al., 2026).
The 5 m GeoSAR DTM of southern Colombia, the Pleiades-derived DTM built in this study, a shapefile with our lateral moraine and channel projections used to calculate offsets, a table showing cosmogenic sample locations and He isotope abundances, and a high resolution version of Fig. 7 are provided in a data repository (Harrichhausen et al., 2026) available at: https://doi.org/10.5281/zenodo.18356947.
Conceptualization: NH, LA, AA. Formal analysis: NH, LM. Funding acquisition: NH, LA, SB, HJ. Investigation: NH, LM, LA, PL, SB, HJ, AA, PHB. Methodology: NH, LM, JH, PHB. Project administration: NH, LA, AA. Resources: AA, IO. Supervision: LA, FR. Visualization: NH, LM. Writing (original draft preparation): NH, LM. Writing (review and editing): NH, LM, LA, PL, SB, HJ, AA, PHB, PM, FR, IO.
The contact author has declared that none of the authors has any competing interests.
Publisher's note: Copernicus Publications remains neutral with regard to jurisdictional claims made in the text, published maps, institutional affiliations, or any other geographical representation in this paper. The authors bear the ultimate responsibility for providing appropriate place names. Views expressed in the text are those of the authors and do not necessarily reflect the views of the publisher.
This research was partly funded by a Centre National d'Études Spatiales (CNES) postdoctoral fellowship to N. Harrichhausen, and it benefited from the Institut de Recherche pour le Développement's (IRD) financial contribution to LMC14 (CEA-CNRS-IRD-IRSN-MCC). Additional funding for radiocarbon dating was provided by the Autorité de Sûreté Nucléaire et de Radioprotection (ASNR). A special thanks to J. Carcaillet and N. Paradis at ISTerre for their assistance with preparing samples for cosmogenic 3He dating. We also would like to thank S. Wimpenny and an anonymous reviewer for their constructive comments and suggestions. Finally, thank you to A. Holland and K. Johnson for proofreading our manuscript.
This research has been supported by the Centre National d'Etudes Spatiales, the Institut de Recherche pour le Développement, and the Autorité de Sûreté Nucléaire et de Radioprotection (ASNR).
This paper was edited by Christoph von Hagke and reviewed by Sam Wimpenny and one anonymous referee.
Agisoft: Agisoft Metashape (Version 1.7.2) [software], http://www.agisoft.com/downloads/installer/, last access: February 2021. a
Allmendinger, R. W., Loveless, J. P., Pritchard, M. E., and Meade, B.: From decades to epochs: Spanning the gap between geodesy and structural geology of active mountain belts, J. Struct. Geol., 31, 1409–1422, https://doi.org/10.1016/j.jsg.2009.08.008, 2009. a
Alvarado, A.: Néotectonique et cinématique de la déformation continentale en Equateur, PhD thesis, Université de Grenoble, https://theses.hal.science/tel-00870332/ (last access: August 2025), 2012. a, b, c, d, e
Alvarado, A., Audin, L., Nocquet, J.-M., Jaillard, E., Mothes, P., Jarrín, P., Segovia, M., Rolandone, F., and Cisneros, D.: Partitioning of oblique convergence in the Northern Andes subduction zone: Migration history and the present-day boundary of the North Andean Sliver in Ecuador, Tectonics, 35, 1048–1065, https://doi.org/10.1002/2016tc004117, 2016. a, b, c, d, e, f, g, h, i, j
Angel, I., Guzman, O., and Carcaillet, J.: Pleistocene Glaciations in the Northern Tropical Andes, South America (Venezuela, Colombia and Ecuador), Cuadernos de Investigación Geográfica, 43, 571, https://doi.org/10.18172/cig.3202, 2017. a, b, c
Arcila, M. and Muñoz Martín, A.: Integrated perspective of the present–day stress and strain regime in Colombia from analysis of earthquake focal mechanisms and geodetic data, chap. 17, pp. p. 549–569, Servicio Geológico Colombiano, Publicaciones Geológicas Especiales, 38, https://doi.org/10.32685/pub.esp.38.2019.17, 2020. a
Aspden, J. A. and Litherland, M.: The geology and Mesozoic collisional history of the Cordillera Real, Ecuador, Tectonophysics, 205, 187–204, https://doi.org/10.1016/0040-1951(92)90426-7, 1992. a, b
Aspden, J. A. and McCourt, W. J.: Mesozoic oceanic terrane in the central Andes of Colombia, Geology, 14, 415–418, https://doi.org/10.1130/0091-7613(1986)14<415:MOTITC>2.0.CO;2, 1986. a
Audemard, F.: Active block tectonics in and around the Caribbean: A Review, in: The Northeastern Limit of the South American Plate – Lithospheric Structures from Surface to the Mantle, 1st edn., chap. 2, edited by: Schmitz, M., Audemard, F., and Urbani, F., Editorial Innovación Tecnológica, 29–77, https://mariantoc.github.io/2024/Resources_2024/TectonicsInAroundCaribbean.pdf (last access: April 2026), 2014. a
Audemard M, F. A., Mora-Páez, H., and Fonseca P, H. A.: Net right-lateral slip of the Eastern Frontal Fault System, North Andes Sliver, northwestern South America, J. S. Am. Earth Sci., 109, 103286, https://doi.org/10.1016/j.jsames.2021.103286, 2021. a
Baize, S., Audin, L., Winter, T., Alvarado, A., Moreno, L. P., Taipe, M., Reyes, P., Kauffmann, P., and Yepes, H.: Paleoseismology and tectonic geomorphology of the Pallatanga fault (Central Ecuador), a major structure of the South-American crust, Geomorphology, 237, 14–28, https://doi.org/10.1016/j.geomorph.2014.02.030, 2015. a, b, c
Baize, S., Audin, L., Alvarado, A., Jomard, H., Bablon, M., Champenois, J., Espin, P., Samaniego, P., Quidelleur, X., and Le Pennec, J.-L.: Active tectonics and earthquake geology along the Pallatanga fault, central Andes of Ecuador, Frontiers in Earth Science, 8, 193, https://doi.org/10.3389/feart.2020.00193, 2020. a, b
Balco, G., Stone, J. O., Lifton, N. A., and Dunai, T. J.: A complete and easily accessible means of calculating surface exposure ages or erosion rates from 10Be and 26Al measurements, Quat. Geochronol., 3, 174–195, https://doi.org/10.1016/j.quageo.2007.12.001, 2008. a, b, c
Beauval, C., Yepes, H., Bakun, W. H., Egred, J., Alvarado, A., and Singaucho, J.-C.: Locations and magnitudes of historical earthquakes in the Sierra of Ecuador (1587–1996), Geophys. J. Int., 181, 1613–1633, https://doi.org/10.1111/j.1365-246x.2010.04569.x, 2010. a, b, c, d
Benford, B., DeMets, C., Tikoff, B., Williams, P., Brown, L., and Wiggins-Grandison, M.: Seismic hazard along the southern boundary of the Gônave microplate: block modelling of GPS velocities from Jamaica and nearby islands, northern Caribbean, Geophys. J. Int., 190, 59–74, https://doi.org/10.1111/j.1365-246X.2012.05493.x, 2012. a
Beyer, R. A., Alexandrov, O., and McMichael, S.: The Ames Stereo Pipeline: NASA's Open Source Software for Deriving and Processing Terrain Data, Earth and Space Science, 5, 537–548, https://doi.org/10.1029/2018EA000409, 2018. a, b
Blard, P.-H.: Cosmogenic 3He in terrestrial rocks: A review, 586, 120543, https://doi.org/10.1016/j.chemgeo.2021.120543, 2021. a, b
Blard, P.-H., Lavé, J., Pik, R., Wagnon, P., and Bourlès, D.: Persistence of full glacial conditions in the central Pacific until 15,000 years ago, Nature, 449, 591–594, https://doi.org/10.1038/nature06142, 2007. a
Blard, P.-H., Lavé, J., Sylvestre, F., Placzek, C., Claude, C., Galy, V., Condom, T., and Tibari, B.: Cosmogenic 3He production rate in the high tropical Andes (3800 m, 20° S): Implications for the local last glacial maximum, Earth Planet. Sc. Lett., 377–378, 260–275, https://doi.org/10.1016/j.epsl.2013.07.006, 2013. a, b, c, d, e, f
Blard, P.-H., Balco, G., Burnard, P., Farley, K., Fenton, C., Friedrich, R., Jull, A., Niedermann, S., Pik, R., Schaefer, J., Scott, E., Shuster, D., Stuart, F., Stute, M., Tibari, B., Winckler, G., and Zimmermann, L.: An inter-laboratory comparison of cosmogenic 3He and radiogenic 4He in the CRONUS-P pyroxene standard, Quat. Geochronol., 26, 11–19, https://doi.org/10.1016/j.quageo.2014.08.004, 2015. a
Boland, M., McCourt, W., and Beate, B.: Mapa geológico de la Cordillera Occidental del Ecuador entre 0–1° N, escala 1:200.000, Minist. Energ. Min.-BGS publs., Quito, https://www.geoenergia.gob.ec/mapas-tematicos-1-200-000/ (last access: June 2022), 2000. a, b, c
Bronk Ramsey, C.: Bayesian Analysis of Radiocarbon Dates, Radiocarbon, 51, 337–360, https://doi.org/10.1017/S0033822200033865, 2009. a, b, c
Bustamante, C., Archanjo, C. J., Cardona, A., and Vervoort, J. D.: Late Jurassic to Early Cretaceous plutonism in the Colombian Andes: A record of long-term arc maturity, GSA Bulletin, 128, 1762–1779, https://doi.org/10.1130/B31307.1, 2016. a
Calvache, M. L. and Duque-Trujillo, J. F.: Geomorphological Features of the Galeras Volcanic Complex, in: Landscapes and Landforms of Colombia, Springer, 193–202, https://doi.org/10.1007/978-3-319-11800-0_16, 2016. a
Canora, C., Villamor, P., Martínez-Díaz, J., Berryman, K. R., Álvarez-Gómez, J. A., Capote, R., and Hernández, W.: Paleoseismic analysis of the San Vicente segment of the El Salvador Fault Zone, El Salvador, Central America, Geol. Acta, 10, 103–123, https://doi.org/10.1344/105.000001700, 2012. a, b
Cediel, F., Shaw, R. P., and Cáceres, C.: Tectonic assembly of the northern Andean block, in: The Circum-Gulf of Mexico and the Caribbean: Hydrocarbon habitats, basin formation, and plate tectonics: AAPG Memoir 79, edited by: Bartolini, C., Buffler, R. T., and Blickwede, J., AAPG Special Volumes, 815–848, https://doi.org/10.1306/M79877, 2003. a
Champenois, J., Baize, S., Vallée, M., Jomard, H., Alvarado, A., Espin, P., Ekström, G., and Audin, L.: Evidences of surface rupture associated with a low-magnitude (Mw 5.0) shallow earthquake in the Ecuadorian Andes, J. Geophys. Res.-Sol. Ea., 122, 8446–8458, https://doi.org/10.1002/2017JB013928, 2017. a
Cheng, Y. and Grapenthin, R.: The Alaska Makushin Volcano 2016–2018 inflation and its potential relation to the 2020 earthquake swarm, from GNSS observations, J. Volcanol. Geoth. Res., 446, 108010, https://doi.org/10.1016/j.jvolgeores.2024.108010, 2024. a, b
Collettini, C., Barchi, M. R., De Paola, N., Trippetta, F., and Tinti, E.: Rock and fault rheology explain differences between on fault and distributed seismicity, Nat. Commun., 13, 5627, https://doi.org/10.1038/s41467-022-33373-y, 2022. a
Delunel, R., Blard, P.-H., Martin, L. C., Nomade, S., and Schlunegger, F.: Long term low latitude and high elevation cosmogenic 3He production rate inferred from a 107 ka-old lava flow in northern Chile; 22° S–3400 m a.s.l., Geochim. Cosmochim. Ac., 184, 71–87, https://doi.org/10.1016/j.gca.2016.04.023, 2016. a, b, c
Doblas, M.: Slickenside kinematic indicators, Tectonophysics, 295, 187–197, https://doi.org/10.1016/s0040-1951(98)00120-6, 1998. a
Doin, M.-P., Guillaso, S., Jolivet, R., Lasserre, C., Lodge, F., Ducret, G., and Grandin, R.: Presentation of the small baseline NSBAS processing chain on a case example: The Etna deformation monitoring from 2003 to 2010 using Envisat data, ESA SP-697, Frascati, Italy, 3434–3437, https://ens.hal.science/hal-02185213/ (last access: February 2024), 2011. a
Doin, M.-P., Cheiab, A., and Thollard, F.: Strategy Used for Phase Unwrapping in the NSBAS MT-InSAR Chain, in: IGARSS 2023 - 2023 IEEE International Geoscience and Remote Sensing Symposium, IEEE, 8210–8213, ISBN 9798350320107, https://doi.org/10.1109/IGARSS52108.2023.10283158, 2023. a
DuRoss, C. B., Gold, R. D., Gray, H. J., and Nicovich, S. R.: Portable optically stimulated luminescence age map of a paleoseismic exposure, Geology, 50, 470–475, https://doi.org/10.1130/g49472.1, 2022. a
Eaves, S. R., N. Mackintosh, A., Winckler, G., Schaefer, J. M., Alloway, B. V., and Townsend, D. B.: A cosmogenic 3He chronology of late Quaternary glacier fluctuations in North Island, New Zealand (39° S), Quaternary Sci. Rev., 132, 40–56, https://doi.org/10.1016/j.quascirev.2015.11.004, 2016. a
Ebmeier, S. K., Elliott, J. R., Nocquet, J.-M., Biggs, J., Mothes, P., Jarrín, P., Yépez, M., Aguaiza, S., Lundgren, P., and Samsonov, S. V.: Shallow earthquake inhibits unrest near Chiles–Cerro Negro volcanoes, Ecuador–Colombian border, Earth Planet. Sc. Lett., 450, 283–291, https://doi.org/10.1016/j.epsl.2016.06.046, 2016. a, b, c, d, e, f, g, h, i
Eguez, A., Alvarado, A., Yepes, H., Machette, M. N., Costa, C., Dart, R. L., and Bradley, L.: Database and map of Quaternary faults and folds of Ecuador and its offshore regions, US Geological Survey Open-File Report, 3, 289, https://doi.org/10.3133/ofr03289, 2003. a
Elliott, J. and Freymueller, J. T.: A block model of present-day kinematics of Alaska and western Canada, J. Geophys. Res.-Sol. Ea., 125, e2019JB018378, https://doi.org/10.1029/2019JB018378, 2020. a
Espín Bedón, P. A., Elliott, J. R., Wright, T. J., Ebmeier, S., Mothes, P., Lazecky, M., Maghsoudi, Y., McGrath, J., and Andrade, D.: Deformation of the Ecuadorian Inter-Andean valley and surroundings from a combined InSAR-GNSS velocity field 2017–2023, J. S. Am. Earth Sci., 163, 105588, https://doi.org/10.1016/j.jsames.2025.105588, 2025. a, b
Evans, E. L.: A dense block model representing western continental United States deformation for the 2023 update to the National Seismic Hazard Model, Seismological Society of America, 93, 3024–3036, https://doi.org/10.1785/0220220141, 2022. a
Fiorini, E. and Tibaldi, A.: Quaternary tectonics in the central Interandean Valley, Ecuador: Fault-propagation folds, transfer faults and the Cotopaxi Volcano, Global Planet. Change, 90, 87–103, https://doi.org/10.1016/j.gloplacha.2011.06.002, 2012. a
Geirsson, H., d'Oreye, N., Mashagiro, N., Syauswa, M., Celli, G., Kadufu, B., Smets, B., and Kervyn, F.: Volcano-tectonic deformation in the Kivu Region, Central Africa: Results from six years of continuous GNSS observations of the Kivu Geodetic Network (KivuGNet), J. Afr. Earth Sci., 134, 809–823, https://doi.org/10.1016/j.jafrearsci.2016.12.013, 2017. a
Gomba, G., Parizzi, A., De Zan, F., Eineder, M., and Bamler, R.: Toward Operational Compensation of Ionospheric Effects in SAR Interferograms: The Split-Spectrum Method, EEE T. Geosci. Remote, 54, 1446–1461, https://doi.org/10.1109/TGRS.2015.2481079, 2015. a
Gray, H., DuRoss, C., Nicovich, S., and Gold, R.: Luminescence sediment tracing reveals the complex dynamics of colluvial wedge formation, Science Advances, 8, eabo0747, https://doi.org/10.1126/sciadv.abo0747, 2022. a
Grützner, C., Schneiderwind, S., Papanikolaou, I., Deligiannakis, G., Pallikarakis, A., and Reicherter, K.: New constraints on extensional tectonics and seismic hazard in northern Attica, Greece: the case of the Milesi Fault, 204, 180–199, https://doi.org/10.1093/gji/ggv443, 2015. a
Guillier, B., Chatelain, J.-L., Jaillard, É., Yepes, H., Poupinet, G., and Fels, J.-F.: Seismological evidence on the geometry of the Orogenic System in central-northern Ecuador (South America), Geophys. Res. Lett., 28, 3749–3752, https://doi.org/10.1029/2001GL013257, 2001. a
Gómez, J., Schobbenhaus, C., Montes, N. E., and compilers: Geological Map of South America 2019. Scale 1:5 000 000, https://doi.org/10.32685/10.143.2019.929, 2019. a
Hall, M. L., Samaniego, P., Le Pennec, J.-L., and Johnson, J.: Ecuadorian Andes volcanism: A review of Late Pliocene to present activity, J. Volcanol. Geoth. Res., 176, 1–6, https://doi.org/10.1016/j.jvolgeores.2008.06.012, 2008. a
Hamling, I. J., Hreinsdóttir, S., Clark, K., Elliott, J., Liang, C., Fielding, E., Litchfield, N., Villamor, P., Wallace, L., Wright, T. J., and D’Anastasio, E.: Complex multifault rupture during the 2016 Mw 7.8 Kaikōura earthquake, New Zealand, Science, 356, eaam7194, https://doi.org/10.1126/science.aam7194, 2017. a
Harrichhausen, N., Audin, L., Baize, S., Johnson, K. L., Beauval, C., Jarrin, P., Marconato, L., Rolandone, F., Jomard, H., Nocquet, J., Alvarado, A., and Mothes, P. A.: Fault Source Models Show Slip Rates Measured across the Width of the Entire Fault Zone Best Represent the Observed Seismicity of the Pallatanga–Puna Fault, Ecuador, Seismol. Res. Lett., 95, 95–112, https://doi.org/10.1785/0220230217, 2023a. a
Harrichhausen, N., Finley, T., Morell, K. D., Regalla, C., Bennett, S. E. K., Leonard, L. J., Nissen, E., McLeod, E., Lynch, E. M., Salomon, G., and Sethanant, I.: Discovery of an Active Forearc Fault in an Urban Region: Holocene Rupture on the XEOLXELEK-Elk Lake Fault, Victoria, British Columbia, Canada, Tectonics, 42, e2023TC008170, https://doi.org/10.1029/2023TC008170, 2023b. a
Harrichhausen, N., Marconato, L., Audin, L., Pierre Lacan and, S. B., Jomard, H., Alvarado, A., Hollingsworth, J., Mothes, P. A., Rolandoné, F., Martin, I. D. O., and Arcila, M.: Distributed right-lateral strain at the northern boundary of the Quito-Latacunga microblock: Dataset, Zenodo [code and data set], https://doi.org/10.5281/zenodo.18356947, 2026. a, b, c, d, e, f, g, h, i, j, k
Hughes, R. A. and Pilatasig, L. F.: Cretaceous and Tertiary terrane accretion in the Cordillera Occidental of the Andes of Ecuador, Tectonophysics, 345, 29–48, https://doi.org/10.1016/S0040-1951(01)00205-0, 2002. a, b
IG-EPN: Informe Especial del volcán Chiles – Cerro Negro No. 3. Tech. rep. 1, Tech. rep., Instituto Geofisico – Escuela Politécnica Nacional, https://www.igepn.edu.ec/servicios/noticias/ (last access: April 2026), 2022. a
Jaillard, E., Ordoñez, M., Suárez, J., Toro, J., Iza, D., and Lugo, W.: Stratigraphy of the late Cretaceous–Paleogene deposits of the cordillera occidental of central ecuador: geodynamic implications, J. S. Am. Earth Sci., 17, 49–58, https://doi.org/10.1016/j.jsames.2004.05.003, 2004. a, b
Jaillard, E., Lapierre, H., Ordoñez, M., Álava, J. T., Amórtegui, A., and Vanmelle, J.: Accreted oceanic terranes in Ecuador: southern edge of the Caribbean Plate?, Geological Society, London, Special Publications, 328, 469–485, https://doi.org/10.1144/SP328.19, 2009. a, b
Jarrin, P., Nocquet, J.-M., Rolandone, F., Audin, L., Mora-Páez, H., Alvarado, A., Mothes, P., Audemard, F., Villegas-Lanza, J. C., and Cisneros, D.: Continental block motion in the Northern Andes from GPS measurements, Geophys. J. Int., 235, https://doi.org/10.1093/gji/ggad294, 2023. a, b, c, d, e, f, g, h, i, j, k, l, m, n, o, p, q
Jiménez, M., García-Fernández, M., and Romero, J.: 1989–1995 Earthquake sequences in the Galeras volcano region, SW Colombia, and possible volcano–earthquake interactions, Tectonophysics, 463, 47–59, https://doi.org/10.1016/j.tecto.2008.09.004, 2009. a, b
Jomard, H., Saqui, D., Baize, S., Alvarado, A., Bernard, B., Audin, L., Hidalgo, S., Pacheco, D., Ruiz, M., and Segovia, M.: Interactions between active tectonics and gravitational deformation along the Billecocha fault system (Northern Ecuador): Insights from morphological and paleoseismological investigations, J. S. Am. Earth Sci., 111, 103406, https://doi.org/10.1016/j.jsames.2021.103406, 2021. a
Kellogg, J. N., Vega, V., Stallings, T., and Aiken, C. L.: Tectonic development of Panama, Costa Rica, and the Colombian Andes: constraints from global positioning system geodetic studies and gravity, Special Papers-Geological Society of America, 75–75, https://doi.org/10.1130/spe295-p75, 1995. a
Lavenu, A., Winter, T., and Dávila, F.: A Pliocene–Quaternary compressional basin in the Interandean Depression, central Ecuador, Geophys. J. Int., 121, 279–300, https://doi.org/10.1111/j.1365-246x.1995.tb03527.x, 1995. a
Lentas, K.: Towards routine determination of focal mechanisms obtained from first motion P-wave arrivals, Geophys. J. Int., 212, 1665–1686, https://doi.org/10.1093/gji/ggx503, 2017-11. a, b
Lentas, K., Di Giacomo, D., Harris, J., and Storchak, D. A.: The ISC Bulletin as a comprehensive source of earthquake source mechanisms, Earth Syst. Sci. Data, 11, 565–578, https://doi.org/10.5194/essd-11-565-2019, 2019. a, b
Leonard, M.: Earthquake fault scaling: Self-consistent relating of rupture length, width, average displacement, and moment release, B. Seismol. Soc. Am., 100, 1971–1988, https://doi.org/10.1785/0120090189, 2010. a, b, c, d
Lienkaemper, J. J. and Ramsey, C. B.: OxCal: Versatile tool for developing paleoearthquake chronologies – A primer, Seismol. Res. Lett., 80, 431–434, https://doi.org/10.1785/gssrl.80.3.431, 2009. a
Loveless, J. P. and Meade, B. J.: Partitioning of localized and diffuse deformation in the Tibetan Plateau from joint inversions of geologic and geodetic observations, Earth Planet. Sc. Lett., 303, 11–24, https://doi.org/10.1016/j.epsl.2010.12.014, 2011. a
Marconato, L., Audin, L., Doin, M.-P., Nocquet, J.-M., Jarrin, P., Rolandone, F., Harrichhausen, N., Mothes, P., Mora-Páez, H., and Cisneros, D.: Internal deformation of the North Andean Sliver in Ecuador-southern Colombia observed by InSAR, Geophys. J. Int., 239, https://doi.org/10.1093/gji/ggae338, 2024a. a, b, c, d
Marconato, L., Doin, M.-P., Audin, L., and Pathier, E.: Ionospheric compensation in L-band InSAR time-series: Performance evaluation for slow deformation contexts in equatorial regions, Science of Remote Sensing, 9, 100113, https://doi.org/10.1016/j.srs.2023.100113, 2024b. a
Marinière, J., Nocquet, J., Beauval, C., Champenois, J., Audin, L., Alvarado, A., Baize, S., and Socquet, A.: Geodetic evidence for shallow creep along the Quito fault, Ecuador, Geophys. J. Int., 220, 2039–2055, https://doi.org/10.1093/gji/ggz564, 2020. a, b
Martin, L., Blard, P.-H., Balco, G., Lavé, J., Delunel, R., Lifton, N., and Laurent, V.: The CREp program and the ICE-D production rate calibration database: A fully parameterizable and updated online tool to compute cosmic-ray exposure ages, Quat. Geochronol., 38, 25–49, https://doi.org/10.1016/j.quageo.2016.11.006, 2017. a, b, c, d
Martin, L. C. P., Blard, P.-H., Lavé, J., Condom, T., Prémaillon, M., Jomelli, V., Brunstein, D., Lupker, M., Charreau, J., Mariotti, V., Tibari, B., Team, A., and Davy, E.: Lake Tauca highstand (Heinrich Stadial 1a) driven by a southward shift of the Bolivian High, Science Advances, 4, eaar2514, https://doi.org/10.1126/sciadv.aar2514, 2018. a
McCaffrey, R., Qamar, A. I., King, R. W., Wells, R., Khazaradze, G., Williams, C. A., Stevens, C. W., Vollick, J. J., and Zwick, P. C.: Fault locking, block rotation and crustal deformation in the Pacific Northwest, Geophys. J. Int., 169, 1315–1340, https://doi.org/10.1111/j.1365-246x.2007.03371.x, 2007. a
Miller, A. D., Foulger, G. R., and Julian, B. R.: Non-double-couple earthquakes 2. Observations, Rev. Geophys., 36, 551–568, https://doi.org/10.1029/98RG00717, 1998. a
Monsalve, M. L. and Laverde, C. A.: Contribución al registro histórico de actividad de los volcanes Chiles y Cerro Negro (frontera colombo-ecuatoriana), Boletín de Geología, 38, 61–78, https://doi.org/10.18273/revbol.v38n4-2016004, 2016. a
Monsalve-Bustamante, M., Gómez, J., and Pinilla-Pachon, A.: The volcanic front in Colombia: Segmentation and recent and historical activity, vol. 4, pp. 97–159, Servicio Geológico Colombiano, Publicaciones Geológicas Especiales 38, https://doi.org/10.32685/pub.esp.38.2019.03, 2020. a, b
Mora-Páez, H., Kellogg, J. N., Freymueller, J. T., Mencin, D., Fernandes, R. M., Diederix, H., LaFemina, P., Cardona-Piedrahita, L., Lizarazo, S., Peláez-Gaviria, J.-R., Díaz-Mila, F., Bohórquez-Orozco, O., Giraldo-Londoño, L., and Corchuelo-Cuervo, Y.: Crustal deformation in the northern Andes–A new GPS velocity field, J. S. Am. Earth Sci., 89, 76–91, https://doi.org/10.1016/j.jsames.2018.11.002, 2019. a
Moreau, C., Messager, C., Berthier, B., Hain, S., Thellier, B., Dumoulin, J. P., Caffy, I., Sieudat, M., Delqué-Količ, E., Mussard, S., and Perron, M.: ARTEMIS, The 14C AMS facility of the LMC14 National Laboratory: a status report on quality control and microsample procedures, Radiocarbon, 62, 1755–1770, 2020. a
Morishita, Y., Kobayashi, T., Fujiwara, S., and Yarai, H.: Complex crustal deformation of the 2016 Kaikoura, New Zealand, earthquake revealed by ALOS-2, B. Seismol. Soc. Am., 107, 2676–2686, https://doi.org/10.1785/0120170143, 2017. a
Mothes, P. A., Nocquet, J.-M., and Jarrín, P.: Continuous GPS network operating throughout Ecuador, Eos, Transactions American Geophysical Union, 94, 229–231, 2013. a
Nocquet, J.-M., Villegas-Lanza, J. C., Chlieh, M., Mothes, P., Rolandone, F., Jarrin, P., Cisneros, D., Alvarado, A., Audin, L., Bondoux, F., Martin, X., Font, Y., Régnier, M., Vallée, M., Tran, T., Beauval, C., Maguiña Mendoza, J. M., Martinez, W., Tavera, H., and Yepes, H.: Motion of continental slivers and creeping subduction in the northern Andes, Nat. Geosci., 7, 287–291, https://doi.org/10.1038/ngeo2099, 2014. a
Pennington, W. D.: Subduction of the Eastern Panama Basin and seismotectonics of northwestern South America, J. Geophys. Res.-Sol. Ea., 86, 10753–10770, https://doi.org/10.1029/JB086iB11p10753, 1981. a, b
Poulenard, J., Podwojewski, P., Janeau, J.-L., and Collinet, J.: Runoff and soil erosion under rainfall simulation of Andisols from the Ecuadorian Páramo: effect of tillage and burning, CATENA, 45, 185–207, https://doi.org/10.1016/S0341-8162(01)00148-5, 2001. a
Pratt, W. T., Duque, P., and Ponce, M.: An autochthonous geological model for the eastern Andes of Ecuador, Tectonophysics, 399, 251–278, https://doi.org/10.1016/j.tecto.2004.12.025, 2005. a
QGIS Association: QGIS Geographic Information System (Version 3.2.2) [software], https://www.qgis.org (last access: December 2021), 2018. a
Reimer, P. J., Austin, W. E., Bard, E., Bayliss, A., Blackwell, P. G., Ramsey, C. B., Butzin, M., Cheng, H., Edwards, R. L., Friedrich, M., and Grootes, P. M.: The IntCal20 Northern Hemisphere radiocarbon age calibration curve (0–55 cal kBP), Radiocarbon, 62, 725–757, https://doi.org/10.1017/rdc.2020.41, 2020. a, b
Reitman, N. G., Bennett, S. E. K., Gold, R. D., Briggs, R. W., and DuRoss, C. B.: High-resolution trench photomosaics from image-based modeling: Workflow and error analysis, B. Seismol. Soc. Am., 105, 2354–2366, https://doi.org/10.1785/0120150041, 2015. a
Rodbell, D. T., Smith, J. A., and Mark, B. G.: Glaciation in the Andes during the Lateglacial and Holocene, Quaternary Sci. Rev., 28, 2165–2212, https://doi.org/10.1016/j.quascirev.2009.03.012, 2009. a, b
Rovida, A. and Tibaldi, A.: Propagation of strike-slip faults across Holocene volcano-sedimentary deposits, Pasto, Colombia, J. Struct. Geol., 27, 1838–1855, https://doi.org/10.1016/j.jsg.2005.06.009, 2005. a, b, c, d, e
Ruch, J., Vezzoli, L., De Rosa, R., Di Lorenzo, R., and Acocella, V.: Magmatic control along a strike-slip volcanic arc: The central Aeolian arc (Italy), Tectonics, 35, 407–424, https://doi.org/10.1002/2015TC004060, 2016. a
Sandwell, D., Mellors, R., Tong, X., Wei, M., and Wessel, P.: Open radar interferometry software for mapping surface deformation, Eos Trans. AGU, 92, 234–234, https://doi.org/10.1029/2011EO280002, 2011. a
Schubert, C. and Clapperton, C. M.: Quaternary glaciations in the northern Andes (Venezuela, Colombia and Ecuador), Quaternary Sci. Rev., 9, 123–135, https://doi.org/10.1016/0277-3791(90)90014-2, 1990. a, b
Smith, J. A., Mark, B. G., and Rodbell, D. T.: The timing and magnitude of mountain glaciation in the tropical Andes, J. Quaternary Sci., 23, 609–634, https://doi.org/10.1002/jqs.1224, 2008. a
Taussi, M., Tardani, D., Tassi, F., Gorini, A., Aguilera, E., Capaccioni, B., and Renzulli, A.: A conceptual model for the Tufiño-Chiles-Cerro Negro (TCCN) geothermal system (Ecuador-Colombia): New insights into geothermal exploration from chemical and isotopic composition of hydrothermal fluids, J. Geochem. Explor., 249, 107214, https://doi.org/10.1016/j.gexplo.2023.107214, 2023. a
Thollard, F., Clesse, D., Doin, M.-P., Donadieu, J., Durand, P., Grandin, R., Lasserre, C., Laurent, C., Deschamps-Ostanciaux, E., Pathier, E., Pointal, E., Proy, C., and Specht, B.: FLATSIM: The ForM@Ter LArge-Scale Multi-Temporal Sentinel-1 InterferoMetry Service, 13, 3734, https://doi.org/10.3390/rs13183734, 2021. a
Tibaldi, A. and Ferrari, L.: Latest Pleistocene-Holocene tectonics of the Ecuadorian Andes, Tectonophysics, 205, 109–125, https://doi.org/10.1016/0040-1951(92)90421-2, 1992. a
Tibaldi, A. and Leon, J. R.: Morphometry of late Pleistocene-Holocene faulting and volcanotectonic relationship in the southern Andes of Colombia, Tectonics, 19, 358–377, https://doi.org/10.1029/1999tc900063, 2000. a, b, c, d, e, f
Tibaldi, A., Rovida, A., and Corazzato, C.: Late Quaternary kinematics, slip-rate and segmentation of a major Cordillera-parallel transcurrent fault: The Cayambe-Afiladores-Sibundoy system, NW South America, J. Struct. Geol., 29, 664–680, https://doi.org/10.1016/j.jsg.2006.11.008, 2007. a, b, c
Velandia, F., Acosta, J., Terraza, R., and Villegas, H.: The current tectonic motion of the Northern Andes along the Algeciras Fault System in SW Colombia, Tectonophysics, 399, 313–329, https://doi.org/10.1016/j.tecto.2004.12.028, 2005. a
Veloza, G., Styron, R., Taylor, M., and Mora, A.: Open-source archive of active faults for northwest South America, Gsa Today, 22, 4–10, https://doi.org/10.1130/gsat-g156a.1, 2012. a, b, c
Villagómez, D. and Spikings, R.: Thermochronology and tectonics of the Central and Western Cordilleras of Colombia: Early Cretaceous–Tertiary evolution of the Northern Andes, Lithos, 160–161, 228–249, https://doi.org/10.1016/j.lithos.2012.12.008, 2013. a
Vinasco, C.: The Romeral Shear Zone, Springer International Publishing, 833–876, ISBN 978-3-319-76132-9, https://doi.org/10.1007/978-3-319-76132-9_12, 2019. a
Wesnousky, S. G.: Displacement and geometrical characteristics of earthquake surface ruptures: Issues and implications for seismic-hazard analysis and the process of earthquake rupture, B. Seismol. Soc. Am., 98, 1609–1632, https://doi.org/10.1785/0120070111, 2008. a, b, c, d, e
Williams, J. N., Barrell, D. J., Stirling, M. W., Sauer, K. M., Duke, G. C., and Hao, K. X.: Surface rupture of the Hundalee fault during the 2016 M w 7.8 Kaikōura earthquake, B. Seismol. Soc. Am., 108, 1540–1555, https://doi.org/10.1785/0120170291, 2018. a
Winter, T., Avouac, J.-P., and Lavenu, A.: Late Quaternary kinematics of the Pallatanga strike-slip fault (Central Ecuador) from topographic measurements of displaced morphological features, Geophys. J. Int., 115, 905–920, https://doi.org/10.1111/j.1365-246x.1993.tb01500.x, 1993. a
Zapata, S., Cardona, A., Jaramillo, C., Valencia, V., and Vervoort, J.: U-Pb LA-ICP-MS geochronology and geochemistry of Jurassic volcanic and plutonic rocks from the Putumayo region (southern Colombia): tectonic setting and regional correlations, Boletín de Geología, 38, 21–38, 2016. a
Zielke, O. and Arrowsmith, J. R.: LaDiCaoz and LiDARimager – MATLAB GUIs for LiDAR data handling and lateral displacement measurement, Geosphere, 8, 206–221, https://doi.org/10.1130/GES00686.1, 2012. a
Zielke, O., Arrowsmith, J. R., Grant Ludwig, L., and Akciz, S. O.: High-Resolution Topography-Derived Offsets along the 1857 Fort Tejon Earthquake Rupture Trace, San Andreas Fault, B. Seismol. Soc. Am., 102, 1135–1154, https://doi.org/10.1785/0120110230, 2012. a
Zimmermann, L., Avice, G., Blard, P.-H., Marty, B., Füri, E., and Burnard, P. G.: A new all-metal induction furnace for noble gas extraction, Chem. Geol., 480, 86–92, https://doi.org/10.1016/j.chemgeo.2017.09.018, 2018. a