the Creative Commons Attribution 4.0 License.
the Creative Commons Attribution 4.0 License.
 | 22 Oct 2020
Coherent diffraction imaging for enhanced fault and fracture network characterization
Charlotte M. Krawczyk
Faults and fractures represent unique features of the solid Earth and are especially pervasive in the shallow crust. Aside from directly relating to crustal dynamics and the systematic assessment of associated risk, fault and fracture networks enable the efficient migration of fluids and therefore have a direct impact on concrete topics relevant to society, including climate-change-mitigating measures like CO2 sequestration or geothermal exploration and production. Due to their small-scale complexity, fault zones and fracture networks are typically poorly resolved, and their presence can often only be inferred indirectly in seismic and ground-penetrating radar (GPR) subsurface reconstructions. We suggest a largely data-driven framework for the direct imaging of these features by making use of the faint and still often underexplored diffracted portion of the wave field. Finding inspiration in the fields of optics and visual perception, we introduce two different conceptual pathways for coherent diffraction imaging and discuss respective advantages and disadvantages in different contexts of application. At the heart of both of these strategies lies the assessment of data coherence, for which a range of quantitative measures is introduced. To illustrate the versatility and effectiveness of the approach for high-resolution geophysical imaging, several seismic and GPR field data examples are presented, in which the diffracted wave field sheds new light on crustal features like fluvial channels, erosional surfaces, and intricate fault and fracture networks on land and in the marine environment.
- Article
(8701 KB) - Full-text XML
- BibTeX
- EndNote


Crustal faults and fracture systems are of significant importance for the structural interpretation of geophysical images. Resulting from acting forces, they not only encode past configurations of local stress fields, but also represent primary indicators of man-made natural hazards or fluid flow in the subsurface (Sibson, 1994). In addition, the delineation of faults also helps to shed light on the mechanical properties of the host material and provides valuable assistance in tracking horizons and spatially linking stratigraphic units in sedimentary regimes. Crystalline rock environments, which are of special interest for geothermal exploration and production, are known to be brittle and scarred by intricate fracture networks, whose successful identification and characterization have an immediate impact on the desired transition to sustainable energies. Despite their importance, pronounced direct geophysical images of crustal faults, in particular when temporarily inactive, remain largely elusive, owing in large part to their sub-wavelength structural complexity and the seemingly diffuse and complex wave fields that are typically associated with them.
With a long history in optical imaging, the wave process of diffraction is synonymous with the highest possible resolution achievable in a reconstruction (Born and Wolf, 1999). Large parts of the Earth’s crust are known to heavily diffract incoming seismic or electromagnetic radiation. However, exploration and earthquake seismology either rely on transmitted, reflected, and converted arrivals or surface waves and often implicitly ignore weaker, seemingly uncorrelated contributions for the direct imaging of the subsurface. Constrained by interference with other typically stronger reflected or transmitted phases, individual diffractions are often hard to identify in isolated records despite the fact that they represent coherent signals. The suitability of seismic diffractions as a direct fault indicator was already explored in the 1950s and was further investigated in the following 2 decades (Krey, 1952; Kunz, 1960; Trorey, 1970; Berryhill, 1977). While these studies were mostly concerned with the accurate numerical modelling of the diffraction response, the first imaging attempts, despite their novelty, largely suffered from inadequate data quality (Landa et al., 1987; Kanasevich and Phadke, 1988). After an extended period in which seismic migration and waveform inversion techniques evolved to their current sophistication (Etgen et al., 2009; Virieux and Operto, 2009), advancements in data acquisition led to a recent rediscovery of diffraction imaging for geophysical applications.
Coherence is a collective property of a wave field and can be viewed as a prerequisite for migration-type imaging. Recent decades have proven the usefulness of systematically assessing this property for applications like noise suppression (Mayne, 1962), wavefront attribute extraction (Gelchinsky et al., 1999a, b; Jäger et al., 2001), data interpolation and regularization (Baykulov and Gajewski, 2009; Höcht et al., 2009), wave-field separation (Bergler et al., 2002), velocity inversion (Symes and Carazzone, 1991; Billette and Lambaré, 1998; Duveneck, 2004), and passive-source localization (Schwarz et al., 2016; Diekmann et al., 2019). With the increasing availability of dense acquisition systems, different forms of coherence arguments have been invoked in seismic and ground-penetrating radar (GPR) diffraction imaging. Arguably one of the most important applications and stumbling blocks for successful high-resolution imaging is the separation of the faint diffracted wave field from stronger, often heavily interfering contributions. While some approaches introduced a diffraction bias in the migration scheme (Khaidukov et al., 2004; Moser and Howard, 2008; Klokov and Fomel, 2012), other strategies aim to extract the weak diffraction response in a separate step before imaging (e.g. Bansal and Imhof, 2005; Fomel et al., 2007).
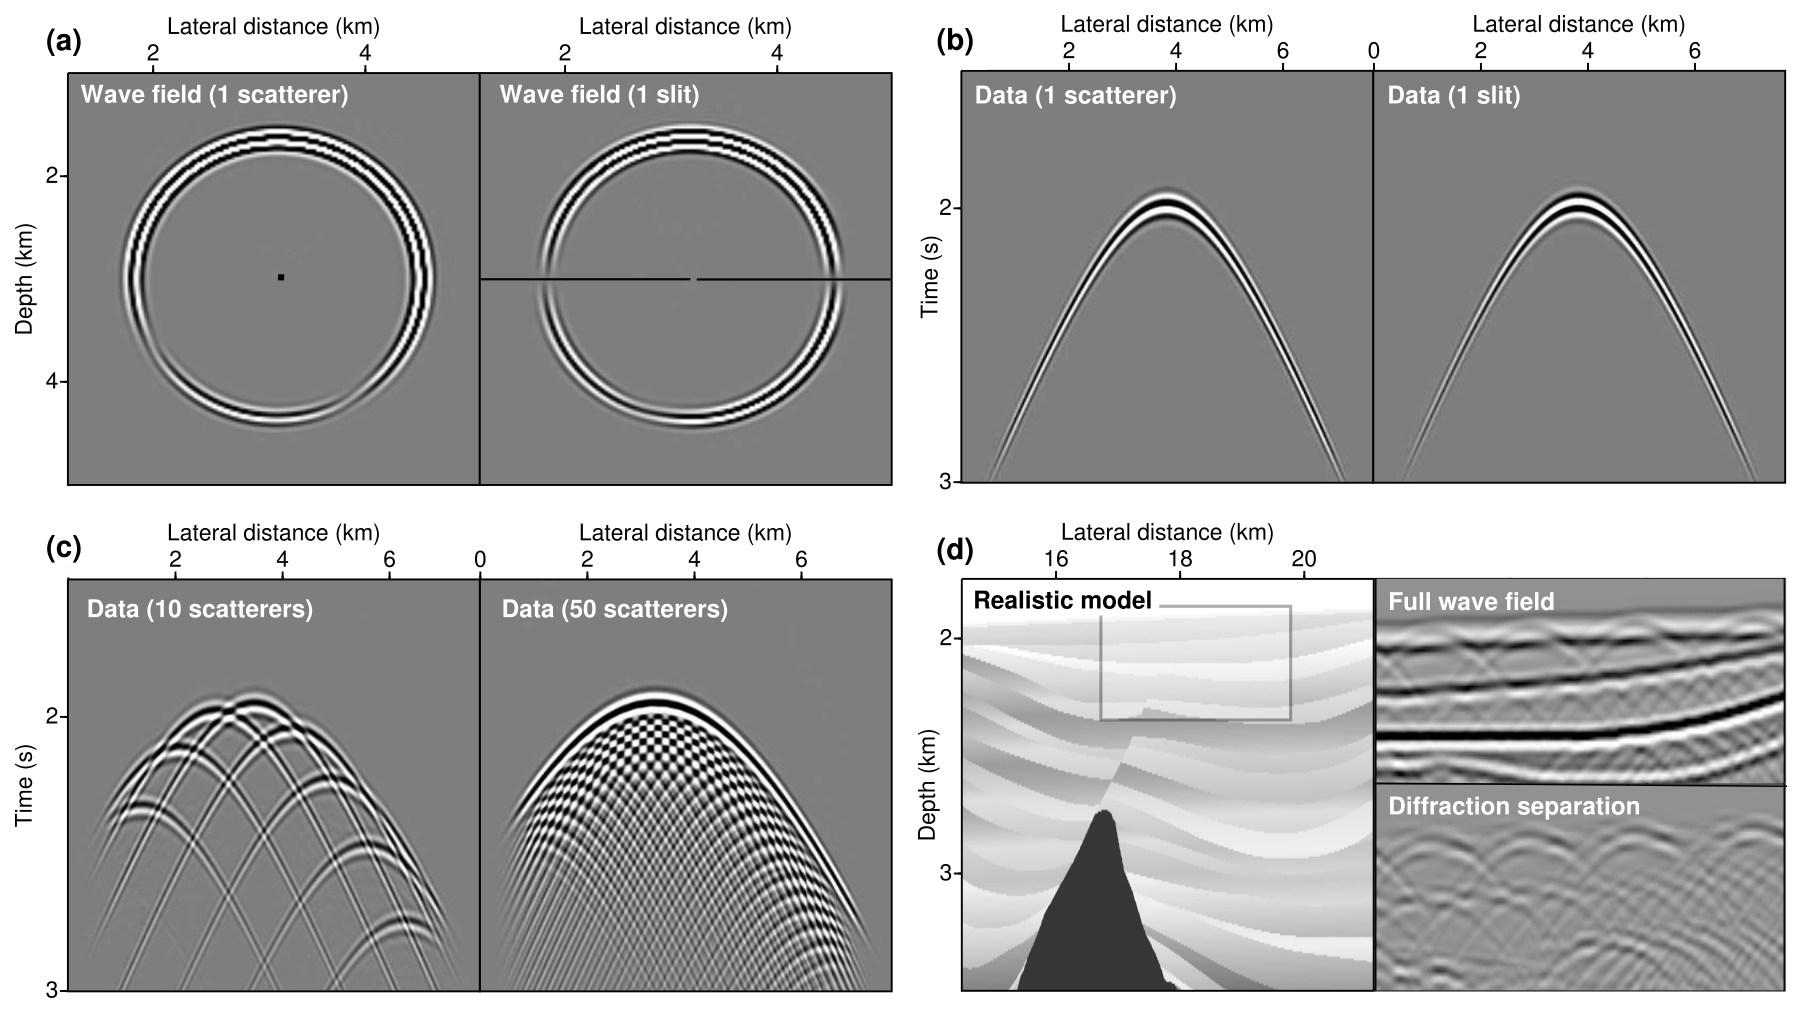
Figure 1Illustration of the most important properties of diffractions. (a) Wave diffraction occurs if medium properties change with a local curvature comparable to the dominant wavelength (the primary wave field causing the diffraction is not shown). (b) Recorded are surface projections as a function of time, which in mildly heterogeneous media are close to hyperbolic, independent of whether zero-offset, common-source, or common-receiver configurations are considered. (c–d) As a manifestation of the Huygens–Fresnel principle, the interference of infinitely many diffractions describes transmitted or reflected arrivals which honour Snell's law.
Likewise applied before migration, there are some techniques that make direct use of wave-field coherence for diffraction separation (Berkovitch et al., 2009; Dell and Gajewski, 2011; Bauer et al., 2016; Bakhtiari Rad et al., 2018). While these methods specifically target the diffracted wave field for extraction, recent developments have shown that a more surgical, amplitude-preserving separation can be achieved by assessing the coherence of reflections instead (Schwarz and Gajewski, 2017a; Schwarz, 2019b). Although other methods like plane-wave destruction can achieve a similar quality of extraction in many applications, the systematic and physically intuitive assessment of coherence can be carried out in any imaginable data configuration and allows for a seamless integration of data enhancement, wave-field separation, and imaging into a single framework. Recent studies suggest that, owing to their unique properties, diffractions also lend themselves well to velocity inversion (Sava et al., 2005; Fomel et al., 2007; Decker et al., 2017; Bauer et al., 2017). These approaches bear the potential for a self-contained imaging and inversion cycle that is also applicable in the case of offset-limited acquisitions, as they can often be found in academia (Preine et al., 2020).
With only a few exceptions (e.g. Landa et al., 1987; Heincke et al., 2006; Dell et al., 2019), the potential of quantitative coherence measures for directly forming noise-robust, contrast-rich images remains largely unexplored. Building on recent advances in adaptive processing and weak wave-field enhancement, we present a strategy for seismic and GPR diffraction imaging that makes direct use of wave-field coherence for scatterer detection. After a brief elaboration on typical characteristics and unique properties of diffraction phenomena, we introduce two different means of reconstructing a scatterer with the help of coherence measurements. Underpinning both these pathways, we introduce generalized coherence measures and systematically investigate their tolerance with respect to imperfect, i.e. noisy, sparse, or incomplete, data and make suggestions with respect to their applicability. Concluding community-spanning seismic and electromagnetic examples suggest that coherent diffraction imaging not only leads to overall highly resolved subsurface reconstructions, but also directly and reliably highlights small-scale erosional features, faults, and fractures.
Diffraction can loosely be defined as a wave's ability to enter shadow zones, which are forbidden regions in geometrical optics. More precisely, diffraction occurs when a wave field encounters a relevant property change that has a local curvature at or below the wavelength (Born and Wolf, 1999). Thus, diffraction is a scale-spanning phenomenon that is only predicted and fully captured in a wave theoretical framework. To provide some intuition, Fig. 1 illustrates some of the key properties of diffractions and how they can be of use for geophysical subsurface imaging (for more details, see Schwarz, 2019a). As arguably the first rigorous experimental evidence, Young's slit experiments concluded that when light hits a small enough opening in a screen, an intricate interference pattern appears on a second screen. The geophysical analogue of such an experiment is shown in Fig. 1a, in which a small-scale heterogeneous object or a gap at an interface acts as a secondary source. The acquisition surface at zero depth can be viewed as a screen, on which the wave fields are captured by seismometers or electromagnetic antennas. The mere occurrence of such a secondary wave field (for clarity the primary field is not displayed) is already indicative of the presence of a small-scale structural change underneath our acquisition surface, which is why it is frequently suggested that the detection and localization of such a structure potentially imply super-resolution imaging, i.e. the inference of structural features of spatial extent beyond the Rayleigh limit (Khaidukov et al., 2004).
Because their wavefronts are principally indistinguishable from an actual source located at the scatterer location, seismic diffractions share striking similarities with passive sources (Li et al., 2020). In Fig. 1b the surface projections of the diffracted wave field (shown in panel a) are displayed as a function of time. Generally, although this is not precisely true in realistic media, diffractions have an approximately hyperbolic shape. In contrast to reflections, diffractions are not constrained by Snell’s law and thus radiate uniformly in all directions. As a result, diffracted wave fields provide improved illumination and encode highly resolved structural information, but also rapidly decay with increasing distance from the scatterer. Closely related to diffraction is the concept of interference, which is likewise a pure wave phenomenon. Interference is mentioned here for two reasons. First, it explains the transitional regime and provides a notion of resolvability (Fig. 1c); second, it helps to appreciate the need and possibility for wave-field separation, in particular, when highly reflective media like sedimentary basins are considered (Fig. 1d). When a sufficiently large number of scatterers is present, individual diffractions become hardly distinguishable. Essentially all diffraction separation strategies rely on dense spatial sampling at the surface. The high-resolution and high-illumination component of diffractions, which bear unique imaging potential, can only be unlocked if spatial aliasing can be prevented (Schwarz, 2019a).
Aside from illustrating lateral resolvability, Fig. 1c also visualizes the underlying principle of Kirchhoff migration (Schneider, 1978). As will be more thoroughly explained in the following section, Kirchhoff migration is a manifestation of the Huygens–Fresnel principle, which states that any arbitrary wave field can be thought of as being composed of infinitely many elementary wave fields. The envelope of these elementary, locally excited waves then forms the transmitted or reflected arrival. Diffractions can be viewed as physically resolved manifestations that are picked out by small-scale disturbances, e.g. caused by faults. Figure 1d shows a small excerpt of a subsurface model that mimics the Sigsbee escarpment beneath the Gulf of Mexico. Aside from structural features related to the top of salt or a fault cutting through the sedimentary strata, wave diffraction is also caused by stair stepping in the discretized model used for the finite-difference simulations. Despite their unintentional introduction, the resulting pervasive diffracted wave fields nicely illustrate the transition from diffraction to reflection and why a successful separation of these contributions remains a challenge. High-resolution imaging aims to back-trace these weak diffracted contributions to their origin.
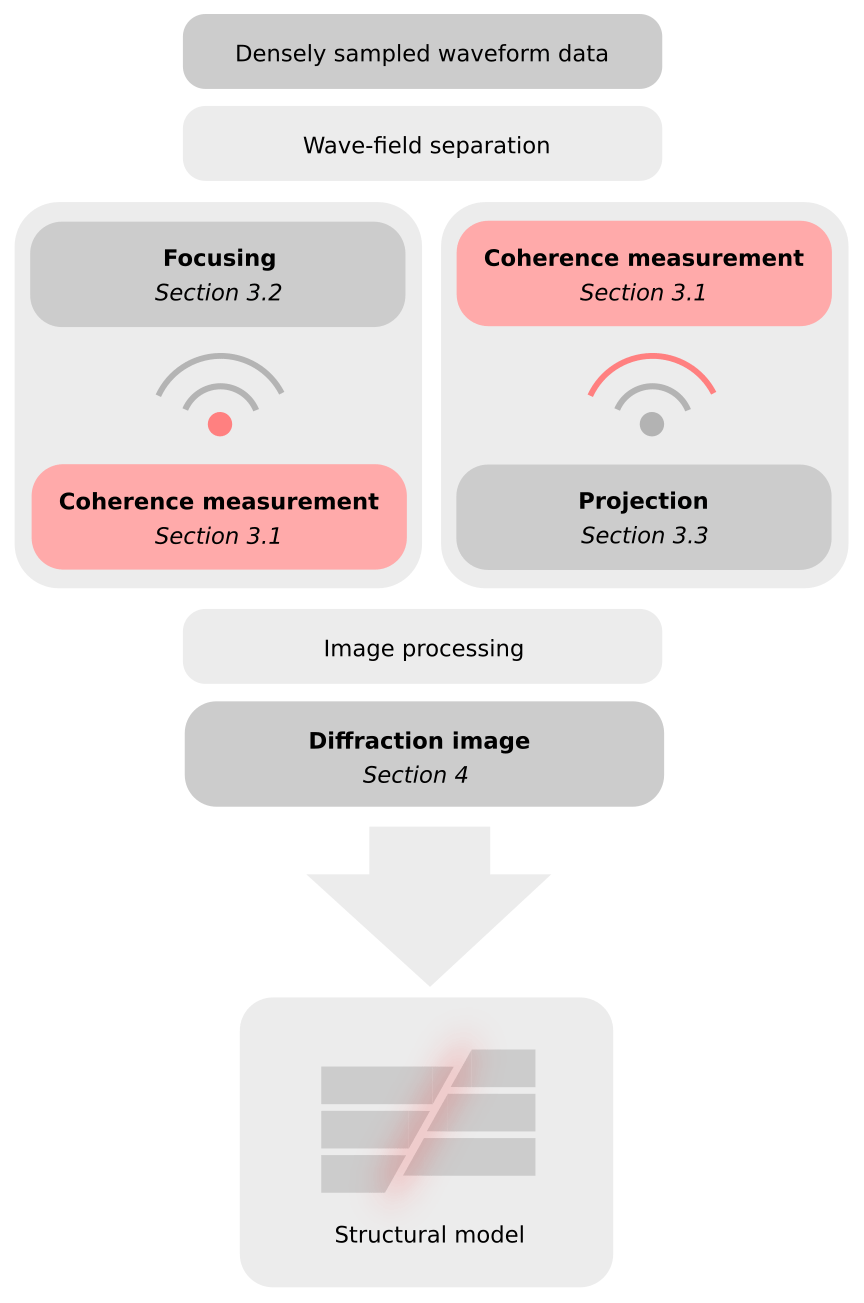
Figure 2Generalized workflow for diffraction imaging. Indicated in red are instances in which coherence measurements enter the reconstruction. While projection-type imaging schemes (Sect. 3.3) start directly in data space, focusing techniques (described in Sect. 3.2) are typically image-centred. Although diffraction separation prior to imaging forms a central ingredient, emphasis is given to the reconstruction steps.
In conventional diffraction imaging, wave-field separation is either performed before or during migration (see e.g. Fomel et al., 2007; Moser and Howard, 2008). Independent of what type of migration algorithm is used, the result commonly comprises a wave-field image that contains amplitude and phase information. While the preservation of phase information in the reconstructions is principally desirable, there are several shortcomings of conventional migration schemes, in particular when imperfect data and weak signals such as diffractions are concerned. In coherent diffraction imaging we seek to directly incorporate wave-field coherence in the imaging workflow to help overcome these limitations. It is generally interesting to note that when optical images are concerned, we only perceive intensities, and wavelength information is encoded in the colours of the visible light to which the eye is sensitive. Following this intuition, we argue that coherence measures, to some degree, mimic intensities and therefore seem principally suited for the construction of structural images. As was briefly illustrated in the previous section, diffractions are coherent and, just like reflections, can benefit from coherence arguments.
The imaging problem can generally be divided into two domains – the data and the image. Migration-type imaging, just like an optical lens, seeks to directly utilize the former to arrive at the latter. In both data and image space, coherence arguments can be invoked (Fig. 2). While the systematic assessment of coherence in data space has a long and successful history, coherence measures, with a few exceptions, have not been utilized to their full potential when the image space is concerned. With intuition from the field of optics, in order to properly differentiate between these two philosophies, we refer to starting in data space, i.e. with the observations, as projection, whereas the image-centric approach will be denoted by focusing. Both mindsets have in common that we use the data to construct an image and both are amenable to improvements when some form of coherence measure is introduced. Consequently, coherent focusing evaluates wave-field coherence during the gathering stage in image space, whereas coherent projection first evaluates data coherence and then back-projects with help of the extracted information. Wave equation migration (focusing) and time-reversal imaging (projection) can be viewed as the most capable endmembers of these two branches, which find themselves powerfully combined in reverse-time migration for reflection imaging (Baysal et al., 1983). While fully honoured wave propagation physics become important in sufficiently complex scenarios, the unique flexibility of Kirchhoff migration and its intimate relation to wave diffraction provides unique opportunities for the imaging of scatterers (Moser and Howard, 2008). Although wave propagation is abstracted by high-frequency approximations of limited validity, the use of only kinematic information lets the developed framework be readily applicable for both seismic and GPR measurement campaigns.
3.1 Measuring coherence
As illustrated in Fig. 1, coherence is an observable contained in densely acquired waveform data. It can be assessed in depth (Fig. 1a) and time (Fig. 1b), i.e. in an image and in data space. Coherence can be viewed as a set of correlations that are connected by the temporal or spatial delays arising from the shape of the propagating wavefront. If data are not acquired densely at the surface, these group correlations can no longer be reliably tracked and connected. A well-appreciated way of assessing wave-field coherence is to perform directional data summations within a predefined time window. If we denote the spatio-temporal waveform data recorded at the surface (at a lateral position denoted by the two-component vector x and time t) by 𝒟(x,t), we can write the summed amplitude at point ξ, estimated within a confined aperture spanned by all x, as
where t(ξ,x) is the travel time surface corresponding to the wavefront. If this travel time surface describes an actual event (see Fig. 1b), the summation result B(ξ) shows increased amplitudes, while for uncorrelated noise or a wrong or inaccurate choice of t(ξ,x), the amplitudes are smaller. Equation (1) can be used to systematically suppress uncorrelated noise or undesired interfering coherent energy, but it does not lend itself well to an automated analysis of wave-field coherence. In addition, the summed wave field, like the data themselves, encodes phase information, resulting in positive and negative values, which complicates interpretation. In analogy to optics, we will refer to Eq. (1) as the beam amplitude or beam, which follows the physically intuitive convention in earthquake seismology (Rost and Thomas, 2002). To arrive at a more robust quantity that can act as a cost function in an optimization scheme, the beam energy can be approximated as follows:
where τ is a small time window in which vertical summation is performed. As a rule of thumb, it should have approximately the size of the considered signal's wavelength. The beam energy E(ξ) takes only positive values but does not precisely correspond to the beam's energy; rather, it is proportional to it. In earthquake seismology, Eq. (2) is investigated routinely in slowness and back-azimuth analysis (Rost and Thomas, 2002). If we consider the total energy contained in the investigated portion of the wave field, a similar proportionality holds
Equation (3) lets us arrive at an upper bound, as coherent summation has to honour energy conservation. The wave field's semblance,
is thus a normalized quantity and was demonstrated to be an ideal candidate for the automation of coherence analysis (Taner and Koehler, 1969; Neidell and Taner, 1971). The quantity Nx indicates the total number of traces at all recording locations x that fall within the considered aperture. For a perfectly coherent signal, S approaches 1, whereas for fully uncorrelated noise it takes values close to 0. If data are very noise-contaminated or other contributions interfere strongly with the event investigated, it can be useful to abstract the waveform data before processing (Li et al., 2020). One such abstraction constitutes the polarity-honouring nth root of the signal:
One main advantage of the nth root abstraction is that in contrast to other means like kurtosis, the transformed data still retain their polarity, which allows destructive interference to occur. Insertion of Eq. (5) for 𝒟(x,t) in Eqs. (1)–(4) then leads to nth root versions of the beam amplitude Bn(ξ), the beam energy En(ξ), and semblance Sn(ξ) (see Schwarz, 2019a). For n=1 all of these expressions reduce to their conventional analogues, which is why in the following, we will refer to different versions of each quantity by their order n. A systematic investigation of the above coherence measures will be carried out in the following two subsections. Nevertheless, it can already be stated that the beam energy in Eq. (2) bears a strong resemblance to a wave field's intensity, which is likewise sensitive to the absolute amplitude of a signal. As a consequence, it ascribes higher values to stronger, more energetic contributions (stronger scatterers appear brighter). Conversely, semblance represents an energy ratio, and, owing to its normalization, coherence is detected independent of signal strength.
3.2 Imaging by focusing
As indicated earlier, imaging by focusing can conveniently be based on Kirchhoff's diffraction integral, which in practice, like Eq. (1), reduces to a discrete sum. In a more physical sense focusing can be viewed as a special form of constructive interference, in which different measurements of the same coherent wave field are superposed at the image location ξ. This image point either represents a sample in the spatio-temporal focused image corresponding to time migration or full spatial reconstruction with a depth axis (Schneider, 1978; Etgen et al., 2009). As we are primarily interested in robust structural images of small-scale crustal features, here, in line with other authors (Khaidukov et al., 2004; Moser and Howard, 2008), we neglect individual amplitude weighting which is normally applied in true-amplitude migration. As a consequence, the discrete version of the Kirchhoff integral is equivalent to the beam amplitude in Eq. (1). Although all the presented findings likewise translate into depth, for the sake of simplicity and in order to stay consistent with the field data examples for which detailed velocity information was scarce, in the following we will only consider spatio-temporal focusing.
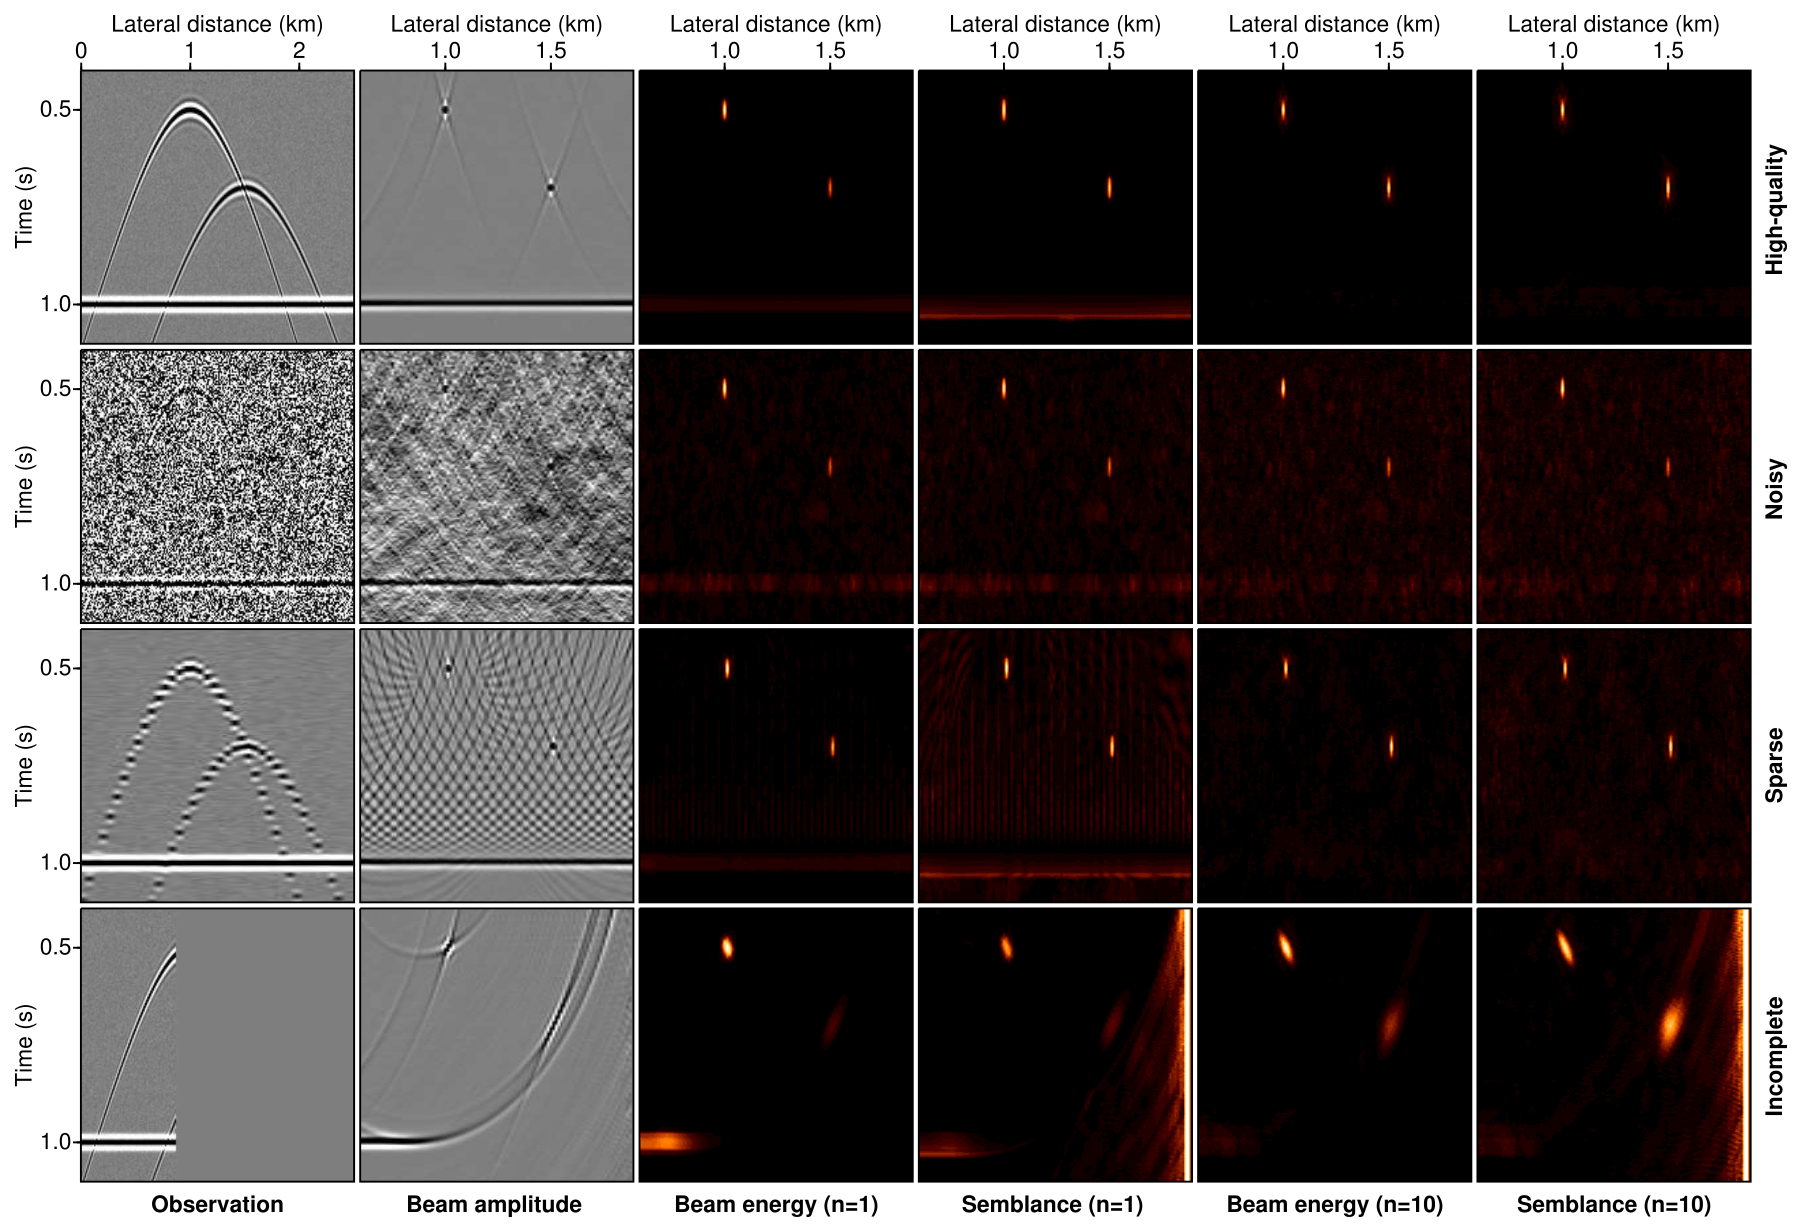
Figure 3Diffraction imaging results gained through focusing with the conventional Kirchhoff-type beam amplitude and four quantitative coherence measures. Displayed are the results for ideal, noisy (signal-to-noise ratio 1), sparse (every fifth trace), and incomplete (left third of the line) data in which a strong residual reflection event is present. The desirable outcome is an image in which the positions of the two diffractors are well-determined and the reflected energy is maximally suppressed.
In order to arrive at a full equivalence of the unweighted Kirchhoff integral with the beam amplitude, for every image point , the travel time response of a diffraction needs to be inserted into Eq. (1). While for depth migration the accurate travel times of a diffracted wavefront are computed by means of ray tracing or eikonal solvers, time imaging typically relies on analytical, closed-form approximations whose validity is restricted to mild levels of lateral heterogeneity. A popular assumption is that travel time move-out is approximately hyperbolic, which corresponds to circular wavefronts in an effective replacement medium (e.g. Schwarz and Gajewski, 2017b). This effective medium is described by the root mean square velocity vrms, which is generally a function of the image point. In compact notation, the multichannel diffraction travel time tdiff can be written as a sum of a source and a receiver leg connected by the shared image point:
where . Figure 3 illustrates with a synthetic example how the previously discussed coherence measures compare for high-quality, i.e. densely and regularly sampled, data with a low noise level, severe noise contamination, data sparsity resulting in spatial aliasing, and incomplete (single-sided) observations. Without loss of generality, alongside the unweighted Kirchhoff reconstruction, i.e. the beam amplitude in Eq. (1) with t=tdiff, only the 1st and the 10th order of the beam energy in Eq. (2) and the semblance coefficient in Eq. (4) are displayed. For the high-quality data (top row in Fig. 3) all considered coherence measures arrive at an accurate reconstruction of the two scatterers, while in the case of data insufficiencies the conventional Kirchhoff-type reconstruction with the beam amplitude particularly suffers from strong imaging artefacts. In Kirchhoff migration, diffractions are naturally favoured in that, in contrast to reflections, the summation trajectory is not only tangential, but also fully coincides with the event. Because the two diffractors are located in different depths and at different lateral positions, they are not equally well-imaged in all scenarios. Especially when only the left-sided incomplete observation is concerned, the right diffractor remains poorly resolved with the beam amplitude, the conventional beam energy, and the conventional semblance norm.
As a typical challenge in diffraction imaging is the presence of residual reflected energy after separation, we included the response of a planar reflector in the deeper part of the model. While this strong but undesired contribution is only mildly suppressed in the conventional Kirchhoff reconstruction, the coherence images are mostly reflection-free with only weak residual energy remaining for the conventional beam energy and the semblance norm. Both the 10th root version of the beam energy and the 10th root semblance lead to diffraction focusing results of consistently high quality in all evaluated scenarios. Following from this systematic analysis and because its normalized character favours weak and incompletely sampled wave fields, we conclude that the nth root semblance can be expected to be the most robust candidate for diffraction imaging with imperfect data. The strong suppression of reflected energy furthermore suggests that even without competitive diffraction separation first, diffraction-enhanced images might be gained in moderately reflective media. Taking the nth root of the amplitude as suggested in Eq. (5) has the effect of making coherent arrivals of different strength more comparable. While the suggested value of 10 results from experience with a variety of data configurations, it can be shown that this equalization in amplitude typically saturates for a reasonably low n. In principle, the problem of finding a suitable root order could be phrased as an optimization problem driven by the amplitude content of the data. However, a fixed value of 10 was shown to be successful in bridging several orders of magnitude and is therefore deemed a reasonable choice in most practical scenarios.
Very similar to the anisotropic radiation characteristics of passive seismic sources, for diffraction off edges and structural steps, as is also likely to occur at fault zones, the polarity of diffractions can change at the stationary point, which would lead to a bimodal reconstruction. To account for this radiation pattern, the conventional coherent focusing result can be augmented with its phase-reversed version (Fig. 4). Every data point is once treated as a potential stationary point at which an artificial phase reversal is performed before evaluating the coherence measure by means of Eq. (2) or (4). Both results, the one gained without reversing the phase and the one for which the phase is reversed, are compared and the higher value contributes to the augmented image. The augmented counterparts of the beam energy and the semblance norm are insensitive to the occurrence of a phase reversal, resulting in a more stable and only slightly less resolved reconstruction. Additionally, it can act as a data-driven migration weight to suppress artefacts in Kirchhoff-type diffraction focusing (see the rightmost column in Fig. 4).
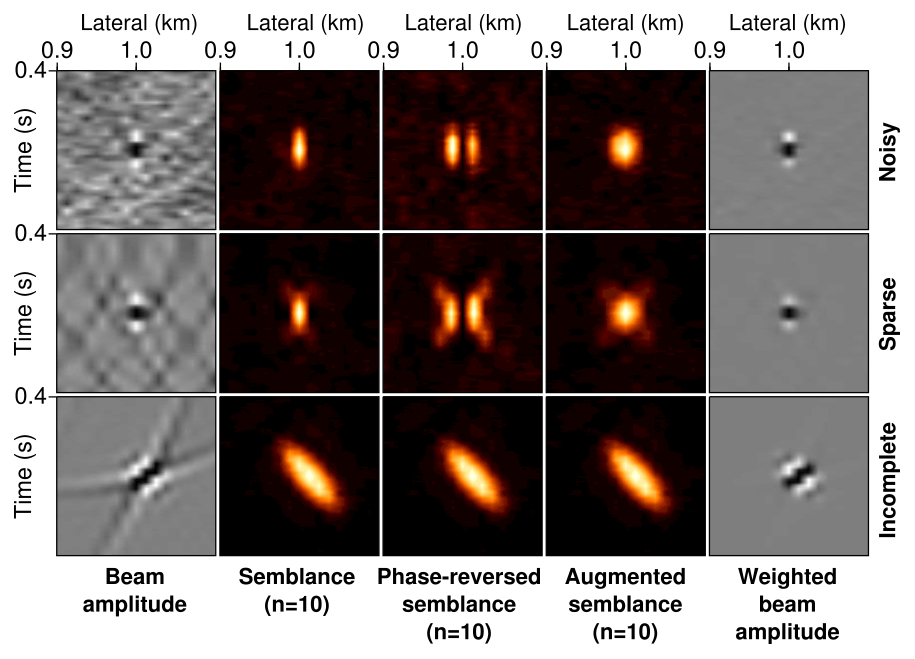
Figure 4Close-up of reconstruction results for the left scatterer of the synthetic test introduced in Fig. 3. The augmentation of a phase-consistent and a phase-reversed version of each considered coherence measure leads to a reconstruction that is slightly less resolved laterally but proves to be insensitive to a sign change in amplitude for diffraction off asymmetric objects like edges. In addition, the normalized semblance norm can be used as a fully data-derived amplitude weight to suppress artefacts or noise in migrated images.
3.3 Imaging by projection
An alternative to diffraction focusing constitutes imaging by projection. The main mindset underlying this second strand of diffraction imaging is to start investigations in data space and to use the extracted information to arrive at an image. In coherent diffraction imaging, coherence analysis is carried out in the data domain to locally enhance and physically characterize waveform similarities that can be exploited for imaging. The previously discussed coherence measures can be readily employed. However, instead of using the reconstruction-centred image point parameterization, the emerging diffracted wavefront is locally characterized along the entire event, resulting in a transformation of the data volume into coherence and wavefront attribute maps. A data-centred 2D analogue to the double-square-root Eq. (6) can be expressed in terms of the local tilt angle α0 and curvature radius R0 of the wavefront as observed at location x0 on the acquisition surface:
with and (Höcht et al., 1999; Schwarz and Gajewski, 2017b). It is important to note that in contrast to the process of image formation by focusing, here the discussed coherence arguments are evaluated within a local data aperture and assigned to the central data point within this aperture. So, in contrast to Eq. (6), (x0,t0), just like the summation process itself, now also resides in data space. The actual reconstruction then consists of a subsequent mapping of every locally coherent data point to a point in image space. In analogy to focusing-based time migration, analytical mapping equations can be gained by evaluating the stationary point (xapex,tapex) corresponding to the apex position of each individual local diffraction travel time curve. For Eq. (7), the projection corresponds to a mapping from each data point (x0,t0) to (xapex,tapex) via
where v0 denotes the locally constant near-surface velocity. Generally, by convention, we refer to near-surface quantities, i.e. quantities that relate directly to the registration, with the subscript 0. Equation (8) in conjunction with Eq. (7) and one of the positive-valued coherence measures can be used to set up an optimization problem to arrive at an approximate but fully data-driven reconstruction of the subsurface scatterer distribution (Fomel, 2007; Schwarz et al., 2014; Bonomi et al., 2014). In addition to considering a near-surface projection, wavefront slopes and curvatures can also be estimated using the assumption of an effective replacement medium, which, like in Eq. (6), is defined by the root mean square velocity. A so-called osculating equation connecting the near-surface projections and effective medium properties was first established by de Bazelaire (1988) and generalized by Schwarz and Gajewski (2017b). For the sake of simplicity, only the 2D versions of the data-centred diffraction move-out in Eq. (7) and the projection in Eq. (8) are given here. However, in a similar way, one can arrive at corresponding 3D analogues of Eq. (8) by evaluating the stationary point of the 3D travel time move-out expression.
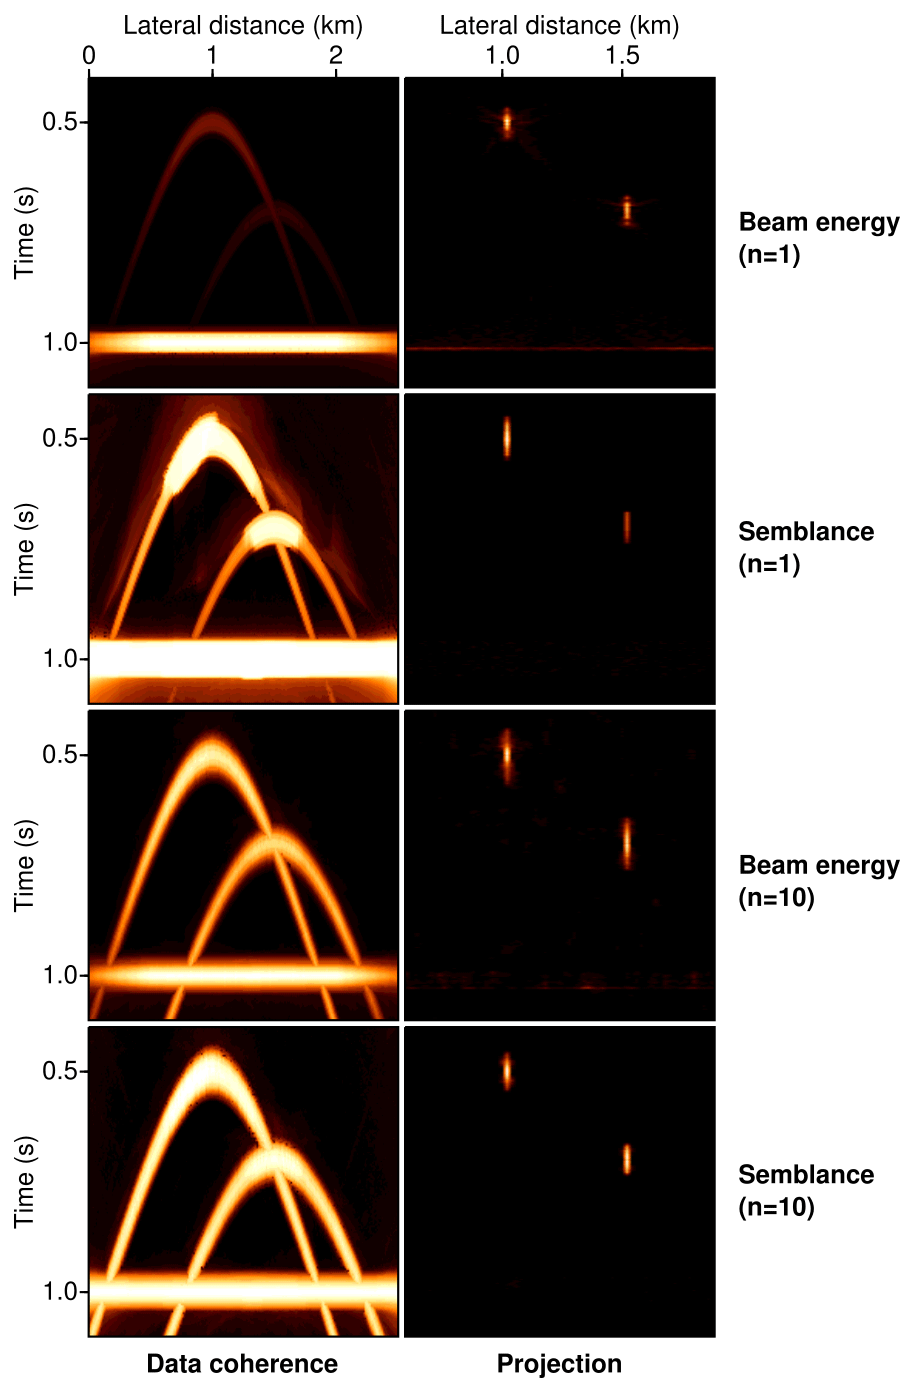
Figure 5Results of data-driven coherence analysis (left) and subsequent projection (right) carried out for the same synthetic test case as in Fig. 3. All measures detect coherence equally well but reveal different characteristics when the overall strength and interference effects are considered. The reconstructions correspond to a count of mapped coherent amplitudes per image point.
In Fig. 5 the maximized coherence for every data point and the corresponding projection results for the same synthetic test as in Figs. 3 and 4 are presented. While all four considered coherence measures perform equally well when the mere detection of coherent energy is concerned, noticeable differences can be observed with regards to overall strength and the handling of interference. Both versions of the beam energy turn out to be unaffected by the presence of the strong conflicting reflected event, whereas semblance, due to its intrinsic normalization, reveals itself to be suited to estimate the coherence of weak and energetic arrivals equally well. In contrast to the results gained with the conventional definition of the semblance (n=1), the 10th root version does not suffer from interference effects and, similar to the preceding focusing analysis, performs consistently well for all data points. Although all four displayed coherence measures can be used as a cost function in data-driven coherence analysis, the use of normalized quantities allows for efficient and intuitive thresholding in subsequent processing steps, which, again, lets the 10th root semblance appear as the most favourable candidate. Similar to coherent focusing, reflections are naturally suppressed by being projected in a diffuse manner.
As will be commented on in more detail in the “Discussion and outlook” section, the data-centric nature of projection favours automation and macro-model-independent imaging. However, a major difference between data and image space is the occurrence of intricate interference phenomena, in which multiple wave fields conflict with each other. This can be viewed as an efficient means of compression, but the decoding (i.e. the separation) of interfering wave-field components remains a challenging and computationally demanding task (see the degradation of the conventional semblance norm in Fig. 5). In contrast to that, the image-centric character of coherent focusing naturally avoids these complications. For this reason, without loss of generality, the challenging data examples considered in the following section will all be based on coherent focusing.
The occurrence of diffraction phenomena is linked to the predominant wavelength. Consequently, just like faults and fractures themselves, diffractions can be observed on essentially all scales probed in geophysical investigations of the upper crust. As with conventional Kirchhoff migration, there are natural limitations of the suggested strategies for coherent diffraction imaging. However, with a range of ambitious field data examples we seek to demonstrate that rich diffracted wave fields exist in essentially all datasets and become assessable with the presented robust coherence arguments. Following the quantitative analysis of the different coherence measures discussed in the previous section, the images presented in the following were without exception generated with the 10th root semblance norm. It may, however, be noted that the other coherence measures might have led to reconstructions of comparable quality. With the exception of the 3D seismic land data example, all diffraction images were formed by augmenting sub-images with and without radiation pattern correction. Despite the depiction of the generalized workflow for coherent diffraction imaging in Fig. 2, the presented images did not experience any image processing but relied on a preceding separation step to suppress reflected energy from the considered pre- and post-stack data (Schwarz, 2019b). While ground-truth reconstructions were not available, a systematic comparison with Kirchhoff-migrated images is provided for some of the examples.
4.1 Multichannel seismic imaging offshore Israel
The first data example consists of a marine multichannel seismic field dataset acquired by TGS in the context of hydrocarbon exploration in the Levantine Basin, eastern Mediterranean (e.g. Reiche et al., 2014). In contrast to the other data examples, this dataset includes source–receiver offsets of up to more than 7 km, which makes it well-suited for conventional migration and inversion. The captured geology off the coast of Israel is primarily dominated by the presence of salt and connected processes in the upper crust (Krijgsman et al., 1999; Gradmann et al., 2005; Netzeband et al., 2006). Most notably, a large, laterally elongated salt body is overlain by vast sedimentary complexes accompanied by chaotic sequences in the shallow layers, possibly related to turbulence. Figure 6 compares a portion of pre-stack Kirchhoff migration to the corresponding coherent diffraction image for the geological units directly above the salt body. In both reconstructions three seismically distinct units can be identified. The uppermost unit consists of largely horizontal strata related to recent, mostly unperturbed sedimentation. Despite its overall smooth appearance, this sediment package contains faint signatures of channel-like structures that might have been caused by ocean currents eroding the sea floor. In the diffraction image this very reflective uppermost unit is almost entirely transparent, while the weak signatures of erosion are distinctly visible features.
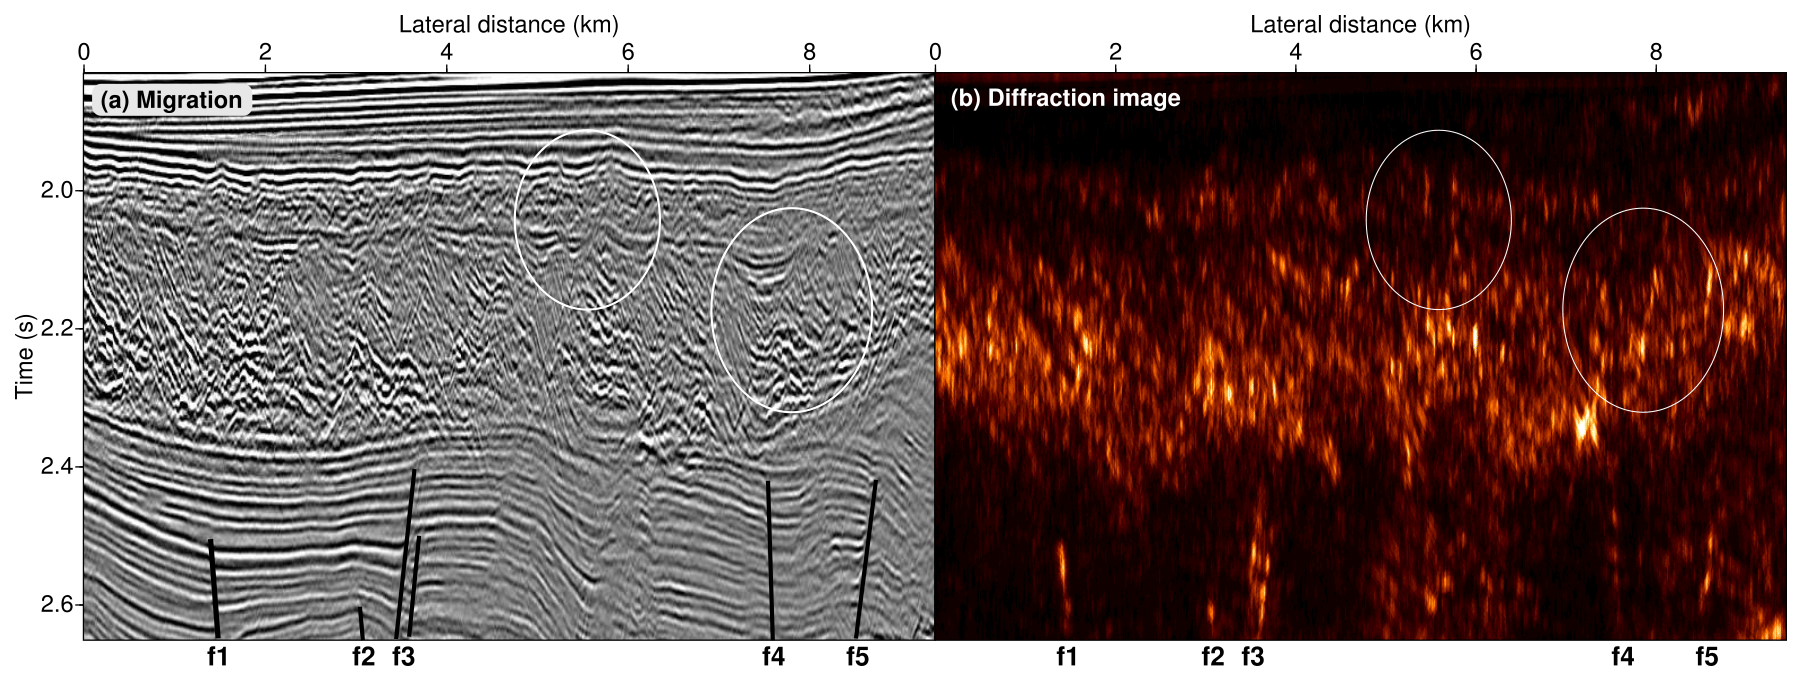
Figure 6Comparison of close-ups of Kirchhoff migration (a) and the corresponding coherent diffraction image (b) for the industrial multichannel data acquired in the Levantine Basin offshore Israel in the eastern Mediterranean. Both images are of complementary nature in that the migration highlights predominantly horizontal features related to sedimentation, whereas the diffraction-based reconstruction emphasizes small-scale structural complexity related to dynamic processes like turbulent erosion or faulting connected to salt tectonics. For orientation five prominent faults below the turbulent layer are denoted by f1–f5. The white ellipses indicate exemplary regions where the diffraction image sheds light on structures that appear mostly hidden in the conventional migration.
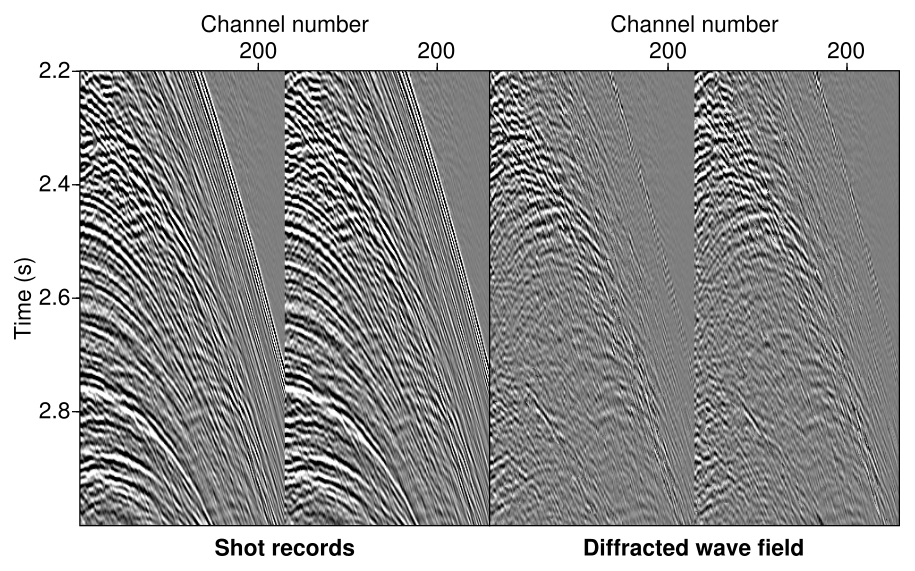
Figure 7Two exemplary common-source gathers highlighting the effectiveness of the preceding wave-field separation step and the presence of a rich diffracted wave field which became assessable in the pre-stack domain. Amplitude strong diffraction at about 2.4 s can be connected to the lowermost part of the central chaotic unit, which reveals pronounced internal small-scale complexity.
The opposite holds for the central unit, which appears to be a less reflective body with a chaotic internal structure. Again, like for the uppermost layers, the diffraction image indicates pronounced internal complexity, while mild reflective signatures vanish entirely from the reconstruction. Whereas in the migrated image the vertical extent and lateral complexity remain largely obscured, the diffraction image favours a clear delineation of this complex unit and its internal structure. Figure 7 shows close-ups of two exemplary common-source gathers, in which a multitude of diffractions related to the lower part of this chaotic unit can be observed in the separation. The lowermost unit reveals primarily horizontally stratified sedimentation which is disrupted by several faults that were caused by salt-related tectonics. Again, the diffraction image is of complementary value in that it highlights geological features related to dynamic processes, while the reflection-dominated conventional migration emphasizes sedimentary features indicative of more stationary episodes in Earth's history. For more details on the interpretation of the data and the captured geology, we refer to Gradmann et al. (2005) and Reiche et al. (2014).
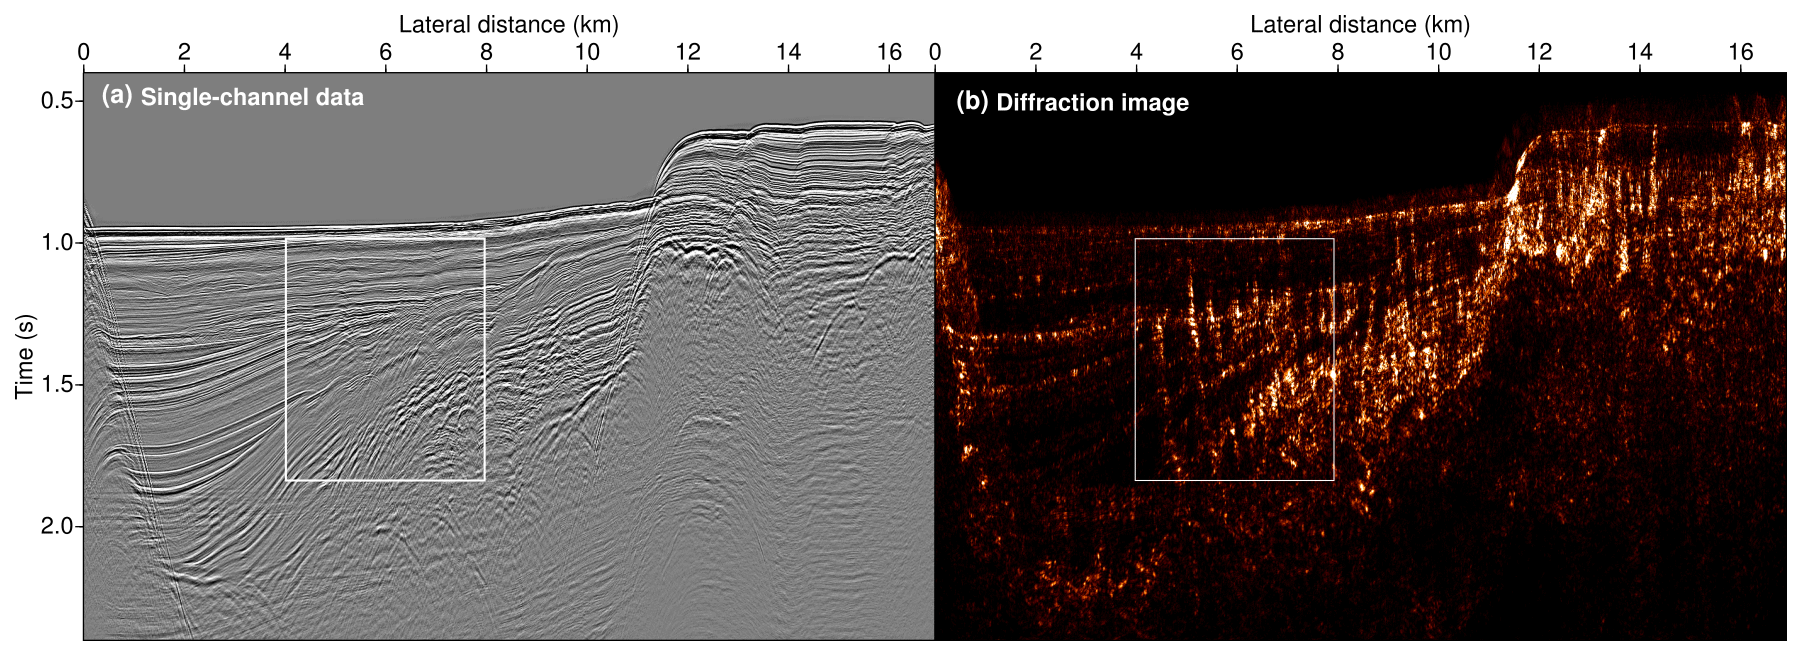
Figure 8Excerpt of the unprocessed input data from a marine seismic single-channel acquisition carried out near Santorini in the Aegean Sea (a) and the result of coherent diffraction imaging (b). Intricate fault and fracture networks are revealed, as their presence causes complicated wave diffraction. Compare to Fig. 9, in which the close-up indicated by the white frame is investigated in more detail. Aside from faulting, erosional unconformities and the interface between sediments and the crystalline basement are well-recovered.
4.2 Single-channel seismic imaging in the Aegean Sea
As a second example we consider a single-channel marine seismic dataset that was acquired near the island of Santorini in the Aegean Sea (Hübscher et al., 2015; Nomikou et al., 2016b). The wider geological setting includes the Anydros Basin – a region known to be shaped by extensive volcanism, resulting in pronounced structural complexity. Owing to past and ongoing tectonic processes, the upper crust is disrupted by major fault and fracture networks. It is dominated by the Kolumbo submarine volcano, whose activity might have triggered devastating tsunamis in the past (Nomikou et al., 2016a). Despite the fact that only a single channel was available, the data can be considered of reasonably high quality. Owing to a short shot interval, the near-offset dataset provides dense spatial sampling, which is deemed ideal for high-resolution diffraction imaging. Figure 8 shows the single-channel data before processing together with the reconstruction based on coherent diffraction imaging. A larger sedimentary basin near the flank of the Kolumbo submarine volcano is captured.
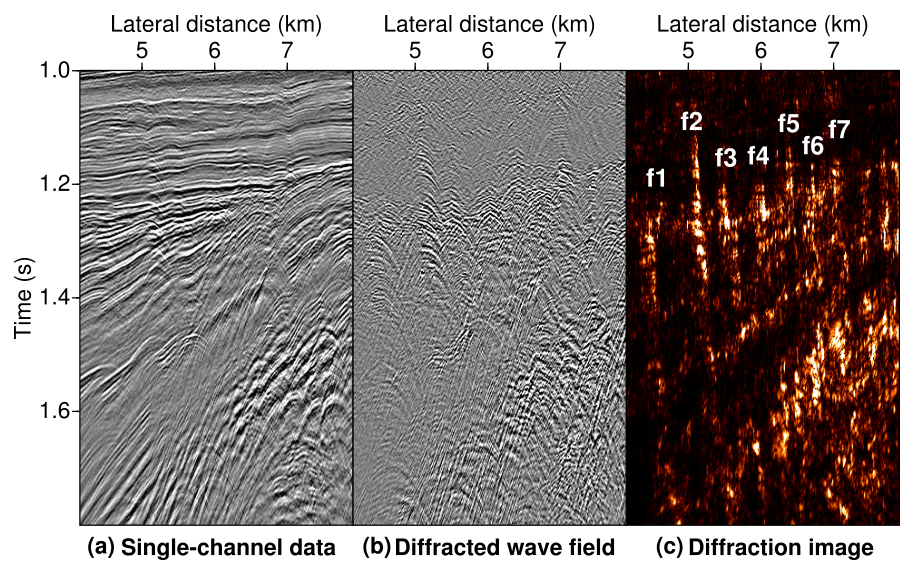
Figure 9Comparison of the unprocessed single-channel data (a), the result of diffraction separation (b), and the diffraction-based reconstruction (c) for the close-up indicated by the white frame in Fig. 8. Coherent focusing of the separated wave field enables a clear delineation of at least seven individual sub-vertical faults (labelled f1–f7) with a lateral separation as small as 200 m.
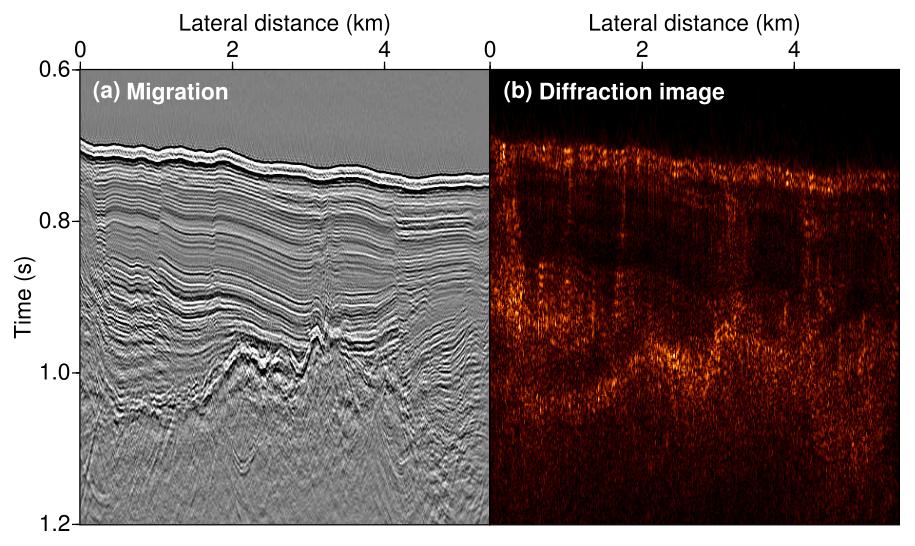
Figure 10Comparison of the Kirchhoff-migrated image (a) with the result of coherent diffraction imaging (b) for a small excerpt of an adjacent portion of the line. Like in Fig. 9, a lateral structural resolution of up to approximately 200 m was achieved, which lets a set of quasi-parallel faults become distinguishable in the lower rightmost part of the diffraction image.
In its unprocessed form the dataset is dominated by reflected energy, and only occasionally is small-scale structural complexity indicated by faint interference patterns. In strong analogy to the marine seismic multichannel dataset discussed before, the diffraction image appears contrast-rich and highly resolved, predominantly in regions where dynamic processes were at work, whereas sedimentary reflections are fully transparent in the reconstruction. Similar to the previous example the dominant features are connected to a major fault system in the right part of the sedimentary basin. This intricate network is thought to represent a major flower structure, which is connected to the rifting regime it is embedded in (Hübscher et al., 2015). Likewise well-resolved are erosional unconformities and the sediment–crystalline basement interface, which are of a rugged character with small-scale lateral complexity. To closer inspect the success of the coherent diffraction imaging workflow, Fig. 9 compares a close-up (indicated by the frame in Fig. 8) of the reflection-dominated input data, the result of diffraction separation, and the diffraction-based reconstruction. Quasi-parallel faults are individually recovered with a lateral separation as small as 200 m, which is broadly in the range of the predominant seismic wavelength. To further illustrate the lateral resolution achievable with diffraction imaging, Fig. 10 compares an excerpt of a Kirchhoff-migrated image with the corresponding diffraction-based reconstruction. In the latter, aside from the contrast-rich detection of an internal unconformity and the top of the crystalline basement, small-scale subparallel faults are recovered at lateral distances above 4 km. Again, the achieved lateral resolution approaches the order of the seismic wavelength, thereby highlighting the high-resolution potential of diffraction imaging. For a more detailed geological interpretation and an example of diffraction-based velocity model building in depth, we refer the reader to Preine et al. (2020).
4.3 3D seismic imaging in southern Texas
Complementing the two marine seismic examples, here we will briefly demonstrate the successful application of 3D diffraction imaging on land. In 2014 Bob Hardage and Scott Tinker of the University of Texas at Austin decided to make the Stratton 3D dataset, consisting of a migrated reference volume, unprocessed pre-stack gathers, vertical seismic profiling data, well log information, and other related resources freely available to the research community. The multichannel seismic data were recorded in four overlapping swaths, which each consisted of six receiver lines separated by approximately 400 m. The acquisition was intended to capture a portion of the Stratton gas field located in southern Texas, with the aim of better understanding the internal architecture of complicated oil and gas reservoirs. As the gas field is of fluvial origin, dominant structural features include overlapping fluvial channels (Hardage et al., 1994). To illustrate the potential added value of coherent diffraction imaging for 3D seismic interpretation, Fig. 11 shows an exemplary migration slice at the reservoir level and compares it with an augmented image consisting of the same migration slice overlain by a semi-transparent version of the coherent diffraction image. As expected from a thin-bed fluvial reservoir system, the diffraction-based reconstruction indicates a high degree of structural complexity. A comparison of the migration to the augmented diffraction image reveals several spatially coherent diffractive corridors that follow established channel trends and might also be indicative of minor faulting, which is of potential significance for the monitoring of fluid flow.
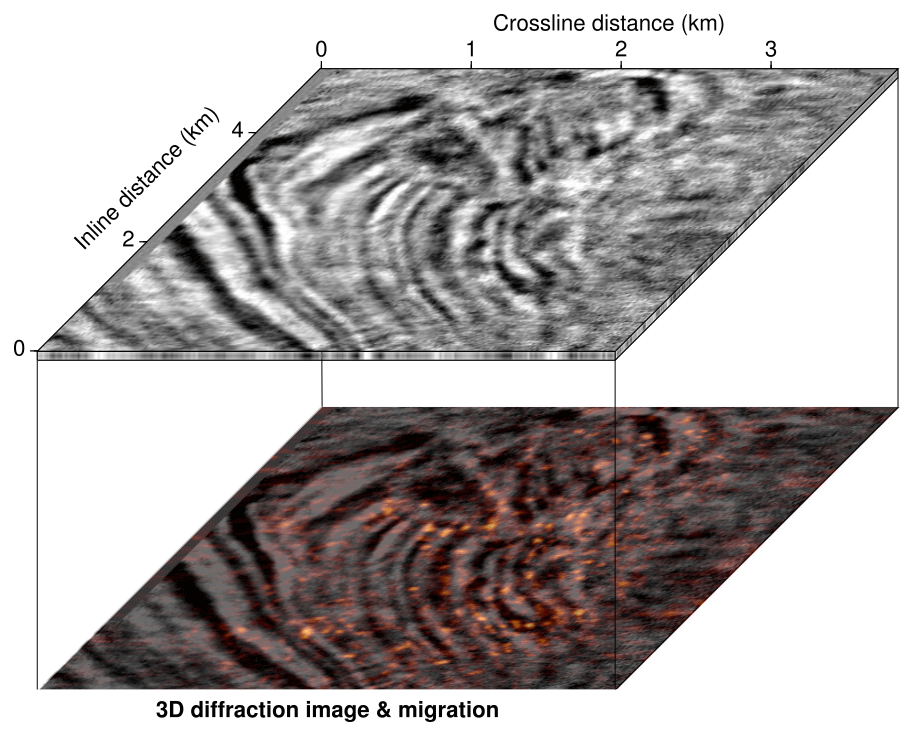
Figure 11A slice of the 3D migration cube that captures a portion of the Stratton gas field in southern Texas (top) and the corresponding augmented image combining the migration with a semi-transparent version of the coherent diffraction image (bottom). Highly resolved features of several fluvial channel systems known to exist at the reservoir level are described well by the diffraction image (see Hardage et al., 1994).
4.4 GPR imaging on Long Beach Island
The fourth and final example consists of a ground-penetrating radar (GPR) line that was acquired by the US Geological Survey in the frame of a multidisciplinary effort to study the impact of seasonal tropical storms on coastal change as part of the Barrier Island and Estuarine Wetland Physical Change Assessment (Zaremba et al., 2016). The campaign was a response to Hurricane Sandy, which approached the US East Coast in October 2012. A connected storm surge and wave activity caused major alterations of the shoreline, resulting in a modified coastal topography, geology, and hydrology with an immediate impact on regional ecosystems. The GPR measurement campaign was carried out roughly 3 years after Hurricane Sandy hit the shore and, in conjunction with remote sensing and sedimentological observations, had the main goal of systematically assessing physical changes to the coast induced by seasonal storms in order to update systemic models to improve predictability (Plant et al., 2018). In Fig. 12 the exemplary line of the GPR data volume is displayed with the result of diffraction separation and the outcome of coherent diffraction focusing. Along the line, pervasive diffraction can be observed, which indicates a strong degree of structural complexity near the surface. At the centre of the line a V-shaped structure is revealed to be responsible for pronounced electromagnetic scattering, suggesting the presence of a strong material contrast. Similar to the single-channel seismic example, owing to the fact that emitting and receiving antennae typically coincide, reflections in GPR data are predominantly sensitive to vertical structural changes, whereas lateral information stemming from channels and other dynamically important erosional structures is largely encoded in the diffracted wave field.
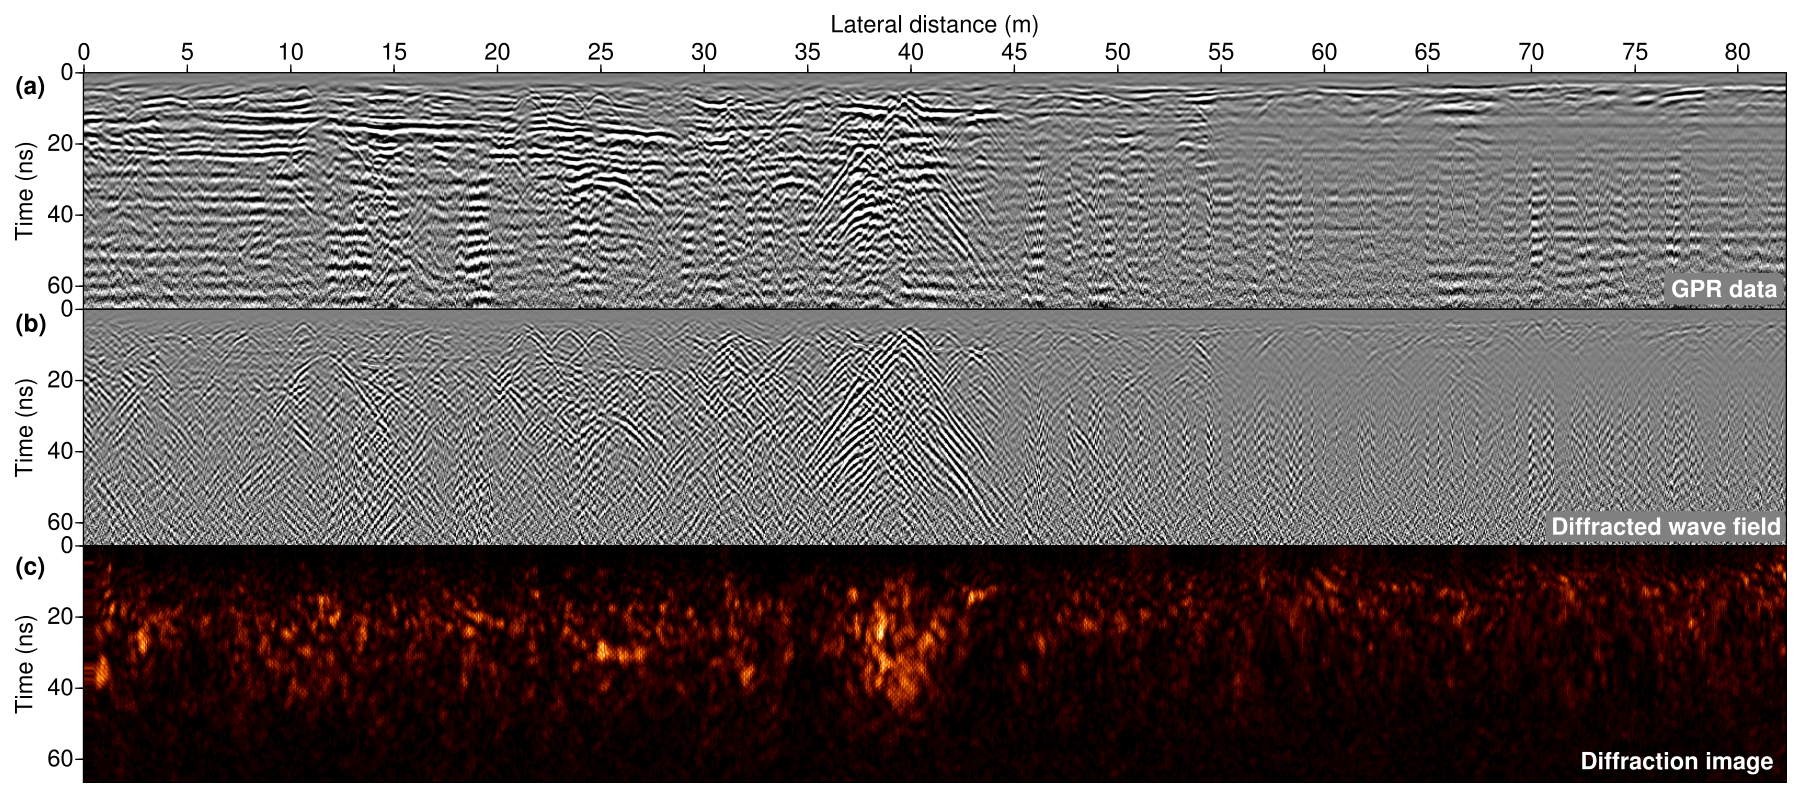
Figure 12Ground-penetrating radar (GPR) line capturing the uppermost subsurface near the shore of Long Beach Island, New Jersey, which was acquired in a multidisciplinary effort to study the impact of seasonal tropical storms on coastal dynamics and the connected structural changes in the environment. Displayed are the input data (a), the result of diffraction separation (b), and the coherent diffraction image (c), in which a strongly diffractive V-shaped structure can be delineated.
Aside from arriving at high-resolution structural subsurface reconstructions, diffractions also provide unique illumination in various important data subdomains, like the zero-offset (single-channel), common-source, or common-receiver configuration. Illustrated by the marine single-channel example (Figs. 8–10), the 3D reconstruction based on reduced land data (Fig. 11), and the zero-offset GPR application (Fig. 12), diffractors can indeed be viewed as structure-related passive sources, which suggests the systematic use of cost-effective, reduced acquisitions in seismic investigations (Schwarz, 2019a). In addition to the potential of lowered acquisition costs, the strong similarity of diffracted and passive events also suggests continuing technological transfer between controlled-source and passive-source seismology (Li et al., 2020). The introduction of interference-sensitive data abstractions like the considered sign-sensitive nth root was shown to have a stabilizing effect on diffraction imaging and is also expected to benefit automated coherence analysis as a whole.
5.1 Potential and extension of the method
Although not considered here, it should be stated that, similar to the employment of ray tracing or eikonal solvers to arrive at more accurate focusing trajectories in laterally complex media, the projection “recipe” can likewise be extended to account for more complicated and demanding scenarios. In fact, wavefront tomography builds on the same attribute fields and coherence maps as were fed to the analytic mapping in Eq. (8), but it makes use of dynamic ray tracing to perform the subsequent projection into image space. Also, the method was shown to reliably utilize diffracted energy to arrive at a resolved estimate of scatterer locations in depth (Duveneck, 2004; Bauer et al., 2017). While the projection step, like in focusing, could be performed for a predefined velocity distribution, projection was shown to lend itself well to a largely automated reconstruction of not only the scatterer locations, but also the macro-velocity structure in an iterative process. As was demonstrated e.g. by Bauer et al. (2019), data-centric mapping lets one tag and track the contribution of each data point into the image, which provides a powerful interface to the machine-learning techniques commonly used for image segmentation tasks (Shustak and Landa, 2018). In conjunction with time-reversal imaging (e.g. Mosk et al., 2012), which can likewise be considered a projection technique, coherence arguments and wavefront tomography were recently demonstrated to form a powerful framework for the joint inversion of passive-source and medium properties (Diekmann et al., 2019). With sufficiently dense spatial sampling, coherent diffraction imaging, in particular when phrased as a projection problem, is expected to be applicable to passive seismic data, as the problem strongly resembles diffraction imaging in the common-source domain (Schwarz, 2019a). Differential semblance optimization and, more broadly, migration velocity analysis can be viewed as the focusing-based counterpart of wavefront tomographic inversion and might likewise be investigated in the future.
5.2 Limitations and challenges
It needs to be emphasized that, in particular when only reduced datasets like single-channel volumes are acquired, diffractions bear a distinct advantage over reflections in that their illumination is encoded in various subdomains of the multichannel response (Schwarz, 2019a; Preine et al., 2020). However, it must also be noted that the process of diffraction is inherently three-dimensional, which can cause out-of-plane energy to contaminate the data with the potential to result in the occurrence of artefacts in the reconstruction. Provided accurate velocity information is available, out-of-plane contributions in two-dimensional (2D) surveys are naturally suppressed if the scattering structure is located reasonably far off the acquisition plane. However, less distant out-of-plane scattering can hardly be distinguished from valuable in-plane contributions, which is why 2D diffraction-based reconstructions must generally be assessed with care. This is particularly true for single-channel data, for which a reliable velocity model might not be available. In order to gain trust in diffraction-derived velocity information and coherent diffraction images, the mere quality of focusing might be complemented by a joint assessment of the reflected wave field. Powerful and reliable reflection-based velocity inversion schemes exist and can be used if sufficient offset information is available. Thus, because reflected energy is less likely to stem from out-of-plane structures, the integrated interpretation of reflection and diffraction images can help to improve velocity models and identify off-plane scattering in 2D surveys (Preine et al., 2020). All these complications become superfluous for sufficiently dense three-dimensional acquisition strategies, which are therefore deemed ideally suited for reliable subsurface imaging with the diffracted wave field. Although coherence arguments were demonstrated to help with handling data imperfections, the highest-quality reconstructions are expected for sufficiently dense spatial data sampling. With the rise of large-N arrays and, in particular, the emerging new data resource of distributed fibre-optic strain sensing (e.g. Jousset et al., 2018), wave fields are starting to be acquired quasi-continuously, which is expected to extend the reach of coherence analysis and diffraction imaging.
5.3 Geological interpretation
In line with previous works on diffraction imaging (Lowney et al., 2020; Preine et al., 2020), the systematic synthetic investigations and, in particular, the range of considered challenging field data examples suggest that diffraction imaging bears the potential to shed unique light on intricate fault and fracture networks and other dynamically relevant features. As indicated in the generalized workflow shown in Fig. 2, coherent diffraction imaging lets us arrive at resolved images of lateral discontinuities, which, in some sense, encode the dynamic history and past and present stress states of the crust. In conjunction with conventional reflection-dominated images resulting from migration, diffraction images were shown to be of immediate and complementary use in interpretation (Burnett et al., 2015; Preine et al., 2020).
Deciphering the signatures of faults and fracture systems is of immediate importance for the construction of geodynamic models or the simulation and assessment of fluid flow. The suggested incorporation of coherence arguments in constructing images is expected to aid in this interpretation task and interface well with automation strategies that build on machine-learning techniques that have their origin in computer vision (e.g. Wu et al., 2019). Generally it can be argued that the positive-valued character of coherent reconstructions favours the subsequent application of useful tools from image processing. The non-normalized beam energy (n=1) directly relates to the diffraction's focusing intensity, which is proportional to the square of the beam's amplitude and therefore to the strength of the impedance contrast at which diffraction occurred. In contrast, higher-order versions of the beam energy (n>1) no longer deal with accurate, but rather distorted amplitude and phase information and accordingly cannot be used for quantitative interpretation. The same holds for the semblance norm in general, as its intrinsic normalization evens out amplitude discrepancies due to material contrasts of different strength. While all of the coherence measures suffer from the loss of phase information in the final reconstruction, the semblance coefficient, due to its normalization, can be used as a reliable weight for artefact and noise suppression in conventional wave-field focusing. The resulting images have higher quality yet largely preserve the amplitude and phase information critical for quantitative geological interpretation.
While the presented workflow discusses the best use of the physical information content of recorded data through diffraction-targeted processing, structural interpretation makes additional use of the growing number of seismic attributes (Chopra and Marfurt, 2005; Barnes, 2016) – an integral approach of seismic interpretation aiming at mapping geological features. Like coherence (gained via cross-correlation of neighbouring traces in the reflection-dominated migrated image), these attributes are often used on their own to improve the interpretation of fault structures. Alternatively, attributes can be assessed in combination or help to establish cross-plotting maps (e.g. Endres et al., 2008; Lohr et al., 2008; Torrado et al., 2014; Wang et al., 2015). In this framework, coherent diffraction images can be viewed as physics-guided feature maps that naturally complement more conventional attributes commonly used for interpretation. To additionally foster the bridging from faults to fractures, data acquisition can likewise play an important role (see concept and example in Krawczyk et al., 2015). In near-surface applications in the field, using shear waves instead of compressional waves for seismic surveying has proven to be a powerful strategy for increasing structural resolution (e.g. Krawczyk et al., 2012; Beilecke et al., 2016). A combination of the proposed high-resolution imaging workflow with these new forms of data acquisition is expected to shed additional light on subsurface pathways, fault extent, and fault connections in the subsurface, which are increasingly important for the assessment of structural integrity and fault behaviour or, ultimately, deformation monitoring in an area.
We have presented a simple yet powerful framework to arrive at highly resolved structural images of the upper crust by making use of the diffracted component of the wave field. By means of controlled synthetic test cases, we introduced and systematically investigated four positive-valued coherence measures which find strong correspondence in visual perception. Based on the prerequisite of reasonably dense spatial sampling, we suggested a generalized workflow for diffraction imaging, in which image formation is either achieved by focusing or by projection of coherent contributions. While synthetic tests suggest the overall robustness of coherence-based diffraction imaging, the investigation of seismic and ground-penetrating radar data acquired on land and in the marine environment emphasizes the applicability and complementary nature of diffraction imaging for a broad range of geophysical applications. Owing to its high-resolution potential, the presented workflow helped to delineate small-scale structural features such as fluvial channels, erosional unconformities, and intricate fault and fracture systems, which remain challenging to image by conventional means.
The two suggested strategies for coherent diffraction imaging were implemented in the emergent high-level language Julia. The codes as well as the intermediate and final results are available upon reasonable request.
BS performed the computations and is responsible for the theoretical aspects of the paper. CMK helped strengthen the overall scope and added to interpretational aspects as well as the discussion of the presented results. Both authors contributed equally to proofreading and the final preparation of the paper.
The authors declare that they have no competing interests.
This article is part of the special issue “Faults, fractures, and fluid flow in the shallow crust”. It is not associated with a conference.
Important strands of the presented research were supported by Geo.X, the Research Network for Geosciences in Berlin and Potsdam. The academic single-channel and the industrial multichannel datasets were acquired and kindly shared by Christian Hübscher and TGS. We are grateful to the US Geological Survey and the Bureau of Economic Geology at the University of Texas in Austin, who collected the Stratton 3D seismic field data and the investigated GPR line from New Jersey and made these valuable resources available to the public. Wave-field simulations for the synthetic examples as well as preprocessing and visualizations were carried out with Seismic Unix, whose contributors we wish to acknowledge. We also warmly thank Alexander Bauer and Jonas Preine for continued stimulating discussions. The thoughtful comments of two anonymous reviewers helped to improve the paper.
The article processing charges for this open-access publication were covered by a Research Centre of the Helmholtz Association.
This paper was edited by Roger Soliva and reviewed by two anonymous referees.
Bakhtiari Rad, P., Schwarz, B., Gajewski, D., and Vanelle, C.: Common-reflection-surface-based prestack diffraction separation and imaging, Geophysics, 83, S47–S55, https://doi.org/10.1190/geo2016-0445.1, 2018. a
Bansal, R. and Imhof, M. G.: Diffraction enhancement in prestack seismic data, Geophysics, 70, V73–V79, https://doi.org/10.1190/1.1926577, 2005. a
Barnes, A. E.: Handbook of poststack seismic attributes, Society of Exploration Geophysicists, Tulsa, Oklahoma, 2016. a
Bauer, A., Schwarz, B., and Gajewski, D.: Enhancement of prestack diffraction data and attributes using a traveltime decomposition approach, Stud. Geophys. Geod., 60, 471–486, https://doi.org/10.1007/s11200-015-1278-y, 2016. a
Bauer, A., Schwarz, B., and Gajewski, D.: Utilizing diffractions in wavefront tomography, Geophysics, 82, R65–R73, https://doi.org/10.1190/geo2016-0396.1, 2017. a, b
Bauer, A., Schwarz, B., Werner, T., and Gajewski, D.: Unsupervised event identification and tagging for diffraction focusing, Geophys. J. Int., 217, 2165–2176, https://doi.org/10.1093/gji/ggz106, 2019. a
Baykulov, M. and Gajewski, D.: Prestack seismic data enhancement with partial common-reflection-surface (CRS) stack, Geophysics, 74, V49–V58, https://doi.org/10.1190/1.3106182, 2009. a
Baysal, E., Kosloff, D. D., and Sherwood, J. W.: Reverse time migration, Geophysics, 48, 1514–1524, https://doi.org/10.1190/1.1441434, 1983. a
Beilecke, T., Krawczyk, C. M., Ziesch, J., and Tanner, D. C.: Near-surface fault detection using high-resolution shear wave reflection seismics at the CO2CRC Otway Project site, Australia, J. Geophys. Res.-Sol. Ea., 121, 6510–6532, https://doi.org/10.1002/2015JB012668, 2016. a
Bergler, S., Duveneck, E., Höcht, G., Zhang, Y., and Hubral, P.: Common-reflection-surface stack for converted waves, Stud. Geophys. Geod., 46, 165–175, https://doi.org/10.1023/A:1019845818278, 2002. a
Berkovitch, A., Belfer, I., Hassin, Y., and Landa, E.: Diffraction imaging by multifocusing, Geophysics, 74, WCA75–WCA81, https://doi.org/10.1190/1.3198210, 2009. a
Berryhill, J. R.: Diffraction response for nonzero separation of source and receiver, Geophysics, 42, 1158–1176, https://doi.org/10.1190/1.1440781, 1977. a
Billette, F. and Lambaré, G.: Velocity macro-model estimation from seismic reflection data by stereotomography, Geophys. J. Int., 135, 671–690, https://doi.org/10.1046/j.1365-246X.1998.00632.x, 1998. a
Bonomi, E., Tomas, C., Marchetti, P., and Caddeo, G.: Velocity-independent and data-driven prestack time imaging: It is possible, The Leading Edge, 33, 1008–1014, https://doi.org/10.1190/tle33091008.1, 2014. a
Born, M. and Wolf, E.: Principles of optics: electromagnetic theory of propagation, interference and diffraction of light, Cambridge University Press, Cambridge, UK, 1999. a, b
Burnett, W. A., Klokov, A., Fomel, S., Bansal, R., Liu, E., and Jenkinson, T.: Seismic diffraction interpretation at Piceance Creek, Interpretation, 3, SF1–SF14, https://doi.org/10.1190/INT-2014-0091.1, 2015. a
Chopra, S. and Marfurt, K. J.: Seismic attributes — A historical perspective, Geophysics, 70, 3SO–28SO, https://doi.org/10.1190/1.2098670, 2005. a
de Bazelaire, E.: Normal moveout revisited: Inhomogeneous media and curved interfaces, Geophysics, 53, 143–157, https://doi.org/10.1190/1.1442449, 1988. a
Decker, L., Merzlikin, D., and Fomel, S.: Diffraction imaging and time-migration velocity analysis using oriented velocity continuation, Geophysics, 82, U25–U35, https://doi.org/10.1190/geo2016-0141.1, 2017. a
Dell, S. and Gajewski, D.: Common-reflection-surface-based workflow for diffraction imaging, Geophysics, 76, S187–S195, https://doi.org/10.1190/geo2010-0229.1, 2011. a
Dell, S., Hoelker, A., and Gajewski, D.: Using seismic diffractions for assessment of tectonic overprint and fault interpretation, Geophysics, 84, IM1–IM9, https://doi.org/10.1190/geo2018-0113.1, 2019. a
Diekmann, L., Schwarz, B., Bauer, A., and Gajewski, D.: Source localization and joint velocity model building using wavefront attributes, Geophys. J. Int., 219, 995–1007, https://doi.org/10.1093/gji/ggz342, 2019. a, b
Duveneck, E.: Velocity model estimation with data-derived wavefront attributes, Geophysics, 69, 265–274, https://doi.org/10.1190/1.1649394, 2004. a, b
Endres, H., Lohr, T., Trappe, H., Samiee, R., Thierer, P. O., Krawczyk, C. M., Tanner, D. C., Oncken, O., and Kukla, P. A.: Quantitative fracture prediction from seismic data, Petrol. Geosci., 14, 369–377, https://doi.org/10.1144/1354-079308-751, 2008. a
Etgen, J., Gray, S. H., and Zhang, Y.: An overview of depth imaging in exploration geophysics, Geophysics, 74, WCA5–WCA17, https://doi.org/10.1190/1.3223188, 2009. a, b
Fomel, S.: Velocity-independent time-domain seismic imaging using local event slopes, Geophysics, 72, S139–S147, https://doi.org/10.1190/1.2714047, 2007. a
Fomel, S., Landa, E., and Taner, M. T.: Poststack velocity analysis by separation and imaging of seismic diffractions, Geophysics, 72, U89–U94, https://doi.org/10.1190/1.2781533, 2007. a, b, c
Gelchinsky, B., Berkovitch, A., and Keydar, S.: Multifocusing homeomorphic imaging: Part 1. Basic concepts and formulas, J. Appl. Geophys., 42, 229–242, https://doi.org/10.1016/S0926-9851(99)00038-5, 1999a. a
Gelchinsky, B., Berkovitch, A., and Keydar, S.: Multifocusing homeomorphic imaging: Part 2. Multifold data set and multifocusing, J. Appl. Geophys., 42, 243–260, https://doi.org/10.1016/S0926-9851(99)00039-7, 1999b. a
Gradmann, S., Hübscher, C., Ben-Avraham, Z., Gajewski, D., and Netzeband, G.: Salt tectonics off northern Israel, Mar. Petrol. Geol., 22, 597–611, https://doi.org/10.1016/j.marpetgeo.2005.02.001, 2005. a, b
Hardage, B. A., Levey, R. A., Pendleton, V., Simmons, J., and Edson, R.: A 3-D seismic case history evaluating fluvial deposited thin-bed reservoirs in a gas-producing property, Geophysics, 59, 1650–1665, https://doi.org/10.1190/1.1443554, 1994. a, b
Heincke, B., Green, A. G., van der Kruk, J., and Willenberg, H.: Semblance-based topographic migration (SBTM): a method for identifying fracture zones in 3D georadar data, Near Surf. Geophys., 4, 79–88, https://doi.org/10.3997/1873-0604.2005034, 2006. a
Höcht, G., de Bazelaire, E., Majer, P., and Hubral, P.: Seismics and optics: hyperbolae and curvatures, J. Appl. Geophys., 42, 261–281, https://doi.org/10.1016/S0926-9851(99)00040-3, 1999. a
Höcht, G., Ricarte, P., Bergler, S., and Landa, E.: Operator-oriented CRS interpolation, Geophys. Prospect., 57, 957–979, https://doi.org/10.1111/j.1365-2478.2009.00789.x, 2009. a
Hübscher, C., Ruhnau, M., and Nomikou, P.: Volcano-tectonic evolution of the polygenetic Kolumbo submarine volcano/Santorini (Aegean Sea), J. Volcanol. Geoth. Res., 291, 101–111, https://doi.org/10.1016/j.jvolgeores.2014.12.020, 2015. a, b
Jäger, R., Mann, J., Höcht, G., and Hubral, P.: Common-reflection-surface stack: Image and attributes, Geophysics, 66, 97–109, https://doi.org/10.1190/1.1444927, 2001. a
Jousset, P., Reinsch, T., Ryberg, T., Blanck, H., Clarke, A., Aghayev, R., Hersir, G. P., Henninges, J., Weber, M., and Krawczyk, C. M.: Dynamic strain determination using fibre-optic cables allows imaging of seismological and structural features, Nat. Commun., 9, 1–11, https://doi.org/10.1038/s41467-018-04860-y, 2018. a
Kanasevich, E. R. and Phadke, S. M.: Imaging discontinuities on seismic sections, Geophysics, 53, 334–345, https://doi.org/10.1190/1.1892075, 1988. a
Khaidukov, V., Landa, E., and Moser, T. J.: Diffraction imaging by focusing-defocusing: An outlook on seismic superresolution, Geophysics, 69, 1478–1490, https://doi.org/10.1190/1.1836821, 2004. a, b, c
Klokov, A. and Fomel, S.: Separation and imaging of seismic diffractions using migrated dip-angle gathers, Geophysics, 77, S131–S143, https://doi.org/10.1190/geo2012-0017.1, 2012. a
Krawczyk, C. M., Polom, U., Trabs, S., and Dahm, T.: Sinkholes in the city of Hamburg—New urban shear-wave reflection seismic system enables high-resolution imaging of subrosion structures, J. Appl. Geophys., 78, 133–143, https://doi.org/10.1016/j.jappgeo.2011.02.003, 2012. a
Krawczyk, C. M., Tanner, D. C., Henk, A., Trappe, H., Ziesch, J., Beilecke, T., Aruffo, C. M., Weber, B., Lippmann, A., Görke, U., Bilke, L., and Kolditz, O.: Seismic and sub-seismic deformation prediction in the context of geological carbon trapping and storage, in: Geological Storage of CO2 – Long Term Security Aspects, pp. 97–113, Springer, Cham, Switzerland, 2015. a
Krey, T.: The significance of diffraction in the investigation of faults, Geophysics, 17, 843–858, https://doi.org/10.1190/1.1437815, 1952. a
Krijgsman, W., Hilgen, F., Raffi, I., Sierro, F. J., and Wilson, D.: Chronology, causes and progression of the Messinian salinity crisis, Nature, 400, 652–655, https://doi.org/10.1038/23231, 1999. a
Kunz, B. F.: Diffraction problems in fault interpretation, Geophys. Prospect., 8, 381–388, https://doi.org/10.1111/j.1365-2478.1960.tb01722.x, 1960. a
Landa, E., Shtivelman, V., and Gelchinsky, B.: A method for detection of diffracted waves on common-offset sections, Geophys. Prospect., 35, 359–373, https://doi.org/10.1111/j.1365-2478.1987.tb00823.x, 1987. a, b
Li, L., Tan, J., Schwarz, B., Staněk, F., Poiata, N., Shi, P., Diekmann, L., Eisner, L., and Gajewski, D.: Recent advances and challenges of waveform-based seismic location methods at multiple scales, Rev. Geophys., 58, e2019RG000667, https://doi.org/10.1029/2019RG000667, 2020. a, b, c
Lohr, T., Krawczyk, C. M., Oncken, O., and Tanner, D. C.: Evolution of a fault surface from 3D attribute analysis and displacement measurements, J. Struct. Geol., 30, 690–700, https://doi.org/10.1016/j.jsg.2008.02.009, 2008. a
Lowney, B., Lokmer, I., O’Brien, G. S., Amy, L., Bean, C. J., and Igoe, M.: Enhancing interpretability with diffraction imaging using plane-wave destruction aided by frequency-wavenumber f-k filtering, Interpretation, 8, 1–52, https://doi.org/10.1190/INT-2019-0199.1, 2020. a
Mayne, W. H.: Common reflection point horizontal data stacking techniques, Geophysics, 27, 927–938, https://doi.org/10.1190/1.1439118, 1962. a
Moser, T. and Howard, C.: Diffraction imaging in depth, Geophys. Prospect., 56, 627–641, https://doi.org/10.1111/j.1365-2478.2007.00718.x, 2008. a, b, c, d
Mosk, A. P., Lagendijk, A., Lerosey, G., and Fink, M.: Controlling waves in space and time for imaging and focusing in complex media, Nat. Photonics, 6, 283–292, https://doi.org/10.1038/nphoton.2012.88, 2012. a
Neidell, N. S. and Taner, M. T.: Semblance and other coherency measures for multichannel data, Geophysics, 36, 482–497, https://doi.org/10.1190/1.1440186, 1971. a
Netzeband, G., Hübscher, C., and Gajewski, D.: The structural evolution of the Messinian evaporites in the Levantine Basin, Mar. Geol., 230, 249–273, https://doi.org/10.1016/j.margeo.2006.05.004, 2006. a
Nomikou, P., Druitt, T., Hübscher, C., Mather, T., Paulatto, M., Kalnins, L., Kelfoun, K., Papanikolaou, D., Bejelou, K., Lampridou, D., Pyle, D. M., Carey, S., Watts, A. B., Weiß, B., and Parks, M. M.: Post-eruptive flooding of Santorini caldera and implications for tsunami generation, Nat. Commun., 7, 1–10, https://doi.org/10.1038/ncomms13332, 2016a. a
Nomikou, P., Hübscher, C., Ruhnau, M., and Bejelou, K.: Tectono-stratigraphic evolution through successive extensional events of the Anydros Basin, hosting Kolumbo volcanic field at the Aegean Sea, Greece, Tectonophysics, 671, 202–217, https://doi.org/10.1016/j.tecto.2016.01.021, 2016b. a
Plant, N. G., Smith, K. E. L., Passeri, D. L., Smith, C. G., and Bernier, J. C.: Barrier-island and estuarine-wetland physical-change assessment after Hurricane Sandy, U.S. Geological Survey Open-File Report 2017, 1157, https://doi.org/10.3133/ofr20171157, 2018. a
Preine, J., Schwarz, B., Bauer, A. and Hübscher, C., When there is no offset‐a demonstration of seismic diffraction imaging and depth‐velocity model building in the southern Aegean Sea, J. Geophys. Res.-Sol. Ea., 125, e2020JB019961, https://doi.org/10.1029/2020JB019961, 2020. a, b, c, d, e, f
Reiche, S., Hübscher, C., and Beitz, M.: Fault-controlled evaporite deformation in the Levant Basin, Eastern Mediterranean, Mar. Geol., 354, 53–68, https://doi.org/10.1016/j.margeo.2014.05.002, 2014. a, b
Rost, S. and Thomas, C.: Array seismology: Methods and applications, Rev. Geophys., 40, 2–1, https://doi.org/10.1029/2000RG000100, 2002. a, b
Sava, P. C., Biondi, B., and Etgen, J.: Wave-equation migration velocity analysis by focusing diffractions and reflections, Geophysics, 70, U19–U27, https://doi.org/10.1190/1.1925749, 2005. a
Schneider, W. A.: Integral formulation for migration in two and three dimensions, Geophysics, 43, 49–76, https://doi.org/10.1190/1.1440828, 1978. a, b
Schwarz, B.: An introduction to seismic diffraction, Adv. Geophys., 60, 1–64, https://doi.org/10.1016/bs.agph.2019.05.001, 2019a. a, b, c, d, e, f
Schwarz, B.: Coherent wavefield subtraction for diffraction separation, Geophysics, 84, V157–V168, https://doi.org/10.1190/geo2018-0368.1, 2019b. a, b
Schwarz, B. and Gajewski, D.: Accessing the diffracted wavefield by coherent subtraction, Geophys. J. Int., 211, 45–49, https://doi.org/10.1093/gji/ggx291, 2017a. a
Schwarz, B. and Gajewski, D.: A generalized view on normal moveout, Geophysics, 82, V335–V349, https://doi.org/10.1190/geo2017-0159.1, 2017b. a, b, c
Schwarz, B., Vanelle, C., Gajewski, D., and Kashtan, B.: Curvatures and inhomogeneities: An improved common-reflection-surface approach, Geophysics, 79, S231–S240, https://doi.org/10.1190/geo2013-0196.1, 2014. a
Schwarz, B., Bauer, A., and Gajewski, D.: Passive seismic source localization via common-reflection-surface attributes, Stud. Geophys. Geod., 60, 531–546, https://doi.org/10.1007/s11200-015-0493-x, 2016. a
Shustak, M. and Landa, E.: Time reversal for wave refocusing and scatterer detection using machine learning, Geophysics, 83, T257–T263, https://doi.org/10.1190/geo2017-0679.1, 2018. a
Sibson, R. H.: Crustal stress, faulting and fluid flow, Geol. Soc. Spec. Publ., 78, 69–84, https://doi.org/10.1144/GSL.SP.1994.078.01.07, 1994. a
Symes, W. W. and Carazzone, J. J.: Velocity inversion by differential semblance optimization, Geophysics, 56, 654–663, https://doi.org/10.1190/1.1443082, 1991. a
Taner, M. T. and Koehler, F.: Velocity spectra—Digital computer derivation applications of velocity functions, Geophysics, 34, 859–881, https://doi.org/10.1190/1.1440058, 1969. a
Torrado, L., Mann, P., and Bhattacharya, J.: Application of seismic attributes and spectral decomposition for reservoir characterization of a complex fluvial system: Case study of the Carbonera Formation, Llanos foreland basin, Colombia, Geophysics, 79, B221–B230, https://doi.org/10.1190/geo2013-0429.1, 2014. a
Trorey, A.: A simple theory for seismic diffractions, Geophysics, 35, 762–784, https://doi.org/10.1190/1.1440129, 1970. a
Virieux, J. and Operto, S.: An overview of full-waveform inversion in exploration geophysics, Geophysics, 74, WCC1–WCC26, https://doi.org/10.1190/1.3238367, 2009. a
Wang, Z., Gao, J., Wang, D., and Wei, Q.: 3D seismic attributes for a tight gas sand reservoir characterization of the eastern Sulige gas field, Ordos Basin, China, Geophysics, 80, B35–B43, https://doi.org/10.1190/geo2014-0362.1, 2015. a
Wu, X., Liang, L., Shi, Y., and Fomel, S.: FaultSeg3D: Using synthetic data sets to train an end-to-end convolutional neural network for 3D seismic fault segmentation, Geophysics, 84, IM35–IM45, https://doi.org/10.1190/geo2018-0646.1, 2019. a
Zaremba, N. J., Smith, K. E., Bishop, J. M., and Smith, C. G.: Ground-penetrating radar and differential global positioning system data collected from Long Beach Island, New Jersey, April 2015, U.S. Geological Survey Data Series, 1006, https://doi.org/10.3133/ds1006, 2016. a