the Creative Commons Attribution 4.0 License.
the Creative Commons Attribution 4.0 License.
 | 09 Sep 2021
Rheological stratification in impure rock salt during long-term creep: morphology, microstructure, and numerical models of multilayer folds in the Ocnele Mari salt mine, Romania
Marta Adamuszek
Dan M. Tămaş
Jessica Barabasch
Janos L. Urai
At laboratory timescales, rock salt samples with different composition and microstructure show variance in steady-state creep rates, but it is not known if and how this variance is manifested at low strain rates and corresponding deviatoric stresses. Here, we aim to quantify this from the analysis of multilayer folds that developed in rock salt over geological timescale in the Ocnele Mari salt mine in Romania. The formation is composed of over 90 % of halite, while distinct multiscale layering is caused by variation in the fraction of impurities. Regional tectonics and mine-scale fold structure are consistent with deformation in a shear zone after strong shearing in a regional detachment, forming over 10 m scale chevron folds of a tectonically sheared sedimentary layering, with smaller folds developing on different scales in the hinges. Fold patterns at various scales clearly indicate that during folding, the sequence was mechanically stratified. The dark layers contain more impurities and are characterised by a more regular layer thickness compared to the bright layers and are thus inferred to have higher viscosities.
Optical microscopy of gamma-decorated samples shows a strong shape-preferred orientation of halite grains parallel to the foliation, which is reoriented parallel to the axial plane of the folds studied. Microstructures indicate dislocation creep, together with extensive fluid-assisted recrystallisation and strong evidence for solution–precipitation creep. This provides support for linear (Newtonian) viscous rheology as a dominating deformation mechanism during the folding. Deviatoric stress during folding was lower than during shearing in the detachment at around 1 MPa.
We investigate fold development on various scales in a representative multilayer package using finite-element numerical models, constrain the relative layer thicknesses in a selected outcrop, and design a numerical model. We explore the effect of different Newtonian viscosity ratios between the layers on the evolving folds on different scales. By comparing the field data and numerical results, we estimate that the effective viscosity ratio between the layers was larger than 10 and up to 20. Additionally, we demonstrate that the considerable variation of the layer thicknesses is not a crucial factor to develop folds on different scales. Instead, unequal distribution of the thin layers, which organise themselves into effectively single layers with variable thickness, can control deformation on various scales. Our results show that impurities can significantly change the viscosity of rock salt deforming at low deviatoric stress and introduce anisotropic viscosity, even in relatively pure layered rock.
- Article
(47779 KB) - Full-text XML
-
Supplement
(34478 KB) - BibTeX
- EndNote


Understanding the rheology of rock salt during long-term deformation is of great significance in modelling salt tectonics and in salt engineering, e.g. salt diapir evolution, evolution of salt basins, designing, operation, and abandonment of underground storage caverns and nuclear waste repositories. Quantifying salt tectonic flow requires extrapolating experimentally derived flow laws to strain rates much lower than those attainable in the laboratory (Herchen et al., 2018). This extrapolation must be based on an understanding of the microscale deformation mechanisms operating under these conditions and on integrated studies of natural structures with experimental work (Urai et al., 1987; Weinberger et al., 2006). Reviews are provided by Carter and Hansen (1983) and Urai et al. (2008a).
Under geological conditions, rock salt deforms by a combination of dislocation creep and solution–precipitation creep processes, which are described by constitutive equations relating strain rate to stress, grain size, and temperature. In situ differential stress in the deep subsurface, using subgrain size piezometry, indicates values usually in the range of 0.5 to 2.3 and sometimes as high as 5 MPa (Schléder and Urai, 2005, 2007, Rowan et al., 2019) so that in situ stress in rock salt is nearly isotropic. Under these conditions, dynamic recrystallisation maintains a stress-dependent steady-state grain size, and power-law rheology is common with an n value of about 4.5. Microstructural studies of subgrains and recrystallised grains in naturally deformed rock salt also show, in agreement with experiments, that during fluid-assisted dynamic recrystallisation of salt in nature (water content >10 ppm), the grain size can adjust itself so that the material deforms close to the boundary between the dislocation and pressure solution creep fields (Ter Heege et al., 2005). In the dislocation creep regime, a large number of laboratory experiments have shown that depending on microfabric and impurities, rock salt power-law creep rates can vary by several orders of magnitude (the so-called “Kriechklassen”) (Hunsche et al., 2003).
However, at low deviatoric stresses and at long timescales, when the grain size is lower than the steady-state grain size of dynamically recrystallised halite for the current deviatoric stress, pressure solution is the dominant deformation mechanism, and rheology is Newtonian viscous (Urai et al., 1986; Bérest et al., 2019). In recent years, advances in understanding of the deformation mechanisms and microstructural processes have been reported based on developments in microstructural and textural or orientation analysis using electron backscatter diffraction (EBSD), microstructure decoration by gamma irradiation, cryo-scanning electron microscopy (cyro-SEM), and other methods. Samples from a wide range of subsurface and surface locations have been studied (e.g., Schléder and Urai, 2005, 2007; Schoenherr et al., 2007; Urai and Spiers, 2007; Urai et al., 2008b; Leitner et al., 2011; Závada et al., 2012; Kneuker et al., 2014; Thiemeyer, 2015; Thiemeyer et al., 2016).
Various deformation structures or processes in nature can be used to infer long-term rheological properties of rocks (e.g. Price and Cosgrove, 1990; Talbot, 1999; Kenis et al., 2005). A number of methods have been used to constrain long-term rheology of rock salt: (i) surface displacement field in areas of active salt tectonics and in the areas where erosion led to a change in the overburden load (e.g. Bruthans et al., 2006; Weinberger et al., 2006; Mukherjee et al., 2010), (ii) sinking or ascent of dense rocks in the rock salt (e.g. Weinberg, 1993; Chemia and Koyi, 2008; Burchardt et al., 2012a, b; Li et al., 2012; Adamuszek and Dabrowski, 2019), (iii) cavern convergence (e.g. Bérest et al., 2017; Cornet et al., 2018), (iv) naturally flowing salt at the surface (e.g. Talbot, 1979; Talbot et al., 2000), and (v) development of finger-like structures (e.g. Słotwiński et al., 2020). The analyses usually assume either linear viscous rheology or power-law creep. However, the problem of which of these rheologies best describes long-term behaviour of the rock salt has not been satisfactorily solved.
In tectonic models, mechanical behaviour of evaporite successions is usually assumed to be homogeneous and isotropic, and mechanical properties of the succession are approximated with the rheology of rock salt. However, evaporites are often layered with common intercalation of rocks such as bittern salt (carnallite, bischofite, epsomite) or anhydrite. Bittern salts are much weaker than rock salt (Urai, 1983, 1985; Urai and Boland, 1985; Urai et al., 1986; Urai, 1987a, b; Schenk and Urai, 2005; Słotwiński et al., 2020) with 100 to 1000 times lower effective viscosity than rock salt. Constraints provided by folds of anhydrite in rock salt point to an effective viscosity about 10 to 100 times that of rock salt (Schmalholz and Urai, 2014; Adamuszek et al., 2015). In summary, in layered evaporites, competency contrast can be as high as 5 orders of magnitude (Rowan et al., 2019). This competency contrast, which is presented at a range of scales, will strongly enhance intrasalt deformation and development of buckle folding or boudinage structures, and at high strains it can also lead to a tectonic melange (Raith et al., 2016, 2017). However, in relatively pure rock salt, extrapolation of laboratory creep rates in rock salt to low stress–low strain rate conditions is not well known, and even less is known about the effect of impurities on this low stress–low strain rate rheology. The influence of the second-phase minerals on the rock salt effective mechanical properties has been mainly studied experimentally and shows either their weakening or strengthening effects (Price, 1982; Jordan, 1987; Hickman and Evans, 1995; Renard et al., 2001). Only a few studies analysed it for naturally deformed rocks (Talbot, 1979; Závada et al., 2015). Talbot (1979) estimated the viscosity ratio between the layers to vary between 8 and 14, implying the pure rock salt layer as the more competent.
In this paper, we investigate rheological variation of folded rock salt based on the analysis of the buckle fold geometry. The shape of buckle folds is a parameter sensitive to rheological properties of the layers, and various studies show suitability of these structures in deciphering rheology of various rocks (for review see: Hudleston and Treagus, 2010; Schmalholz and Mancktelow, 2016). The Ocnele Mari salt mine, located in the Southern Carpathians of Romania, exposes spectacular structures on the cleaned walls of over 50 regularly arranged pillars, the ceiling, and the floor. We focus on analysing folds that develop on various scales, which are often referred to as polyharmonic folds. Development of the polyharmonic folds is limited to a specific combination of geometrical and rheological parameters of the multilayer sequence (e.g. Treagus and Fletcher, 2009). As a result, these structures are potentially useful in deciphering mechanical variation between the layers.
Field observations from the Ocnele Mari salt mine are used as input for numerical models to constrain the range of geometrical parameters of the multilayer sequence. We carry out microstructural analysis to gain information about the dominating deformation mechanism. Our observations strongly suggest that the rheology of rock salt was linear viscous during the folding. We employ numerical simulations to study the influence of viscosity ratio between the layers on the developing structures for a number of initial model setups. We show that the polyharmonic folds develop only for a specific range of viscosity ratios. A detailed comparison between the field observations and numerical results suggests that the viscosity ratio between the dark (rich in impurities) and white (poor in impurities) layers varied between 10 and 20.
The study area is located in the Romanian Southern Carpathians in the thin-skinned part of this fold-and-thrust belt (Fig. 1a). The Carpathians are an Alpine orogen that records the late Jurassic to middle Miocene closure of the Alpine Tethys ocean (Săndulescu, 1988, 1984; Csontos and Vörös, 2004; Schmid et al., 2008; Matenco, 2017). This thin-skinned mountain belt is located at the contact between the Southern Carpathians and the Moesian platform (Fig. 1a, c) commonly known as the Getic depression (Motaş, 1983; Răbăgia et al., 2011; Krézsek et al., 2013). The sediments of the Getic depression range from latest Cretaceous to Quaternary and were deposited as post-tectonic to the Cretaceous thick-skinned deformation of the Southern Carpathians (Răbăgia and Maţenco, 1999; Răbăgia et al., 2011; Krézsek et al., 2013). The evolution of the Getic depression is characterised by transtensional opening during the Paleogene–early Miocene period, followed by south-directed thrusting and transpression (inversion) during middle Miocene to Quaternary times (Krézsek et al., 2013).
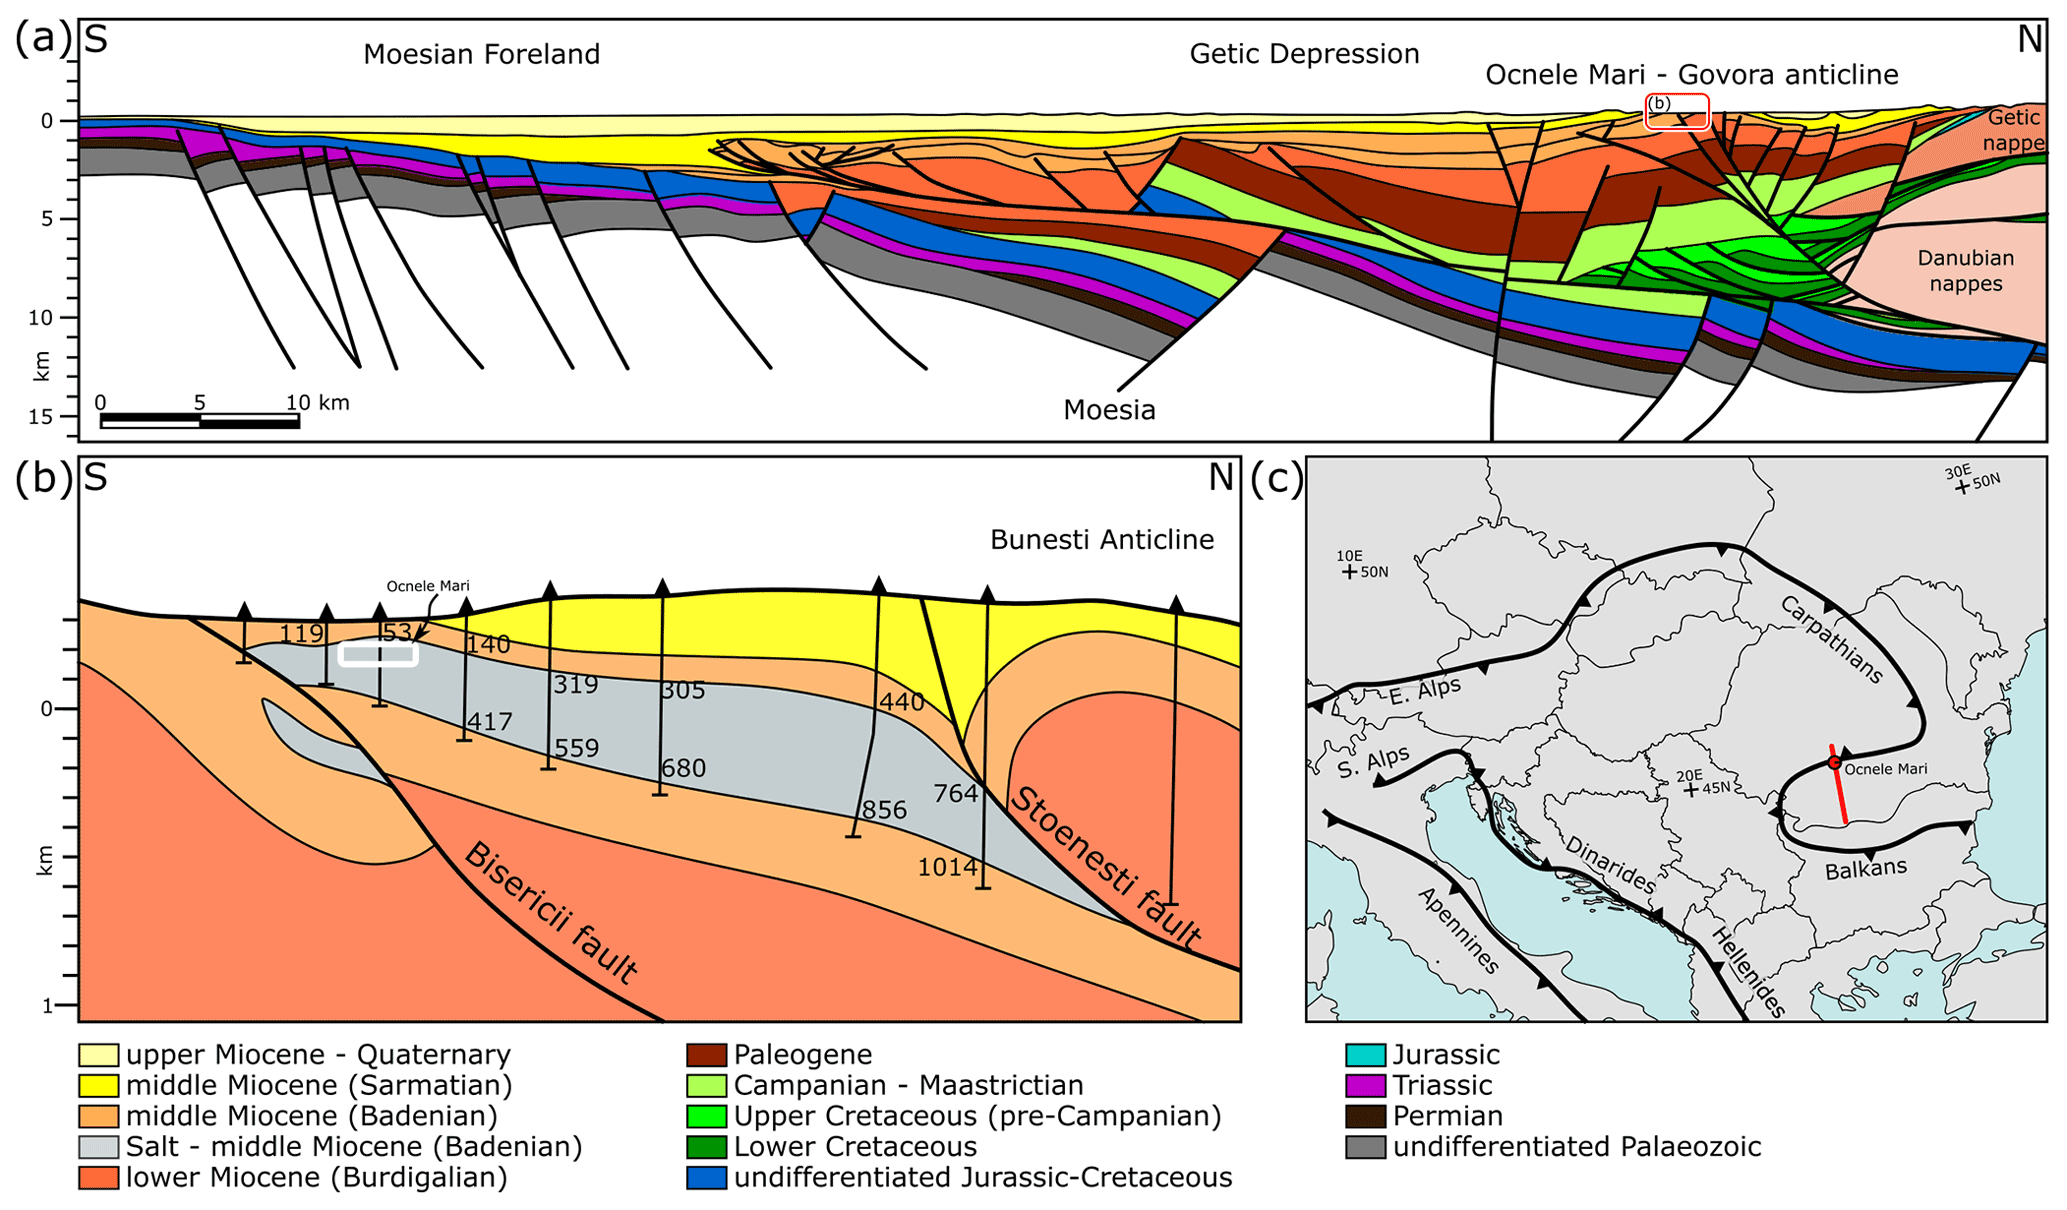
Figure 1(a) Regional geological profile of the area (after Răbăgia et al., 2011, and references therein). The location of the local profile (b) is marked with a red rectangle. Coordinates of the two ends of the profile are north 45∘20′51′′ N 24∘19′51′′ E and south 43∘47′11′′ N 24∘31′43′′ E. (b) Local geological profile of the Ocnele Mari area, illustrating the shape and position of the salt body (45∘05′06.9′′ N 24∘18′33.7′" E) (after Stoica and Gherasie, 1981) with the location of wells, on which the profile is based. The numbers indicate the top and bottom of salt (in measured depth). The approximate location of the mine is marked with a white rectangle. (c) Sketch of main structural features of the Alpino–Carpatho–Dinaric region. The location of the regional profile (a) is marked with a red line.
The Ocnele Mari salt mine is located in the Govora–Ocnele Mari antiform (e.g. Răbăgia et al., 2011; Krézsek et al., 2013). It evolved as an early Miocene extensional structure that was repeatedly inverted by subsequent shortening phases (Răbăgia et al., 2011; Krézsek et al., 2013). There are two main areas with structural highs in this antiform, the Govora anticline (west) and the Ocnele Mari anticline (east), with multiple tear faults striking from NNE–SSW to NNW–SSE (Popescu, 1954; Răbăgia et al., 2011).
The Ocnele Mari salt body is approximately 10 km long and 3.5 km wide (Stoica and Gherasie, 1981; Zamfirescu et al., 2007), and it is middle Miocene in age (Popescu, 1954; Iorgulescu et al., 1962; Murgoci, 1905). The salt body dips 15–20∘ to the north and is over 400 m thick in its central part as defined by well and mining data (Fig. 1b; Zamfirescu et al., 2007). It is likely that the deposition of salt was laterally uneven, controlled by the pre-middle Miocene topography (Fig. 1b, Popescu, 1954), before it became one of the evaporite detachments of this fold-and-thrust belt. Most of the salt is more than 97 % halite with an alternation of lighter (white) and darker layers (Stoica and Gherasie, 1981). Rare microfossils include nuts, chestnuts, pine cones, and charred coal fragments (Iorgulescu et al., 1962). Due to the complex tectonic history and the poor fossil record in the lower to middle Miocene formations, there are still large uncertainties regarding the age of some salt formations today (see Filipescu et al., 2020).
The Ocnele Mari salt mine is one of the many salt mines in Romania that is open to the public. It is located in the Southern Carpathian region in the upper near-surface part of the Ocnele Mari salt body (45∘05′06.9′′ N 24∘18′33.7′′ E). Mining activities in the Ocnele Mari region have been ongoing since Roman times (11th to 13th century) (Stoica and Gherasie, 1981; Tămaş et al., 2021a). Salt from this area is being exploited with both solution mining and room-and-pillar mining. For more details on the location of the mine, other such exposures, and the history of salt tectonics in the Romanian Carpathians, see Tămaş et al. (2018, 2021a). The active salt mine is being exploited at two distinct levels (+226 and +210 m above sea level), one of which is accessible to the public (horizon 226, ∼ 50 m below the surface), exposing spectacularly folded rock salt.
Multilayer buckle folds show a great variety of shapes related to the large number of parameters that influence the folding process. The most important factors are (i) model geometry, e.g. the number of layers and their thickness, geometry of the layer interfaces (type of perturbation and its amplitude); (ii) mechanical properties of the layers, e.g. viscosity ratio, stress exponent for the power-law flow law, anisotropy; (iii) contact between the layers, e.g. no slip (bonded) or free slip; (iv) amount of shortening; and (v) boundary condition, e.g. free slip, no slip, free surface, rate of deformation. Based on the analysis of folding, when the shortening direction is oblique to the layering, the influence of simple shear on the fold shape geometry is demonstrated to have no great effect (Cobbold et al., 1971; Schmalholz and Schmid, 2012; Llorens et al., 2013). As pointed out by Russel K. Davis and Raymond C. Fletcher (personal communication, 2021), this is due to the fact that fold geometry, to the first order, depends only on the bulk layer-parallel shortening. Hobbs et al. (2008) suggested that the softening mechanism related to the thermal effect is another important factor influencing the fold geometry. However, the significance of this mechanism, particularly for the small-scale folding, was questioned and widely discussed (see Hobbs et al., 2009; Treagus and Hudleston, 2009; Hobbs et al., 2010; Schmid et al., 2010).
Understanding folding in multilayers is rooted in the analysis of deformation of an isolated more viscous layer embedded in the less viscous matrix. Biot (1961) and Ramberg (1962) described the wavelength selection process, which is responsible for the faster growth of selected wavelengths and leads to development of a semi-regular pattern of the fold train. The wavelength that initially experiences the largest growth rate is referred to as the dominant wavelength. The dominant wavelength normalised by the layer thickness is a function of the viscosity ratio between the layer and matrix. Layers with a larger viscosity ratio tend to develop larger dominant wavelengths and grow faster. With progressing shortening, the wavelength-to-thickness ratio evolves and maximum growth rates are recorded by initially larger wavelength-to-thickness ratios. The wavelength-to-thickness ratio with the maximum cumulative amplification is referred to as the preferred wavelength. Further studies on the wavelength selection process allowed a relation to be established between the single-layer fold shape and the rheological parameters (Biot, 1961; Sherwin and Chapple, 1968; Fletcher and Sherwin, 1978; Schmalholz and Podladchikov, 2001).
Numerous theoretical (e.g. Biot, 1961, 1965; Johnson and Fletcher, 1994), analogue (e.g. Currie et al., 1962; Ghosh, 1968; Cobbold et al., 1971; Ramberg and Strömgård, 1971), and numerical (e.g. Frehner and Schmalholz, 2006; Schmid and Podladchikov, 2006; Schmalholz and Schmid, 2012; Frehner and Schmid, 2016) studies aimed to investigate multilayer buckle folding and the wavelength selection process. The studies show that folding instability increases with an increasing (i) number of stiff layers, (ii) viscosity ratio between the stiff and soft layers, and (iii) thickness of the bounding soft layers (e.g. Johnson and Fletcher, 1994). However, establishing a general relation between the parameters that control multilayer folding and the resulting fold shape is strongly hampered due to multiple controlling factors and associated non-unique solutions. An additional difficulty of the analysis involves determining fold shape parameters that can accurately describe the often complex multilayer pattern.
In various studies, evolution of the multilayer structures is limited to the analysis of a specific configuration of the layers. Johnson and Pfaff (1989) examined conditions of development of parallel, similar, and constrained folds in multilayers composed of alternating stiff and soft layers with bonded or free-slip contact or multilayers composed of all stiff layers with free-slip contact. The authors illustrated how these structures can be used to infer the viscosity ratio between the layers and also conditions of deformation. The role of spacing between the layers was discussed by Ramberg (1962), who distinguished disharmonic and harmonic folds. He showed that if the separation between the layers is larger than the sum of their dominant wavelength, the layers fold independently, forming disharmonic structures; otherwise they start to interact and fold harmonically. Decreasing distance between the layers causes them to behave as an effective single layer. A theoretical and numerical study of the transition between single-layer, multilayer, and effective single-layer deformation was presented by Schmid and Podladchikov (2006). When the multilayer sequence consists of layers that interact with each other and have strongly variable thickness and/or variable rheology, folds can grow on various scales, forming a polyharmonic structure. Conditions of when the polyharmonic structures can develop in the multilayer sequence were investigated by Frehner and Schmalholz (2006) and Treagus and Fletcher (2009).
Treagus and Fletcher (2009) suggested that small-scale structures that develop in the thin layers, in order to survive, must have a greater growth rate than the large-scale structures. However, the growth rate of the multilayer package is always larger than that of the single layer. The authors concluded that the layer thickness variation alone in various cases is insufficient to generate polyharmonic folding. Yet, two factors can reverse this relation: (i) increasing viscosity of the thin layer strengthens amplification of the small-scale structure, and (ii) confinement of the multilayer stack (i.e. confined between two parallel rigid planes) suppresses amplification of the large-scale folds.
Frehner and Schmalholz (2006) numerically tested the development of polyharmonic folds in a multilayer package containing alternating stiff and soft layers with variable thickness. In their models, the initial perturbation amplitude was equal for thin and thick layers, causing relatively greater interface roughness of the thin layer. The authors argue that using the same perturbation amplitude for all the layers could be a reasonable assumption in various rock sequences, in particular in sedimentary rocks. Consequently, the small-scale folds developed two wavelengths as they achieved large amplitudes before they were incorporated into large-scale fold structures.
5.1 Field and photogrammetry techniques
Several fieldwork campaigns were carried out in the Ocnele Mari salt mine with the scope of structural mapping, acquiring high-resolution photographs of all the accessible pillar walls and part of the mine ceiling (∼ 3300 photographs) and measuring the orientation of the observed structural features. Key photographs within the mine were selected and interpreted using vector graphics software (Inkscape).
To aid the 3D structural analysis, 3D digital outcrop models and orthorectified models have been created using structure from motion (SfM) photogrammetry techniques. Agisoft Metashape Professional (v.1.6.2) was used for the creation of these models, and Virtual Reality Geological Studio (VRGS v.2.52) software (Hodgetts et al., 2007) was used for interpreting them (for more details on outcrop creation and interpretation see Tămaş et al., 2021b).
In addition to data extracted from the 3D digital outcrop models, we measured the orientation of salt foliations and fold axes in the mine using a traditional Freiberg geological compass and with an iPad 9.7 2018 (using FieldMove software). Orientation data were processed in Structural Geology to PostScript (SG2PS; Sasvári and Baharev, 2014). The measurement of these structural features was allowed by the geometry of the pillars, as foliation and fold axes could be traced “around the corner” to the other side of the pillar.
5.2 Numerical modelling
The open-source software FOLDER, which is designed for the analysis of deformation in a layered medium in two dimensions (Adamuszek et al., 2016), was used to model evolution of the multilayer fold structures. FOLDER builds on MILAMIN (Dabrowski et al., 2008) to solve Stokes equations for incompressible viscous flow under zero gravity using the finite-element method. A high-quality unstructured mesh is created using the triangular mesh generator Triangle (Shewchuk, 1996). Moreover, FOLDER includes a range of utilities from the MUTILS package (Krotkiewski and Dabrowski, 2013), which allow for high-resolution modelling. The simulations were conducted using the Neptun computational cluster at the Polish Geological Institute – NRI.
5.3 Fold shape analysis
The fold shape of a single-layer fold example is analysed using the Fold Geometry Toolbox (FGT; Adamuszek et al., 2011); the following definitions of the parameters are used. Arclength (L) is determined along the interface as the distance between two neighbouring inflection points. Amplitude (A) is measured as the distance between the line joining two inflection points and the extremity of the fold, whereas wavelength (λ) is twice the distance between two inflection points (Ramsay and Huber, 1987). For layer thickness (h), we use a mean thickness value calculated as the area of the layer divided by the average arclength (Adamuszek et al., 2011). Finally, for the example studied here, we estimate the viscosity ratio between the layer and embedding matrix using the Fletcher and Sherwin (1978) and Schmalholz and Podladchikov (2001) methods. In the Fletcher and Sherwin (1978) method, we determine (i) the relative bandwidth of the amplification spectrum (β*), which is related to the dispersion (ratio between the standard deviation and the mean value) of the frequency distribution of the arclength-to-thickness ratio () and (ii) the preferred arclength-to-thickness ratio (), which can be approximated by the mean value of the arclength-to-thickness ratio. The method of Schmalholz and Podladchikov (2001) requires analysis of (i) the amplitude-to-wavelength ratio and (ii) the thickness-to-wavelength ratio. The methods are briefly presented and discussed in e.g. Hudleston and Treagus (2010).
5.4 Microstructural analysis
The microstructural analysis of regular and gamma-irradiated thin sections was performed based on two hand specimens collected in the Ocnele Mari mine: RO-OM-01 and RO-OM-02. The unoriented samples were recently mined and were collected at the entrance of the tourist area. They were cut perpendicular to the bedding in a dry laboratory with a diamond saw and cooled by a small amount of slightly undersaturated salt brine to reduce mechanical damage. Regular thin sections were dry-polished to a thickness of approximately 1 mm, and gamma-irradiated thin sections were dry-polished to a thickness of approximately 50 µm to allow decorated microstructures to be visible. To create a negative topography at grain boundaries and subgrain boundaries, the samples were chemically etched with slightly undersaturated brine and flushed with a stream of n-hexane using the technique described in Urai et al. (1987). The thin sections were imaged in reflected and transmitted light on a Zeiss optical microscope with the stitching panorama function of the ZEN imaging software. To decorate crystal defect structures, samples were irradiated in the research reactor FRM-II at the TU Munich in Garching with varying dose rates between 6 and 11kGy h−1 to a total dose of 4 MGy at a constant temperature of 100 ∘C (Urai et al., 1986; Schléder and Urai, 2005; Schléder et al., 2007).
For X-ray diffraction (XRD) analysis of inclusions, part of RO-OM-02 was dissolved in deionised water and the insoluble residue vacuum-filtered. Qualitative and quantitative XRD measurements were then performed on a Bruker D8 equipped with a graphite monochromator and a scintillation counter. Scans were measured with Cu–Kα radiation.
Vitrinite reflectance measurements were performed on RO-OM-01 to obtain information on the maximum temperature reached during burial. Due to the low organic content of the sample, the sample was crushed by hand to a grain size of about 1 mm, ensuring no vitrinites were destroyed. Several washing steps with distilled water dissolved the halite fraction until only insoluble components remained. After drying, this residue was then impregnated in a two-compound epoxy resin and polished.
Reflectance values were measured on a Zeiss Axioplan microscope equipped with a 50 EC-Epiplan-NEOFLUAR Oil Pol objective lens and a PI 10 ocular lens. Images were recorded using a Basler CCD camera, and image processing was performed using the Fossil software (Hilgers Technisches Büro). Calibration of reflected incident light intensity was performed with a Leuco–Saphir standard with a reflectance of 0.592 %. A total of 50 individual vitrinite grains were measured to calculate the mean random vitrinite reflectance (VRr). VRr was translated to the maximum past temperature using the equation by Barker and Pawlewicz (1994) for burial heating.
Halite grain and subgrain boundaries were manually traced with a touch pen and tablet and analysed with Fiji (Schindelin et al., 2012). Subgrain size for piezometry was calculated as equivalent circular diameter (Schléder and Urai, 2005).
6.1 Overview of the mine
The public area of the mine (studied area) is approximately 180 m by 210 m and has a height of approximately 8 m. The galleries are oriented approximately N–S and E–W, separating over 50 square pillars with an edge length and spacing between the pillars of around 15 m (Fig. 2). The structures in the mine can be observed on the clean surface of pillars, walls, and the ceiling, allowing for detailed three-dimensional analysis. Figure 3 illustrates a three-dimensional digital model of pillar D49.
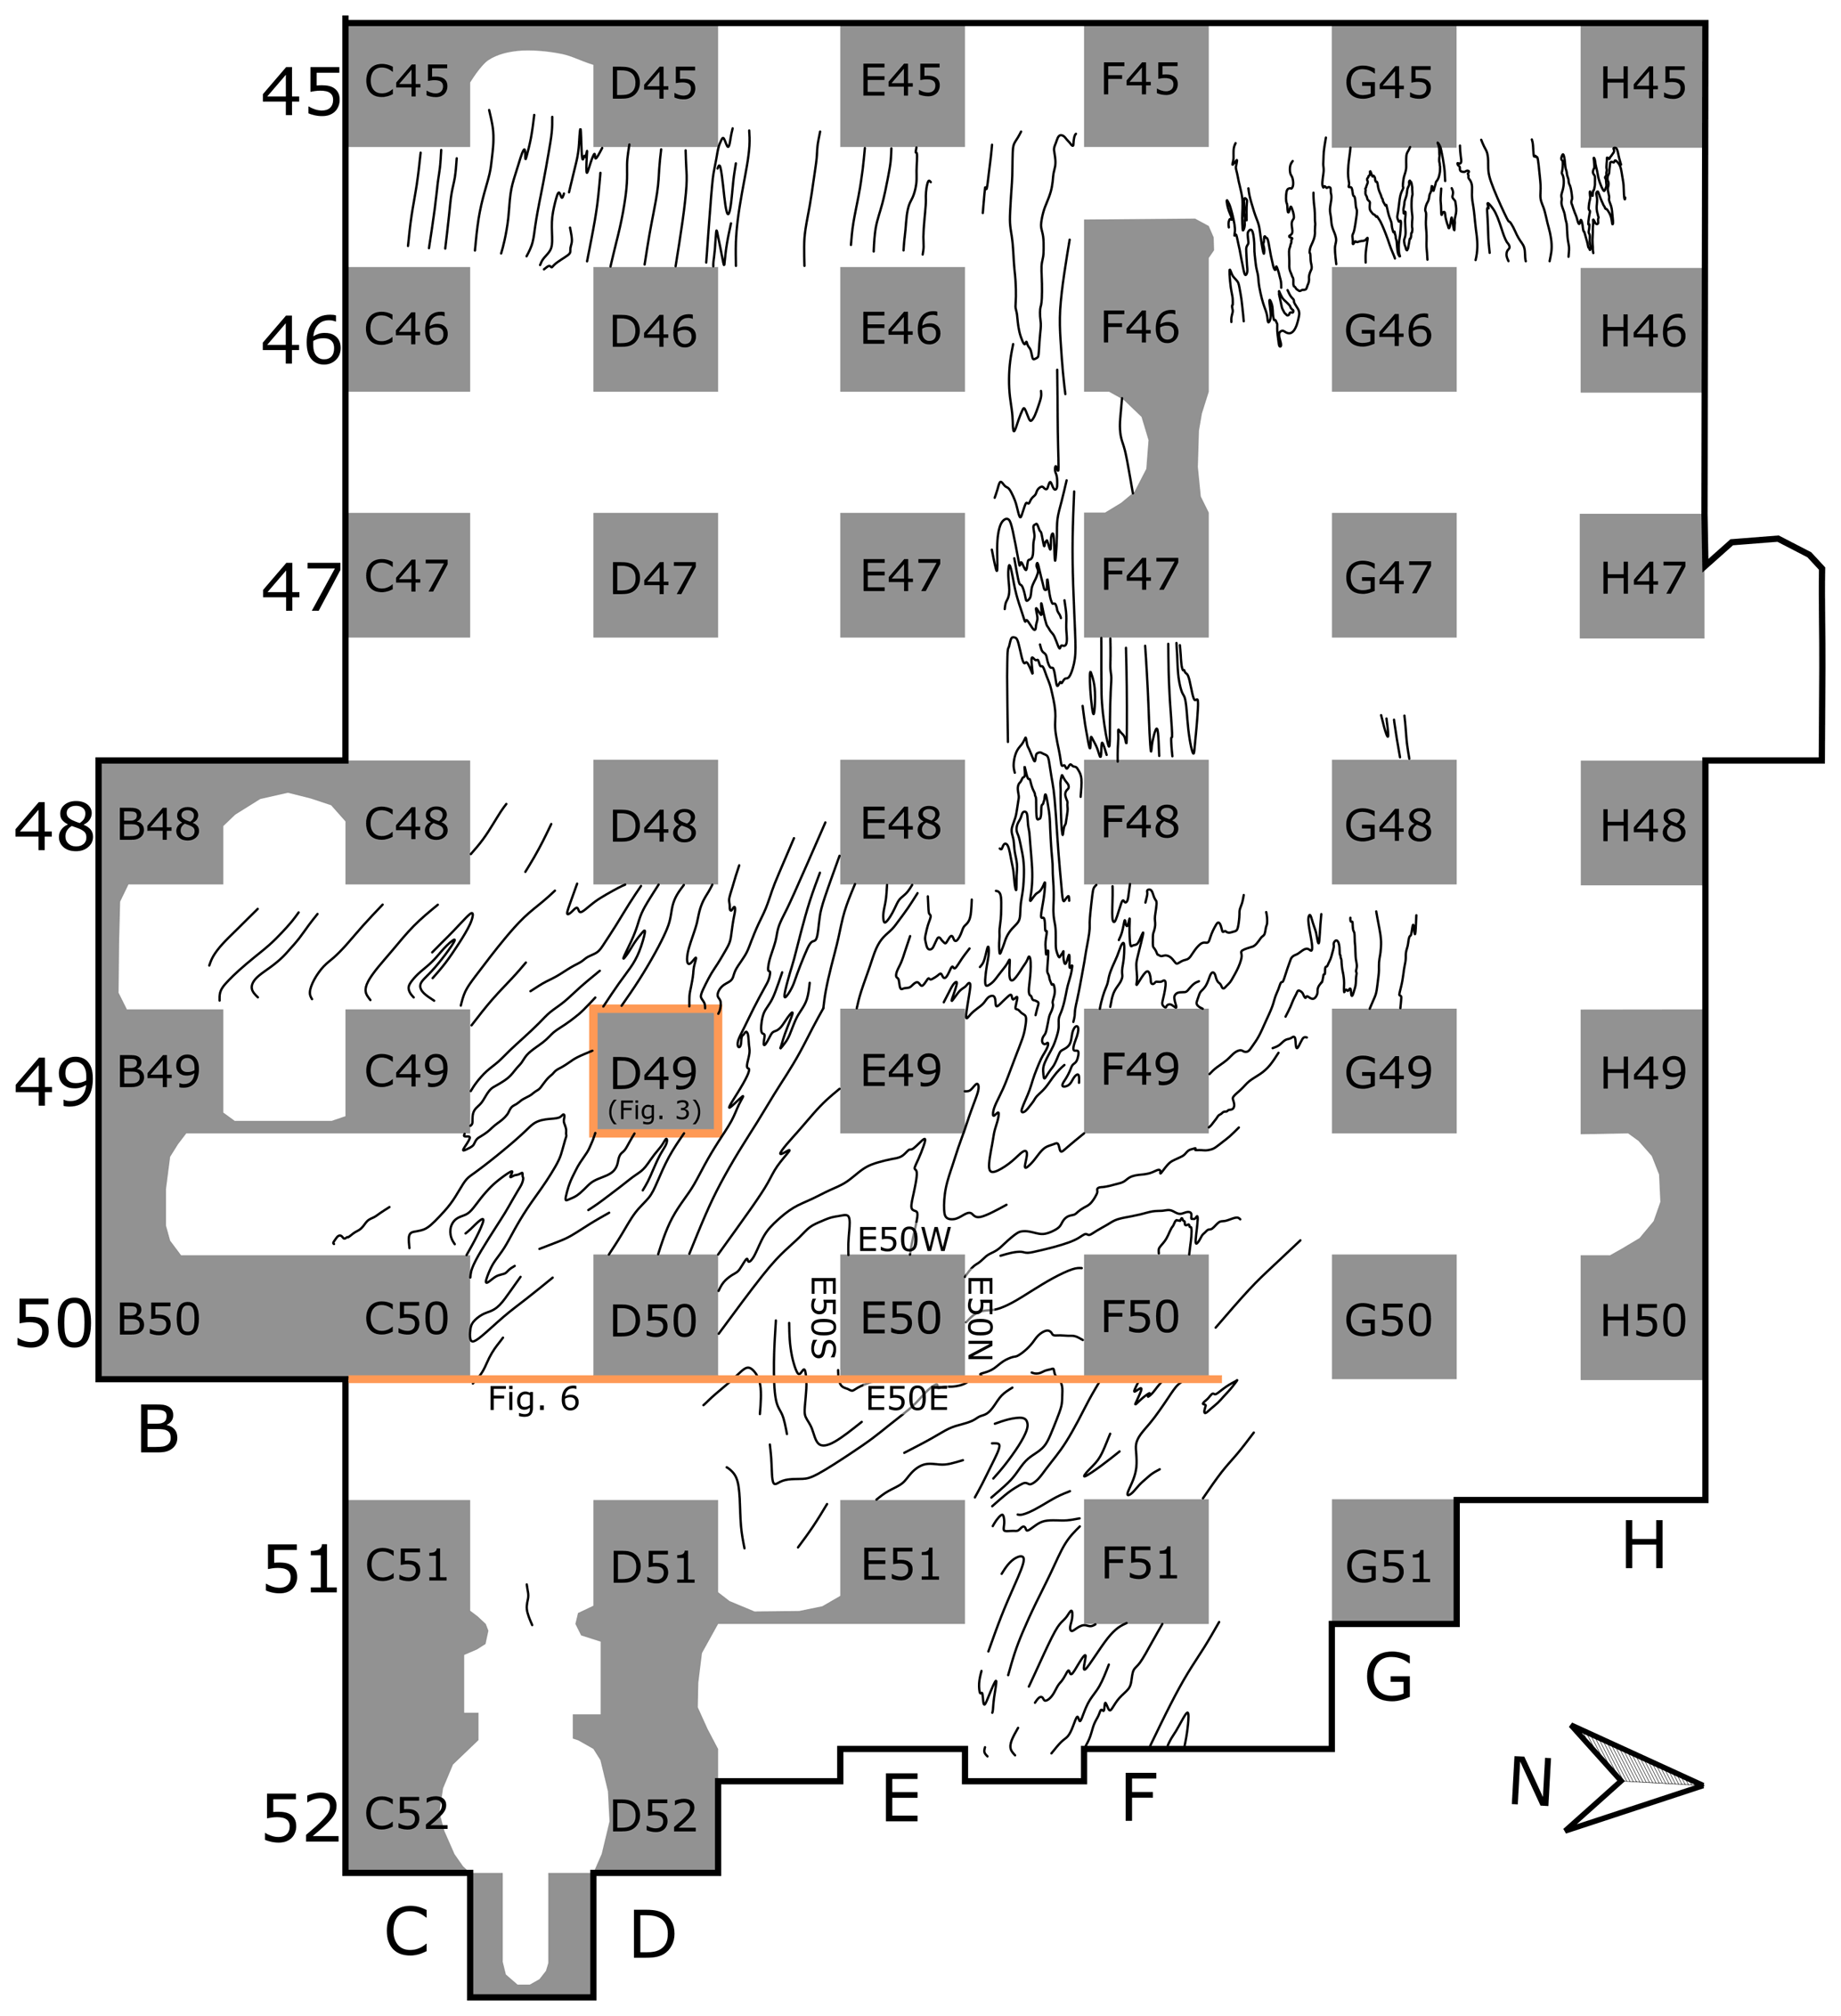
Figure 2Map of the studied area in the +226 horizon of the Ocnele Mari salt mine, illustrating the position of the pillars. Curves between the pillars show traces of the layers observed on the mine ceiling. The thick orange line along the eastern sides of line 50 marks the position of the cross section through the mine (see Fig. 6). The orange square indicates the pillar presented in Fig. 3. The public area of the mine (shown on the map) is approximately 180 m by 210 m and has a height of approximately 8 m.
The salt exposed in the studied area of the Ocnele Mari salt mine typically shows an alternation of darker and lighter layers of rock salt (Figs. 3, 4, and 5). The light-coloured layers are commonly multilayer packages centimetres to decimetres thick and consist almost entirely of a granular aggregate of halite crystals, while the darker layers are multilayers consisting of thinner (millimetres to centimetres thick) layers in many shades of grey (Fig. 4b, e). Together with these darker and lighter salt layers, in many cases, locally, we find thin millimetre- to centimetre-scale layers rich in clastic material (shale, silt and sand) or gypsum and anhydrite-rich layers. These inclusion-rich layers are often either black in colour or yellow–brown (the silty–sandy ones) (Fig. 4d).

Figure 3(a) 3D digital model of pillar D49. (b) Photograph of the east-facing pillar wall. (c) Photograph of the north-facing pillar wall. (d) Photograph of the west-facing pillar wall. (e) Photograph of the south-facing pillar wall.
Folds are the most impressive structures in the Ocnele Mari salt mine and can be observed on most east- or west-facing pillar walls. Folds occur on various scales ranging from centimetres to tens of metres and represent a variety of geometries including harmonic, polyharmonic, and disharmonic styles.
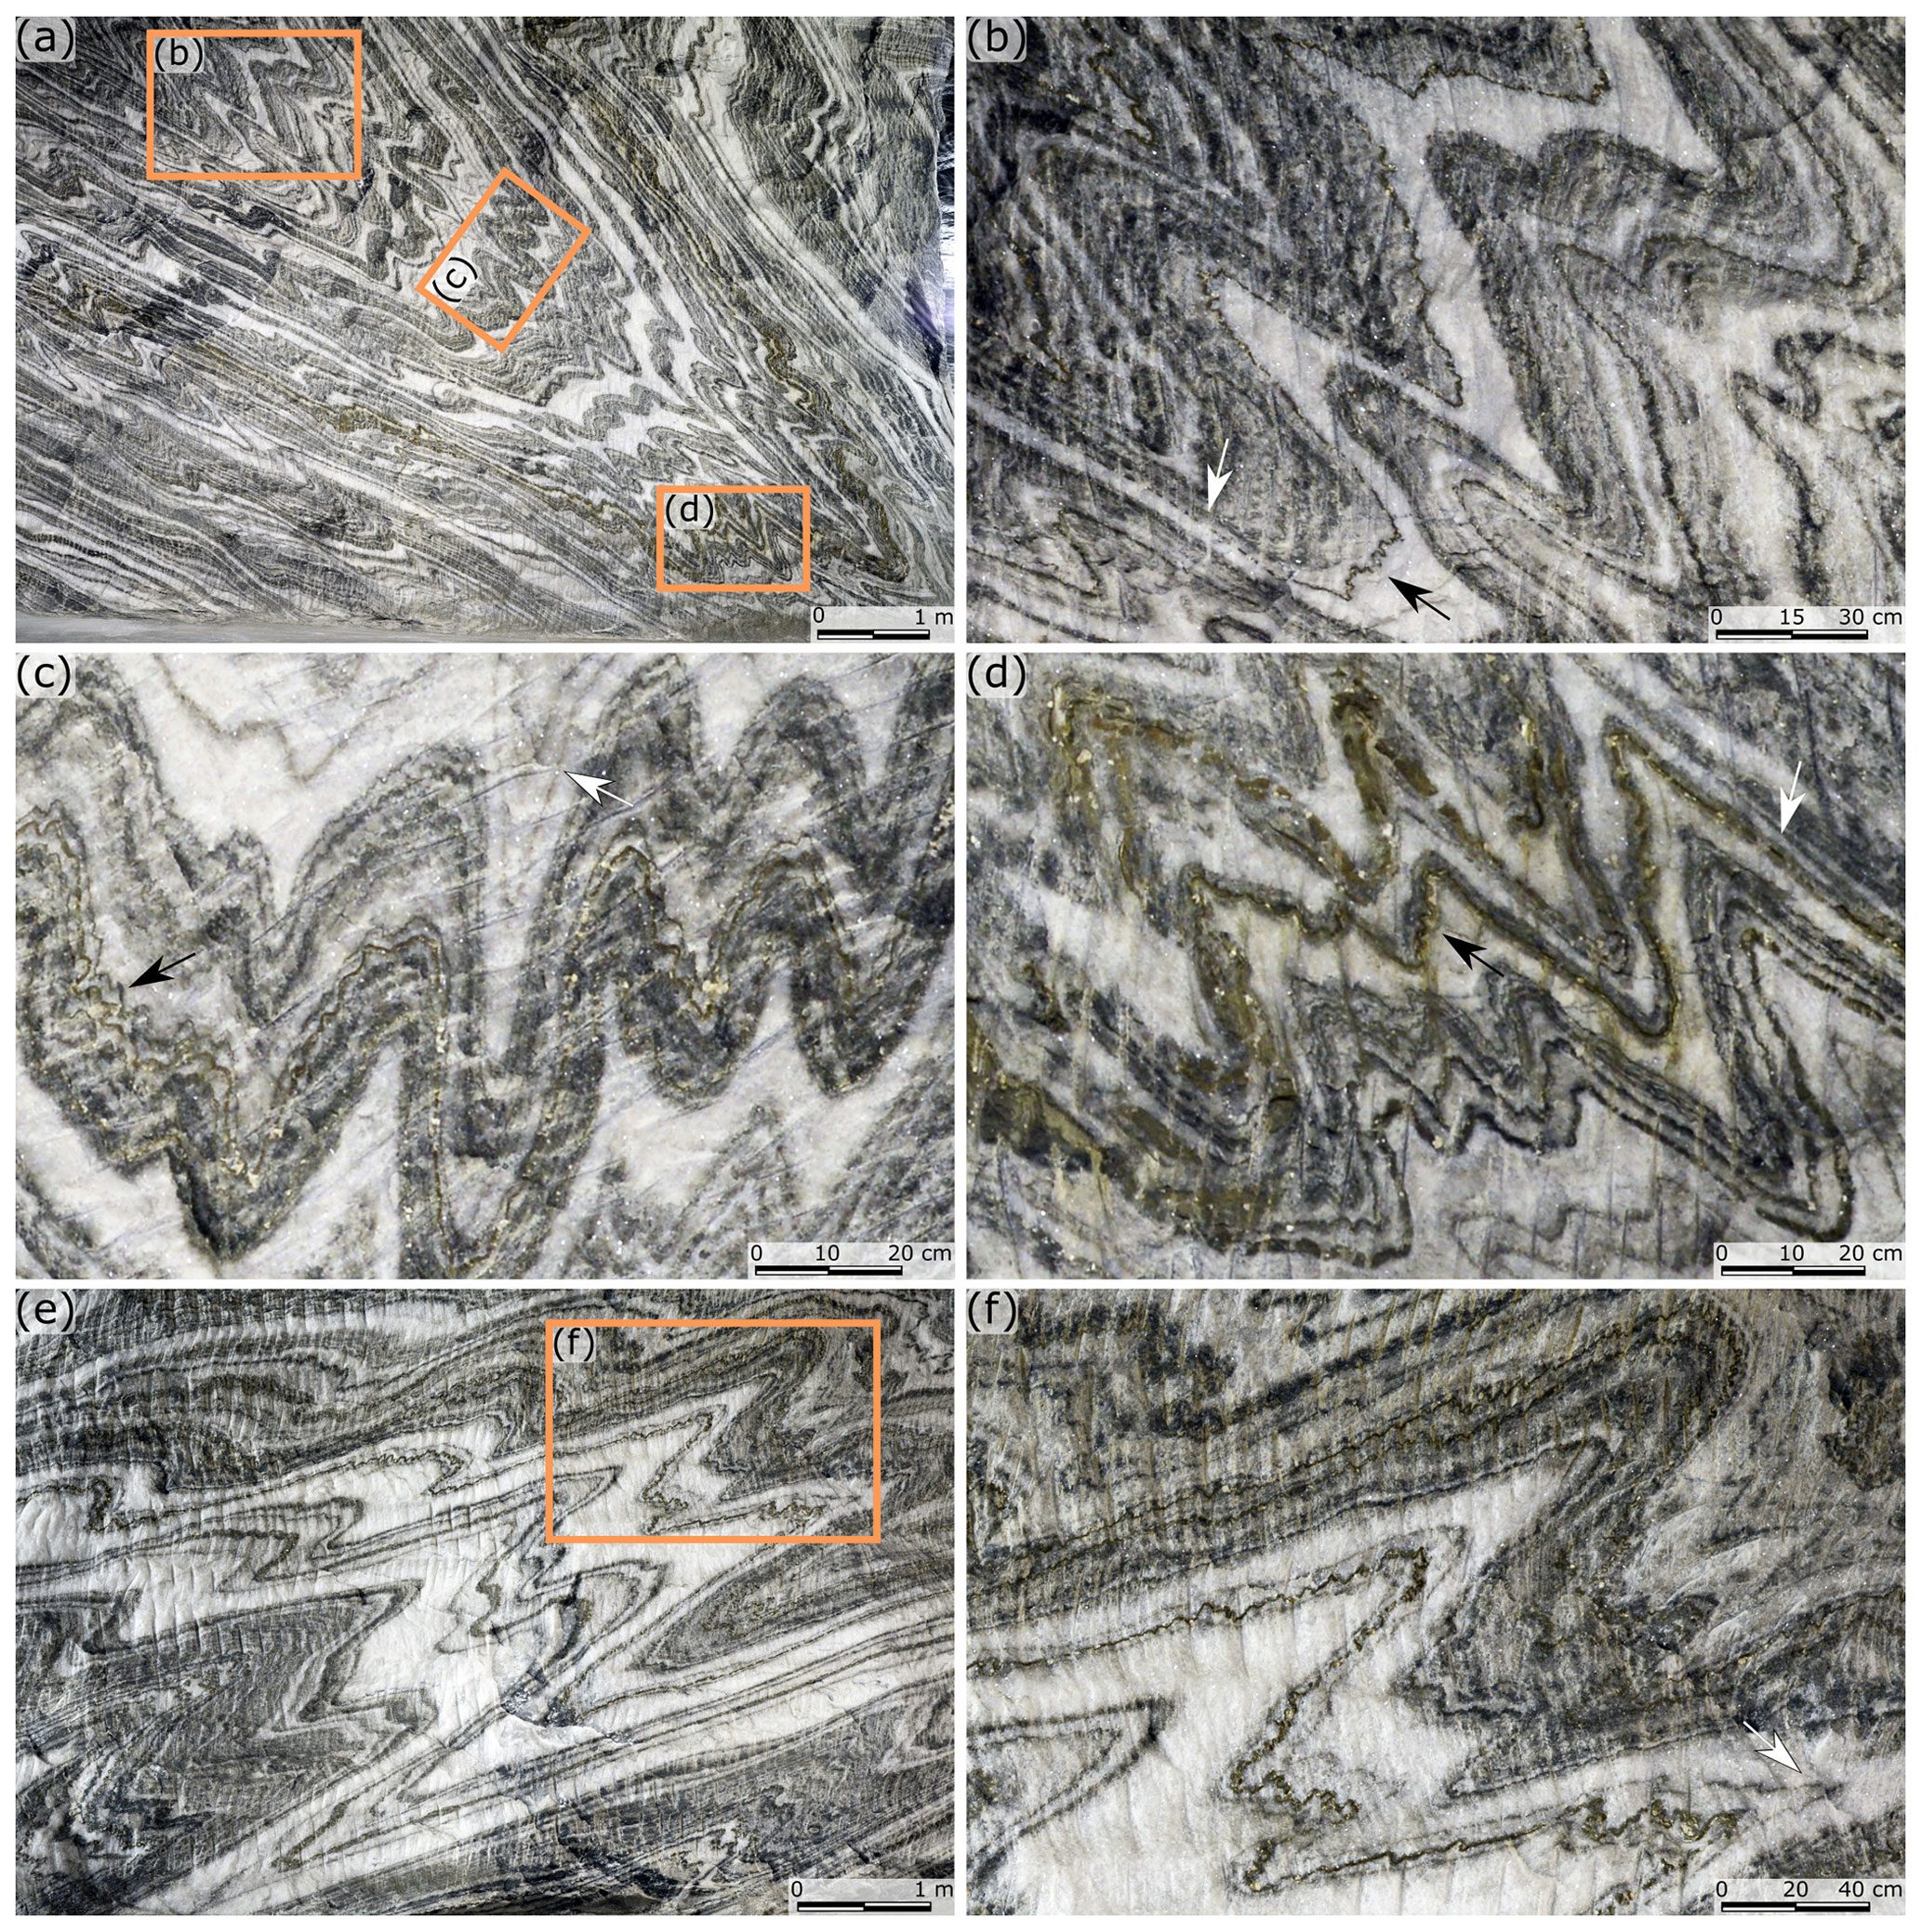
Figure 4Photos of the eastern and western sides of pillar C50, illustrating different scale folding and the range of fold shapes. Note that the layers in the fold limbs are locally boudinaged (indicated with white arrows in b and d). See text for further discussion.
Figure 4a shows an example of the hinge region of the large-scale multilayer fold structure in the eastern wall of pillar C50. The large-scale fold is tight and angular. On the limbs, smaller-scale asymmetric folds commonly occur, forming a characteristic Z and S shape. More complex geometry is observed in the hinge of the fold, where different folds develop depending on the distance between dark layers. The black layer in Fig. 4b, embedded in relatively thick light-coloured (white and bright grey) beds, locally develops geometries characteristic for a large-amplitude single-layer buckle fold (indicated with a black arrow in Fig. 4b). Close spacing between the black and yellow–brown layers in Fig. 4c leads to development of the two multilayer packages that behave as effectively two layers. These “two layers” form 10–40 cm scale folds with close to tight geometry and subrounded to angular hinges. Note that locally the very thin yellow–brown layers form smaller-scale folds (indicated with a black arrow in Fig. 4c). The bright layer separating the two layers is characterised by considerable thickness variation compared to the other “layers”. Fold shapes with angular hinges shown in Fig. 4d develop in the multilayer package; the ratio of spacing between the black and yellow–brown layers and their thickness is ca. 1. Note the folded yellow–brown layer embedded within the black layer (indicated with a black arrow in Fig. 4d).
Locally, thin-layer greyish bands within the white material (indicated with a white arrow in Fig. 4c, f) form folds with angular to sharp hinges. The limbs of the folds are characterised by a wavy shape that follows the shape of the neighbouring layers. The shape of these folds clearly differs from the other examples of folded layers.
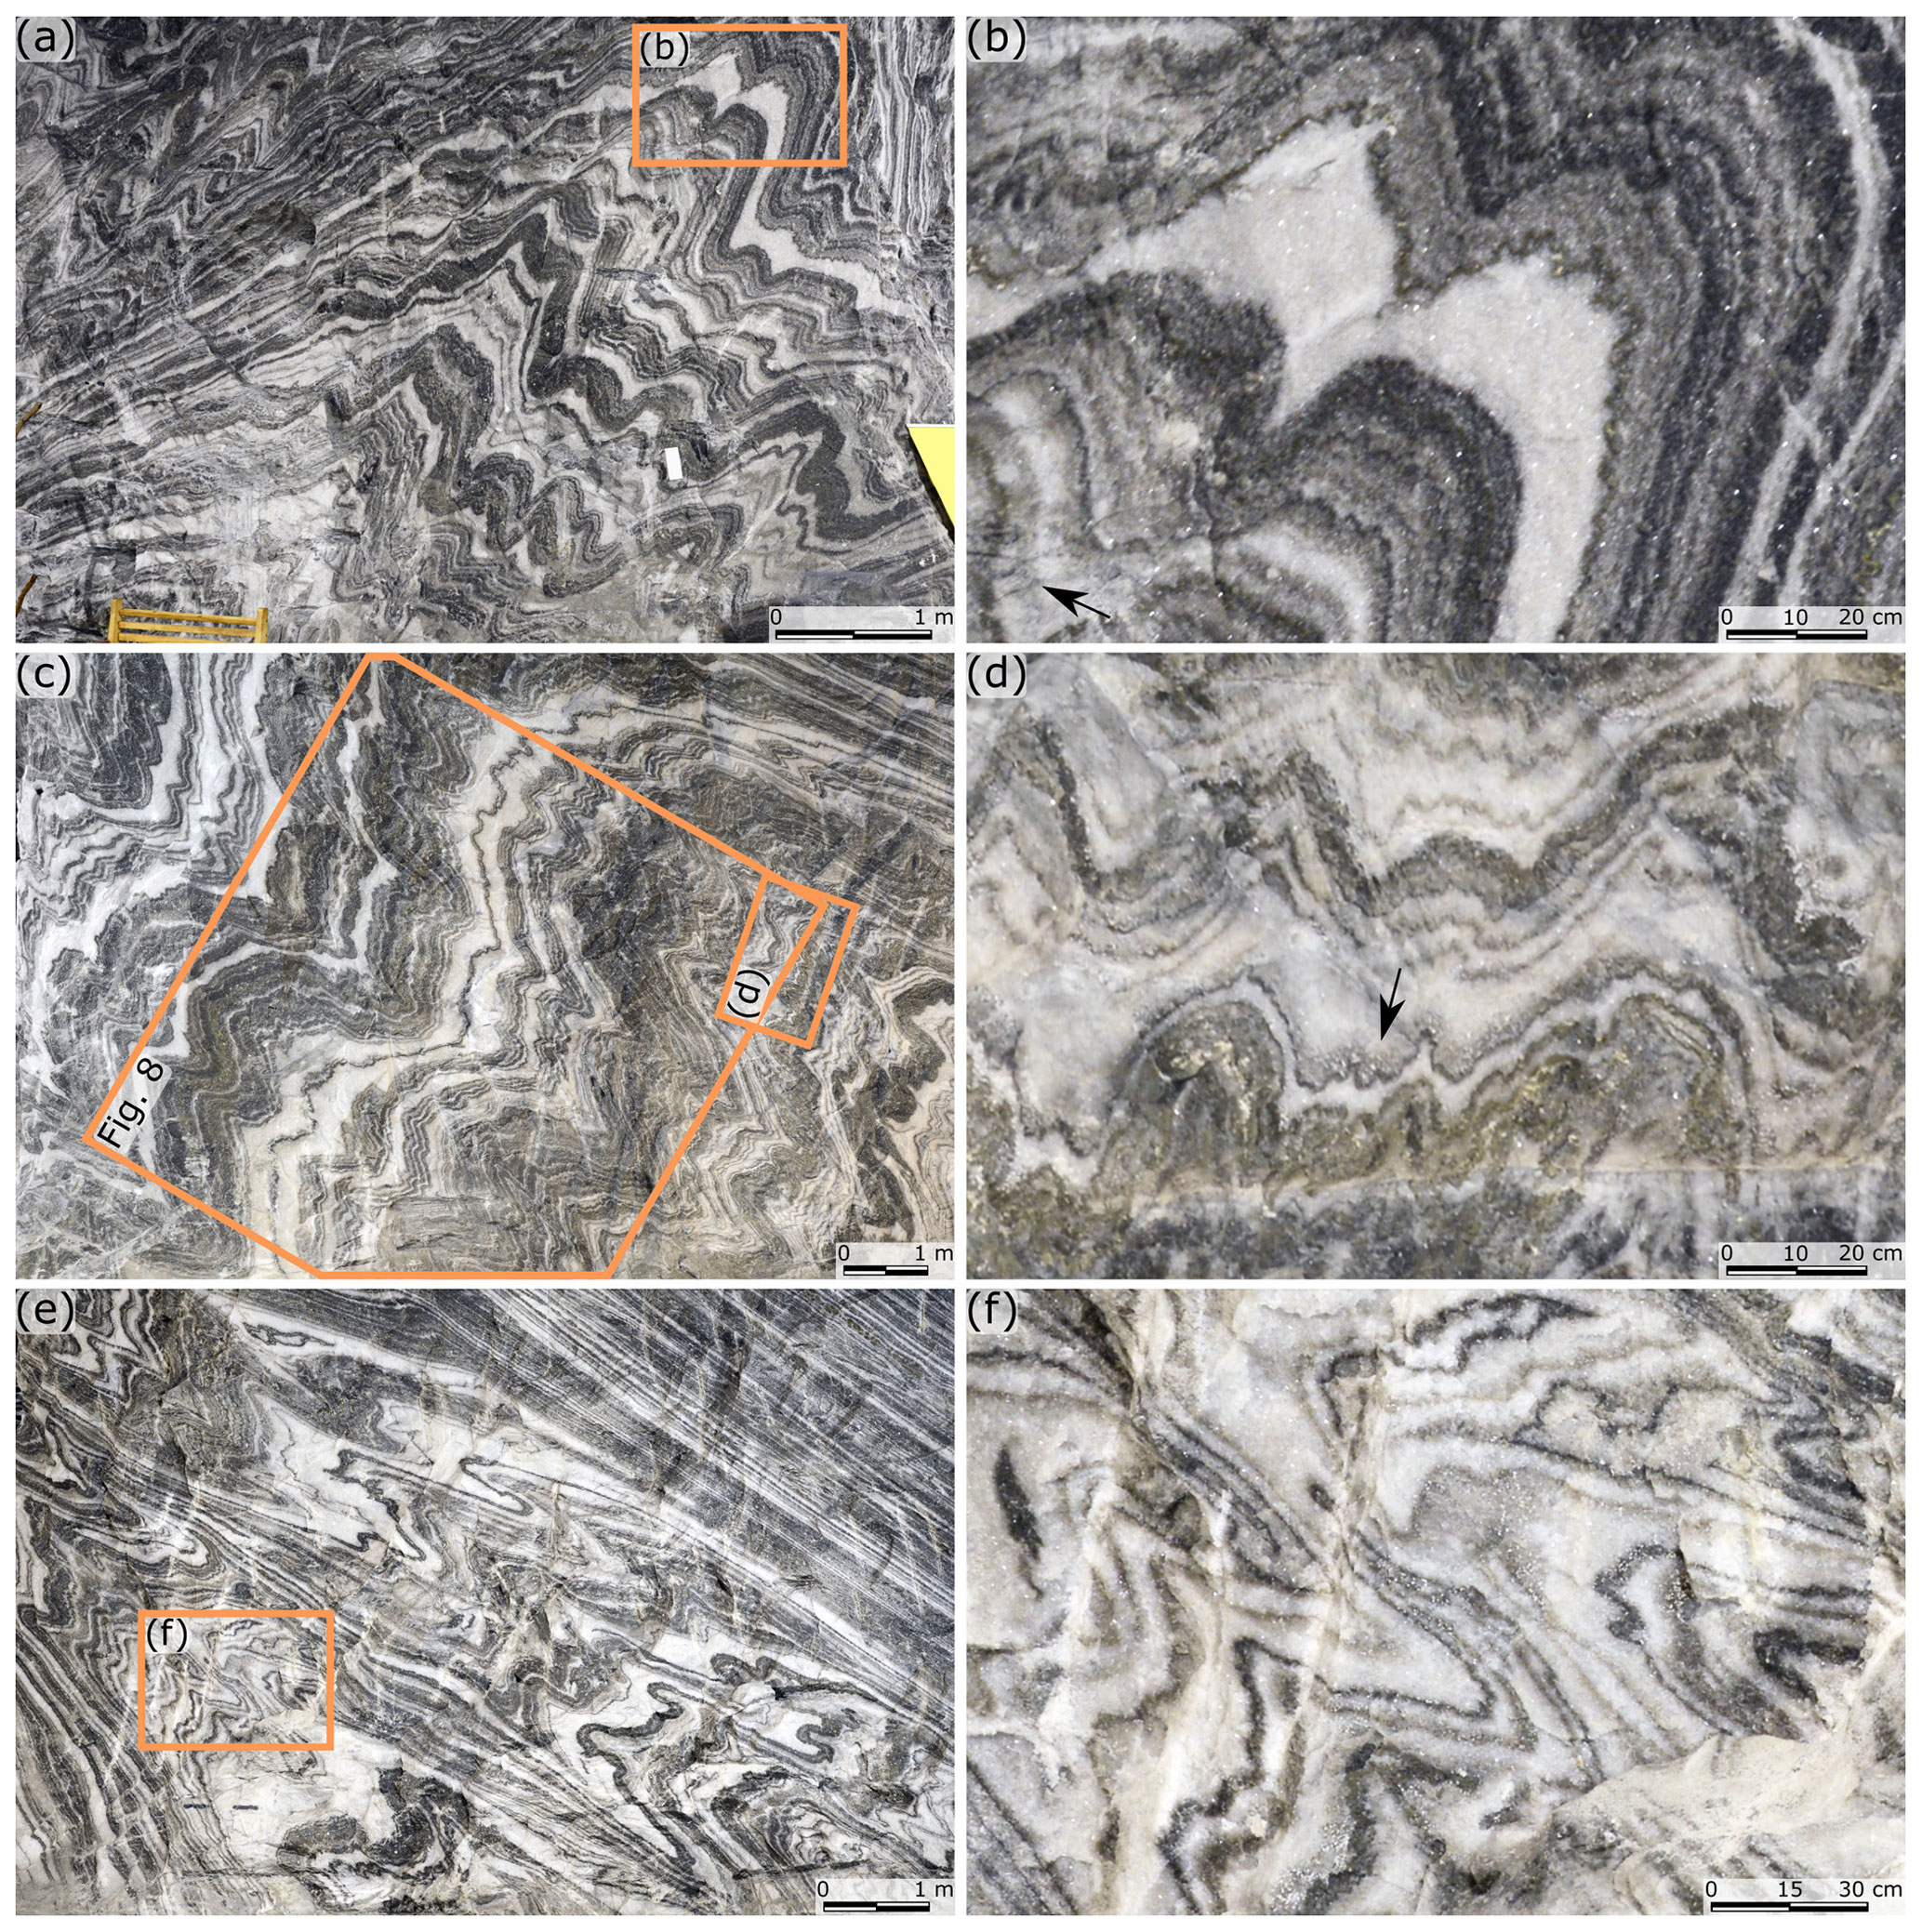
Figure 5Fold structures on the (a, b) western-facing wall of pillar F48, (c, d) eastern-facing wall of pillar E50, and (e, f) eastern-facing wall of pillar D50E. See text for further discussion.
Figure 5a and c illustrate other examples of the polyharmonic folds that develop in the hinge region of the larger-scale folds. Similarly as in Fig. 4, depending on the thickness variation of the individual layers and the spacing between the layers, we observe variable geometry of the fold shapes developing on different scales.
The style of the multilayer folding can change along the layer, which is often a result of the lateral variation of the layer thickness. Moreover, some layers are boudinaged (indicated with white arrows in Fig. 4b, d), whereas others have locally diffuse boundaries (indicated with black arrows in Fig. 5b, d).
Refolded folds have been observed in several pillars, the floor, and the ceiling (Fig. 5e, f). These are not common and they only locally affect the morphology of the folds discussed here, but the examples are consistent with strong deformation before the folding.
6.2 Polyharmonic folds
To illustrate the geometry of folds at the scale of the mine, we constructed a N–S cross section through the mine (Fig. 6) along the 50 line (see Fig. 2). Between the pillars, layers were correlated by (i) similarities in the multilayer stratigraphy (keeping in mind that layer thickness can vary strongly between fold hinge and fold limb and that not all layers in one pillar are laterally continuous) and (ii) by tracing layers from one pillar to the next along the ceiling and floor (see Fig. 2). The largest-scale folds generally have straight limbs and angular hinges. The fold shapes range from open to isoclinal. They are strongly asymmetric; the short limb is ca. 10–20 m long, whereas the long limb is 30–60 m long. The folds verge south and dip to the north, consistent with top-to-the-south shear in a salt detachment. The fold axes are nearly horizontal: E–W in the western part of the mine and NW–SE in the east (Fig. 7a). The orientation of the foliation changes from north-dipping in the western side of the salt mine (Fig. 7b; pillar lines 45–48) to northeast-dipping in the eastern side of the salt mine (Fig. 7c; pillar lines 48–52).
We select an excellent, representative exposure of the polyharmonic folds in the multilayer package from the eastern-facing wall of pillar E50 for a detailed fold shape analysis (see Fig. 2a). We rotate the image so the axial planes of the large-scale fold structure are vertical and indicate the top direction with an arrow (compare Figs. 5c and 8). The package consists of interbedded dark and white layers of different thicknesses. In the sequence, we distinguish five domains, which comprise a set of closely spaced layers, and refer to them as D1–D5 (see Fig. 8a). Most of the layers are dark grey, and yellow–brown layers are only found locally.
The multilayer sequence exhibits multiple orders of folding (second, third, and fourth), which we further refer to as large, middle, and small scale, respectively. The structures in the pillar are located in the hinge area of the largest first-order fold structure that we have identified on the mine scale (see Fig. 6). In Fig. 8a, three selected interfaces (marked with black curves) in the D1, D2, and D4 domains illustrate large-, middle-, and small-scale folds, respectively.
All dark layers are characterised by a less variable thickness compared to the white layers and are thus considered to have higher viscosity (e.g. see the white layers embedding the D4 domain). The minimum layer shortening estimated based on the relation between the layer arclength and layer length varies between 35 % and 45 % depending on the layer.
All the layers within the package exhibit a common harmonic geometry with approximately similar wavelength and amplitude. The fold wavelength varies between 60 and 200 cm. The large-scale folds characterise the fold pattern of the relatively thick D1 and D5 domains, which, due to small thickness of the internal white layers, appear as massive units controlling the large-scale deformation. The folds are reasonably symmetric in the hinge regions. The interlimb angles vary around 90∘, and folds can be classified as open (according to Fleuty, 1964). Locally, where the individual dark layers are embedded in a thicker white salt, we can observe even smaller-scale fold structures developing within the domains.
Middle-scale folds are visible in the D2 and D3 domains. Both domains are composed of white and dark layers of approximately similar thicknesses. Folds that developed on the long limbs of higher-order folds are slightly asymmetric and show typical Z and S geometry (Fig. 8b). The folds show gentle to open geometry with rounded hinges. Typical fold wavelength varies between 15 and 30 cm.
The small-scale folds reveal wavelengths of 1–5 cm scale and are characteristic of the D4 domain. The domain contains a thicker lower and a thinner upper dark layer interbedded with a white layer (Fig. 8c). The lower layer is ca. 1 cm thick and shows a clear folding pattern. Folds have variable open to tight geometry with no significant shape asymmetry. The thin layer has less than 0.2 cm in thickness and generally illustrates low-amplitude, gentle folds. D4 is embedded in the relatively thick white layers. The whole domain follows the large-scale fold geometry, whereas we do not observe clear undulations characteristic for the middle-scale wavelength.
6.3 Fold shape analysis
Single dark-layer folds surrounded by a thick white layer are rare in Ocnele Mari. However, a selected fragment of the bottom dark layer in the D4 domain is used to estimate the viscosity ratio between the layers using FGT (Fig. 9a). Figure 9b shows the positions of hinges and inflection points determined by the toolbox, whereas Fig. 9c–d illustrates the diagram of the viscosity ratio estimates by the Fletcher and Sherwin (1978) and Schmalholz and Podladchikov (2001) methods, respectively. Two dark dots in the plots indicate the analysis for the two interfaces. The method by Fletcher and Sherwin (1978) yields a viscosity ratio in a range between 10 and 20. Stretch, at which the wavelength selection took place, is ca. 0.55. The viscosity ratio estimated using Schmalholz and Podladchikov (2001) for the mean values of the fold-amplitude-to-wavelength ratio () and the mean thickness-to-wavelength ratio () ranges between 10 and 25. The amount of total shortening is around 40 %.
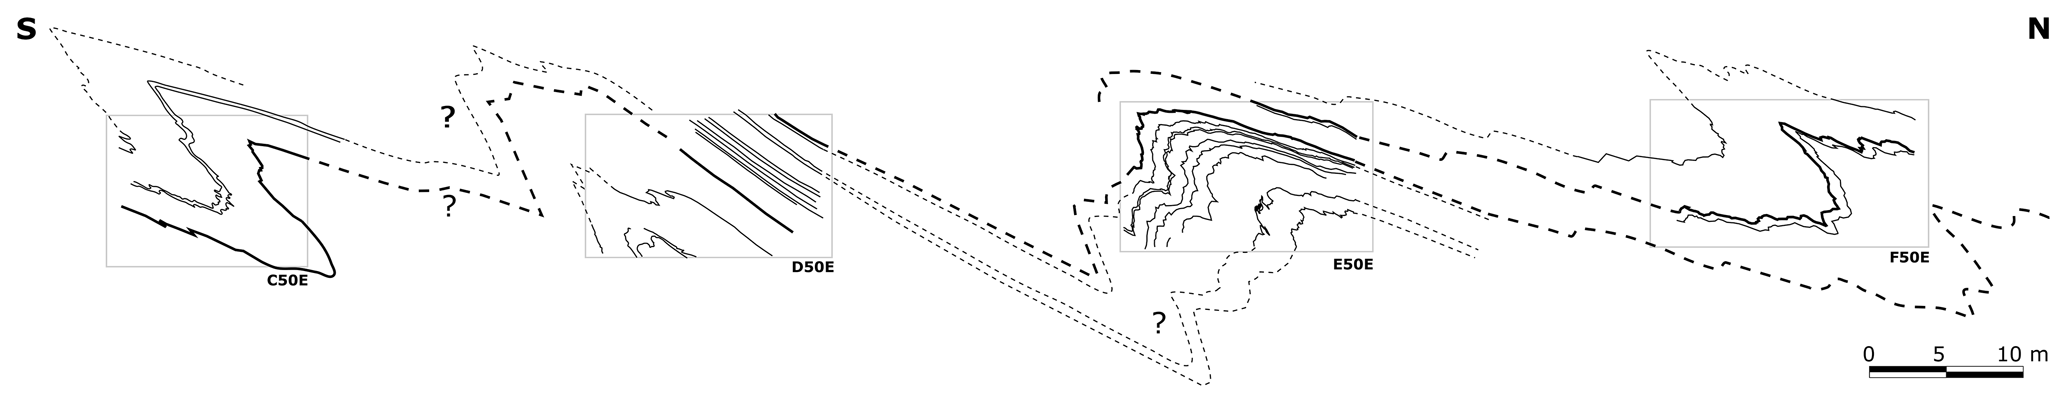
Figure 6Cross section across the mine along the eastern side of pillar line 50 (see Fig. 2 for overview). Rectangular boxes illustrate the position of pillars. Dashed lines indicate correlations between pillars based on layer morphology and observations on the ceiling and floor as well as the other sides of the pillars.
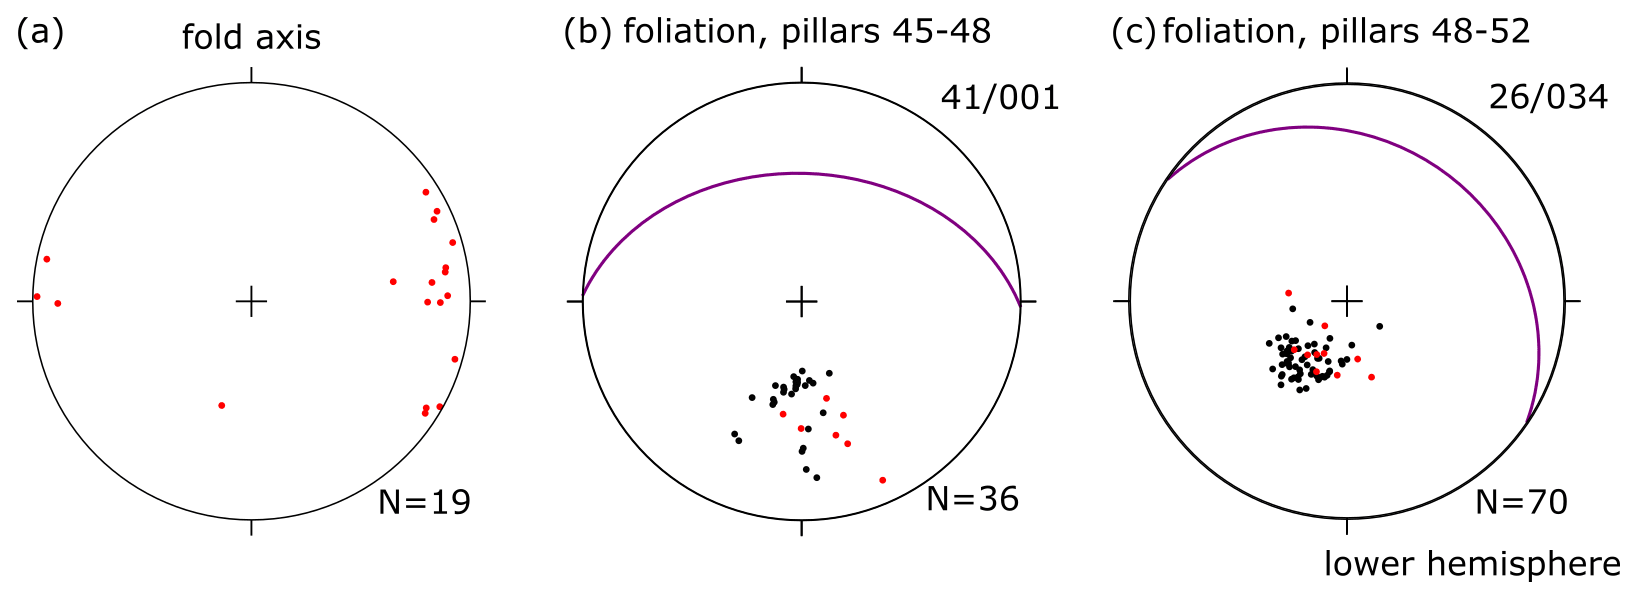
Figure 7Lower-hemisphere stereonet plots showing (a) fold axes (all measured with the compass) and (b, c) poles to measured foliations and average orientation as a great circle. Black poles resulted from the interpretation of the 3D digital models of the mine, while the red poles were measured in the field.
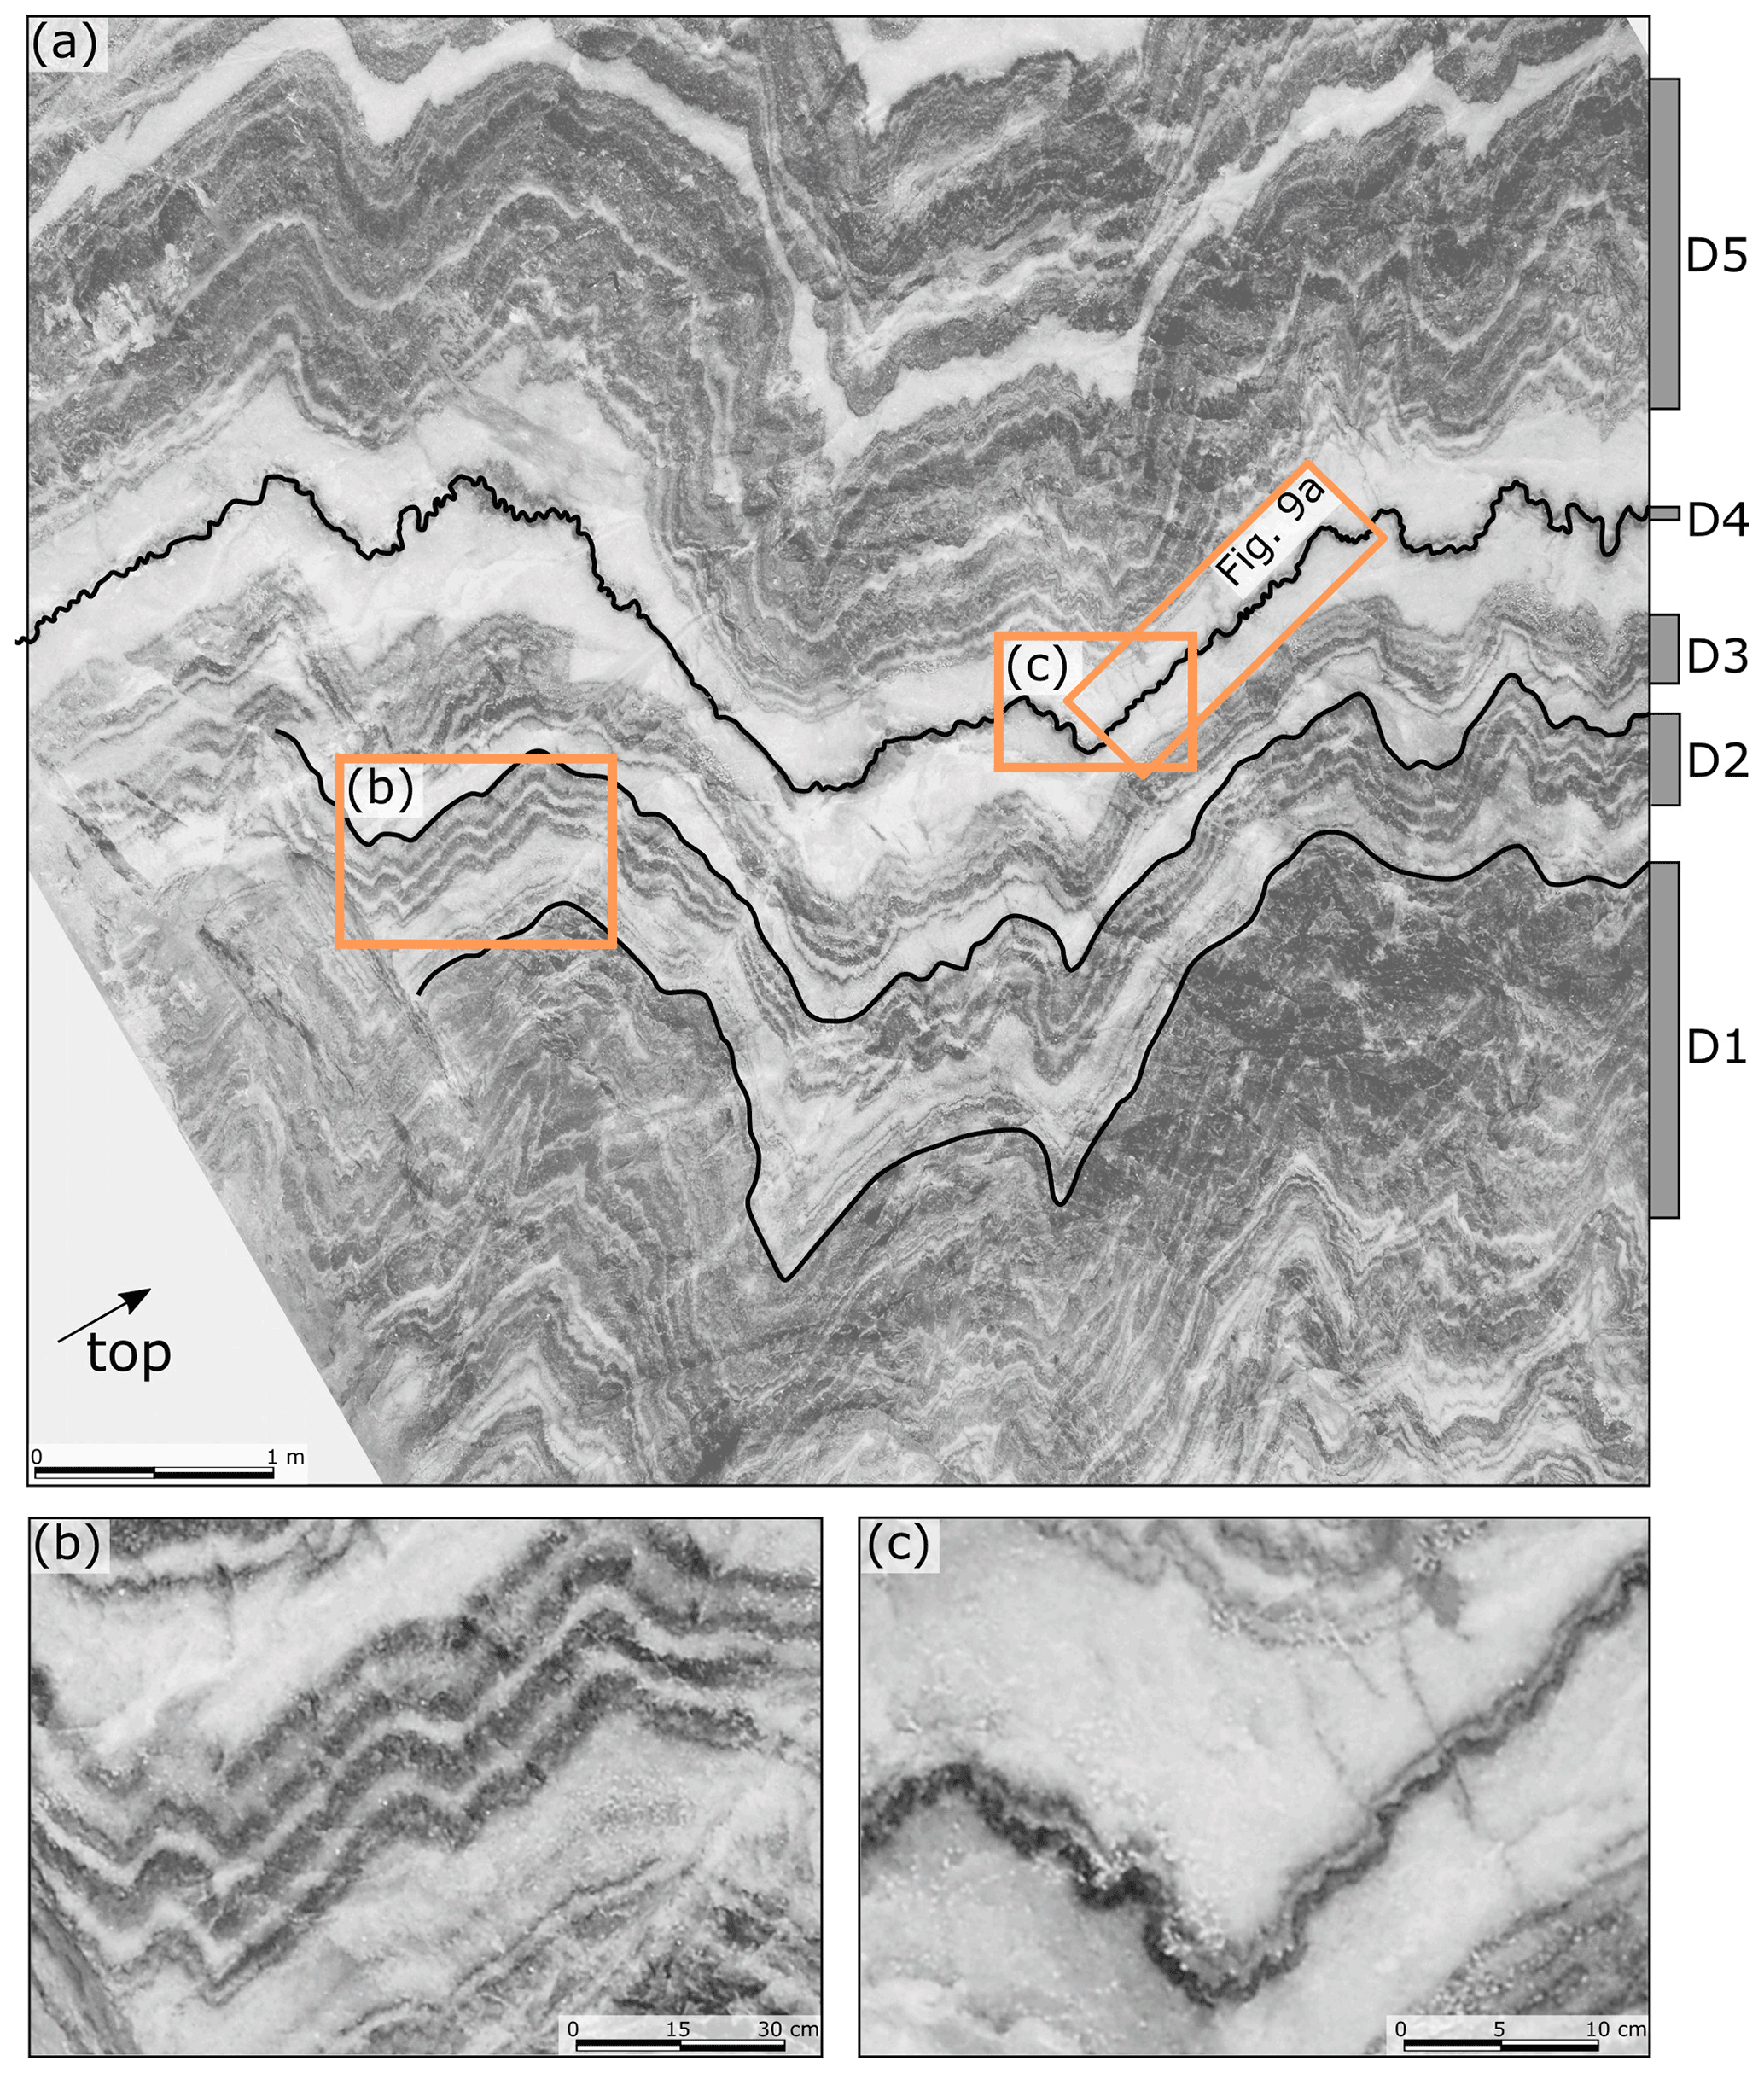
Figure 8(a) Polyharmonic fold structures observed on the eastern-facing wall of pillar E50 (Fig. 5c), which were used for the numerical modelling. Black lines trace the layer interfaces, which illustrate (from the bottom) large-, middle-, and small-scale fold structures. Panels (b) and (c) show a zoom-in of the middle- and small-scale fold structures. Note that the photo is rotated and the arrow in (a) points upwards.
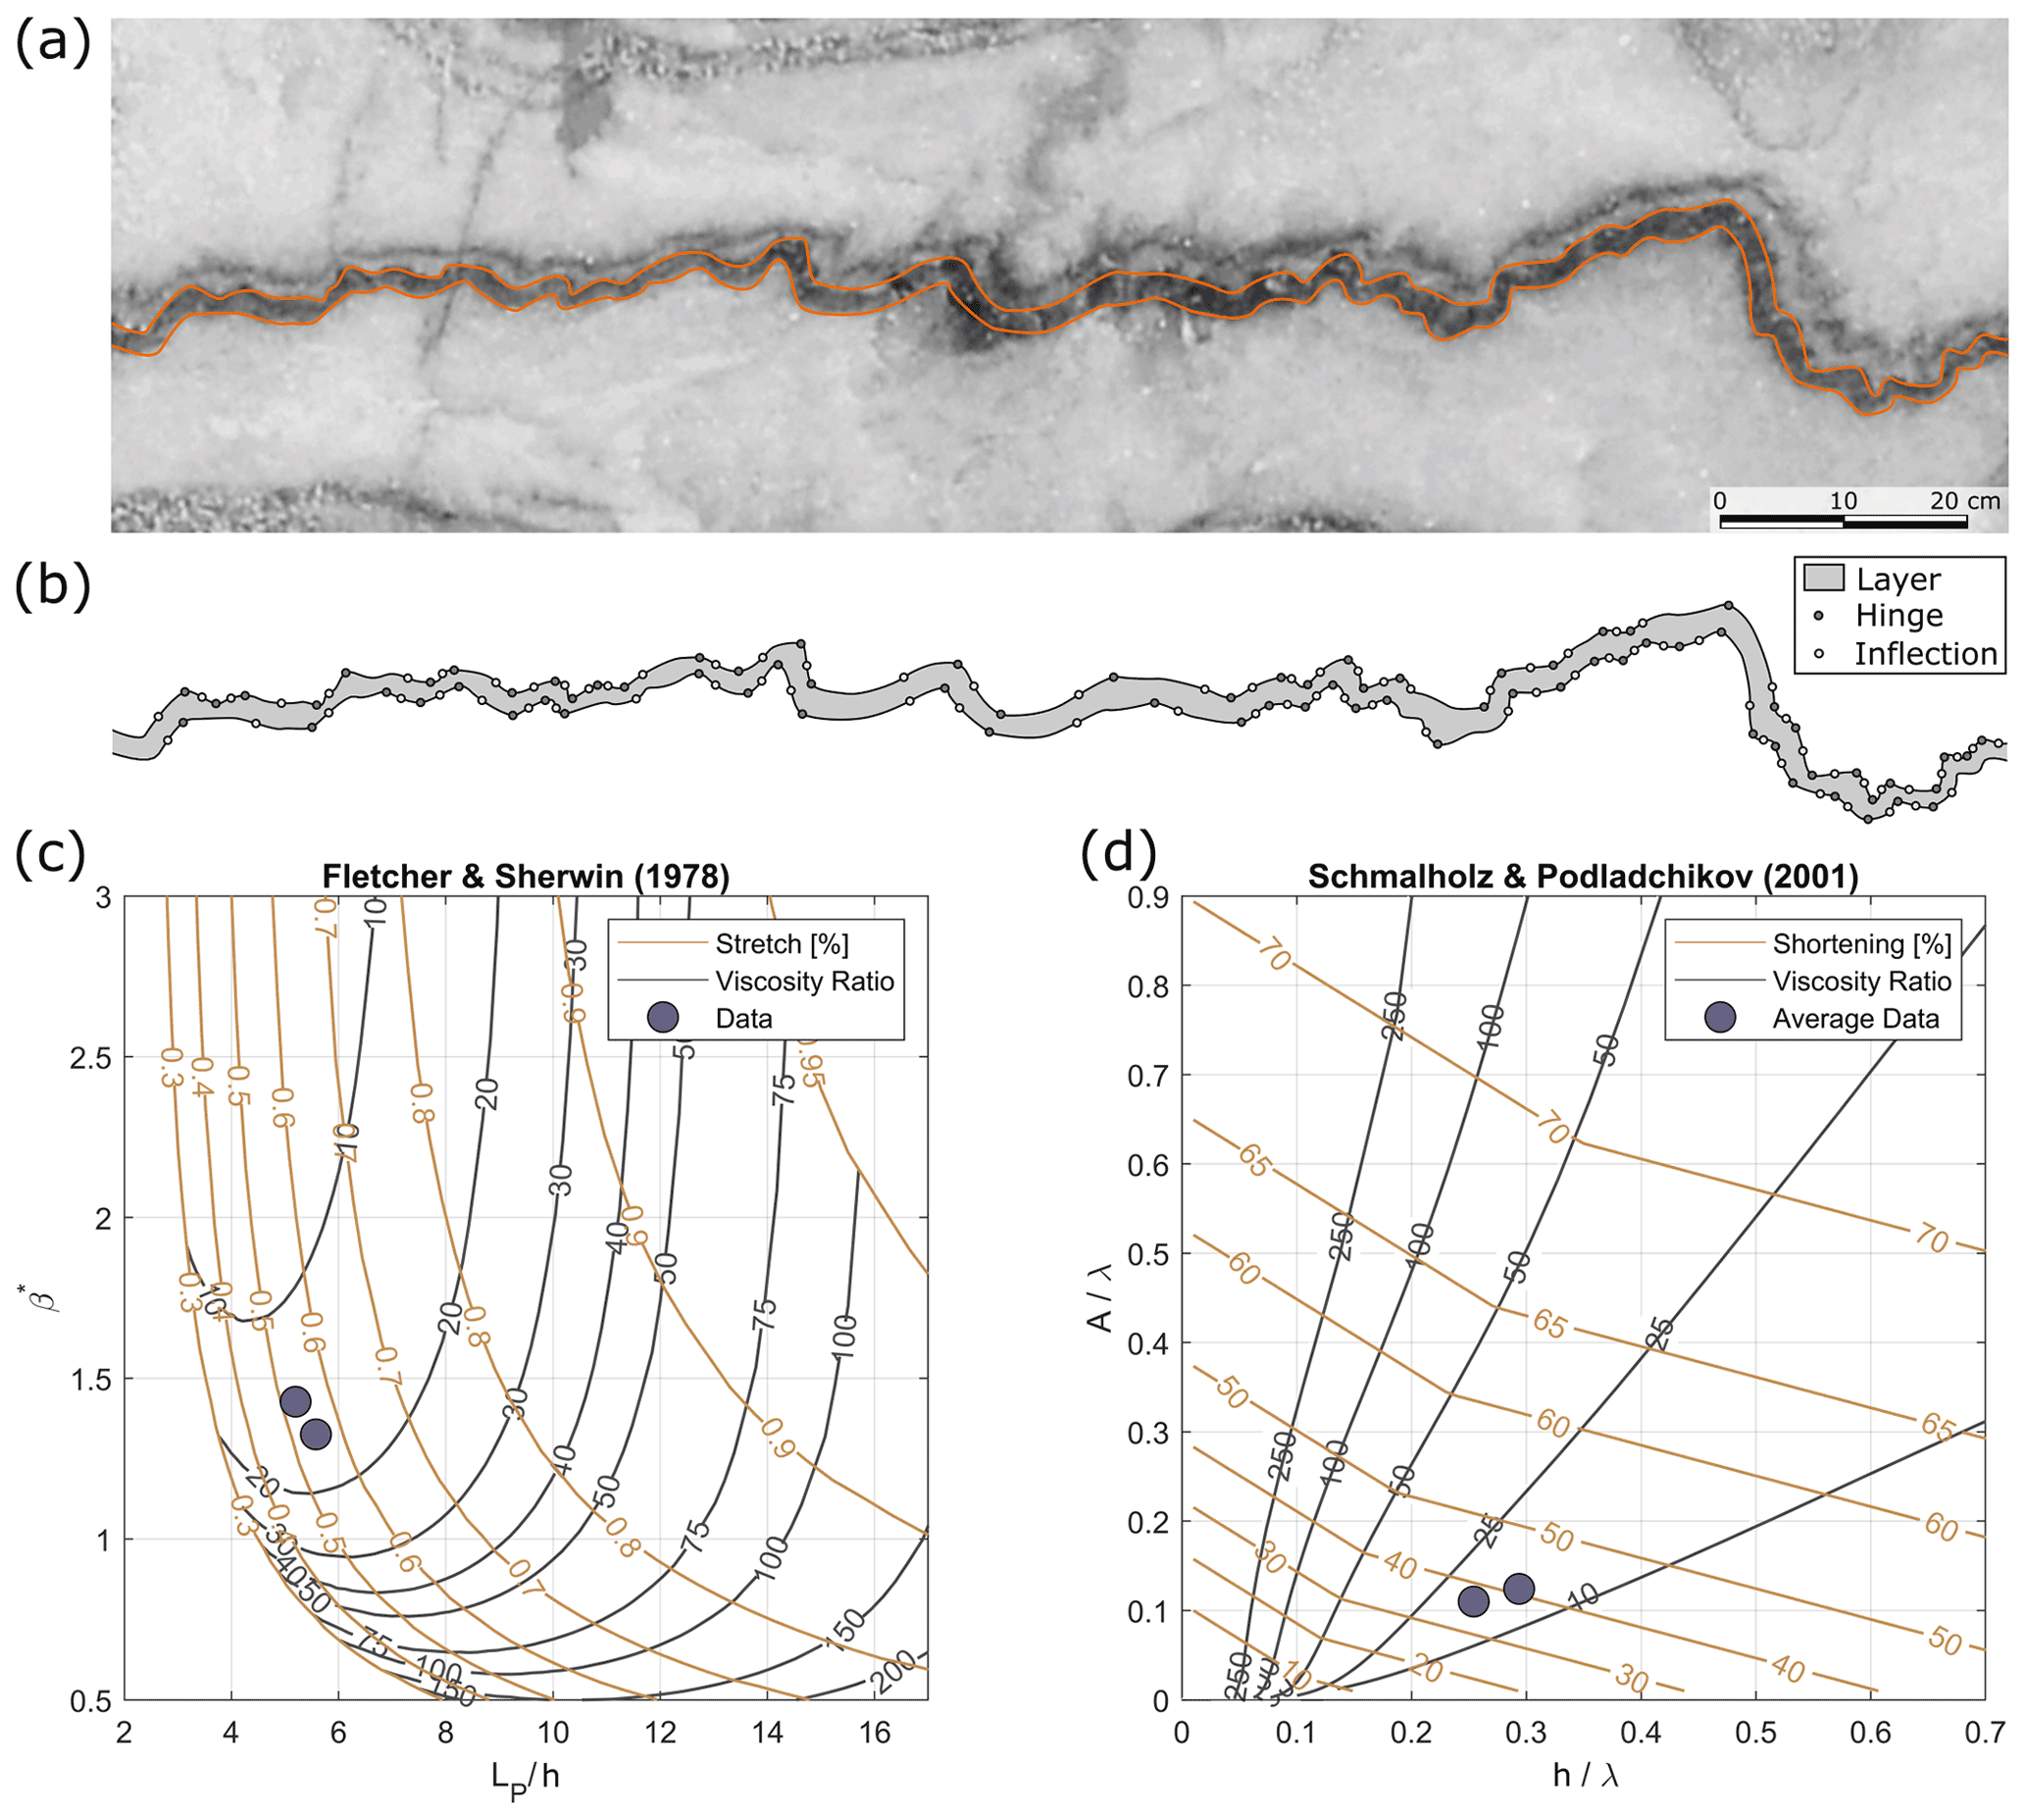
Figure 9Fold shape analysis using FGT. (a) Small-scale fold structure (Fig. 8a). (b) Position of inflection points and hinges. (c) Estimates of layer-parallel shortening stretch and viscosity ratio after Fletcher and Sherwin (1978). (d) Estimates of shortening and viscosity ratio after Schmalholz and Podladchikov (2001).
6.4 Microstructure
Microstructural investigations of the Ocnele Mari salt were performed based on two hand specimens that show different yet individually rich rock fabrics. The samples are representative of the white, grey, and beige bands present in the pillars (Fig. 10a, b) and contain one of the thin darkest layers shown in Figs. 4 and 5. Sample RO-OM-01 is a small fold representing the hinge areas discussed above (sectioned perpendicular to the fold axis), and RO-OM-02 is a sample with straight foliation (Fig. 11), inferred to represent the limbs of the folds studied.
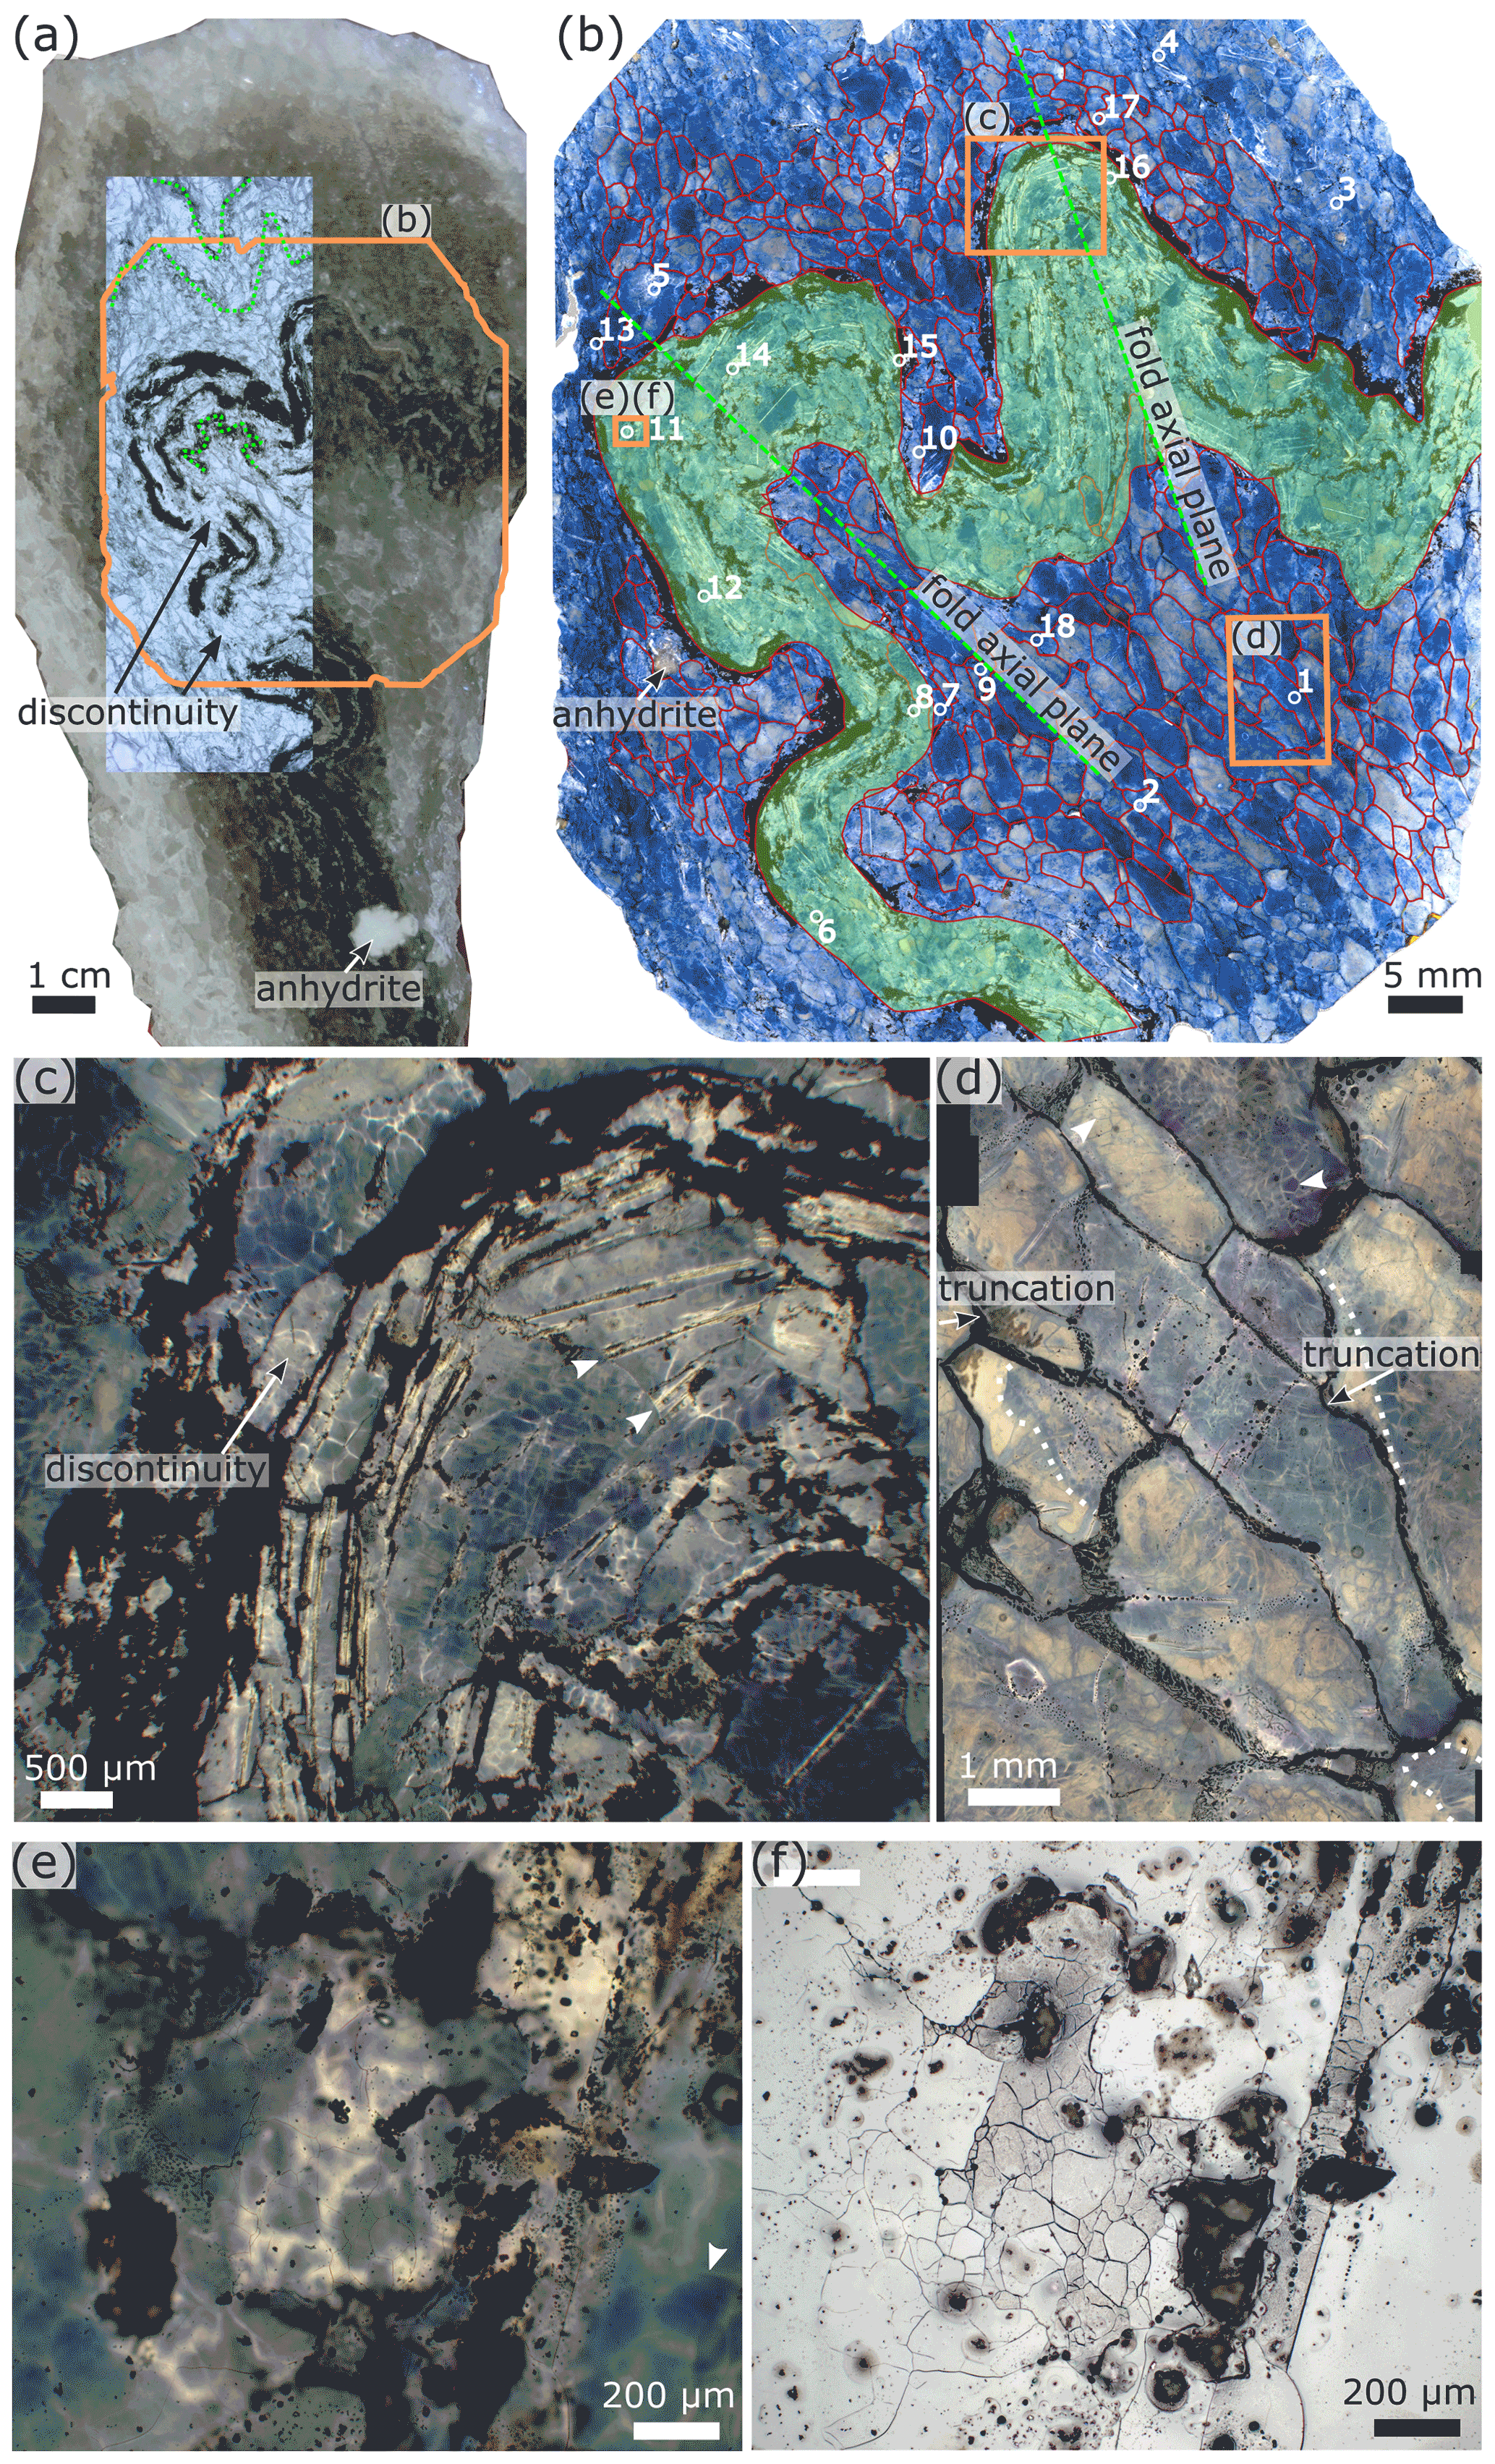
Figure 10(a) Hand specimen RO-OM-01 with a photomontaged transmitted light image of the thin section, showing white salt in the matrix and folded multilayers in the centre surrounded by dark salt. Green lines indicate folded millimetre-scale inclusion-rich halite layers. (b) Transmitted light image of gamma-irradiated thin section of sample RO-OM-01 with blue decoration of halite microstructures and traced halite grain boundaries. Folded salt with elongated claystone fragments is highlighted in green. Numbering (1–18) indicates halite grains that were used for subgrain size piezometry (reflected light micrographs and measurements are provided in Supplement S1.1 and S1.2). (c) Transmitted light micrograph of a fold hinge showing subgrains in gamma-decorated halite and aligned cubic fluid inclusion bands following the orientation of the fold; the location is indicated in (b). Arrows point to the grain boundary of a halite grain that is overgrowing fluid inclusion bands of the neighbouring grain. (d) Transmitted light micrograph of white salt showing elongated halite grains rich in subgrains and overgrowth rims (dotted lines); the location is indicated in (b). Arrows indicate blue and white subgrain boundaries. (e) Transmitted light micrograph of halite showing decorated white subgrains and impurities as well as fluid films at halite grain boundaries; the location is indicated in (b). The arrow points to a subgrain boundary visible through gamma decoration but not visible on the etched surface in panel (f). (f) Reflected light micrograph of the image in (e) showing etched subgrains in a halite grain with darker reflectance and also subgrain-free halite grains; the location is indicated in (b).
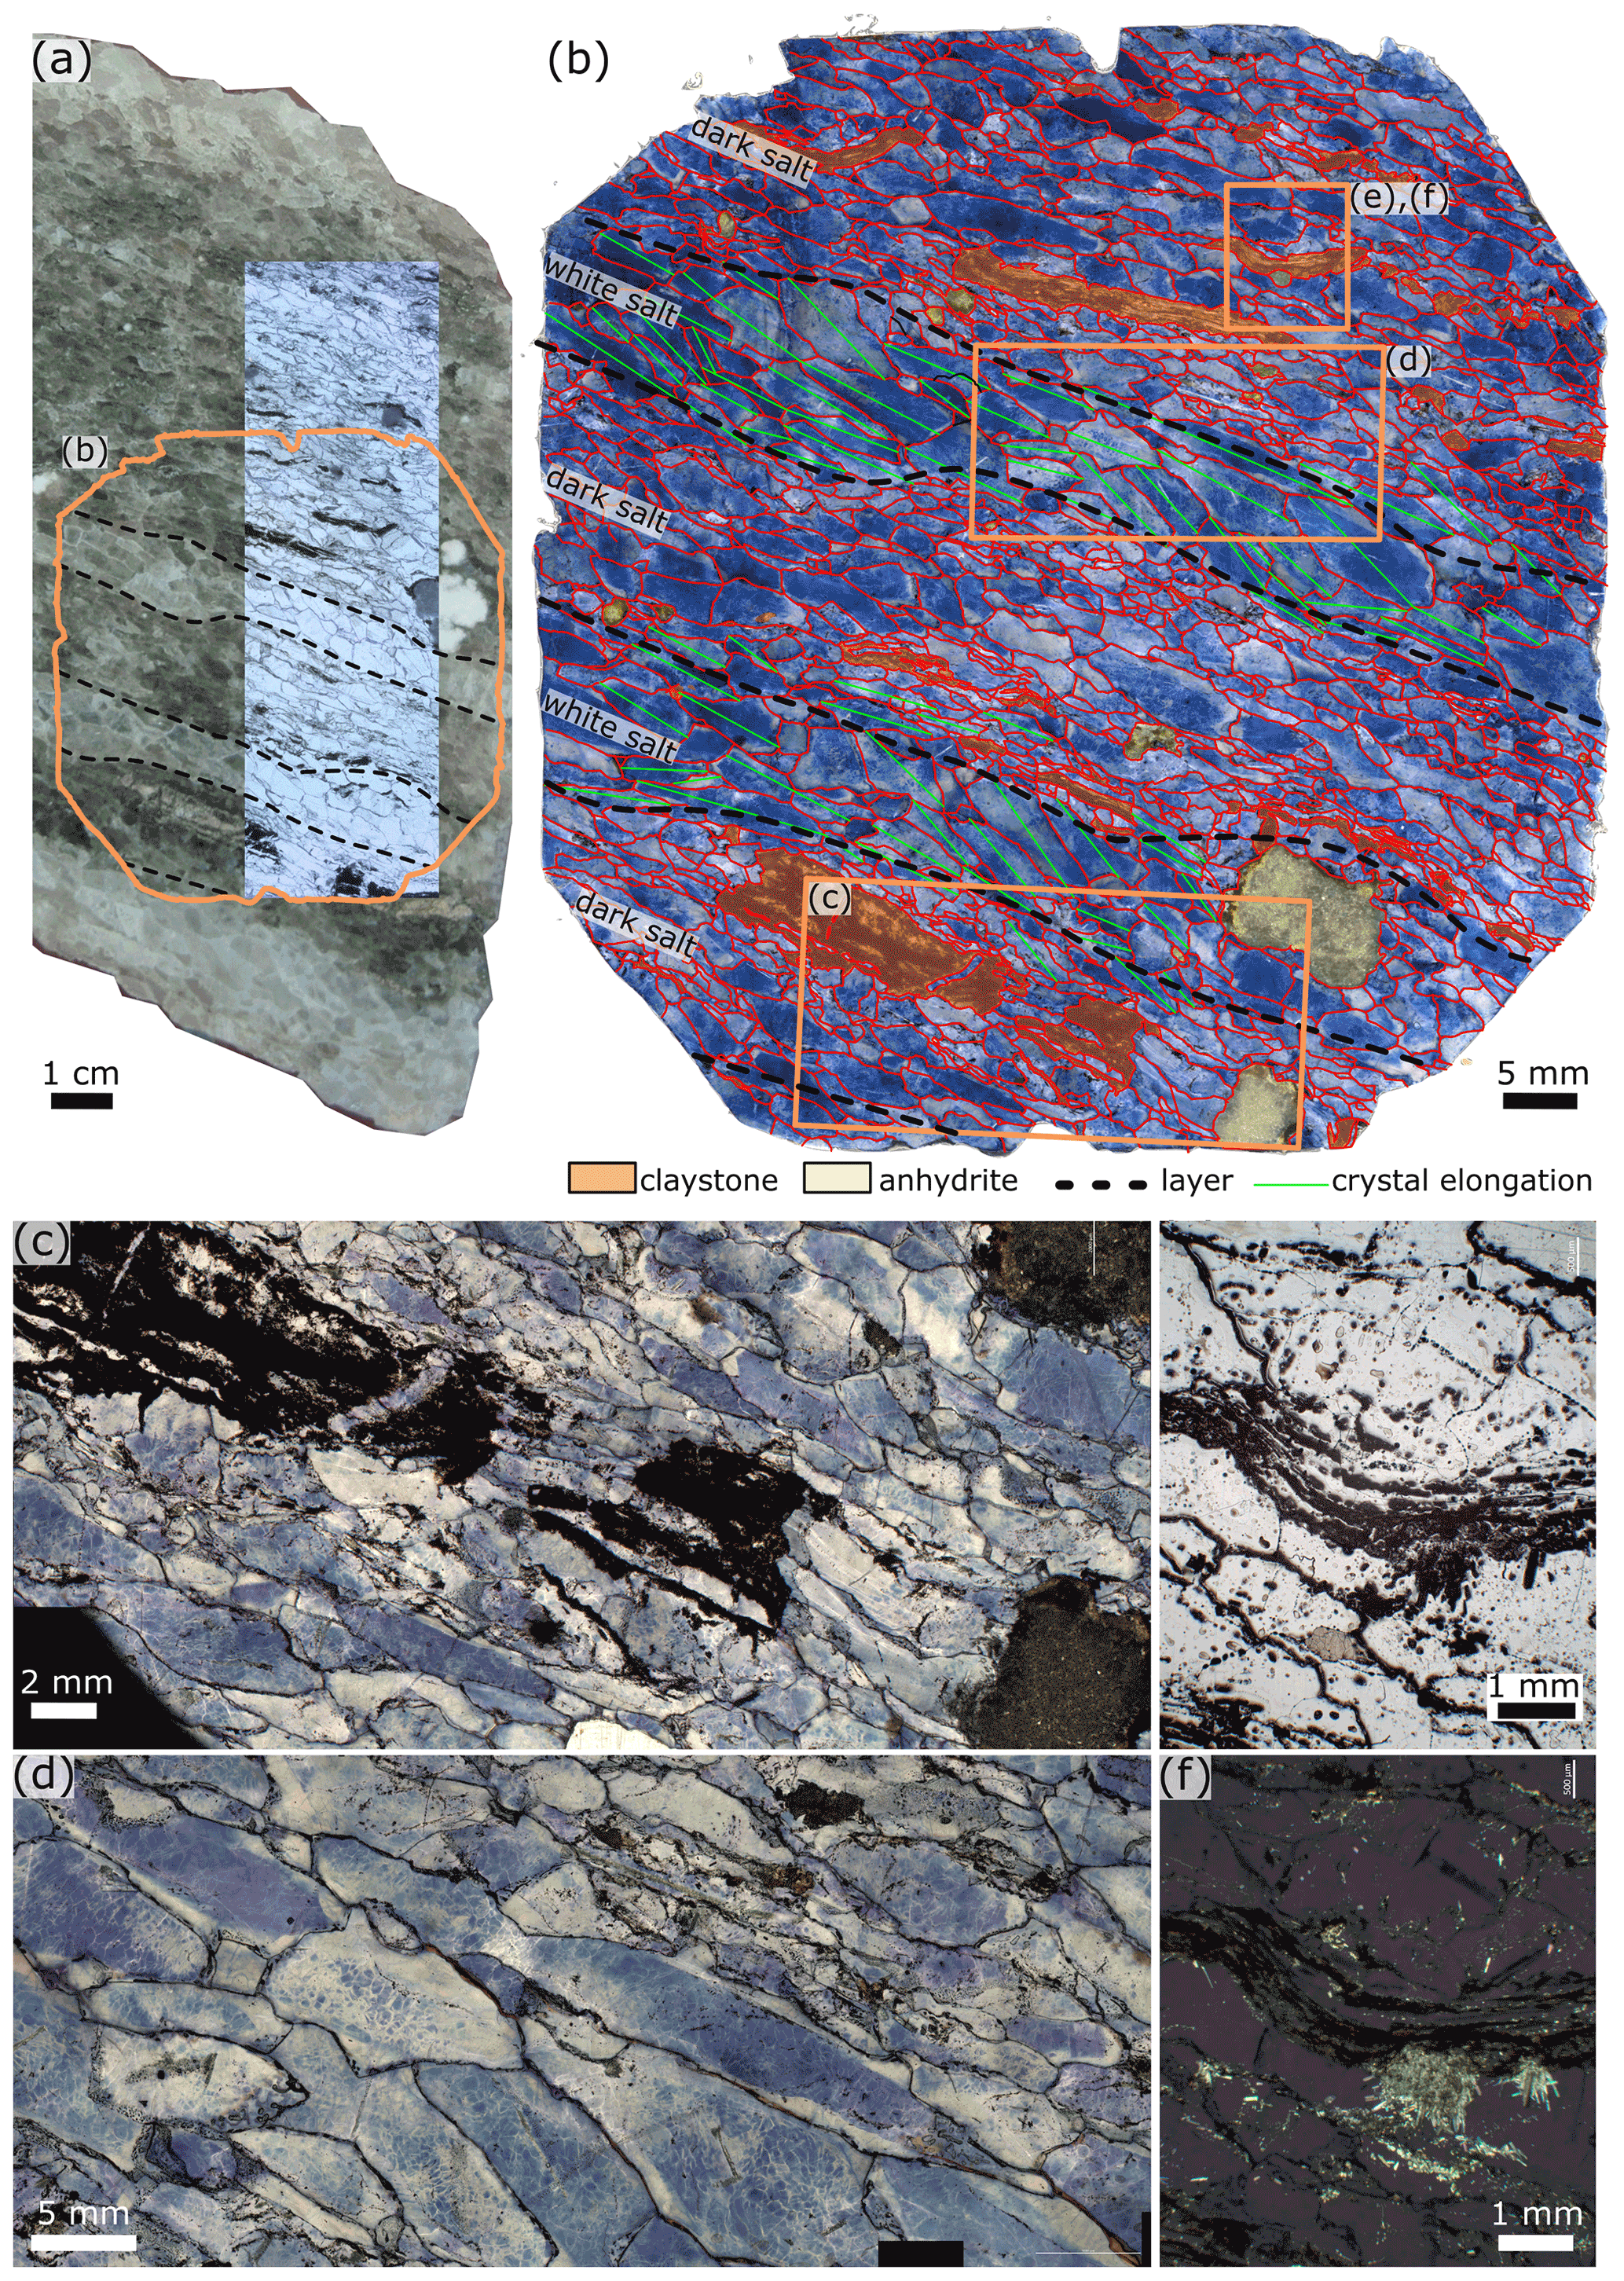
Figure 11(a) Hand specimen RO-OM-02 with a photomontaged transmitted light image of the thin section, showing bands of white and dark salt with elongated fragments parallel to the foliation. (b) Transmitted light image of a gamma-irradiated thin section of sample RO-OM-02 with blue decoration of halite microstructures and traced halite grain boundaries. Elongated claystone fragments, anhydrite, and salt layer boundaries are indicated. (c) Transmitted light micrograph showing a boudinaged claystone aggregate with thin layers of halite and fibrous halite in the boudin neck; the location is indicated in (b). (d) Transmitted light micrograph of elongated halite grains showing subgrain-free and subgrain-rich halite cores with white overgrowth rims; the location is indicated in (b). (e) Reflected light micrograph of grey salt and bent claystone particle as well as smaller inclusions between halite crystals; the location is indicated in (b). (f) Cross-polarised transmitted light micrograph showing anhydrite accumulation next to a claystone particle and smaller high-interference minerals at halite grain boundaries; the location identical to (e) is indicated in (b).
6.4.1 White salt
The white salt in both samples is clear halite, with elongated halite crystals with an average grain size of 2.1 mm (larger grains of up to 10 mm and an average aspect ratio of 2.8 in sample RO-OM-01). Digitised grain boundaries and inclusions of sample RO-OM-02, as well as grain size measurements, are provided in Supplement S2.1 and S2.2. In sample RO-OM-02, halite grains of the white salt around a large anhydrite inclusion are smaller, with an average grain size of 1.6 mm. In sample RO-OM-01, the grains' long axes are parallel to the axial plane in the fold cores and parallel to the folded layer outside the fold (Fig. 10b). In sample RO-OM-02, the grains' long axis orientations are sub-parallel to the layering (Fig. 11b). The grain boundaries in the white salt are mostly straight or slightly curved, with locally lobate morphologies (Figs. 10e and 11c, e).
Gamma decoration of white salts in sample RO-OM-01 shows mostly light or dark blue grain cores with white growth bands, which are locally truncated (Fig. 10d). Light grain cores with pale blue rims are also present (Fig. 10d). These can contain transgranular cleavage cracks filled with fluid inclusions and have a pale blue gamma-decorated halo of approximately 80 µm radius. Some grains show decoration of weak slip bands. Subgrains decorated by gamma irradiation can appear as either blue subgrain boundaries in white halite grains or white subgrains in blue halite grains. The white salt halite grains in sample RO-OM-02 usually have dark blue cores with gamma-decorated subgrain boundaries and white rims. Subgrain boundaries appear white in blue halite cores (white arrows in Fig. 10d). It is interesting to note that in both samples, not all subgrains boundaries marked by gamma decoration appear on the etched surfaces under reflected light (Fig. 10e). This is surprising because EBSD studies have shown that the chemical etching procedure is very sensitive and decorates subgrains with even very small misorientations (Trimby et al., 2000); this needs further study. Only the very bright subgrain boundaries visible under transmitted light are also consistently present under reflected light. Grain boundaries show abundant fluid inclusion arrays (Fig. 10d).
6.4.2 Dark salt
The dark salt of both samples RO-OM-01 and RO-OM-02 is rich in second-phase inclusions and consists mostly of halite with elongated aggregates of clay that have an average aspect ratio of 4 and rounded particles of anhydrite with an aspect ratio of 2 (Figs. 10a–b, 11b, and S2.1–S2.2 in the Supplement). Fluid inclusions at grain boundaries and ghost grain boundaries are abundant (Figs. 10f, 11e). Thin layers of second-phase inclusions are commonly boudinaged in both samples (Figs. 10a and c, 11c), folded (Fig. 10a, b) or bent (Fig. 11b). Anhydrite grains in these thin layers are intergrown with the halite matrix (Figs. 10a, 11a, b, e, f), which is best seen in Fig. 11f, where large anhydrite needles penetrate the adjacent halite grain. The boudin necks contain fibrous halite crystals (Fig. 11c) (Leitner et al., 2011). The grey salt halite grain size of 1.3 mm in sample RO-OM-02 is smaller than in the white salt (2.1 mm): the second-phase inclusion-rich salt is consistently finer-grained than the pure salt (Krabbendam et al., 2003) (Supplement S2.1 and S2.2). Sample RO-OM-01 has abundant fluid inclusions inside halite crystals of the dark folded layer that are aligned and parallel to the folded layer. These aligned fluid inclusions are partly overgrown with halite crystals that contain subgrains visible through gamma decoration (Fig. 10c). We observe two approximately 1 mm thick “layers” of impure salt outside the fold, following the fold shape (Fig. 10a).
X-ray diffraction analysis of insoluble residue was conducted for sample RO-OM-02 (Fig. 11a). Results show the presence of anhydrite and gypsum (combined 39 wt %), the clay minerals smectite, muscovite–illite, and chlorite (combined 34 wt %), and minor quartz, orthoclase, albite, dolomite, apatite, and calcite. Individual measurement of larger white particles indicated them to be mostly anhydrite (90 wt %), so we interpret the presence of gypsum as a consequence of anhydrite hydration in water during dissolution in the preparation process. Further, the analysed sample contains 6 wt % of amorphous phases that are interpreted to be organic material. This is supported by the findings of vitrinite within claystone fragments on thin sections under reflected light microscopy. Measurements of vitrinite reflectance indicate a maximum heating temperature of 58 ∘C according to Barker and Pawlewicz (1994).
6.4.3 Subgrains
Gamma decoration illuminates abundant subgrains, mostly visible as blue patches with white subgrain boundaries or white subgrains with delicate blue subgrain boundaries (Figs. 10d, 11d). However, these abundant subgrains are either weakly resolved or not resolved on the etched surface under reflected light. Only a few halite grains show well-defined subgrain boundaries; often these grains have lower reflection (Figs. 10f and S1.1 in the Supplement), and under transmitted light, these subgrain boundaries appear very bright (Fig. 10e). Subgrain size piezometry (Schléder and Urai, 2005) of RO-OM-1 indicates variable mean subgrain sizes for individually measured halite grains with no significant difference between the dark and the white salt (S.1.2 in the Supplement). The halite grains with the smallest subgrains show high differential stresses such as 4 MPa in the case of grain 11 (in Fig. 10b, e, f), with a logarithmic mean subgrain size of 1.65 µm with n=187. Measurements and micrographs of further grains are provided in the Supplement. Grains with larger subgrains such as grain 1 and grain 10 (Fig. 10b) indicate low differential stresses of about 0.4 MPa according to Schléder and Urai (2005). Based on the average subgrain size of all measured grains with subgrains, a differential stress of 2.3 MPa for sample RO-OM-01 was calculated.
6.5 Numerical modelling
6.5.1 Setup
Multilayer fold structures observed on the south side of the E50 pillar (described in detail in Fig. 8) were selected for detailed numerical modelling. We consider a domain comprising a stack of alternating stiff and soft layers with varying thicknesses embedded in the thick soft layers (Fig. 12). We constrain the initial thicknesses of the individual layers by calculating their area and dividing it by their mean layer arclength. The layer area and arclength values are measured from the digitised photo of pillar E50 (Fig. 8a). The estimate assumes two-dimensional plane-strain deformation, no volume loss, and initial constant layer thickness. All the length scale values used in the models are normalised by the thickness of the thinnest layer, href (thin layer in the D4 domain).
The computational model width, , is set to 13 000. The numerical model consists of a multilayer stack containing 91 layers with variable viscosities. The thickness of the stack, , is equal to 800, and the individual layer thickness varies between 1 and 50. On each interface, we initially impose a red noise perturbation. All the layers are treated as incompressible, linear viscous material, and the contacts between the layers are welded.
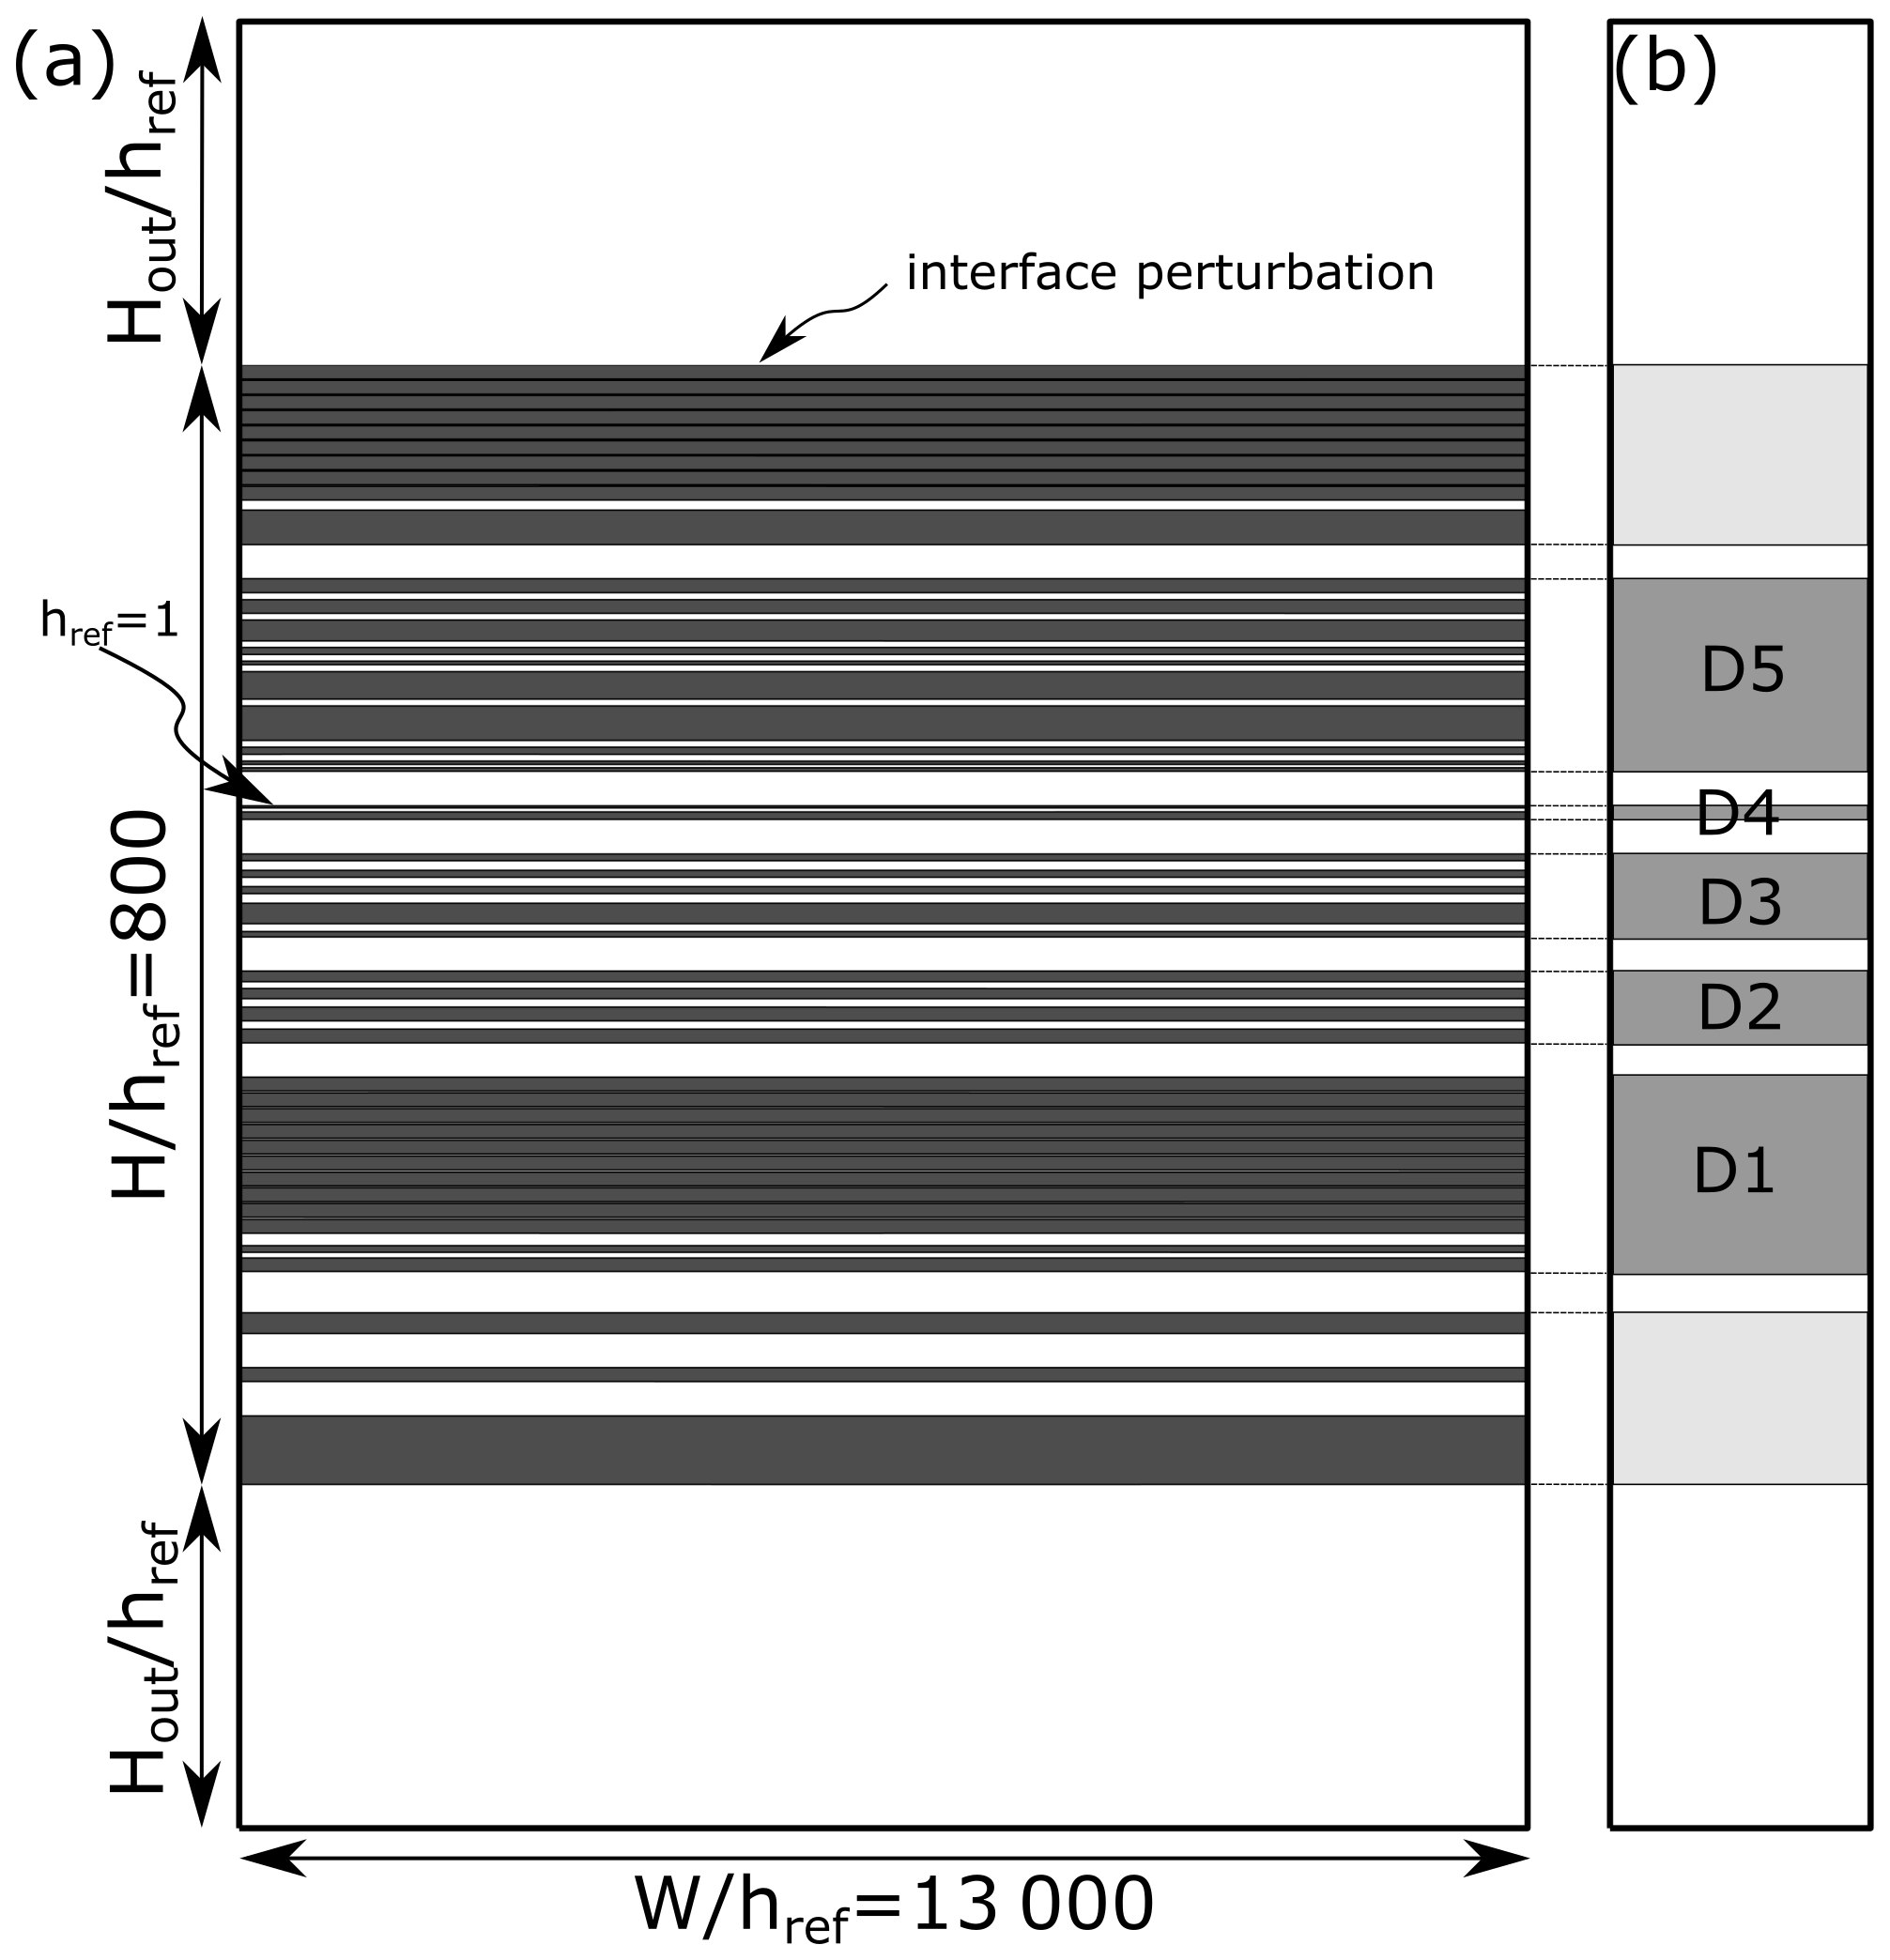
Figure 12(a) Model geometry used in the numerical simulations based on the outcrop shown in Fig. 8. Note that the model has no scale. (b) Domains.
In all the simulations, the normal components of the velocity vectors are prescribed at the boundaries according to a pure shear deformation, and free-slip boundary conditions are used for all the walls. The model is subjected to up to 90 % shortening at the constant rate of deformation. We use high spatial and temporal resolutions. To avoid significant mesh distortion, the model geometry is re-meshed at each time step.
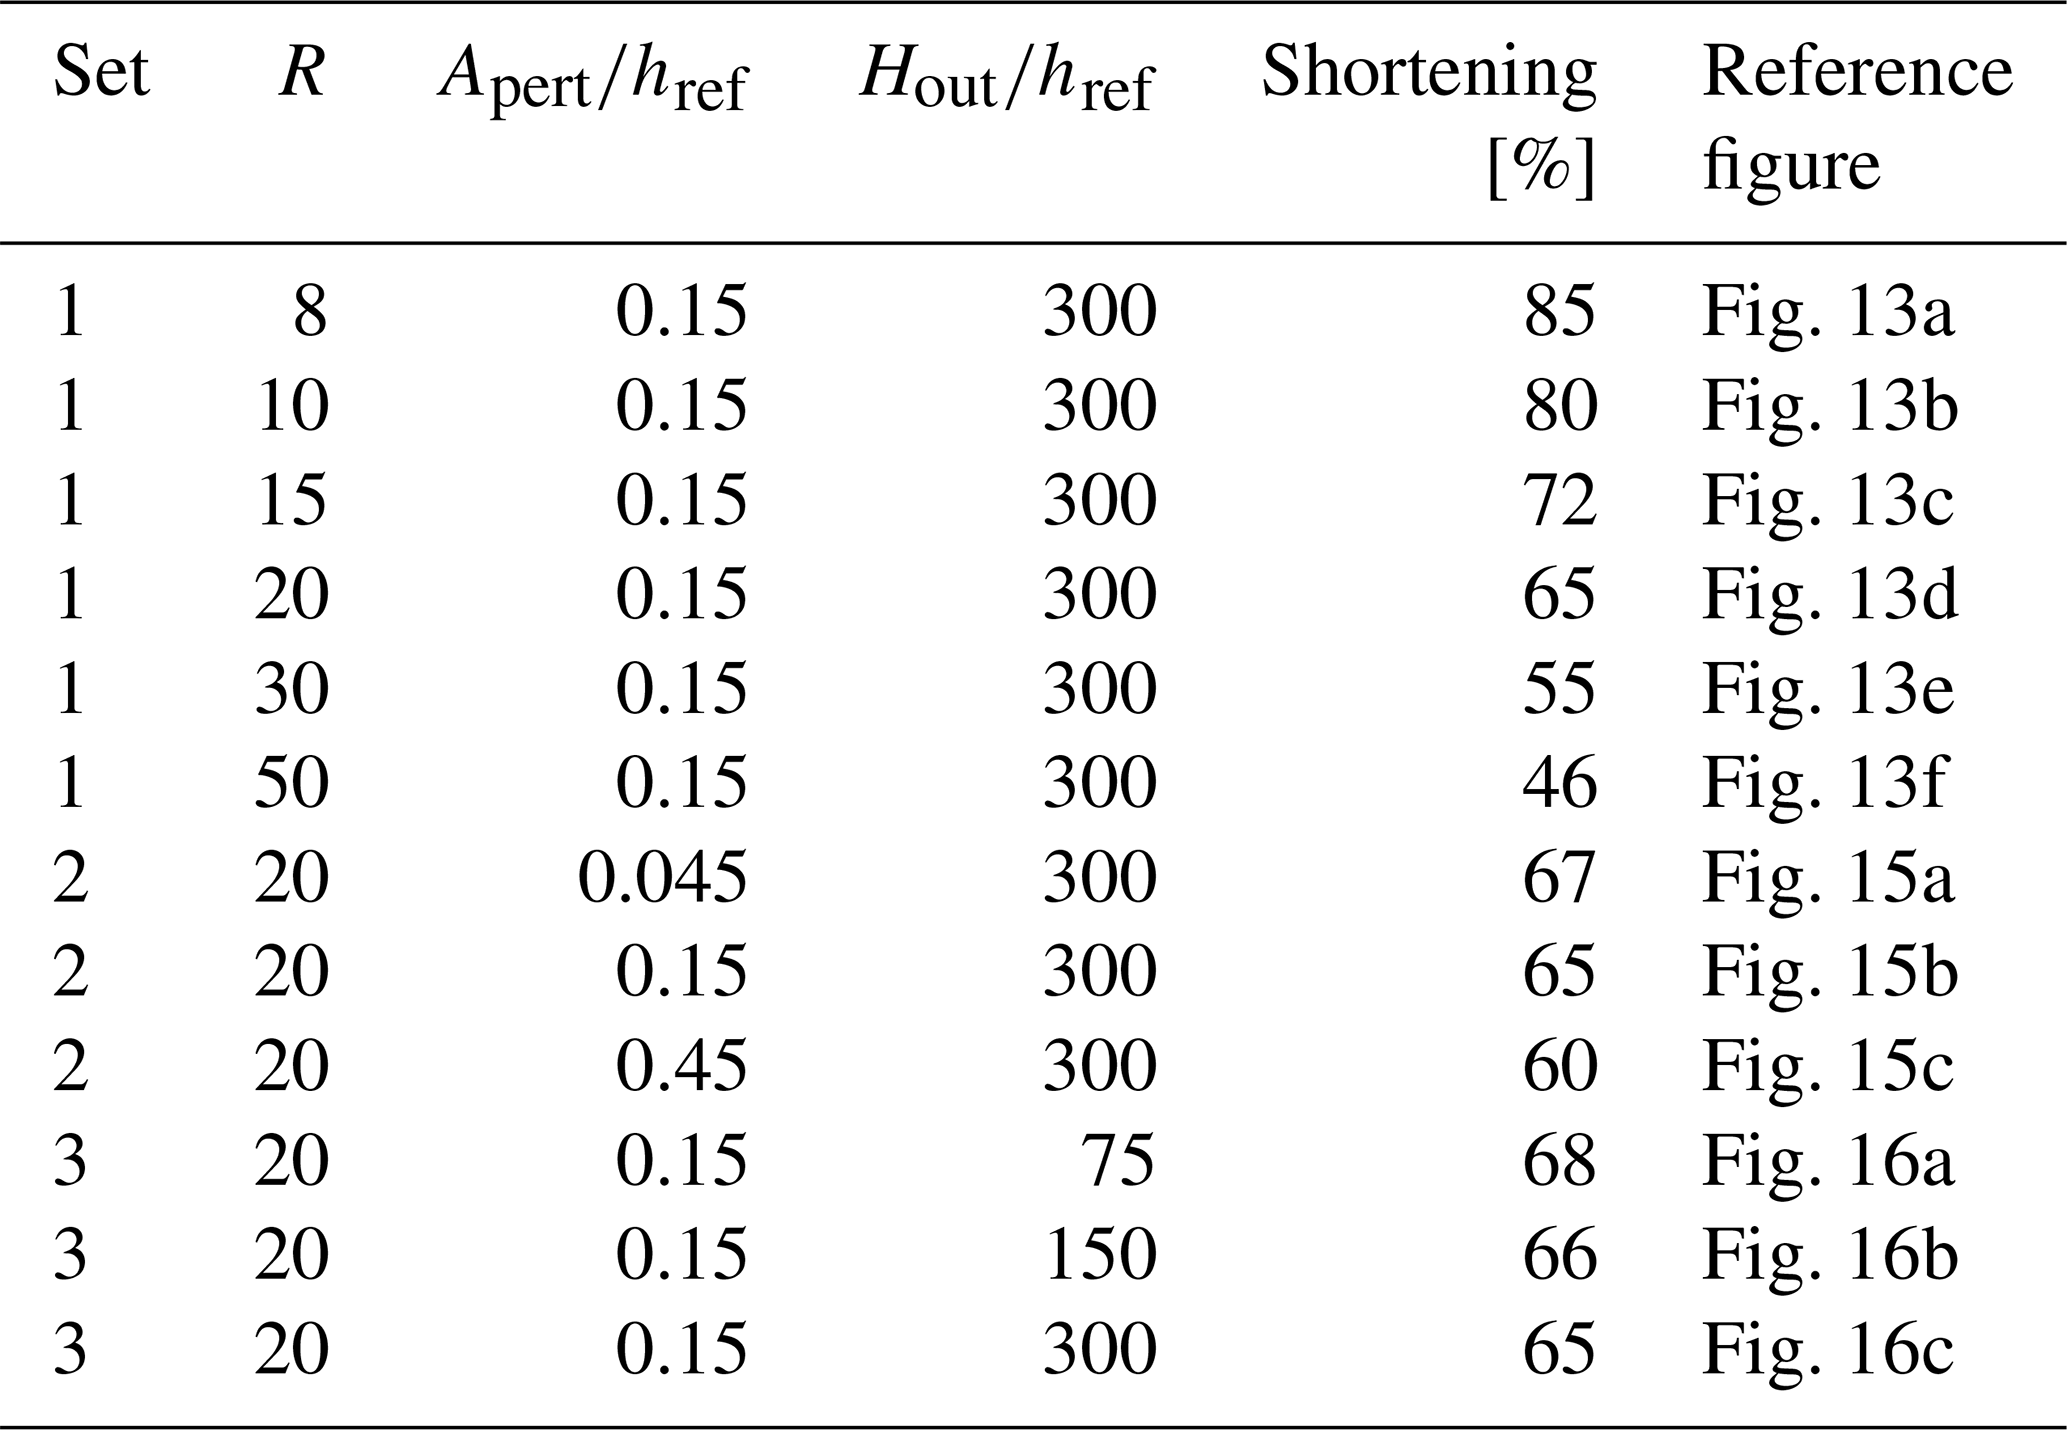
In the first set of simulations, we assume a viscosity ratio between dark and white beds of R=8, 10, 15, 20, 30, and 50. The package is sandwiched between two thick soft layers, whose thickness is equal to . Moreover, we set the initial amplitude of perturbation as . In the second set of simulations, we examine the role of the perturbation amplitude; we use equal to 0.045, 0.15, and 0.45. Here, we fix R=20 and . In the third set of simulations, we vary the thickness of the outer layers with , 150, and 300 and run the simulations for constant R=20 and . The initial parameters applied in the models are presented in Table 1.
We compare the results of the simulations for the sets when the mean limb dip of the large-scale folds is ca. 45∘. However, this criterion is achieved at different stages of deformation for different models and is listed in Table 1. Additionally, we provide references to the figures showing the results of the simulations. Note that models 13d, 15b, and 16c are the same.
6.5.2 Numerical results
Figure 13 shows the results of the first set of simulations for different R values. The amount of shortening required to achieve a limb dip of 45∘ for the large-scale folds decreases with increasing R; e.g. a model with R=8 requires 85 % shortening, whereas R=50 is shortened only 43 % (see Table 1 for details).
Close spacing between the stiff layers causes the layers to interact with each other. With increasing R, they form a smooth transition between polyharmonic and harmonic folds. Since very few small-scale fold structures are observed in models with R=30 and 50, we consider the polyharmonic folds to be characteristic for R<30, whereas the harmonic folds occur for R≥30.
The influence of R on the large-scale fold structure is best illustrated in the geometry of the folds of the D1 domain. The increase in R causes the increase in the large-scale fold wavelength and promotes development of folds with sharper hinges and longer and straighter limbs. Moreover, the thickness of each layer decreases, causing the thickness of the whole D1 domain to decrease with R.
The middle-scale folds tend to develop in the D2 and D3 domains. In Fig. 14a, we compare the shape of the uppermost layer of the D2 domain. The middle-scale folds occur in models with R<30; the most pronounced structures develop for R=10 and R=15. The middle-scale folds occurring on the limbs of the large-scale folds are the most notable and are generally characterised by an asymmetric shape. For R≥30, the layers have long, nearly straight limbs following the large-scale fold pattern and develop a “keel-like” accommodation structure around the hinge zone (Price and Cosgrove, 1990, p. 320).
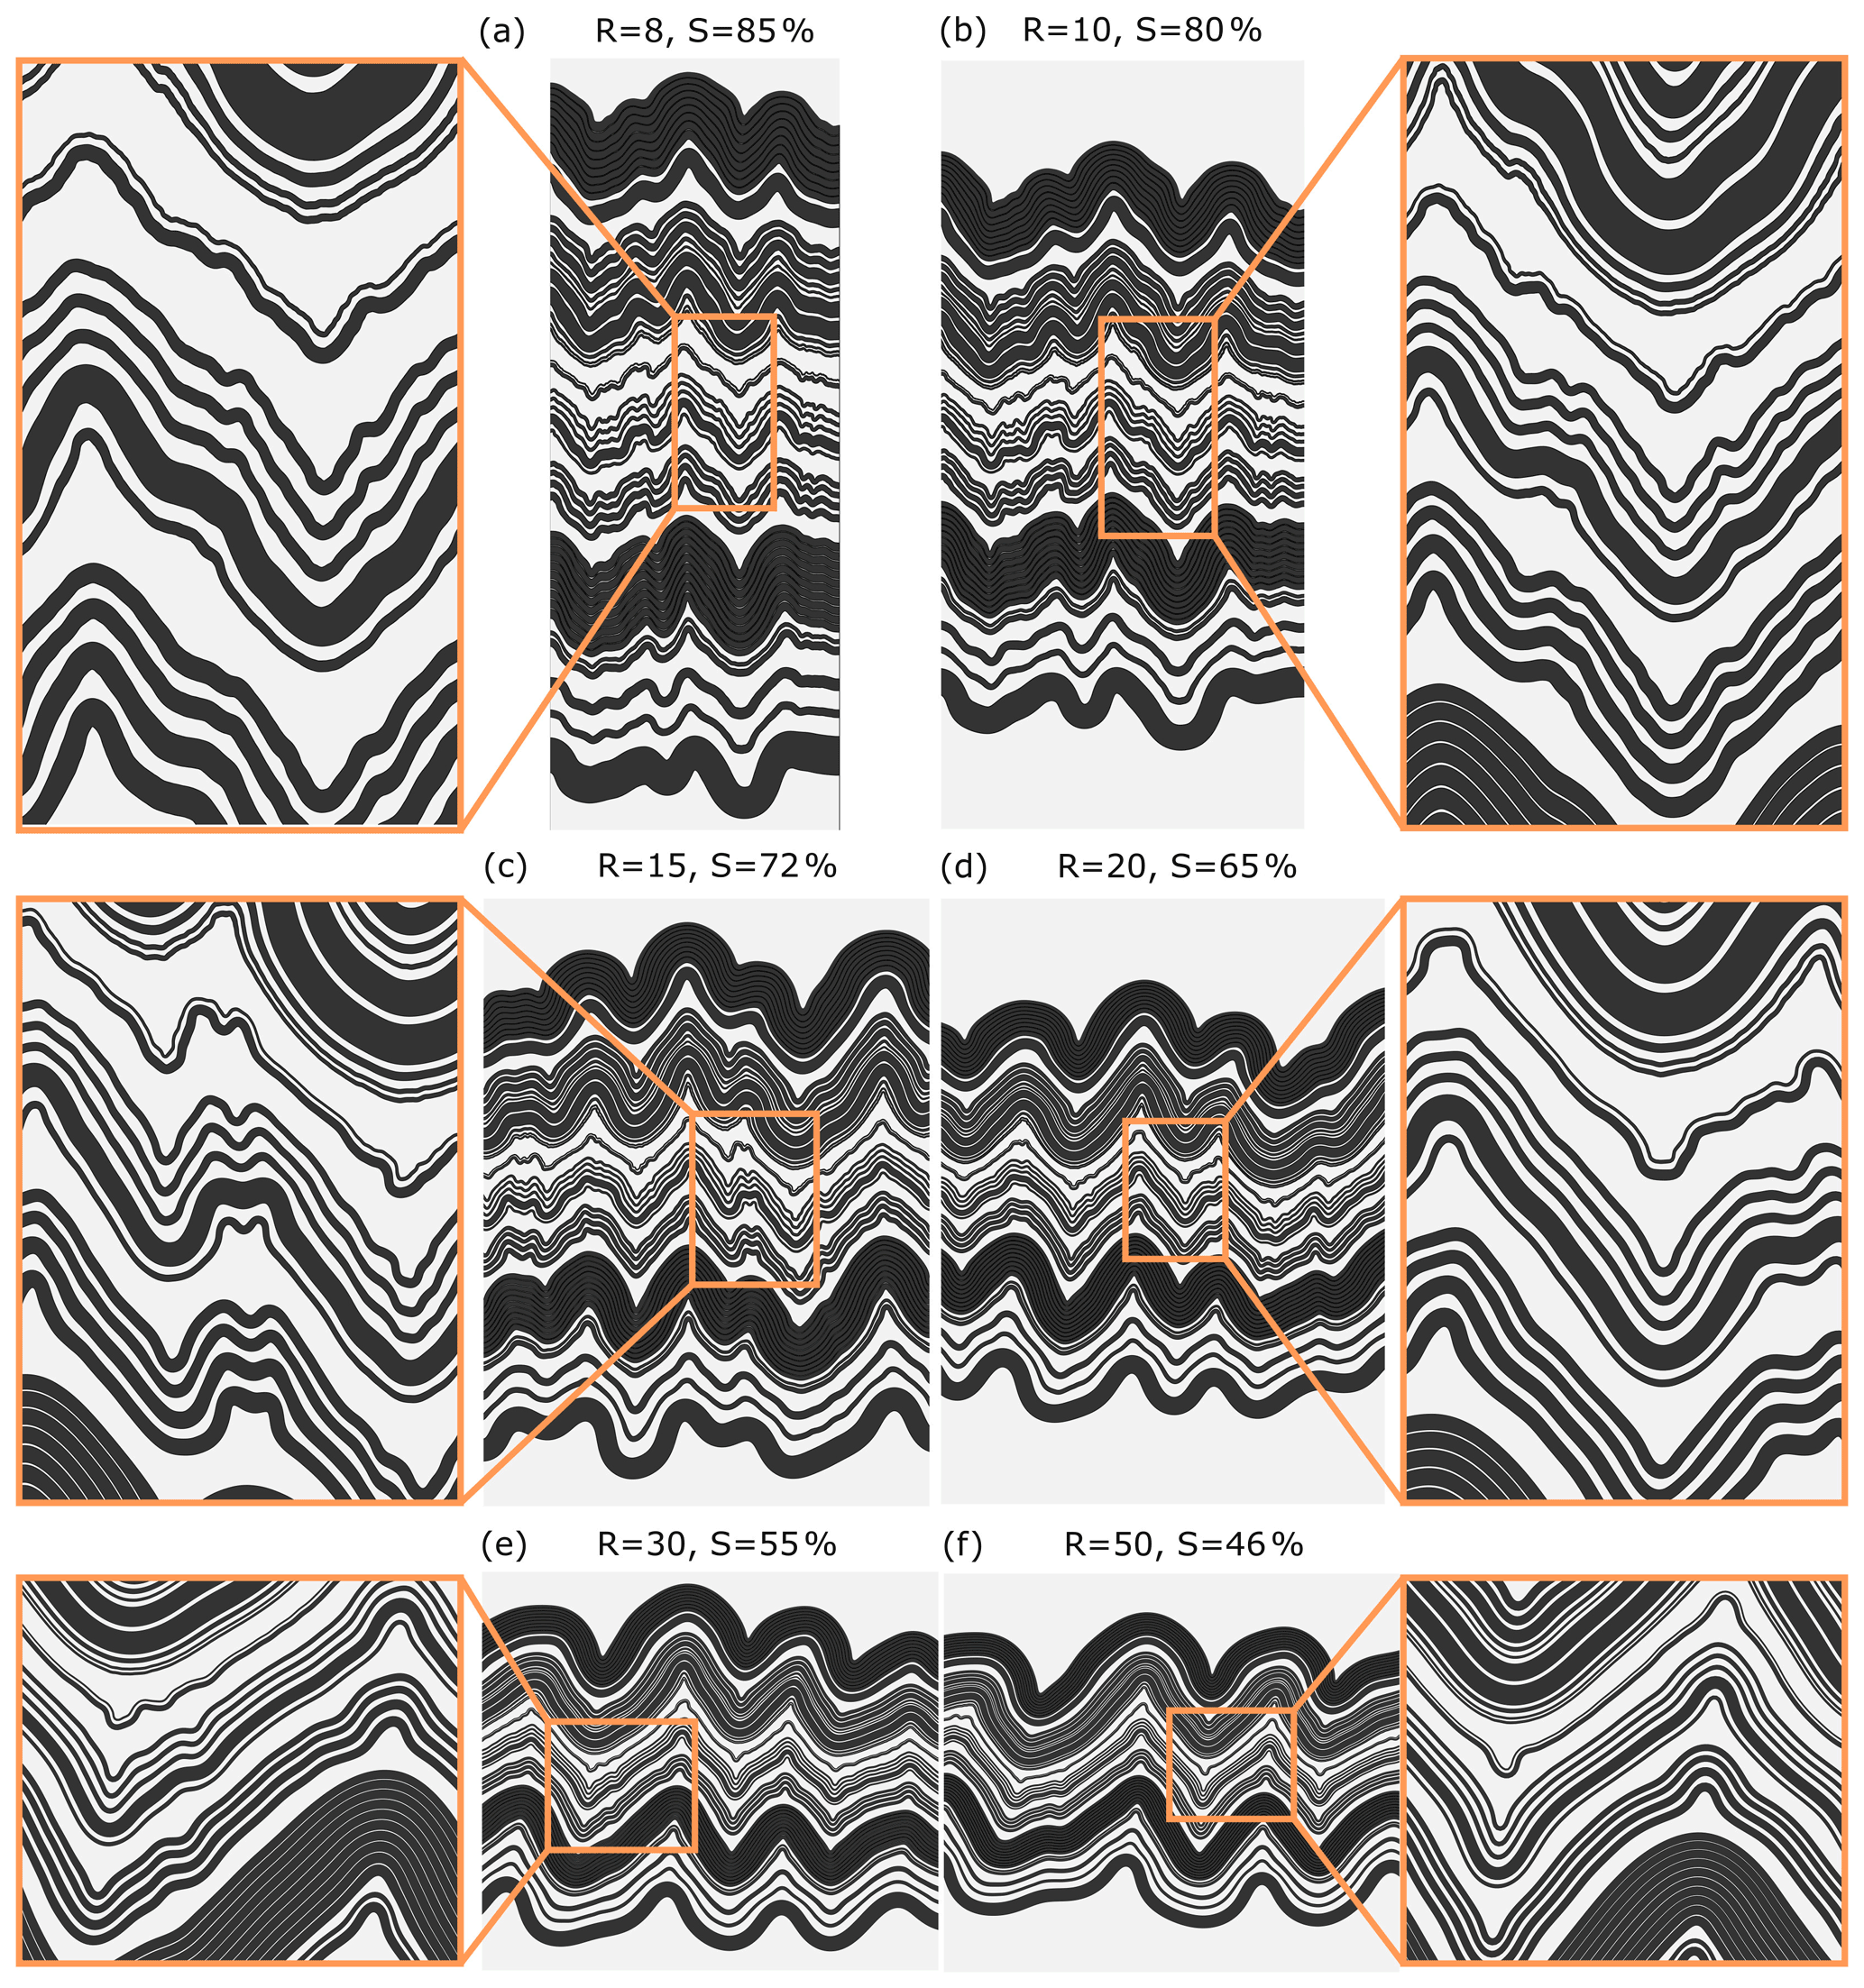
Figure 13Results of the numerical simulations for different viscosity ratios between dark and white layers (R) and shortening (S) values: (a) R=8 % and S=85 %, (b) R=10 % and S=80 %, (c) R=15 % and S=72 %, (d) R=20 % and S=65 %, (e) R=30 % and S=55 %, and (f) R=50 % and S=46 %. In the model, the normalised initial amplitude of interface perturbation, , is set to 0.15, and the thickness of the outer soft layers, , is set to 300.
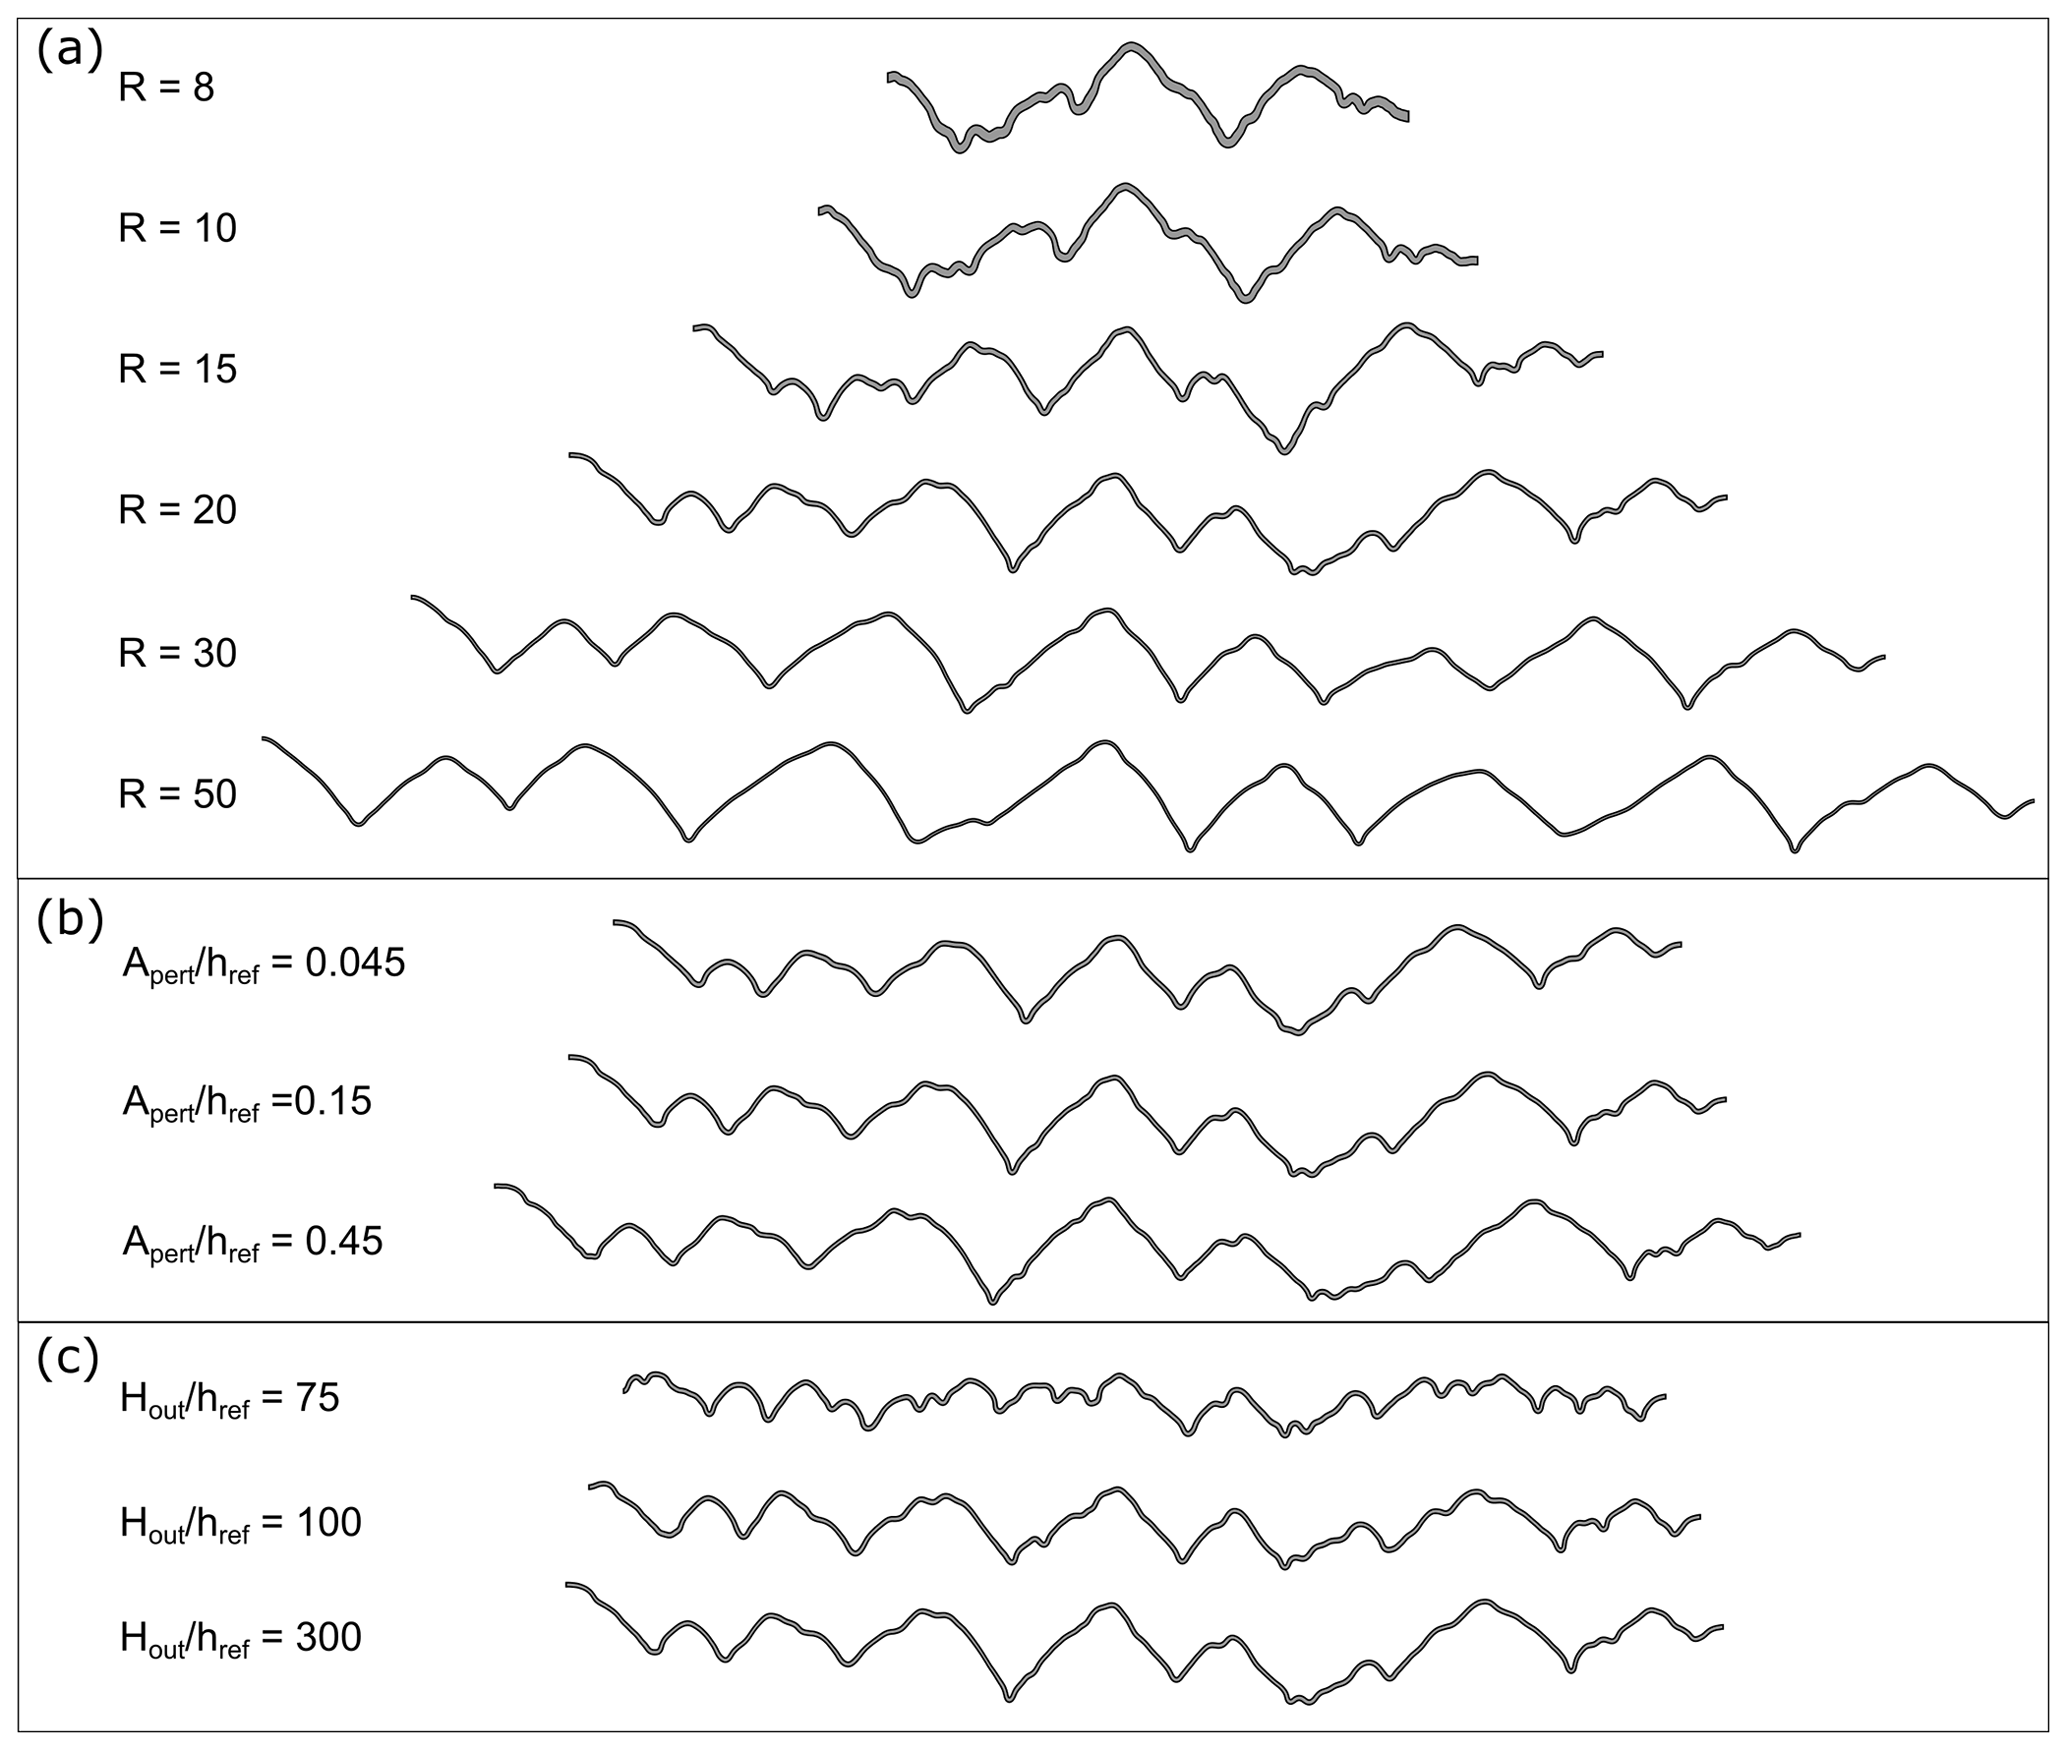
Figure 14Fold shape of the uppermost layer in the D2 domain for (a) different viscosity ratios, R (set 1), (b) different initial normalised perturbation amplitude, , (set 2), and (c) different initial normalised thickness of the outer layers, (set 3).
Distinct small-scale folds are represented by the thick layer in the D4 domain for R=8 and 10 (Fig. 13a, b). The thin layer in this domain locally forms even smaller-scale fold structures. In other models, both layers in the D4 domain fold along middle- and/or large-scale folds. For R=50, evident keel-like structures occur in the hinge areas.
In the second set of simulations, we investigate the sensitivity of our results to the amplitude of the initial perturbation (Fig. 15a–c). The large-scale fold shape is generally similar in all the models; however, the decreasing requires more shortening to develop into fold limbs of ca. 45∘. For the results are presented after 67 % shortening and for after 65 % shortening, whereas for they are presented after 60 % shortening.
No significant difference can be observed in the overall shape of the middle-scale folds (Fig. 14b). For larger the layer interface is rougher. The discrepancy between the models is more pronounced in the case of small-scale structures. For models with larger more small-scale fold structures can be observed.
The third set of simulations test the influence of the thickness of the bounding layers, (Fig. 16a–c). The folds in models with larger tend to develop folds with larger amplitude and straight limbs. Development of the middle- and smaller-scale structure is more pronounced for models with smaller ; the growth of large-scale folds is limited due to confinement (Fig. 14c).
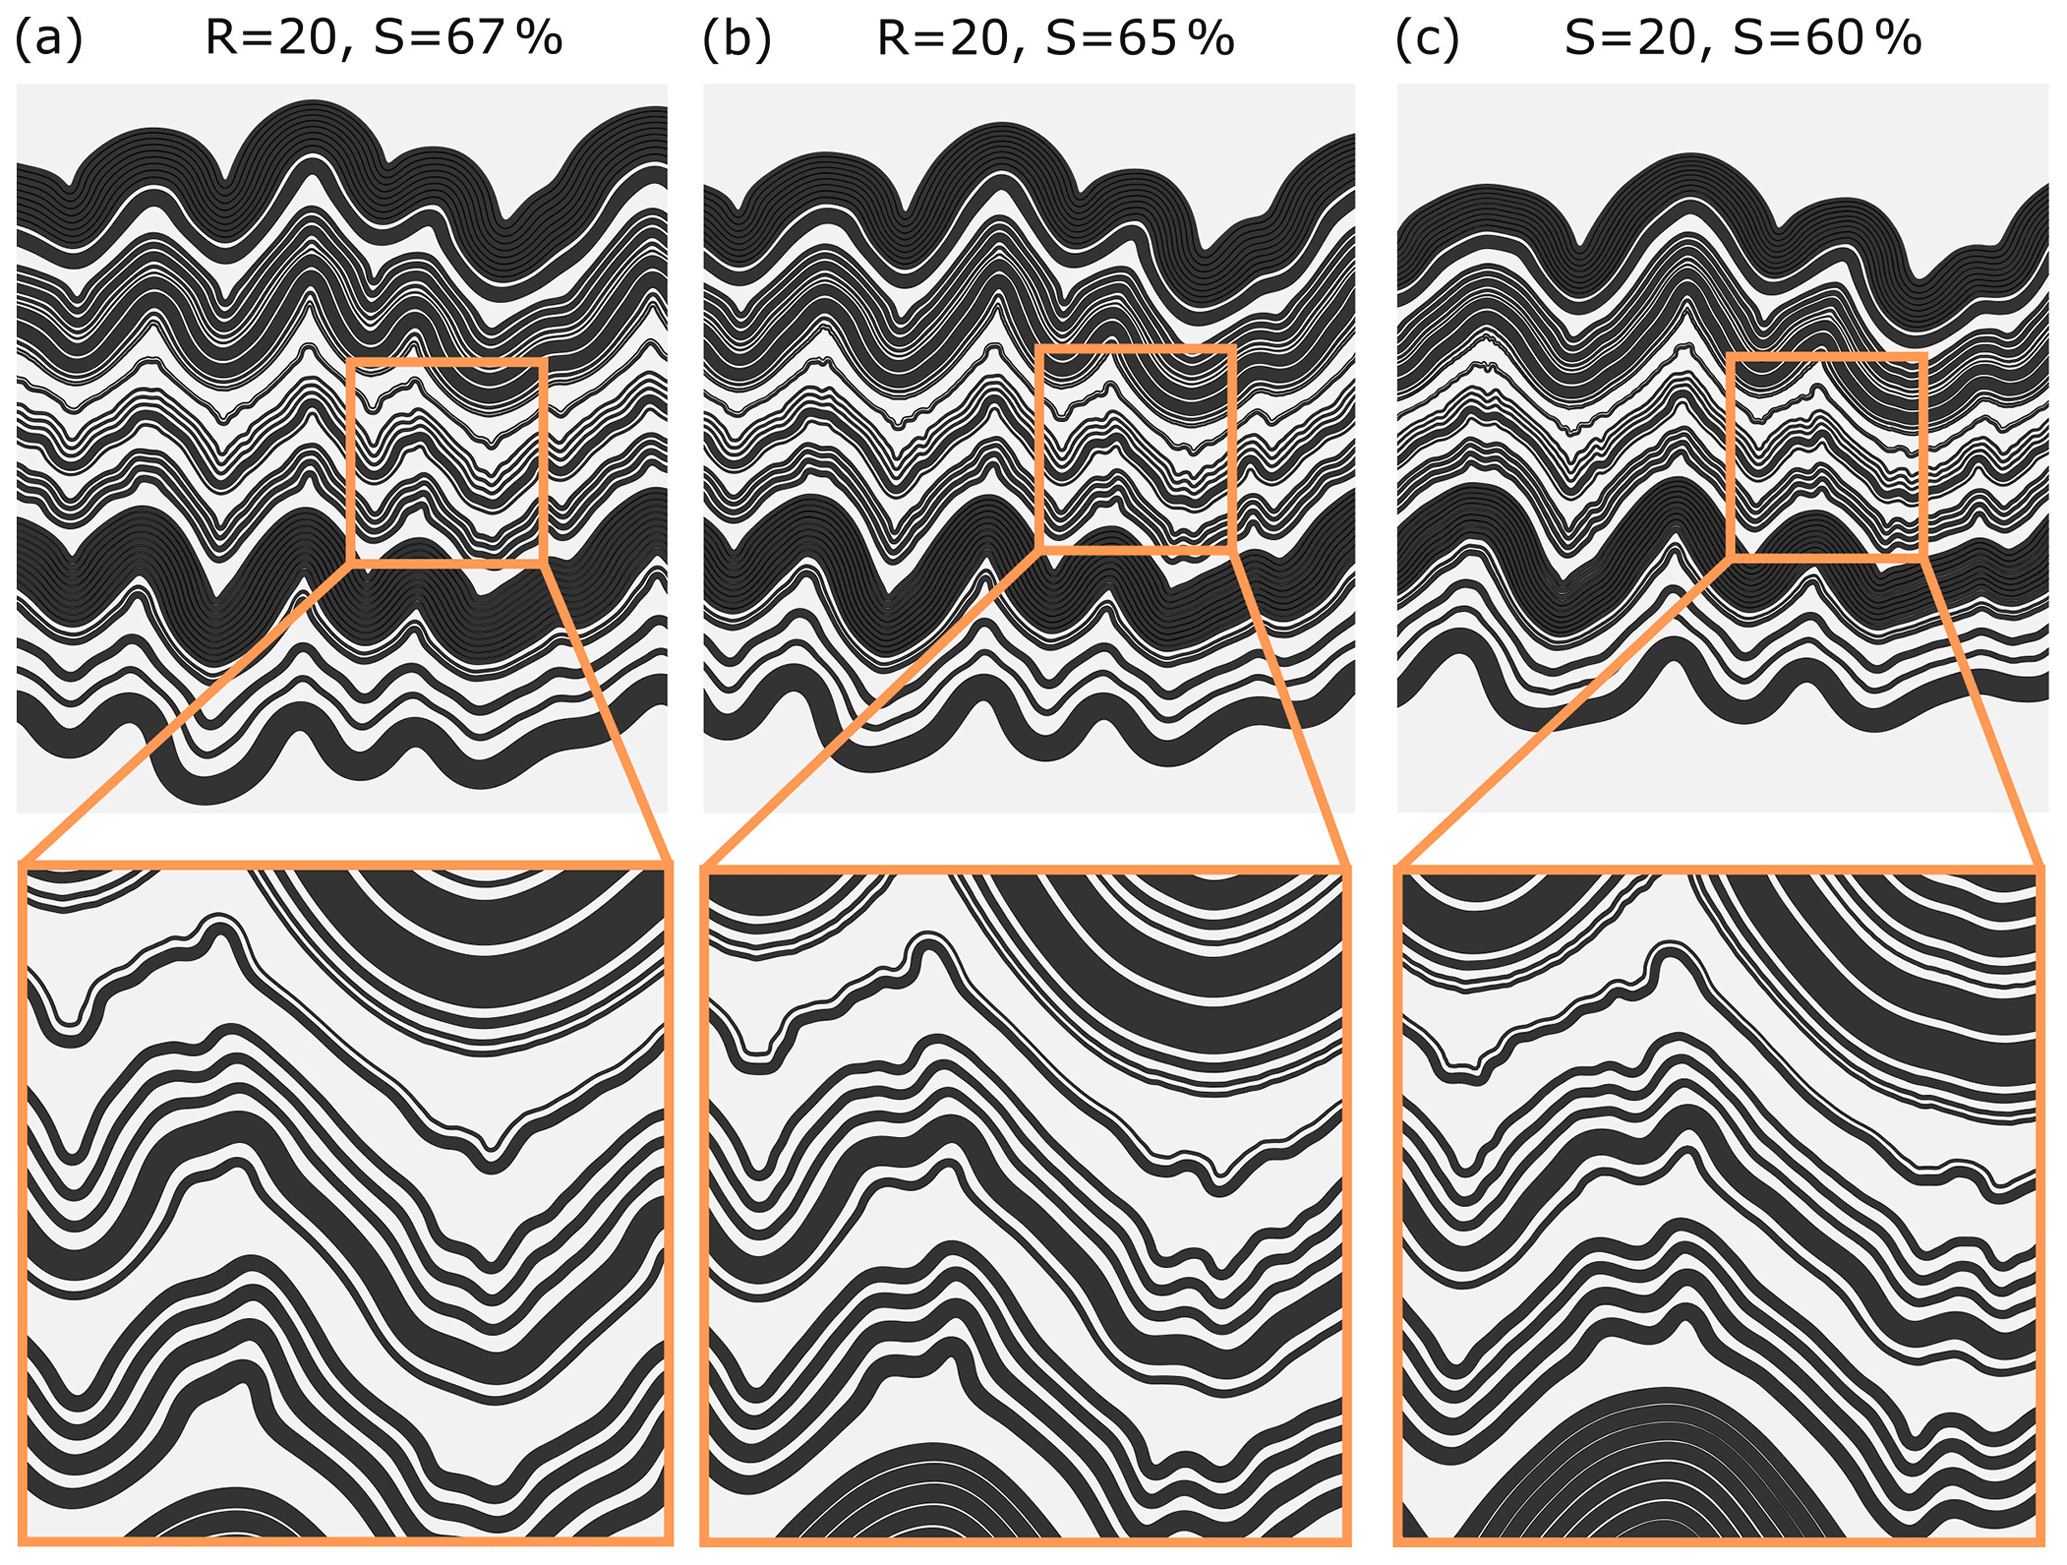
Figure 15(a–c) Models showing the role of initial normalised perturbation amplitude for = 0.045, 0.15, and 0.45, respectively. In all models, the viscosity ratio between the dark and white layers is set to R=20.
We combined observations at a wide range of scales of the folded multilayer sequence from the Ocnele Mari salt mine with numerical simulations to constrain long-term competency contrast between the layers. The morphology of the folds, at first look, clearly indicates that the sequence is mechanically stratified and the competency contrast is associated with the presence of impurities in different layers. In the sections below, we discuss and interpret our results further to finally arrive at the permissible range of viscosity ratios.
7.1 Deformation in a salt detachment shear zone
Regional geological arguments, a tectonic setting in a fold-and-thrust belt, and well data constrain the salt body to a 400 m thick sheet conformable to regional layering. The presence of top-to-the-foreland shear in a salt detachment between clastics is common in such settings. The salt body is well defined by salt exploration wells (Fig. 1b), and the structure is not a deep-rooted diapir, as shown by reflectance of vitrinite indicating burial to less than 1.5 km. The faults offsetting the deposit suggest that deformation slowed down after movement on the detachment.
Structures in the mine (with excellent exposure of clean salt pillars) are in agreement with this interpretation. The layering in the fold limbs shows evidence for large shear strains and the formation of early isoclinal folds before the formation of S-vergent folds with gently curved fold axes, which all agree with deformation in a shear zone that strongly reworked the original sedimentary layering. Perturbation of the flow field during shearing is inferred to have formed the asymmetry of the large-scale folds observed in the mine. We suggest that the asymmetry in fold shape in our study is similar to that described in salt glaciers by Talbot (1979), who attributed it to the presence of irregularities in the basement. Moreover, using numerical simulations, Schmalholz and Schmid (2012) showed that deformation over a ramp with a slope break can lead to development of such fold asymmetry.
7.2 Deformation mechanisms and rheology
Optical microscopy of samples in the hinges and the limbs of the folds was aided by gamma decoration, which is a sensitive indicator for small differences in the halite crystal defect structure (Schléder, 2006). In the fold limbs, halite grains show a strong shape-preferred orientation parallel to the foliation, with boudinage of inclusion-rich layers and halite fibres in the boudin necks. We interpret this foliation to have formed mostly in the large strain shearing deformation phase before the folding (together with the earlier folds, which are refolded later). Overgrowth and truncation structures are common, and subgrain-rich grains are uncommon, suggesting that solution–precipitation creep was a dominant deformation mechanism. Halite grain size is smaller in the inclusion-rich layers, suggesting pinning of mobile grain boundaries and enhancement of grain-size-sensitive flow (Krabbendam et al., 2003). The subgrain-rich grains are therefore interpreted to have formed in an earlier phase of deformation (the detachment phase?) and are now replaced by fluid-assisted grain boundary migration. Further, we suggest that most subgrains visible through gamma decoration but not visible in the etched surfaces are paleosubgrains, which are not present anymore, although this cannot be proven by the presented data.
The shape-preferred orientation is reoriented in the fold hinges to parallelism with the axial plane, indicating that this grain fabric is related to folding. Microstructures representing this deformation show evidence for solution–precipitation creep indicated by dislocation-free grains with truncation and overgrowth structures. This we interpret as evidence for solution precipitation creep, providing support for linear (Newtonian) viscous rheology used in our numerical models. The recorded maximum heating temperature of 58 ∘C eliminates thermally induced effects as the potentially important factor that can influence the rheology of salt. The darker layers are inferred to contain more impurities and have higher viscosities. However, to better quantify the number of impurities, more samples and analysis are needed. We consider the dark salt to be more competent than the white salt based on field and fold shape observations. The dark salt itself, consisting of claystone particles and halite grains, can have internal competency contrasts (Fig. 11e), which are not resolved in our numerical models. We note that pressure solution microstructure does not provide information on deviatoric stress (solution–precipitation creep does not form subgrains), so we have no way to test if the layers inferred to have had higher viscosities actually deformed under higher deviatoric stress; we only note that deviatoric stress was very low (less than 1 MPa). We also want to mention that in the limbs of the folds, where the subgrains may represent the deformation in the early higher-stress detachment phase, the similar deviatoric stresses in the different layers (Supplement) may reflect the homogeneous state of stress (but not shear strain) expected to be present in simple shear.
7.3 Folds in the Ocnele Mari salt mine
In the Ocnele Mari salt mine, polyharmonic fold structures occur on up to four scales. As shown by Ramberg (1962), polyharmonic folds can develop in a multilayer sequence, where significant variation of the more competent layer thicknesses is observed. However, in the Ocnele Mari salt mine, the salt is finely layered and the variation of the layer thicknesses ranges centimetres to tens of centimetres with a maximum of ca. 30 cm. In this study, we show that the development of polyharmonic folding is not attributed to the variation of the individual layers but to the arrangement of the fine layers in the multilayer stack. Close spacing of thin layers causes this package to behave effectively as a thick single layer, triggering structure development on a larger scale. Consequently, the assemblage of layers and packages of layers can result in deformation at various scales.
Generally, the dark layers develop folds with rounded hinges, and they are thus considered to have higher viscosity compared to the bright layers (Figs. 4c–d, 5a–d). We suspect that the mechanical properties of the dark layers can slightly differ from each other as they show different shades of grey colouring, which is probably related to the variable amount of impurity in the layer. The effective viscosity of the multilayer packages forming an effective single layer would depend on the characteristic of the individual dark layer, the number of layers, and their thickness.
However, some of the very thin grey layers form folds with sharp hinges and wavy limbs following the shapes of the neighbouring layers (Figs. 4c and 5d). These structures are more characteristic for passive layers. We infer that the layers are not mechanically homogeneous due to their relatively small thickness compared to the size of impurities and salt grains. Similar observations have been reported for the case of boudinaged structures by von Hagke et al. (2018).
7.4 Numerical model design
The most critical factor in designing our multilayer modelling was the estimation of the initial layer thicknesses. We constrain the parameters based on the relative area of the layers that we observe in the outcrop. The estimate assumes plane-strain deformation, no volume change in the deformed rock mass, and initially constant lateral layer thicknesses. Further uncertainties in the definition of the layer thickness are related to the digitisation error and definition of the layer thickness. The problems are greater in the case of very small layers or layers with diffuse boundaries. We expect that the error related to the layer thickness estimation does not significantly affect our numerical simulations. On one hand, minor changes are expected to occur if the wrongly estimated layer is a part of the multilayer package. On the other hand, more pronounced changes could occur for the isolated layers; however, this would not affect the overall structure development.
The other problems related to the numerical model design include defining boundary conditions and initial perturbation type and amplitude. We incorporate these factors in the numerical analysis and investigate their influence on the developing structures (see below).
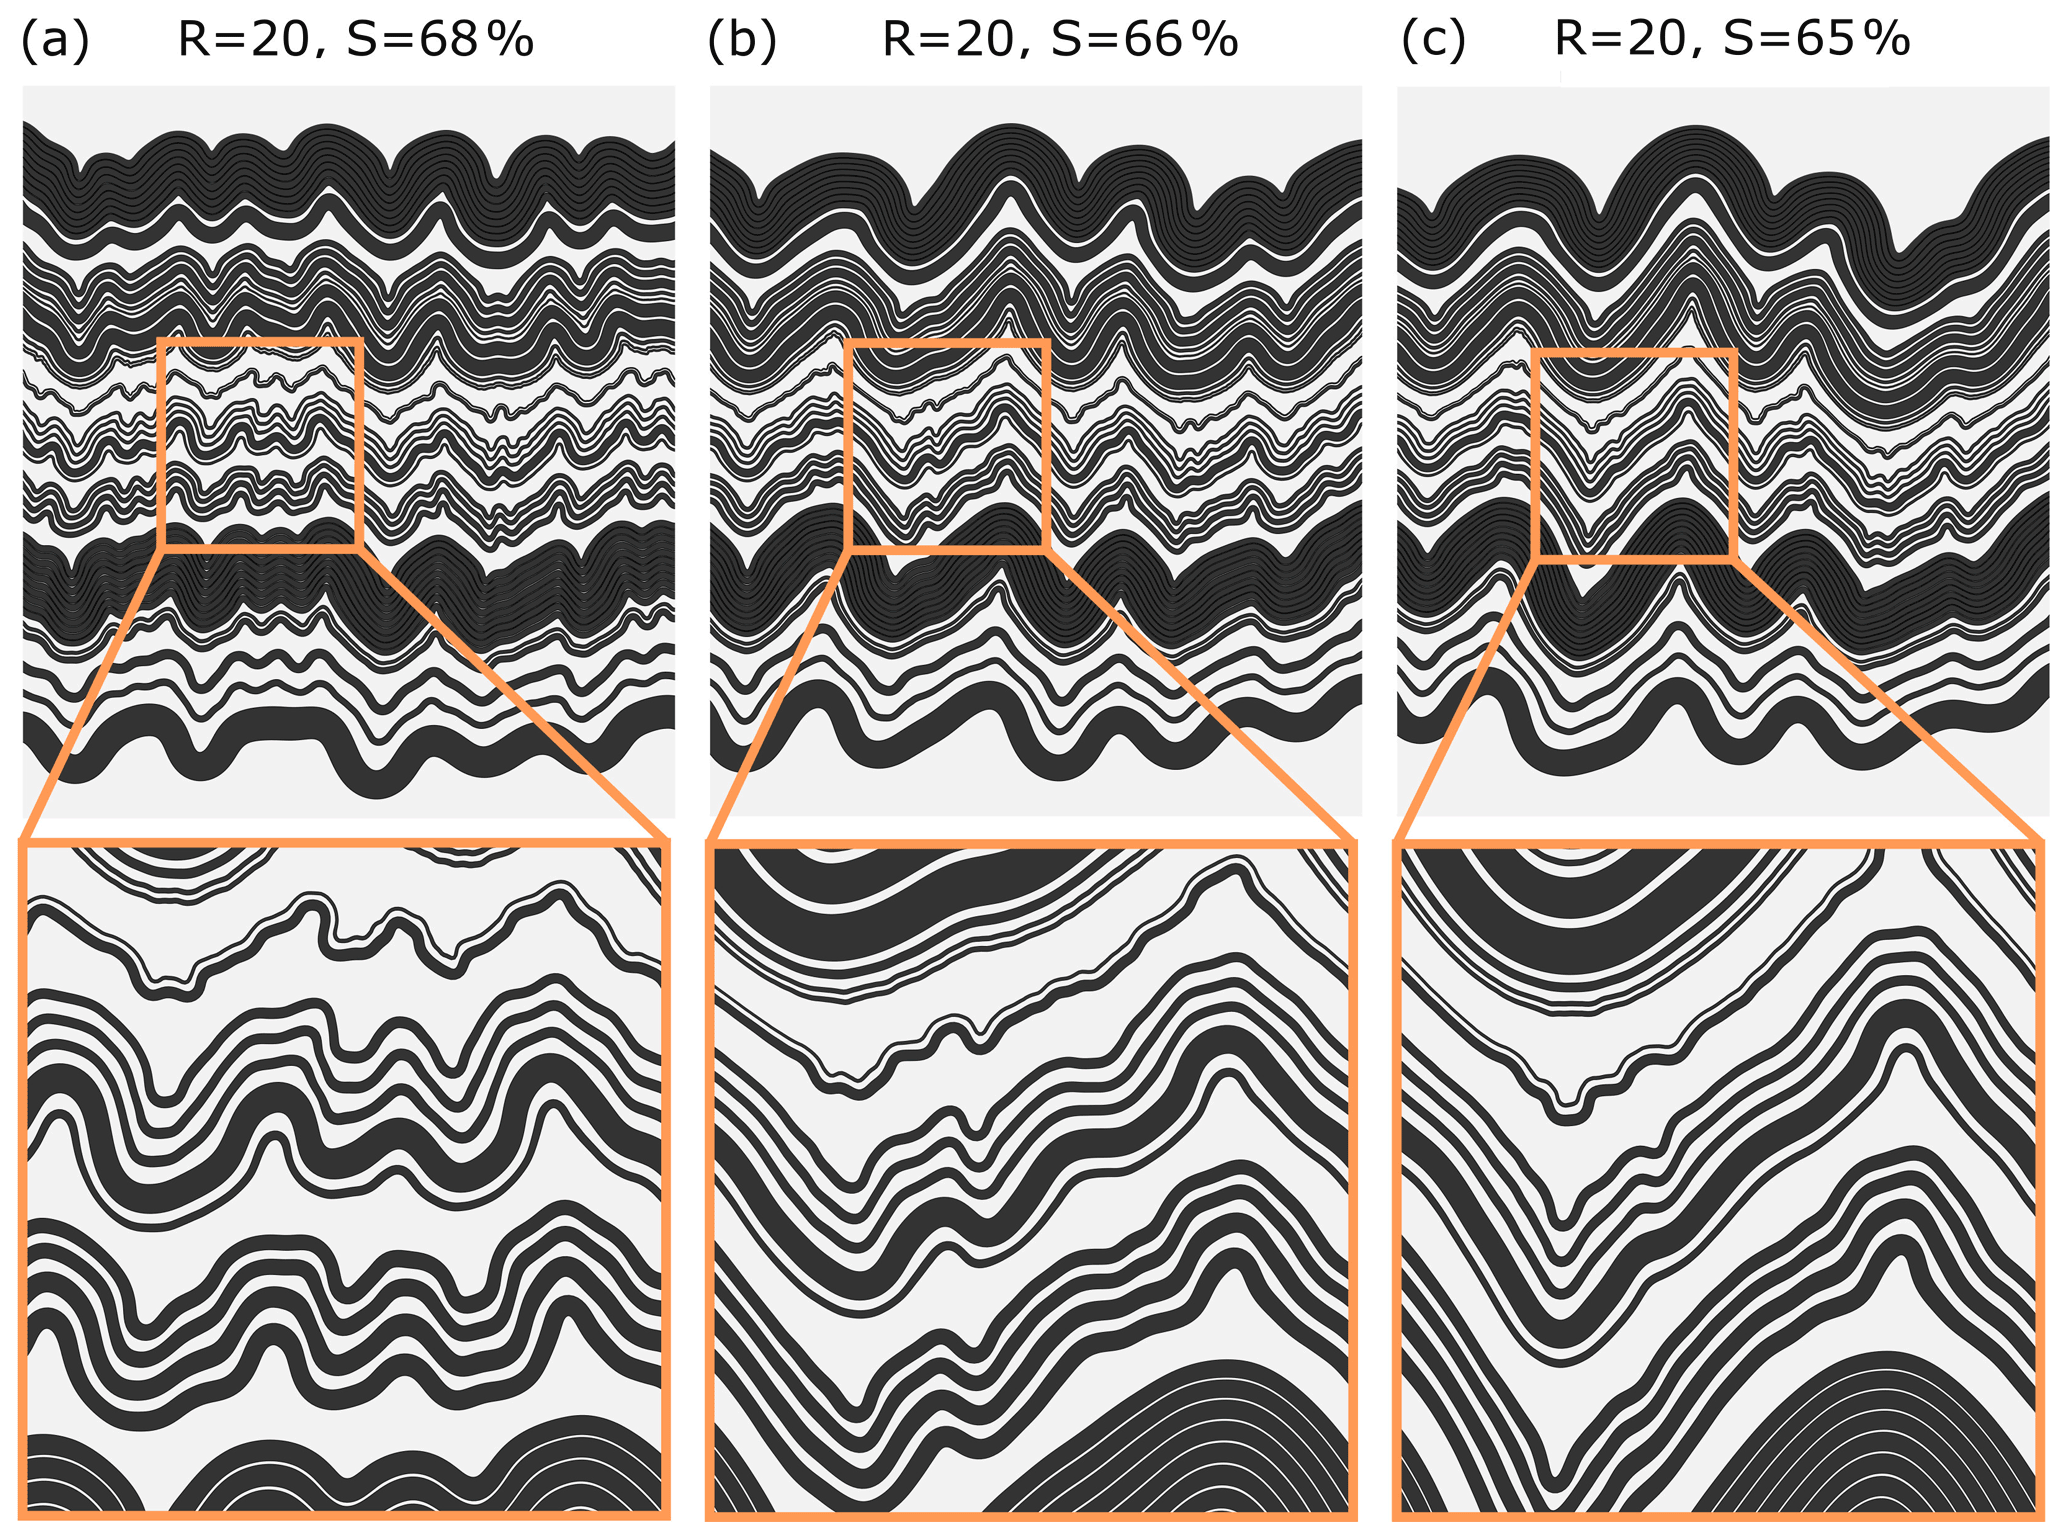
Figure 16(a–c) Models showing the role of the thickness of the bounding layers for = 75, 150, and 300, respectively. In all models, the viscosity ratio between the dark and white layers is set to R=20.
7.5 Viscosity ratio estimates
We attempt to investigate the viscosity ratio in the folded multilayer sequence using two approaches: (i) based on the single-layer fold shape analysis and (ii) testing the occurrence of polyharmonic folds.
7.5.1 Single-layer folding
We carried out the analysis of the fold shape that develops in the lower layer of the D4 domain, which is embedded by white layers with relatively considerable thickness (Fig. 9). The upper layer in the domain is very thin and generally illustrates a passive layer behaviour.
We choose a part of the layer with small thickness variation to reduce unnecessary complexity of the analysis and increase reliability of the solution. Two independent methods developed by Fletcher and Sherwin (1978) and Schmalholz and Podladchikov (2001) for estimating the viscosity ratio of the folded single layer indicate values between 10 and 25.
7.5.2 Polyharmonic folding
Development of polyharmonic folds requires a range of geometrical and mechanical conditions to be satisfied. These constraints provide an excellent opportunity to investigate the evolution of our multilayers. We carefully digitised the outcrop in pillar E50, where the three orders of folds can be observed, and designed a model for detailed numerical analysis. We simplified the number of geometrical parameters by constraining the relative layer thicknesses. For varying viscosity ratios between the layers, we investigate development of polyharmonic structures.
In the numerical simulations of multilayers, the polyharmonic structures appear for models with R<30. An overall good correspondence of the computed structures and field observations is obtained for R=10 and R=15. In both cases, we can observe developing folds over three distinct orders with morphologies that can be matched with observations.
In the models with R=8, we observe some discrepancies in the observed and numerically generated large-scale folds. The numerical folds are characterised by much smaller amplitude and length of the limbs. The shape of the structures is much more concentric-like when compared to the field examples, and these models require very large shortenings, which are unlikely in our natural examples.
Numerical models with R=30 and R=50 generate large-scale folds with sharp hinges. The multilayer sequence folds harmonically, and the development of the smaller-scale structures is suppressed. Moreover, layers in domains D2 and D3 tend to develop a keel-like accommodation structure around the hinge zone of the larger folds. These structures are not observed in the Ocnele Mari salt mine.
With increasing viscosity ratio, the amount of shortening needed for the large-scale structure to reach 45∘ limb dip decreases. Our field observations allow us to constrain the minimum shortening, which is 35 %–45 %. These values are still below the analysed model of R=50, which is shortened by 46 %. This constraint shows that viscosity ratios could be slightly higher than R=50.
In the model, we used only two viscosities, which correspond to white and dark layers in the field. Thus, in our estimates, we refer to their effective viscosity ratio and we do not take into account more than one value of viscosity in the dark layers or lateral changes in their composition. As illustrated in Fig. 4d, yellow–brown layers are probably more competent than black layers.
Since the selected example of the sequence in pillar E50 is characterised by a rather simple configuration of the layers with generally sharp layer interfaces, we argue that this simplification is acceptable. Note that the detailed relation between the impurity content and different shades of grey as well as their influence on the effective viscosity of salt is not known in detail and is beyond the scope of this paper.
7.5.3 Number of layers in the multilayer sequence and confining medium
We analyse structures developing in a selected part of a much larger multilayer sequence. In the numerical model, we simplify this far field by introducing thick upper and lower weak layers. Above and below the analysed sequence (D1–D5), we include additional layers to decrease the boundary effect.
As pointed out by Biot (1961), the dominant wavelength increases by a factor of for a multilayer composed of m layers. The relation is valid only for the case of a simple multilayer stack composed of alternating stiff and soft layers with equal thickness. Increasing the number of layers in the analysed sequence would result in a larger dominant wavelength of the large-scale folds. This can affect the development of middle- and small-scale folding. On the other hand, including a thick weak layer around the multilayer sequence promotes the development of large-scale folds (Fig. 15d–f). Significant change in the fold shape evolution is found only for the close proximity of the rigid boundaries, which is not the case we observe in the field. Consequently, we argue that the simplification used in the numerical model does not change our findings.
7.5.4 Initial perturbation amplitude
Initial perturbation of the layer interface is the parameter that is difficult to constrain. A common practice in numerical simulation of folding is using red noise perturbation with the initial amplitude normalised by the layer thickness. However, for the multilayer sequence composed of variable layer thickness, this assumption cannot be used. Instead, we use equal perturbation amplitude for all the layers. Since the presence of impurities in the layers is probably the main source of the natural perturbation, we consider this assumption to be reasonable, following Frehner and Schmalholz (2006).
Increasing initial perturbation amplitude promotes development of large-amplitude folds, which effectively reduces the amount of shortening needed for large-scale folds to reach limb dip of ca. 45∘. Moreover, a large initial amplitude reduces the wavelength selection process. Consequently, the layer interface is rougher and the regularity of the developing fold shapes is reduced. In our simulations, we see more pronounced small-scale folds developing in the models with initially higher .
7.6 Mechanical anisotropy
The presence of mechanical layering in the sequence results in anisotropic mechanical behaviour. For a given viscosity ratio between the layers (R), bilaminates with the equal thickness of layers show the highest anisotropy (δmax), which can be calculated from the relation (Treagus, 2003). Thus, the estimated viscosity ratio of the impure salt in the Ocnele Mari salt mine between 10 and 20 gives rise to δmax between 3 and 5.5, respectively. Due to variable layer thickness in the sequence, we expect the anisotropy to be slightly smaller. However, the presence of structures and the layers with different viscosities (e.g. yellow–brown layers or thin grey layers) can additionally modify the anisotropy value. We speculate that, in general, due to common occurrence of the intercalation of different rock types (anhydrite, clay, and bittern salt) within the evaporite successions, the successions are rarely isotropic.
-
The field observations and numerical models clearly show that the Ocnele Mari impure rock salt is mechanically heterogeneous and anisotropic during deformation at low differential stress below 1 MPa.
-
For a relatively small fraction of impurities (ca. 10 %), a viscosity ratio up to 20 can form in fine-layered rock salt. We propose that such competency contrasts are common, giving layered rock salt an anisotropic viscosity at a wide range of scales, in addition to the effects of layers of anhydrite, clay, and bittern salts.
-
Microstructural analysis shows evidence of dissolution–precipitation processes, supporting our assumption of Newtonian viscous creep under these conditions.
-
Development of polyharmonic folds requires a range of geometrical and mechanical conditions to be satisfied, providing a tool for constraining viscosity ratios in ductile deformation.
The codes used, FOLDER and the Fold Geometry Toolbox (FGT), are open-source toolboxes available at https://github.com/dwschmid/folder (Adamuszek et al., 2016) and https://github.com/dwschmid/fgt (Adamuszek et al., 2011), respectively.
The data presented in this study are available on request from Marta Adamuszek.
The supplement related to this article is available online at: https://doi.org/10.5194/se-12-2041-2021-supplement.
MA designed and carried out the numerical analysis. DMT provided the field data and the photos. JB performed the microstructural analysis. JLU designed the project. All the co-authors contributed to writing the paper.
The contact author has declared that neither they nor their co-authors have any competing interests.
Publisher's note: Copernicus Publications remains neutral with regard to jurisdictional claims in published maps and institutional affiliations.
Janos L. Urai acknowledges the hospitality and inspiring discussions of Stefan Schmalholz and his group during a sabbatical at the University of Lausanne, where the first ideas of this study were developed. This sabbatical was supported by a Theodore von Kármán Fellowship of RWTH Aachen University. We thank Lina Gotzen for providing Fig. 6 from her MSc studies at RWTH Aachen University.
This research has been supported by the Polish Geological Institute - National Research Institute (grant no. 62.9012.2054.00.0) and the Universitatea Babeș-Bolyai (grant no. 35275/18.11.2020).
This paper was edited by Florian Fusseis and reviewed by Prokop Závada and Jolien Linckens.
Adamuszek, M. and Dabrowski, M.: Sinking of a fragmented anhydrite layer in rock salt, Tectonophysics, 20, 40–59, https://doi.org/10.1016/j.tecto.2019.05.018, 2019.
Adamuszek, M., Schmid, D. W., and Dabrowski, M.: Fold geometry toolbox – Automated determination of fold shae, shortening, and material properties, J. Struct. Geol., 33, 1406–1416, https://doi.org/10.1016/j.jsg.2011.06.003, 2011.
Adamuszek, M., Dabrowski, M., Schmalholz, S. M., Urai, J. L., and Raith, A.: Estimating Rheological Parameters of Anhydrite from Folded Evaporite sequences: Implications for Internal Dynamics of Salt Structure, in: EGU General Assembly Conference Abstracts, Austria, 9954, 2015.
Adamuszek, M., Dabrowski, M., and Schmid, D. W.: Folder: A numerical tool to simulate the development of structures in layered media, J. Struct. Geol., 84, 85–101, https://doi.org/10.1016/j.jsg.2016.01.001, 2016.
Barker, C. E. and Pawlewicz, M. J.: Calculation of Vitrinite Reflectance from Thermal Histories and Peak Temperatures, in: Vitrinite Reflectance as a Maturity Parameter, Am. Chem. Soc., 570, 216–229, https://doi.org/10.1021/bk-1994-0570.ch014, 1994.
Bérest, P., Karimi-Jafari, M., and Brouard, B.: Geometrical versus rheological transient creep closure in a salt cavern, C. R. Mécanique, 345, 735–741, https://doi.org/10.1016/j.crme.2017.09.002, 2017.
Bérest, P., Gharbi, H., Brouard, B., Brückner, D., DeVries, K., Hévin, G., Hofer, G., Spiers, C., and Urai, J.: Very Slow Creep Tests on Salt Samples, Rock Mech. Rock Eng., 52, 2917–2934, https://doi.org/10.1007/s00603-019-01778-9, 2019.
Biot, M. A.: Theory of Folding of Stratified Viscoelastic Media and Its Implications in Tectonics and Orogenesis, Geol. Soc. Am. Bull., 72, 1595, https://doi.org/10.1130/0016-7606(1961)72[1595:TOFOSV]2.0.CO;2, 1961.
Biot, M. A.: Theory of similar folding of the first and second kind, Geol. Soc. Am. Bull., 76, 251–258, https://doi.org/10.1130/0016-7606(1965)76[251:TOSFOT]2.0.CO;2, 1965.
Bruthans, J., Filippi, M., Geršl, M., Zare, M., Melková, J., Pazdur, A., and Bosák, P.: Holocene marine terraces on two salt diapirs in the Persian Gulf, Iran: age, depositional history and uplift rates, J. Quaternary Sci., 21, 843–857, https://doi.org/10.1002/jqs.1007, 2006.
Burchardt, S., Koyi H., and Schmeling H.: The influence of viscosity contrast on the strain pattern and magnitude within and around dense blocks sinking through Newtonian rock salt, J. Struct. Geol., 35, 102–116, https://doi.org/10.1016/j.jsg.2011.07.007, 2012a.
Burchardt, S., Koyi, H., Schmeling, H., and Fuchs, L.: Sinking of anhydrite blocks within a Newtonian salt diapir: modelling the influence of block aspect ratio and salt stratification: Sinking of anhydrite blocks, Geophys. J. Int., 188, 763–778, https://doi.org/10.1111/j.1365-246X.2011.05290.x, 2012b.
Carter, N. L. and Hansen, F. D.: Creep of Rocksalt, Tectonophysics, 92, 275–333, https://doi.org/10.1016/0040-1951(83)90200-7, 1983.
Chemia, Z. and Koyi, H.: The control of salt supply on entrainment of an anhydrite layer within a salt diapir, J. Struct. Geol., 30, 1192–1200, https://doi.org/10.1016/j.jsg.2008.06.004, 2008.
Cobbold, P. R., Cosgrove, J. W., and Summers, J. M.: Development of internal structures in deformed anisotropic rocks, Tectonophysics, 12, 23–53, https://doi.org/10.1016/0040-1951(71)90065-5, 1971.
Cornet, J. S., Dabrowski, M., and Schmid, D. W.: Long term creep closure of salt cavities, Int. J. Rock Mech. Min. Sci., 103, 96–106, https://doi.org/10.1016/j.ijrmms.2018.01.025, 2018.
Csontos, L. and Vörös, A.: Mesozoic plate tectonic reconstruction of the Carpathian region, Palaeogeogr. Palaeocl., 210, 1–56, https://doi.org/10.1016/j.palaeo.2004.02.033, 2004.
Currie, J. B., Patnode, H. W., and Trump, R. P.: Development of Folds in Sedimentary Strata, Geol. Soc. Am. Bull., 73, 655–673, https://doi.org/10.1130/0016-7606(1962)73[655:DOFISS]2.0.CO;2, 1962.
Dabrowski, M., Krotkiewski, M., and Schmid, D. W.: MILAMIN: MATLAB-based finite element method solver for large problems: MILAMIN MATLAB-based FEM solver, Geochem. Geophy. Geosy., 9, Q04030, https://doi.org/10.1029/2007GC001719, 2008.
Filipescu, S., Tămaş, D. M., Bercea, R.-I., Tămaş, A., Bălc, R., Tabără, D., Bindiu-Haitonic, R., Silye, L., Auer, A., Krézsek, C., Schléder, Z., and Săsăran, E.: Biostratigraphic re-evaluation of the lower to middle Miocene succession in the Eastern Carpathians: a case study related to the oil fields of the Diapir Fold Zone, Romania, Geol. Q., 64, 781–800, https://doi.org/10.7306/gq.1554, 2020.
Fletcher, R. C. and Sherwin, J.: Arc lengths of single layer folds; a discussion of the comparison between theory and observation, Am. J. Sci., 278, 1085–1098, https://doi.org/10.2475/ajs.278.8.1085, 1978.
Fleuty, M. J.: The description of folds, Proc. Geol. Assoc., 75, 461–492, https://doi.org/10.1016/S0016-7878(64)80023-7, 1964.
Frehner, M. and Schmalholz, S. M.: Numerical simulations of parasitic folding in multilayers, J. Struct. Geol., 28, 1647–1657, https://doi.org/10.1016/j.jsg.2006.05.008, 2006.
Frehner, M. and Schmid, T.: Parasitic folds with wrong vergence: How pre-existing geometrical asymmetries can be inherited during multilayer buckle folding, J. Struct. Geol., 87, 19–29, https://doi.org/10.1016/j.jsg.2016.04.004, 2016.
Ghosh, S. K.: Experiments of buckling of multilayers which permit interlayer gliding, Tectonophysics, 6, 207–249, https://doi.org/10.1016/0040-1951(68)90052-8, 1968.
Herchen, K., Popp, T., Düsterloh, U., Lux, K.-H., Salzer, K., Lüdeling, C., Günther, R.-M., Rölke, C., Minkley, W., Hampel, A., Yildirim, S., Staudtmeister, K., Gährken, A., Stahlmann, J., Reedlunn, B., and Hansen, F. D.: WEIMOS: laboratory investigations of damage reduction and creep at small deviatoric stresses in rock salt, in: Proceedings of the conference on mechanical behavior of salt, SaltMech IX, Hannover, Germany, September 12–18, 175–192, 2018.
Hickman, S. H. and Evans, B.: Kinetics of pressure solution at halite-silica interfaces and intergranular clay films, J. Geophys. Res.-Sol. Ea., 100, 13113–13132, https://doi.org/10.1029/95JB00911, 1995.
Hobbs, B., Regenauer-Lieb, K., and Ord, A.: Folding with thermal–mechanical feedback, J. Struct. Geol., 30, 1572–1592, https://doi.org/10.1016/j.jsg.2008.09.002, 2008.
Hobbs, B., Regenauer-lieb, K., and Ord, A.: Folding with thermal mechanical feedback: Another reply, J. Struct. Geol., 32, 131–134, https://doi.org/10.1016/j.jsg.2009.10.005, 2010.
Hobbs, B. E., Regenauer-Lieb, K., and Ord, A.: Folding with thermal-mechanical feedback: A reply, J. Struct. Geol., 31, 752–755, https://doi.org/10.1016/j.jsg.2009.03.014, 2009.
Hodgetts, D., Gawthorpe, R. L., Wilson, P., and Rarity, F.: Integrating Digital and Traditional Field Techniques Using Virtual Reality Geological Studio (VRGS), 69th EAGE Conference and Exhibition incorporating SPE EUROPEC 2007, European Association of Geoscientists and Engineers, London, https://doi.org/10.3997/2214-4609.201401718, 2007.
Hudleston, P. J. and Treagus, S. H.: Information from folds: A review, J. Struct. Geol., 32, 2042–2071, https://doi.org/10.1016/j.jsg.2010.08.011, 2010.
Hunsche, U., Schulze, O., Walter, F., and Plischke, I.: Projekt gorleben 9G2138110000-Thermomechanisches Verhalten von Salzgestein, Abschlussbericht Hann. Bundesanst. Für Geowiss. Rohst., 38 pp., 2003.
Iorgulescu, T., Niculescu, N. I., and Pene, M.: Virsta unor massive de sare din RPR, Editura Academiei Republicii Populare Romine, Bucuresti, Romania, 1962.
Johnson, A. M. and Fletcher, R. C.: Folding of viscous layers: mechanical analysis and interpretation of structures in deformed rock, Columbia Univ. Press, New York, 461 pp., 1994.
Johnson, A. M. and Pfaff, V. J.: Parallel, similar and constrained folds, Eng. Geol., 27, 115–180, https://doi.org/10.1016/0013-7952(89)90032-X, 1989.
Jordan, P. G.: The deformational behaviour of bimineralic limestone-halite aggregates, Tectonophysics, 135, 185–197, https://doi.org/10.1016/0040-1951(87)90160-0, 1987.
Kenis, I., Urai, J., Vanderzee, W., Hilgers, C., and Sintubin, M.: Rheology of fine-grained siliciclastic rocks in the middle crust – evidence from structural and numerical analysis, Earth Planet. Sc. Lett., 233, 351–360, https://doi.org/10.1016/j.epsl.2005.02.007, 2005.
Kneuker, T., Zulauf, G., Mertineit, M., Behlau, J., and Hammer, J.: Deformationsverhalten von permischem Staßfurt-Steinsalz aus Morsleben (Deutschland) bei unterschiedlichem finitem Strain: Abschätzungen aus Mikrogefüge-Studien und EBSD-Analysen, Z. Dtsch. Ges. Geowiss., 165, 91–106, https://doi.org/10.1127/1860-1804/2013/0041, 2014.
Krabbendam, M., Urai, J. L., and Vliet, L. J.: Grain size stabilisation by dispersed graphite in a high-grade quartz mylonite: an example from Naxos (Greece), J. Struct. Geol., 25, 855–866, https://doi.org/10.1016/S0191-8141(02)00086-X, 2003.
Krézsek, C., Lăpădat, A., Maţenco, L., Arnberger, K., Barbu, V., and Olaru, R.: Strain partitioning at orogenic contacts during rotation, strike–slip and oblique convergence: Paleogene–Early Miocene evolution of the contact between the South Carpathians and Moesia, Glob. Planet. Change, 103, 63–81, https://doi.org/10.1016/j.gloplacha.2012.11.009, 2013.
Krotkiewski, M. and Dabrowski, M.: MUTILS – a set of efficient modeling tools for multi-core CPUs implemented in MEX, in: EGU General Assembly Conference Abstracts, Austria, EGU2013-7877, 2013.
Leitner, C., Neubauer, F., Urai, J. L., and Schoenherr, J.: Structure and evolution of a rocksalt-mudrock-tectonite: The haselgebirge in the Northern Calcareous Alps, J. Struct. Geol., 33, 970–984, https://doi.org/10.1016/j.jsg.2011.02.008, 2011.
Li, S., Abe, S., Urai, J. L., Strozyk, F., Kukla, P. A., and van Gent, H.: A method to evaluate long-term rheology of Zechstein salt in the Tertiary, in: Mechanical Behaviour of Salt VII, edited by: Bérest, P., Ghoreychi, M., Hadj-Hassen, F., and Tijani, M., Taylor & Francis Group, London, 215–220, 2012.
Llorens, M.-G., Bons, P. D., Griera, A., Gomez-Rivas, E., and Evans, L. A.: Single layer folding in simple shear, J. Struct. Geol., 50, 209–220, https://doi.org/10.1016/j.jsg.2012.04.002, 2013.
Matenco, L.: Tectonics and Exhumation of Romanian Carpathians: Inferences from Kinematic and Thermochronological Studies, in: Landform Dynamics and Evolution in Romania, edited by: Radoane, M. and Vespremeanu-Stroe, A., Springer International Publishing, Cham, 15–56, https://doi.org/10.1007/978-3-319-32589-7_2, 2017.
Motaş, C.: Nouvelles donnés sur les rapports structuraux entre les Carpathes Méridionales et la Depression Gétique, Analale Institutului Geol. Şi Geofiz., 60, 141–146, 1983.
Mukherjee, S., Talbot, C. J., and Koyi, H. A.: Viscosity estimates of salt in the Hormuz and Namakdan salt diapirs, Persian Gulf, Geol. Mag., 147, 497–507, 2010.
Murgoci, G. M.: Tertiary Formations of Oltenia with Regard to Salt, Petroleum, and Mineral Springs, J. Geol., 13, 670–712, 1905.
Popescu, G.: Cercetari geologice in regiunea Govora – Ramnicu-Valcea – Olanesti (Depresiunea Getica), Dari Seama Ale Sedintelor Com. Geol., 38, 118–136, 1954.
Price, N. J. and Cosgrove, J. W.: Analysis of geological structures, Reissued, Cambridge University Press, Cambridge, 502 pp., 1990.
Price, R. H.: Effects of anhydrite and pressure on the mechanical behavior of synthetic rocksalt, Geophys. Res. Lett., 9, 1029–1032, https://doi.org/10.1029/GL009i009p01029, 1982.
Răbăgia, T. and Maţenco, L.: Tertiary tectonic and sedimentological evolution of the South Carpathians foredeep: tectonic vs eustatic control, Mar. Pet. Geol., 16, 719–740, https://doi.org/10.1016/S0264-8172(99)00045-8, 1999.
Răbăgia, T., Matenco, L., and Cloetingh, S.: The interplay between eustacy, tectonics and surface processes during the growth of a fault-related structure as derived from sequence stratigraphy: The Govora–Ocnele Mari antiform, South Carpathians, Tectonophysics, 502, 196–220, https://doi.org/10.1016/j.tecto.2009.09.017, 2011.
Raith, A. F., Strozyk, F., Visser, J., and Urai, J. L.: Evolution of rheologically heterogeneous salt structures: a case study from the NE Netherlands, Solid Earth, 7, 67–82, https://doi.org/10.5194/se-7-67-2016, 2016.
Raith, A. F., Urai, J. L., and Visser, J.: Structural and microstructural analysis of K–Mg salt layers in the Zechstein 3 of the Veendam Pillow, NE Netherlands: development of a tectonic mélange during salt flow, Neth. J. Geosci., 96, 331–351, https://doi.org/10.1017/njg.2017.31, 2017.
Ramberg, H.: Contact strain and folding instability of a multilayered body under compression, Geol. Rundsch., 51, 405–439, https://doi.org/10.1007/BF01820010, 1962.
Ramberg, H. and Strömgård, K.-E.: Experimental tests of modern buckling theory applied on multilayered media, Tectonophysics, 11, 461–472, https://doi.org/10.1016/0040-1951(71)90052-7, 1971.
Ramsay, J. G. and Huber, M. I.: Folds and fractures, 6th reprinting., Acad. Press, London, 309 pp., 1987.
Renard, F., Dysthe, D., Feder, J., Bjørlykke, K., and Jamtveit, B.: Enhanced pressure solution creep rates induced by clay particles: Experimental evidence in salt aggregates, Geophys. Res. Lett., 28, 1295–1298, https://doi.org/10.1029/2000GL012394, 2001.
Rowan, M. G., Urai, J. L., Fiduk, J. C., and Kukla, P. A.: Deformation of intrasalt competent layers in different modes of salt tectonics, Solid Earth, 10, 987–1013, https://doi.org/10.5194/se-10-987-2019, 2019.
Săndulescu, M.: Geotectonica României, Editura Tehnică Bucureşti, Bucharest, Romania, 1984.
Săndulescu, M.: Cenozoic Tectonic History of the Carpathians, in: The Pannonian Basin: A Study in Basin Evolution, AAPG Memoir 45, edited by: Royden, L. H. and Horváth, F., AAPG, 17–25, 1988.
Sasvári, Á. and Baharev, A.: SG2PS (structural geology to postscript converter) – A graphical solution for brittle structural data evaluation and paleostress calculation, Comput. Geosci., 66, 81–93, https://doi.org/10.1016/j.cageo.2013.12.010, 2014.
Schenk, O. and Urai, J. L.: The migration of fluid-filled grain boundaries in recrystallizing synthetic bischofite: first results of in-situ high-pressure, high-temperature deformation experiments in transmitted light, J. Metamorph. Geol., 23, 695–709, https://doi.org/10.1111/j.1525-1314.2005.00604.x, 2005.
Schindelin, J., Arganda-Carreras, I., Frise, E., Kaynig, V., Longair, M., Pietzsch, T., Preibisch, S., Rueden, C., Saalfeld, S., Schmid, B., Tinevez, J.-Y., White, D. J., Hartenstein, V., Eliceiri, K., Tomancak, P., and Cardona, A.: Fiji: an open-source platform for biological-image analysis, Nat. Methods, 9, 676–682, https://doi.org/10.1038/nmeth.2019, 2012.
Schléder, Z.: Deformation mechanisms of naturally deformed rocksalt, Rheinisch-Westfälischen Technischen Hochschule Aachen, Aachen, 161 pp., 2006.
Schléder, Z. and Urai, J. L.: Microstructural evolution of deformation-modified primary halite from the Middle Triassic Röt Formation at Hengelo, The Netherlands, Int. J. Earth Sci., 94, 941–955, https://doi.org/10.1007/s00531-005-0503-2, 2005.
Schléder, Z. and Urai, J. L.: Deformation and recrystallization mechanisms in mylonitic shear zones in naturally deformed extrusive Eocene–Oligocene rocksalt from Eyvanekey plateau and Garmsar hills (central Iran), J. Struct. Geol., 29, 241–255, https://doi.org/10.1016/j.jsg.2006.08.014, 2007.
Schléder, Z., Burliga, S., and Urai, J. L.: Dynamic and static recrystallization-related microstructures in halite samples from the Klodawa salt wall (central Poland) as revealed by gamma-irradiation, Neues Jahrb. Für Mineral.-Abh., 184, 17–28, https://doi.org/10.1127/0077-7757/2007/0079, 2007.
Schmalholz, S. M. and Mancktelow, N. S.: Folding and necking across the scales: a review of theoretical andexperimental results and their applications, Solid Earth, 7, 1417–1465, https://doi.org/10.5194/se-7-1417-2016, 2016.
Schmalholz, S. M. and Podladchikov, Y. Y.: Strain and competence contrast estimation from fold shape, Tectonophysics, 340, 195–213, https://doi.org/10.1016/S0040-1951(01)00151-2, 2001.
Schmalholz, S. M. and Schmid, D. W.: Folding in power-law viscous multi-layers, Philos. T. R. Soc.-Math. Phys. Eng. Sc., 370, 1798–1826, https://doi.org/10.1098/rsta.2011.0421, 2012.
Schmalholz, S. M. and Urai, J.: Rheology of Anhydrite during deformation in nature: a first look, in: EGU General Assembly Conference Abstracts, Austria, 14871, 2014.
Schmid, D. W. and Podladchikov, Y. Y.: Fold amplification rates and dominant wavelength selection in multilayer stacks, Philos. Mag., 86, 3409–3423, https://doi.org/10.1080/14786430500380175, 2006.
Schmid, D. W., Schmalholz, S. M., Mancktelow, N. S., and Fletcher, R. C.: Comment on “Folding with thermal-mechanical feedback”, J. Struct. Geol., 32, 127–130, https://doi.org/10.1016/j.jsg.2009.10.004, 2010.
Schmid, S. M., Bernoulli, D., Fügenschuh, B., Matenco, L., Schefer, S., Schuster, R., Tischler, M., and Ustaszewski, K.: The Alpine-Carpathian-Dinaridic orogenic system: correlation and evolution of tectonic units, Swiss J. Geosci., 101, 139–183, https://doi.org/10.1007/s00015-008-1247-3, 2008.
Schoenherr, J., Urai, J. L., Kukla, P. A., Littke, R., Schléder, Z., Larroque, J.-M., Newall, M. J., Al-Abry, N., Al-Siyabi, H. A., and Rawahi, Z.: Limits to the sealing capacity of rock salt: A case study of the infra-Cambrian Ara Salt from the South Oman salt basin, AAPG Bull., 91, 1541–1557, https://doi.org/10.1306/06200706122, 2007.
Sherwin, T.-A. and Chapple, W. M.: Wavelengths of single layer folds: a comparison between theory and observation, Am. J. Sci., 266, 167–179, 1968.
Shewchuk, J. R.: Triangle: Engineering a 2D quality mesh generator and Delaunay triangulator, in: Applied Computational Geometry Towards Geometric Engineering, Berlin, Heidelberg, 203–222, 1996.
Słotwiński, M., Adamuszek, M., and Burliga, S.: Numerical study of tectonic structure evolution in a multi-layer evaporite sequence, J. Struct. Geol., 134, 104011, https://doi.org/10.1016/j.jsg.2020.104011, 2020.
Stoica, C. and Gherasie, I.: Sarea si sărurile de potasiu si magneziu din România, Craiova, Romania, 1981.
Talbot, C. J.: Fold trains in a glacier of salt in southern Iran, J. Struct. Geol., 1, 5–18, https://doi.org/10.1016/0191-8141(79)90017-8, 1979.
Talbot, C. J.: Can field data constrain rock viscosities?, J. Struct. Geol., 9, 949–957, https://doi.org/10.1016/S0191-8141(99)00037-1, 1999.
Talbot, C. J., Medvedev, S., Alavi, M., Shahrivar, H., and Heidari, E.: Salt extrusion at Kuh-e-Jahani, Iran, from June 1994 to November 1997, Geol. Soc. Lond. Spec. Publ., 174, 93–110, https://doi.org/10.1144/GSL.SP.1999.174.01.06, 2000.
Tămaş, D. M., Schléder, Z., Krézsek, C., Man, S., and Filipescu, S.: Understanding salt in orogenic settings: The evolution of ideas in the Romanian Carpathians, AAPG Bull., 102, 941–958, https://doi.org/10.1306/0913171615517088, 2018.
Tămaş, D. M., Tămaş, A., Jüstel, A. M., Passchier, M., Chudalla, N., Gotzen, L., Pizano-Wagner, L. A., Taṣcu-Stavre, T., Schléder, Z., Krézsek, C., Filipescu, S., and Urai, J. L.: A Field Guide to the Spectacular Salt Mines of the Transylvanian Basin and Romanian Carpathians, in: Structural Geology and Tectonics Field Guidebook, Vol. 1, edited by: Mukherjee, S., Springer, 167–187, https://doi.org/10.1007/978-3-030-60143-0_6, 2021a.
Tămaş, D. M., Tămaş, A., Barabasch, J., Rowan, M. G., Schleder, Z., Krézsek, C., and Urai, J. L.: Low-Angle Shear Within the Exposed Mânzăsleti Diapir, Romania: Salt Decapitation in the Eastern Carpathians Fold-and-Thrust Belt, Tectonics, 40, e2021TC006850, https://doi.org/10.1029/2021TC006850, 2021b.
Ter Heege, J. H., De Bresser, J. H. P., and Spiers, C. J.: Rheological behaviour of synthetic rocksalt: the interplay between water, dynamic recrystallization and deformation mechanisms, J. Struct. Geol., 27, 948–963, https://doi.org/10.1016/j.jsg.2005.04.008, 2005.
Thiemeyer, N.: The application of high resolution X-ray computed tomography on naturally deformed rock salt: Multi-scale investigations of the structural inventory, J. Struct. Geol., 15, 92–106, https://doi.org/10.1016/j.jsg.2015.05.014, 2015.
Thiemeyer, N., Zulauf, G., Mertineit, M., Linckens, J., Pusch, M., and Hammer, J.: Microfabrics and 3D grain shape of Gorleben rock salt: Constraints on deformation mechanisms and paleodifferential stress, Tectonophysics, 676, 1–19, https://doi.org/10.1016/j.tecto.2016.02.046, 2016.
Treagus, S. H.: Viscous anisotropy of two-phase composites, and applications to rocks and structures, Tectonophysics, 372, 121–133, https://doi.org/10.1016/S0040-1951(03)00239-7, 2003.
Treagus, S. H. and Fletcher, R. C.: Controls of folding on different scales in multilayered rocks, J. Struct. Geol., 31, 1340–1349, https://doi.org/10.1016/j.jsg.2009.07.009, 2009.
Treagus, S. H. and Hudleston, P. J.: Folding with thermal–mechanical feedback: Discussion, J. Struct. Geol., 31, 749–751, https://doi.org/10.1016/j.jsg.2009.03.015, 2009.
Trimby, P. W., Drury, M. R., and Spiers, C. J.: Misorientations across etched boundaries in deformed rocksalt: a study using electron backscatter diffraction, J. Struct. Geol., 22, 81–89, https://doi.org/10.1016/S0191-8141(99)00126-1, 2000.
Urai, J. L.: Water assisted dynamic recrystallization and weakening in polycrystalline bischofite, Tectonophysics, 96, 125–157, https://doi.org/10.1016/0040-1951(83)90247-0, 1983.
Urai, J. L.: Water-enhanced dynamic recrystallization and solution transfer in experimentally deformed carnallite, Tectonophysics, 120, 285–317, https://doi.org/10.1016/0040-1951(85)90055-1, 1985.
Urai, J. L.: Carnallit – thermisches und thermomechanisches Verhalten in Endlager-Salzstoecken; diskussion; Carnallite - thermal and thermomechanic properties in salt domes; discussion, Z. Dtsch. Geol. Ges., 138, 239–241, 1987a.
Urai, J. L.: Development of microstructure during deformation of carnallite and bischofite in transmitted light, Tectonophysics, 135, 251–263, https://doi.org/10.1016/0040-1951(87)90166-1, 1987b.
Urai, J. L. and Boland, J. N.: Development of microstructures and the origin of hematite in naturally deformed carnallite, Neues Jahrb. Für Mineral. – Monatshefte H2, 58–72, 1985.
Urai, J. L. and Spiers, C. J.: The effect of grain boundary water on deformation mechanisms and rheology of rocksalt during long-term deformation, in: The Mechanical Behavior of Salt – Understanding of THMC Processes in Salt, edited by: Wallner, M., Lux, K.-H., Minkley, W., and Hardy, H. R., CRC Press, 149–158, https://doi.org/10.1201/9781315106502-17, 2007.
Urai, J. L., Spiers, C. J., Zwart, H. J., and Lister, G. S.: Weakening of rock salt by water during long-term creep, Nature, 324, 554–557, https://doi.org/10.1038/324554a0, 1986.
Urai, J. L., Spiers, C. J., Peach, C. J., Franssen, R. C. M. W., and Liezenberg, J. L.: Deformation Mechanisms Operating in Naturally Deformed Halite Rocks as Deduced from Microstructural Investigations, Geol. En Mijnb., 66, 165–176, 1987.
Urai, J. L., Schleder, Z., Spiers, C. J., and Kukla, P. A.: Flow and Transport Properties of Salt Rocks, in: Dynamics of Complex Intracontinental Basins: The Central European Basin System, Springer, 277–290, 2008a.
Urai, J. L., Schléder, Z., Spiers, C. J., and Kukla, P. A.: Flow and Transport Properties of Salt Rocks, in: Dynamics of complex intracontinental basins: The Central European Basin System, edited by: Littke, R., Bayer, U., Gajewski, D., and Nelskamp, S., Springer-Verlag Berlin Heidelberg, 277–290, 2008b.
von Hagke, C., Bamberg, B., Virgo, S., and Urai, J. L.: Outcrop-scale tomography: Insights into the 3D structure of multiphase boudins, J. Struct. Geol., 115, 311–317, https://doi.org/10.1016/j.jsg.2018.02.014, 2018.
Weinberg, R. F.: The upward transport of inclusions in Newtonian and power-law salt diapirs, Tectonophysics, 228, 141–150, https://doi.org/10.1016/0040-1951(93)90337-J, 1993.
Weinberger, R., Lyakhovsky, V., Baer, G., and Begin, Z. B.: Mechanical modeling and InSAR measurements of Mount Sedom uplift, Dead Sea basin: Implications for effective viscosity of rock salt: mount sedom uplift modeling, Geochem. Geophy. Geosy., 7, Q05014, https://doi.org/10.1029/2005GC001185, 2006.
Zamfirescu, F., Mocuta, M., Constantinescu, T., Nita, C., and Danchiv, A.: The main causes and processes of instability at Field II of Ocnele Mari, Romania, in: Solution Mining Research Institute, Technical Conference, Tech. Conf., 1–7, 2007.
Závada, P., Desbois, G., Schwedt, A., Lexa, O., and Urai, J. L.: Extreme ductile deformation of fine-grained salt by coupled solution-precipitation creep and microcracking: Microstructural evidence from perennial Zechstein sequence (Neuhof salt mine, Germany), J. Struct. Geol., 37, 89–104, https://doi.org/10.1016/j.jsg.2012.01.024, 2012.
Závada, P., Desbois, G., Urai, J. L., Schulmann, K., Rahmati, M., Lexa, O., and Wollenberg, U.: Impact of solid second phases on deformation mechanisms of naturally deformed salt rocks (Kuh-e-Namak, Dashti, Iran) and rheological stratification of the Hormuz Salt Formation, J. Struct. Geol., 74, 117–144, https://doi.org/10.1016/j.jsg.2015.02.009, 2015.
- Abstract
- Introduction
- Regional setting in Carpathian geology
- Ocnele Mari salt mine
- Multilayer buckle fold analysis
- Methods
- Results
- Discussion
- Conclusions
- Code availability
- Data availability
- Author contributions
- Competing interests
- Disclaimer
- Acknowledgements
- Financial support
- Review statement
- References
- Supplement