the Creative Commons Attribution 4.0 License.
the Creative Commons Attribution 4.0 License.
 | 06 Apr 2021
Multi-scale analysis and modelling of aeromagnetic data over the Bétaré-Oya area in eastern Cameroon, for structural evidence investigations
Christian Emile Nyaban
Théophile Ndougsa-Mbarga
Marcelin Bikoro-Bi-Alou
Stella Amina Manekeng Tadjouteu
Stephane Patrick Assembe
This study was carried out in the Lom series in Cameroon, at the border with Central African Republic, located between the latitudes 5∘30′–6∘ N and the longitudes 13∘30′–14∘45′ E. A multi-scale analysis of aeromagnetic data combining tilt derivative, Euler deconvolution, upward continuation, and 2.75D modelling was used. The following conclusions were drawn. (1) Several major families of faults were mapped. Their orientations are ENE–WSW, E–W, NW–SE, and N–S with a NE–SW prevalence. The latter are predominantly sub-vertical with NW and SW dips and appear to be prospective for future mining investigations. (2) The evidence of compression, folding, and shearing axis was concluded from superposition of null contours of the tilt derivative and Euler deconvolution. The principal evidence of the local tectonics was due to several deformation episodes (D1, D2, and D4) associated with NE–SW, E–W, and NW–SE events, respectively. (3) Depths of interpreted faults range from 1000 to 3400 m. (4) Several linear structures correlating with known mylonitic veins were identified. These are associated with the Lom faults and represent the contacts between the Lom series and the granito-gneissic rocks; we concluded the intense folding was caused by senestral and dextral NE–SW and NW–SE stumps. (5) We propose a structural model of the top of the crust (schists, gneisses, granites) that delineates principal intrusions (porphyroid granite, garnet gneiss, syenites, micaschists, graphite, and garnet gneiss) responsible for the observed anomalies. The 2.75D modelling revealed many faults with a depth greater than 1200 m and confirmed the observations from reduced-to-Equator total magnetic intensity (RTE-TMI), tilt derivative, and Euler deconvolution. (6) We developed a lithologic profile of the Bétaré-Oya basin.
- Article
(10098 KB) - Full-text XML
- BibTeX
- EndNote


There is a renewed interest in magnetic methods for solid mineral, hydrocarbon, and geological research. During data interpretation, the first crucial step is the removal of the effect of deep-seated structures from the observed total magnetic field to enhance shallow body signatures (Ndougsa et al., 2013). These shallow bodies in mining exploration are generally associated with mineral substances which have magnetic properties (Ndougsa et al., 2013). In our study, magnetic fabrics are signalled by Kankeu et al. (2009). The second step is mapping the causative body's edges, which is fundamental to the use of potential field data for geological mapping. The edge detection techniques are used to distinguish between different sizes and different depths of the geological discontinuities (Oruç et al., 2011). There have been several methods proposed to help normalize the magnetic signatures in images. Cordell and Grauch (1985) have suggested a method to locate horizontal extents of the sources from the maxima of horizontal gradient of the pseudo-gravity computed from the magnetic anomalies. Verduzco et al. (2004) discussed the use of tilt derivatives from gravity or magnetic field anomaly maps using the horizontal gradient magnitude of the tilt derivative as an edge detector for vertical contacts.
Salem et al. (2008) developed a new interpretation method for gridded magnetic data based on the tilt derivative, without specifying prior information about the nature of the source. In this article, we have used the approach of Salem et al. (2007) for the location of vertical contacts and source depth. In addition, because the identified source has a non-uniform volume from the roof to the bottom, we examine how this volume varies with depth by using upward continuation of magnetic anomaly.
2.1 Regional setting
The following structural domains can be distinguished in the Pan-African Belt north of the Congo craton (Toteu et al., 2004; Fig. 1):
- a.
a pre-collisional stage that includes the emplacement of pre-tectonic calc-alkaline granitoids (e.g. at 660–670 Ma);
- b.
a syn-collisional stage inducing crustal thickening and delamination of the subcrustal lithospheric mantle and comprising D1 and D2 deformations and S-type granitoids (640–610 Ma; Toteu et al., 2004);
- c.
a post-collisional stage associated with D3 deformation (nappe and wrench) concomitant with the exhumation of granulites, development of D4 shear zones, and emplacement of late-tectonic calc-alkaline to sub-alkaline granitoids (600–570 Ma).
The Pan-African formations of Cameroon belong to the mobile zone of central Africa (Bessoles and Trompette, 1980), also known as the Oubanguide chain (Poidevin, 1985). It is attached to the east to Pan-African formations of the Mozambican belt of sub-meridian orientation. To the west, it extends to the north of Brazil by the Sergipe range. Two large dextral mylonitic shear zones, the Sanaga Fault (Dumont, 1986) and the central Cameroon shear zone, cross Cameroon from the north-east to the south-west. These major shears belong to the Oubanguides setback zone (Rolin, 1995), which runs continually from the Gulf of Guinea to the Gulf of Aden (Cornacchia and Dars, 1983). Geologically, the Pan-African mobile chain is composed of granites, schists, micaschists, and migmatites (Poidevin, 1985).
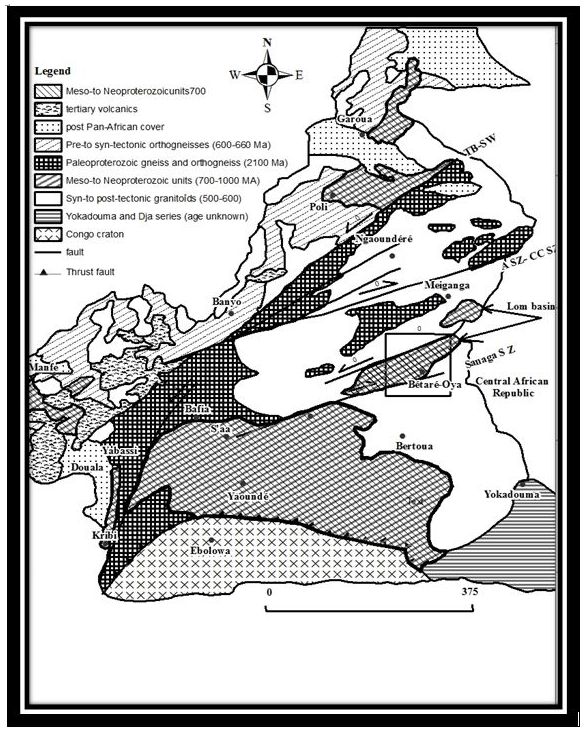
Figure 1Geologic map of Cameroon, modified from Kankeu et al. (2009) and available in the public domain, showing major lithotectonic units: ASZ, Adamaoua shear zone; CCSZ, central Cameroon shear zone; TBSZ, Tcholliré-Banyo shear zone. The location of the study area is marked by a box and shown in detail in Fig. 2.
Local setting
The study area is in eastern Cameroon; it is bounded by northern latitudes 5∘30′–6∘ and eastern longitudes 13∘30′–14∘45′ (Fig. 2). The lithology comprises the Lom series, a sequence of Neoproterozoic rocks consisting of metasedimentary and metavolcanic rocks with late granitic intrusions (Ngako et al., 2003). The lithologic units have a strong NE–SW regional foliation deflected in places by the granitic pluton reflecting dextral and sinistral shear senses. The rocks have been metamorphosed to greenschist facies and hydrothermal alteration especially around the granitic plutons (Odey Omang et al., 2014). Gold is sporadically identified in NE–SW quartz veins associated with early pyrite, whereas a vug-filling late pyritization event is barren (Asaah, 2010; Nih-Fon et al., 2012).
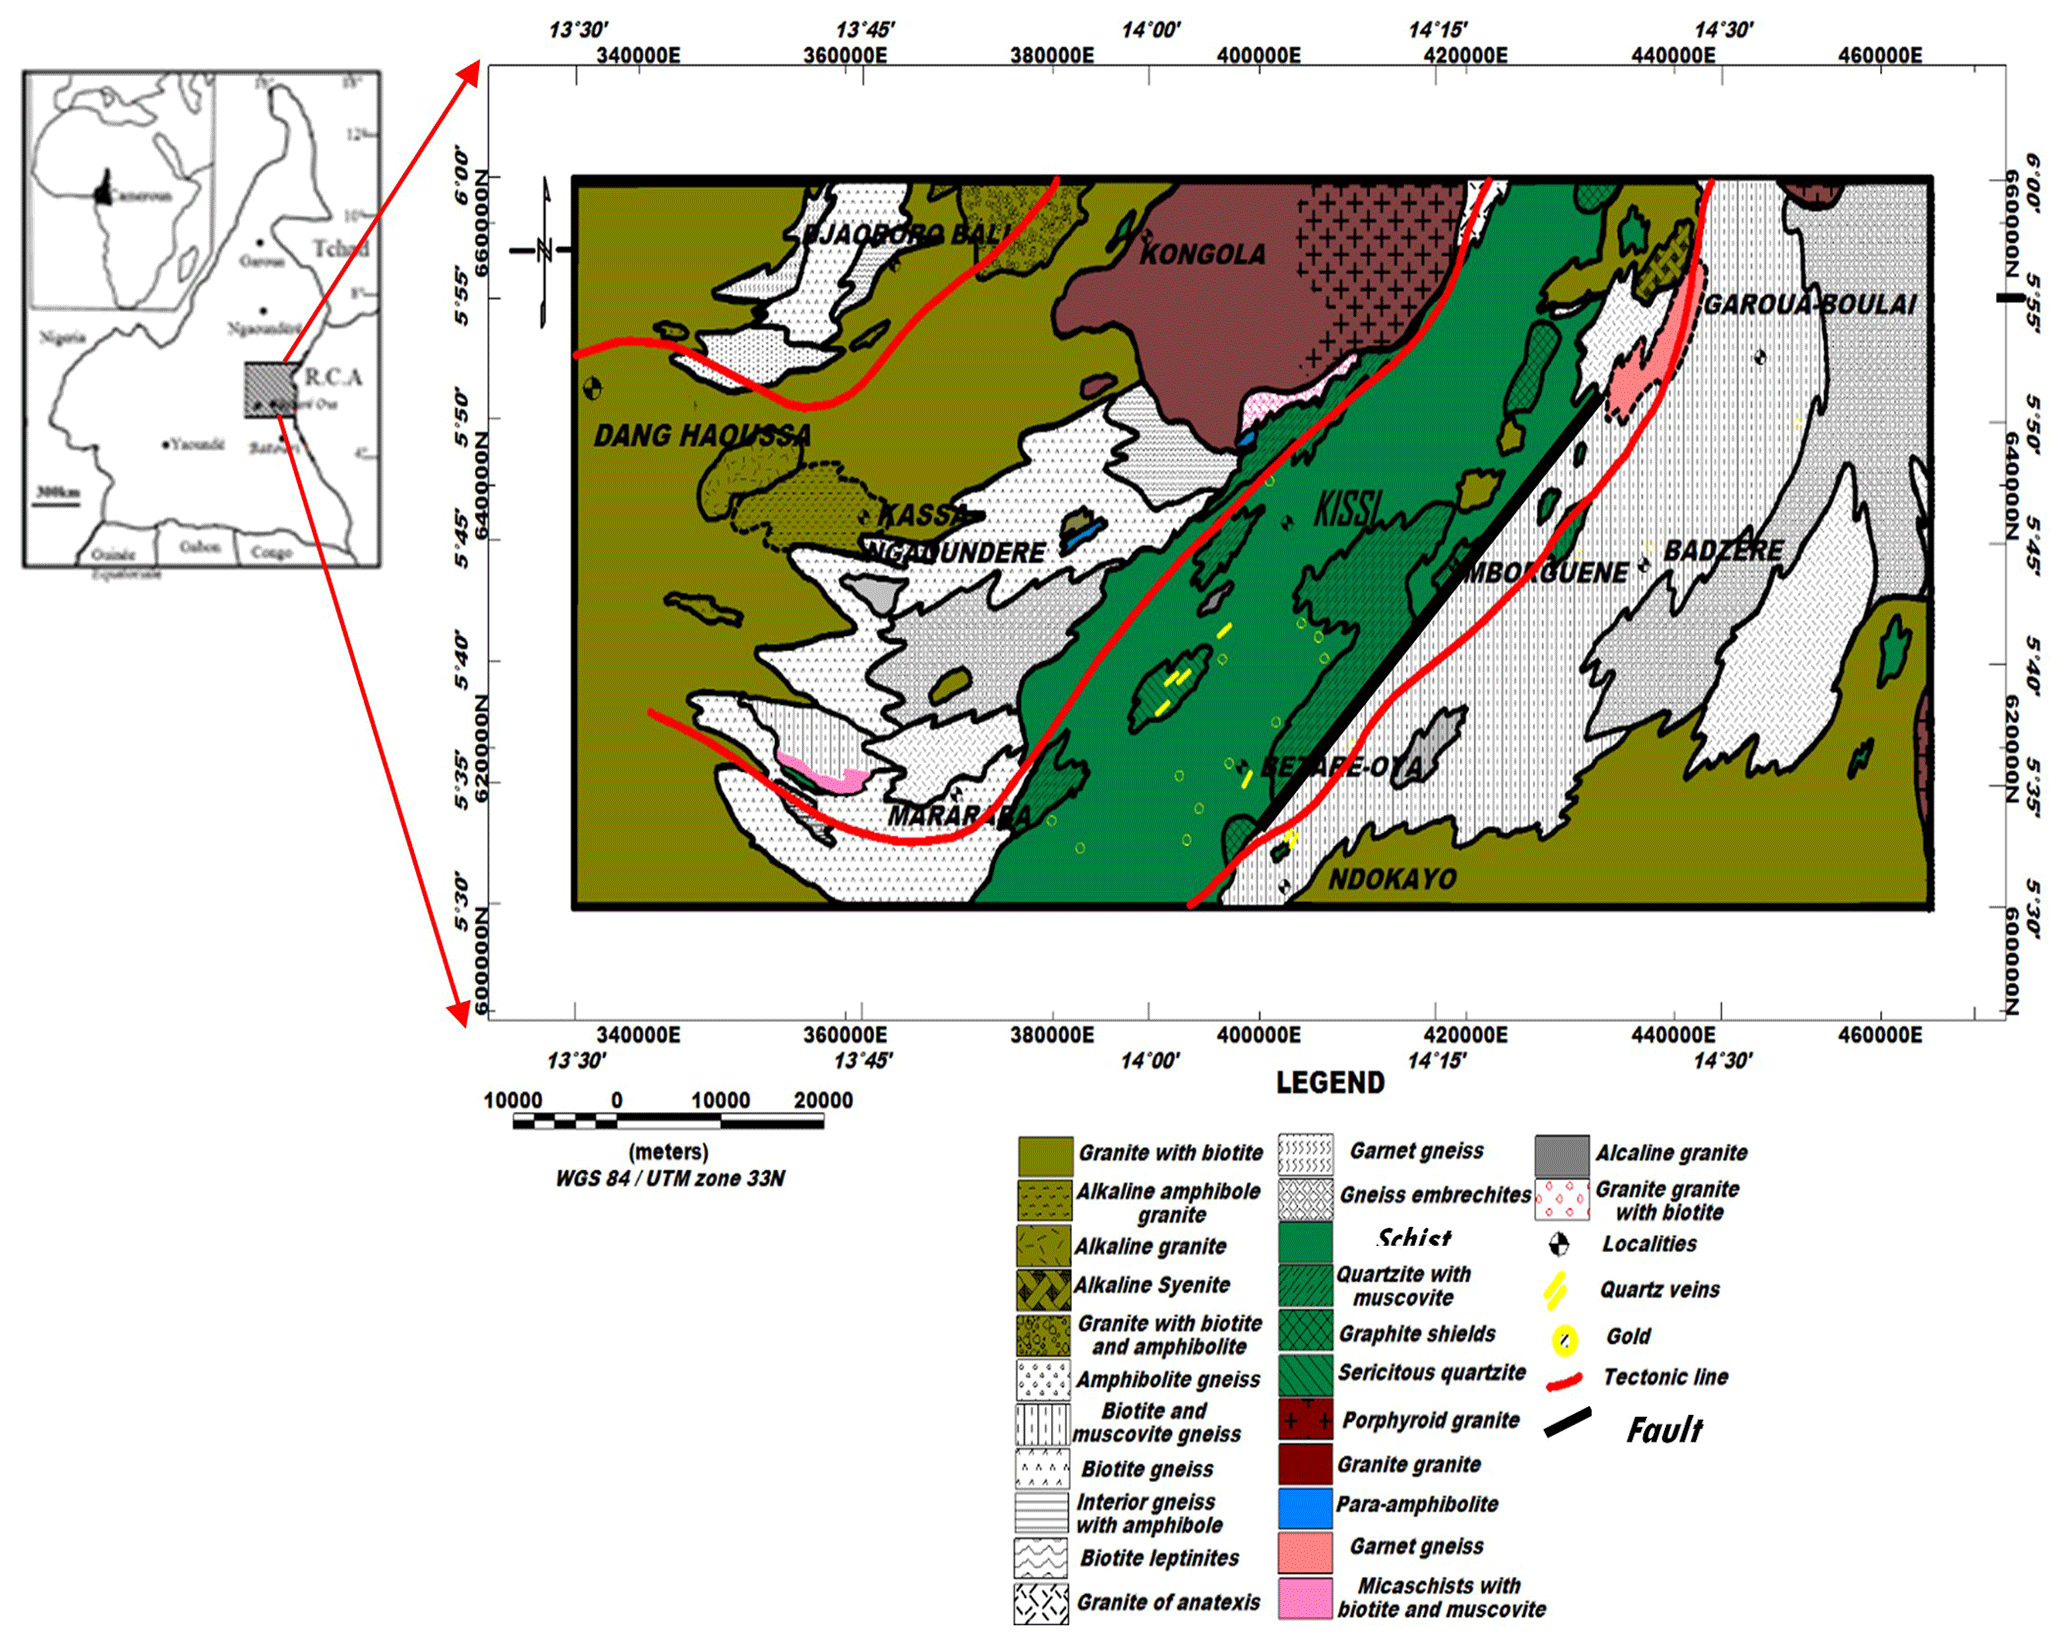
Figure 2Geological map of the study area (Gazel and Gerard, 1954, modified as a document available in the public domain). In the centre we have the Lom series marked by its greenschist facies. We can also perceive in red the tectonic lines that cross the study area.
The orography and hydrographic network is structurally guided (Kouske, 2006), sub-divided into three major morphological units. The high-altitude unit (800–1092 m) which is a vast peneplain enamelled by interfluves with multiple vertices of alignment oriented NW–SE, N–S, and NE–SW. The low-altitude unit (652–760 m) is a large flat-bottomed depression, in the centre of which is a U-shaped valley, oriented NE–SW, within which flows the Lom river and the intermediate unit (760–860 m), which corresponds to a long NE–SW-oriented cliff connecting the high-altitude unit to that of low altitude. In its northern part, this unit has an E–W orientation.
2.2 Geophysical constraints
Seismic anisotropy in Cameroon has been studied by Koch et al. (2012) through analysis of SKS splitting, which allowed four regions of distinct anisotropy to be identified: moderately strong NE–SW-oriented fast polarization directions (δt≈1.0 s) beneath two regions, the Congo Craton in the south and the Garoua rift in the north; weak anisotropy (δt≈0.3 s) between the Congo Craton and the CVL; N–S-oriented fast polarization directions within the CVL, with δt≈0.7 s (Koch et al., 2012). Benkhelil et al. (2002) used seismic data and proposed a structural and chronostratigraphic scheme of the southern Cameroon basin (clayey sand, dolomitic to calcite sandstone, marls and sandstone, dolomitic sandstone, granite, gneiss).
Gravity studies were carried out, and Tadjou et al. (2004) identified many structures like contacts, dykes, fractures, and faults in the transition zone between the Congo Craton and the Pan-African Belt in central Africa. Shandini et al. (2011) found evidence in the northern margin of the Congo Craton of a deep structure, which corresponds to a classical model of the collision suture of the West African Craton and Pan-African Belt.
Owono et al. (2019) used 2.75D modelling of aeromagnetic data in Bertoua and showed intrusive bodies composed of gneiss and porphyroid granite and some domes with their roof situated at various depths not exceeding 1800 m from the surface. The structural map of the study area shows the trending of the structural features observed, namely, NE–SW, NW–SE, ENE–WSW, and WNW–ESE, while the E–W and N–S are secondary orientations of the observed tectonic evidence.
3.1 Data acquisition and processing
The aeromagnetic data were collected in Cameroon by Survair Limited through the Cameroon–Canada cooperation framework in the 1970s. Data were collected along N–S flight lines at 750 m spacing, with a flying height of 235 m; the measurements involved a magnetometer with a sensitivity of 0.5 nT (Paterson et al., 1976). Aeromagnetic anomaly maps have been digitized using the geographical information system software (Mapinfo Pro. 16.0) and interpolated on a grid with 750 m cells. The estimate error introduced is 0.28 mm, which is usually considered to be the distinctive capacity of human vision (Achilleos, 2010). Gridding and processing were done with Geosoft v8.4 software. The IGRF-70 reference field values were removed from the observed magnetic data as stated by Reeves (2005).
3.2 Methods
3.2.1 Upward continuation
The upward continuation computes the magnetic field that would have been measured further away from the source, with is the smoothing operation. The upward continuation was proposed by Henderson and Zietz (1949) and described by Blakely (1996). In this study it helps us to easily visualize the effects of the deep sources and to remove their effect.
3.2.2 The tilt-angle approach
The tilt angle (Miller and Singh 1994; Verduzco et al., 2004; Salem et al., 2007) is defined by Eq. (1) below for a potential field anomaly T:
where is the horizontal gradient magnitude and is the vertical gradient; , are the horizontal gradients along the x and y directions, respectively.
In 2007, Salem et al. (2007) extended the method to the determination of depth to source by relating the depth Zc of the source and its horizontal location h to the tilt angle through Eq. (2):
This means that the vertical contacts are located for a nil tilt (h=0), and the depth corresponds to horizontal distance between 0 and ±45∘ contours, i.e. (Salem et al., 2007).
3.2.3 Qualitative analysis by tilt-angle derivative
The tilt-angle operator can be used for mapping geological structures because it permits their contacts and their shapes to be located and delimited (Miller and Singh, 1994). By coupling it to the extension upward, it becomes more interesting because one obtains the lateral extension of body but also of depth and therefore its three-dimensional shape. Salem et al. (2007) proposed the use of tilt angle for the localization of vertical contacts, knowing that the upward continuation operator can attenuate short wavelengths and allow long wavelengths to be visualized (Henderson and Zietz, 1949). We can therefore use it for a better visualization of the behaviour of contacts with depth. Thus, we have
-
generated the total magnetic intensity (TMI) maps reduced to the Equator and then applied upward continuation for 1 and 2 km,
-
computed the position of the contact considered as vertical of these different three maps using Salem et al. (2007), and
-
finally superimposed the different contact maps obtained to evaluate the continuity of the sources. This technique is used in the qualitative analysis for tilt-derivative results.
3.2.4 Euler deconvolution
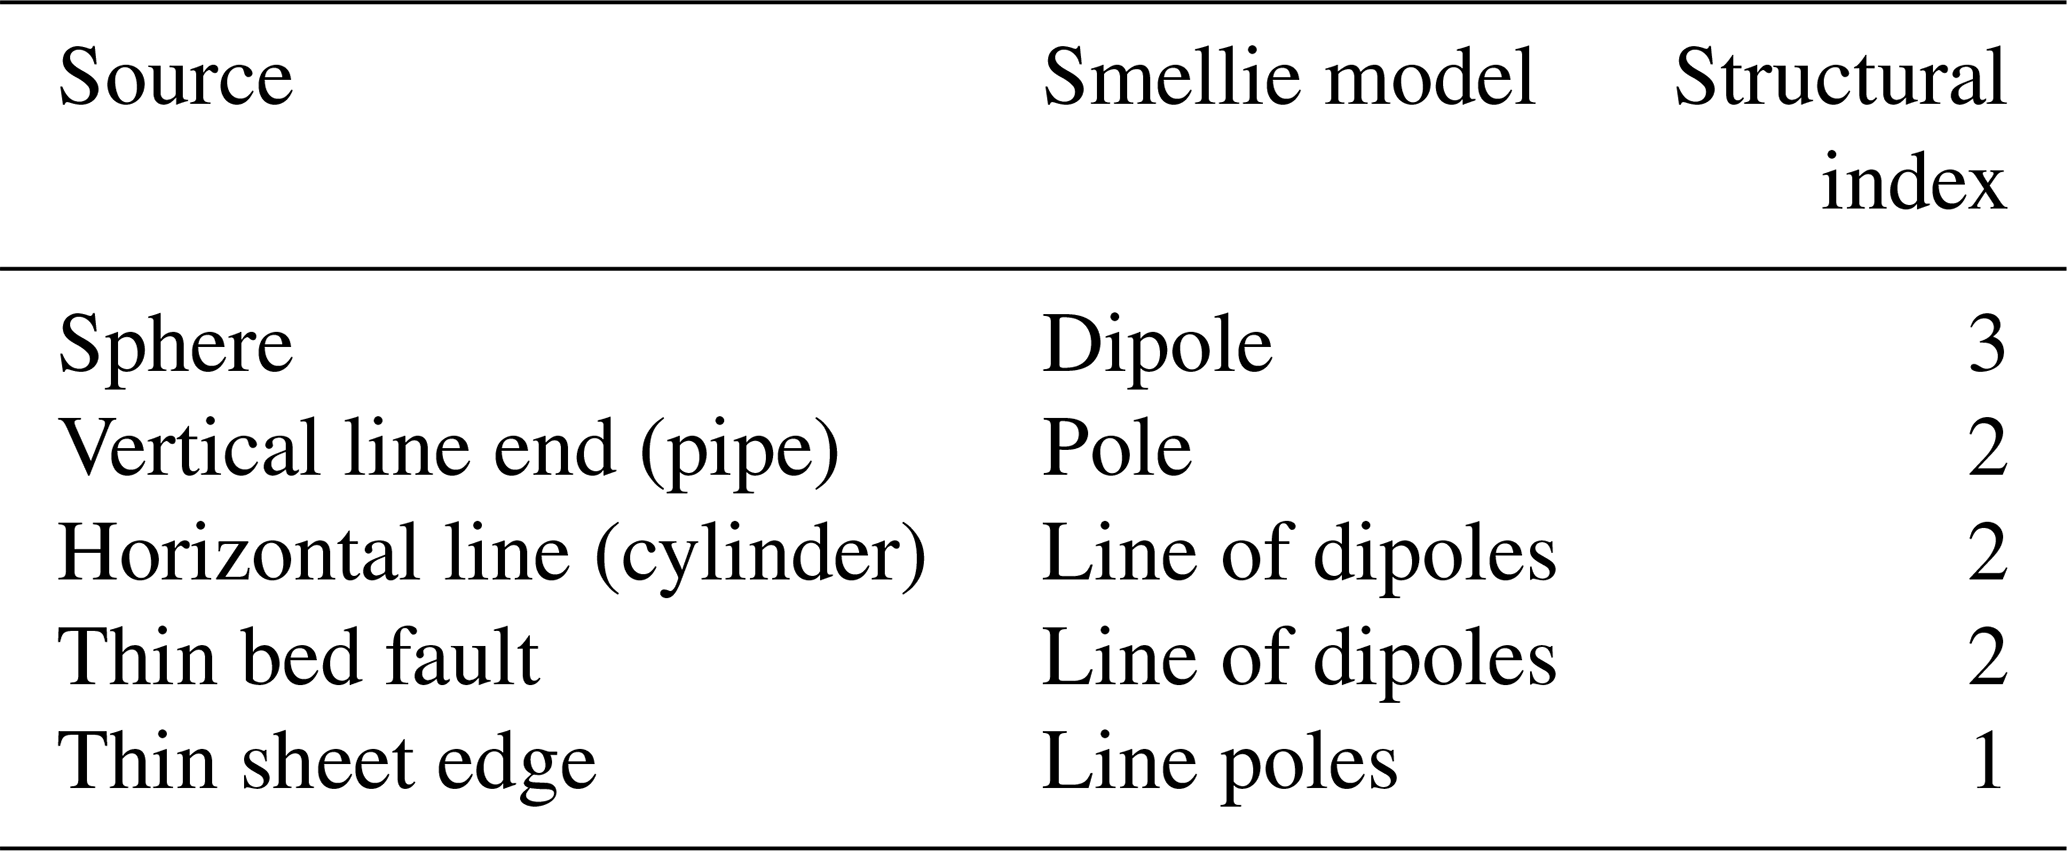
This method was introduced by Thompson (1982) based on the Euler homogeneity equation to solve for the source depths for profile data. Reid et al. (1990) extended the operator to gridded data by using Eq. (3):
where () represents the coordinates of the observation point; () represents the coordinate of the magnetic source; M and B are the field at the observation point and regional the field respectively; and N, the structural index, characterizes the variation rate of the field in relation to the distance due to the type of source (Table 1). In this study, we take the advantage of the clustering in depth to define the correct structural index.
Table 1Structural index for magnetic sources of different geometries.
3.2.5 2.75D modelling
A particularly useful variation on the 2D model, which removes the restriction of infinite strike length and is easier to define than the more complex 3D model, is a model with constant cross section extending over a finite strike length. This is known as a 2.5D model. When the source can have different strike extents on either side of the modelled profile, or the strike or plunge of the body is not perpendicular to the profile, this is called a 2.75D model.
The 2.75D model represents the subsurface as a series of polygonal prisms with horizontal axes (x) and finite extent in the strike direction (y). This method was described by Skalbeck et al. (2005). Geologic models were constructed with a GM-SYS operator of Geosoft using the 2.75D modelling algorithm from Won and Bevis (1987), based on the analyses of Rasmussen and Pedersen (1979). The 2.75D model gives the interpreter control of the third dimension without the complexity of defining and manipulating a full 3D model.
After interpolation, data have been reduced to the Equator using the Fourier transform performed with inclination ∘ and declination ∘ of 1 January 1970. Our choice of declination and inclination values for the IGRF is included in the interval of validity defined by the latest IGRF-12 (Thébault et al., 2015). This transformation eliminated the tilt of the Earth's magnetic field due to inclination and positioned anomalies directly above the corresponding magnetic source.
4.1 Interpretation of the aeromagnetic total field reduced to Equator (RTE)
The magnetic field over the Bétaré-Oya area has a complex magnetic pattern (Fig. 3). For better characterization of the geological structures, we subdivided the area into different units.
4.1.1 Unit A
The major observable singularity is in the centre where a large anomaly about 5 km wide and up to 100 nT is observed. It is oriented NE–SW along the major tectonic feature in this area, namely the tectonic line of the Sanaga (Fig. 1). Comparing with the geological map in Fig. 2, this signal is mainly due to volcano-clastic schists (with gold deposit), also called Lom schists, associated with conglomeratic quartzites with intrusions of granitoids (Kankeu et al., 2009). Hence, the presence of the anomalies with similar signatures could be related to the circulation of hydrothermal fluids rich in magnetic minerals along the Bétaré-Oya shear zone (BOSZ).
4.1.2 Unit B–C
In the north-eastern part of Bétaré-Oya, particularly around Badzéré, two heterogeneous anomalies are observed. They are in the south of the area at Ndokayo, with very long wavelength of about 22 km. Their amplitudes are quite high and reach 120 nT. They are aligned with one of the major foliations in this area trending E–W. The shape and amplitude of these anomalies suggest high magnetization of the causative bodies, such as igneous granitoids known to be in this area.
4.1.3 Unit D–E
In Mararaba and Kassa, there is a large magnetic anomaly (Fig. 3). It is characterized by a long wavelength with variable amplitude reaching 150 nT; its approximate direction is ENE–WSW. We can also observe anomalies of 100 and 20 nT intensity; elongated shapes; circular and semi-circular shapes; and short wavelengths oriented ENE–WSW, NW–SE, and NE–SW corresponding to structural directions in the study area (Kankeu et al., 2009; Nih-Fon et al., 2012).
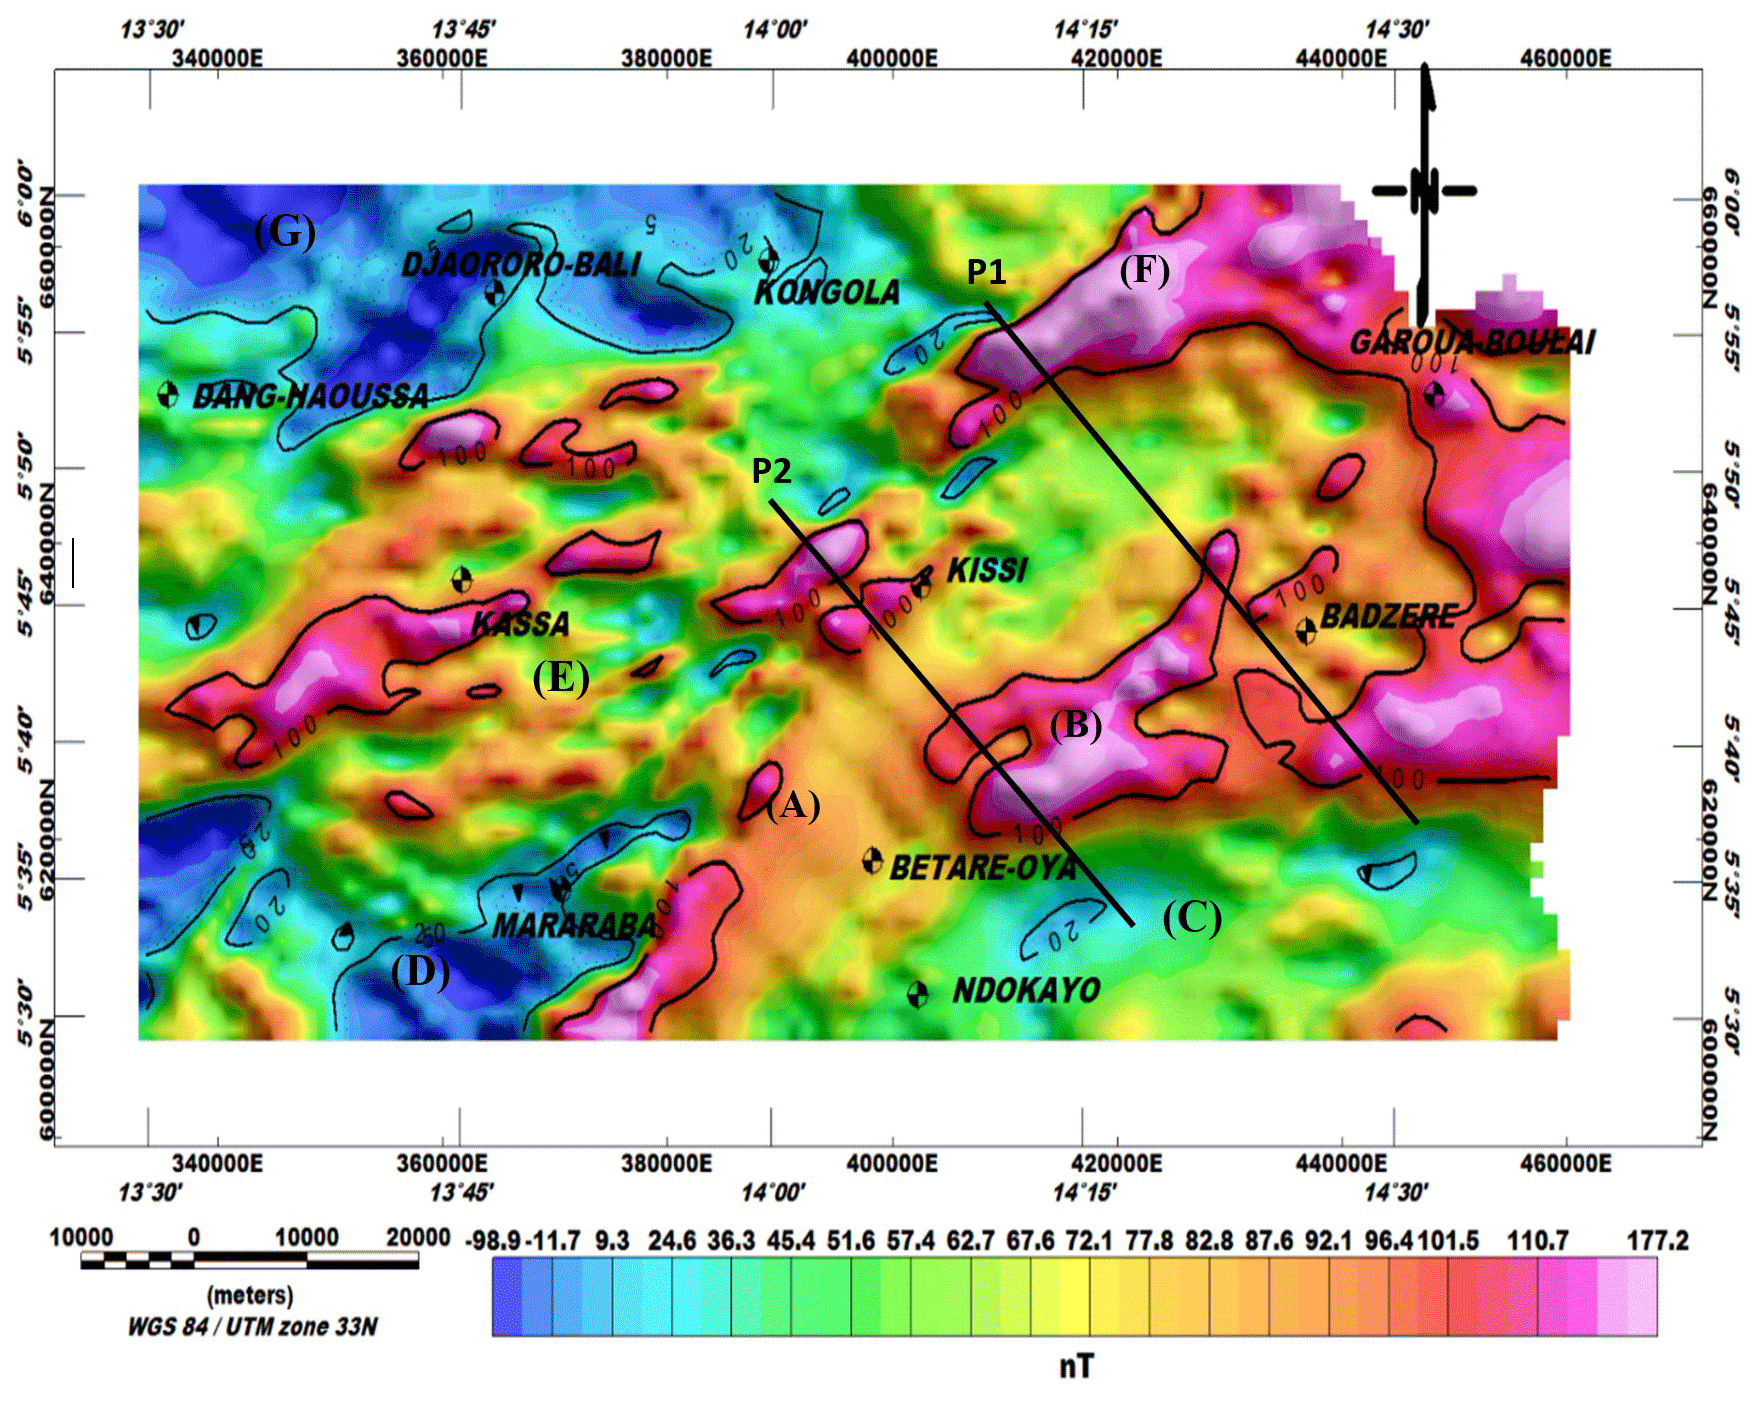
Figure 3Total magnetic intensity (TMI) map reduced to the Equator.
4.1.4 Unit F
In the north-western part of Garoua-Boulai, a heterogeneous anomaly with irregular shapes and a very long wavelength of about 22 km has been observed. Its amplitude is quite high and reaches 177 nT. Its approximate direction is ENE–WSW. It is probably associated with the meta-volcanic outcrops of the meta-lava within the schistous Lom series (Regnoult, 1986).
4.1.5 Unit G
The lowest magnetic intensities are recorded in the north-west near Djaororo-Bali, where anomalies with amplitudes down to −98.9 nT are found that are associated with surface meta-sediments such as modified-biotite gneiss overlying the old metamorphic basement.
4.2 Tilt angle on residual map
The residual map is obtained by subtracting the total magnetic field map reduced to the Equator to the regional map. The determination of the optimum regional anomaly map for the study area relies on the method of Zeng (1989). This method consists of determining a suitable altitude for upward continuation in the study area. The extrema of each altitude of upward continuation are then counted (Table 2). These are points where the gradient is null. Further, a graph of extrema versus altitudes of upward continuation is plotted (Fig. 4). Finally, the suitable altitude (h=10 km) necessary for the upward continuation technique is determined graphically (Jacobsen, 1987; Jean et al., 2016).
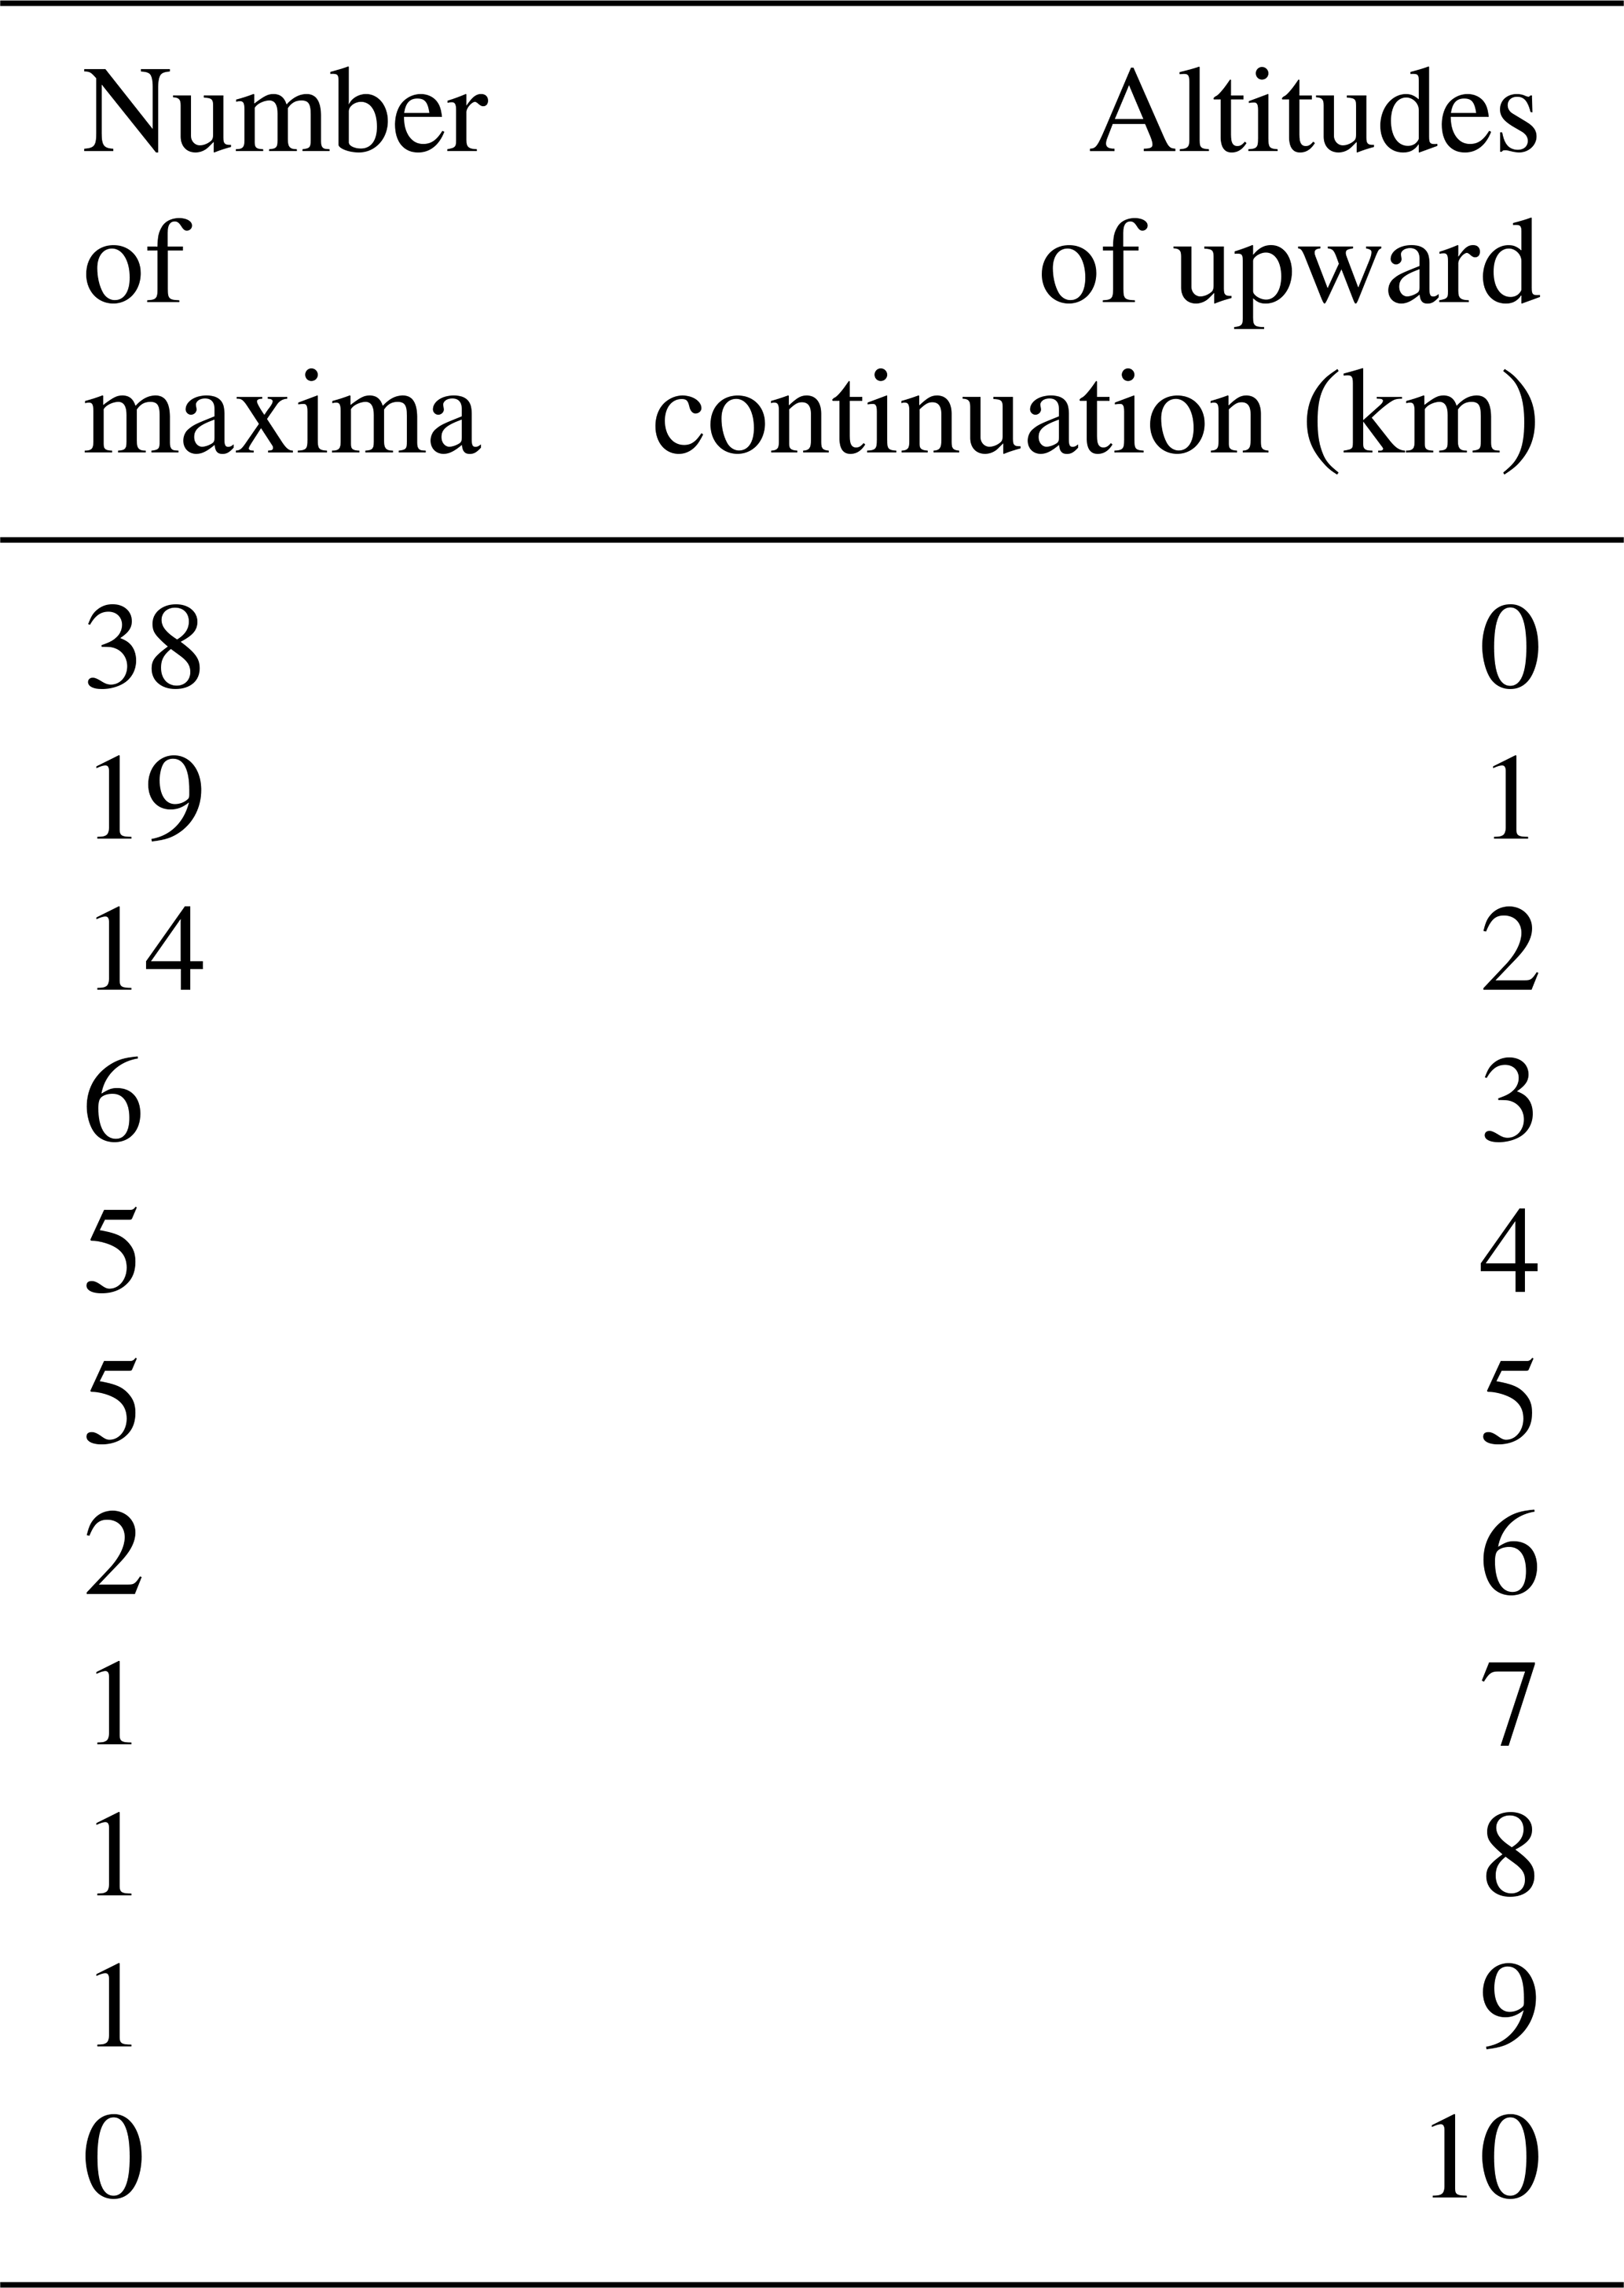

Figure 4Number of extrema versus upward continuation height. From h=10 km (circle in red), the number of maxima becomes constant and does not vary anymore.
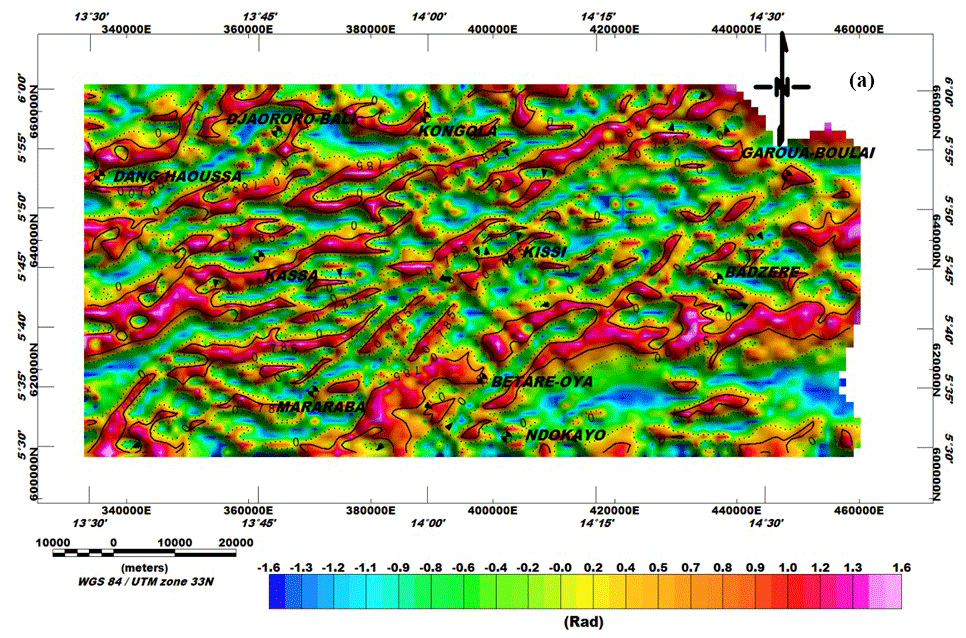
Figure 5Tilt angle on residual map.
The generated tilt angle map (Fig. 5) represents possible lineaments of the study area. On this map it can clearly be seen that the signal is uniformly distributed in −1.6 to 1.6 rad intervals, thus making it possible to map the lineaments with an extremely high resolution. The presence of several accidents marks the heterogeneity of the basement in this area as well as the intense deformation undergone by its subsurface. The lineaments and spatial patterns of geophysical attributes are important data that can be obtained from magnetic interpretations. Steep features and straight faults are commonly expressed as subtle lineaments of potential fields. This expression can be gradient zones, local anomaly alignments of different types and shapes, aligned breaks, or discontinuities in the anomaly model.
4.3 Structural map
To characterize information, we were interested in the peaks of anomalies derived from the tilt-angle derivative (Fig. 5). We counted 111 lineaments, among which 45 have lengths varying between 2.5 and 10.8 km, 37 are minor lineaments varying between 1.2 and 2.3 km, and 29 are major lineaments between 2.4 and 15.6 km. Five structural NE–SW families are observed: ENE–WSW, E–W, NW–SE, N–S, and the major structural direction NE–SW (Fig. 6).
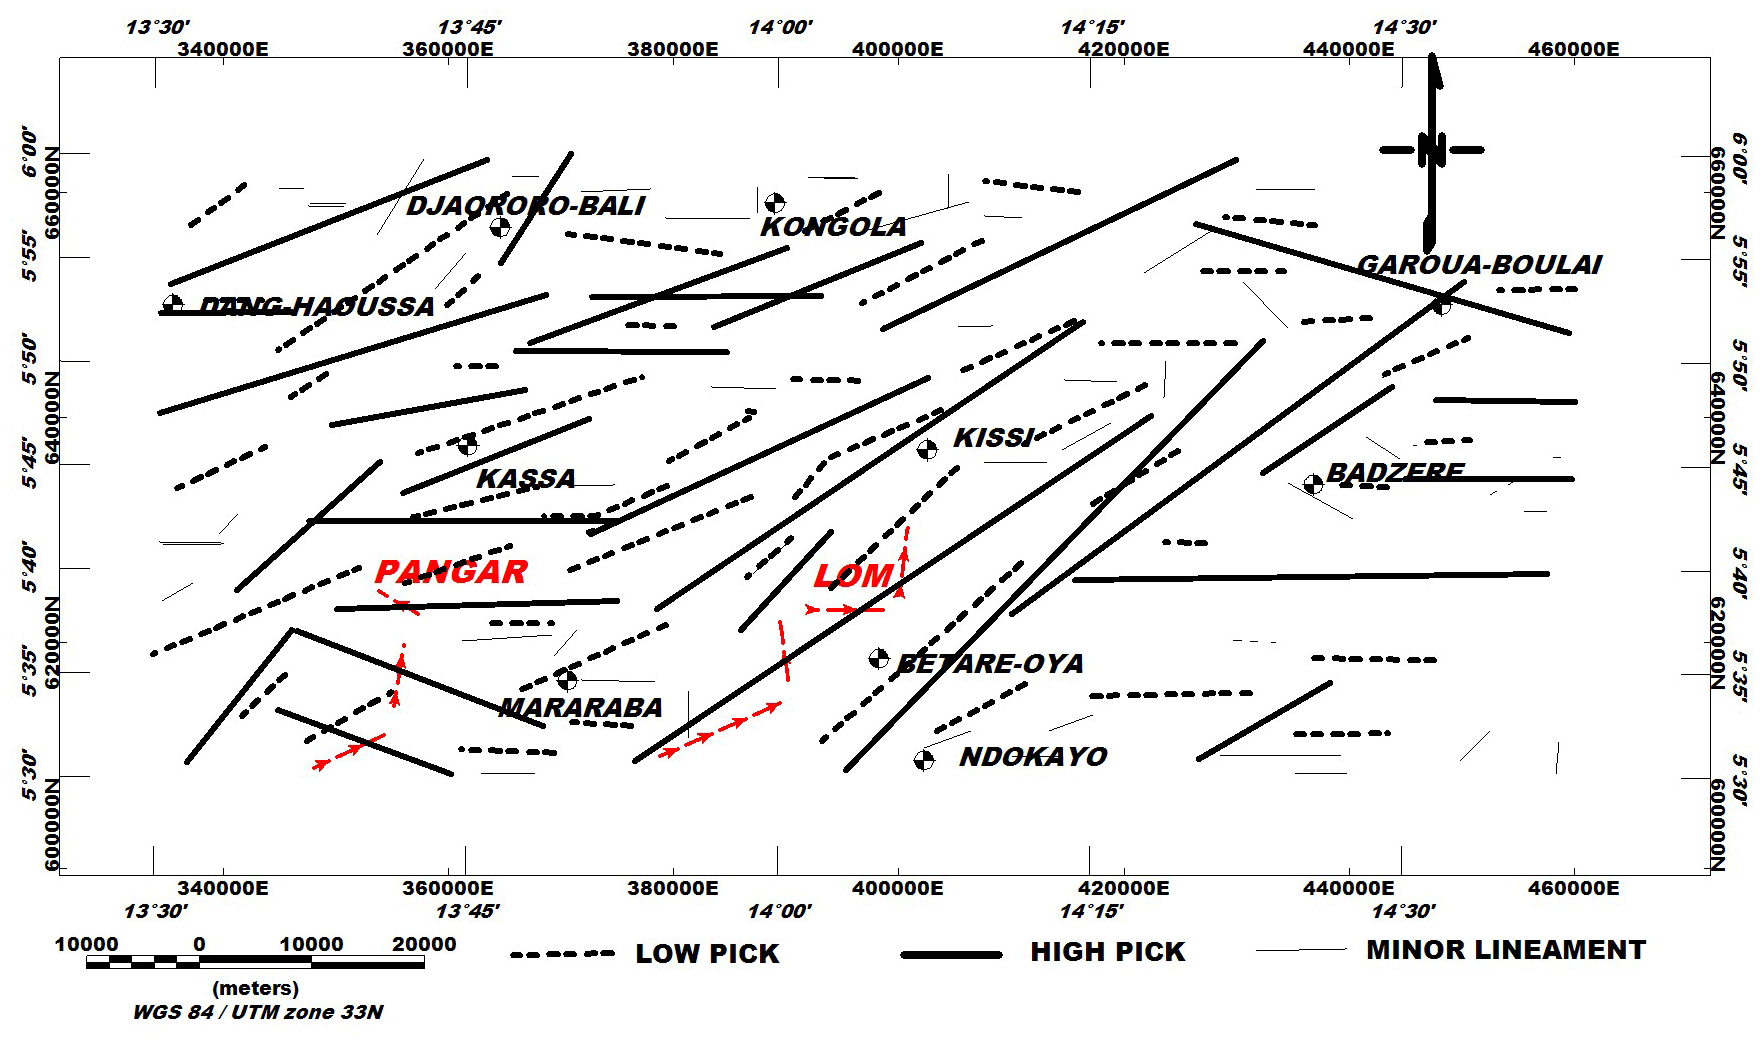
Figure 6Structural map of the study area.
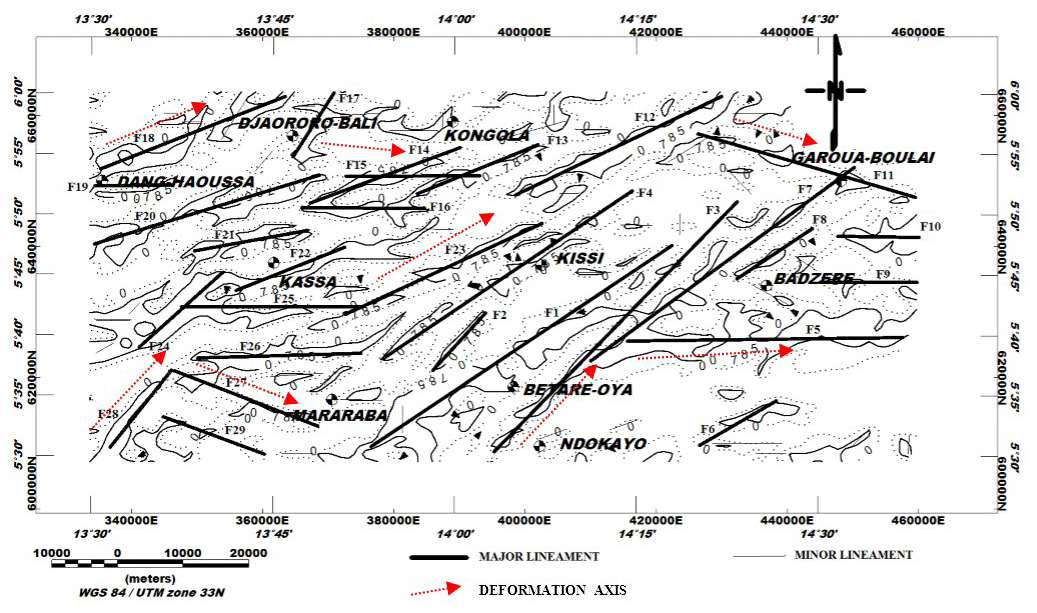
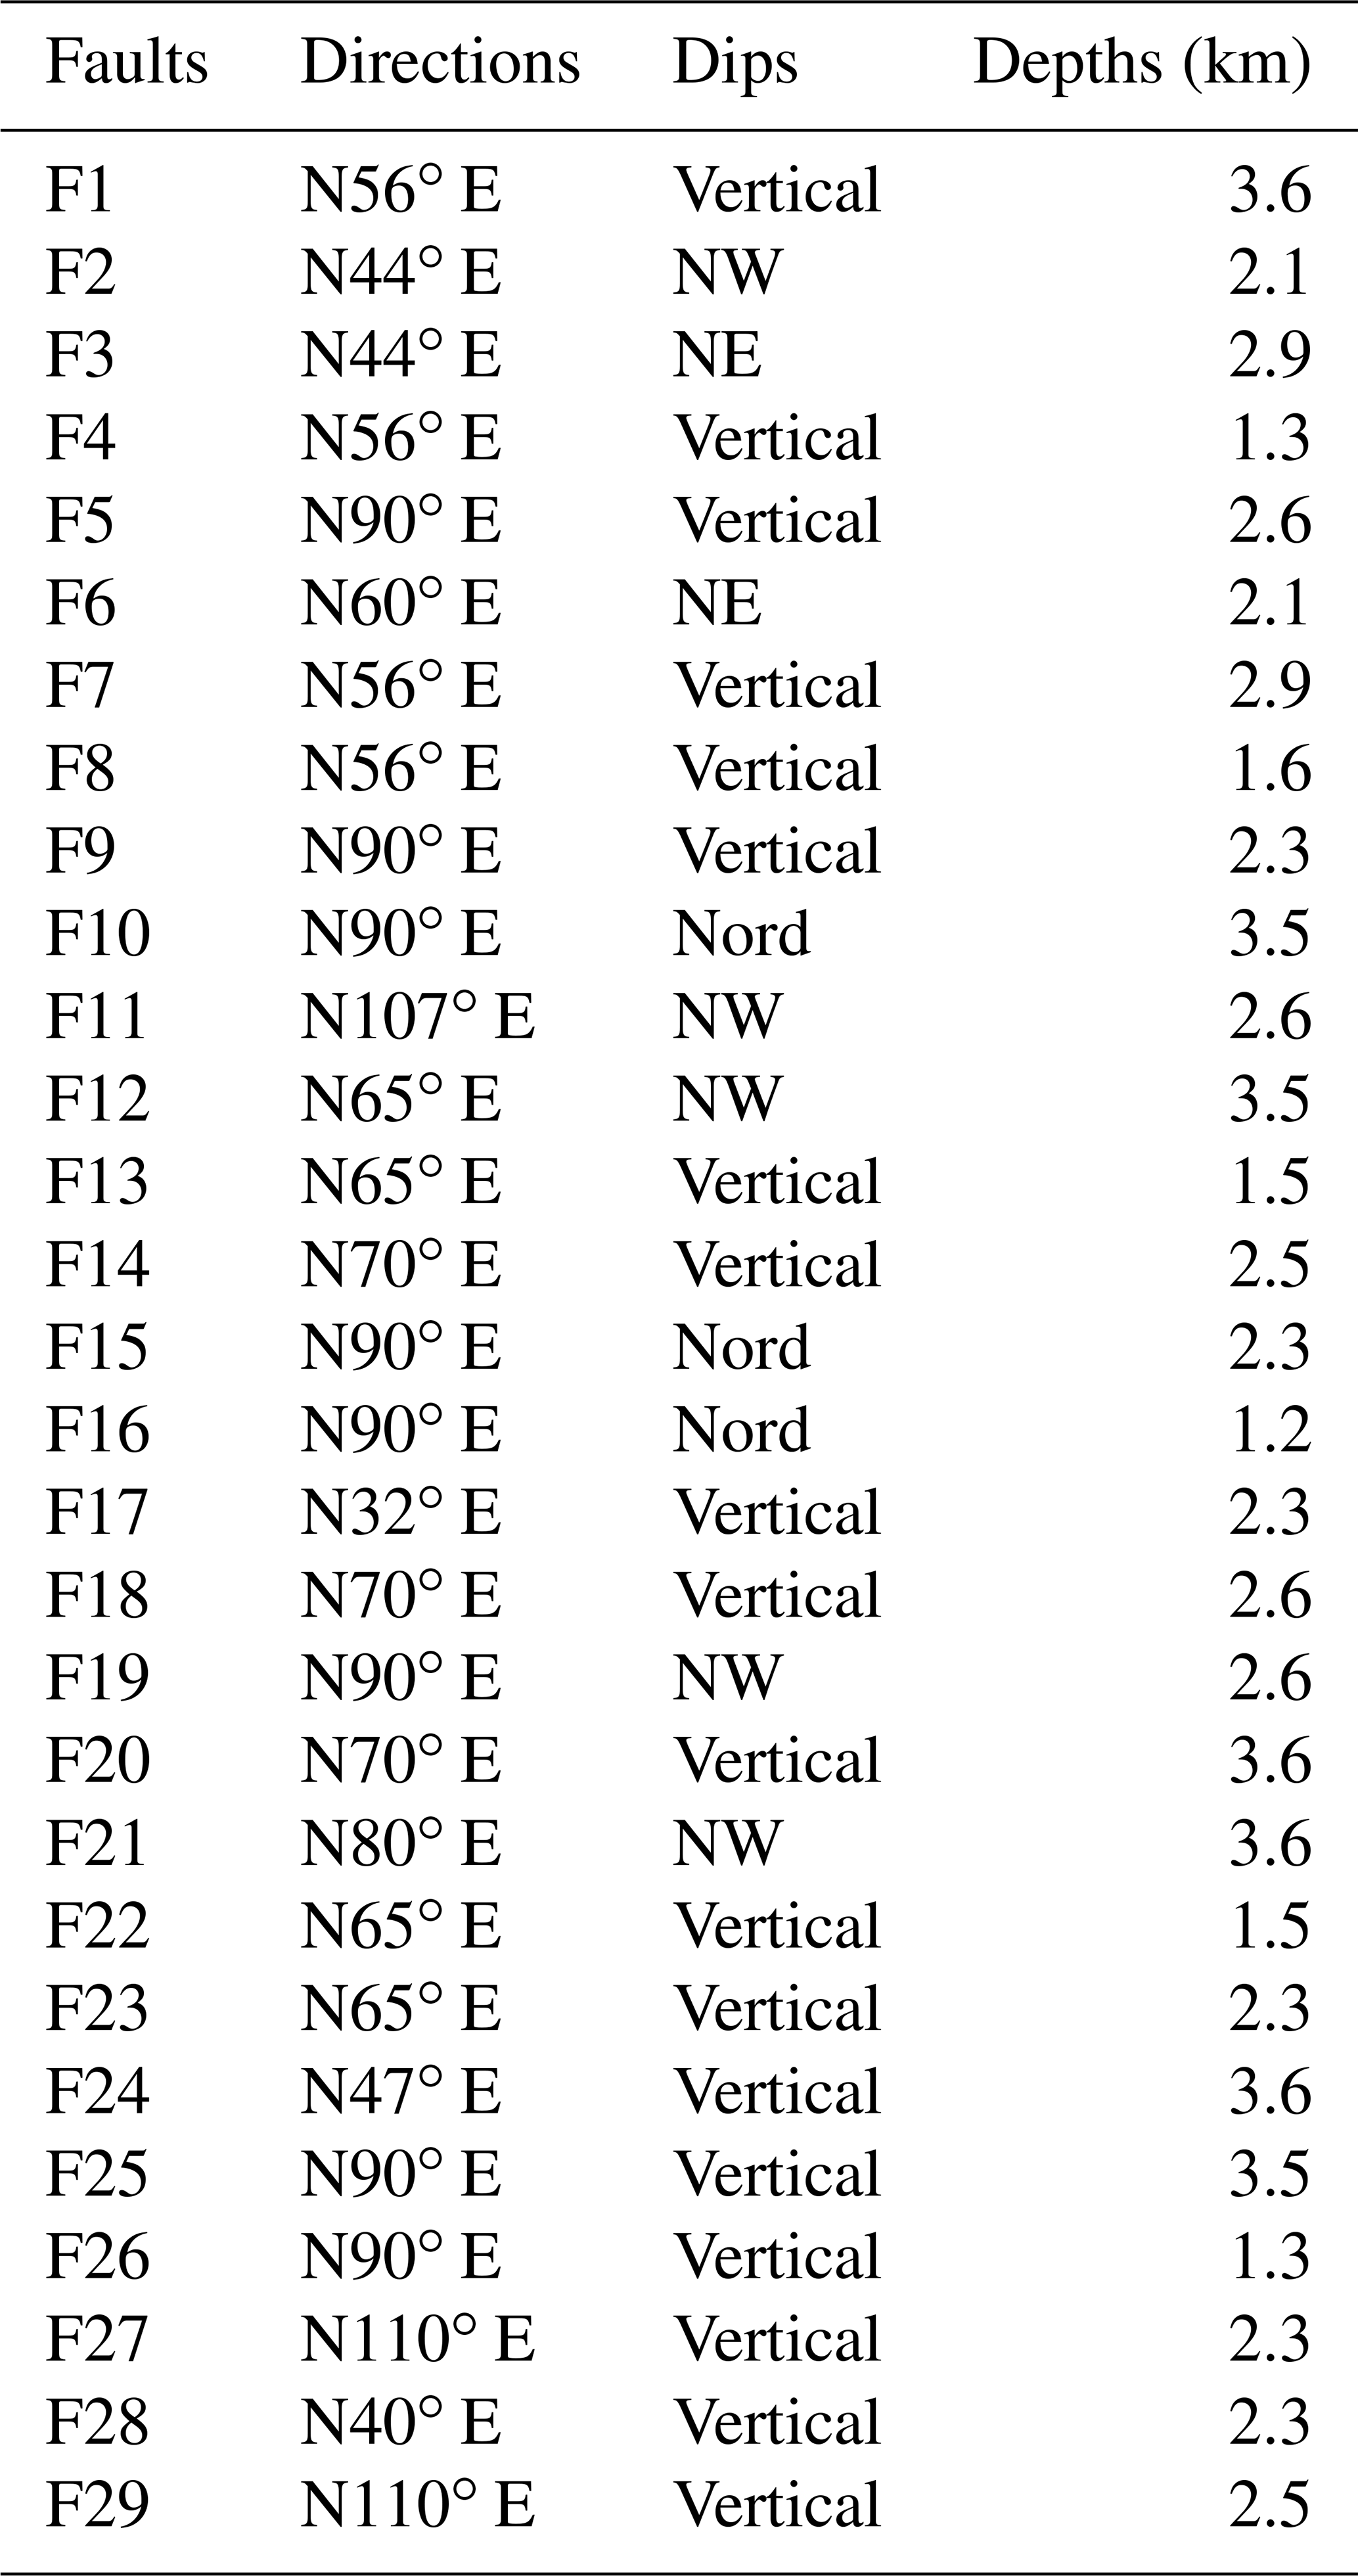
Figure 7Major faults map superimposed on tilt-angle contours. On this map we observe the major regional deformation axes (NE–SW, E–W, ENE–WSW, and NW–SE) as well as the associated faults (F1 to F29).
The longest faults are present at the eastern edge of the Lom series with lengths of more than 15 km (F1, F3, F7). To the west we also note the NE–SW F4 fault with more than 10 km length, which marks the limit of the Lom series (Fig. 7). The most remarkable is the change of direction of compression or deformation axes. The E–W events marked by the faults F15, F16, F19, F25, and F26 at the eastern edge of the Lom and by the faults F5, F9, and F10 in the west seem to have been taken up by the tectonic accidents F1, F2, F3, F4, F7, F8, F12, and F23 punctuated by the BOSZ. The same phenomenon occurs in the extreme west of the study area around Dang Haoussa and Mararaba with the ENE–WSW (F13, F14, F18, F20, F21, F22) and NW–SE (F27, F29) accidents, respectively. These discrepancies suggest the passage of shear faults. The curvature (type II) structures corresponding to foliations induce most of the major fault network present in the Bétaré-Oya area. In order to confirm the results obtained by the tilt derivative, we apply the Euler deconvolution method.
4.4 3D extension of anomalies
By superposing the zero contours of tilt angle of the residual map, we obtain Fig. 8, which has no perfect superimposition of sources on the previous ones and hence assumes the heterogeneity of the basement and the existence of movements that affected the subsurface formations. Deep crustal tightening of volcano-clastic rocks in the vicinity of Bétaré-Oya confirms that the site is affected by shear tectonics (Soba, 1989), causing deep and shallow faults. This is shown by the contact between the granito-gneissic rocks and the Lom schists (Fig. 2). These contours delimit the edges of the magnetic source, so their superposition in depth allows an idea to develop about the disposition, the extent, the dip, and the shape of the geological sources responsible for the magnetic anomalies observed.
By applying the principles mentioned in Sect. 3.2.2, we observed the following from the obtained map (Fig. 8 below):
- i.
They are not identical, which could mean that the contacts situated near the surface could be masked by those located at the subsurface or in depth.
- ii.
There are some vertical contacts that narrowed with depth. This could be interpreted as a sign of crustal thinning of the source of the anomaly with depth.
- iii.
In some places, a lateral displacement of the contact is identified. It could suggest here, a dip of the source in the concerned direction.
For example, the east of Ndokayo, Kassa, and the south-east of Mborguene, several structures lose extension in depth, taking the form of a basic cone of revolution located on the surface (interrupted circle).
The presence of this regional-scale fold system, which controls all movements in the area (BOSZ), suggests an interconnection of crustal geological structures by lines of faults and foliations. Hence the structural elements highlighted in this study (folds, faults, dykes, etc.) globally belong to Pan-African tectonics.

Figure 8Superposition of contours (O=0∘) of tilt angle of upward data RTE continued to 1 km (red) and 2 km (blue).
4.5 Quantitative analysis
4.5.1 Tilt angle
The tilt-angle operator makes it easy to determine the depth of the vertical contacts (Salem et al., 2007) by estimating the distance between the zero-angle contours and those corresponding to the values ±45∘ (Fig. 7). We have determined the average-depth interval ranges from 1 to 3 km for major lineaments (Table 3).
4.5.2 Euler deconvolution
Euler solutions allowed us to verify the position of the contacts obtained by the tilt-angle method as well as their depth.
The superposition of the structural map with Euler solutions allowed us to delimit deep and superficial faults, dykes, and veins; to delineate tectonic lines established by previous geological studies (Gazel and Gerard, 1954); and to compare with results from the tilt-angle method (Fig. 10).

Figure 9Euler solution (N=1; W=25; Z=10 %).
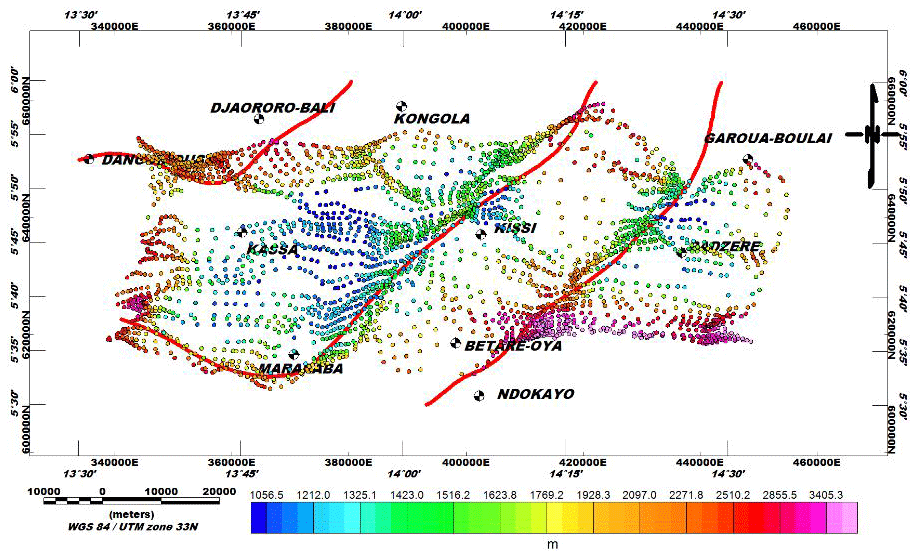
Figure 10Euler solution (N=2; W=20; Z=10 %). These maps allow for a comparative study with the results obtained from the tilt derivative. They also make it possible to confirm the tectonic lines of the zone (in red) highlighted in the work of Gazel and Gerard (1954) and to estimate their depths.
On the Euler solutions map we have perfectly distinguished the limits of the intrusive bodies and the deeper faults. On these maps, we observe the five main directions of structures, namely NE–SW, ENE–WSW, E–W, NW–SE, and N–S (Fig. 7). In addition, the vertical contacts are clearly visible on the Euler solutions map and extend over 15 km in length.
The deepest accidents are mainly NE–SW to E–W with depths of over 3500 m and are well located at the eastern limits in the Lom series the Badzéré gneiss contact zone, and around the East fault of Bétaré-Oya. In the south-west of the map, at Mararaba, Euler solutions allow NW–SE faults to be approximately detected that were the result of the highlighted tectonic line (Fig. 9) and whose depths are estimated at 3000 m. We obtain depths ranging from 0.5 to 3.6 km. Figure 10 clearly shows tectonic directions which dominate all subsurface movements of the study area and their depths ranging from 1 to 3.4 km.
Table 3Main faults of Lom series. This summary table is obtained after comparing the results from the Euler deconvolution method and the tilt derivative.
4.5.3 2.75D modelling
Profile 1
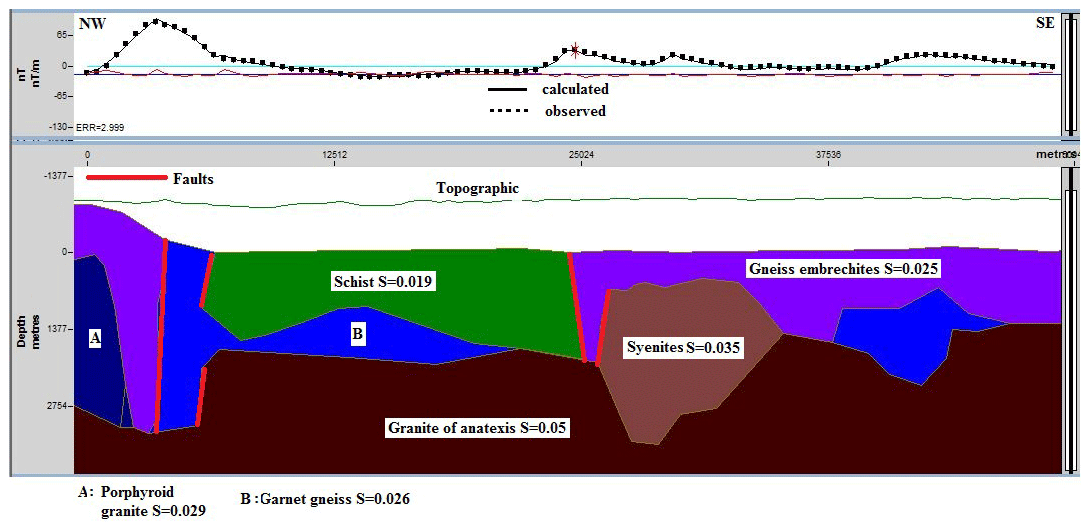
This profile (P1) extends 48.8 km NW–SE through Badzere and Mborguene. It crosses six geological formations from NW to SE, namely porphyroid granite, granite with biotite, gneiss embrechites, granite of anatexis, schists, biotite, and muscovite gneiss (Fig. 3). The strongest anomalies are localized in the NW of the profile with an intensity of 177 nT. The basement obtained is made up of granite anataxis which are old magmatic rocks forming the old basement complex and put in place during the first half of the Precambrian. Its maximum depth is h=3.608 km, which agrees with the depths obtained by the Euler convolution (Fig. 11). Its susceptibility is S=0.05 SI. Above, one can observe the embrechite gneisses (S=0.025 SI) and volcano-clastics schists (S=0.019 SI). This contact between the granito-gneissic rocks and the Lom schists has therefore caused several fractures and faults, represented here by several intrusions: porphyroid granite (S=0.029 SI), garnet gneiss (S=0.026 SI), syenites (S=0.035 SI). Our model agrees with previous geological (Poidevin, 1985; Gazel and Gerard, 1954; Kouske, 2006; Ngako et al., 2003) and geophysical studies (Koch et al., 2012; Owono et al., 2019). These intrusions were set up during the Pan-African orogenesis (Eno Belinga, 1984) and are present in our geological map (Fig. 2).
Profile 2
Profile 2 (P2) extends 46 km along the NW–SE direction through Bétaré-Oya and Kissi. It crosses five geological formations: biotite leptinites gneiss, quartzite with muscovite schists, schists, biotite and muscovite gneiss, and alkaline granite (Fig. 3). The lowest anomalies are localized in the NW of the profile with an intensity of −43.4 nT, while the strongest are on the edge of the Lom schists with a maximum value of 65.6 nT. The basement is made up of anatexite granites (S=0.05 SI), intruded by strongly magnetized rocks such as syenite (S=0.044 SI), ryolite (S=0.037 SI), and anatexic biotites (S=0.048 SI). Upstream, one can note the embrechite gneisses (S=0.025 SI) discordant to volcano-clastic schists (S=0.023 SI) located above the metasediment's rocks (S=0.003 SI). One can also observe several intrusions of micaschists (S=0.0186 SI), graphite (S=0.00012 SI), and garnet gneiss (S=0.027 SI). The geological layers obtained are located below the topography, and the maximum depth is h=3.419 km (Fig. 12), in agreement with the data resulting from the Euler deconvolution. The model from this profile is in accordance with previous studies (geology, seismic, magnetic etc.). We note intrusions from the Pan-African orogenesis (Poidevin, 1985; Gazel and Gerard, 1954; Kouske, 2006; Ngako et al., 2003; Koch et al., 2012; Owono et al., 2019; Eno Belinga, 1984), located in our geological map (Fig. 2).

The geological synthesis of Cameroon allows us to have a lithostratigraphic sketch of the Lom Formation. Recently, the near-surface work of Mboudou et al. (2017) at Bétaré-Oya proposed the lithological model with topsoil, saprolites, sandy layer, conglomeritic sand, and schist formations.
On our model from profile 2 that passes through the locality of Bétaré-Oya, we observe that the first layers of rocks encountered are well below the topography, which is explained by the fact that the method used allows us to highlight the structuring of deep formations. This would have the effect of hiding the superficial (sediments) and hence the observed shift. Thus, the first formation detected on our models at Bétaré-Oya is schist. We can therefore complete this lithological model with the formations of the Pan-African basement highlighted by our geophysical methods (Fig. 13) and propose the litho-stratigraphic model updated below (Table 4). Crustal formations in our model are in accordance with those obtained by Benkhelil et al. (2002) from seismic data from south Cameroon, and the summary above is in accordance with the geological study of Mboudou et al. (2017).
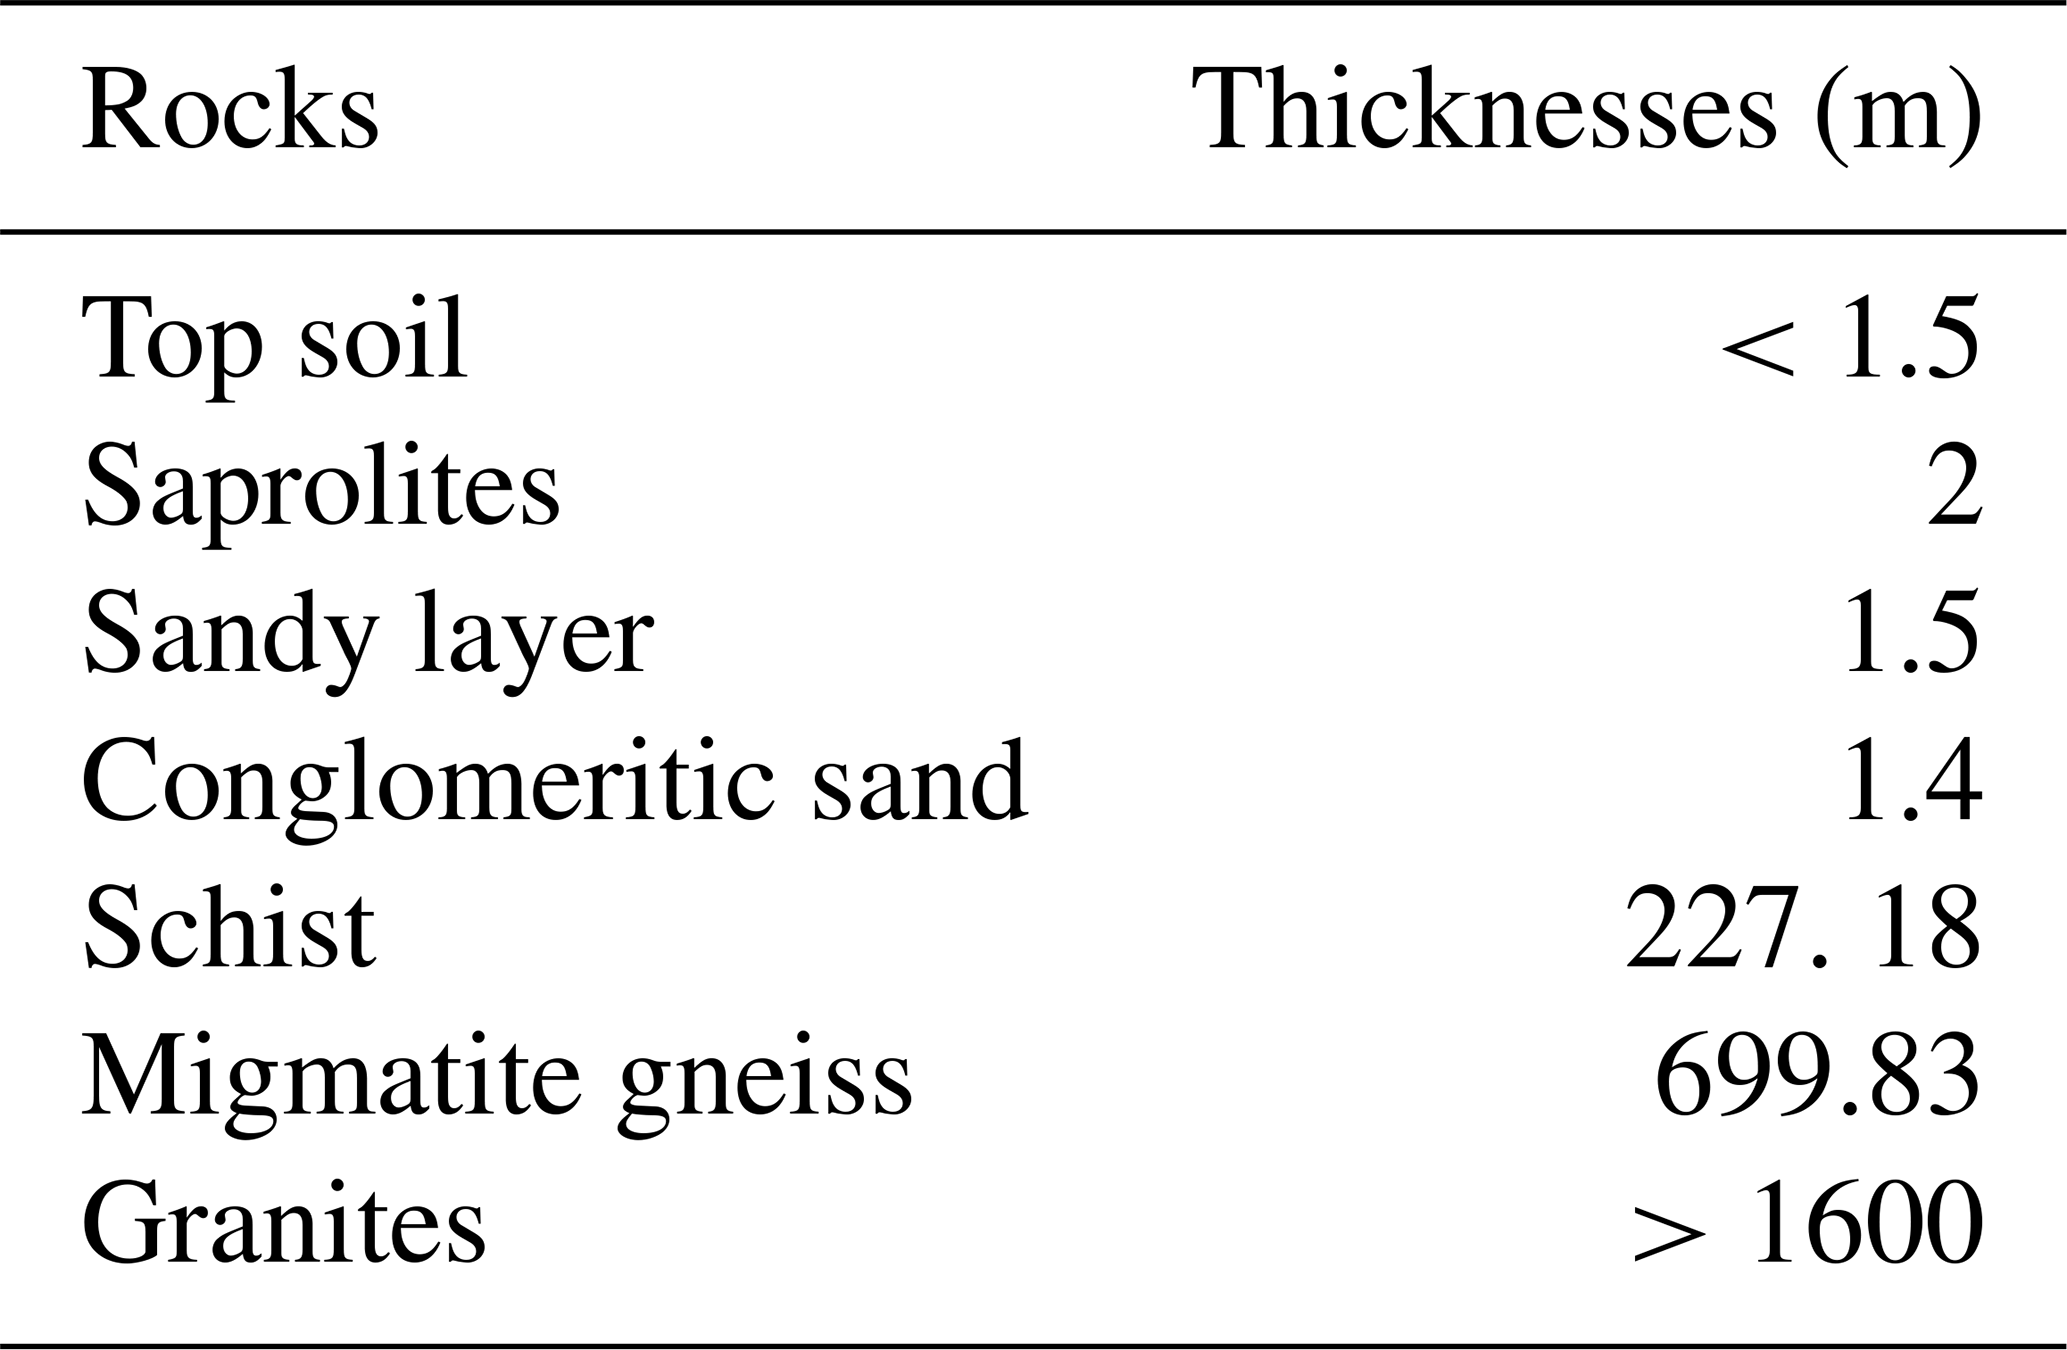
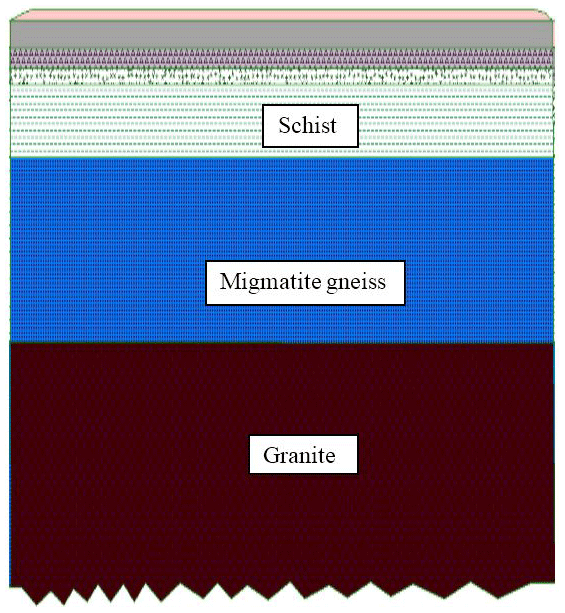
Figure 13Improved sketch of the lithologic profile of Bétaré-Oya basin. The scale map is 2 1000.
This model confirms the granite-gneiss nature of the Pan-African base.
The major faults highlighted in this work controlled by the BOSZ belong in fact to a wider network of faults found on the Pan-African and which would extend to the São Francisco Craton (SFC) by the central Cameroon shear zone (CCSZ). Indeed, the work of Toteu et al. (2004) suggests that the Reghane shear zone, which during the whole Pan-African Belt evolution (650–580 Ma) only recorded dextral wrench movement, can be considered as a major boundary separating the mobile domain in two (Fig. 14) – a western part where the tectonics is controlled by the motion of the WAC and an eastern part controlled by the motion of the Congo craton.
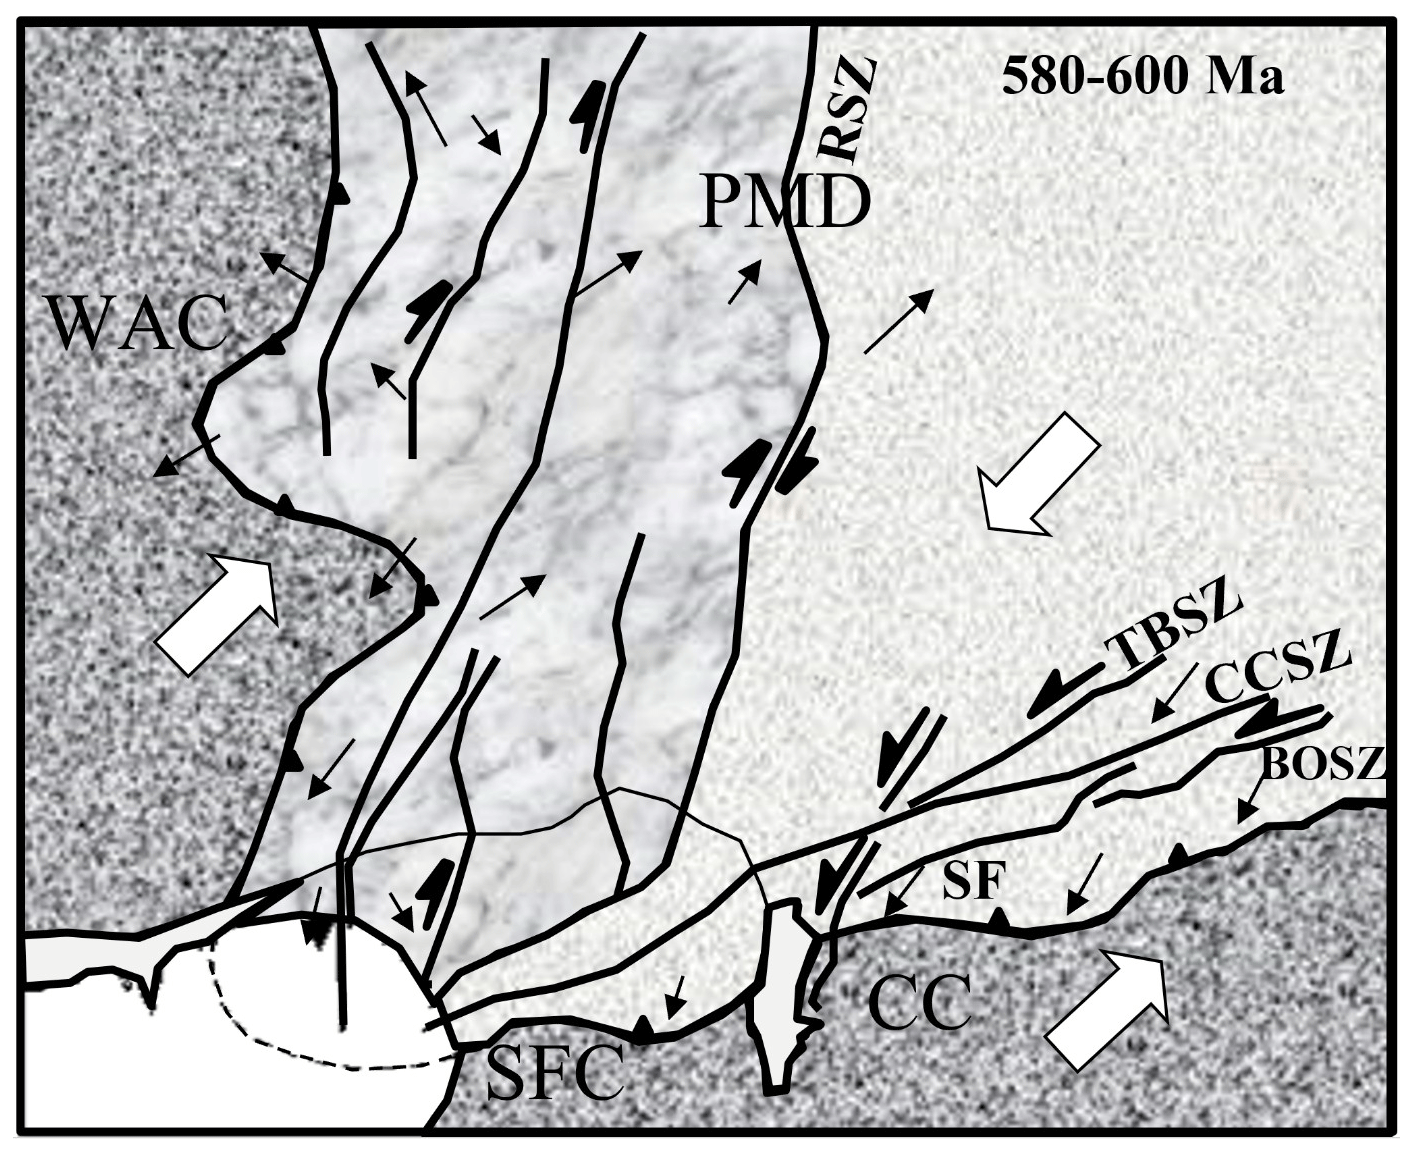
Figure 14The Pan-African mobile domain (PMD) between the West African Craton (WAC) and the São Francisco (SFC) and Congo (CC) cratons showing two sub-domains, west and east, separated by the Raghane shear zone (RSZ). Horizontal lines represent the Tcholliré–Banyo shear zone (TBSZ), central Cameroon shear zone (CCSZ), Sanaga fault (SF), and Bétaré-Oya shear zone (BOSZ). Small arrows correspond to stretching lineations and large arrows to movement directions of blocks during D3 (600–580 Ma). Modified from Toteu et al. (2004) (original document is available in the public domain).
The structural map obtained (Fig. 6) shows a great disparity in the distribution of lineaments which can be explained in part by the general tectonics of the area. Hence, the collision between the stable Archean craton in the south and one of the two Paleoproterozoic blocks in the north during the Pan-African orogeny of 700 Ma would have caused a flattening of the basement and intrusions in the old Precambrian basement, causing the major NE–SW-oriented lineaments related to the Lom schists. According to the Cameroon geological synthesis, these intrusions are identified as granitic batholiths placed during regional deformation D1 and D2.
On both sides of the Lom series, there are major NE–SW lineaments representing the bounding faults of the Lom series with the granite-gneiss rocks. The E–W, NE–SW, and N–S lineaments may represent major tectonic structures marking the change in the structural direction between the trans-Saharan (N–S) and the Oubanguides (E–W) chains.
At the local scale, the deformation D2 is characterized by L2 lineations representing here stretches of quartz minerals oriented E–W. The ENE–WSW-oriented lineaments appear to correlate with the mylonitic deformations occurring during the D3 phase while the ones trending NW–SE related to senestral and dextral recesses and represent fractures with or without lode flow. These structures are much more abundant near Mararaba and could be the target for future mining studies.
The geoelectrical study of Nih-Fon et al. (2012) in our study area identified NE–SW-oriented irregular anomaly zones. These correlate with the quartz veins known in the region and are aligned with the regional shear zone. The morphological units identified also present NW–SE, N–S, NE–SW, and E–W directions. In addition, Kouske (2006) reveals that the hydrographic network of the study area has two major directions, NE–SW and NW–SE, and it is dense and dendritic.
The P1 and P2 models obtained can be used as pseudo-3D imagery of the Lom basement. Previous geological studies indicate that the area was subject to intense metamorphic activity during the Neoproterozoic that has resulted in schist formation (Coyne and Bellier, 2010). The contact between this schistous series and the gneissic and granitic rocks of the basement resulted in multiple fractures and faults (Gazel and Gerard, 1954; Soba, 1989). The litho-stratigraphic sketch proposed by our models, derived from the magnetic profiles and work of Mboudou et al. (2017), is consistent with previous geological work that asserts that the Pan-African basement would be made up of migmatites and granitic to ortho-gneissic and biotite-rich rocks (Poidevin, 1985; Gazel and Gerard, 1954; Kouske, 2006; Ngako et al., 2003; Koch et al., 2012; Pepogo et al., 2019; Owono et al., 2019; Eno Belinga, 1984).
From the mining point of view, the artisanal gold indices are places located near the Lom and Pangar rivers (Nih-Fon et al., 2012). These alluviums correlate with NE–SW trends in our structural map. Since the structures in our study area are structurally guided, it can be concluded that the alluvial deposits observed and exploited by residents are some signs that have been leached and transported by the waterways. Overall, the geological structures obtained from the data processing correspond to the ductile-brittle structures such as shear zones and faults. These structures constitute pathways for both mineralizing fluids and groundwater. Since several gold mines exist in the Bétaré-Oya area, the new mapping approach could be an important guide for the identification of the structures that control the gold mineralization in the area.
In this work, some new analysis techniques were applied on aeromagnetic data to delineate the sub-surface structures. The results obtained highlight the axes of compression, folding, and shearing as well as mylonitic veins (veins are at the outcrop's scale) several kilometres long and oriented NE–SW. The regional and local structural settings of the area are characterized by major faults and other structural elements mainly striking in the NE–SW, NW–SE, ENE–WSW, N–S, and E–W directions. A major trend in the NE–SW direction represents the dominant tectonic trend which is the prolongation of the central Cameroon shear zone (CCSZ) in the study area. Several folds and faults evidenced by this study correlate with past studies while others are inferences. The depths of major accidents in the area have been estimated between 1.2 and 3.6 km, and the NE–SW structures on our structural map are proposed here for possible gold exploration. The models from the P1 and P2 profiles have enabled us to propose a structuration of the superficial crust of the Lom that highlights the main rocks and intrusions responsible for the observed anomalies (porphyroid granite, garnet gneiss, syenites, micaschists, graphite, and garnet gneiss), identify deep and shallow fractures, their depths, and propose a lithostratigraphic model in agreement with the previous works. Finally, we note that the tilt angle coupled to the upward continuation is an interesting tool for 2.75D modelling.
Despite the results obtained, some limits are observed concerning the application of the tilt derivative on data RTE, as cited below:
-
With the data RTE, we used the hypothesis of a magnetically induced anomaly, which has the same direction as the geomagnetic field, given by the global geomagnetic field models (IGRF), and the remanent part in the rock source of the anomaly seems to be neglected.
-
Satisfactory results using the tilt angle on magnetic data analysis and modelling, especially in the determination of the vertical contacts in low-latitude areas, are constrained by the use of the data RTE.
In our case, investigating a low-latitude area we engaged the following:
-
use of the Euler deconvolution to identify various potential contacts including the vertical one and then compare them with those derived from the tilt results, and
-
care to correlate our results with the previous geological investigations over and outside on the one hand, and geophysical studies over adjacent areas, particularly the aeromagnetic investigations, on the other hand.
The data used to support the findings of this study are available from the corresponding author upon request.
CEN performed the data analyses, modelling, and preliminary interpretation including preparation of the paper in conjunction with all the co-authors. TNM designed the topic, gave the orientations for the investigation, and reviewed the quality of the models and related interpretation and the entire paper. MBBA defined the criteria and the physical parameters for the 2D3/4 modelling with the first author. SAMT and SPA worked on the review of quality and quantitative analyses of the maps and 2D3/4 models.
The authors declare that they have no conflict of interest.
The authors thank the reviewers for their valuable comments.
This paper was edited by Nicolas Gillet and reviewed by Bruno Gavazzi and one anonymous referee.
Achilleos, G. A.: Approaching a model for estimating horizontal errors of digitized contours, J. Spat. Sci., 55, 147–164, https://doi.org/10.1080/14498596.2010.487856, 2010.
Asaah, V. A.: Lode gold mineralization in the Neoproterozoic granitoids of Batouri, southeastern Cameroon, PhD Thesis, Faculty of Energy and Economic Sciences, Clausthal University of Technology, Clausthal-Zellerfeld, Germany, 187 pp., 2010.
Benkhelil, J., Pierre, G., Claude, P., and Ngueutchoua, G.: Lithostratigraphic, geophysical and morpho-tectonic studies of the South Cameroon shelf, Mar. Petrol. Geol., 19, 499–517, https://doi.org/10.1016/S0264-8172(02)00002-8, 2002.
Bessoles, B. and Trompette, M.: Géologie de l'Afrique: la chaine Panafricaine, Zone mobile d'Afrique centrale (partie sud) et Zone mobile soudanaise, Mémoire du BRGM, 92, 19–80, 1980.
Blakely, R. J.: Potential theory applied in gravity and magnetism, Cambridge University Press, Cambridge, UK, 1996.
Cordell, L. and Grauch, V. J. S.: Mapping basement magnetization zones from aeromagnetic data in the San Juan Basin, New Mexico, in: The utility of regional gravity and magnetic anomaly maps, edited by: Hinze, W. J., Society of Exploration Geophysicists, Denver Colorado, USA, 181–197, https://doi.org/10.1190/1.0931830346.ch16, 1985.
Cornacchia, M. and Dars, R.: Un trait structural majeur du continent africain: Les linéaments centrafricains du Cameroun au Golfe d'Aden, B. Soc. Géogr. Fr., 25, 101–109, https://doi.org/10.2113/gssgfbull.S7-XXV.1.101, 1983.
Coyne, B.: Aménagement hydroélectrique de Lom Pangar, Document No. 10108-RP-400-B, 57–58, Online report, Yaoundé-Cameroon, 2010.
Dumont, J. F.: Identification par télédétection de l'accident de la Sanaga (Cameroun), Sa position dans les grands accidents d'Afrique Centrale et de la limite Nord du Craton du Congolais, Géodynamique, 1, 13–19, 1986.
Eno Belinga, S. M.: Géologie du Cameroun, Librairie Universitaire de Yaoundé, Yaounde, Cameroon, 1984.
Gazel, J. and Gerard, G.: Geological map of Cameroon recognition at the scale 1/500 000, 27, Report from the Directorate of Mines & Geology (available upon request), Ministry of mines and energy, Cameroon, 1954.
Henderson, R. G. and Zietz, I.: The Upward Continuation of Anomalies in Total Magnetic Intensity Fields, Geophysics, 14, 517–534, https://doi.org/10.1190/1.1437560, 1949.
Jacobsen, B. H.: A Case for Upward Continuation as a Standard Separation Filter for Potential-Field Maps, Geophysics, 52, 390–398, https://doi.org/10.1190/1.1442378, 1987.
Jean, M., Abate, E. J. M., Njandjock Nouck, P., Ngatchou, H. E., Oyoa, V., Tabod, C. T., and Manguelle-Dicoum, E.: Structure of the Crust Beneath the South Western Cameroon, from Gravity Data Analysis, Int. J. Geosci., 7, 991–1008, 2016.
KanKeu, B., Greiling, R. O., and Nzenti, J. P.: Pan-African strike slip tectonics in eastern Cameroon-Magnetic fabrics (AMS) and structures in the Lom basin and its gneissic basement, Precambrian Res., 174, 258–272, https://doi.org/10.1016/j.precamres.2009.08.001, 2009.
Koch, F., Wiens, D., Nyblade, A., Shore, P., Tibi, R., Ateba, B., Tabod, C., and Nnange, J.: Upper Mantle Anisotropy beneath the Cameroon Volcanic Line and Congo Craton from Shear Wave Splitting Measurements, Geophys. J. Int., 190, 75–86, https://doi.org/10.1111/j.1365-246X.2012.05497.x, 2012.
Kouske, A. P.: Geological and environmental study of the artisanal gold mining sector of Bangbel-Mborguéné (East Cameroon), PhD thesis, University of Yaounde I, Yaounde, Cameroon, 89 pp., 2006.
Mboudou, G. M., Kennedy, F. F., Njoh, O. A., and Agyingi, C. M.: Characterization of Alluvial Gold Bearing Sediments of Betare Oya District-East Cameroon, Implication for Gold Exploration and Recovery, J. Geol., 7, 1724–1738, https://doi.org/10.4236/ojg.2017.711115, 2017.
Miller, H. G. and Singh, V.: Potential field tilt – a new concept for location of potential field sources, J. Appl. Geophys., 32, 213–217, https://doi.org/10.1016/0926-9851(94)90022-1, 1994.
Ndougsa, M. T., Bikoro, B. A., Tabod, C. T., and Sharma, K. K.: Filtering of gravity and magnetic anomalies using the finite element approach (fea), J. Indian Geophysical Union, 17, 167–178, 2013.
Ngako, V., Affaton, P., Nnange, J. M., and Njanko, T.: Pan-African tectonic evolution in central and Southern Cameroon: transpression and transtension during sinistral shear movements, J. Afr. Earth Sci., 36, 207–214, https://doi.org/10.1016/S0899-5362(03)00023-X, 2003.
Nih-Fon, A., Bih, C. V., and Suh, C. E.: Application of Electrical Resistivity and Chargeability Data on a GIS Platform in Delineating Auriferous Structures in a Deeply Weathered Lateritic Terrain, Eastern Cameroon, Int. J. Geosci., 3, 960–971, https://doi.org/10.4236/ijg.2012.325097, 2012.
Odey Omang, B., Che, V. B., Nih, F., Embui, V., and Cheo Suh, E.: Regional Geochemical Stream Sediment Survey for Gold Exploration in the Upper Lom Basin, Eastern Cameroon, Int. J. Geosci., 5, 1012–1026, 2014.
Oruç, B. and Selim, H. H.: Interpretation of magnetic data in the Sinop area of Mid Black Sea, Turkey, using tilt derivative, Euler deconvolution, and discrete wavelet transform, J. Appl. Geophys., 74, 194–204, https://doi.org/10.1016/j.jappgeo.2011.05.007, 2011.
Owono Amougou, O. U. I., Ndougsa, M. T., Meying, A., Assembe, S. P., Ngoh, J. D., Ngoumou, P. C., and Yandjimain, J.: Evidence of Major Structural Features over the Pan-African Domain in the Bertoua-Mbangue Area (East Cameroon) from a Multiscale Approach of Modelling and Interpretation of Aeromagnetic Data, Int. J. Geophys., 2019, 9148678, https://doi.org/10.1155/2019/9148678, 2019.
Paterson, Grant, and Watson Ltd.: Aeromagnetic studies on some regions of the United Republic of Cameroon. Interpretation Report, Canadian International Development Agency (CIDA), Toronto, 192 pp., 1976.
Pepogo, M. A. D., Ndougsa, M. T., Meying, A., Ngoh, J.D., Mvondo, O. J., and Ngoumou, P. C.: New Geological and Structural Facts under the Lateritic Cover in Garga Sarali, Ndokayo (East Cameroon) Area, from Audiomagnetotellurics Soundings, International Journal of Geophysics, Volume 2018, Article ID 4806357, 17, https://doi.org/10.1155/2018/4806357, 2018.
Poidevin, J. L.: Le Protérozoïque supérieur de la République Centrafricaine, Annals of Royal Museum for Central Africa, 91, 74, Tervuren, Belgium, 1985.
Rasmussen, R. and Pedersen, L. B.: End corrections in potential field modelling, Geophys. Prospect., 27, 749–760, 1979.
Reeves, C.: Aeromagnetic Surveys; Principles, Practice, and Interpretation, Geosoft, 155, 2005.
Regnoult, J. M.: Geological Synthesis of Cameroon, 119, Directorate of Mines & Geology, Ministry of mines, energy & water, Yaoundé, Cameroon, 1986.
Reid, A. B., Allsop, J. M., Granser, H., Millett, A. J., and Somerton, I. W.: Magnetic interpretation in three dimensions using Euler Deconvolution, Geophysics, 55, 80–90, https://doi.org/10.1190/1.1442774, 1990.
Rolin, P.: La zone de décrochement panafricain des oubanguides en république centrafricaine, Comptes Rendus de l'Académie des Sciences, 320, 63–69, 1995.
Salem, A., William, S., Fairhead, D., Ravat, D., and Smith, R.: Tilt-depth method: a simple depth estimation method using first-order magnetic derivatives, The Leading Edge December, Meter Reader, 150, 2–5, https://doi.org/10.1190/1.2821934, 2007.
Salem, A., Williams, S., Fairhead, J. D., Smith, R., and Ravat, D. J.: Interpretation of magnetic data using tilt-angle derivatives, Geophysics, 73, 1–10, https://doi.org/10.1190/1.2799992, 2008.
Shandini, N. Y., Tadjou, J. M., and Basseka, C. A.: Delineating deep basement faults in South Cameroon area, World Appl. Sci. J., 14, 611–615, 2011.
Skalbeck, J. D., Karlin, R. E., Shevenell, L., and Widmer, M. C.: Gravity and aeromagnetic modeling of alluvial basins in the southern Truckee Meadows adjacent to the Steamboat Hills geothermal area, Washoe County, Nevada, Geophysics, 70, B1–B9, https://doi.org/10.1190/1.1925739, 2005.
Soba, D.: The Lom series: geological and geochronological study of a volcano-sedimentary basin of the Pan-African chain in eastern Cameroon, PhD thesis, Pierre and Marie Curie University, Paris, France, 198 pp., 1989.
Tadjou, J. M., Manguelle-Dicoum, E., and Tabod, C. T.: Gravity modelling along the northern margin of the Congo craton, South-Cameroon, J. Cameroon Acad. Sci., 4, 51–60, 2004.
Thébault, E., Finlay, C. C., Beggan, C. D., Alken, P., Aubert, J., Barroi, O., Bertrand, F., Bondar, T., Boness, A., Brocco, L., Canet, E., Chambodut, A., Chulliat, A., Coisson, P., Civet, F., Du, A., Fournier, A., Fratter, I., Gillet, N., Hamilton, B., Hamoudi, M., Hulot, G., Jager, T., Korte, M., Kuang, W., Lalanne, X., Langlais, B., Leger, J. M., Lesur, V., Lowes, J. F., Macmillan, S., Mandea, M., Manoj, C., Maus, S., Olsen, N., Petrov, V., Ridley, V., Rother, M., Sabaka, T. J., Saturnino, D., Schachtschneider, R., Sirol, O., Tangborn, A., Thomson, A., Toffner-Clausen, L., Vigneron, P., Wardinski, I., and Zvereva, T.: International Geomagnetic Reference Field: the 12th generation, Earth Planets Space, 67, 79, https://doi.org/10.1186/s40623-015-0228-9, 2015.
Thompson, D. T.: EULDPH: A new technique for making computer-assisted depth estimates from Magnetic data, Geophysics, 47, 31–37, https://doi.org/10.1190/1.1441278, 1982.
Toteu, S. F., Penaye, J., and Poudjom Djomani, Y.: Geodynamic evolution of the Pan-African belt in central Africa with special reference to Cameroon, Can. J. Earth Sci., 41, 73–85, https://doi.org/10.1139/e03-079, 2004.
Verduzco, B., Fairhead, J. D, Green, C. M., and Mackenzie, C.: New insights into magnetic derivatives for structural mapping, Leading Edge, 23, 116–119, https://doi.org/10.1190/1.1651454, 2004.
Won, I. J. and Bevis, M.: Computing the gravitational and magnetic anomalies due to a polygon: Algorithms and FORTRAN subroutines, Geophysics, 52, 232–238, https://doi.org/10.1190/1.1442298, 1987.
Zeng, H.: Estimation of the Degree of Polynomial Fitted to Gravity Anomalies and Its Applications, Geophys. Prospect., 37, 959–973, https://doi.org/10.1111/j.1365-2478.1989.tb02242.x, 1989.