the Creative Commons Attribution 4.0 License.
the Creative Commons Attribution 4.0 License.
 | 13 Apr 2021
Mapping and evaluating kinematics and the stress and strain field at active faults and fissures: a comparison between field and drone data at the NE rift, Mt Etna (Italy)
Alessandro Tibaldi
Noemi Corti
Emanuela De Beni
Fabio Luca Bonali
Susanna Falsaperla
Horst Langer
Marco Neri
Massimo Cantarero
Danilo Reitano
Luca Fallati
We collected drone data to quantify the kinematics at extensional fractures and normal faults, integrated this information with seismological data to reconstruct the stress field, and critically compared the results with previous fieldwork to assess the best practice. As a key site, we analyzed a sector of the northeast rift of Mt Etna, an area affected by continuous ground deformation linked to gravity sliding of the volcano's eastern flank and dike injections. The studied sector is characterized also by the existence of eruptive craters and fissures and lava flows. This work shows that this rift segment is affected by a series of NNE- to NE-striking, parallel extensional fractures characterized by an opening mode along an average N105.7∘ vector. The stress field is characterized by a σHmin trending northwest–southeast. Normal faults strike parallel to the extensional fractures. The extensional strain obtained by cumulating the net offset at extensional fractures with the fault heave gives a stretching ratio of 1.003 in the northeastern part of the study area and 1.005 in the southwestern part. Given a maximum age of 1614 CE for the offset lavas, we obtained an extension rate of 1.9 cm yr−1 for the last 406 years. This value is consistent with the slip along the Pernicana Fault system, confirming that the NE rift structures accommodate the sliding of the eastern flank of the volcano.
- Article
(21688 KB) - Full-text XML
-
Supplement
(210 KB) - BibTeX
- EndNote


Quantifying offset at recent and active faults and other structures is fundamental to deciphering the kinematics and stress and strain of deformation zones. This is a basic step for the assessment of seismic hazard (Lyakhovsky et al., 2012); in the case of volcanic zones it also contributes to the understanding of the crustal conditions that may facilitate magma ascent and thus the evaluation of volcanic hazard (Keir et al., 2006). At rift zones, the precise definition of the spreading direction and extensional rate requires the collection of a huge amount of data that must cover the whole rift extension. Since rift zones are composed of swarms of tens to hundreds of normal faults and extension fractures, the collection of a statistically robust amount of data requires a great fieldwork effort. Moreover, logistically complex conditions can affect the performance of fieldwork, as for example in the East Africa Rift system, where crustal extension rates have been frequently evaluated indirectly from plate tectonic models (Jestin et al., 1994; Chu and Gordon, 1999).
On active volcanoes, the presence of rough terrains and the possible exposition of researchers to explosive products frequently prevent optimal field surveys. These complex logistic conditions, in fact, do not permit having a detailed evaluation of the strain field due to the difficulties in obtaining a sufficiently large number of measurements along an extension fracture or a fault. In fact, only the collection of a large amount of horizontal dilation values can allow the precise reconstruction of the strain field. At faults, the reconstruction of heave and throw values requires the precise measurement of offset. In any case, the measurement of fault slip profiles is very time-consuming and can be very difficult in the case of faults with offsets in the order of tens of meters.
In the last few years, the abovementioned difficulties have been overcome by the use of structure-from-motion (SfM) photogrammetry applied to images collected by unmanned aerial vehicles (UAVs or drones) in active volcano-tectonics studies (Bonali et al., 2019a, 2020; Trippanera et al., 2019; Weismüller et al., 2019) and to assess volcanic hazard (Müller et al., 2017; Darmawan et al., 2018; De Beni et al., 2019). Therefore, in this work we use this technique, which allows us to reconstruct very detailed orthomosaics and digital surface models (DSMs) of the surveyed areas. The resulting images, which can attain a resolution as precise as 1 cm, allow us to collect several pieces of high-resolution structural data also in 3D and take direct measurements of structures and morphostructures, like dilation values along faults and fractures, even using immersive virtual reality tools (Tibaldi et al., 2020).
The present paper has a double focus: on the one hand, it describes new data useful for the interpretation of the activity of the NE rift, and on the other hand, it aims to present a methodology useful for similar studies. We show that the UAV-supported methodology can attain a precision comparable to field surveys in areas affected by active deformation. We also wish to show that UAV surveys have sufficient precision that may allow us to quantify the increment of extensional deformation by successive, repeated surveys. For this, we selected a sector of the NE rift, located on the northern summit part of Mt Etna (Italy) (Fig. 1), which is characterized by ongoing extensional fracturing, eruptive fissuring, and normal faulting. This also contributes to improving our knowledge of this important volcano-tectonic structure of Mt Etna, where only a few structural surveys were conducted several years ago by Garduño et al. (1997) and Tibaldi and Groppelli (2002). The 2002–2003 eruption took place here, accompanied by the development of new fractures and deposits, and thus new mapping is necessary.

Figure 1(a) Map showing the geodynamic context where the volcano Etna is located. (b) Map showing the main structures of Mt Etna, with the eastern flank characterized by instability (a and b modified after Villani et al., 2020). (c) Digital elevation model of the upper part of Mt Etna with the location of the 118 well-constrained earthquake epicenters (yellow dots) that occurred during the 2002–2003 eruption (data credits: Tiziana Tuvè, INGV) and available focal mechanisms between 2008 and 2019 (blue dots) (source: http://sismoweb.ct.ingv.it/maps/eq_maps/focals/index.php, last access: 15 January 2021). The location errors of the dataset are on average 0.62 km for the epicenter and 0.41 km for the depth. The corresponding values for the median are 0.3 km (epicenter) and 0.1 km (depth). For more details on the location uncertainties, see Figs. 4 and 5 of Mostaccio et al. (2013). The black rectangle locates the area of the NE rift represented in Figs. 2 and 3. PF: Piano Provenzana Fault; PFS: Pernicana Fault system; NEC: Northeast Crater; VOR: Voragine Crater; BN: Bocca Nuova Crater; SEC: Southeast Crater.
The area turned out to be very suitable for such studies because (i) it is not covered by vegetation due to the high altitude (2000–2500 m a.s.l.); (ii) it is characterized by high deformation rates (in the order of 2 cm yr−1; Tibaldi and Groppelli, 2002); (iii) the deposits affected by faulting and fracturing are historic, and as a consequence the effects of erosion are negligible and structures are perfectly preserved.
Mt Etna, one of the most active volcanoes on Earth, is located in a compressional environment (Lanzafame et al., 1997; Cocina et al., 1997, 1998), on the border between the African and the European plates (Fig. 1a).
The volcano Etna has a constantly opened central conduit feeding four summit craters named Voragine (VOR; formed in 1945), the Northeast Crater (NEC; 1911), Bocca Nuova (BN; 1968), and the Southeast Crater (SEC; 1971) (Fig. 1c). After 2007, a new large summit cone grew on the southeast flank of the SEC: the New Southeast Crater (Del Negro et al., 2013; Behncke et al., 2014; Acocella et al., 2016). Eruptions from these summit craters are classified as summit eruptions (Acocella and Neri, 2003). Flank eruptions occur along radial fissures mostly on three main “rift zones”: the W rift, the S rift, and the NE rift (Fig. 1b) (Cappello et al., 2012). These flank (or lateral) eruptions are usually fed by shallow (1–3 km) dikes that propagate laterally from the central conduit (Acocella and Neri, 2009).
The NE rift is a network of N- to NE-striking eruptive fissures, 0.5 km wide and about 7 km long, extending from the NEC (∼ 3320 m a.s.l.) to ∼1400 m of altitude (Garduño et al., 1997) (Fig. 2). The upper portion of the rift strikes north from the summit down to 2500 m a.s.l., whereas the lower section strikes northeast down to the Monte Nero area (Fig. 1c). The rift is bordered to the southeast by a 200 m high tectonic scarp (Piano Provenzana Fault, PF in Figs. 1c and 2) partially covered by recent volcanic products. To the west, the rift is limited by a small scarp, crossed by recent eruptive fissures and largely concealed by historic lava flows and cinder cones. Faults and non-eruptive fractures cut the central portion of the NE rift; they strike between 0 and 60∘ and have different kinematics, including pure extension or right-lateral and left-lateral transtension (Tibaldi and Groppelli, 2002). About 35 % of the fractures are associated with extrusive volcanic activity, which affected the lower portion of the same fractures: along these, hornitos, craters, and small and large cinder cones are common. Moving downslope, cones and craters take on a more and more pronounced elliptical shape, with the main axis striking 30–60∘. Within them, the feeding magmatic dike often crops out, striking 10–20∘ in the central part of the rift and 40–50∘ in the northeastern part (Geshi and Neri, 2014).
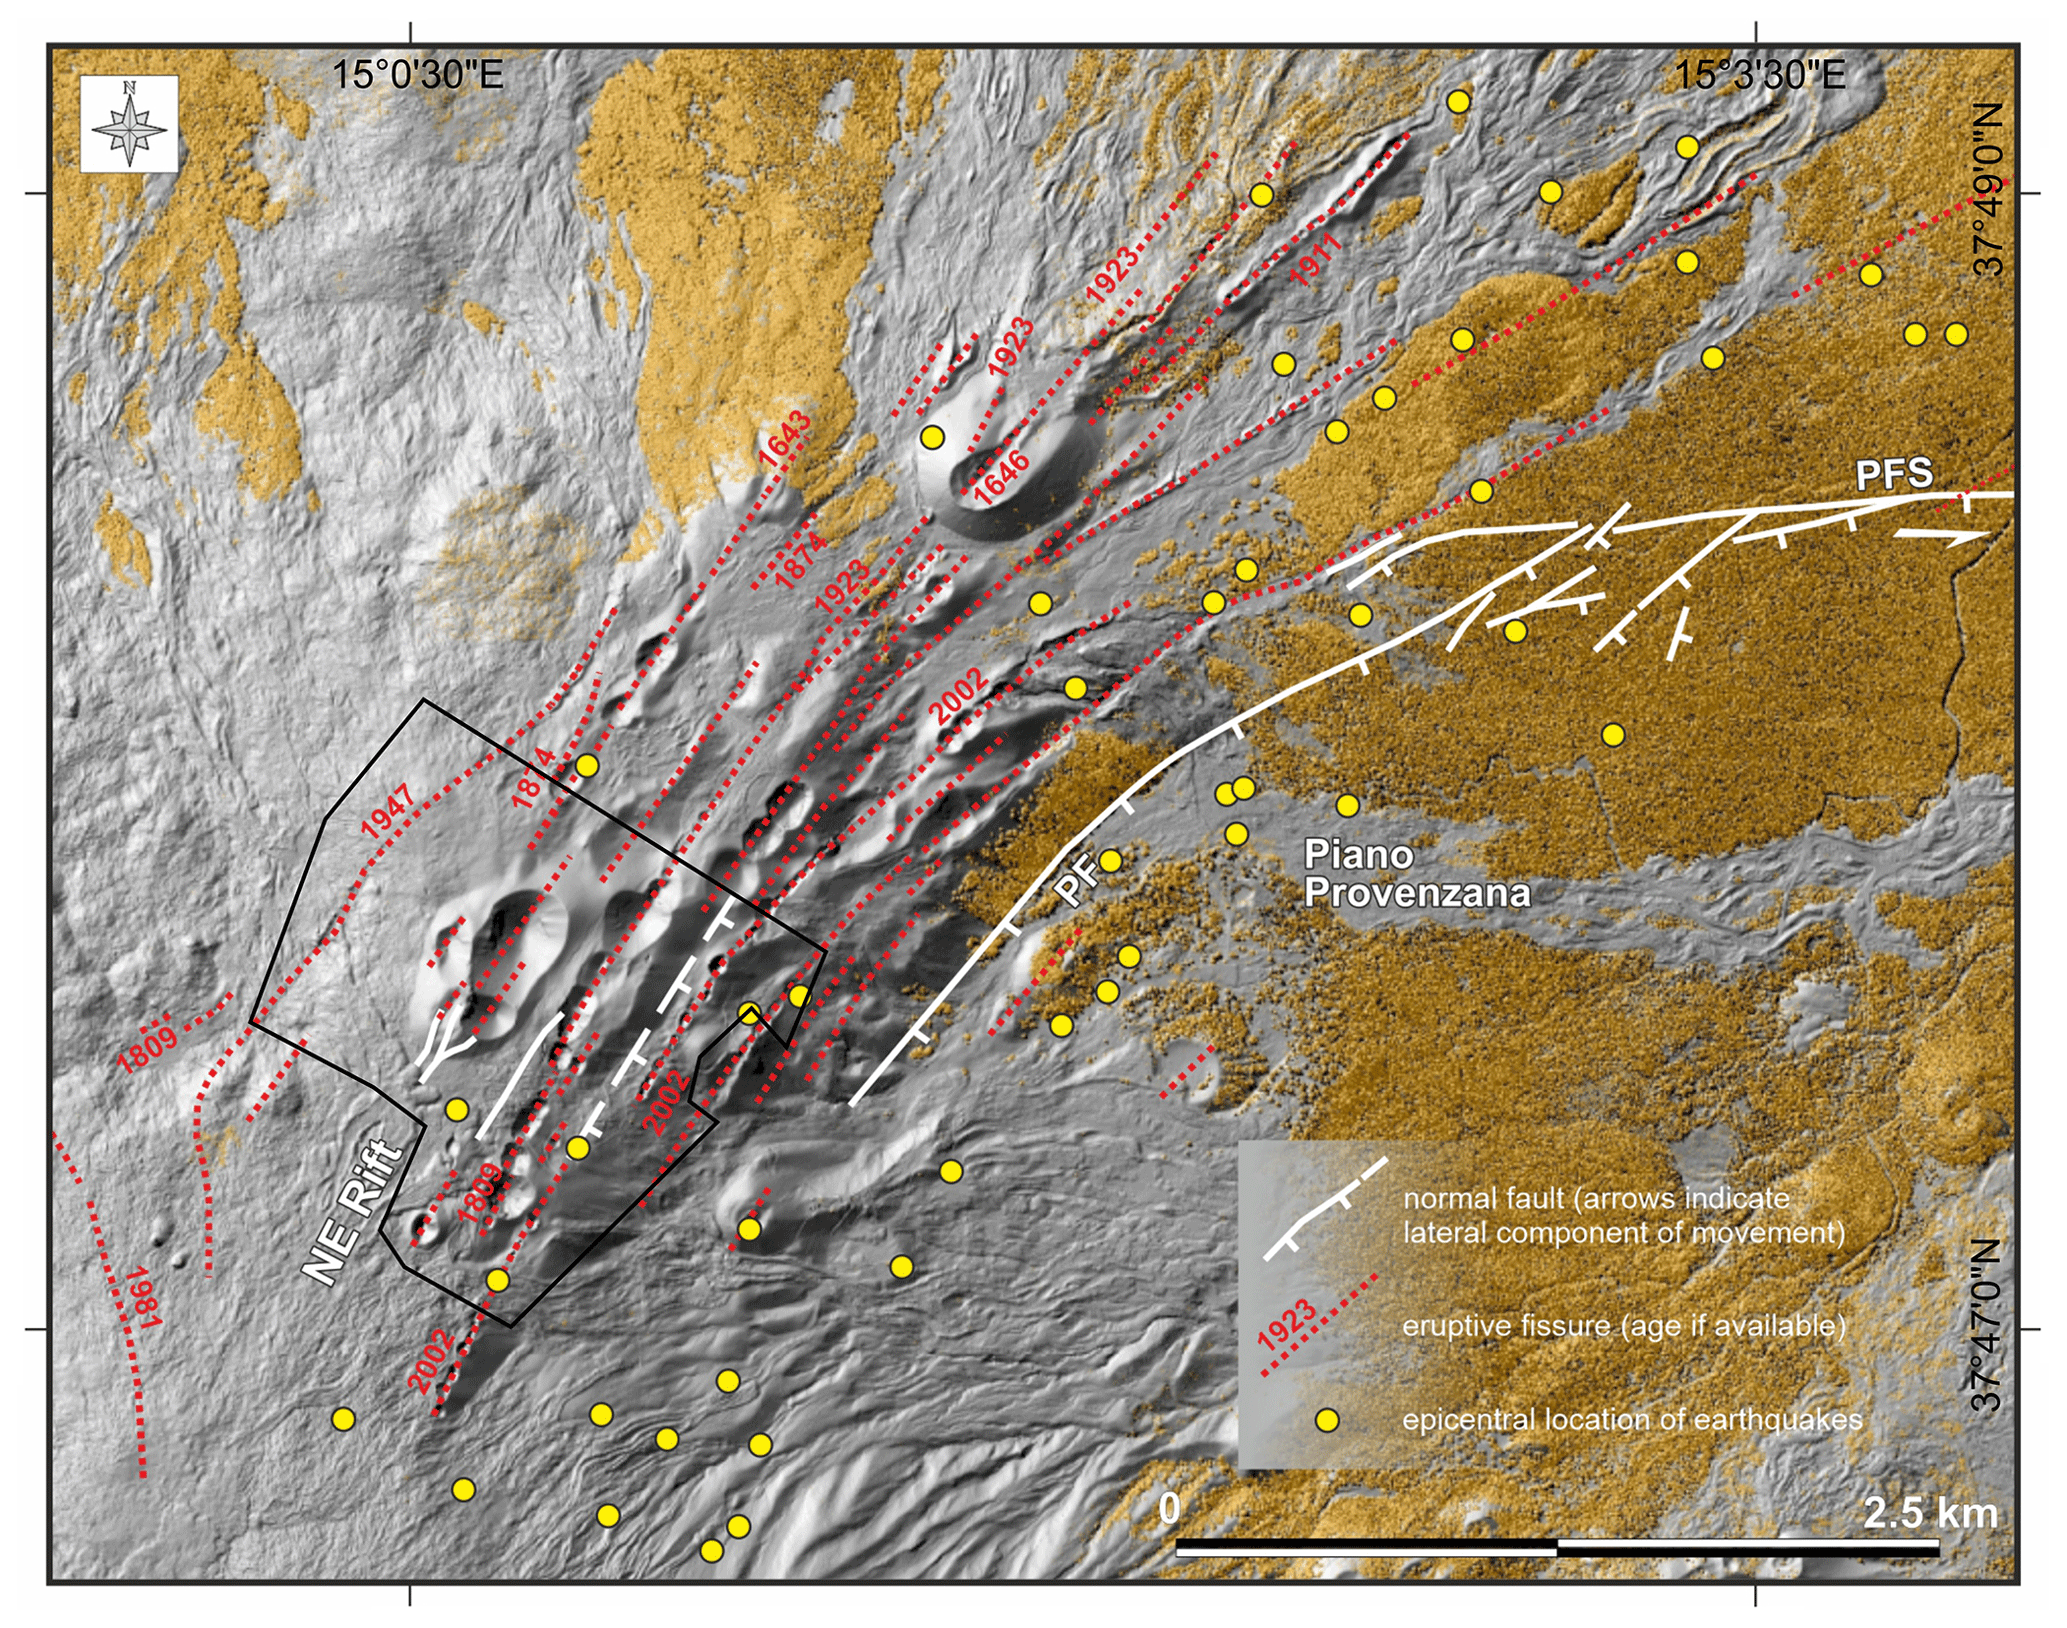
Figure 2Structural map of the NE rift superimposed on a shaded relief lidar-derived image of the area. Numbers show date of historical eruptive fissures (dotted red lines), modified after Neri et al. (2004). Yellow circles mark the epicentral location of earthquakes recorded during the 2002–2003 eruption (for location error, see caption of Fig. 1). In white, major faults; PF: Piano Provenzana Fault; PFS: Pernicana Fault system. The area outlined by the black line represents the area of Figs. 5–6 surveyed with the drones. The NE rift is located in Fig. 1.
At ∼1800 m a.s.l., the NE rift meets the 18 km long Pernicana Fault system (PFS, Figs. 1c and 2), an active left-lateral transtensional structure bounding the unstable flank of the volcano (Groppelli and Tibaldi, 1999; Acocella and Neri, 2005). Both the NE rift and the PFS are the NW margins of a wide sector of Etna involved in seaward displacement (Fig. 1b) (Borgia et al., 1992; Solaro et al., 2010; Ruch et al., 2010, 2013; Acocella et al., 2013; Apuani et al., 2013; Mattia et al., 2015), affecting an onshore area >700 km2 (Neri et al., 2004) and with a thickness of 1–4 km (Ruch et al., 2010; Siniscalchi et al., 2012; Ruch et al., 2012). This corresponds to the unstable flank delimited by the upper slip surface of Guardo et al. (2020), since this upper surface tends to emerge in correspondence to the Etna summit–NE rift zone and goes from above sea level down to almost 4 km b.s.l., from west to east. The unstable area also continues below sea level, until it reaches the abyssal plain at a depth of over 2000 m (Urulaub et al., 2018). Several authors have recently highlighted the possible relationship between eruptive activity and flank deformation, showing that the acceleration of flank deformation may trigger flank eruptions and vice versa. In some cases, it was demonstrated that tectonic activity along the PFS triggers eruptions from the NE rift (Neri et al., 2004, 2005; Walter et al., 2005; Bonforte et al., 2011; Ruch et al., 2012; De Novellis et al., 2019).
Applying the lithostratigraphic units following the standards suggested by Salvador (1994), two main groups of volcanic deposits are detectable in the NE rift area (Fig. 3): the products belonging to the Il Piano Synthem (Mongibello Volcano lithosomatic unit; 15 420 ± 60–0 yr BP) and those belonging to the Concazze Synthem (Ellittico Volcano lithosomatic unit; 56.6 ± 15.4 ka–15 420 ± 60 yr BP) (Coltelli et al., 1994; Garduño at al., 1997; Coltelli et al., 2000). Both represent volcanic units made up of products erupted during the last ∼ 57 ka and belonging to the Mongibello Supersynthem (Branca et al., 2011).
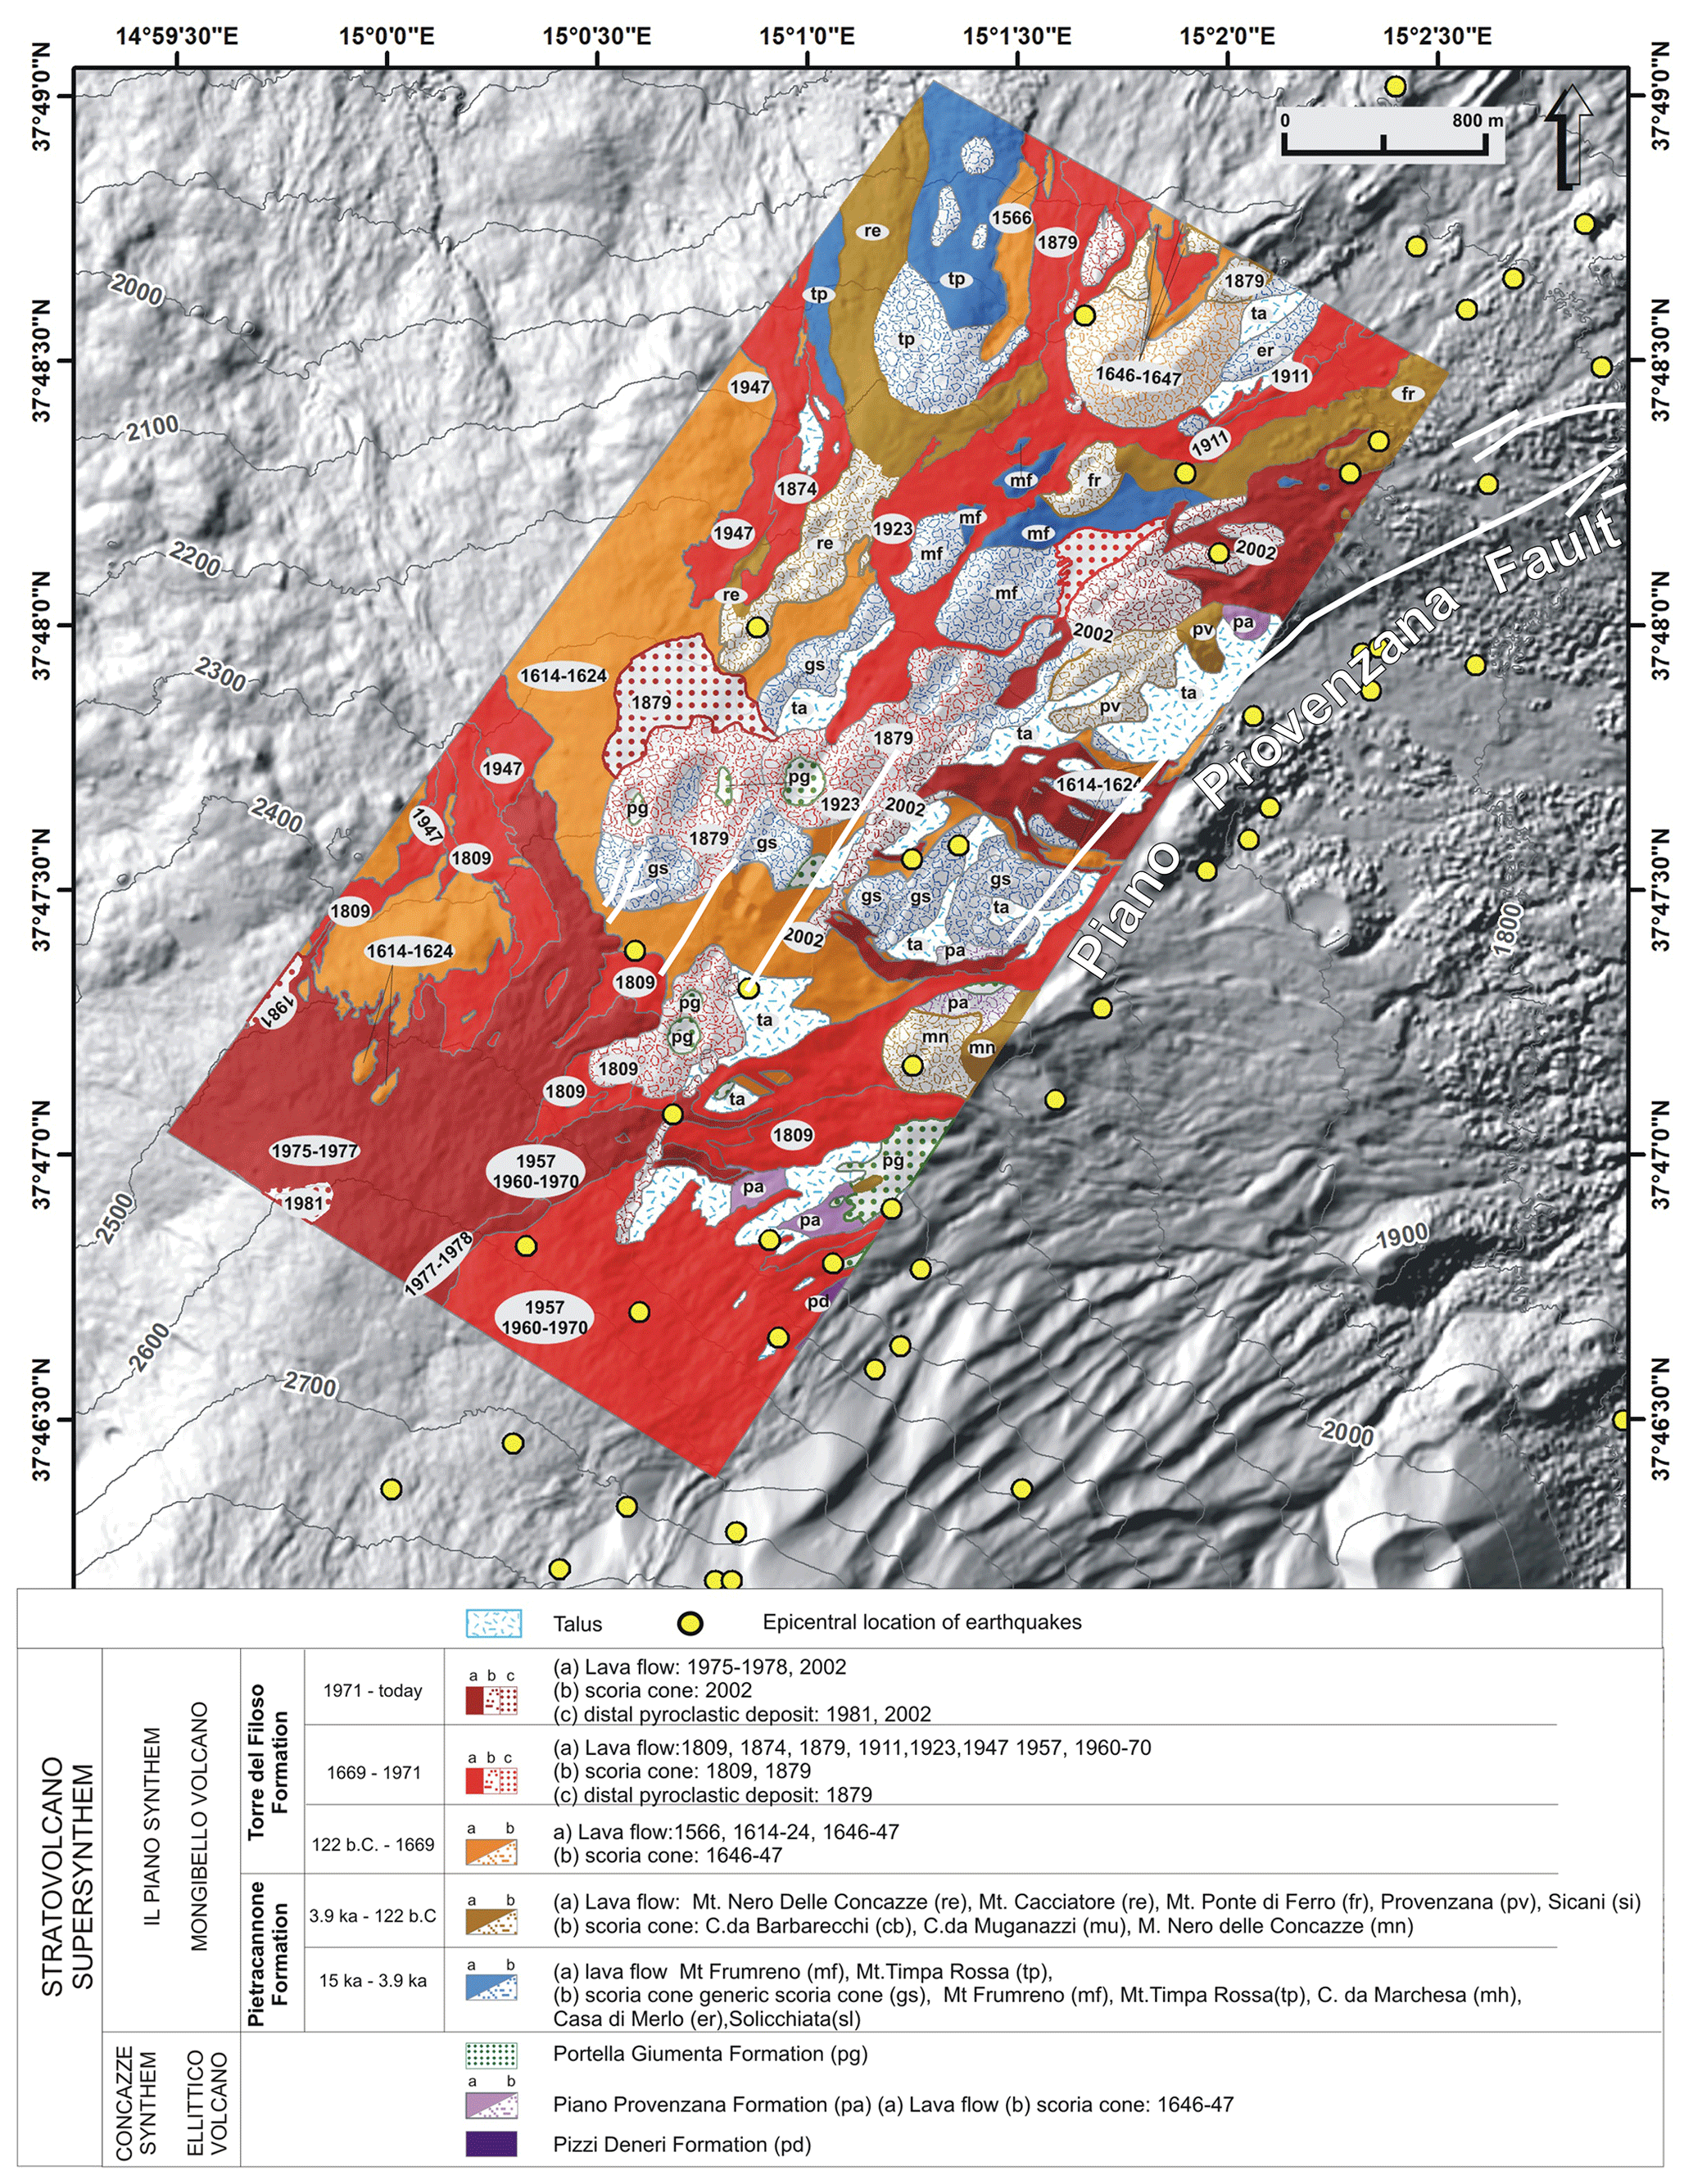
Figure 3Geological map of the NE rift showing lithostratigraphic units, the 2002–2003 earthquake epicenters (yellow dots), and the main faults (in white), superimposed on a shaded relief DSM derived from the area (Gwinner et al., 2006). The NE rift is located in Fig. 1.
With reference to the stratigraphy in the bottom part of Fig. 3, the Concazze Synthem coincides with Ellittico Volcano, a large stratovolcano with a main, summit eruptive vent approximately coinciding with the current summit of Etna but higher (3600–3800 m a.s.l.). The stratigraphic succession consists of alternating lavas and pyroclastic deposits. It ends with plagioclase-rich porphyritic lava flows and reddish subaphyric lavas and scorias (Pizzi Deneri Formation and Portella Giumenta Formation, respectively; Coltelli et al., 1994; Branca et al., 2011). The deposits of the final explosive activity at Ellittico date to 15 420 ± 60 yr BP (Condomines et al., 1982; Cortesi et al., 1988; Gillot et al., 1994; Coltelli et al., 2000; De Beni et al., 2011); this explosive activity also generated the formation of a large and deep summit caldera, whose remains today crop out at the edge of the highest portion of the NE rift, namely at Punta Lucia and Pizzi Deneri. In the NE rift area, the products of the Portella Giumenta Formation overlap deeply eroded cinder cones and porphyritic lavas belonging to Piano Provenzana Formation.
The Il Piano Synthem constitutes the present active volcano. The lower boundary coincides with the Ellittico caldera, while the upper boundary is the current topographic surface. In the NE rift, the volcanics belonging to the Pietracannone and Torre del Filosofo formations largely crop out. During the last 120 years, the NE rift eruptions lasted 21 d on average, with 7 m3 s−1 eruption rates. In ∼ 1 d, the eruptive fissures reached the maximum length (3825 m) by propagating at an average speed of 0.053 m s−1 (Neri et al., 2011).
The number of stations and geometry of the seismic network for the permanent monitoring of Etna has significantly changed in the last 40 years. The boost to the seismic network (from five short-period, vertical-component stations of the 1970s to the 30 broadband, three-component sensors of 2020) has also involved signal transmission (from analogue to digital) and acquisition systems (Patanè et al., 2004). In the framework of seismic activity at Etna, the NE rift, along with the PFS and the PF, plays a key role. Indeed, they form a discontinuity that accommodates stress changes related to the magma intrusion and tectonic loading, interpreted as the main sources causing the eastward sliding of the eastern sector of the volcano (Alparone et al., 2013a, b).
The area of interest in this case study is situated at the westernmost part of the PFS–PF fault system. The structure has a bow-like geometry, striking northeast at its western tip, and bending along an E–W strike direction towards east. Here the earthquakes are usually shallow (depths mostly between 0 and 3 km b.s.l.) and with small to moderate magnitude (< ML 5) (Fig. 1c). Despite their magnitude, these superficial earthquakes can be damaging as documented by macroseismic studies, which highlight the high seismic hazard of this sector of the volcano (Azzaro et al., 1998; Azzaro, 2004). Alparone et al. (2013a, b) report that seismic activity at the PFS–PF fault system increased from September 2002 on, starting shortly (a month) before the 2002–2003 eruption. Overall, 874 earthquakes with Mmax 4.1 heralded the onset of that eruptive episode. Focusing on seismic activity during the 2002–2003 eruption, Mostaccio et al. (2013) tested NonLinLoc (Lomax et al., 2000), a nonlinear probabilistic earthquake location method, using a 3D velocity model. From the 328 well-constrained locations obtained by Mostaccio et al. (2013), we extracted a subset of 118 shallow earthquakes, which are located in an area encompassing the zone of our case study, part of the Valle del Bove and of the PFS–PF fault system. We used this 2002–2003 dataset because it contains the best-located earthquakes and because it is representative of the typical seismic activity of this sector of Mt Etna. Figure 1c highlights a bow-shaped distribution of 90 epicenters starting from the summit caters. The striking correlation between epicenter location and structural elements is visible comparing Figs. 1 and 2, since both have an arcuate shape and seismicity recalls the bow shape of the faults and fracture distribution. Along the NE rift, the earthquake distribution trends north-northeast–south–southwest and tends to bend to northeast–southwest and east–west moving in an eastern direction. This group of earthquakes is well separated from a second, smaller group (26) located more to the south, whose position clearly marks the northern rim of the Valle del Bove (Fig. 1). It is worth noting that the peculiar distribution of earthquakes in Fig. 1 is not only typical of the 2002–2003 eruptive period. Indeed, analyzing the distribution of seismic foci during the years from 2000 to 2009 (with the exclusion of time spans with volcanic activity), Alparone et al. (2013a, b) identified a cluster of earthquakes, which closely marked the NE rift and which are aligned along the PFS–PF fault system. The magnitude of these earthquakes was small, with only two of them with ML>2. A second cluster belonged to the easternmost sector of the PFS–PF; they had stronger magnitude, reaching values ML 4.1.
Figure 1c depicts the fault plane solution calculated for the earthquakes reported in Table S1 (Supplement), which occurred from 2008 to 2019 (source: http://sismoweb.ct.ingv.it/maps/eq_maps/focals/index.php, last access: 15 January 2021). Even though the mechanisms show some scatter, common elements may be identified. The earthquakes located in the southwestern corner of the picture have T axes striking mostly north, northeast, and east–northeast. Most of these earthquakes have strike-slip or normal faulting mechanisms, with almost vertical P axes. The earthquakes located in the northern part of the figure express the general trend of deformation along the PFS–PF fault system, with either normal faulting or a horizontal strike-slip mechanism. All mechanisms of this group have T axes striking in a SE direction.
4.1 Drone survey, photo, and ground control point (GCP) collection
In the present work, we applied the structure-from-motion (SfM) photogrammetry techniques, through drone surveys, to build up the high-resolution digital surface model (DSM) and orthomosaic for the target area. We followed the overall workflow that has been successfully tested in volcanic terrains and in challenging logistic conditions (Bonali et al., 2019a, 2020). Such a workflow has been designed to work with commercial quadcopters over large areas in volcanic terrain; that is exactly the situation we tackled in the present work where we used the DJI Phantom 4 PRO. This device is supplied with an incorporated chip set to work with a space-based satellite navigation/referencing system (GPS/GLONASS) and a high-resolution camera sensor (20 megapixels) in order to enhance the quality of the surveying as well as to obtain georeferenced pictures (geographic coordinates/WGS84). The overall area has been surveyed by several different flight missions where each of them has been planned to consider the presence of natural obstacles – mainly identified as topographic highs – known from a previous field survey, topographic maps, and satellite images. Flight height has been set up to 80–95 m above the ground, reaching the excellent pixel size of 2–3 cm for the resulting orthomosaic. We set the flight path considering the wind speed and direction and chose an overlap ratio of 85 % and 80 %, along the flight path and in a lateral direction, respectively (Gerloni et al., 2018; Antoniou et al., 2019; Bonali et al., 2019a, 2020; Fallati et al., 2020). The constant speed velocity was set up by the app considering all the above settings, and pictures have been captured using equal time interval modality.
As a parallel and complementary activity to the UAV survey, we collected several GCPs, distributed all over the area, essential to scale and reference the SfM-derived models as well as to avoid any bulging effect (James and Robson, 2012; Turner et al., 2012; Westoby et al., 2012; Smith et al., 2016; Vollgger and Cruden, 2016; James et al., 2017; Esposito et al., 2017). We targeted 34 natural targets, as already successfully performed by Bonali et al. (2020), to speed up the GCP collection avoiding the deployment and recovery of artificial targets. This method allowed us to save a day (8 h) of fieldwork. All GCPs have been collected with the GPS/GNSS Stonex S850A multi-frequency receiver in RTK configuration (with sub-centimeter accuracy). Depending on the 3G network availability, the GPS was linked in real time with the sicili@net network, a real-time correction service based on the caster NTRIP tool (http://193.206.223.39:5099/spiderweb/frmIndex.aspx, last access: 10 January 2021), or, in base-rover configuration, data were post-processed thanks to the Stonex Cube manager using Monte Conca and Pizzi Deneri permanent station correction data of the Istituto Nazionale di Geofisica e Vulcanologia (INGV) network.
4.2 Photogrammetry processing
For the photogrammetry processing of the 4018 captured pictures, we used a commercial SfM software – Agisoft METASHAPE (http://www.agisoft.com/, last access: 20 January 2021), which is commonly used due to the outstanding quality of the resulting output models (Cook, 2017; Burns and Delparte, 2017; Benassi et al., 2017). We also used the Agisoft Cloud beta service for data processing. The processing passed through some key steps (workflow), described in detail by Verhoeven (2011) and Brunier et al. (2016), which led to the realization of the DSM and the orthomosaic as final products (see Fig. 4 and Tables 1–2), which are based on the SfM-derived sparse and dense clouds.
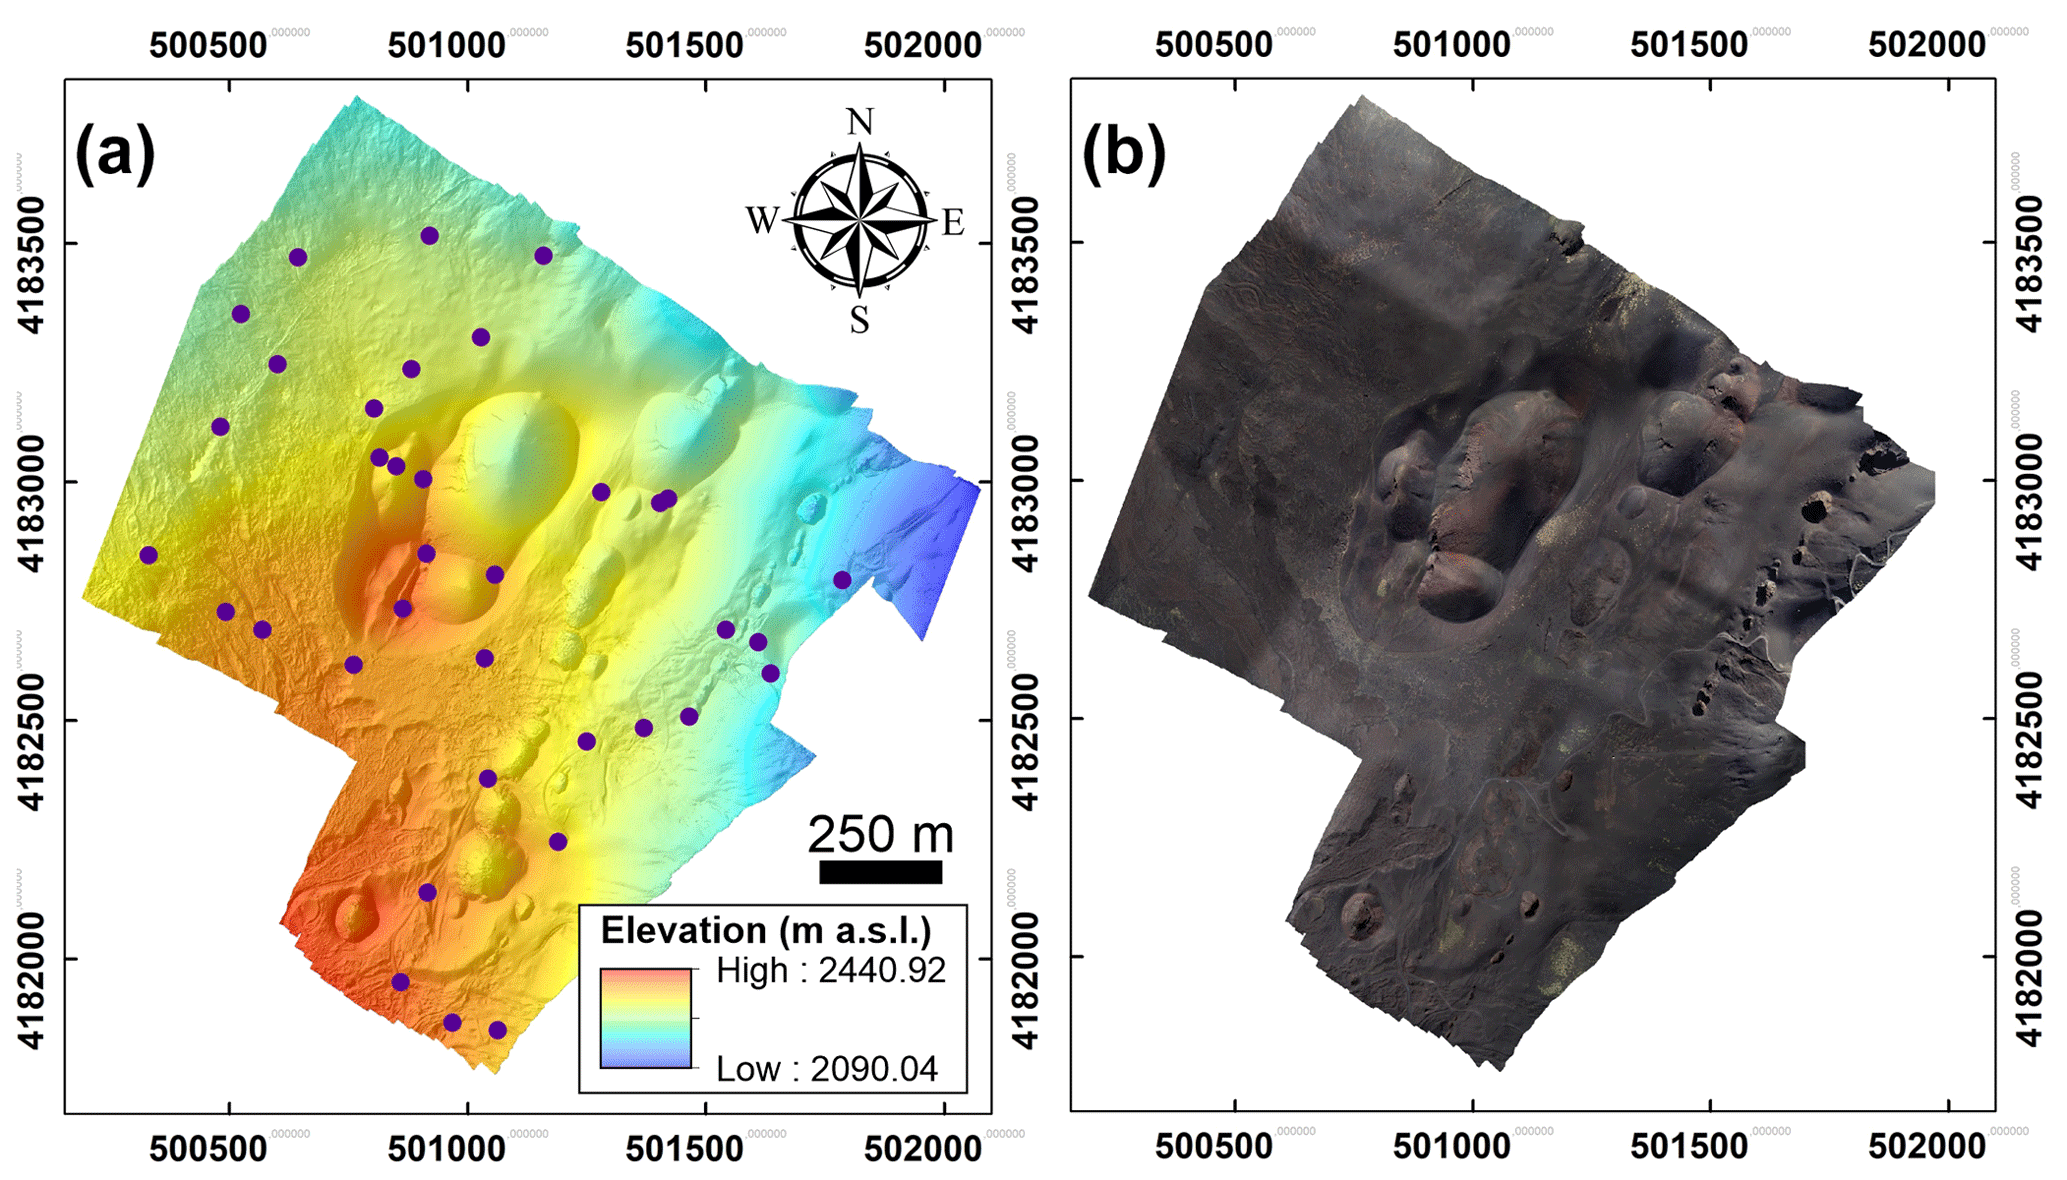
Figure 4Resulting DSM (a) and orthomosaic (b) of the surveyed area; blue dots represent the location of surveyed GCPs. Ref. system: UTM33/WGS84.
Table 1Summary of setting and results related to the photogrammetry processing.
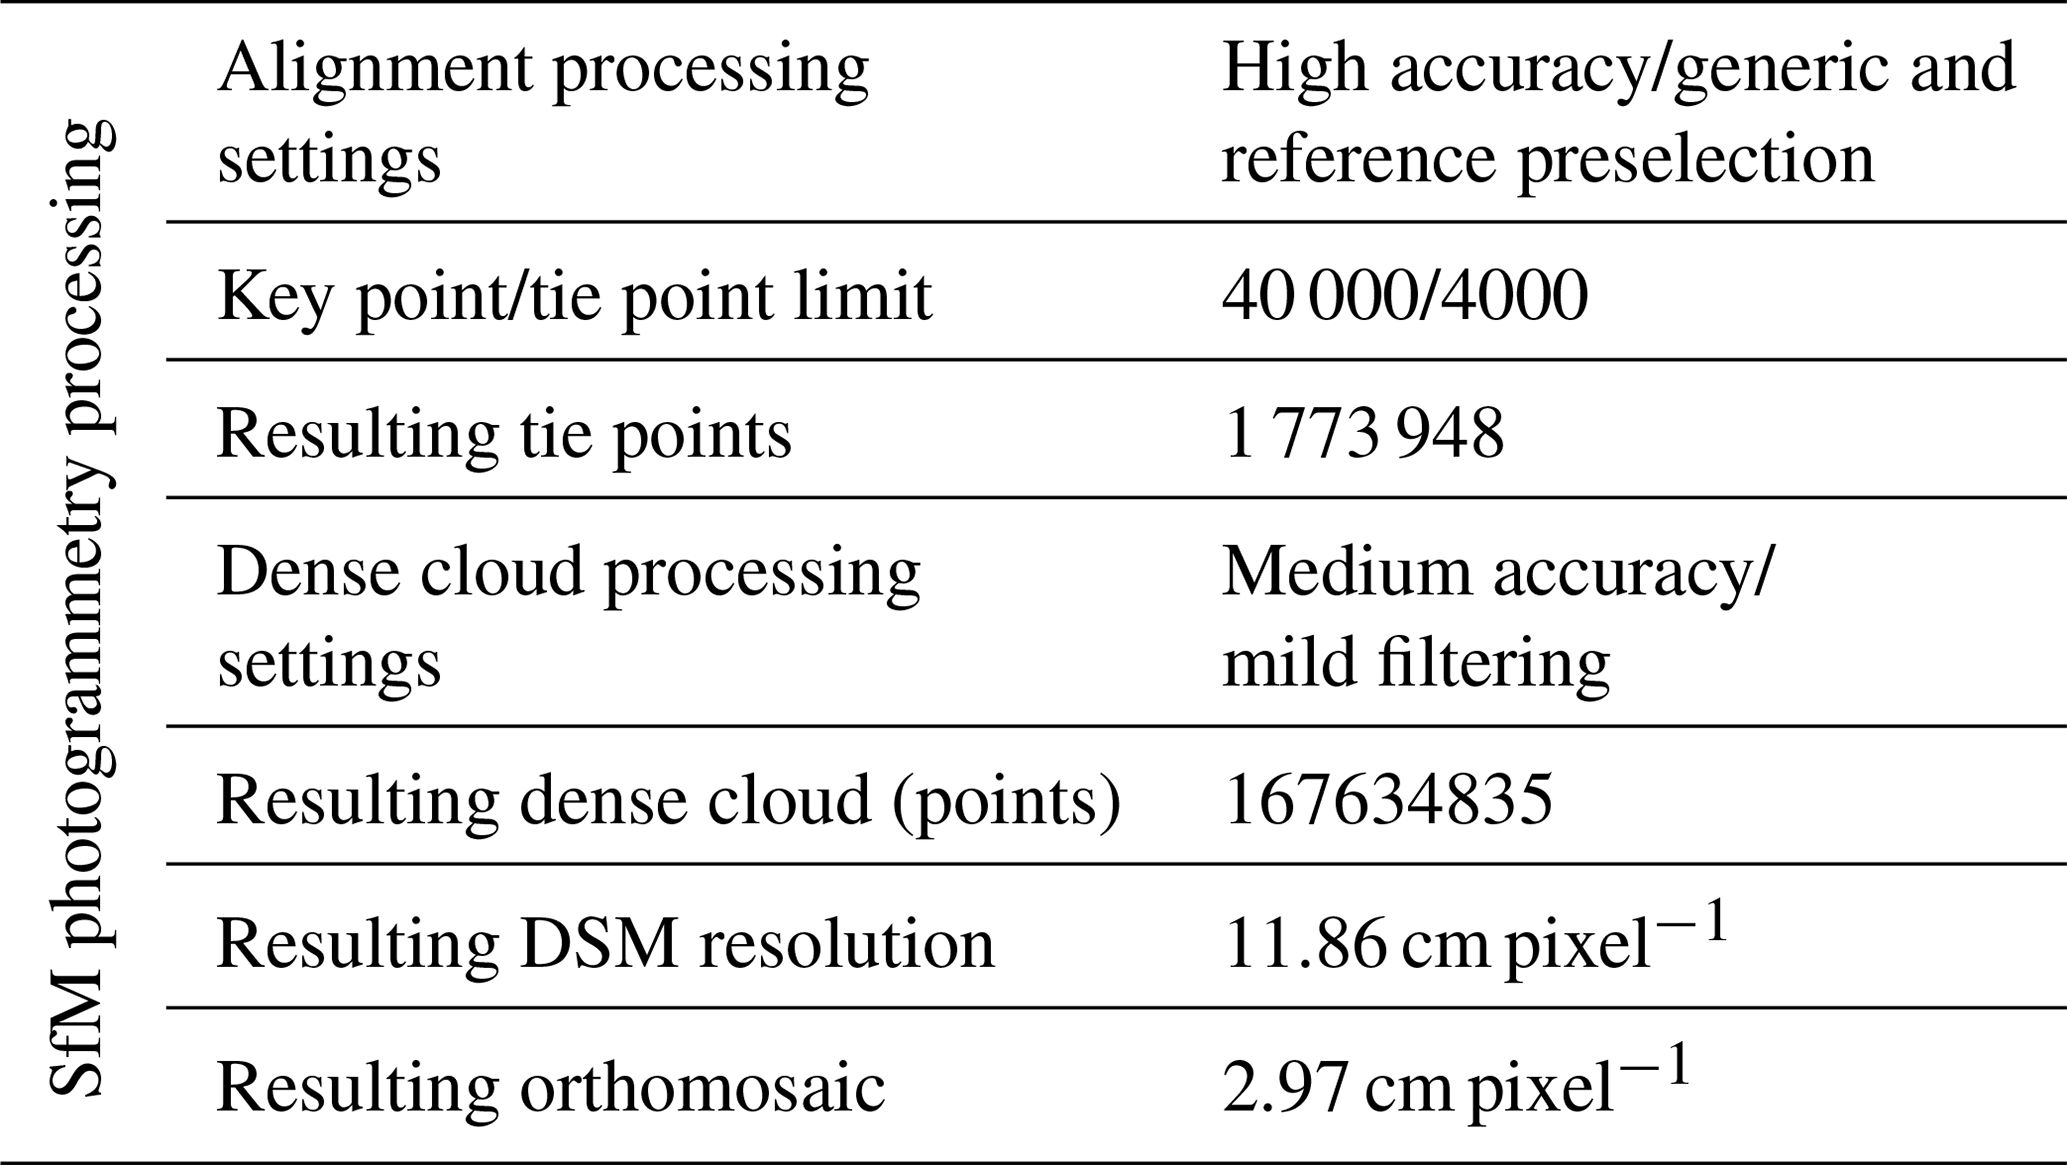
Table 2Outline of time production for DSM and orthomosaic, including the time (in hh:mm:ss) for UAV survey and image collection.
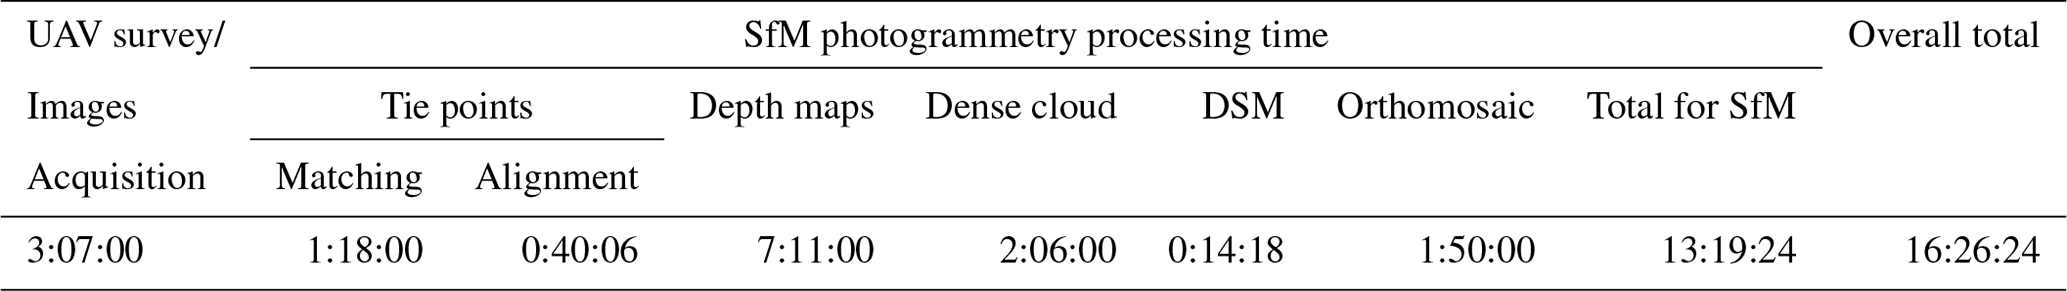
We divided the overall workflow in four principal steps: (i) aligning of pictures, (ii) georeferencing, (iii) dense cloud generation, and (iv) DSM and orthomosaic production. A summary of all details regarding the photogrammetry processing and results are reported in Tables 1 and 2.
4.3 Mapping and measurement gathering on SfM-derived models
The DSM and the orthomosaic have been uploaded in a GIS environment, where we were able to trace all normal faults, extension fractures, and eruptive fissures we recognized in the area (Fig. 5a). Structures with a continuous vertical offset >20 cm, as measured on the DSM, have been classified as normal faults, whereas structures with a vertical offset <20 cm have been classified as extension fractures. Regarding eruptive fissures, they have been traced considering morphometric parameters of the eruptive centers, as explained in Tibaldi (1995), Bonali et al. (2011), and Tibaldi and Bonali (2017): the strike of the feeding fracture is directly related to the elongation of the cone base and the crater, to the direction of the line connecting the depressions on the crater rim, and to the alignment of cones. In some eruptive centers, the outcropping dike was visible, giving information about the direction and component of opening of the eruptive fissure.

Figure 5(a) Geological–structural map of the studied area; structures are traced on high-resolution SfM-derived models; reference system: UTM33N-WGS84. Location in Fig. 2. Rose diagrams show the strike of the extension fractures (b), normal faults (c), and eruptive fissures (d).
On the basis of the derived models, we collected a total of 574 structural data (432 at extension fractures and 142 at faults): on the DSM, we measured strike and vertical offset along the normal faults by calculating the difference in elevation along topographic profiles traced every 10 m, orthogonally to the fault scarp. With regard to extension fractures, we determined the local strike, the opening direction vector, and the amount of net dilation. The latter two values were obtained by tracing a line that connects the two piercing points located on the opposite sides of an extension fracture, whenever they were undoubtedly recognizable. The length of the line gives the net dilation and related opening vector.
Finally, along two NW–SE-trending transects traced parallel to the resulting overall direction of opening, the total amount of horizontal dilation has been calculated, cumulating each single value, as well as the extension rate and stretch in the area. These values were compared with the data collected in the field by Tibaldi and Groppelli (2002).
We surveyed an area of 2.2 km2 through the collection of a total of 4018 photos. Thanks to the above-described workflow, a high-quality orthomosaic and a DSM were reconstructed (Fig. 4), with a resulting ground resolution of 2.97 and 11.86 cm pixel−1, respectively. In these models, we recognized the presence of 20 normal fault segments, 250 extension fractures, and 54 eruptive fissures (Fig. 5a). The extension fractures strike mainly N20–50∘, as highlighted in Fig. 5b, with an average strike of N24.6∘. Normal faults strike mainly N10–40∘ (Fig. 5c) with an average strike of N25.3∘, whereas eruptive fissures strike mainly N20–40∘ (Fig. 5d) with an average strike of N29.8∘. Regarding normal faults, they depict a graben running at the foothill of the westernmost pyroclastic cone, known as Monte Pizzillo (Fig. 5a). These faults have a maximum height of the SE-dipping scarp of 2.3 m (Fig. 6a), giving a heave of 0.6 m and assuming a fault plane dip of 75∘. The fault scarp facing northwest reaches a height of 3 m giving a heave of 0.8 m. The fault scarp located towards the southeastern part of the studied area faces southeast and reaches a maximum height of 4.2 m, resulting in a heave of 1.1 m.

Figure 6Geological–structural map showing (a) vertical offset amounts along normal faults and values of horizontal dilation measured along the two transects (black lines: traces of the transects) and (b) amount of opening and opening direction in the 144 detected structural stations. Rose diagram shows the distribution of net opening direction (grey) and of the respective local fracture azimuth (blue).
To better understanding the active deformation processes affecting the area, we also collected a series of quantitative data at 144 sites along the extension fractures, totalling 432 structural measurements (Fig. 6). The latter include (i) local fracture strike; (ii) the amount of fracture dilation; and (iii) the opening direction. Opening direction values are in the range N72–163∘, with a mean value of N105.7∘, and most values are between N90–100∘ (rose diagram in Figs. 6b and 7a). The fracture strike compared with the fracture opening direction highlights a clockwise rotation of fracture strike with the increase in opening directions (Fig. 7a). We have also quantified the local extension fracture azimuth, obtaining values between N329.8∘ W and N78.8∘, with a peak between N0–10∘ and a mean value of N19.1∘ (rose diagram in Fig. 6b), suggesting a slight overall left-lateral component of 3.4∘. In more detail, the fractures with a lateral component <5∘ were here classified as pure extensional fractures, whereas the remaining fractures have a left-lateral or a right-lateral component (Fig. 7b), counting 65 fractures with a left-lateral component, 40 fractures with a right-lateral component, and 39 pure extensional fractures, out of our 144 total data. Moreover, the component of left-lateral motions (up to 52∘) is larger than the right-lateral component (up to 36∘). The graph of Fig. 7b also shows the relation between lateral components of motions and fracture azimuth: with an increase in the fracture strike, the lateral component tends to change from the right-lateral component to the left-lateral component.

Figure 7(a) Graph comparing the local strike of extension fractures with the net opening direction at each site. (b) Graph comparing the local strike of extension fractures with the lateral component of motions at each site. (c) Histogram showing the frequency of the net dilation amount values measured along extension fractures. (d) Histogram showing the frequency of vertical offset values measured along normal faults. (e) Graph comparing the local strike of extension fractures with the net dilation amount at each site. (f) Graph comparing the strike of all the 250 extension fractures with their length. (g) Graph comparing the length of each structure with its maximum offset/dilation values, distinguishing between SE-dipping faults, NW-dipping faults, and extension fractures.
The dilation values measured along extension fractures are in the range of 0.07–4.14 m (Figs. 6b and 7c), the average value is 0.4 m, and almost all values <1 m. These values have been related to the local strike, showing that the greatest dilation values are associated with strike values of about N20∘E; moving away from these strike values, dilation decreases gradually, especially if strike rotates in a NW–SE direction (Fig. 7e). Regarding structure length, extension fractures reach a maximum length of 93.8 m, with an average value of 13.8 m. Fractures with greater lengths show strike values between N40–60∘ E, decreasing gradually if strike rotates in a counterclockwise direction and more abruptly if it rotates in a clockwise direction, as shown in Fig. 7f.
Regarding normal faults, we measured vertical offset every 10 m along all the fault segments, obtaining values included in the range 0.1–7 m (Figs. 6a and 7d); the average value is 1.6 m and about half of the values <1.5 m. Faults present greater lengths, reaching a maximum of 299.6 m, with an average value of 92.2 m (Fig. 7g). In particular, in Fig. 7g it is evident that greater lengths characterize SE-dipping faults, with respect to NW-dipping ones, which are all <85 m. Also, regarding the amount of displacement, we can observe that SE-dipping faults are characterized by greater values of offset than NW-dipping ones: the former reach a maximum offset of 7 m, whereas the latter reach a maximum value of 3 m (Fig. 7g). Regarding length / displacement ratios for normal faults, these are between 11.3 and 284.7, with an average value of 67.9.
Considering a dip of 75∘ for normal faults, we were able to calculate the dilatational component at both extension fractures and normal faults. Thus, we determined the total extensional component along two transects (traces in Fig. 6a), both with a length of 1.43 km, oriented in the given overall spreading direction, obtaining a total value of 5.3 m in the northern part of the area and 7.6 m in the southern part, which correspond to a stretching ratio of 1.003 in the north and 1.005 in the south.
6.1 Rift geometry, structuring, and kinematics
The part of the rift where we focused our study belongs to the 4.5 km long NE rift of Mt Etna, a volcano-tectonic feature that showed important volcanic and tectonic activity in historic times. The orientation of the structures surveyed by UAVs is coherent with the remaining structures of the central part of the NE rift, which generally strike northeast–southwest. The remaining northeastern and southwestern portions of the NE rift show a slight clockwise and counterclockwise rotation with respect to the central part, giving the rift a gentle concavity towards the southeast (Fig. 2). Most of the rift, and similarly the studied area, is dominated by extension fractures and a few normal faults. Among faults, the largest one is represented by the PF normal fault, facing southeast, which constitutes the westernmost termination of the PFS (Groppelli and Tibaldi, 1999; Tibaldi and Groppelli, 2002; Acocella and Neri, 2005). Although the PFS has left-lateral strike-slip to transtensional motions, as shown by the focal mechanism solutions of Fig. 1, in the studied sector the PF produces an escarpment, facing southeast, about 200 m high that separates the ridge of the NE rift from the flat plain of Piano Provenzana. This dominant downdip motion is linked to the rotation of the PFS–PF fault system that turns from an E–W orientation in the eastern part towards a NE–SW strike direction in the studied area. The other faults form small grabens, one of which is present in the studied sector: this graben is 35 m wide at the southwestern foothill of the Mt Pizzillo pyroclastic cone and widens up to 80 m in correspondence to the upper portions of the cone. We suggest that this geometry is mainly due to the interference between the fault dip and the shape of the conical edifice, as observed also at Mount Laki in Iceland (Trippanera et al., 2015) or along the Harrat Lunayyir Fault in Saudi Arabia (Trippanera et al., 2019).
Regarding normal faults in the area, the calculated length / displacement ratios (11.3–284.7) are smaller than the ones obtained by Gudmundsson et al. (2013), which are in the range 42–362 (average about 130). In any case, our work considered a much smaller area than the one studied by these authors, which studied all the principal faults of the eastern flank of the volcano, with lengths up to 12 950 m and displacements up to 190 m.
The 144 opening directions measured along the extension fractures on the images obtained by drone surveys and SfM, indicate a clear homogenous dominant extension vector trending N105.7∘. This vector is perpendicular to the largest slope of the area that is represented by the scarp of the PF and coincides with the direction of the maximum slope gradient of this part of Mt Etna (Favalli et al., 1999). As a consequence, we retain that the opening vector of the NE rift is strongly influenced by gravity effects linked to the shape of the Mt Etna edifice. A comparison with seismicity indicates that here the focal mechanism solutions have T axes trending northwest–southeast (Fig. 1), consistent with the opening directions measured by the drone surveys.
The fact that the faults dipping to the southeast are longer, have larger offsets, and are more frequent than those dipping to the northwest, can be linked to the fact that the NE rift has a strongly asymmetric profile measured in a NW–SE direction. Towards the northwest, in fact, there is a smooth topographic decrease, whereas in the opposite direction there is the steep slope gradient produced by the PF scarp. Moreover, the northwestern side of the NE rift is buttressed by the stable northern volcano slope, whereas the southeastern side is involved in the gravity sliding of the eastern volcano slope. This means that there is a larger gravity force acting in the SE direction.
The fact that most opening took place at the fractures with a strike ranging N0–50∘ and that the longest fractures strike N10–55∘ can be explained by assuming that this range corresponds to the local orientation of the opening vector linked with the instability of the eastern volcano flank. Finally, the generally larger values of the length of faults with respect to fractures is compatible with the concept that extensional fractures represent an immature stage of the evolution towards faults (Gudmundsson, 1987; Acocella et al., 2003; Tibaldi et al., 2019); faults can, in fact, derive from the linkage between different fracture segments during the evolutionary process.
Notwithstanding the general orthogonality of the opening direction with respect to the average trend of the NE rift, in greater detail we observed that 45 % of all extension fractures present a left-lateral component, whereas 27 % are characterized by pure extension. Considering also that the component of left-lateral motions is larger than the right-lateral component, we conclude that the NE rift has a left-lateral transtensional behavior linked to the large strike-slip component of motions along the PFS.
Finally, we used the software “Lissage” (Lee and Angelier, 1994) and the unpublished software ATMO-Stress, prepared in the framework of the NEANIAS project (https://www.neanias.eu/, last access: 10 February 2021) of the EU to calculate the stress field. Lissage is a C-based software designed to reconstruct paleo-stress trajectories in a given area (Lee and Angelier, 1994), using multiple local stress determinations as input data, including P and T axes derived from seismological data, the direction of principal stress axes from stress inversion, and any other data that describe the azimuth of σHmax or σHmin. Such software can be used to reconstruct stress trajectories both using local field data and regional paleo-stress database (e.g., Hu et al., 1996; Munoz-Martín et al., 1998; Maestro et al., 2007; Bonali et al., 2019b). The Lissage software was here used to quantify the stress field at a broader scale by the interpolation of σHmin resulting from T axes of focal mechanism solutions and from the single points of measurement of net dilation direction at extension fractures in our study area (Fig. 8a), assuming that net dilation is parallel to σHmin. The ATMO-Stress software is the online version of such software and was here used to calculate in detail, at a more local scale, the stress field based only on net dilation direction at extension fractures (Fig. 8b). Both results indicate a clear NW–SE trend of σHmin, although in detail there appears a slight counterclockwise rotation from east to west. We maintain that this rotation is linked to the transition from the strike-slip dominion of the PFS, which strikes east–west, to the more extensional dominion of the rift-PF, which strike northeast–southwest.
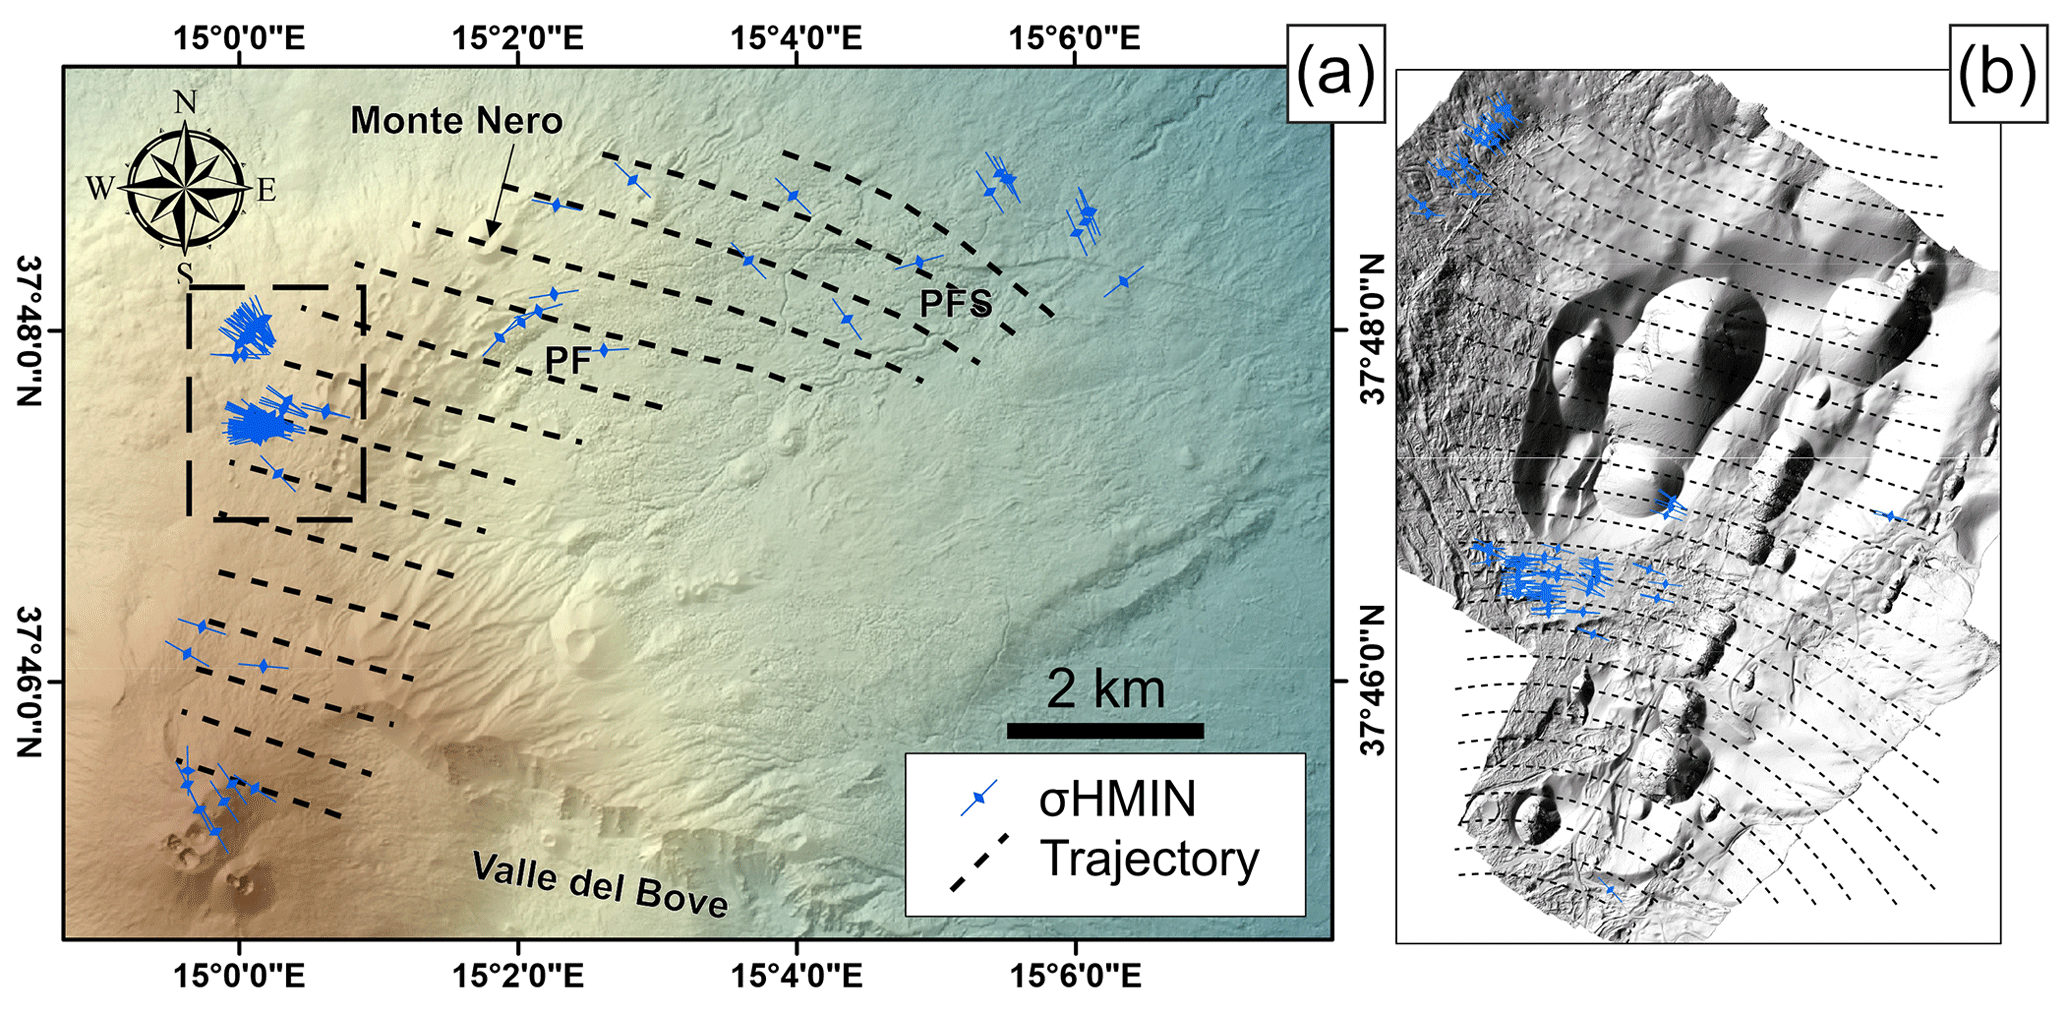
Figure 8Stress field trajectories obtained by the interpolation of σHmin in the whole NE rift (a) and in our study area (b). For stress computation, we used the program “Lissage” (Lee and Angelier, 1994) in (a), and the unpublished program ATMO-Stress in (b).
6.2 Extensional rate
The total extension measured along the faults and fractures that crop out in the studied area along the two transects is 5.3 m in the northern part of the area and 7.6 m in the southern part. Assuming the age of 1614–1624 CE for the oldest lavas affected by the brittle structures, we obtain an extension rate of 1.87 cm yr−1 at the southern transect for the last 406 years. Our measured extension rates are based on a wider dataset than that published in the Tibaldi and Groppelli (2002) paper, who indicated extension rates measured at single fractures with values of 1.8, 1.3, and 0.6 cm yr−1 along the rift moving from southwest to northeast. Our studied area corresponds to the southwestern portion of the NE rift that, based on the data of Tibaldi and Groppelli (2002), opens at a higher rate. Our data thus indicate that this part of the rift opens at a slightly higher rate than previously suggested (1.87 cm yr−1 instead of 1.3–1.8 cm yr−1) and we retain our result is based on a more robust statistical dataset.
This result is also coherent with the gross general rate of deformation measured along the nearest main structure that is represented by the PFS. This fault is linked to the NE rift, and this justifies its comparison with our data. The PFS slip-rate has been quantified in its central-western part at 0.4 ± 0.1 to 2.2 ± 0.1 cm yr−1 and in the eastern part at 0.2 ± 0.1 to 0.8 ± 0.4 cm yr−1, where the PFS splays in the Vena–Presa zone (Tibaldi and Groppelli, 2002). The PFS short-term slip-rate has been assessed to be 1 cm yr−1 in the vertical component and 2.8 cm yr−1 in the left-lateral component by Azzaro et al. (2001). A lower fault slip-rate of 0.6–1.5 cm yr−1 since 3 ka has been more recently calculated by D'Amato et al. (2017), although this refers only to the throw rate and does not consider the strike-slip component that is especially high in the western and eastern part of the PFS. This consistency between the extension rate at the NE rift and the slip along the PFS confirms that they accommodate the seaward sliding of the eastern volcano flank.
6.3 Methodological aspects
Results from the present work support the utility of using UAV-based SfM as a complementary tool to increase quality data collection, in addition to classical fieldwork, here aimed at defining the architecture and active processes working in a rift zone in volcanic areas. If we consider the time necessary to carry out the drone surveys, plus the time necessary to process the data and interpret them, we reach a total of 10 d of work. This yielded the collection of a huge amount of structural data, comprising 432 structural measurements (opening directions, amount of opening, and local azimuth) at extension fractures. In comparison, Tibaldi and Groppelli (2002) collected just 22 opening directions in the field for the same area and the related structural map over a total of 1 week of work.
The use of UAVs in geoscience is quickly increasing for a series of reasons: (i) UAV data acquisition is cheaper with respect to other methods, such as airborne and terrestrial laser scanning and lidar (Cawood et al., 2017; Lizarazo et al., 2017); (ii) the proposed approach reduces work time compared to field data collection, especially in the case of the study of long structures as those of Tibaldi and Ferrari (1992), Kozhurin et al. (2006), and Trippanera et al. (2019); (iii) UAVs provide the possibility of reaching sites that can be inaccessible for logistic conditions or can be dangerous, such as an active volcano. Moreover, the excellent accuracy of the SfM-derived models allows us to carry out observations and measures at a level of detail in the order of centimeters and thus a scale that is comparable to field surveys. This scale, together with the velocity of the workflow and related processing, can even improve performance.
Furthermore, the rapid development of UAV technology (furnished with a real-time kinematic positioning system) will increase the accuracy of the SfM outputs in the future, flying also at a higher elevation from the ground. Similarly, the UAV flight stability, camera quality and battery capacity can also improve thanks to the continuous delivery of new UAVs and related items.
With regard to limitations arising from the use of the UAV-based SfM, we mention the dependence on the flight time that is linked to the battery life, weather conditions, flight rules, and the fundamental step of placing and surveying the GCPs. The latter are needed to precisely scale and reference the model, but their placement is time-consuming, slowing down the total time needed for the UAV missions, particularly over broad areas. Smith et al. (2016) suggested considering a minimum of three GCPs, whereas other authors considered a higher number of GCPs but decreased the overlap ratio among the pictures to 60 %–70 % (Javernick et al., 2014). Finally, by increasing overlap ratio, it is possible to decrease the number of GCPs considered for scaling and referencing (Esposito et al., 2017).
We applied UAV-based structure-from-motion (SfM) photogrammetry to analyze a high-altitude area characterized by rough terrains in the northeastern part of Mt Etna. The area is affected by the presence of the NE rift, a volcano-tectonic feature composed of NE-striking historic eruptive fissures, extension fractures, and normal faults. The stratigraphic deposits span an age from 56.6 ± 15.4 ka to nowadays, whereas in the area surveyed by the drones, the deposits are mostly historic in age.
The highly detailed drone survey, in the order of 2.8 cm of resolution, showed that the studied sector of the NE rift is affected by 250 extension fractures, 20 normal fault segments, and 54 eruptive fissures. The extension fractures strike mainly N20–50∘, with an average strike of N24.6∘. The normal faults strike mainly N10–40∘ with an average strike of N25.3∘. The eruptive fissures strike mainly N20–40∘ with an average strike of N29.8∘.
We measured 432 structural data, comprising local fracture strike, dilation amount, and opening direction. Opening direction values are in the range N72–163∘, with a mean value of N105.7∘. A comparison with respect to fracture strike indicates the presence of a slight overall left-lateral component of 3.4∘. Moreover, 65 fractures have a left-lateral component, 40 fractures a right-lateral component, and 39 pure extension. The component of left-lateral motions (up to 52∘) is larger than the right-lateral component (up to 36∘). These data suggest the effect of the left-lateral normal Pernicana Fault system on the NE rift kinematics.
Seismicity seems to be concentrated along the Pernicana–Piano Provenzana faults, whereas earthquake focal mechanism solutions show T axes trending perpendicularly to the NE rift, consistent with the results of our measurements of dilation orientations.
Assuming the age of 1614–1624 CE for the oldest lavas affected by the studied fractures, we obtain an extension rate of 1.87 cm yr−1 for the last 406 years. This rate is consistent with the data measured by other authors at the Pernicana Fault system.
Results indicate that SfM photogrammetry coupled with drone surveys allows us to collect large datasets with a detail comparable to field surveys. Drone survey has the advantage of collecting more data in the same time period with respect to classical fieldwork and also allows data collection in difficult terrains where logistics can represent an insurmountable obstacle.
Data are available from the corresponding author upon request.
The supplement related to this article is available online at: https://doi.org/10.5194/se-12-801-2021-supplement.
Conceptualization of the project was done by AT and NC. Photogrammetry processing of the 3D model was done by FLB. Data for the model and its calibration were collected and provided by MC, EDB, FLB, and LF. Geological structural data and stratigraphy have been prepared by MN. Seismological data and text come from SF and HL. Evaluation of the model results and their interpretation were performed by NC and FLB. AT wrote the paper with help from all co-authors. All authors read and approved the final paper.
The authors declare that they have no conflict of interest.
This article is part of the special issue “Tools, data and models for 3-D seismotectonics: Italy as a key natural laboratory”. It is a result of the workshop on “Tools, data and models for 3D seismotectonics: the Italian laboratory over time”, Perugia, Italy, 9–10 July 2019.
We acknowledge Roberto Emanuele Rizzo and Daniele Trippanera for their useful suggestions to improve an earlier version of the paper. We are grateful to Tiziana Tuvè (INGV) for the data on the hypocentral location of earthquakes in 2002–2003 and to Luciano Scarfì and Carmelo Cassisi for the access to http://sismoweb.ct.ingv.it/maps/eq_maps/focals/index.php (last access: 15 January 2021). This study has been conducted in the framework of the EU project NEANIAS, within which the software ATMO-stress has been developed under the guidance of Konstantinos Karantzalos, the International Lithosphere Program – Task Force II (Leader Alessandro Tibaldi), and it is also an outcome of (i) the Project MIUR – Dipartimenti di Eccellenza 2018–2022 and (ii) GeoVires, the Virtual Reality Lab for Earth Sciences, Department of Earth and Environmental Sciences, University of Milan Bicocca, Italy (https://geovires.unimib.it/, last access: 30 March 2021). We also acknowledge the Parco dell'Etna (https://parcoetna.it/, last access: 15 December 2020) for permission for drone surveys.
This research has been supported by the European Commission, Horizon 2020 Framework Programme (NEANIAS (grant no. 863448)).
This paper was edited by Luca De Siena and reviewed by Daniele Trippanera and Roberto Emanuele Rizzo.
Acocella, V. and Neri, M.: What makes flank eruptions? The 2001 Etna eruption and the possible triggering mechanisms, B. Volcanol., 65, 517–529, https://doi.org/10.1007/s00445-003-0280-3, 2003.
Acocella, V. and Neri, M.: Structural features of an active strike-slip fault on the sliding flank of Mt. Etna (Italy), J. Struct. Geol., 27/2, 343–355, https://doi.org/10.1016/j.jsg.2004.07.006, 2005.
Acocella, V. and Neri, M.: Dike propagation in volcanic edifices: overview and possible developments, Special Issue: Gudmundsson – Volcanoes, Tectonophysics, 471, 67–77, https://doi.org/10.1016/j.tecto.2008.10.002, 2009.
Acocella, V., Korme, T., and Salvini, F.: Formation of normal faults along the axial zone of the Ethiopian Rift, J. Struct. Geol., 25, 503–513, 2003.
Acocella, V., Neri, M., and Norini, G.: An overview of analogue models to understand a complex volcanic instability: application to Etna, Italy, J. Volcanol. Geoth. Res., 251, 98–111, https://doi.org/10.1016/j.jvolgeores.2012.06.003, 2013.
Acocella, V., Neri, M., Behncke, B., Bonforte, A., del Negro, C., and Ganci, G.: Why does a mature volcano need new vents? The case of the New Southeast Crater at Etna, Front. Earth Sci., 4, 67, https://doi.org/10.3389/feart.2016.00067, 2016.
Alparone, S., Bonaccorso, A., Bonforte, A., and Currenti, G.: Long-term stress-strain analysis of volcano flank instability: The eastern sector of Etna from 1980 to 2012, J. Geophys. Res., 118, 5098–5108, https://doi.org/10.1002/jgrb.50364, 2013a.
Alparone, S., Cocina, O., Gambino, S., Mostaccio, A., Spampinato, S., Tuvè, T., and Ursino, A.: Seismological features of the Pernicana–Provenzana Fault System (Mt. Etna, Italy) and implications for the dynamics of northeastern flank of the volcano, J. Volcanol. Geoth. Res., 251, 16–26, https://doi.org/10.1016/j.jvolgeores.2012.03.010, 2013b.
Antoniou, V., Nomikou, P., Bardouli, P., Sorotou, P., Bonali, F., Ragia, L., and Metaxas, A.: The story map for Metaxa mine (Santorini, Greece): a unique site where history and volcanology meet each other, in: Proceedings of the 5th International Conference on Geographical Information Systems Theory, Applications and Management, Heraklion, Greece, 3–5 May 2019, SciTePress, 1, 212–219, 2019.
Apuani, T., Corazzato, C., Merri, A., and Tibaldi, A.: Understanding Etna flank instability through numerical models, J. Volcanol. Geoth. Res., 251, 112–126, https://doi.org/10.1016/j.jvolgeores.2012.06.015, 2013.
Azzaro, R.: Seismicity and active tectonics in the Etna region: constraints for a seismotectonic model, in: Mt. Etna: volcano laboratory, Geophysical monograph, edited by: Bonaccorso, A., Calvari, S., Coltelli, M., Del Negro, C., and Falsaperla, S., AGU, Washington D.C., 143, 205–220, https://doi.org/10.1029/143GM13, 2004.
Azzaro, R., Ferreli, L., Michetti, A. L., Serva, L., and Vittori, E.: Environmental hazard of capable faults: the case of the Pernicana fault (Mt. Etna, Sicily), Nat. Hazards, 17, 147–162, 1998.
Azzaro, R., Mattia, M., and Puglisi, G.: Fault creep and kinematics of the eastern segment of the Pernicana Fault (Mt. Etna, Italy) derived from geodetic observations and their tectonic significance, Tectonophysics, 333, 401–415, 2001.
Behncke, B., Branca, S., Corsaro, R. A., De Beni, E., Miraglia, L., and Proietti, C.: The 2011–2012 summit activity of Mount Etna: birth, growth and products of the new SE crater, J. Volcanol. Geoth. Res., 270, 10–21, 2014.
Benassi, F., Dall'Asta, E., Diotri, F., Forlani, G., Morra di Cella, U., Roncella, R., and Santise, M.: Testing accuracy and repeatability of UAV blocks oriented with gnss-supported aerial triangulation, Remote Sens., 9, 172, https://doi.org/10.3390/rs9020172, 2017.
Bonali, F. L., Corazzato, C., and Tibaldi, A.: Identifying rift zones on volcanoes: an example from La Réunion island, Indian Ocean, B. Volcanol., 73, 347–366, 2011.
Bonali, F. L., Tibaldi, A., Marchese, F., Fallati, L., Russo, E., Corselli, C., and Savini, A.: UAV-based surveying in volcano-tectonics: An example from the Iceland rift, J. Struct. Geol., 121, 46–64, 2019a.
Bonali, F. L., Tibaldi, A., Mariotto, F. P., Saviano, D., Meloni, A., and Sajovitz, P.: Geometry, oblique kinematics and extensional strain variation along a diverging plate boundary: The example of the northern Theistareykir Fissure Swarm, NE Iceland, Tectonophysics, 756, 57–72, 2019b.
Bonali, F. L., Tibaldi, A., Corti, N., Fallati, L., and Russo, E.: Reconstruction of Late Pleistocene-Holocene Deformation through Massive Data Collection at Krafla Rift (NE Iceland) Owing to Drone-Based Structure-from-Motion Photogrammetry, Appl. Sci., 10, 6759, https://doi.org/10.3390/app10196759, 2020.
Bonforte, A., Guglielmino, F., Coltelli, M., Ferretti, A., and Puglisi, G.: Structural assessment of Mount Etna volcano from Permanent Scatterers analysis, Geochem. Geophy. Geosy., 12, Q02002, https://doi.org/10.1029/2010GC003213, 2011.
Borgia, A., Ferrari, L., and Pasquarè, G.: Importance of gravitational spreading in the tectonic and volcanic evolution of Mount Etna, Nature, 357, 231–235, 1992.
Branca, S., Coltelli M., and Groppelli G.: Geological evolution of a complex basaltic stratovolcano: Mount Etna, Italy, It. J. Geosci. (Boll. Soc. Geol. It.), 130, 306–317, https://doi.org/10.3301/IJG.2011.13, 2011.
Brunier, G., Fleury, J., Anthony, E. J., Gardel, A., and Dussouillez, P.: Close-range airborne Structure-from-Motion Photogrammetry for high-resolution beach morphometric surveys: Examples from an embayed rotating beach, Geomorphology, 261, 76–88, 2016.
Burns, J. H. R. and and Delparte, D.: Comparison of commercial structure-from-motion photogrammetry software used for underwater three-dimensional modeling of coral reef environments, in: International Archives of the Photogrammetry, Remote Sensing and Spatial Information Sciences, ISPRS Archives, 42, 127–131, 2017.
Cappello, A., Neri, M., Acocella, V., Gallo, G., Vicari, A., and Del Negro, C.: Spatial vent opening probability map of Mt. Etna volcano (Sicily, Italy), B. Volcanol., 74, 2083–2094, https://doi.org/10.1007/s00445-012-0647-4, 2012.
Cawood, A. J., Bond, C. E., Howell, J. A., Butler, R. W., and Totake, Y.: LiDAR, UAV or compass-clinometer? Accuracy, coverage and the effects on structural models, J. Struct. Geol., 98, 67–82, 2017.
Chu, D. and Gordon, R. G.: Evidence for motion between Nubia and Somalia along the Southwest Indian Ridge, Nature, 398, 64–67, https://doi.org/10.1038/18014, 1999.
Cocina, O., Neri, G., Privitera, E., and Spampinato, S.: Stress tensor computations in the Mount Etna area (Southern Italy) and tectonic implications, J. Geodyn., 23, 109–127, 1997.
Cocina, O., Neri, G., Privitera, E., and Spampinato, S.: Seismogenic stress field beneath Mt. Etna (South Italy) and possible relationships with volcano-tectonic features, J. Volcanol. Geoth. Res., 83, 335–348, 1998.
Coltelli, M., Garduño, V.H., Neri, M., Pasquarè, G., and Pompilio, M.: Geology of northern wall of Valle del Bove, Etna (Sicily), Acta Vulcanol., 5, 55–68, 1994.
Coltelli, M., Del Carlo, P., and Vezzoli, L.: Stratigraphic constrains for explosive activity in the last 100 ka at Etna volcano. Italy, Int. J. Earth Sci., 89, 665–677, 2000.
Condomines, M., Tanguy, J. C., Kieffer, G., and Allegre, C. J.: Magmatic evolution of a volcano studied by 230Th–238U disequilibrium and trace elements systematics: the Etna case, Geochim. Cosmochim. Ac., 46, 1397–1416, 1982.
Cook, K. L.: An evaluation of the effectiveness of low-cost UAVs and structure from motion for geomorphic change detection, Geomorphology, 278, 195–208, 2017.
Cortesi, C., Fornaseri, M., Romano, R., Alessio, M., Allegri, L., Azzi, C., Bella, F., Calderoni, G., Follieri, M., Improta, S., Magri, D., Preite, Martinez M., Sadori, L., Petrone, V., and Turi, B.: Cronologia 14C di piroclastiti recenti del Monte Etna identificazione e distribuzione dei fossili vegetali, Boll. Soc. Geol. It., 107, 531–545, 1988.
D'Amato, D., Pace, B., Di Nicola, L., Stuart, F. M., Visini, F., Azzaro, R., Branca, S., and Barfod, D. N.: Holocene slip rate variability along the Pernicana fault system (Mt. Etna, Italy): Evidence from offset lava flows, GSA Bulletin, 129, 304–317, 2017.
Darmawan, H., Walter, T. R., Brotopuspito, K. S., and Nandaka, I. G. M. A.: Morphological and structural changes at the Merapi lava dome monitored in 2012–15 using unmanned aerial vehicles (UAVs), J. Volcanol. Geoth. Res., 349, 256–267, 2018.
De Beni, E., Branca, S., Coltelli, M., Groppelli, G., and Wijbrans J.: 40Ar/39Ar isotopic dating of Etna volcanic succession, It. J. Geosci. (Boll. Soc. Geol. It.), 130, 292–305, https://doi.org/10.3301/IJG.2011.14, 2011.
De Beni, E., Cantarero, M., and Messina, A.: UAVs for volcano monitoring: A new approach applied on an active lava flow on Mt. Etna (Italy), during the 27 February–02 March 2017 eruption, J. Volcanol. Geoth. Res., 369, 250–262, 2019.
Del Negro, C., Cappello, A., Neri, M., Bilotta, G., Hérault, A., and Ganci, G.: Lava flow hazards at Etna volcano: constraints imposed by eruptive history and numerical simulations, Scientific Reports – Nature, 3, 3493, https://doi.org/10.1038/srep03493, 2013.
De Novellis, V., Atzori, S., De Luca, C., Manzo, M., Valerio, E., Bonano, M., C., Cardaci, R., Castaldo, D., Di Bucci, M., Manunta, G., Onorato, S., Pepe, G., Solaro, P., Tizzani, I., Zinno, M., Neri, R., Lanari, and Casuet, F.: DInSAR analysis and analytical modeling of Mount Etna displacements: The December 2018 volcano-tectonic crisis, Geophys. Res. Lett., 46, 5817–5827, https://doi.org/10.1029/2019GL082467, 2019.
Esposito, G., Mastrorocco, G., Salvini, R., Oliveti, M., and Starita, P.: Application of UAV photogrammetry for the multi-temporal estimation of surface extent and volumetric excavation in the Sa Pigada Bianca open-pit mine, Sardinia, Italy. Environ, Earth Sci., 76, 103, https://doi.org/10.1007/s12665-017-6409-z, 2017.
Fallati, L., Saponari, L., Savini, A., Marchese, F., Corselli, C., and Galli, P.: Multi-Temporal UAV Data and Object-Based Image Analysis (OBIA) for Estimation of Substrate Changes in a Post-Bleaching Scenario on a Maldivian Reef, Remote Sens., 12, 2093, https://doi.org/10.3390/rs12132093, 2020.
Favalli, M., Innocenti, F., Teresa Pareschi, M., Pasquarè, G., Mazzarini, F., Branca, S., and Tibaldi, A.: The DEM or Mt. Etna: geomorphological and structural implications, Geodin. Acta, 12, 279–290, 1999.
Garduño, V. H., Neri, M., Pasquarè, G., Borgia, A., and Tibaldi A.: Geology of the NE-Rift of Mount Etna (Sicily, Italy), Acta Vulcanologica, 9, 91–100, 1997.
Gerloni, I. G., Carchiolo, V., Vitello, F. R., Sciacca, E., Becciani, U., Costa, A., Riggi, S., Bonali, F. L., Russo, E., Fallati, L., Marchese, F., and Tibaldi, A.: Immersive Virtual Reality for Earth Sciences, in: Proceedings of the 2018 Federated Conference on Computer Science and Information Systems (FedCSIS) IEEE, Poznan, Poland, 9–12 September 2018, 527–534, 2018.
Geshi, N. and Neri, M.: Dynamic feeder dyke systems in basaltic volcanoes: the exceptional example of the 1809 Etna eruption (Italy), Front. Earth Sci., 2, 13, https://doi.org/10.3389/feart.2014.00013, 2014.
Gillot, P. Y., Kieffer, G., and Romano, R.: The evolution of Mount Etna in the light of potassium-argon dating, Acta Vulcanol., 5, 81–87, 1994.
Groppelli, G. and Tibaldi, A.: Control of rock rheology on deformation style and slip-rate along the active Pernicana Fault, Mt. Etna, Italy, Tectonophysics, 305, 521–537, https://doi.org/10.1016/S0040-1951(99)00035-9, 1999.
Guardo, R. A., De Siena, L., and Dreidemie, C.: Mt. Etna feeding system and sliding flank: a new 3D image from earthquakes distribution in a customisable GIS, Front. Earth Sci., 8, 589925, https://doi.org/10.3389/feart.2020.589925, 2020.
Gudmundsson, A.: Geometry, formation and development of tectonic fractures on the Reykjanes Peninsula, southwest Iceland, Tectonophysics, 139, 295–308, 1987.
Gudmundsson, A., De Guidi, G., and Scudero, S.: Length–displacement scaling and fault growth, Tectonophysics, 608, 1298–1309, 2013.
Gwinner, K., Coltelli, M., Flohrer, J., Jaumann, R., Matz, K. D., Marsella, M., Roatsch T., Scholten F., and Trauthan, F.: The HRSC-AX Mt. Etna project: High-resolution orthoimages and 1 m DEM at regional scale, International Archives of Photogrammetry and Remote Sensing, XXXVI (Part 1), available at: http://isprs.free. fr/documents/Papers/T05-23 (last access: 10 January 2021), 2006.
Hu, J. C., Angelier, J., Lee, J. C., Chu, H. T., and Byrne, D.: Kinematics of convergence, deformation and stress distribution in the Taiwan collision area: 2-D finite-element numerical modelling, Tectonophysics, 255, 243–268, 1996.
James, M. R. and Robson, S.: Straightforward reconstruction of 3D surfaces and topography with a camera: accuracy and geoscience application, J. Geophys. Res.-Earth, 117, F03017, https://doi.org/10.1029/2011JF002289, 2012.
James, M. R., Robson, S., d'Oleire-Oltmanns, S., and Niethammer, U.: Optimising UAV topographic surveys processed with structure-from-motion: ground control quality, quantity and bundle adjustment, Geomorphology, 280, 51–66, 2017.
Javernick, L., Brasington, J., and Caruso, B.: Modeling the topography of shallow braided rivers using Structure-from-Motion photogrammetry, Geomorphology, 213, 166–182, 2014.
Jestin, F., Huchon, P., and Gaulier, J. M.: The Somalia plate and the East-African Rift system – Present-day kinematics, Geophys. J. Int., 116, 637–654, https://doi.org/10.1111/j.1365-246X.1994.tb03286.x, 1994.
Keir, D., Ebinger, C. J., Stuart, G. W., Daly, E., and Ayele, A.: Strain accommodation by magmatism and faulting as rifting proceeds to breakup: Seismicity of the northern Ethiopian rift, J. Geophys. Res.-Sol. Ea., 111, B05314, https://doi.org/10.1029/2005JB003748, 2006.
Kozhurin, A., Acocella, V., Kyle, P. R., Lagmay, F. M., Melekestsev, I. V., Ponomareva, V., Rust, D., Tibaldi, A., Tunesi, A., Corazzato, C., Rovida, A., Sakharovh, A., Tengonciang, A., and Uyd, H.: Trenching studies of active faults in Kamchatka, eastern Russia: Palaeoseismic, tectonic and hazard implications, Tectonophysics, 417, 285–304, 2006.
Lanzafame, G., Neri, M., Coltelli, M., Lodato, L., and Rust, D.: North-South compression in the Nit. Etna region (Sicily): spatial and temporal distribution, Acta Vulcanologica, 9, 121–134, 1997.
Lee, J. C. and Angelier, J.: Paleostress trajectory maps based on the results of local determinations: the “Lissage” program, Comput. Geosci., 20, 161–191, 1994.
Lizarazo, I., Angulo, V., and Rodríguez, J.: Automatic mapping of land surface elevation changes from UAV-based imagery, Int. J. Remote Sens., 38, 2603–2622, 2017.
Lomax, A., Virieux, J., Volant, P., and Thierry-Berge, C.: Probabilistic earthquake location in 3D and layered models, in: Advances in Seismic Event Location, edited by: Thurber, C. H. and Rabinowitz, N., Kluwer Academic Publishers, Dordrecht/Boston/London, 101–134, 2000.
Lyakhovsky, V., Segev, A., Schattner, U., and Weinberger, R.: Deformation and seismicity associated with continental rift zones propagating toward continental margins, Geochem. Geophy. Geosy., 13, Q01012, https://doi.org/10.1029/2011GC003927, 2012.
Maestro, A., Somoza, L., Rey, J., Martínez-Frías, J., and López-Martínez, J.: Active tectonics, fault patterns, and stress field of Deception Island: a response to oblique convergence between the Pacific and Antarctic plates, J. S. Am. Earth Sci., 23, 256–268, 2007.
Mattia, M., Bruno, V., Caltabiano, T., Cannata, A., Cannavò, F., D'Alessandro, W., di Grazia, G., Federico, C., Giammanco, S., la Spina, A., Liuzzo, M., Longo, M., Monaco, C., Patanè, D., and Salerno, G.: A comprehensive interpretative model of slow slip events on Mt. Etna's eastern flank, Geochem. Geophy. Geosy., 16, 635–658, https://doi.org/10.1002/2014GC005585, 2015.
Mostaccio, A., Tuvè, T., Patanè, D., Barberi, G., and Zuccarello, L.: Improving Seismic Surveillance at Mt. Etna Volcano by Probabilistic Earthquake Location in a 3D Model, B. Seismol. Soc. Am., 103, 2447–2459, https://doi.org/10.1785/0120110202, 2013.
Müller, D., Walter, T. R., Schöpa, A., Witt, T., Steinke, B., Gudmundsson, M. T., and Dürig, T.: High-resolution digital elevation modeling from TLS and UAV campaign reveals structural complexity at the 2014/2015 Holuhraun eruption site, Iceland, Front. Earth Sci., 5, 59 pp., https://doi.org/10.3389/feart.2017.00059, 2017.
Munoz-Martín, A., Cloetingh, S. A. P. L., De Vicente, G., and Andeweg, B.: Finite-element modelling of Tertiary paleostress fields in the eastern part of the Tajo Basin (central Spain), Tectonophysics, 300, 47–62, 1998.
Neri, M., Acocella, V., and Behncke, B.: The role of the Pernicana Fault System in the spreading of Mount Etna (Italy) during the 2002–2003 eruption, Bull. Volcanol., 66, 417–430, https://doi.org/10.1007/s00445-003-0322-x, 2004.
Neri, M., Acocella, V., Behncke, B., Maiolino, V., Ursino, A., and Velardita, R.: Contrasting triggering mechanisms of the 2001 and 2002–2003 eruptions of Mount Etna (Italy), J. Volcanol. Geoth. Res., 144, 235–255, https://doi.org/10.1016/j.jvolgeores.2004.11.025, 2005.
Neri, M., Acocella, V., Behncke, B., Giammanco, S., Mazzarini, F., and Rust D.: Structural analysis of the eruptive fissures at Mount Etna (Italy), Ann. Geophys., 54, 464–479, https://doi.org/10.4401/ag-5332, 2011.
Patanè, D., Cocina, O., Falsaperla, S., Privitera, E., and Spampinato, S.: Mt. Etna volcano: A seismological framework, in: Mt. Etna Volcano Laboratory, edited by: Bonaccorso, A., Calvari, S., Coltelli, M., Del Negro, C., Falsaperla, S., American Geophysical Monograph 143, 147–165, AGU, Washington, D. C., https://doi.org/10.1029/143GM10, 2004.
Ruch, J., Acocella, V., Storti, F., Neri, M., Pepe, S., Solaro, G., and Sansosti, E.: Detachment depth of an unstable volcano revealed by rollover deformation: an integrated approach at Mt. Etna, Geophys. Res. Lett., 37, L16304, https://doi.org/10.1029/2010GL044131, 2010.
Ruch, J., Pepe, S., Casu, F., Acocella, V., Neri, M., Solaro, G., and Sansosti, E.: How do rift zones relate to volcano flank instability? Evidence from collapsing rifts at Etna, Geophys. Res. Lett., 39, L20311, https://doi.org/10.1029/2012GL053683, 2012.
Ruch, J., Pepe, S., Casu, F., Solaro, G., Pepe, A., Acocella, V., Neri, M., and Sansosti, E.: Seismo-tectonic behavior of the Pernicana Fault System (Mt Etna): a gauge for volcano flank instability?, J. Geophys. Res.-Sol. Ea., 118, 4398–4409, https://doi.org/10.1002/jgrb.50281, 2013.
Salvador, A.: International Stratigraphic Guide, edited by: Salvador, GSA, A., Boulder, USA, 1–214, 1994.
Siniscalchi, A., Tripaldi, S., Neri, M., Balasco, M., Romano, G., Ruch, J., and Schiavone D.: Flank instability structure of Mt Etna inferred by a magnetotelluric survey, J. Geophys. Res., 117, B03216, https://doi.org/10.1029/2011JB008657, 2012.
Smith, M. W., Carrivick, J. L., and Quincey, D. J.: Structure from motion photogrammetry in physical geography, Prog. Phys. Geogr., 40, 247–275, 2016.
Solaro, G., Acocella, V., Pepe, S., Ruch, J., Neri, M., and Sansosti E.: Anatomy of an unstable volcano through InSAR data: multiple processes affecting flank instability at Mt. Etna in 1994–2008, J. Geophys. Res., 115, B10405, https://doi.org/10.1029/2009JB000820, 2010.
Tibaldi, A.: Morphology of pyroclastic cones and tectonics, J. Geophys. Res.-Sol. Ea., 100, 24521–24535, 1995.
Tibaldi, A. and Bonali, F. L.: Intra-arc and back-arc volcano-tectonics: Magma pathways at Holocene Alaska-Aleutian volcanoes, Earth-Sci. Rev., 167, 1–26, 2017.
Tibaldi, A. and Ferrari, L.: Latest Pleistocene-Holocene tectonics of the Ecuadorian Andes, Tectonophysics, 205, 109–125, 1992.
Tibaldi, A. and Groppelli, G.: Volcano-tectonic activity along structures of the unstable NE flank of Mt. Etna (Italy) and their possible origin, J. Volcanol. Geoth. Res., 115, 277–302, 2002.
Tibaldi, A., Bonali, F. L., Mariotto, F. P., Russo, E., and Tenti, L. R.: The development of divergent margins: Insights from the North Volcanic Zone, Iceland, Earth Planet. Sc. Lett., 509, 1–8, 2019.
Tibaldi, A., Bonali, F. L., Vitello, F., Delage, E., Nomikou, P., Antoniou, V., Becciani U., Van Wyk de Vries B., Krokos M., and Whitworth, M.: Real world-based immersive Virtual Reality for research, teaching and communication in volcanology, B. Volcanol., 82, 38, https://doi.org/10.1007/s00445-020-01376-6, 2020.
Trippanera, D., Ruch, J., Acocella, V., and Rivalta, E.: Experiments of dike-induced deformation: insights on the long-term evolution of divergent plate boundaries, J. Geophys. Res.-Sol. Ea., 120, 6913–6942, 2015.
Trippanera, D., Ruch, J., Passone, L., and Jónsson, S.: Structural mapping of dike-induced faulting in Harrat Lunayyir (Saudi Arabia) by using high resolution drone imagery, Front. Earth Sci., 7, 168 pp., https://doi.org/10.3389/feart.2019.00168, 2019.
Turner, D., Lucieer, A., and Watson, C.: An automated technique for generating georectified mosaics from ultra-high resolution unmanned aerial vehicle (UAV) imagery, based on structure from motion (SfM) Point clouds, Remote Sens., 4, 1392–1410, 2012.
Urulaub, M., Petersen, F., Gross, F., Bonforte, A., Puglisi, G., Guglielmino, F., Krastel, S., Lange, D., and Kopp, H.: Gravitational collapse of Mount Etna's southeastern flank, Sci. Adv., 4, eaat9700, https://doi.org/10.1126/sciadv.aat9700, 2018.
Verhoeven, G.: Taking computer vision aloft–archaeological three-dimensional reconstructions from aerial photographs with photoscan, Archaeol. Prospect., 18, 67–73, 2011.
Villani, F., Pucci, S., Azzaro, R., Civico, R., Cinti, F. R., Pizzimenti, L., Tarabusi, G., Branca, S., Brunori, C. A., Caciagli, M., Cantarero, M., Cucci, L., D'Amico, S., De Beni, E., De Martini, P. M., Mariucci, M. T., Messina, A., Montone, P., Nappi, R., Nave, R., Pantosti, D., Ricci, T., Sapia, V., Smedile, A., Vallone, R., and Venuti, A.: Surface ruptures database related to the 26 December 2018, MW 4.9 Mt. Etna earthquake, southern Italy, Sci. Data, 7, 1–9, 2020.
Vollgger, S. A. and Cruden, A. R.: Mapping folds and fractures in basement and cover rocks using UAV photogrammetry, Cape Liptrap and Cape Paterson, Victoria, Australia, J. Struct. Geol., 85, 168–187, 2016.
Walter, T. R., Acocella, V., Neri, M., and Amelung, F.: Feedback processes between magmatism and E-flank movement at Mt. Etna (Italy) during the 2002–2003 eruption, J. Geophys. Res., 110, B10205, https://doi.org/10.1029/2005JB003688, 2005.
Weismüller, C., Urai, J. L., Kettermann, M., von Hagke, C., and Reicherter, K.: Structure of massively dilatant faults in Iceland: lessons learned from high-resolution unmanned aerial vehicle data, Solid Earth, 10, 1757–1784, https://doi.org/10.5194/se-10-1757-2019, 2019.
Westoby, M. J., Brasington, J., Glasser, N. F., Hambrey, M. J., and Reynolds, J. M.: “Structure-from-Motion” photogrammetry: a low-cost, effective tool for geoscience applications, Geomorphology, 179, 300–314, 2012.