the Creative Commons Attribution 4.0 License.
the Creative Commons Attribution 4.0 License.
 | 19 Apr 2023
Water release and homogenization by dynamic recrystallization of quartz
Takamoto Okudaira
Yukiko Ohtomo
To evaluate changes in water distribution generated by dynamic recrystallization of quartz, we performed infrared (IR) spectroscopy mapping of quartz in deformed granite from the Wariyama uplift zone in NE Japan. We analyzed three granite samples with different degrees of deformation: almost undeformed, weakly deformed, and strongly deformed. Dynamically recrystallized quartz grains with a grain size of ∼10 µm are found in these three samples, but the percentages of recrystallized grains and the recrystallization processes are different. Quartz in the almost-undeformed sample shows wavy grain boundaries, with a few bulged quartz grains. In the weakly deformed sample, bulging of quartz, which consumed adjacent host quartz grains, forms regions of a few hundred micrometers. In the strongly deformed sample, almost all quartz grains are recrystallized by subgrain rotation. IR spectra of quartz in the three samples commonly show a broad water band owing to H2O fluid at 2800–3750 cm−1, with no structural OH bands. Water contents in host quartz grains in the almost-undeformed sample are in the range of 40–1750 wt ppm, with a mean of 500±280 wt ppm H2O. On the other hand, water contents in regions of recrystallized grains, regardless of the recrystallization processes involved, are in the range of 100–510 wt ppm, with a mean of 220±70 wt ppm; these values are low and homogeneous compared with the contents in host quartz grains. These low water contents in recrystallized regions also contrast with those of up to 1540 wt ppm in adjacent host grains in the weakly deformed sample. Water contents in regions of subgrains are intermediate between those in host and recrystallized grains. These results for water distribution in quartz imply that water was released by dynamic recrystallization.
- Article
(18474 KB) - Full-text XML
- BibTeX
- EndNote


Quartz is a major constituent of Earth's crust, and its deformation can control crustal rheology (e.g., Rutter and Brodie, 1988; Kohlstedt et al., 1995; Bürgmann and Dresen, 2008; Fossen and Cavalcante, 2017). For plastic deformation of quartz, water occurring as an impurity in this mineral can reduce its strength by up to several orders of magnitude, as has been confirmed by numerous experimental investigations (e.g., Griggs and Blacic, 1965; Griggs, 1967; Blacic, 1975; Parrish et al., 1976; Jaoul et al., 1984; Kronenberg and Tullis, 1984; Koch et al., 1989; Post et al., 1996; Chernak et al., 2009; Holyoke and Kronenberg, 2013). In addition, increasing water fugacity reduces the plastic strength of quartz (Post et al., 1996; Chernak et al., 2009; Holyoke and Kronenberg, 2013; Fukuda and Shimizu, 2017; Fukuda et al., 2018; Tokle et al., 2019; Lu and Jiang, 2019; Lusk et al., 2021; Nègre et al., 2021). As a species of water, molecular H2O is trapped as fluid inclusions and at grain boundaries, and the crystal structure of quartz incorporates OH groups that are coupled with impurity cations in quartz (Kats, 1962; Aines and Rossman, 1984; Kronenberg, 1994; Stenina, 2004; Stalder, 2021; also see the review by Stünitz et al., 2017, for water species in quartz and their effects on plastic deformation).
Water in naturally deformed quartz has been measured by infrared (IR) spectroscopy focusing on contents and species (H2O or OH; Kronenberg and Wolf, 1990; Kronenberg et al., 1990; Kronenberg, 1994; Nakashima et al., 1995; Niimi et al., 1999; Muto et al., 2004, 2005; O'Kane et al., 2007; Gleason and DeSisto, 2008; Menegon et al., 2011; Finch et al., 2016; Kilian et al., 2016; Kronenberg et al., 2017, 2020; Fukuda and Shimizu, 2019). However, the effects of water content and species in quartz on the strength of quartz are not fully understood, especially regarding the quantitative relationships between water content, species, and flow laws of quartz. These relationships in olivine have been partly evaluated by experimental means (Jung and Karato, 2001; Hirth and Kohlstedt, 2003; Katayama et al., 2004; Jung et al., 2006; Masuti et al., 2019) and have been linked to the deformation of natural olivine and to mantle dynamics (Karato et al., 2008; Katayama et al., 2011; Skemer et al., 2013; Jung, 2017).
IR spectroscopic measurements of water in quartz aggregates have revealed that water content increases with decreasing grain size (Kronenberg and Wolf, 1990; Kronenberg et al., 1990; Kronenberg, 1994; Nakashima et al., 1995; Muto et al., 2004, 2005; Fukuda and Shimizu, 2019), which has been explained in terms of volume increases of grain boundary regions being able to host more water than grain interiors (Ito and Nakashima, 2002). It is also known that grain size can be reduced by dynamic recrystallization (reviewed for quartz in, e.g., Stipp et al., 2002; Tullis, 2002; Passchier and Trouw, 2005). Recent studies of naturally deformed quartz by Finch et al. (2016) and Kronenberg et al. (2020) have shown that water content decreases as grain size decreases by means of dynamic recrystallization, on which basis those authors proposed that water is released by dynamic recrystallization. The release of water by dynamic recrystallization has also been shown by the experiments of Palazzin et al. (2018). Those various studies performed point IR analyses in regions composed of dynamically recrystallized quartz grains. However, there is still only limited information on the water contents, species, and distributions within the development of the microstructure, meaning that more data are required for water distributions in naturally deformed quartz.
In this study, we performed IR mapping analyses of undeformed quartz grains and dynamically recrystallized grains. We use the results as a basis for discussion of variations in water content and the behavior of water release arising from microstructural change due to dynamic recrystallization.
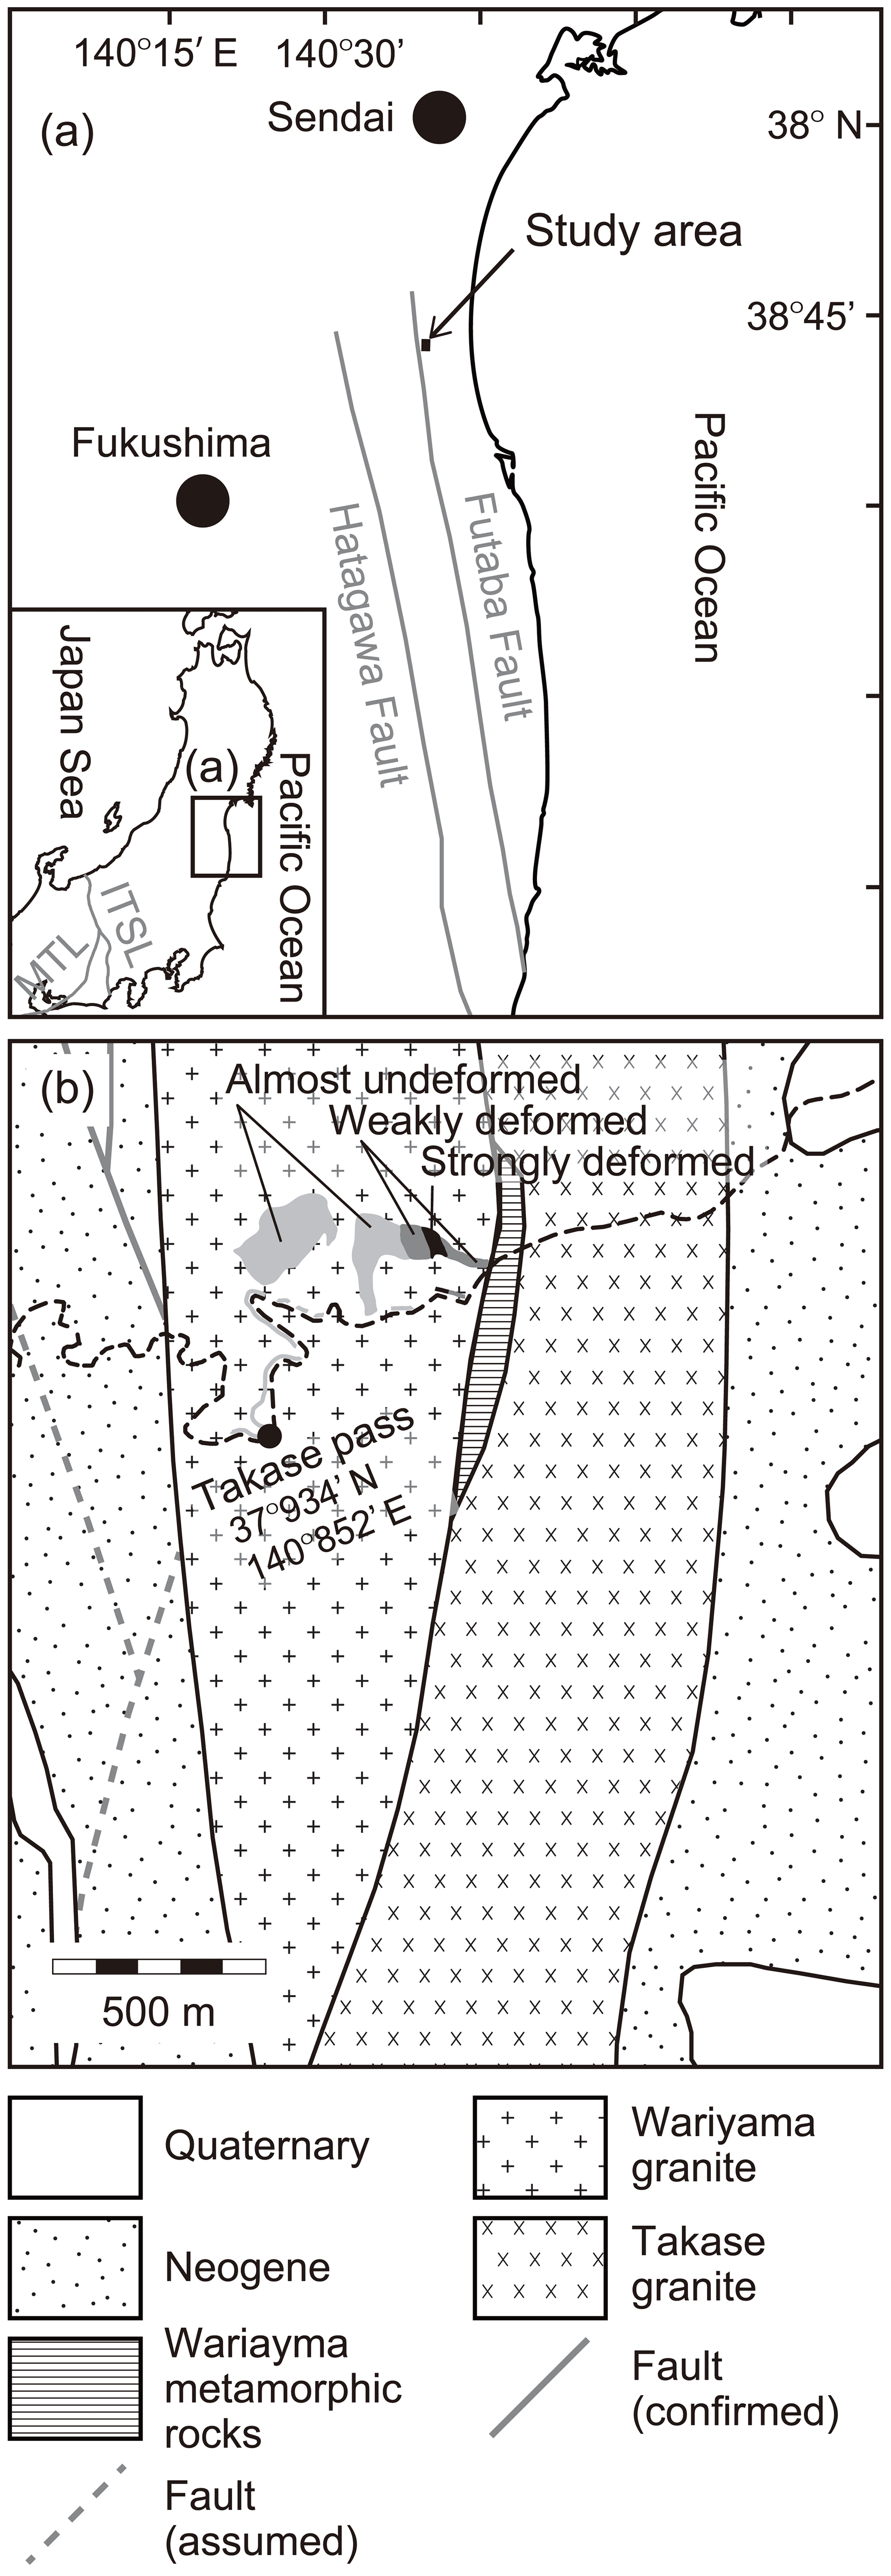
Figure 1Study area location map (a) and geological map (b) of northeastern Japan after Oide and Fujita (1975), Fujita et al. (1988), and Tsuchiya et al. (2014). The inset in (a) shows the location of (a) in Japan and major tectonic lines (the Itoigawa–Shizuoka Tectonic Line (ISTL) and the Median Tectonic Line (MTL)). In (b), the dashed black line represents a path including Takase Pass. The solid black lines represent geological boundaries. The Wariyama granite was categorized into three types based on the degree of deformation, as observed in hand specimens (Fig. 2) and according to microstructures observed under a polarizing microscope (Figs. 3 and 4). The three types are referred to as almost undeformed, weakly deformed, and strongly deformed, with distributions as shown in the geological map.
Granite samples with differing degrees of deformation were obtained from the Wariyama uplift zone in NE Japan, which is located on the eastern side of the Futaba fault (Fig. 1). The geological setting of this zone has been reported by Oide and Fujita (1975) and Fujita et al. (1988). The Wariyama uplift zone shows a N–S to NNE–SSW trend and includes many vertical faults (Fujita et al., 1988). Tsuchiya et al. (2014) reported a U–Pb zircon age of ca. 300 Ma for the Wariyama granite and documented an age of ca. 120 Ma for the Takase granite to the eastern side of the Wariyama granite. In the uplift zone, the deformed mylonitic Wariyama granite is found on the eastern side of the Takase pass as a local shear zone (Tsuchiya et al., 2013). The western and eastern edges of the Wariyama uplift zone are bounded by the NNW–SSE-trending Futaba fault zone, which is a sinistral strike-slip fault that formed during the mid-Cretaceous (Fujita et al., 1988; Otsuki, 1992). The foliations of the mylonitic rocks strike N–S to NNE–SSW, with a dip to the east and the stretching lineations gently plunging to the north or south. Thus, the deformation of the Wariyama granite may be caused by the mid-Cretaceous movement of the Futaba fault zone. We divided the deformed Wariyama granite samples into three types – almost undeformed, weakly deformed, and strongly deformed – on the basis of the development of foliations of mylonitic rocks as observed in hand specimen (Fig. 2) and according to microstructures observed under a polarizing microscope (Figs. 3 and 4).
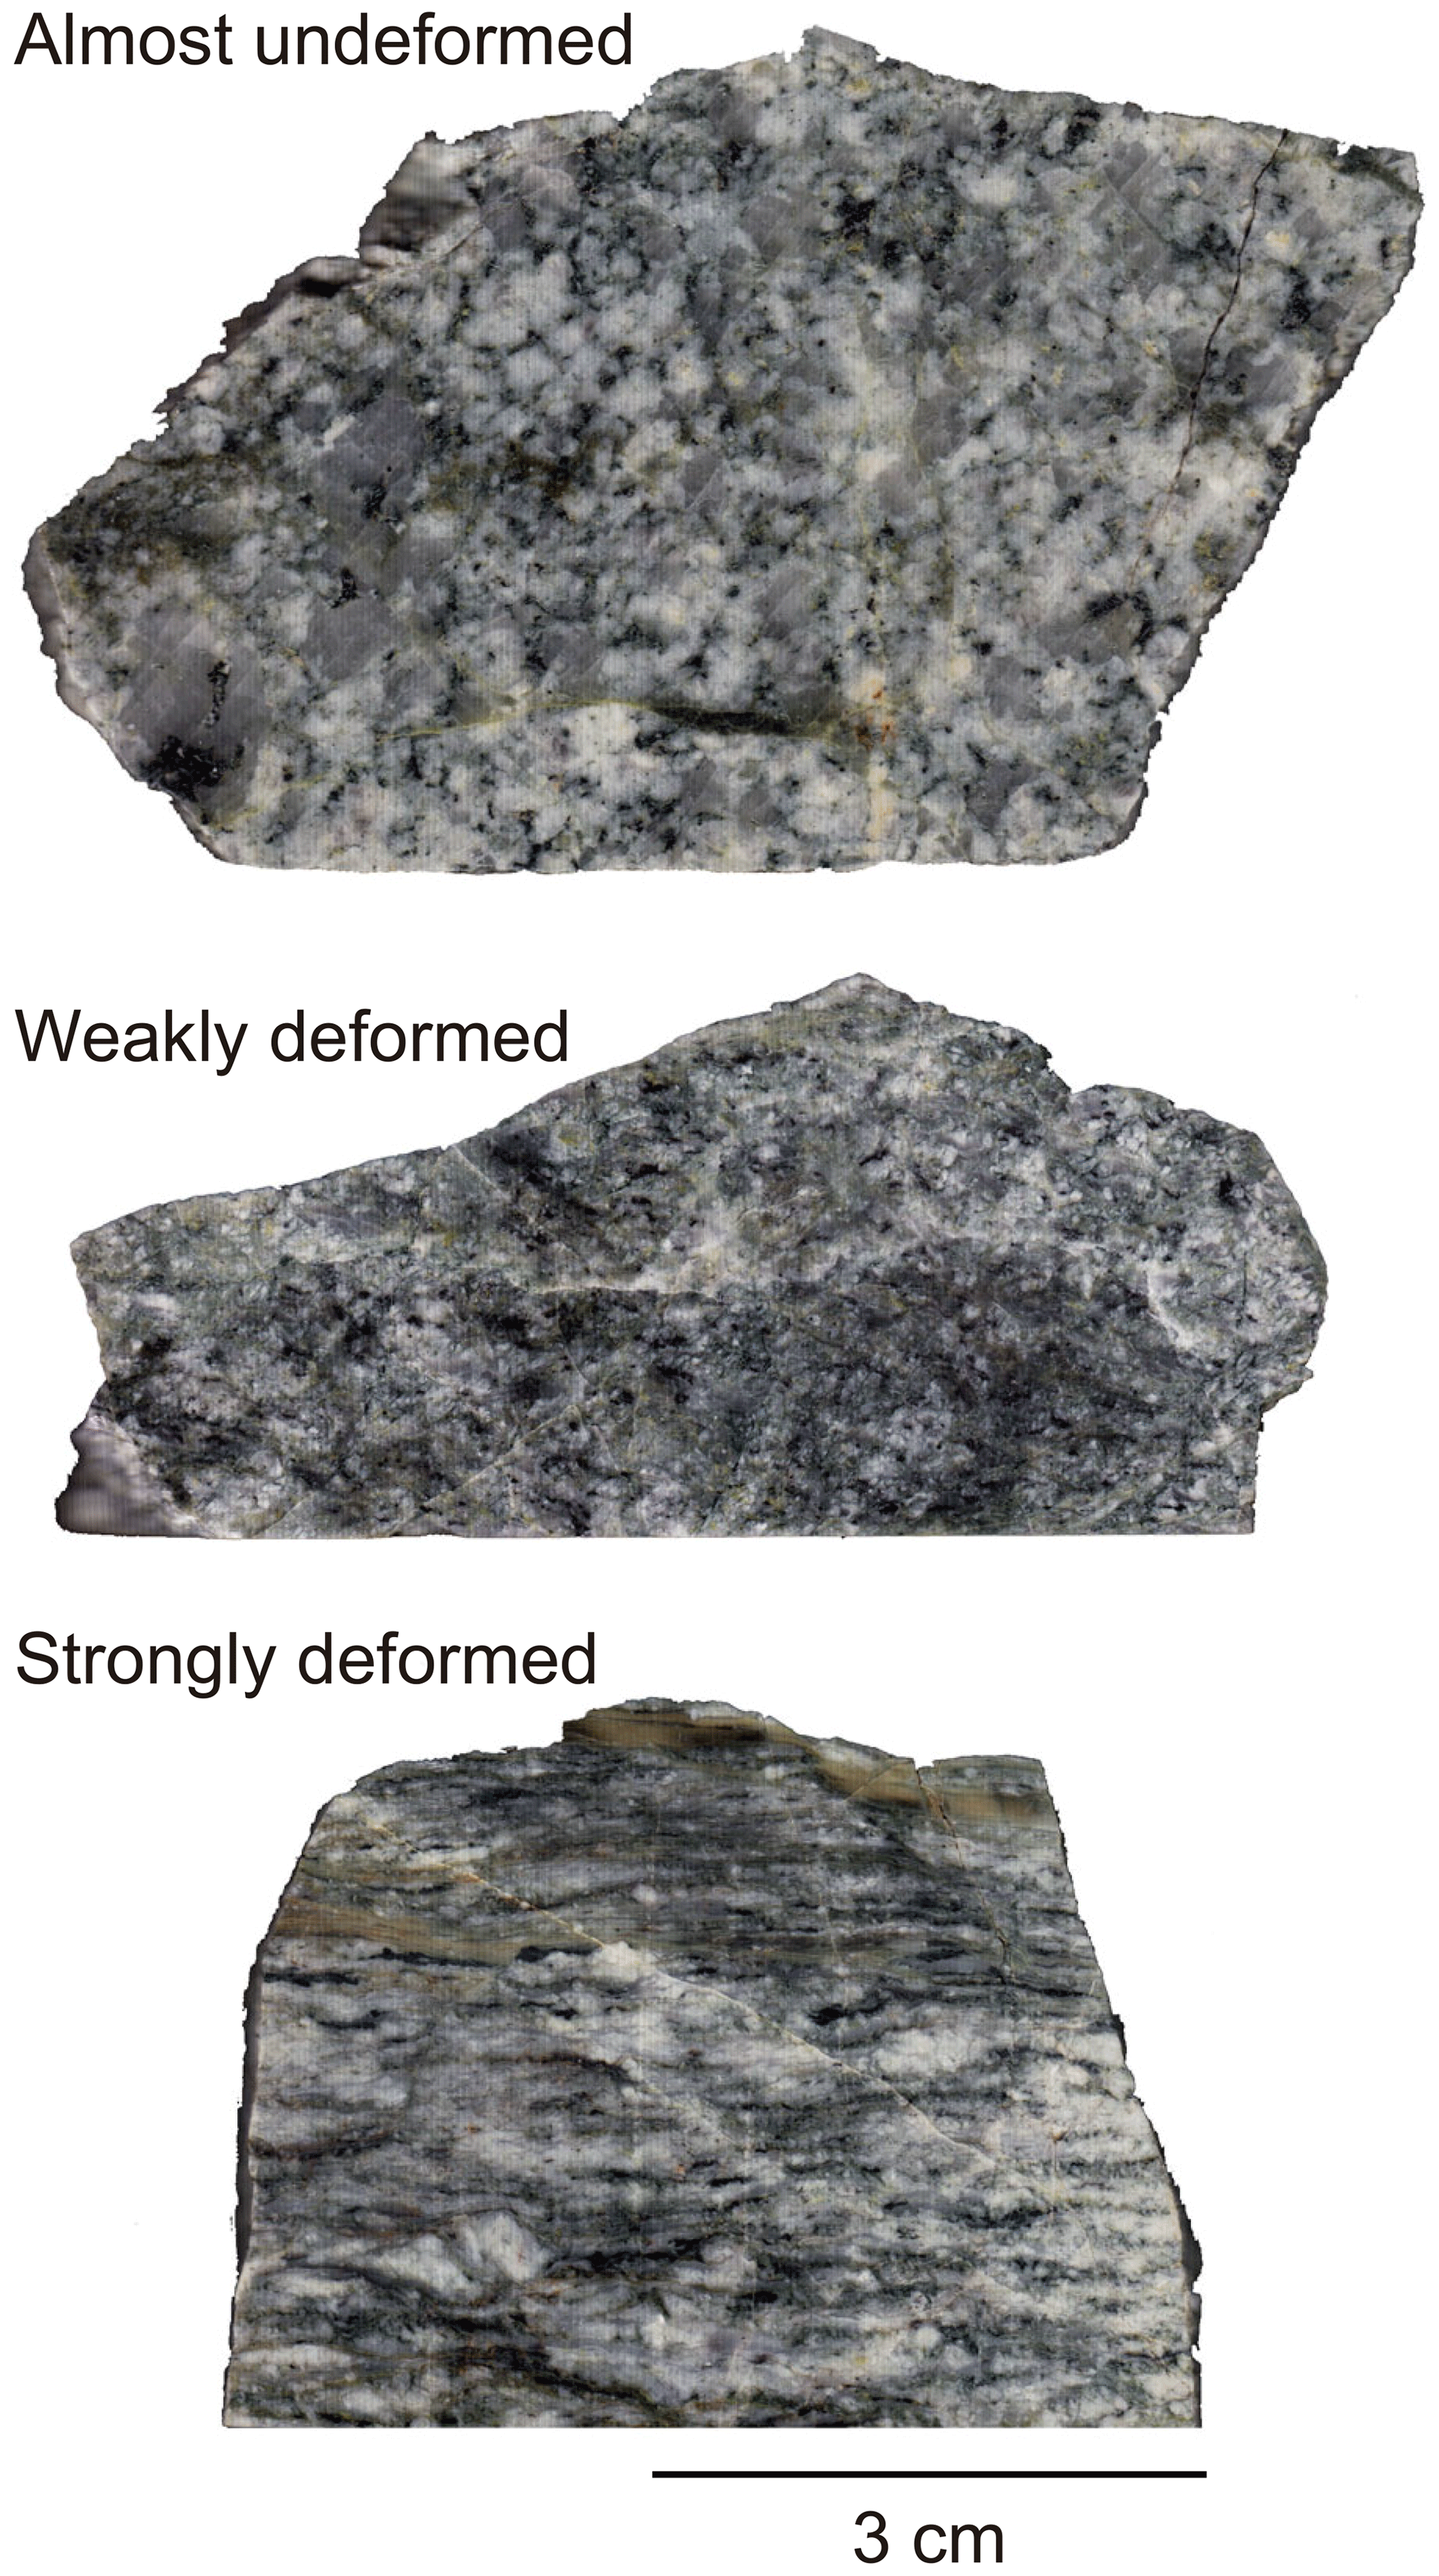
Figure 2Scanned images of the three studied samples of the Wariyama granite. The two deformed samples were cut parallel to the lineation and perpendicular to the foliation.
In the almost-undeformed and weakly deformed samples, mafic igneous minerals are partly replaced by epidote and chlorite (Fig. 3a–d). Although some or all chlorite may have replaced amphibole during late-stage hydrothermal alteration in the three types of sample (Fig. 3a, c, and e), chlorite is found in shear bands in the strongly deformed sample (Fig. 3e), suggesting that chlorite may have been stable during mylonitization. Grain interiors of plagioclase are commonly altered to become epidote, muscovite, and clay minerals in the three types of sample. In the weakly and strongly deformed samples (Fig. 3c–f), brittle deformation of plagioclase dominates, and plagioclase and amphibole form porphyroclasts, but there is no development of microstructures that is indicative of dynamic recrystallization or pressure shadows at their margins. In the strongly deformed samples, amphibole (mainly hornblende) and epidote grains may have been stable during mylonitization because shear bands that developed in the samples are composed of amphibole and epidote grains (Fig. 3e and f). According to Fujita et al. (1988), some metasedimentary rocks affected by the thermal effects of granitoid intrusions in the Wariyama area contain metamorphic andalusite, implying that these granitoids were emplaced into upper-crustal levels. On the basis of these observations, mylonitization, at least of the strongly deformed sample, is inferred to have occurred under epidote–amphibolite-facies conditions and within or near the andalusite stability field (i.e., ∼500 ∘C; Spear, 1993).

Figure 3Optical photomicrographs showing microstructures of the Wariyama granite under plane-polarized (a, c, e) and cross-polarized (b, d, f) light. (a, b) Almost-undeformed sample. (c, d) Weakly deformed sample. (e, f) Strongly deformed sample. Microstructures of quartz in the three samples are shown in Fig. 4.
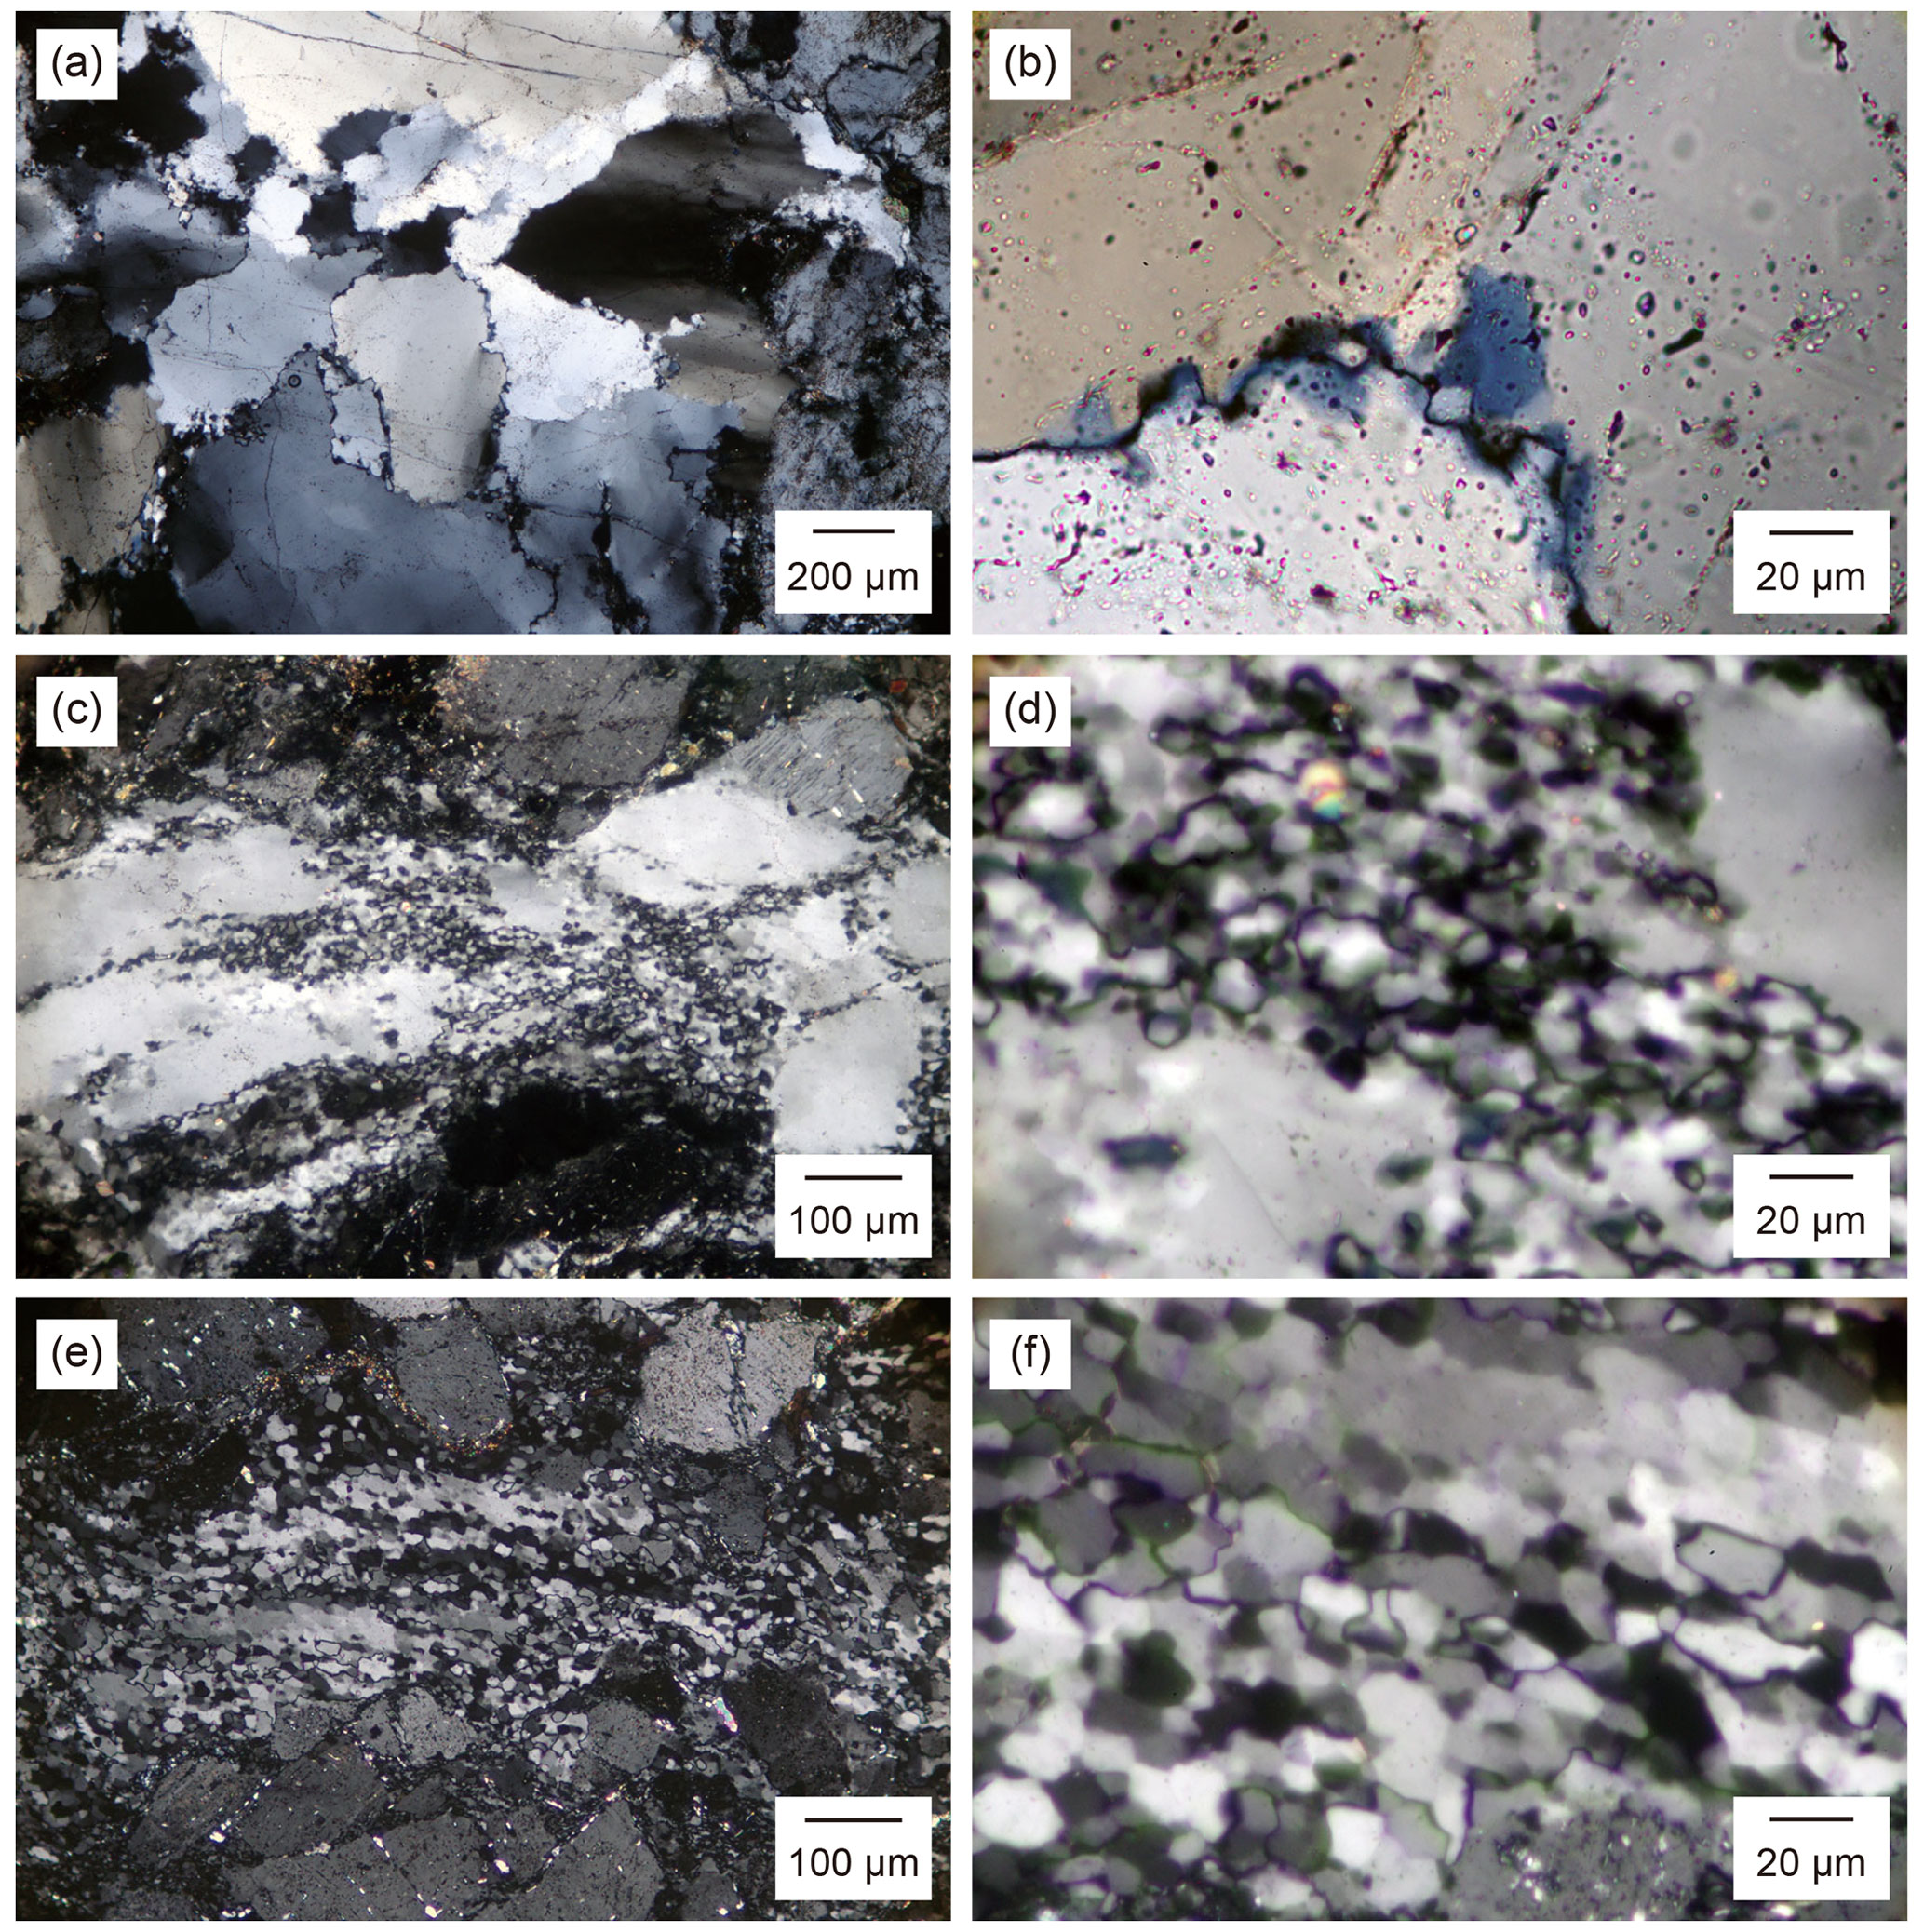
Figure 4Optical photomicrographs taken under cross-polarized light showing quartz microstructures in the Wariyama granite. (a, b) Almost-undeformed sample. Quartz grain boundaries are wavy, and a few bulged grains are observed. (c, d) Weakly deformed sample cut parallel to the lineation and perpendicular to the foliation. Bulging of quartz, which consumed adjacent host quartz grains, forms regions of a few hundred micrometers, and host grains are elongated. (e, f) Strongly deformed sample cut parallel to the lineation and perpendicular to the foliation. Almost all quartz grains are recrystallized by subgrain rotation, and subgrains remain in some regions, as in the upper part of (f).
In the microstructures of quartz, original quartz grains of up to 2 mm in size are observed (Fig. 4a). However, quartz grain boundaries are wavy, and a few bulged grains of ∼10 µm occur (Fig. 4b). Therefore, we term this sample as almost undeformed. In original quartz grains, fluid inclusions are observed and are heterogeneously distributed (Fig. 4b). In the weakly deformed sample cut parallel to the lineation and perpendicular to the foliation, larger regions of a few hundred micrometers are composed of bulged quartz grains that have developed from adjacent elongated host quartz grains (Fig. 4c and d). In comparison with the almost-undeformed sample, there are fewer large fluid inclusions. Thus, the redistribution of fluid inclusions by deformation is inferred, as reported previously in natural samples (Kerrich, 1976; Wilkins and Barkas, 1978; Hollister, 1990; Cordier et al., 1994; Vityk et al., 2000; Faleiros et al., 2010). According to those previous studies, fluid inclusions may undergo leakage, or smaller inclusions or structural OH may be formed, as confirmed experimentally by Stünitz et al. (2017) and Palazzin et al. (2018). In this study, we examine the actual water distribution by using IR spectroscopic measurements. The strongly deformed sample shows well-developed foliations (Fig. 2) and almost fully recrystallized quartz microstructures (Fig. 4e and f). Recrystallized quartz grains measuring ∼10 µm in size and formed by subgrain rotation constitute the major part of the quartz matrix (Fig. 4e). In some regions of quartz, crystallographic orientations continuously change, as in undulose extinction, and these regions are composed of subgrains (Fig. 4f). Differences in the recrystallization mechanisms of quartz in the three types of sample may be due to differences in temperature, strain rate, and/or stress.
Grain sizes of recrystallized grains were determined by image analysis of traced grains. More than 300 grains of recrystallized grains in optical photomicrographs (e.g., Fig. 4b, d, and f) were traced. The area of each grain was determined by image analysis using ImageJ software, and grain size was expressed as the diameter of a circle whose area is equivalent to that of the grain. The mean grain sizes of recrystallized quartz within ±1 standard deviation of the almost-undeformed, weakly deformed, and strongly deformed samples are 10.5±3.7, 6.7±1.9, and 9.6±3.6 µm, respectively (Fig. 5). The piezometers of Stipp and Tullis (2003) and Holyoke and Kronenberg (2010), developed mainly for bulging recrystallization, were applied to the mean grain sizes of the almost-undeformed and weakly deformed samples, and they yield values of a few tens of megapascals. Similarly, values of a few hundred megapascals are obtained for the mean grain size of the strongly deformed sample using the piezometers of these two papers for subgrain rotation (and for grain boundary migration, but this type of recrystallization is not evident in our samples). Values of a few hundred megapascals are also obtained from all of the samples for a grain size of ∼10 µm, for which the reported piezometers do not distinguish the mechanisms of dynamic recrystallization (Twiss, 1977; Shimizu, 2008, 2012; Cross et al., 2017).
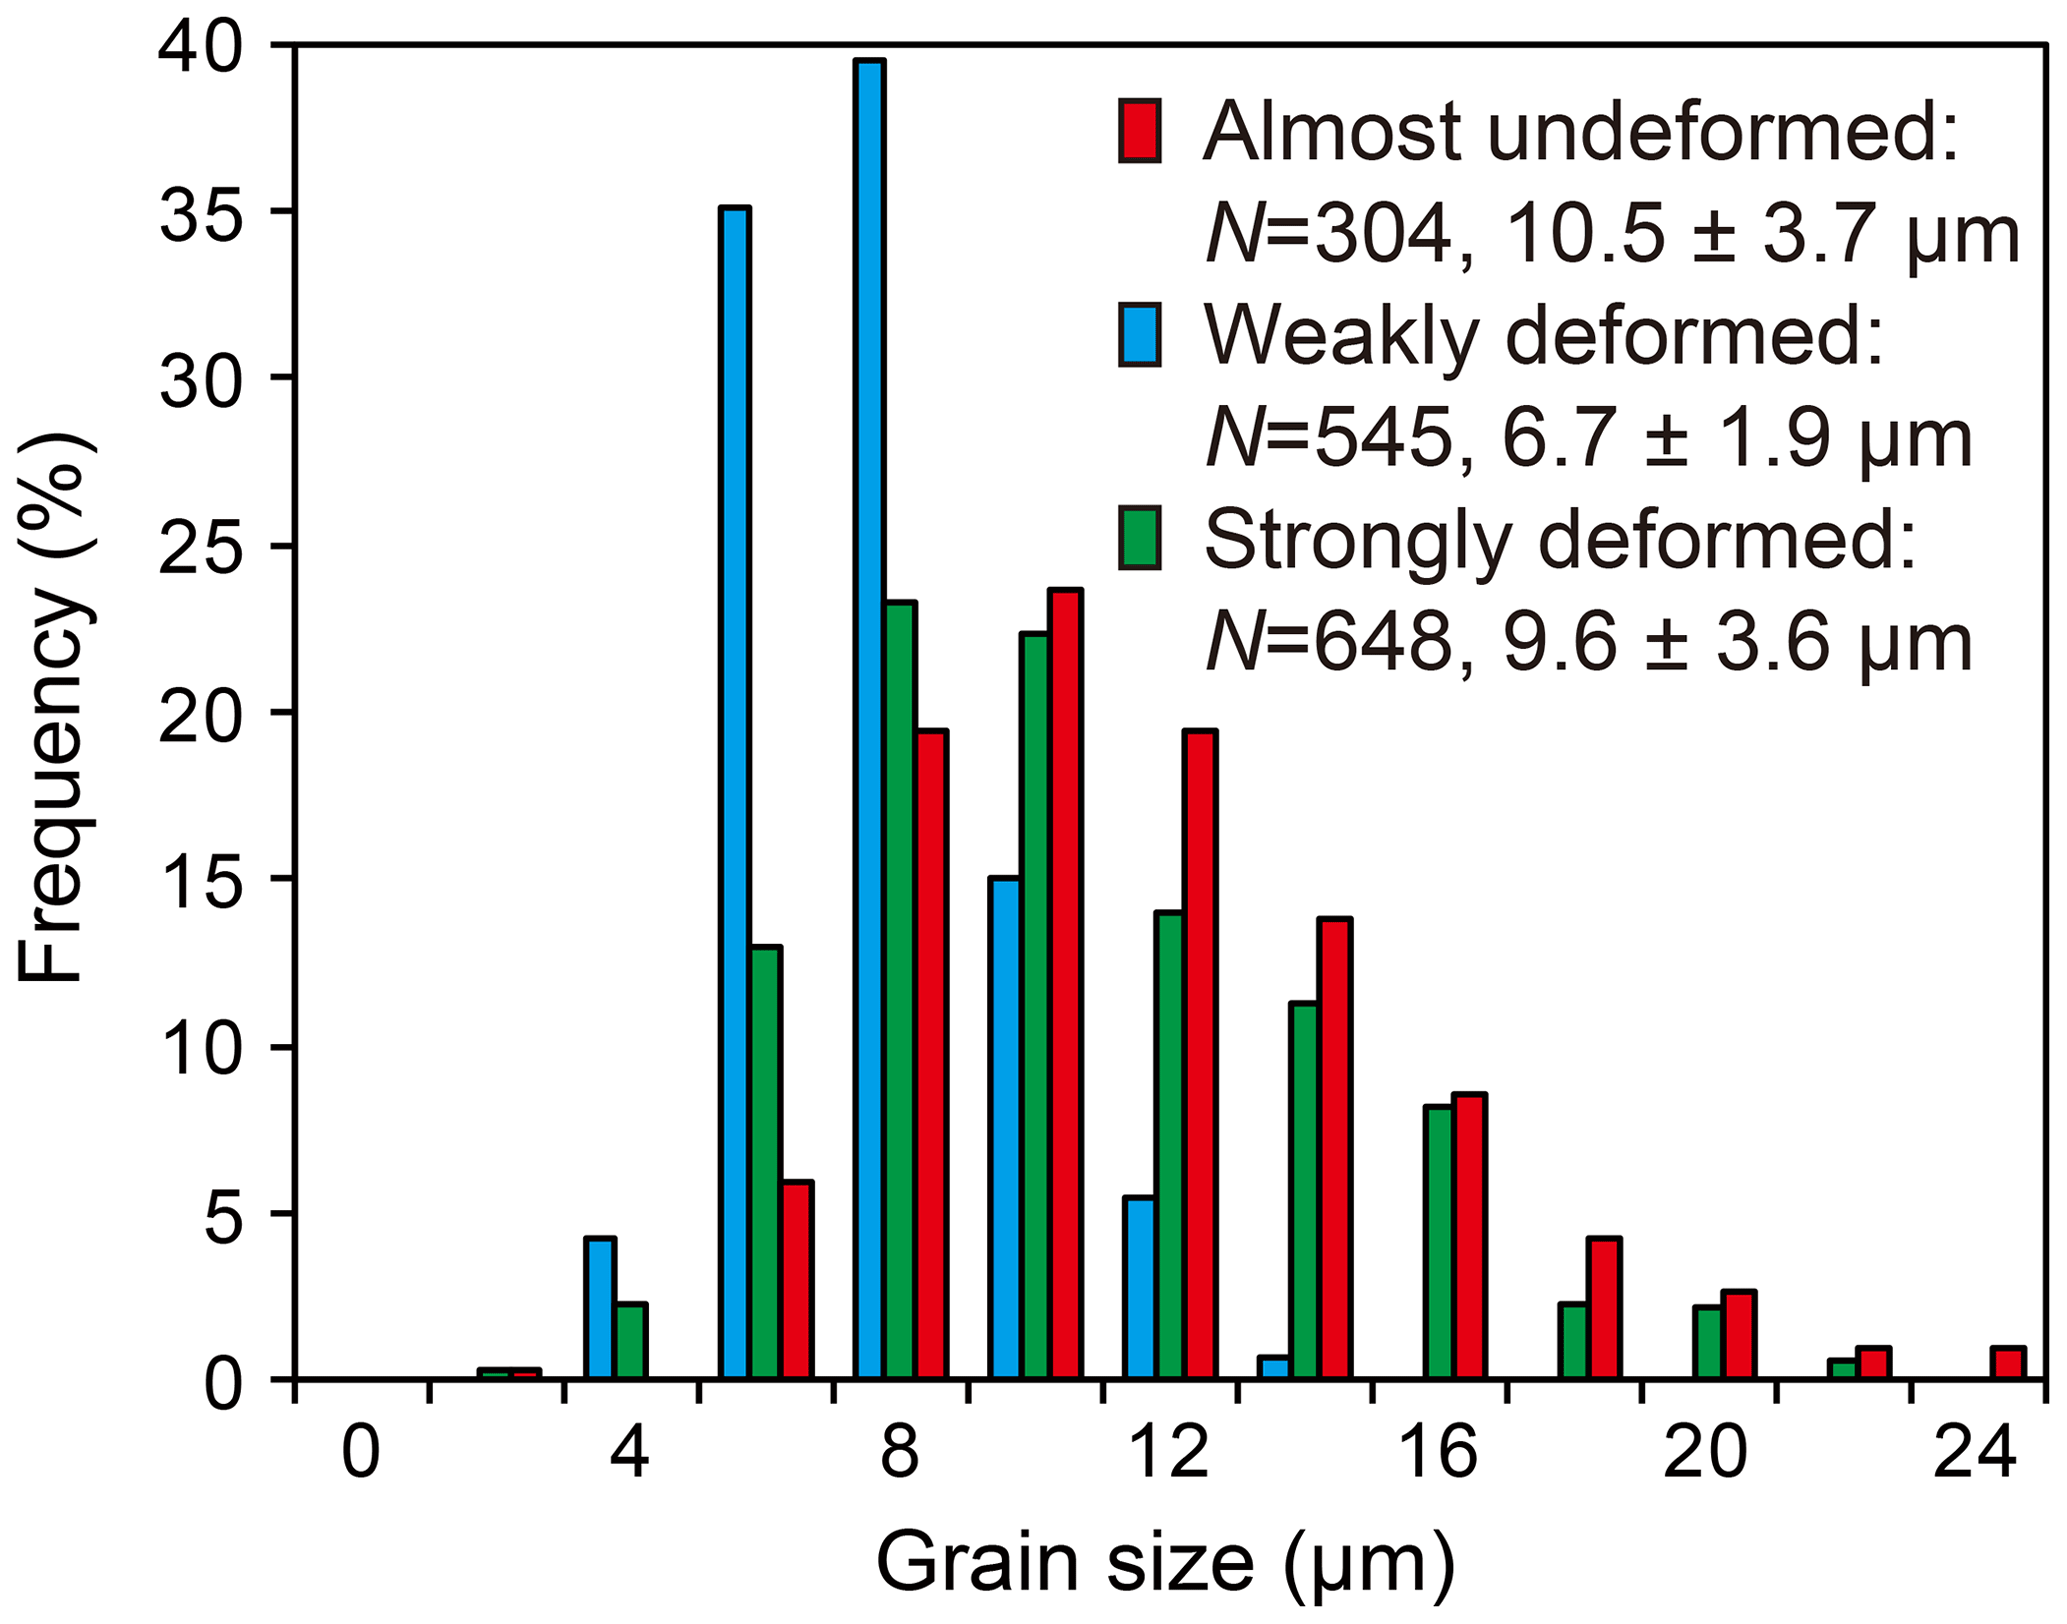
Figure 5Grain size distributions of recrystallized quartz grains of the studied samples, with three different degrees of deformation. N is the number of grains measured. Mean grain sizes and standard deviations are given.
Quartz grains in the almost-undeformed, weakly deformed, and strongly deformed samples were measured by IR mapping to evaluate water contents and species. Sample thin sections with an approximate thickness of 100 µm were prepared. The process for making thin sections followed that for making regular thin sections with a thickness of ∼30 µm for observation using a polarizing microscope, but there are a few exceptions. One side of the sample was polished down to #6000 aluminum oxide powder. and glycol phthalate resin was used to attach the polished sample surface to a glass slide on a hot plate heated to 100–120 ∘C. Then, the other side of the sample section was polished down to #6000 to give an approximate thickness of 100 µm to minimize scattered IR light on the sample surface and interference fringes within the sample. Finally, the sample was removed from the glass slide by dissolving the resin in acetone. IR spectra obtained in this study did not show any CH peaks around 2950 cm−1, which can be indicative of organic contamination from residuals of the resin and/or acetone; even if these peaks are detected in IR spectra, they do not affect water bands, as the wavenumbers are different (e.g., Kebukawa et al., 2009). Subsequently, the sample thin section was set on a stand stage equipped with a dial gauge, and the actual sample thicknesses of the IR mapped areas were measured. The sample thickness of approximately 100 µm is suitable for obtaining good transmitted IR signals through quartz and for making microstructural observations under a polarizing microscope. Water in tight grain boundaries and triple junctions (e.g., at the scale of transmission electron microscope resolution), as well as water in grain interiors, is preserved during the above-described processes of thin sectioning and heating on a hot plate (Fukuda et al., 2009). Therefore, arguments and interpretations in this paper concern water that was originally trapped in the samples.
We used a Fourier-transform IR spectrometer (JASCO FT/IR-4700) equipped with a microspectrometer (JASCO IRT-5200) to measure water included in quartz and other minerals in the samples. The IR spectrometer incorporated a silicon carbide (Globar) IR source and a KBr beamsplitter. Unpolarized IR light was irradiated to the sample set on the sample stage of the microspectrometer, and IR light through the sample under atmospheric conditions was detected using a mercury–cadmium–telluride detector in the microspectrometer. IR spectra were obtained from an average of 100 scans with a wavenumber resolution of 4 cm−1. An aperture size of 25×25 µm was used. Mapping measurements were performed using a beam-moving function in the sample area of up to 400×400 µm; the sample stage was fixed, and IR light irradiated to the sample was moved. Mapping step intervals the same as the aperture size were applied. We checked that mapping measurements with larger aperture sizes for the same areas gave similar averaged water distributions. We also included other minerals such as plagioclase and/or phyllosilicate neighboring quartz in the mapping, as their IR spectra differ substantially from those of quartz and can serve as markers in IR mapped data to match with the locations in the optical photomicrographs.
Water contents were converted by means of the absorbance of water-stretching bands with linear baselines from 2800 to 3750 cm−1. Water-stretching bands in our quartz samples commonly exhibit molecular H2O bands (presented below in the Results section). We used the calibration of Paterson (1982), which was designed for molecular H2O, as dν, where C is the concentration in mol H2O ℓ−1 (note that the original paper of Paterson (1982) uses H ℓ−1), and A(ν) is the absorbance at a wavenumber ν in cm−1 for a sample thickness normalized to 1 cm. This calibration is based on a linear trend of absorption coefficients for any type of water (H2O and OH) in different materials but assumes isotropically distributed molecular H2O for the orientation factor of , which is already included in the above equation. The mapped areas also include plagioclase and/or phyllosilicate. Grain interiors of plagioclase are also altered to epidote, muscovite, and clay minerals (Fig. 3; also see the description in Sect. 2). IR spectra of plagioclase, as well as those of phyllosilicate, that possibly include these alteration minerals exhibit a dominant band owing to molecular H2O and accessory band(s) caused by structural OH (shown later). In particular, structural OH may be anisotropically incorporated in all of these minerals. It is noted, therefore, that the calibration of Paterson (1982) used for these minerals gives semi-quantitative water contents. Other calibrations for contents of molecular H2O and/or OH species in quartz have been given by Kats (1962), Aines et al. (1984), Nakashima et al. (1995), Libowitzky and Rossman (1997), Stipp et al. (2006), and Thomas et al. (2009). Fukuda and Shimizu (2019) compared these calibrations, and the ratios of the calculated water contents between them, based on the value by the calibration of Paterson (1982) as unity, are . Previously reported absorption coefficients of water in quartz have been discussed by Fukuda and Shimizu (2019) and Stalder (2021). In this study, water contents are expressed as wt ppm H2O, which is converted from mol H2O ℓ−1 using the molar mass of H2O (18 g mol−1) and the density of quartz (2650 g ℓ−1). This conversion using these values was applied to other minerals, namely, plagioclase and/or phyllosilicate, which are commonly measured together with quartz in IR maps and are used as markers for the locations measured. As the densities (averaged densities when mixed) of these minerals differ from that of quartz, albeit slightly, the water contents of the minerals reported in this study are semi-quantitative values.
The results of IR mapping for the almost-undeformed sample are shown in Fig. 6. The measured area includes a single quartz grain (Fig. 6a). Water contents are heterogeneous (Fig. 6b), ranging from a minimum of 40 wt ppm (no. 1) to a maximum of 1750 wt ppm (no. 5), the raw IR spectra for which are presented in Fig. 6c. The heterogeneous distribution of fluid inclusions is clearly observed in the optical photomicrograph (Fig. 4b) and would correspond to the IR mapped data. Raw IR spectra commonly show a broad band at 2800–3750 cm−1, which is a result of the stretching vibrations of molecular H2O (Fig. 6c).

Figure 6IR mapping results for the almost-undeformed sample. The sample thickness is 60 µm. (a) Optical photomicrograph under cross-polarized light. The IR mapped area is shown with a red square. (b) Water distribution. Numbers represent raw IR spectra in (c) from low to high water contents.
The results of IR mapping for the weakly deformed sample are presented in Fig. 7. The measured area includes two host quartz grains, dynamically recrystallized grains around them, and plagioclase grains (Fig. 7a). In the water distribution map (Fig. 7b), the plagioclase shows much higher water contents (around no. 5) compared with quartz. The higher water contents in plagioclase in the mapped data serve as a marker for comparison with the microstructural image (Fig. 7a). The IR spectrum of plagioclase in Fig. 7c shows a sharp band at 3630 cm−1, which may be related to structural hydroxyl vibration(s) of plagioclase and/or altered clay minerals (Johnson and Rossman, 2004). In all of the studied samples, grain interiors of plagioclase are altered to epidote, muscovite, and clay minerals (Fig. 3). When ductile shear zones developed in the study area, plagioclase was not deformed plastically but was replaced by various minerals during late-stage alteration. Therefore, the IR spectra of the plagioclase that includes alteration minerals may not provide useful information about water in rocks during mylonitization. Water contents in the host quartz grains are in the range of 600–1000 wt ppm (Fig. 7b). In contrast, water contents in the recrystallized regions at a distance of >150 µm from the adjacent host grains are 200–300 wt ppm, clearly lower than those in the host grains. In addition, a gradual decrease in water content from the host grains to the adjacent recrystallized regions is observed in some cases; for example, over a distance of ∼150 µm from no. 3 (host; 680 wt ppm in Fig. 7c) to no. 1 (recrystallized region; 210 wt ppm). In terms of microstructure, this decrease is consistent with the development of dynamic recrystallization – from subgrains in and around host grains (Fig. 7a) to recrystallized grains.
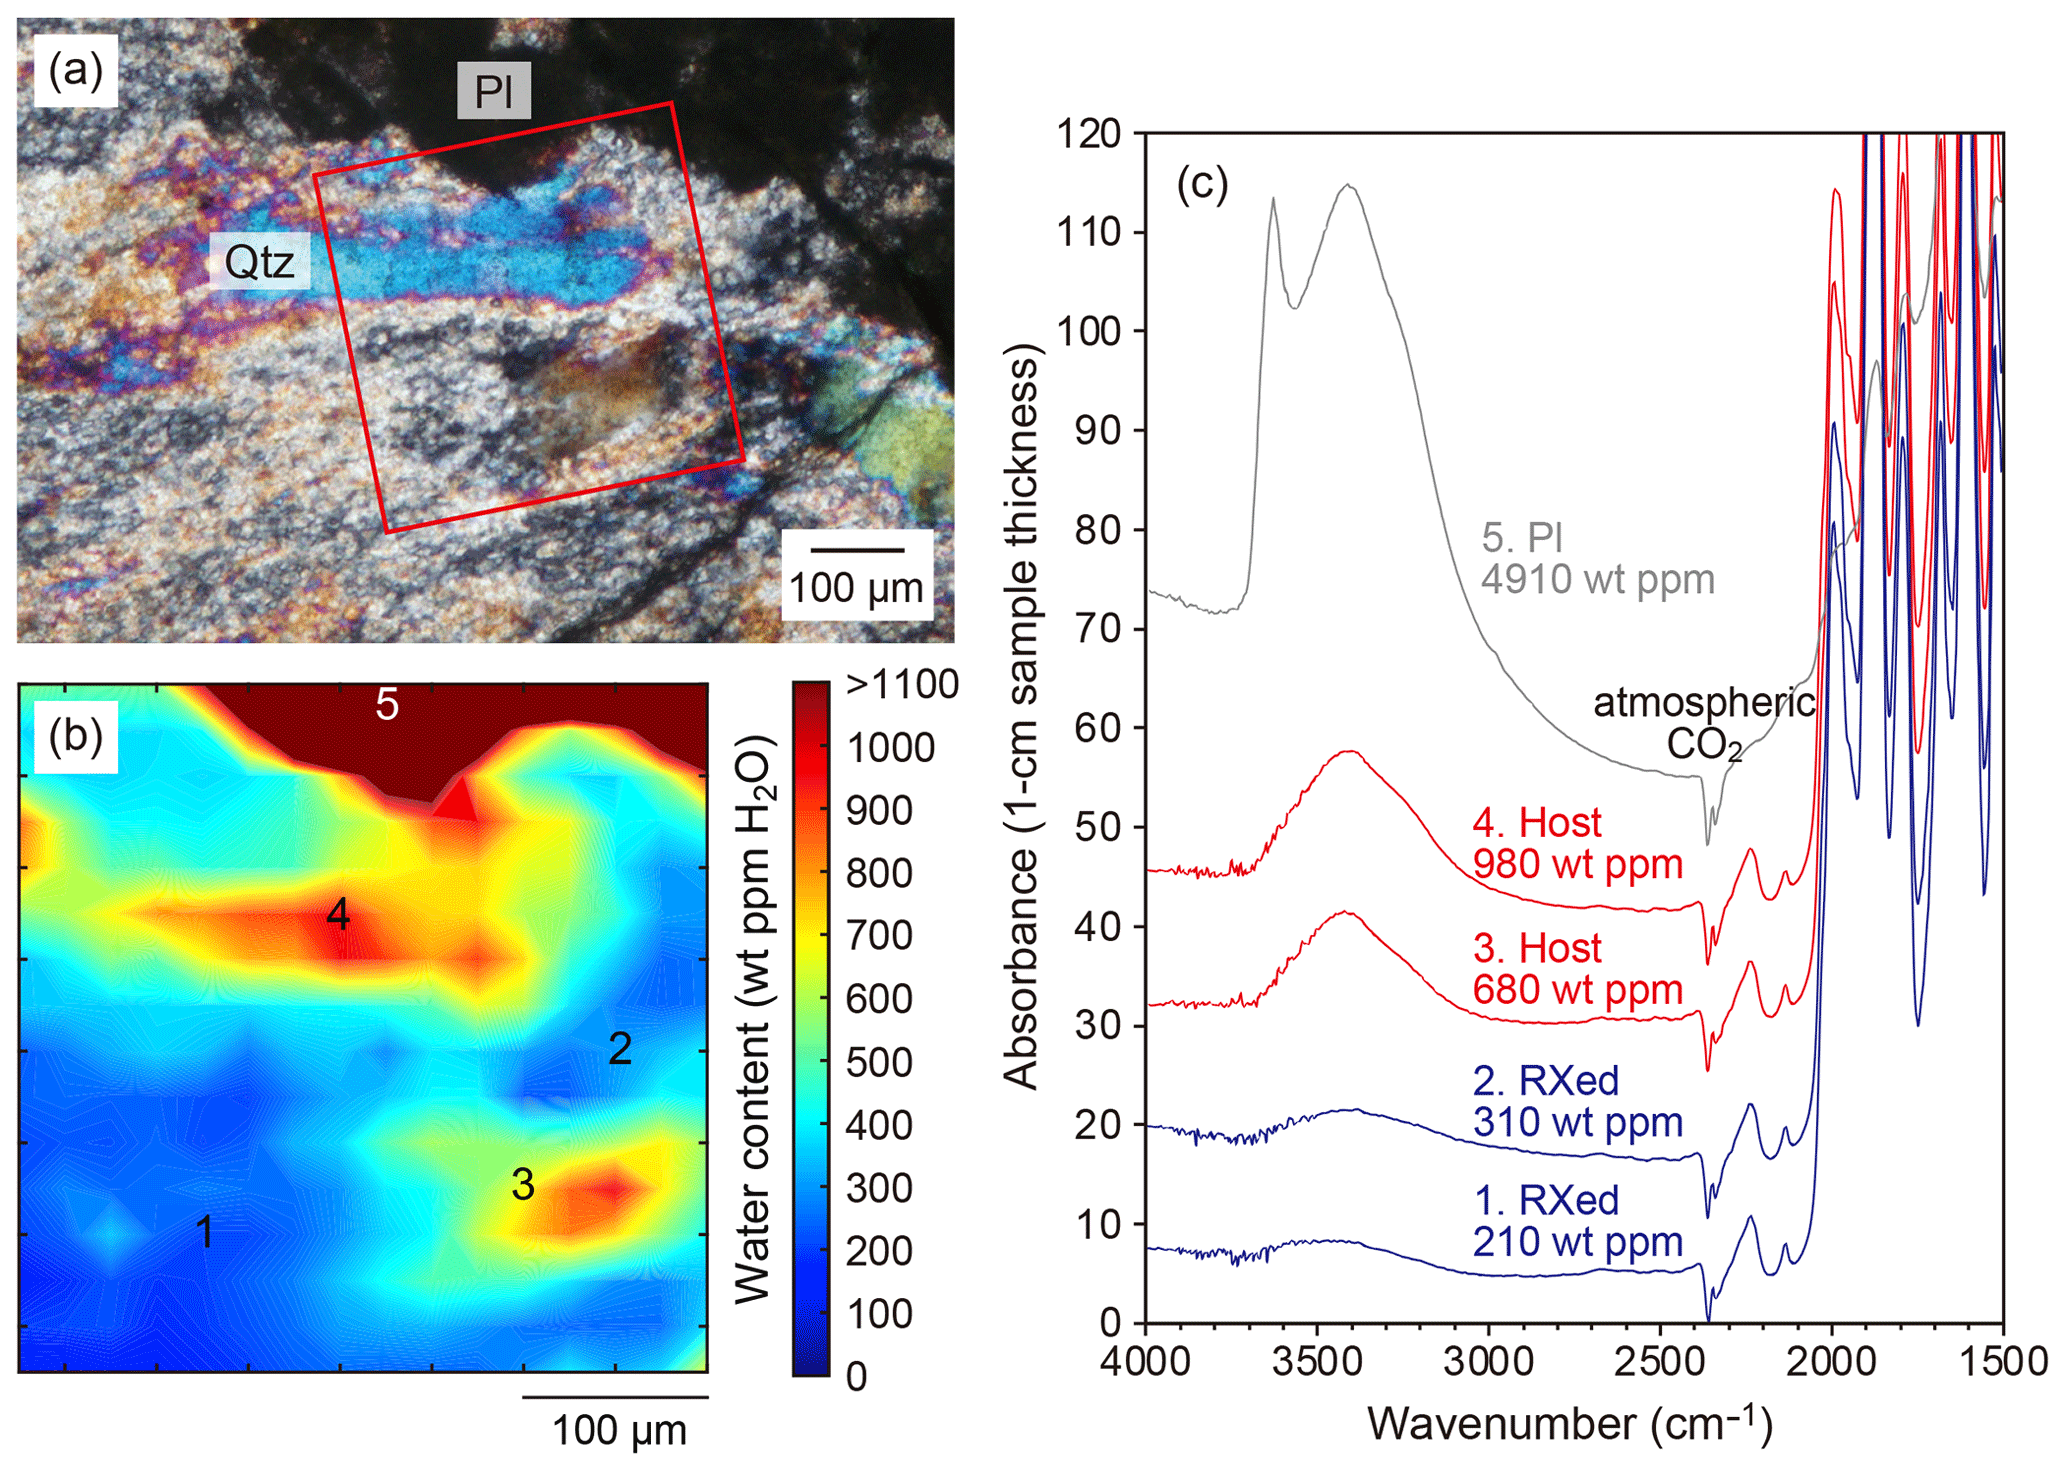
Figure 7IR mapping results for the weakly deformed sample. The sample thickness is 103 µm. (a) Optical photomicrograph under cross-polarized light. The IR mapped area is shown with a red square. (b) Water distribution. Numbers represent raw IR spectra in (c). Color-coded water contents up to 1100 wt ppm H2O are for quartz, and those above are for plagioclase around no. 5 in (b). “RXed” in (c) means recrystallized.
In another part of the weakly deformed sample (Fig. 8), regions of small grains around host grains widen at certain sample stage angles under a polarizing microscope, and subgrains would be included (Fig. 8a–f). Water contents in recrystallized regions that probably include subgrains are 290–500 wt ppm (around nos. 1 and 2 in Fig. 8g and h), slightly higher than those in the recrystallized regions in Fig. 7. These regions look slightly darker under plane-polarizing light, probably because of light scattering by fine grains (Fig. 8c and e). We did not observe microcracks that hold water, at least under a polarizing microscope. Water contents in host grains reach up to 1540 wt ppm, which is as high as those in the almost-undeformed sample.

Figure 8IR mapping results for the weakly deformed sample. The sample thickness is 97 µm. (a) Optical photomicrograph under cross-polarized light. The IR mapped area is shown with a red square. The dashed white rectangle depicts the area of enlarged images of fine-grained quartz regions that include host grains under (b) cross-polarized and (c) plane-polarized light. Similarly, images (d) and (e) are from (f), where the optical photomicrograph is rotated approximately 30∘ clockwise from (a). Fine-grained quartz regions are smaller than those in (a), indicating that subgrains are included. (g) Water distribution. Numbers represent raw IR spectra in (h). Color-coded water contents up to 1600 wt ppm H2O are for quartz, and those above are for plagioclase around no. 5 in (g). “RXed” in (h) means recrystallized. Both recrystallized grains and subgrains are included in the measured area.
The results of IR mapping for the strongly deformed sample are shown in Fig. 9. The IR mapped area consists mainly of recrystallized quartz (Fig. 9a). The crystallographic orientations of some grains within and around a relic of a host grain look continuously similar and/or continuously change, as in undulose extinction, and these grains would be subgrains (inset under cross-polarized light in Fig. 9a). Water contents in the subgrain region (around no. 4 in Fig. 9b) are 390–540 wt ppm, substantially higher than those in other recrystallized regions (water contents of 120–250 wt ppm). The IR spectra of quartz in the strongly deformed sample commonly show a broad H2O band at 2800–3750 cm−1 (Fig. 9c), the same as quartz in the almost-undeformed and weakly deformed samples (Figs. 6–8). The low and homogeneous water contents in the recrystallized regions are consistent with those in the weakly deformed sample (Fig. 7).
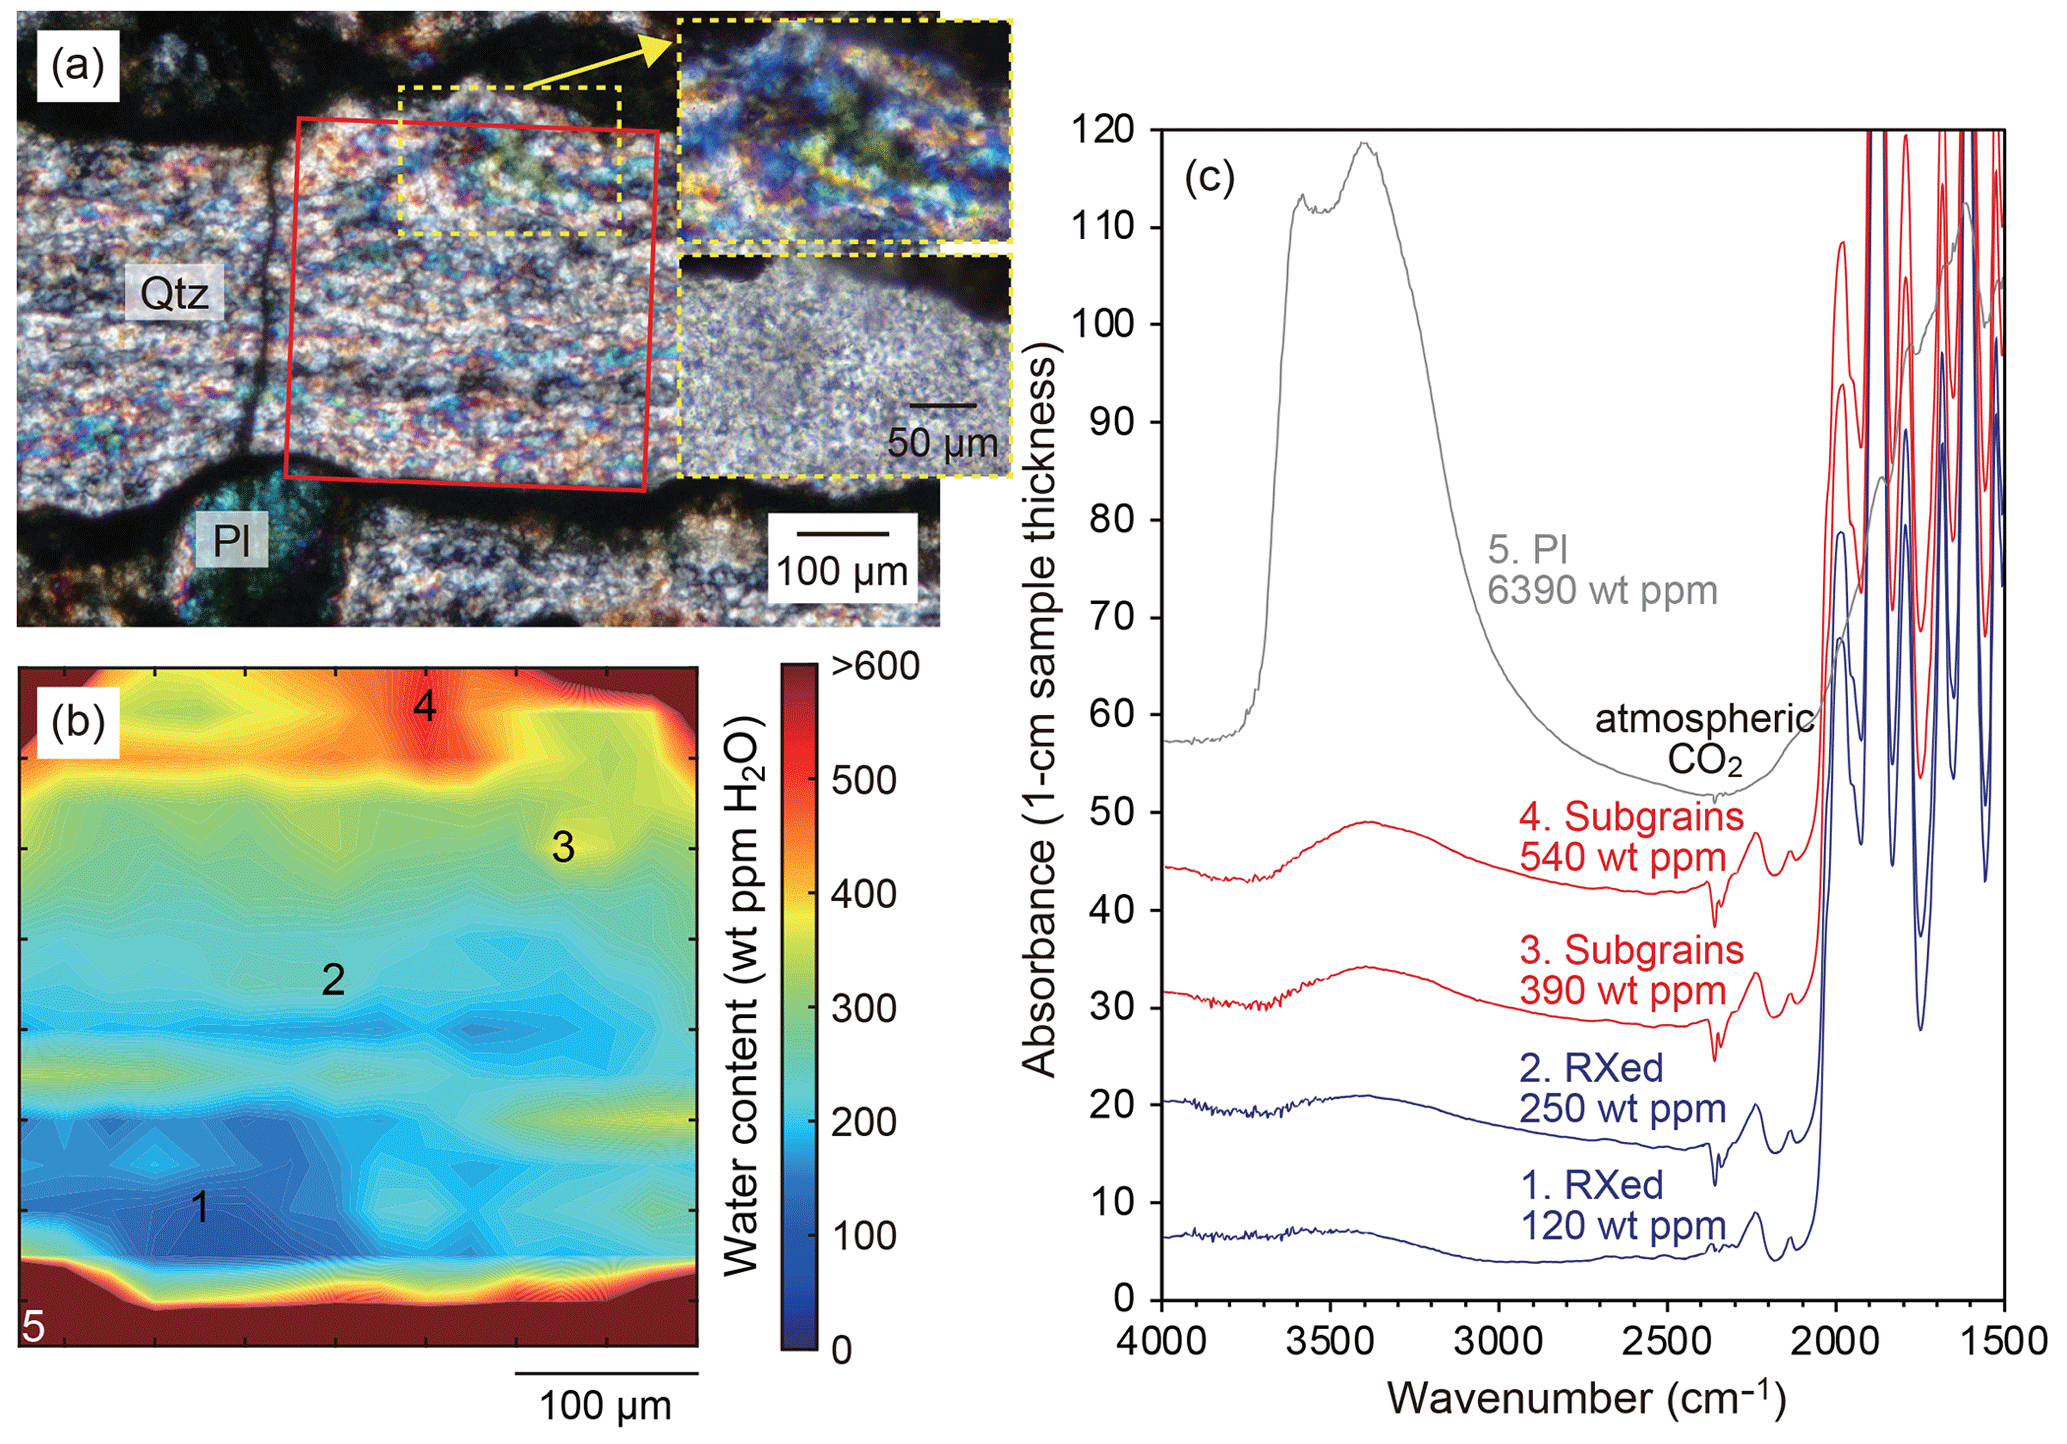
Figure 9IR mapping results for the strongly deformed sample. The sample thickness is 112 µm. (a) Optical photomicrograph under cross-polarized light. The IR mapped area is shown with a red square. The two insets in the yellow rectangles show enlarged images of a region that includes a relic of a host grain at the center under cross-polarized (upper) and plane-polarized (lower) light. (b) Water distribution. Numbers represent raw IR spectra in (c). Color-coded water contents up to 600 wt ppm H2O are for quartz, and those above are for plagioclase and phyllosilicate around no. 5 and others in (b). Quartz subgrains in host grains are around nos. 3 and 4 in (b), which correspond to the microstructure in (a). “RXed” in (c) means recrystallized.
5.1 Water in host quartz and water species
Water contents in host quartz grains are heterogeneous regardless of the degree of deformation (Figs. 6–8) and range from 40 to 1750 wt ppm with a mean of 500±280 wt ppm in the almost-undeformed sample and from 250 to 1540 wt ppm with a mean of 800±200 wt ppm in the weakly deformed sample (Fig. 10). The IR spectra commonly show a broad band at 2800–3750 cm−1 as molecular H2O in the three different samples. In the almost-undeformed sample, fluid inclusions in quartz grains are visible and heterogeneously distributed in the optical photomicrograph (Fig. 4b), but submicroscopic fluid inclusions may be included. In the weakly deformed sample, fluid inclusions in host quartz grains are less numerous in the photomicrograph (Fig. 4d). In the IR mapping images for the weakly deformed sample, the high-water-content regions (Figs. 7b and 8g) correspond to relics of host grains identified under a polarizing microscope (Figs. 7a and 8a–f). In comparison, in the almost-undeformed sample, water contents in host grains are simply heterogeneous. As water contents in host quartz grains in the almost-undeformed and weakly deformed samples do not differ substantially, although their distributions in the two samples are different, a redistribution of fluid inclusions with a size change to less than the optical microscopic scale must have occurred in the latter sample. The redistribution of fluid inclusions owing to plastic deformation has been reported in previous microstructural observations (Kerrich, 1976; Wilkins and Barkas, 1978; Hollister, 1990; Cordier et al., 1994; Vityk et al., 2000; Faleiros et al., 2010). The redistribution of fluid inclusions is possible by means of volume diffusion and/or diffusion through dislocation cores (pipe diffusion) of water molecules and/or hydrogen. Some of the abovementioned studies proposed leakage of water during the redistribution of fluid inclusions, but this is unlikely to have been significant in the host grains analyzed in the present study, since the water contents in host grains in the almost-undeformed and weakly deformed samples are not significantly different. The redistribution of fluid inclusions has similarly also been reported from IR spectroscopic measurements of an experimentally deformed single quartz crystal (Stünitz et al., 2017). Those authors demonstrated that original fluid inclusions with sizes of up to 100 µm transformed into Si–OH, as Si–O–Si + H2O ⟷ Si–OH OH–Si, where Si–OH showed a sharp band at 3585 cm−1 in IR spectra. This band was also observed in naturally deformed quartz by Niimi et al. (1999) and Gleason and DeSisto (2008) but was not detected in our samples or by others (e.g., Kronenberg and Wolf, 1990; Kronenberg et al., 1990; Muto et al., 2004, 2005; O'Kane et al., 2007; Finch et al., 2016; Kronenberg et al., 2017, 2020; Fukuda and Shimizu, 2019). Stünitz et al. (2017) also demonstrated that the above Si–OH, which could have originally been visible fluid inclusions with sizes of a few micrometers under a polarizing microscope, are again transformed into much smaller fluid inclusions measuring less than 100 nm in size by subsequent annealing. This process may have occurred in our samples and can explain the redistribution of fluid inclusions in the optical photomicrographs (Fig. 4b vs. 4d) while retaining the original water contents.
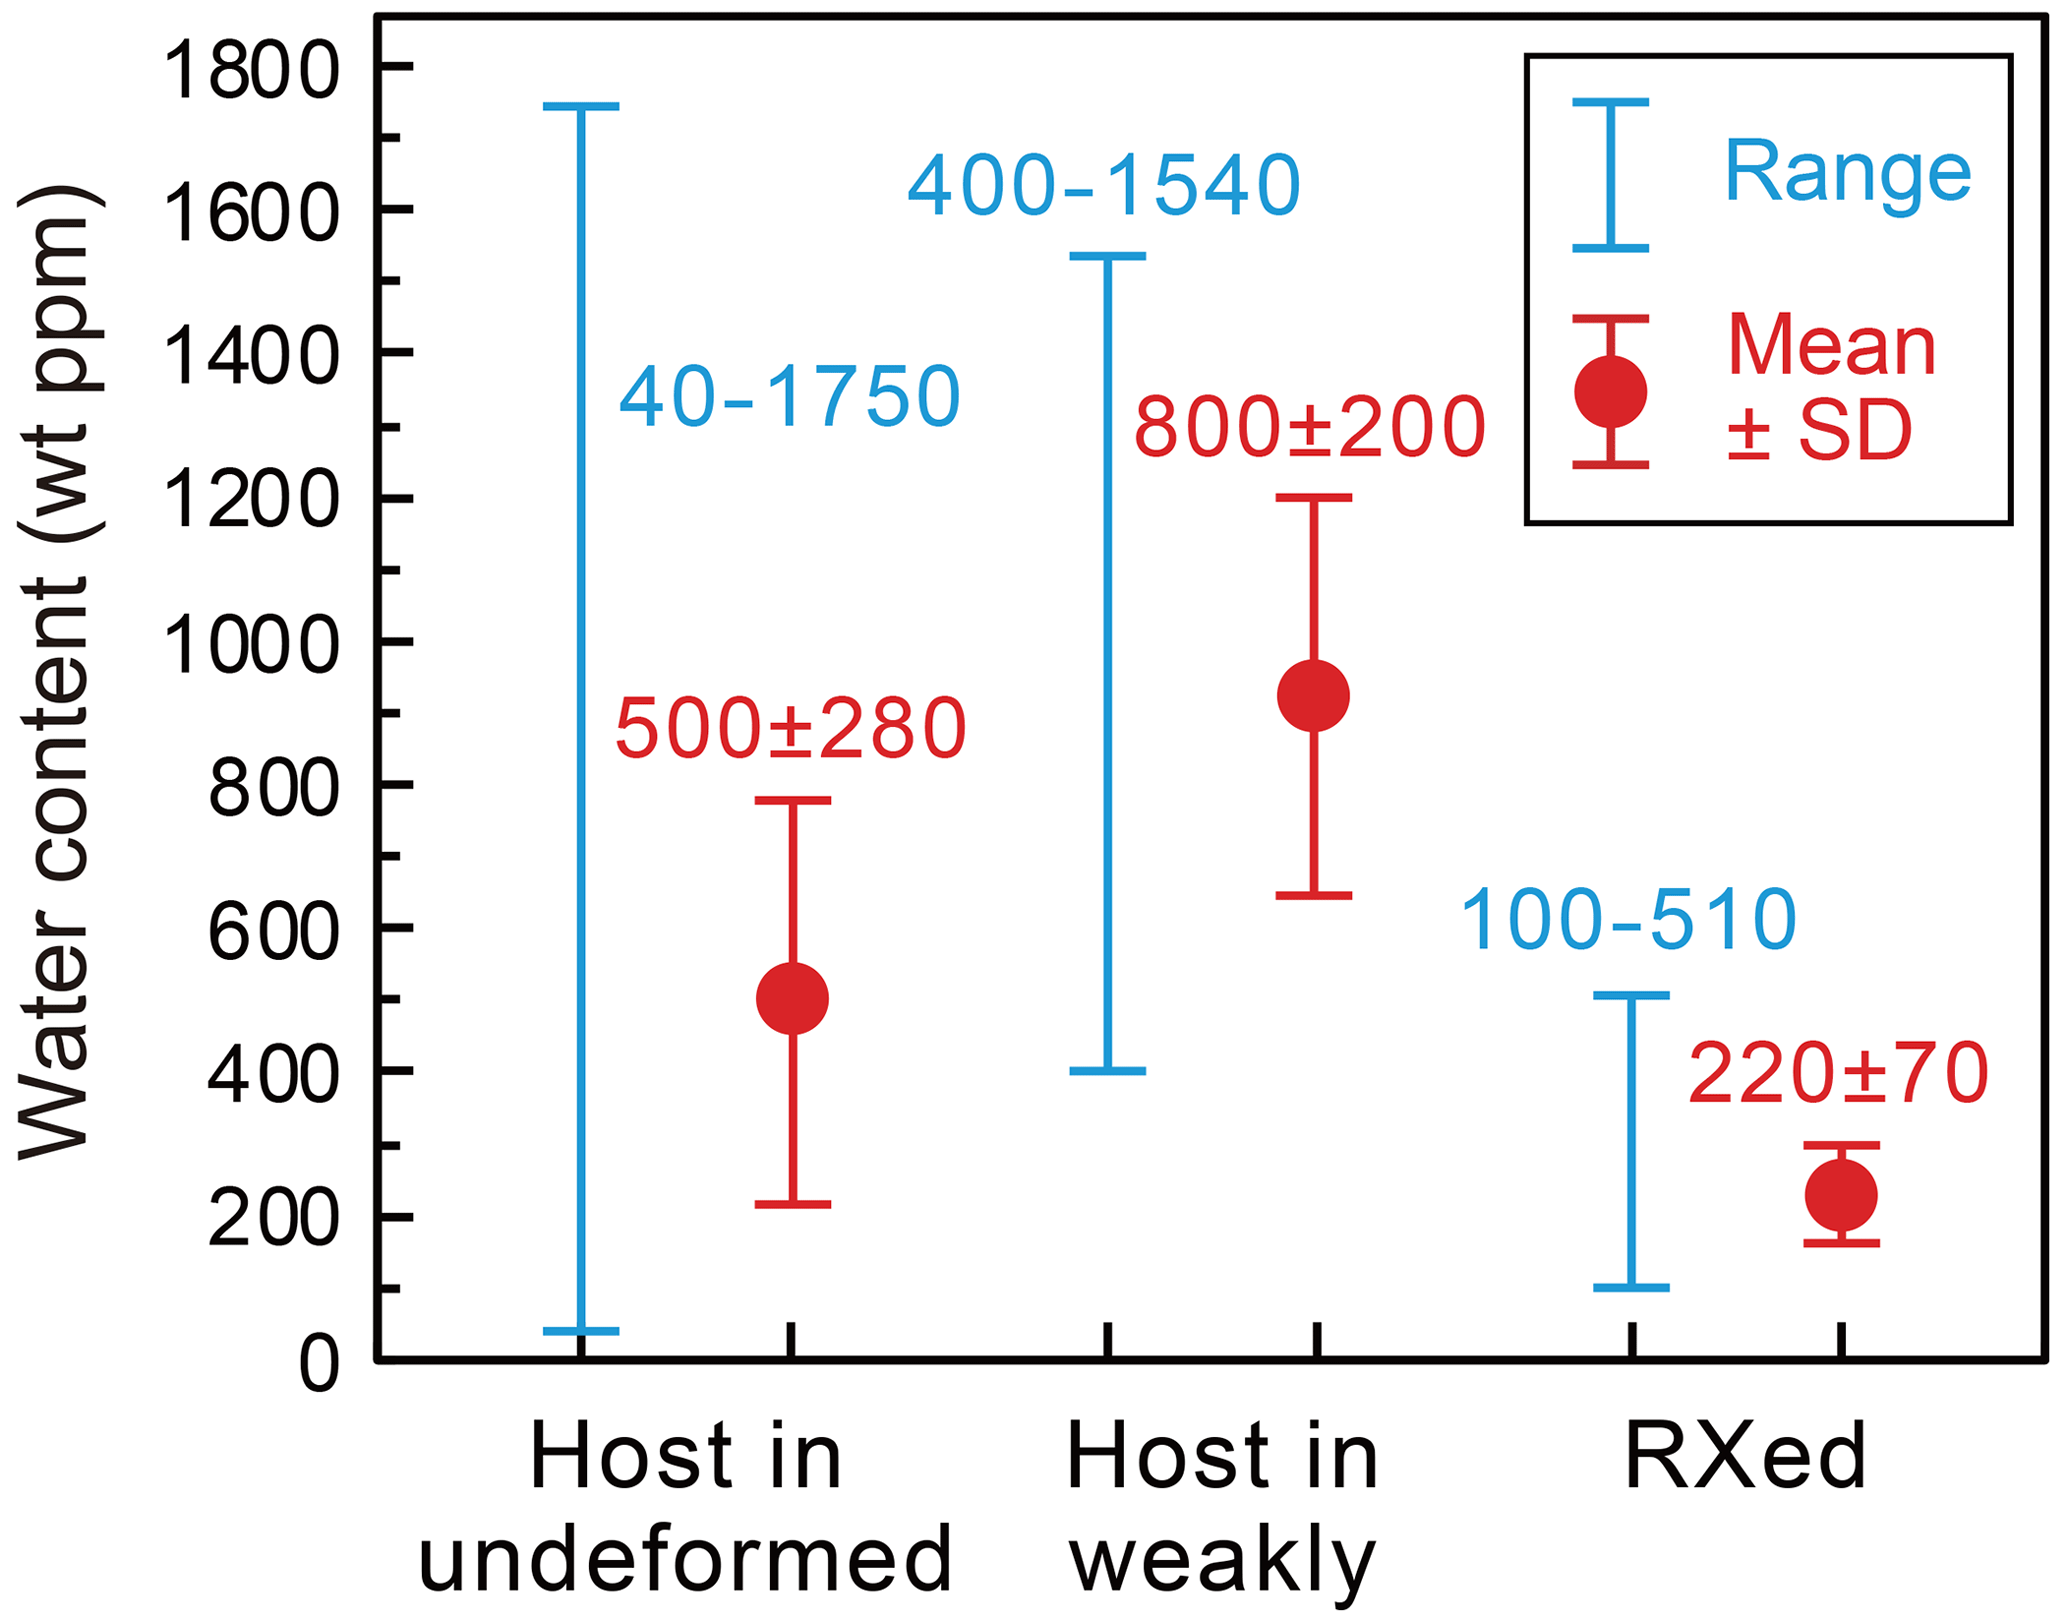
Figure 10Summary of water content variations in quartz. “Host” represents host quartz grains as grain interiors in the almost-undeformed and weakly deformed samples. These two samples are referred to as undeformed and weakly in the figure, respectively. “RXed” represents regions of recrystallized quartz grains, including both grain interiors and grain boundaries in the weakly deformed and strongly deformed samples. Ranges from the lowest to highest contents in blue and means with standard deviations (SD) in red are shown. The difference between the almost-undeformed and weakly deformed samples in terms of water contents in host grains may be because of the areas to be measured. In addition, the water distributions in host grains in the weakly deformed sample correspond to the shapes of host grains (Figs. 7 and 8), but those in the almost-undeformed sample do not (Fig. 6). Therefore, there may be a redistribution of water in host grains by plastic deformation, as supported by the photomicrographs, which show fewer visible fluid inclusions in the latter sample (Fig. 4).
5.2 Water in dynamically recrystallized quartz
As seen in the weakly and strongly deformed samples, where dynamic recrystallization of quartz is developed, water contents in recrystallized regions are low and homogeneous compared with those in host grains (Figs. 7–9). The mean water content is 220±70 wt ppm (Fig. 10) where grains are fully recrystallized. These low water contents also contrast with those of up to 1540 wt ppm in adjacent host grains in the weakly deformed sample. As the sizes of the recrystallized grains are ∼10 µm (Fig. 5) and because the sample thickness is ∼100 µm, the aperture size of 25×25 µm of the IR microspectrometer captures water in both grain interiors and grain boundaries. In the regions of subgrains in the weakly deformed sample (Figs. 7 and 8) and in the strongly deformed sample (Fig. 9), water contents in subgrain regions are intermediate between those in recrystallized regions and host grains. Thus, water in quartz is inferred to be released by dynamic recrystallization. Similar results have been reported by Finch et al. (2016), Kilian et al. (2016), and Kronenberg et al. (2020) for naturally recrystallized quartz and by Palazzin et al. (2018) for experimentally recrystallized quartz. Kronenberg et al. (2020) reported that water contents in quartzites from the Moine thrust vary from around 600 to 220 wt ppm, depending on the percentage of recrystallized regions (from 20 % to 100 %) within a distance of 70 m towards the thrust. The mean recrystallized grain size in their samples was 21.7 µm. As those authors performed point analyses, it may be difficult to correlate the water content values with the microstructures, and their water content values may thus include subgrains, which are more likely to be measured when recrystallization percentages are low. In addition, in our weakly deformed sample, water contents in quartz gradually decrease with increasing distance within a range of ∼150 µm, from the adjacent host grains (Fig. 7), which may be due to the transition from subgrains to recrystallized grains. In addition, in the strongly deformed sample, water contents in regions of subgrains are higher than those in recrystallized regions (Fig. 9). Water contents reported by Finch et al. (2016) for deformed granitic diatexite vary from approximately 650 to 200 wt ppm from their weakly deformed sample to mylonite to ultramylonite and with decreasing grain size from 95 to 60 µm (there are also slight differences in water contents between ribbon and matrix regions in their samples). Palazzin et al. (2018) reported water contents in matrix regions with a grain size of <10 µm in experimentally deformed quartzite of ∼200 wt ppm, even though different starting quartz samples with different water contents ranging from 39 to 3446 wt ppm were used (their Table 1). Kilian et al. (2016) studied quartz in a granite deformed under amphibolite-facies conditions. In their samples, quartz grains were dynamically recrystallized to a grain size of 250–750 µm, mainly by means of grain boundary migration, with a minor contribution from subgrain rotation. Their mean water contents, including intracrystalline OH and molecular H2O as fluid inclusions in recrystallized quartz, were ∼10 wt ppm, comprising 70 %–80 % of molecular H2O and the remainder of intracrystalline OH, and were approximately half of those in the original magmatic host grains. Those values in recrystallized and original grains are much lower than those in other previous studies and in the present study. Thus, water contents in recrystallized quartz grains and host grains are diverse in natural samples; this diversity may depend on deformation conditions, including the equilibrium state of water. In addition, Fukuda et al. (2012) found heterogeneously distributed water with contents of 150–2200 wt ppm in K-feldspar porphyroclasts in granitoid mylonite. In contrast, in the same granitoid mylonite sample, water in regions of fine-grained K-feldspar (∼20 µm), which could have been formed by solution–precipitation processes around porphyroclasts, was homogeneously distributed, with contents of 150–300 wt ppm, much lower than those in porphyroclasts. Those authors also proposed that water was released during the formation process of fine grains.
If the water content of 220±70 wt ppm in the recrystallized regions analyzed in this study is distributed homogeneously in grain boundaries as thin films, then the mean grain size of ∼10 µm (Fig. 5) gives a grain boundary width of ∼2 nm based on the estimation by Ito and Nakashima (2002; 1.9 nm using their cubic grain model and 2.5 s nm using their tetradecahedral grain model). This is consistent with the estimation by Palazzin et al. (2018) for their samples whose grain sizes are similar to ours. However, there is no basis for assuming homogeneous grain boundary films. Some previous studies of natural quartz aggregates have shown that water contents increase with decreasing grain size (Kronenberg et al., 1990; Nakashima et al., 1995; Ito and Nakashima, 2002; Muto et al., 2004, 2005; Fukuda and Shimizu, 2019). In these cases, where quartz displays microstructural modifications as a result of dynamic recrystallization and/or grain growth, which results in a change in grain size, water may have been continuously supplied to fill grain boundaries, where more water can be stored compared to grain interiors. Thus, the IR spectra of these samples, as measured in laboratories, may show larger water absorption bands stored in grain boundaries with decreasing grain size compared with samples that did not undergo subsequent water infiltration along grain boundaries in previous studies (Finch et al., 2016; Kilian et al., 2016; Kronenberg et al., 2020). Under natural conditions, including those of the upper and middle crust, fluid water could form thin films in quartz grain boundaries with a wetting angle of , as confirmed by experiments (Watson and Brenan, 1987; Holness, 1992, 1993) and observations of natural samples (Hiraga et al., 1999). For example, in the IR mapping measurements reported by Fukuda and Shimizu (2019) for quartz in the Sanbagawa metamorphic schist, the estimated water content varies from 310 to 40 wt ppm in quartz-aggregated regions, with changing grain size from ∼40 µm (chlorite zone) to ∼120 µm (oligoclase–biotite zone). The water content in the latter sample is inferred to be from grain interiors, as the grain size and sample thickness were sufficiently large for the aperture sizes of 30×30 µm and/or 50×50 µm used in those authors' study. For their samples whose grain sizes were smaller than the aperture sizes, the measured water would include grain boundaries. Their estimated grain boundary width filled with water was ∼10 nm, which is approximately 5 times larger than that estimated in the present study. However, grain boundaries are not always filled with water, depending on the water-available conditions after dynamic recrystallization. In our samples, quartz grain boundaries may not have undergone a subsequent water infiltration process, and the water distribution indicates that water contents in recrystallized regions include the water released from host grains by dynamic recrystallization.
5.3 Mechanism of water release and homogenization by dynamic recrystallization
In our samples, it is clear that water occurring as fluid inclusions in host quartz grains is released and homogenized by dynamic recrystallization (Figs. 6–10). Fluid inclusions in host quartz grains may be trapped during quartz crystallization from magma. As experimentally confirmed by Tarantola et al. (2010), when plastic strain is very low (<1 %), the shapes of fluid inclusions may be elongated or burst in the original locations. In contrast, under higher plastic strain, when dislocations, which would be associated with the formation of hydroxyl, are introduced as Si–O–Si + H2O ⟷ Si–OH OH–Si, water from the original fluid inclusions can be redistributed by diffusion, which is also rate limited by this reaction (Kerrich, 1976; Wilkins and Barkas, 1978; Hollister, 1990; Cordier et al., 1994; Vityk et al., 2000; Faleiros et al., 2010). In addition to this type of diffusion, diffusion through dislocation cores (i.e., pipe diffusion) can redistribute fluid inclusions (Trepied and Doukhan, 1978; Cordier et al., 1988, 1994; Kronenberg, 1994). In cases where Si–OH is preserved, the IR spectrum shows its OH vibration at 3585 cm−1 (Stünitz et al., 2017) or at 3596 cm−1 (Niimi et al., 1999; Gleason and DeSisto, 2008). However, as discussed above, Si–OH transforms back to SiO2+ H2O by annealing to form smaller fluid inclusions with sizes of <100 nm in both host and recrystallized grains (Stünitz et al., 2017). Thus, the redistribution of fluid inclusions caused by diffusion within host grains may account for water distributions that correspond to the shapes of host grains in the weakly deformed sample (Figs. 7 and 8), as discussed in Sect. 5.1. In cases where diffused H2O during the redistribution process reaches newly formed grain boundaries by dynamic recrystallization, this water should be released, as grain boundaries are fast diffusion paths that lead to the equilibrium state of water in the system. In other words, original fluid inclusions in host quartz grains in the photomicrograph (Fig. 4b) and IR spectra (Fig. 6) were trapped during quartz crystallization from magma, and their contents were not equilibrated with the water system under deformation conditions (possibly including water activity and/or water fugacity). During the dynamic recrystallization process from subgrains to fully recrystallized grains, the water release process may be enhanced by the development of fast diffusion paths. In fact, water contents in regions of subgrains are intermediate between those in host grains and regions of recrystallized grains (Figs. 7–9), indicating that the degree of water release depends on the degree of dynamic recrystallization. Some studies have also speculated that water transfer including release can occur through microcracking (e.g., Kronenberg et al., 1986; Palazzin et al., 2018), but this process was not confirmed in our samples. In summary, through dynamic recrystallization, water release and homogenization occur to achieve the equilibrium state of water in the system corresponding to the deformation conditions.
We performed IR mapping measurements on host and recrystallized quartz in three types of Wariyama granite: almost undeformed, weakly deformed, and strongly deformed. Our results allow the following conclusions to be drawn:
-
Water in host quartz grains in the almost-undeformed sample has contents of 40–1750 wt ppm, with a mean of 500±280 wt ppm, and is heterogeneously distributed as fluid inclusions.
-
Fluid inclusions in host quartz grains in the weakly deformed sample become less numerous under a polarizing microscope compared with those in the almost-undeformed sample. The water contents of host quartz grains in the two samples do not change substantially, but the water distributions in host grains in the weakly deformed sample can correspond to the shapes of host grains. This suggests a redistribution of water within host grains during plastic deformation.
-
When dynamic recrystallization occurs, water is most likely released along newly formed grain boundaries by means of diffusion and is homogenized to achieve an equilibrium state. Water contents in regions of recrystallized grains are 100–510 wt ppm, with a mean of 220±70 wt ppm, in the weakly and strongly deformed samples, whereas those of adjacent host grains observed in the weakly deformed sample are up to 1540 wt ppm.
-
Water contents in regions of subgrains are intermediate between those in host grains and recrystallized regions in the weakly and strongly deformed samples, implying that the degree of water release depends on the degree of dynamic recrystallization.
Raw IR mapped data for Figs. 6–9 in JASCO format (e.g., Fig6.jwa) and each exported IR spectrum for each sample position (e.g., Fig6_X1Y1.txt) are available from Mendeley Data, https://doi.org/10.17632/zn24kbg9xt.1 (Fukuda, 2023). The text files can be used by those who do not have JASCO's IR software. These data can be used to reproduce the water content variations presented in Fig. 10.
The samples used in this study are available at the locations shown in Fig. 1. The rock specimens for Fig. 2 and the thin sections for Figs. 3 and 4 and for Figs. 6–9 (IR analyses) are stored in the laboratory of JF. The thin sections for Fig. 4 were used for the grain size analyses presented in Fig. 5.
JF conceptualized the study, performed the formal analyses for all the data, and carried the overall responsibility for the study. JF and YO investigated the geological setting. All the authors investigated the sample microstructures. JF and TO analyzed the IR data. JF drafted the main part of the paper. All the authors drafted, reviewed, and edited the paper.
The contact author has declared that none of the authors has any competing interests.
Publisher’s note: Copernicus Publications remains neutral with regard to jurisdictional claims in published maps and institutional affiliations.
The authors thank the constructive reviews and encouragement given by the two anonymous referees and Andreas Kronenberg. We also thank Tetsuro Hirono for his support of our IR measurements. This research was supported by a Grant-in-Aid for Scientific Research (grant nos. KAKENHI 19K04041 for Junichi Fukuda and 20K04087 for Takamoto Okudaira, and 23K03531 for both Junichi Fukuda and Takamoto Okudaira) provided by the Japan Society for the Promotion of Science (JSPS).
This research has been supported by the Japan Society for the Promotion of Science (grant nos. 19K04041, 20K04087, and 23K03531).
This paper was edited by Federico Rossetti and reviewed by Andreas Kronenberg and two anonymous referees.
Aines, R. D. and Rossman, G. R.: Water in minerals? A peak in the infrared, J. Geophys. Res.-Sol. Ea., 89, 4059–4071, https://doi.org/10.1029/JB089iB06p04059, 1984.
Aines, R. D., Kirby, S. H., and Rossman, G. R.: Hydrogen speciation in synthetic quartz, Phys. Chem. Miner., 11, 204–212, https://doi.org/10.1007/BF00308135, 1984.
Blacic, J. D.: Plastic deformation mechanisms in quartz: the effect of water, Tectonophysics, 27, 271–294, https://doi.org/10.1016/0040-1951(75)90021-9, 1975.
Bürgmann, R. and Dresen, G.: Rheology of the lower crust and upper mantle: evidence from rock mechanics, geodesy, and field observations, Annu. Rev. Earth Pl. Sc., 36, 531–567, https://doi.org/10.1146/annurev.earth.36.031207.124326, 2008.
Chernak, L. J., Hirth, G., Selverstone, J., and Tullis, J.: Effect of aqueous and carbonic fluids on dislocation creep strength of quartz, J. Geophys. Res.-Sol. Ea., 114, B04201, https://doi.org/10.1029/2008JB005884, 2009.
Cordier, P., Boulogne, B., and Doukhan, J. C.: Water precipitation and diffusion in wet quartz and wet berlinite AlPO4, B. Mineral., 111, 113–137, 1988.
Cordier, P., Doukhan, J. C., and Ramboz, C.: Influence of dislocations on water leakage from fluid inclusions in quartz: a quantitative reappraisal, Eur. J. Mineral., 6, 745–752, 1994.
Cross, A. J., Prior, D. J., Stipp, M., and Kidder, S.: The recrystallized grainsize piezometer for quartz: An EBSD-based calibration, Geophys. Res. Lett., 44, 6667–6674, https://doi.org/10.1002/2017GL073836, 2017.
Faleiros, F. M., da Cruz Campanha, G. A., da Silveira Ballo, R. M., and Fuzikawa, K.: Quartz recrystallization regimes, c-axis texture transitions and fluid inclusion reequilibration in a prograde greenschist to amphibolite facies mylonite zone (Ribeira Shear Zone, SE Brazil), Tectonophysics, 485, 193–214, https://doi.org/10.1016/j.tecto.2009.12.014, 2010.
Finch, M. A., Weinberg, R. F., and Hunter, N. J. R.: Water loss and the origin of thick ultramylonites, Geology, 44, 599–602, https://doi.org/10.1130/G37972.1, 2016.
Fossen, H. and Cavalcante, G. C. G.: Shear zone – A review, Earth-Sci. Rev., 171, 434–455, https://doi.org/10.1016/j.earscirev.2017.05.002, 2017.
Fujita, Y., Kano, H., Takizawa, F., and Yashima, R.: Geology of the Kakuda district. With geological sheet map at 1:50 000, Geol. Surv. Japan, 99 p., 1988 (in Japanese with English Abstract).
Fukuda, J.: Data for “Water release and homogenization by dynamic recrystallization of quartz” by Junichi Fukuda, Takamoto Okudaira, and Yukiko Ohtomo in Solid Earth, Mendeley Data [data set], V1, https://doi.org/10.17632/zn24kbg9xt.1, 2023.
Fukuda, J. and Shimizu, I.: Theoretical derivation of flow laws for quartz dislocation creep: Comparisons with experimental creep data and extrapolation to natural conditions using water fugacity corrections, J. Geophys. Res., 122, 5956–5971, https://doi.org/10.1002/2016JB013798, 2017.
Fukuda, J. and Shimizu, I.: Water distribution in quartz schists of the Sanbagawa Metamorphic Belt, Japan: infrared spectroscopic mapping and comparison of the calibrations proposed determining water contents, Earth Planet. Space, 71, 136, https://doi.org/10.1186/s40623-019-1117-4, 2019.
Fukuda, J., Yokoyama, T., and Kirino, Y.: Characterization of the states and diffusivity of intergranular water in a chalcedonic quartz by high-temperature in situ infrared spectroscopy, Mineral. Mag., 73, 825–835, https://doi.org/10.1180/minmag.2009.073.5.825, 2009.
Fukuda, J., Okudaira, T., Satsukawa, T., and Michibayashi, K.: Solution-precipitation of K-feldspar in deformed granitoids and its relationship to the distribution of water, Tectonophysics, 532–535, 175–185, https://doi.org/10.1016/j.tecto.2012.01.033, 2012.
Fukuda, J., Holyoke, C. W., and Kronenberg, A. K.: Deformation of fine-grained quartz aggregates by mixed diffusion and dislocation creep, J. Geophys. Res., 123, 4676–4696, https://doi.org/10.1029/2017JB015133, 2018.
Gleason, G. C. and DeSisto, S.: A natural example of crystal-plastic deformation enhancing the incorporation of water into quartz, Tectonophysics, 446, 16–30, https://doi.org/10.1016/j.tecto.2007.09.006, 2008.
Griggs, D. T.: Hydrolytic weakening of quartz and other silicates, Geophys. J. Int., 14, 19–31, https://doi.org/10.1111/j.1365-246X.1967.tb06218.x, 1967.
Griggs, D. T. and Blacic, J. D.: Quartz: Anomalous weakness of synthetic crystals, Science, 147, 292–295, https://doi.org/10.1126/science.147.3655.292, 1965.
Hiraga, T., Nagase, T., and Akizuki, M.: The structure of grain boundaries in granite-origin ultramylonite studied by high-resolution electron microscopy, Phys. Chem. Miner., 26, 617–623, https://doi.org/10.1007/s002690050226, 1999.
Hirth, G. and Kohlstedt, D.: Rheology of the upper mantle and the mantle wedge: A view from the experimentalists, in: Inside the Subduction Factory, edited by: Eiler, J., Geophys. Monogr. Ser., American Geophysical Union, 138, 83–105, https://doi.org/10.1029/138GM06, 2003.
Hollister, L. S.: Enrichment of CO2 in fluid inclusions in quartz by removal of H2O during crystal-plastic deformation, J. Struct. Geol., 12, 859–901, https://doi.org/10.1016/0191-8141(90)90062-4, 1990.
Holness, M. B.: Equilibrium dihedral angles in the system quartz–CO2–H2O–NaCl at 800∘ C and 1–15 kbar: the effects of pressure and fluid composition on the permeability of quartzites, Earth Planet. Sc. Lett., 114, 171–184, https://doi.org/10.1016/0012-821X(92)90159-S, 1992.
Holness, M. B.: Temperature and pressure dependence of quartz–aqueous fluid dihedral angles: the control of adsorbed H2O on the permeability of quartzites, Earth Planet. Sc. Lett., 117, 363–377, https://doi.org/10.1016/0012-821X(93)90090-V, 1993.
Holyoke, C. W. and Kronenberg, A. K.: Accurate differential stress measurement using the molten salt cell and solid salt assemblies in the Griggs apparatus with applications to strength, piezometers and rheology, Tectonophysics, 494, 17–31, https://doi.org/10.1016/j.tecto.2010.08.001, 2010.
Holyoke, C. W. and Kronenberg, A. K.: Reversible water weakening of quartz, Earth Planet. Sc. Lett., 374, 385–390, https://doi.org/10.1016/j.epsl.2013.05.039, 2013.
Ito, Y. and Nakashima, S.: Water distribution in low-grade siliceous metamorphic rocks by micro-FTIR and its relation to grain size: a case from the Kanto Mountain region, Japan, Chem. Geol. 189, 1–18, https://doi.org/10.1016/S0009-2541(02)00022-0, 2002.
Jaoul, O., Tullis, J., and Kronenberg, A.: The effect of varying water contents on the creep behavior of Hevitree quartzite, J. Geophys. Res.-Sol. Ea., B89, 4298–4312, https://doi.org/10.1029/JB089iB06p04298, 1984.
Johnson, E. and Rossman, G. R.: A survey of hydrous species and concentrations in igneous feldspars, Am. Mineral., 89, 586–600, https://doi.org/10.2138/am-2004-0413, 2004.
Jung, H.: Crystal preferred orientations of olivine, orthopyroxene, serpentine, chlorite, and amphibole, and implications for seismic anisotropy in subduction zones: a review, Geosci. J., 21, 985–1011, https://doi.org/10.1007/s12303-017-0045-1, 2017.
Jung, H. and Karato, S.: Water-induced fabric transitions in olivine, Science, 293, 1460–1463, https://doi.org/10.1126/science.1062235, 2001.
Jung, H., Katayama, I., Jiang, Z., Hiraga, T., and Karato, S.: Effect of water and stress on the lattice-preferred orientation of olivine, Tectonophysics, 421, 1–22, https://doi.org/10.1016/j.tecto.2006.02.011, 2006.
Katayama, I., Jung, H., and Karato, S.: New type of olivine fabric from deformation experiments at modest water content and low stress, Geology, 32, 1045–1048, https://doi.org/10.1130/G20805.1, 2004.
Katayama, I., Michibayashi, K., Terao, R., Ando, J., and Komiya, T.: Water content of the mantle xenoliths from Kimberley and implications for explaining textural variations in cratonic roots, Geol. J., 46, 173–182, https://doi.org/10.1002/gj.1216, 2011.
Karato, S., Jung, H., Katayama, I., and Skemer, P.: Geodynamics significance of seismic anisotropy of the upper mantle: New insights from laboratory studies, Annu. Rev. Earth Pl. Sc., 36, 59–95, https://doi.org/10.1146/annurev.earth.36.031207.124120, 2008.
Kats, A.: Hydrogen in alpha quartz, Philips Res. Rep., 17, 133–195, 201–279, 1962.
Kebukawa, Y., Nakashinma, S., Otsuka, T., Nakamura-Messenger, K., and Zolensky, M.E.: Rapid contamination during storage of carbonaceous chondrites prepared for micro FTIR measurements, Meteorit. Planet. Sci., 44, 545–557, https://doi.org/10.1111/j.1945-5100.2009.tb00750.x, 2009.
Kerrich, R.: Some effects of tectonic recrystallisation on fluid inclusions in vein quartz, Contrib. Mineral. Petr., 59, 195–202, https://doi.org/10.1007/BF00371308, 1976.
Kilian, R., Heilbronner, R., Holyoke III, C. W., Kronenberg, A. K., and Stünitz, H.: Dislocation creep of dry quartz. J. Geophys. Res.-Sol. Ea., 121, 3278–3299, https://doi.org/10.1002/2015JB012771, 2016.
Koch, P. S., Christie, J. M., Ord, A., and George, R. P. Jr.: Effect of water on the rheology of experimentally deformed quartzite, J. Geophys. Res.-Sol. Ea., 94, 13975–13996, https://doi.org/10.1029/JB094iB10p13975, 1989.
Kohlstedt, D. L., Evans, B., and Mackwell, S. J.: Strength of the lithosphere: Constraints imposed by laboratory experiments, J. Geophys. Res., 100, 17587–17602, https://doi.org/10.1029/95JB01460, 1995.
Kronenberg, A. K.: Hydrogen speciation and chemical weakening of quartz, Rev. Mineral. Geochem., 29, 123–176, https://doi.org/10.1515/9781501509698-009, 1994.
Kronenberg, A. K. and Tullis, J.: Flow strengths of quartz aggregates: Grain size and pressure effects due to hydrolytic weakening, J. Geophys. Res.-Sol. Ea., 89, 4281–4297, https://doi.org/10.1029/JB089iB06p04281, 1984.
Kronenberg, A. K. and Wolf, G. H.: Fourier transform infrared spectroscopy determinations of intragranular water content in quartz-bearing rocks: Implications for hydrolytic weakening in the laboratory and within the earth, Tectonophysics, 172, 225–271, https://doi.org/10.1016/0040-1951(90)90034-6, 1990.
Kronenberg, A. K., Kirby, S. H., Aines, R. D., and Rossman, G. R.: Solubility and diffusional uptake of hydrogen in quartz at high water pressures: Implications for hydrolytic weakening, J. Geophys. Res.-Sol. Ea., 91, 12723–12744, https://doi.org/10.1029/JB091iB12p12723, 1986.
Kronenberg, A. K., Segall, P., and Wolf, G. H.: Hydrolytic weakening and penetrative deformation within a natural shear zone, in: The Brittle–Ductile Transition in Rocks, edited by: Duba, A. G., Durham, W. B., Handin, J. W., and Wang, H. F., American Geophysical Union, Washington DC, 21–36, https://doi.org/10.1029/GM056p0021, 1990.
Kronenberg, A. K., Hasnan, H. F. B., Holyoke III, C. W., Law, R. D., Liu, Z., and Thomas, J. B.: Synchrotron FTIR imaging of OH in quartz mylonites, Solid Earth, 8, 1025–1045, https://doi.org/10.5194/se-8-1025-2017, 2017.
Kronenberg, A. K., Ashley, K. T., Francsis, M. K., Holyoke III, C. W., Jezek, L., Kronenberg, J. A., Law, R. D., and Thomas, J. B.: Water loss during dynamic recrystallization of Moine thrust quartzites, northwest Scotland, Geology, 48, 557–561, https://doi.org/10.1130/G47041.1, 2020.
Libowitzky, E. and Rossman, G. R.: An IR absorption calibration for water in minerals, Am. Mineral., 82, 1111–1115, https://doi.org/10.2138/am-1997-11-1208, 1997.
Lu, L. X. and Jiang, D.: Quartz flow law revisited: The significance of pressure dependence of the activation enthalpy, J. Geophys. Res.-Sol. Ea., 124, 241–256, https://doi.org/10.1029/2018JB016226, 2019.
Lusk, A. D. J., Platt, J. P., and Platt, J. A.: Natural and experimental constraints on a flow law for dislocation-dominated creep in wet quartz, J. Geophys. Res.-Sol. Ea., 126, e2020JB021302, https://doi.org/10.1029/2020JB021302, 2021.
Masuti, S., Karato, S., Girard, J., and Barbot, S. D.: Anisotropic high-temperature creep in hydrous olivine single crystals and its geodynamic implications, Phys. Earth Planet. In., 290, 1–9, https://doi.org/10.1016/j.pepi.2019.03.002, 2019.
Menegon, L., Nasipuri, P., Stünitz, H., Behrens, H., and Ravna, E.: Dry and strong quartz during deformation of the lower crust in the presence of melt, J. Geophys. Res.-Sol. Ea., 116, B10410, https://doi.org/10.1029/2011JB008371, 2011.
Muto, J., Nagahama, H., and Hashimoto, T.: Micro-infrared reflection spectroscopic mapping: application to the detection of hydrogen-related species in natural quartz, J. Microsc., 216, 222–228, https://doi.org/10.1111/j.0022-2720.2004.01419.x, 2004.
Muto, J., Nagahama, H., and Hashimoto, T.: Water distribution in dynamically recrystallized quartz grains: cathodoluminescence and micro-infrared spectroscopic mapping, in: High-strain zones: Structure and physical properties, edited by: Bruhn, D. and Durlini, L., Geol. Soc. London Spec. Publ., 245, 397–407, https://doi.org/10.1144/GSL.SP.2005.245.01.19, 2005.
Nakashima, S., Matayoshi, H., Yuko, T., Michibayashi, K., Masuda, T., Kuroki, N., Yamagishi, H., Ito, Y., and Nakamura, A.: Infrared microspectroscopy analysis of water distribution in deformed and metamorphosed rocks, Tectonophysics, 245, 263–276, https://doi.org/10.1016/0040-1951(94)00239-6, 1995.
Nègre, L, Sünitz, H., Raimbourg, H., Lee, A., Précigout, J., Pongrac, P., and Jeřábek, P., Effect of pressure on the deformation of quartz aggregates in the presence of H2O, J. Struct. Geol., 148, 104351, https://doi.org/10.1016/j.jsg.2021.104351, 2021.
Niimi, N., Aikawa, N., and Shinoda, K.: The infrared absorption band at 3596 cm−1 of the recrystallized quartz from Mt. Takamiyama, southwest Japan, Mineral. Mag., 63, 693–701, https://doi.org/10.1180/002646199548853, 1999.
Oide, K. and Fujita, Y.: Geology of the Iwanuma District. With geological sheet map at 1:50 000, Geol. Surv. Japan, 31 p., 1975 (in Japanese with English Abstract).
O'kane, A., Onasch, C. M., and Farver, J. R.: The role of fluids in low temperature, fault related deformation of quartz arenite, J. Struct. Geol., 29, 819–836, https://doi.org/10.1016/j.jsg.2007.01.003, 2007.
Otsuki, K.: Oblique subduction, collision of microcontinents and subduction of oceanic ridge: Their implications on the Cretaceous tectonics of Japan, Isl. Arc, 1, 51–63, https://doi.org/10.1111/j.1440-1738.1992.tb00057.x, 1992.
Palazzin, G., Raimbourg, H., Stüunitz, H., Heilbronner, R., Neufeld, K., and Précigout, J.: Evolution in H2O contents during deformation of polycrystalline quartz: An experimental study, J. Struct. Geol., 114, 95–110, https://doi.org/10.1016/j.jsg.2018.05.021, 2018.
Parrish, D. K., Krivz, A. L., and Carter, N. L.: Finite-element folds of similar geometry, Tectonophysics, 32, 183–207, https://doi.org/10.1016/0040-1951(76)90062-7, 1976.
Passchier, C. W. and Trouw, R. A. J.: Microtectonics, 2nd Ed. Springer-Verlag, Heidelberg, 2005.
Paterson, M. S.: The determination of hydroxyl by infrared absorption in quartz, silicate glasses and similar materials, B. Mineral., 105, 20–29, 1982.
Post, A., Tullis, J., and Yund, R. A.: Effects of chemical environment on dislocation creep of quartzite. J. Geophys. Res.-Sol. Ea., 101, 22143–22155, https://doi.org/10.1029/96JB01926, 1996.
Rutter, E. H. and Brodie, K. H.: The role of tectonic grain size reduction in the rheological stratification of the lithosphere, Geol. Rundsch., 77, 295–308, https://doi.org/10.1007/BF01848691, 1988.
Shimizu, I.: Theories and applicability of grain size piezometers: The role of dynamic recrystallization mechanisms, J. Struct. Geol., 30, 899–917, https://doi.org/10.1016/j.jsg.2008.03.004, 2008.
Shimizu, I.: Steady-state grain size in dynamic recrystallization of minerals, in: Recrystallization, edited by: Sztwiertnia, K., InTech, Rijeka, Croatia, 371–386, https://doi.org/10.5772/33701, 2012.
Skemer, P., Warren, J. M., Hansen, L. N., Hirth, G., and Kelemen, P. B.: The influence of water and LPO on the initiation and evolution of mantle shear zones, Earth Planet. Sc. Lett., 375, 222–233, https://doi.org/10.1016/j.epsl.2013.05.034, 2013.
Spear, F. S.: Metamorphic phase equilibria and pressure-temperature-time paths, Mineralogical Society of America, Washington, D. C., 1993.
Stalder, R.: OH point defects in quartz – a review, Eur. J. Mineral., 33, 145–163, https://doi.org/10.5194/ejm-33-145-2021, 2021.
Stenina, N. G.: Water-related defects in quartz, B. Geosci., 79, 251–268, 2004.
Stipp, M. and Tullis, J.: The recrystallized grain size piezometer for quartz, Geophys. Res. Lett., 30, 2088, https://doi.org/10.1029/2003GL018444, 2003.
Stipp, M., Stünitz, H., Heilbronner, R., and Schmid, S. M.: The eastern Tonale fault zone: a “natural laboratory” for crystal plastic deformation of quartz over a temperature range from 250 to 700 degrees C, J. Struct. Geol., 24, 1861–1884, https://doi.org/10.1016/S0191-8141(02)00035-4, 2002.
Stipp, M., Tullis, J., and Behrens, H.: Effect of water on the dislocation creep microstructure and flow stress of quartz and implications for the recrystallized grain size piezometer, J. Geophys. Res.-Sol. Ea., 111, B04201, https://doi.org/10.1029/2005JB003852, 2006.
Stünitz, H., Thust, A., Heilbronner, R., Behrens, H., Kilian, R., Tarantola, A., and Fitz Gerald, J. D.: Water redistribution in experimentally deformed natural milky quartz single crystals–Implications for H2O-weakening processes, J. Geophys. Res.-Sol. Ea., 122, 866–894, https://doi.org/10.1002/2016JB013533, 2017.
Thomas, S. M., Koch–Müller, M., Reichart, P., Rhede, D., Thomas, R., Wirth, R., and Matsyuk, S.: IR calibrations for water determination in olivine, r-GeO2, and SiO2 polymorphs, Phys. Chem. Miner., 36, 489–509, https://doi.org/10.1007/s00269-009-0295-1, 2009.
Tokle, L., Hirth, G., and Behr, W.M.: Flow laws and fabric transitions in wet quartzite, Earth Planet. Sc. Lett., 505, 152–161, https://doi.org/10.1016/j.epsl.2018.10.017, 2019.
Tarantola, A., Diamond, L. W., and Stünitz, H.: Modification of fluid inclusions in quartz by deviatoric stress I: experimentally induced changes in inclusion shapes and microstructures, Contrib. Mineral. Petr., 160, 825–843, https://doi.org/10.1007/s00410-010-0509-z, 2010.
Tsuchiya, N., Ohtomo,Y., Takeda, T., Sasaki, J., and Abe, M.: Late Carboniferous and Early Cretaceous adakitic granites from eastern margin of the Abukuma Mountains, J. Geol. Soc. Jpn., 119, 154–167, https://doi.org/10.5575/geosoc.2013.0033, 2013 (in Japanese with English Abstract).
Tsuchiya, N., Takeda, T., Tani, K., Adachi, T., Nakano, N., Osanai, Y., and Kimura, J.: Zircon U–Pb age and its geological significance of late Carboniferous and Early Cretaceous adakitic granites from eastern margin of the Aubukuma Mountains, Japan, J. Geol. Soc. Jpn., 120, 37–51, https://doi.org/10.5575/geosoc.2014.0003, 2014.
Trepied, L. and Doukhan, J. C.: Dissociated `a' dislocations in quartz, J. Mater. Sci., 13, 492–498, https://doi.org/10.1007/BF00541797, 1978.
Tullis, J.: Deformation of granitic rocks: Experimental studies and natural examples, Rev. Mineral. Geochem., 51, 51–95, https://doi.org/10.2138/gsrmg.51.1.51, 2002.
Twiss, R. J.: Theory and applicability of recrystallized grain size paleopiezometer, Pure Appl. Geophys., 115, 227–244, https://doi.org/10.1007/978-3-0348-5745-1_13, 1977.
Vityk, M. O., Bodnar, R. J., and Doukhan, J. C.: Synthetic fluid inclusions. XV. TEM investigation of plastic flow associated with reequilibration of fluid inclusions in natural quartz, Contrib. Mineral. Petr., 139, 285–297, https://doi.org/10.1007/s004100000142, 2000.
Watson, E. B. and Brenan, J. M: Fluids in the lithosphere, 1. Experimentally-determined wetting characteristics of CO2-H2O fluids and their implications for fluid transport, host-rock physical properties, and fluid inclusion formation, Earth Planet. Sc. Lett., 85, 497–515, https://doi.org/10.1016/0012-821X(87)90144-0, 1987.
Wilkins, R. W. T. and Barkas, J. P.: Fluid inclusions, deformation and recrystallization in granite tectonites, Contrib. Mineral. Petr., 65, 293–299, https://doi.org/10.1007/BF00375515, 1978.