the Creative Commons Attribution 4.0 License.
the Creative Commons Attribution 4.0 License.
 | 09 Aug 2024
Interseismic and long-term deformation of southeastern Sicily driven by the Ionian slab roll-back
Amélie Viger
Stéphane Dominguez
Stéphane Mazzotti
Michel Peyret
Maxime Henriquet
Giovanni Barreca
Carmelo Monaco
Adrien Damon
New satellite geodetic data challenge our knowledge of the deformation mechanisms driving the active deformations affecting southeastern Sicily. The PS-InSAR (Permanent Scatterer Interferometry Synthetic Aperture Radar) measurements evidence a generalized subsidence and an eastward tilting of the Hyblean Plateau, combined with a local relative uplift along its eastern coast. To find a mechanical explanation for the present-day strain field, we investigate short- and large-scale surface-to-crustal deformation processes. Geological and geophysical data suggest that the southward migration of the Calabrian subduction could be the causative geodynamic process. We evaluate this hypothesis using flexural modeling and show that the combined downward pull force, induced by the Ionian slab roll-back and the overloading of the Calabrian accretionary prism, is strong enough to flex the adjacent Hyblean continental domain, explaining the measured large-scale subsidence and eastward bending of the Hyblean Plateau. To explain the short-scale relative uplift evidenced along the eastern coast, we perform elastic modeling on identified or inferred onshore and offshore normal faults. We also investigate the potential effects of other deformation processes, including upwelling mantle flow, volcanic deflation, and hydrologic loading. Our results enable us to propose an original seismic cycle model for southeastern Sicily, linking the current interseismic strain field with available long-term deformation data. This model is mainly driven by the southward migration of the Ionian slab roll-back which induces a downward force capable of flexuring the Hyblean crust.
- Article
(14889 KB) - Full-text XML
-
Supplement
(19215 KB) - BibTeX
- EndNote


-
Recent satellite geodetic data shed new light on the origin of the active deformations affecting southeastern Sicily.
-
Several deformation processes, including crustal flexure and faulting, are investigated to determine the most reliable mechanical explanation.
-
Seismic cycle, surface, and crustal deformations of southeastern Sicily are mainly driven by the southward migration of the Ionian slab roll-back.
Geodetic measurements, instrumental seismicity, onshore/offshore geology, and geophysics all indicate that southeastern Sicily is actively deforming (e.g., Azzaro and Barbano, 2000; Mastrolembo Ventura et al., 2014; Meschis et al., 2020; Anzidei et al., 2021). This region also suffered the most powerful and devastating earthquake, the 1693 Mw∼7.4 Val di Noto earthquake, reported in the Italian seismicity catalog (Rovida et al., 2022). This earthquake is thought to have occurred offshore the eastern margin of the Hyblean Plateau, triggering a widespread tsunami (e.g., Azzaro and Barbano, 2000; Gutscher et al., 2006; Scicchitano et al., 2022). The current geologic and tectonic framework is in line with the Cenozoic geodynamic evolution of the central Mediterranean (Fig. 1) but also appears to be influenced by the Mesozoic pre-structuration of this region (e.g., Carminati and Doglioni, 2005; Frizon De Lamotte et al., 2011; Henriquet et al., 2020; Van Hinsbergen et al., 2020). In the Late Cretaceous, the Africa and Eurasia plate convergence initiated the subduction of the Alpine Tethys under the Apulia–Adria and Iberia plates, giving rise to the Alpine orogeny (e.g., Handy et al., 2010, 2015; Van Hinsbergen et al., 2020; Jolivet, 2023). During the early Cenozoic, the subduction experienced polarity reversal (e.g., Handy et al., 2010; Almeida et al., 2022) followed by, since at least the Oligocene, long-lasting slab roll-back, causing the drifting of continental micro-blocks detached from the Iberian margin and the opening of back-arc basins throughout the Mediterranean realm (e.g., Gueguen et al., 1998; Faccenna et al., 2001; Rosenbaum et al., 2002; Carminati et al., 2012; Van Hinsbergen et al., 2020). During the Mio-Pliocene (10–5 Myr), the collision between the southeastward-migrating Calabrian–Peloritan arc and associated Calabrian accretionary prism (CAP) with the northern African passive margin led to the formation of the Sicilian fold-and-thrust belt (e.g., Gueguen et al., 1998; Henriquet et al., 2020). During the Plio-Pleistocene (5–2 Myr), the Calabrian Arc and the retreating Ionian slab continued to interact strongly with the crustal structure of the African margin, particularly with the thick Pelagian continental Platform and the Malta Escarpment (Wortel and Spakman, 2000) (Fig. 1). These major tectonic domains, which originated during the Triassic period, were shaped by the fragmentation of Pangea in the Early Jurassic, leading to the opening of the Neo-Tethys Ocean (e.g., Stampfli et al., 2002). Nowadays, the Calabrian subduction zone keeps moving south but at a much slower rate, suggesting that the system as a whole is undergoing opposing forces and/or that its driving mechanism, slab roll-back, is losing its effectiveness.
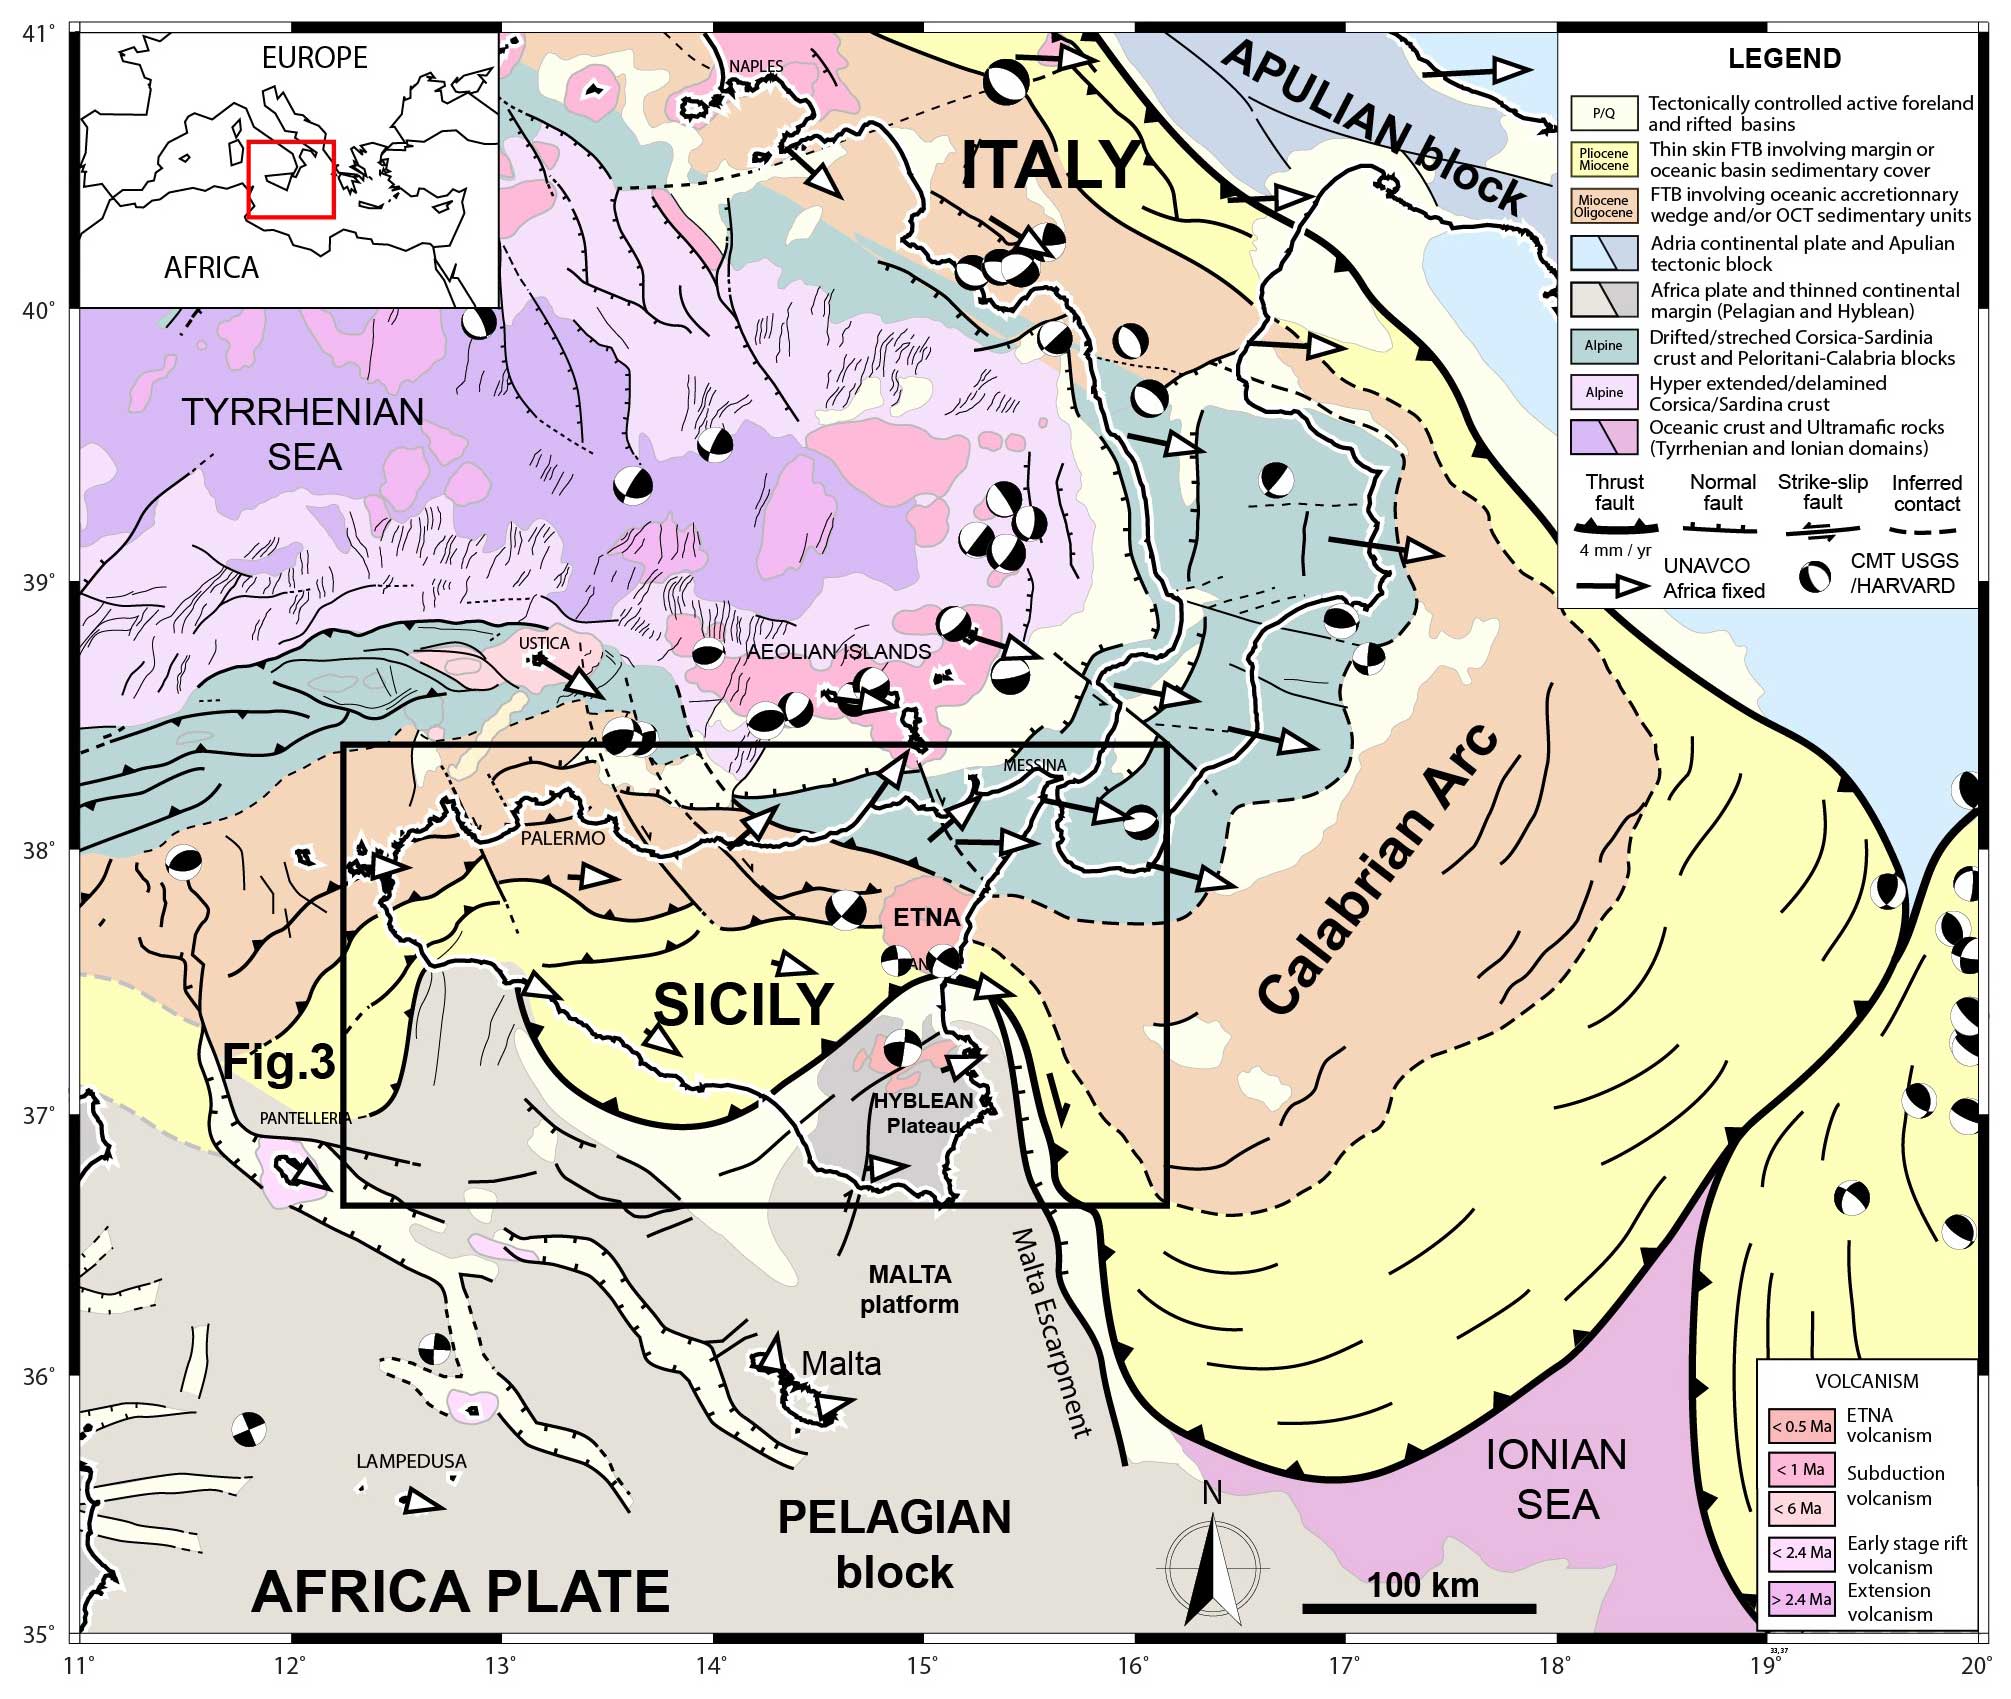
Figure 1Geodynamic and tectonic map of central Mediterranean (modified from Henriquet et al., 2020). Geological and structural data were synthesized from previous publications (e.g., Funiciello et al., 1981; Bigi et al., 1991; APAT, 2005; Finetti et al., 2005; Lentini and Carbone, 2014; Prada et al., 2014). Present-day centroid moment tensors (Mw>4.5) and global navigation satellite system (GNSS) data were retrieved from https://www.globalcmt.org/CMTsearch.html (last access: 15 April 2020) and https://www.unavco.org/data/gps-gnss/gps-gnss.html (last access: 15 April 2020), respectively.
Recent PS-InSAR (Permanent Scatterer Interferometry Synthetic Aperture Radar) satellite measurements (radar interferometry) published by Henriquet et al. (2022) have revealed an unexpected pattern of surface deformation across southeastern Sicily, particularly an eastward increasing subsidence of the whole Hyblean Plateau (Fig. 2). This region has been partially investigated in previous studies using similar techniques but only captured local surface deformation features (Canova et al., 2012; Vollrath et al., 2017). Up to now, the origin of such a pattern of deformation has remained, thus, unexplained. Since satellite measurements were acquired over a very short period compared to typical seismic cycle durations (5 years versus several hundreds of years), and considering the discrepancy between satellite measurements and inferred long-term coastal uplift estimations (e.g., Bianca et al., 1999; Ferranti et al., 2006, 2010; Scicchitano et al., 2008; Meschis et al., 2020) (Fig. 2a), we hypothesize that the satellite data are representative of the interseismic period. We further infer that the PS-InSAR data mainly document elastic loading mechanisms and reversible deformations. To explain the geodetic observations, we investigate the surface deformation signature of crustal and lithospheric deformation processes, including the impact of the southward migration of the Calabrian subduction system on the structural evolution of the eastern Hyblean margin, as well as elastic loading and aseismic creep on coastal and offshore normal faults. We also test the potential surface expression of other processes, such as volcanic deflation, hydrologic loading, and upwelling mantle flow.
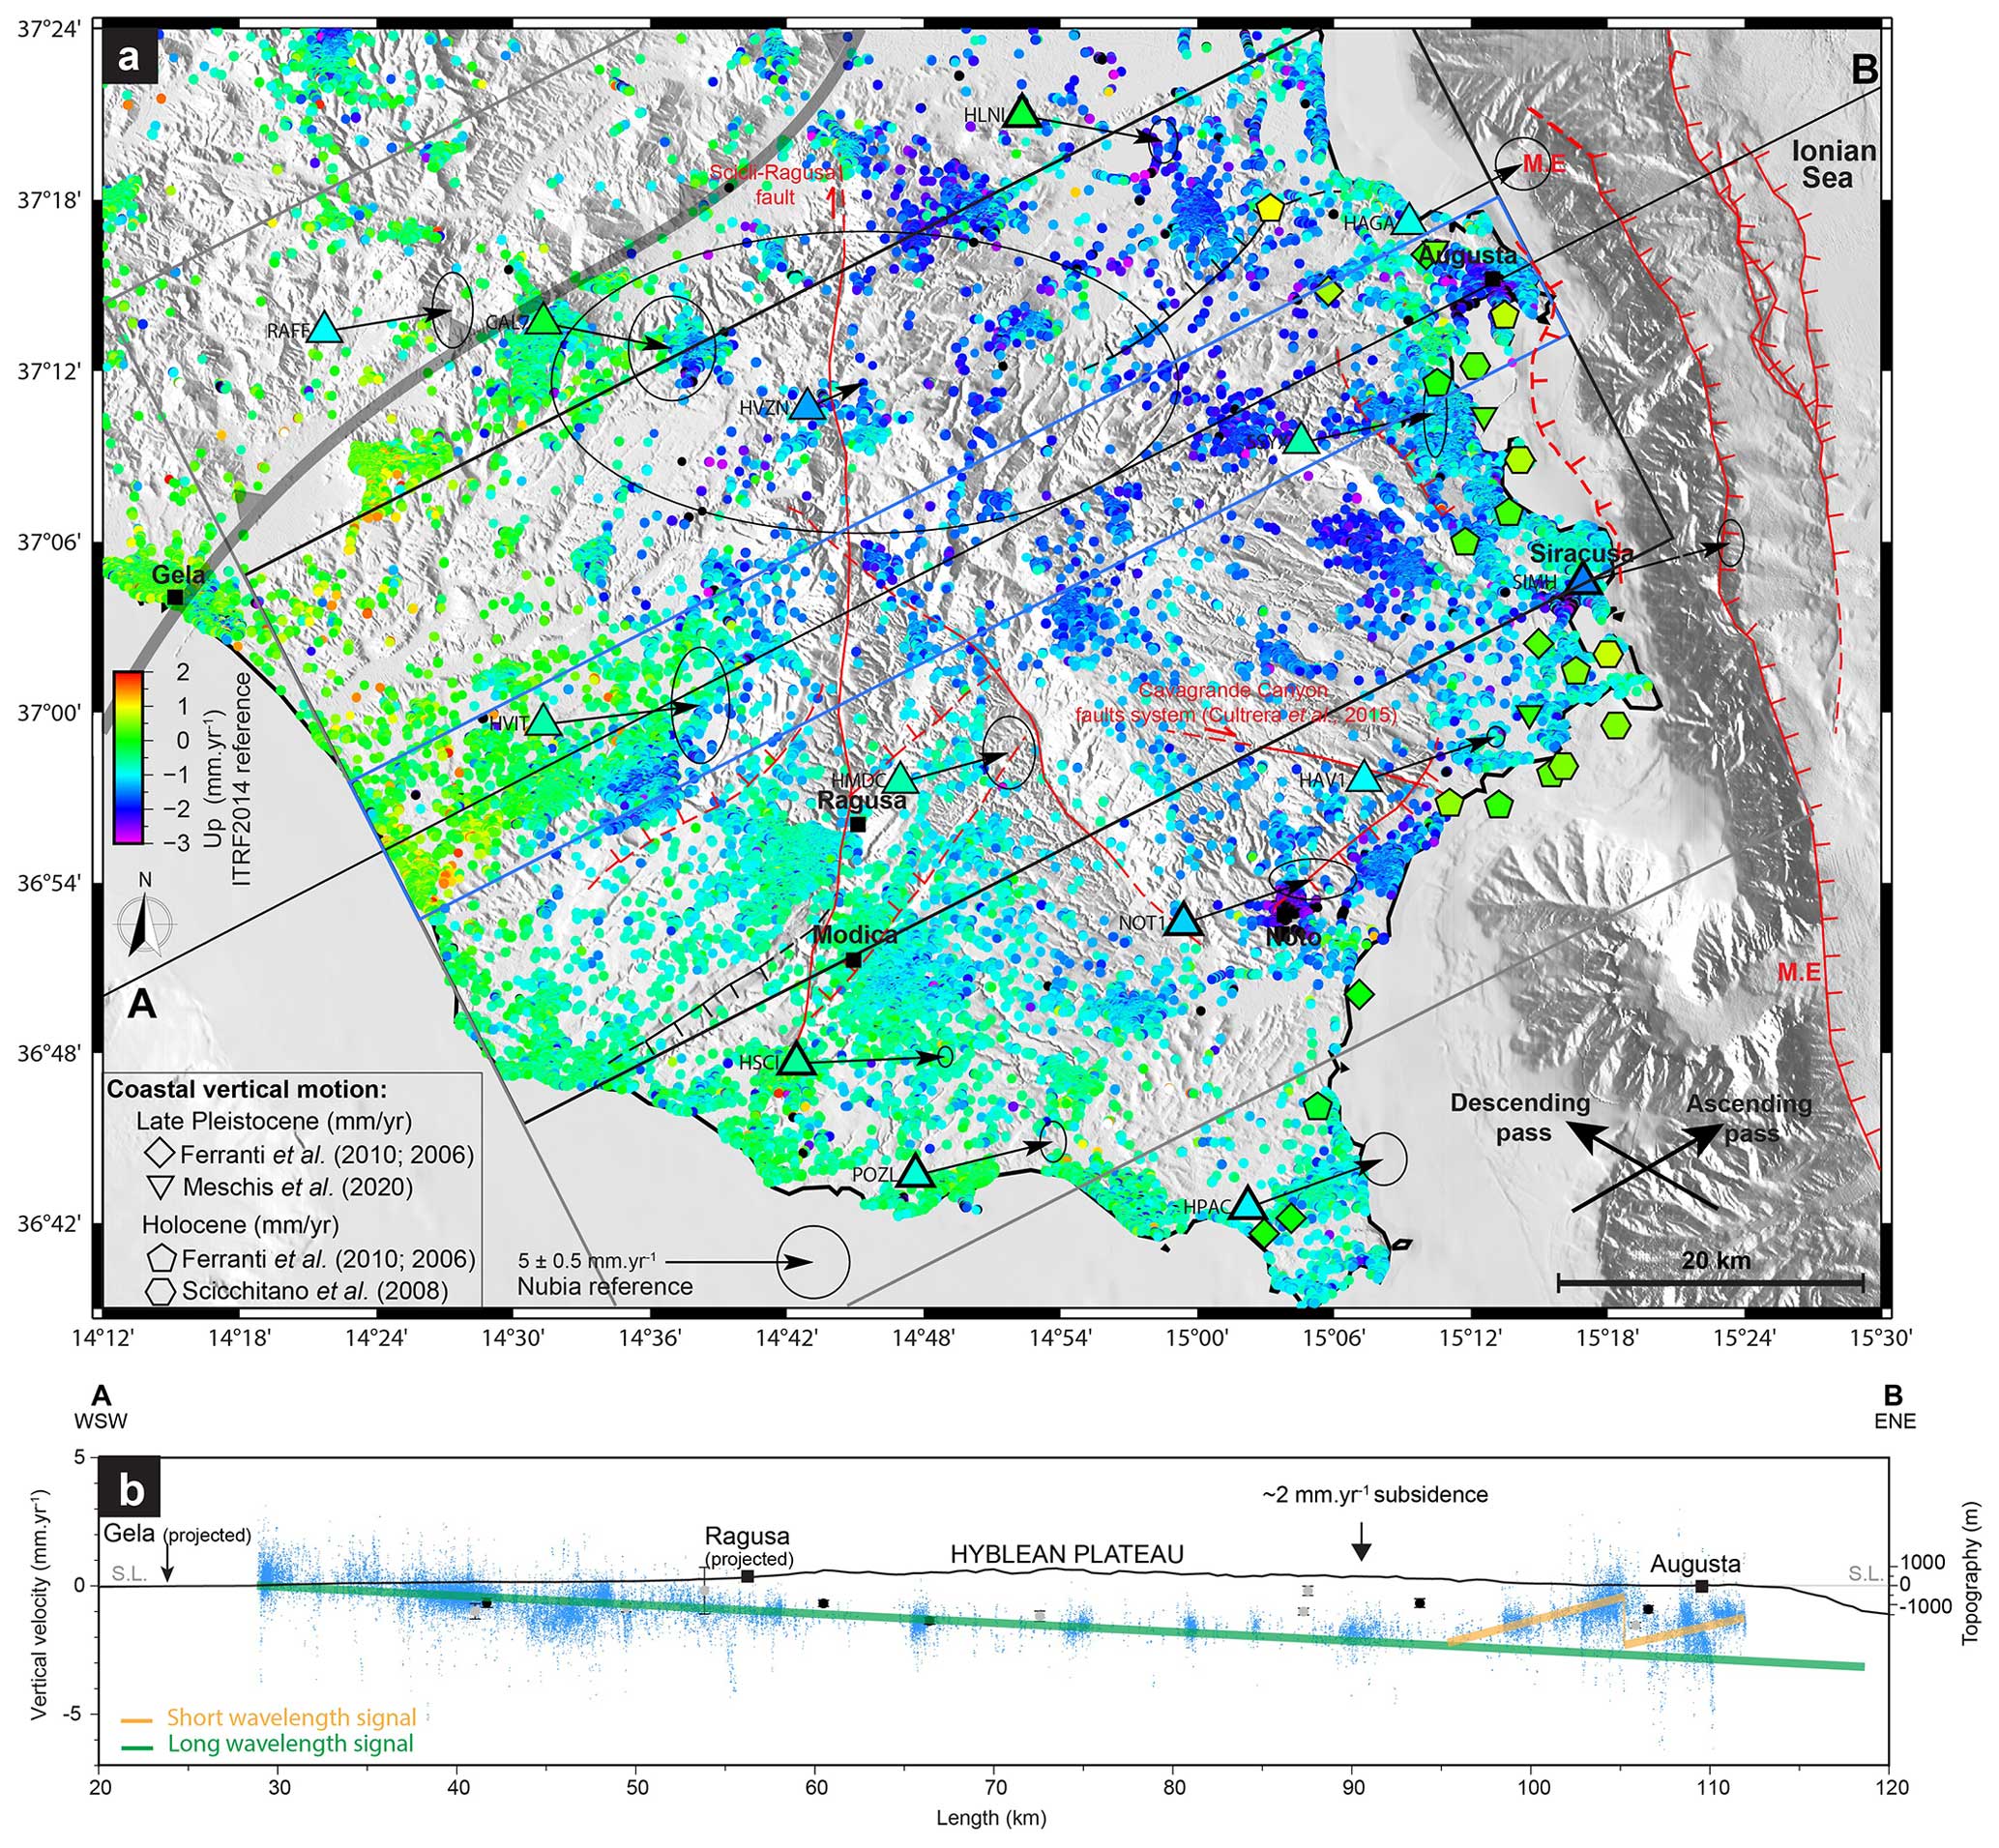
Figure 2Geodetic data across the Hyblean Plateau region (see the location in Fig. 3). (a) Permanent-scatterer (PS-InSAR 2015–2020) pseudo-3D vertical (up) velocities in map view from Henriquet et al. (2022). GNSS 3D surface velocities are derived from a reanalysis of the Nevada Geodetic Laboratory (NGL) data (horizontal component reference: fixed Nubia; up component reference: ITRF2014). Major faults of the Hyblean Plateau (HP) and Malta Escarpment (ME), including the offshore normal faults identified by Bianca et al. (1999) and Argnani and Bonazzi (2005) and recently analyzed by Gambino et al. (2021) (red is the active fault; dashed red is the inferred active fault; black is the inferred aseismic slip from Spampinato et al., 2013). (b) SW–NE-trending velocity profile showing surface velocity (up) derived from PS-InSAR and GNSS stations' vertical velocities. We observed a long-wavelength signal (in green) and a short-wavelength signal at the eastern part of the HP (in orange) along the AB profile, and a similar surface deformation is observed to the south of the AB profile (Fig. S1). PS-InSAR data are stacked across a 5 km width on both sides of the AB profile (in blue). GNSS data are stacked using 20 km (in black) and 40 km (in gray) widths on both sides of the AB profile. Topographic and bathymetric profiles are presented without vertical exaggeration (VEx1).
The kinematics and active tectonics in SE Sicily are still a matter of debate, with marked developments in the last decade (e.g., Bianca et al., 1999; Argnani et al., 2012), in particular with the acquisition of high-resolution bathymetry and seismic reflection/refraction profiles in the adjacent Ionian domain (Argnani and Bonazzi, 2005; Gutscher et al., 2016; Dellong et al., 2020) and seismotectonic analysis (e.g., Gambino et al., 2021, 2022b). The main reasons include the complex polyphased geological history of this region and the relatively low present-day horizontal strain rate (<5 mm yr−1) resulting from the culmination of the Calabrian Arc and African margin collision and the subsequent slowdown of the Calabrian subduction (roll-back and back-arc extension) in the last million years (Goes et al., 2004; D'Agostino et al., 2011; Zitellini et al., 2020).
2.1 Geodesy
Geodetic surface measurements in SE Sicily include GNSS (e.g., Palano et al., 2012), PS-InSAR/DInSAR (Differential Interferometry Synthetic Aperture Radar) (e.g., Vollrath et al., 2017), and leveling datasets (e.g., Spampinato et al., 2013).
2.1.1 PS-InSAR
In the present study, we use the first geodetic velocity field covering the whole island of Sicily published by Henriquet et al. (2022) and derived from Sentinel-1 radar satellite (InSAR data) acquired during the 2015–2020 period. The PS-InSAR pseudo-3D velocity field (up and E–W component) was obtained by merging ascending and descending acquisitions combined with a reanalysis of the GNSS time series. Due to the acquisition geometry, the Sentinel-1 radar satellite is not sensitive to the N–S component of horizontal surface deformation, which is, fortunately, very low in the studied region (Henriquet et al., 2022). We therefore consider that, even if affected by minor distortions, the up and E–W components of the pseudo-3D velocity data can be used with confidence (Figs. S2–S5). The vertical (up) component of this dataset reveals that the central and eastern parts of the Hyblean Plateau experience subsiding rates increasing eastward from 1 to nearly 3 mm yr−1 relative to the western coast (Figs. 2 and S1 in the Supplement). It should be noted that PS-InSAR data also show a slowly decreasing E–W component to the east of the Hyblean Plateau with velocities evolving from 3 to 2 mm yr−1 (Fig. 10; Henriquet et al., 2022).
One should note that the zero reference of the PS-InSAR vertical velocity field is not precisely known. The vertical component of the pseudo-3D PS-InSAR velocity field and GNSS data have a ±0.5 mm yr−1 uncertainty in the ITRF2014 (Altamimi et al., 2016), which implies that the observed subsidence over the Hyblean Plateau could be a little bit higher or slower. In the last case, slow uplift rates could be present in the Gela region. The vertical velocity trend is obtained by projecting and stacking the PS-InSAR data across a 5 km wide band along an N30° E AB profile (Fig. 2b). Along this profile, oriented perpendicular to the main regional faults, the subsidence velocity reaches, on average, ∼1 mm yr−1 between Gela and Ragusa and increases progressively to ∼2.5 mm yr−1 between Ragusa and Augusta. All along the eastern coast, geodetic data evidence a significantly slower subsidence (or a relative uplift). From Augusta to Siracusa, and in the southernmost part of the Hyblean Plateau (HP), the subsidence rate decreases to about 1 mm yr−1 compared to the maximum subsidence rate in the central Hyblean Plateau (Fig. 2). In the Gela region, PS-InSAR vertical velocities indicate a possible slow uplift rate of ∼0.5 mm yr−1 (Fig. 2). To the south of the AB profile, a similar surface deformation pattern is observed; an eastward increase in subsidence rates evolving towards a similar relative uplift in the coastal (Siracusa) region (profile CC′; Fig. S1).
Along the AB velocity profile, neither the Scicli–Ragusa-inferred active fault (Vollrath et al., 2017) nor the other major faults of the Hyblean Plateau can be evidenced in the E–W and vertical components of the PS-InSAR data (Henriquet et al., 2022) (Fig. 2a), indicating that these faults are locked or are creeping at a slip rate lower than the PS-InSAR resolution (±0.5 mm yr−1). Locally, fast-subsiding (≫3 mm yr−1) zones, most probably related to human activities such as water pumping (Canova et al., 2012), can be identified near the main cities of Augusta, Siracusa, and Noto (Fig. 2a).
Surface deformation signals extending over a hundred or more kilometers are most probably related to crustal or lithospheric-scale processes (e.g., Stephenson et al., 2022), whereas those extending over tens of kilometers are likely associated with much shallower and localized mechanical processes such as seismic cycle deformation, volcanic bulging/collapse, hillslope instabilities (landslides), or human activities (water pumping and mining) (e.g., Vilardo et al., 2009). We therefore hypothesize that the PS-InSAR vertical velocity field consists of two superimposed signals: (1) a long-wavelength (>100 km) subsidence and gradual eastward tilt of the Hyblean Plateau (green line in Fig. 2b), compatible with the decreasing PS-InSAR E–W velocities, and (2) a short-wavelength signal, extending along the eastern coast and characterized by sharp variations in the vertical velocities at kilometric scale (orange lines in Fig. 2b).
2.1.2 GNSS
The global navigation satellite system (GNSS) data used to calibrate the pseudo-3D PS-InSAR velocity field (Henriquet et al., 2022) were based on the analysis of time series retrieved from the Nevada Geodetic Laboratory (Blewitt et al., 2018). We refine this analysis by correcting for annual and semiannual seasonal signals, instantaneous offsets, and gaps using the time-series-inversion software developed by Masson et al. (2019). Across the Hyblean Plateau, GNSS velocities show horizontal velocities of ∼2 mm yr−1 oriented homogeneously toward the ENE in the Nubia reference frame (Fig. 2). The vertical component of most of the GNSS stations shows an overall subsidence of the HP (−0.8 mm yr−1 on average) in the ITRF2014 reference frame (Altamimi et al., 2016). This tendency is well illustrated by the high-quality NOT1 GNSS station located near the city of Noto, which has recorded the longest time series (23 years; 2000–2023), or by the SSYX and HMDC stations (Figs. S2 and S3). Overall, the GNSS vertical velocities are consistent with the median of the PS-InSAR vertical velocities calculated over a 3×3 km2 region centered on each GNSS station (Figs. S2–S5).
To estimate the regional horizontal strain rate tensor, we processed the GNSS dataset using the inversion model of Mazzotti et al. (2005). The Hyblean Plateau is characterized by an extension rate oriented N55° E ± 1° (close to the AB profile direction) and a shortening rate oriented N145° E ± 1° (Fig. S6), consistent with the focal mechanism inversion (Fig. 3).
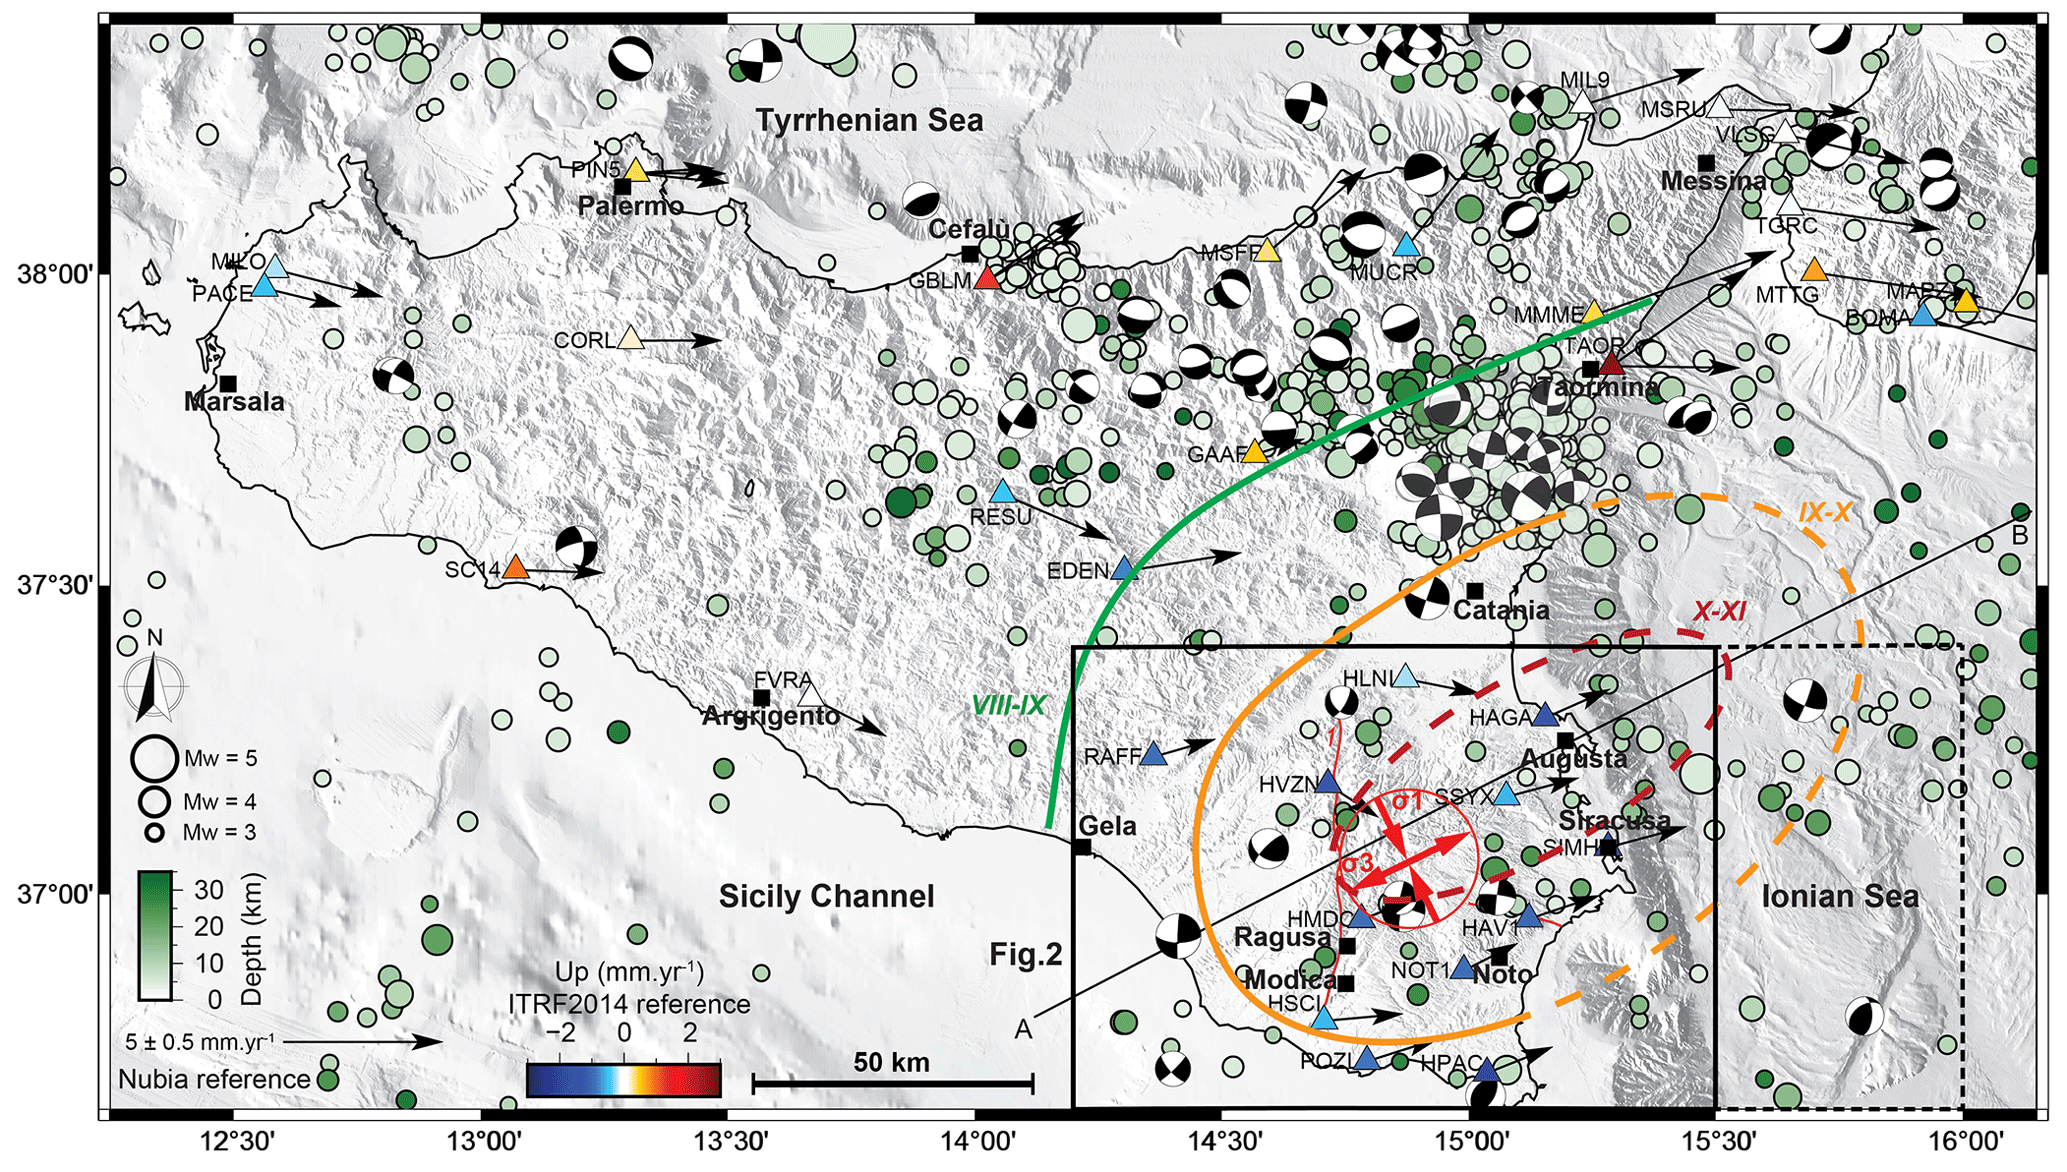
Figure 3Instrumental seismicity of Sicily at crustal scale (0–30 km depth), showing earthquake hypocentral locations and focal mechanism solutions of M>3 events from 1985 to 2022 (INGV, 2005; Scognamiglio et al., 2006). 3D surface velocity derived from GNSS time series published in Henriquet et al. (2022) (horizontal component reference: fixed Nubia; up component reference: ITRF2014). Macroseismic intensity data of the 1693 Val di Noto Earthquake (M∼7.4) from INGV CPTI15 database (Rovida et al., 2022) (dashed red line is the X–XI intensity; dashed orange line is the IX–X intensity; dashed green line is the VIII–IX intensity). Focal mechanism stress inversion (red arrows) for the Hyblean Plateau region (black frame) and Ionian Sea (dashed black frame) using Michael's method (Vavryčuk, 2014; Levandowski et al., 2018). The AB profile shows the location of the PS-InSAR profile and synthetic structural cross section presented in Figs. 2 and 4.
2.2 Seismology
The instrumental seismicity map of SE Sicily, derived from INGV and the Rovida et al. (2022) datasets (Fig. 3), shows minor to moderate events (M<5) with deep crustal hypocenters (15–30 km). Over the Hyblean Plateau, earthquake hypocenters tend to roughly align along the inferred active, N–S trending, Scicli–Ragusa strike-slip fault (e.g., Vollrath et al., 2017) and near the Cavagrande Canyon fault system (Cultrera et al., 2015) (Fig. 3). Most of these faults are probably inherited from the Plio-Quaternary tectonomagmatic phase of deformation (Henriquet et al., 2019) and were partly re-activated in response to the ongoing Africa–Nubia/Eurasia plate convergence (e.g., Mattia et al., 2012; Cultrera et al., 2015). In this framework, the identification of the seismogenic source that triggered the 1693 event remains debated (e.g., Argnani and Bonazzi, 2005; Bianca et al., 1999). The isoseists of the Mw∼7.4 Noto earthquake appear largely open toward the Malta Escarpment and Ionian Sea domains, suggesting the seismogenic fault is located offshore (Fig. 3). East of the Hyblean Plateau, earthquakes essentially distribute along the Malta Escarpment where a normal fault system, potentially responsible for the 1693 earthquake, has been identified (e.g., Bianca et al., 1999; Argnani and Bonazzi, 2005; Gambino et al., 2021, 2022b) (Fig. 3).
The focal mechanisms over the Hyblean Plateau have dominant strike-slip characteristics, contrasting with the extensional deformation characterizing the NE corner of Sicily (Fig. 3).
To estimate the present-day regional stress field across SE Sicily, we analyzed the available focal mechanisms using Vavryčuk's numerical model (Vavryčuk, 2014; Levandowski et al., 2018) that is based on Michael's method (Michael, 1984). Results show that the regional stress across SE Sicily (Fig. 3) is homogeneous (Figs. S7 and S8). The maximum compressive stress (σ1) is horizontal and oriented N154° E ± 7°, compatible with the N160° E Africa/Eurasia plate convergence (e.g., Mattia et al., 2012; Kreemer et al., 2014). The minimum stress (σ3) is oriented N64° E ± 7°, compatible with the extension rate derived from GNSS data inversion (Fig. 3).
If this regional stress field is compatible with the PS-InSAR surface deformation data (E–W bending generating extensional stress), it does not explain the observed eastward-increasing subsidence rate across the HP.
2.3 Synthetic structural profile
To constrain the deep structure and rheology of the studied area, we synthesize the available geological and geophysical data into a 200 km long simplified crustal-scale structural cross section following the N30° E AB profile. This section incorporates part of the Hyblean Platform, the Malta Escarpment, the western Ionian domain, and cuts, almost perpendicularly, the offshore normal faults along the Malta Escarpment and the Alfeo and Ionian strike-slip fault systems, extending eastward (Figs. 2–4). The eastern part of the synthetic structural profile is mainly based on seismic refraction profiles from Dellong et al. (2018, 2020), particularly the DY-P3 profile running sub-parallel to the AB profile and located 20 km further north, as well as seismic reflection profiles from Argnani et al. (2012), Gutscher et al. (2016), Tugend et al. (2019), Gambino et al. (2021), and Gambino et al. (2022b) (Fig. 4c). The structure of the western section is constrained by onshore and offshore geology, well log stratigraphy, geophysics, seismic reflection profiles, and geological cross sections from the ViDEPI (2016) project, Lentini and Carbone (2014), Lipparini et al. (2023), Scarfì et al. (2018), Henriquet et al. (2019), and Finetti et al. (2005).
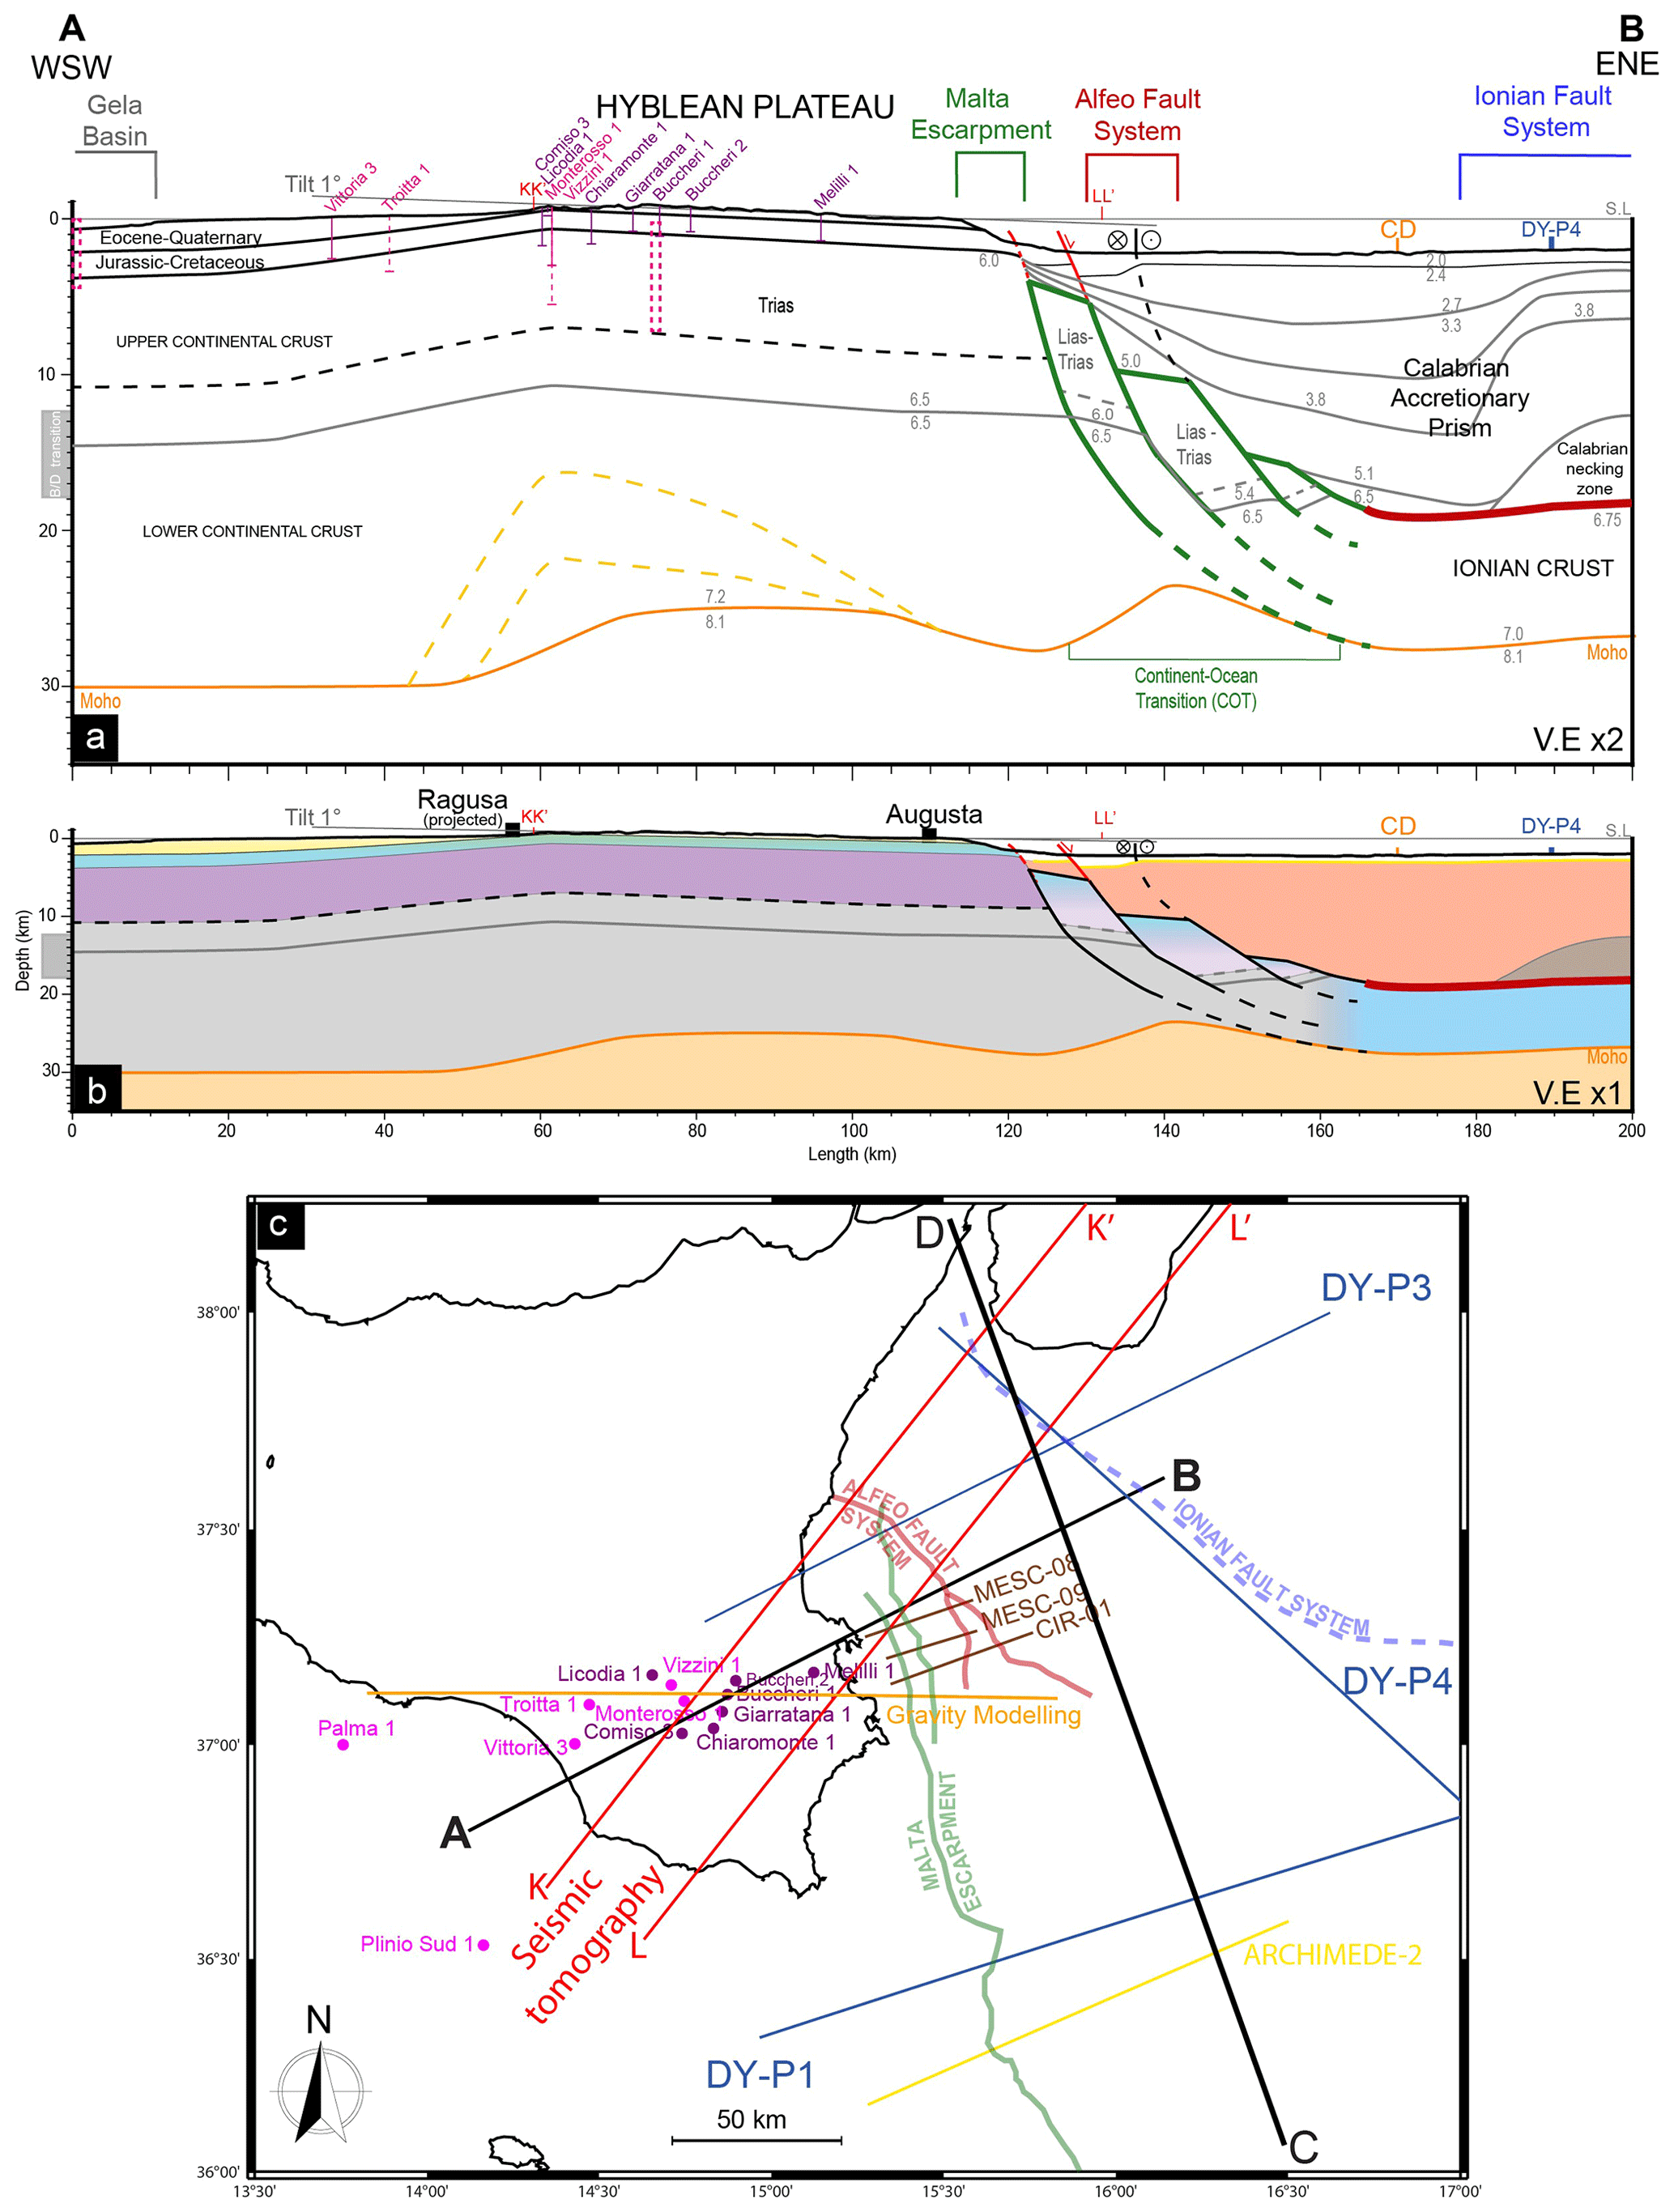
Figure 4Simplified crustal cross section along the N30° E AB profile (see Figs. 4c and 2 for the location). (a) Two times vertically exaggerated synthetic structural profile, along with seismic velocity data, showing the structure and rheology of the Hyblean Plateau and western oceanic domain determined from onshore and offshore geology, well stratigraphy, geophysics, seismic reflection, and refraction profiles (see Fig. S9 for references). Note the 1° tilt of the Hyblean Plateau topography toward the east. The red line corresponds to the inferred position of the main subduction décollement, and the green lines refer to our interpretation of tilted blocks from the Malta Escarpment (ME). (b) The synthetic structural profile shows the potential geological layers and structural deduced by, essentially, well data for onshore domain and seismic refraction for offshore domain profiles, respectively, without vertical exaggeration (VEx1). (c) Locations in the map view of the AB profile, well data, tomography profile, refraction, and reflection seismic profiles.
In the Hyblean domain, geophysical data (e.g., Sgroi et al., 2012; Milano et al., 2020) indicate that the crust has an average thickness of ∼30–35 km, with a notable difference in the Hyblean Plateau region marked by a huge positive Bouguer anomaly. Based on gravity data modeling, Henriquet et al. (2019) showed that this gravity anomaly can be explained by a 100 km large, high-density, and lower-crustal body, compatible with a local Moho uplift to a depth of about 20–25 km. This last interpretation also seems to be supported by recent tomographic data (Scarfì et al., 2018). We constrain the geometries of the Quaternary to Mesozoic sedimentary units of the Hyblean Platform and Gela basin, and these are constrained using the Monterosso 1, Plinio Sud 1, Troitta 1, Vittoria 3, and Vizzini 1 wells from the ViDEPI (2016) project (in pink; Figs. 4c and S9); the Chiaramonte 1 and Mellili 1 wells from Lentini and Carbone (2014); and Buccheri 1–2, Comiso 3, Giarratana 1, and Licodia 1 wells from Lipparini et al. (2023) (in purple; Figs. 4c and S9). We also used the top of the Upper Triassic (Gela formation) isobaths published by Lipparini et al. (2023).
In the DY-P3 seismic refraction profile (Dellong et al., 2018), the 6.0 and 6.5 km s−1 velocity contours delimit two main steps deepening eastward at the junction between the Hyblean continental and Ionian oceanic domains (Fig. 4a and b). Considering their locations along the Malta Escarpment that outline the continent–ocean transition (COT), we interpret these velocity variations as the deepening of the sediment/basement boundary, potentially related to tilted blocks of thinned continental crust formed during the Permo-Triassic–Early Jurassic rifting phase (see Sect. 1) (e.g., Scandone et al., 1981; Minelli and Faccenna, 2010; Dellong et al., 2018; Tugend et al., 2019). Our interpretation of tilted blocks at the continent–ocean transition is consistent with similar considerations analyzing seismic reflection/refraction profiles (e.g., Afilhado et al., 2015; Sapin et al., 2021; Klingelhoefer et al., 2022).
As documented in Argnani and Bonazzi (2005), Gutscher et al. (2016), and Gambino et al. (2021, 2022b), the seismic reflection profiles (MESC-O6, MESC-11, CIR-01, MESC-08, and MESC-09) show several normal faults bounding and crossing the Turbiditic Valley, extending along the base of the Malta Escarpment (Gutscher et al., 2016). The Turbiditic Valley fault system is constituted by three parallel normal faults, ∼60 km long, producing a marked morphological offset of the Ionian seafloor from the latitudes of Catania to Siracusa (Fig. 4a and b). These faults dip 35–50° to the east and most probably merge at depth into a single major fault plane (Argnani and Bonazzi, 2005; Argnani, 2021; see MESC-08 and MESC-09 seismic reflection profiles in Gambino et al., 2021). These offshore normal faults could be linked to the recent re-activation of crustal faults at the ocean–continent transition inherited from the Early Mesozoic rifting phase (Fig. 4a and b).
On the eastern side of the Hyblean domain, the Moho is constrained by DY-P3 and DY-P1 refraction profiles to a depth of ∼30 km below the Malta Escarpment. To the east, in response to the bending of the Ionian slab, the Moho deepens northward from 20 km (DY-P1) to 32 km (DY-P3). Based on these data and the DY-P4 refraction profile (Dellong et al., 2020), we estimate the depth of the Moho below the Ionian oceanic crust to be about 25–30 km in the eastern part of the AB synthetic profile. In this region, the domain delimited by the seismic refraction velocities of 3.8–5.1 km s−1 has been interpreted as corresponding to the deformed sediments of the Calabrian accretionary prism (CAP) (Dellong et al., 2018). Its thickness increases from 5 km (DY-P1) to 15 km (DY-P3), and it is evaluated to be ∼15 km along the AB profile (Fig. 4a and b). Note that a portion of the southern termination of the Calabrian Arc (i.e., Hercynian basement) is probably present in the AB profile according to the seismic refraction DY-P4 profiles (Dellong et al., 2020) (Fig. 4a and b). The location of the main subduction décollement along the AB profile has been estimated at a depth of ∼20 km (thick red line in Fig. 4a), using the velocity of 6.75 km s−1 seismic refraction in the DY-P3 and DY-P4 profiles (Dellong et al., 2018).
To explain the long-wavelength bending trend evidenced by the PS-InSAR up component, we model the flexure of the Hyblean Plateau induced by the (1) overloading of the continent–ocean transition (COT) domain in response to the SE migration of the very thick Calabrian accretionary prism (CAP) and by the (2) forcing of the subsidence of the COT due to the local increase in the slab pull force imposed by the southward roll-back of the Ionian subduction. We hypothesize that these crustal/lithospheric deformation mechanisms may be strong enough to bend the adjacent Hyblean domain and induce the large-scale subsidence and tilt evidenced by the geodetic data (PS-InSAR and GNSS) (Fig. 2b). In addition, we test interseismic loading models on several onshore and offshore east-dipping normal faults, such as the Augusta–Siracusa fault, the Malta Escarpment, and the active faults documented by Bianca et al. (1999), Argnani and Bonazzi (2005), Gutscher et al. (2016), and Gambino et al. (2021, 2022b) to explain the short-wavelength deformation signal (relative uplift) extending along the eastern coast of the Hyblean Plateau (Fig. 2b).
3.1 Lithospheric flexure along a NNW–SSE profile
To better constrain key flexural parameters, such as the rigidity of the Hyblean and Ionian crust/lithospheres and the slab pull force, and to investigate the impact of the Ionian slab roll-back, we first model the bending of the subducting Ionian slab along a NNW–SSE profile (CD profile) trending orthogonal to the AB profile (Fig. 5a). We compare the Ionian slab geometries with the Hayes et al. (2018) and Maesano et al. (2017) datasets, with the depth of the top oceanic crust from the Dellong et al. (2018) seismic refraction data (Fig. S10). In the southern part of the CD profile, the Maesano et al. (2017) dataset indicates shallower depths (∼5 km) compared to the Hayes et al. (2018) and Dellong et al. (2018, 2020) data because the main décollement jumps away from the top of the Ionian oceanic crust to a higher level in the sedimentary cover (Fig. S10). Note that in the northern part of the CD profile, the Maesano et al. (2017) dataset indicates also a shallower depth compared to the Hayes et al. (2018) dataset.
Finally, we decided to use, as a structural reference, the isobaths of the top of the Ionian slab published by Hayes et al. (2018) because it correlates with the top of the oceanic crust depths derived from the seismic refraction data (Dellong et al., 2018, 2020) (Fig. 5a).
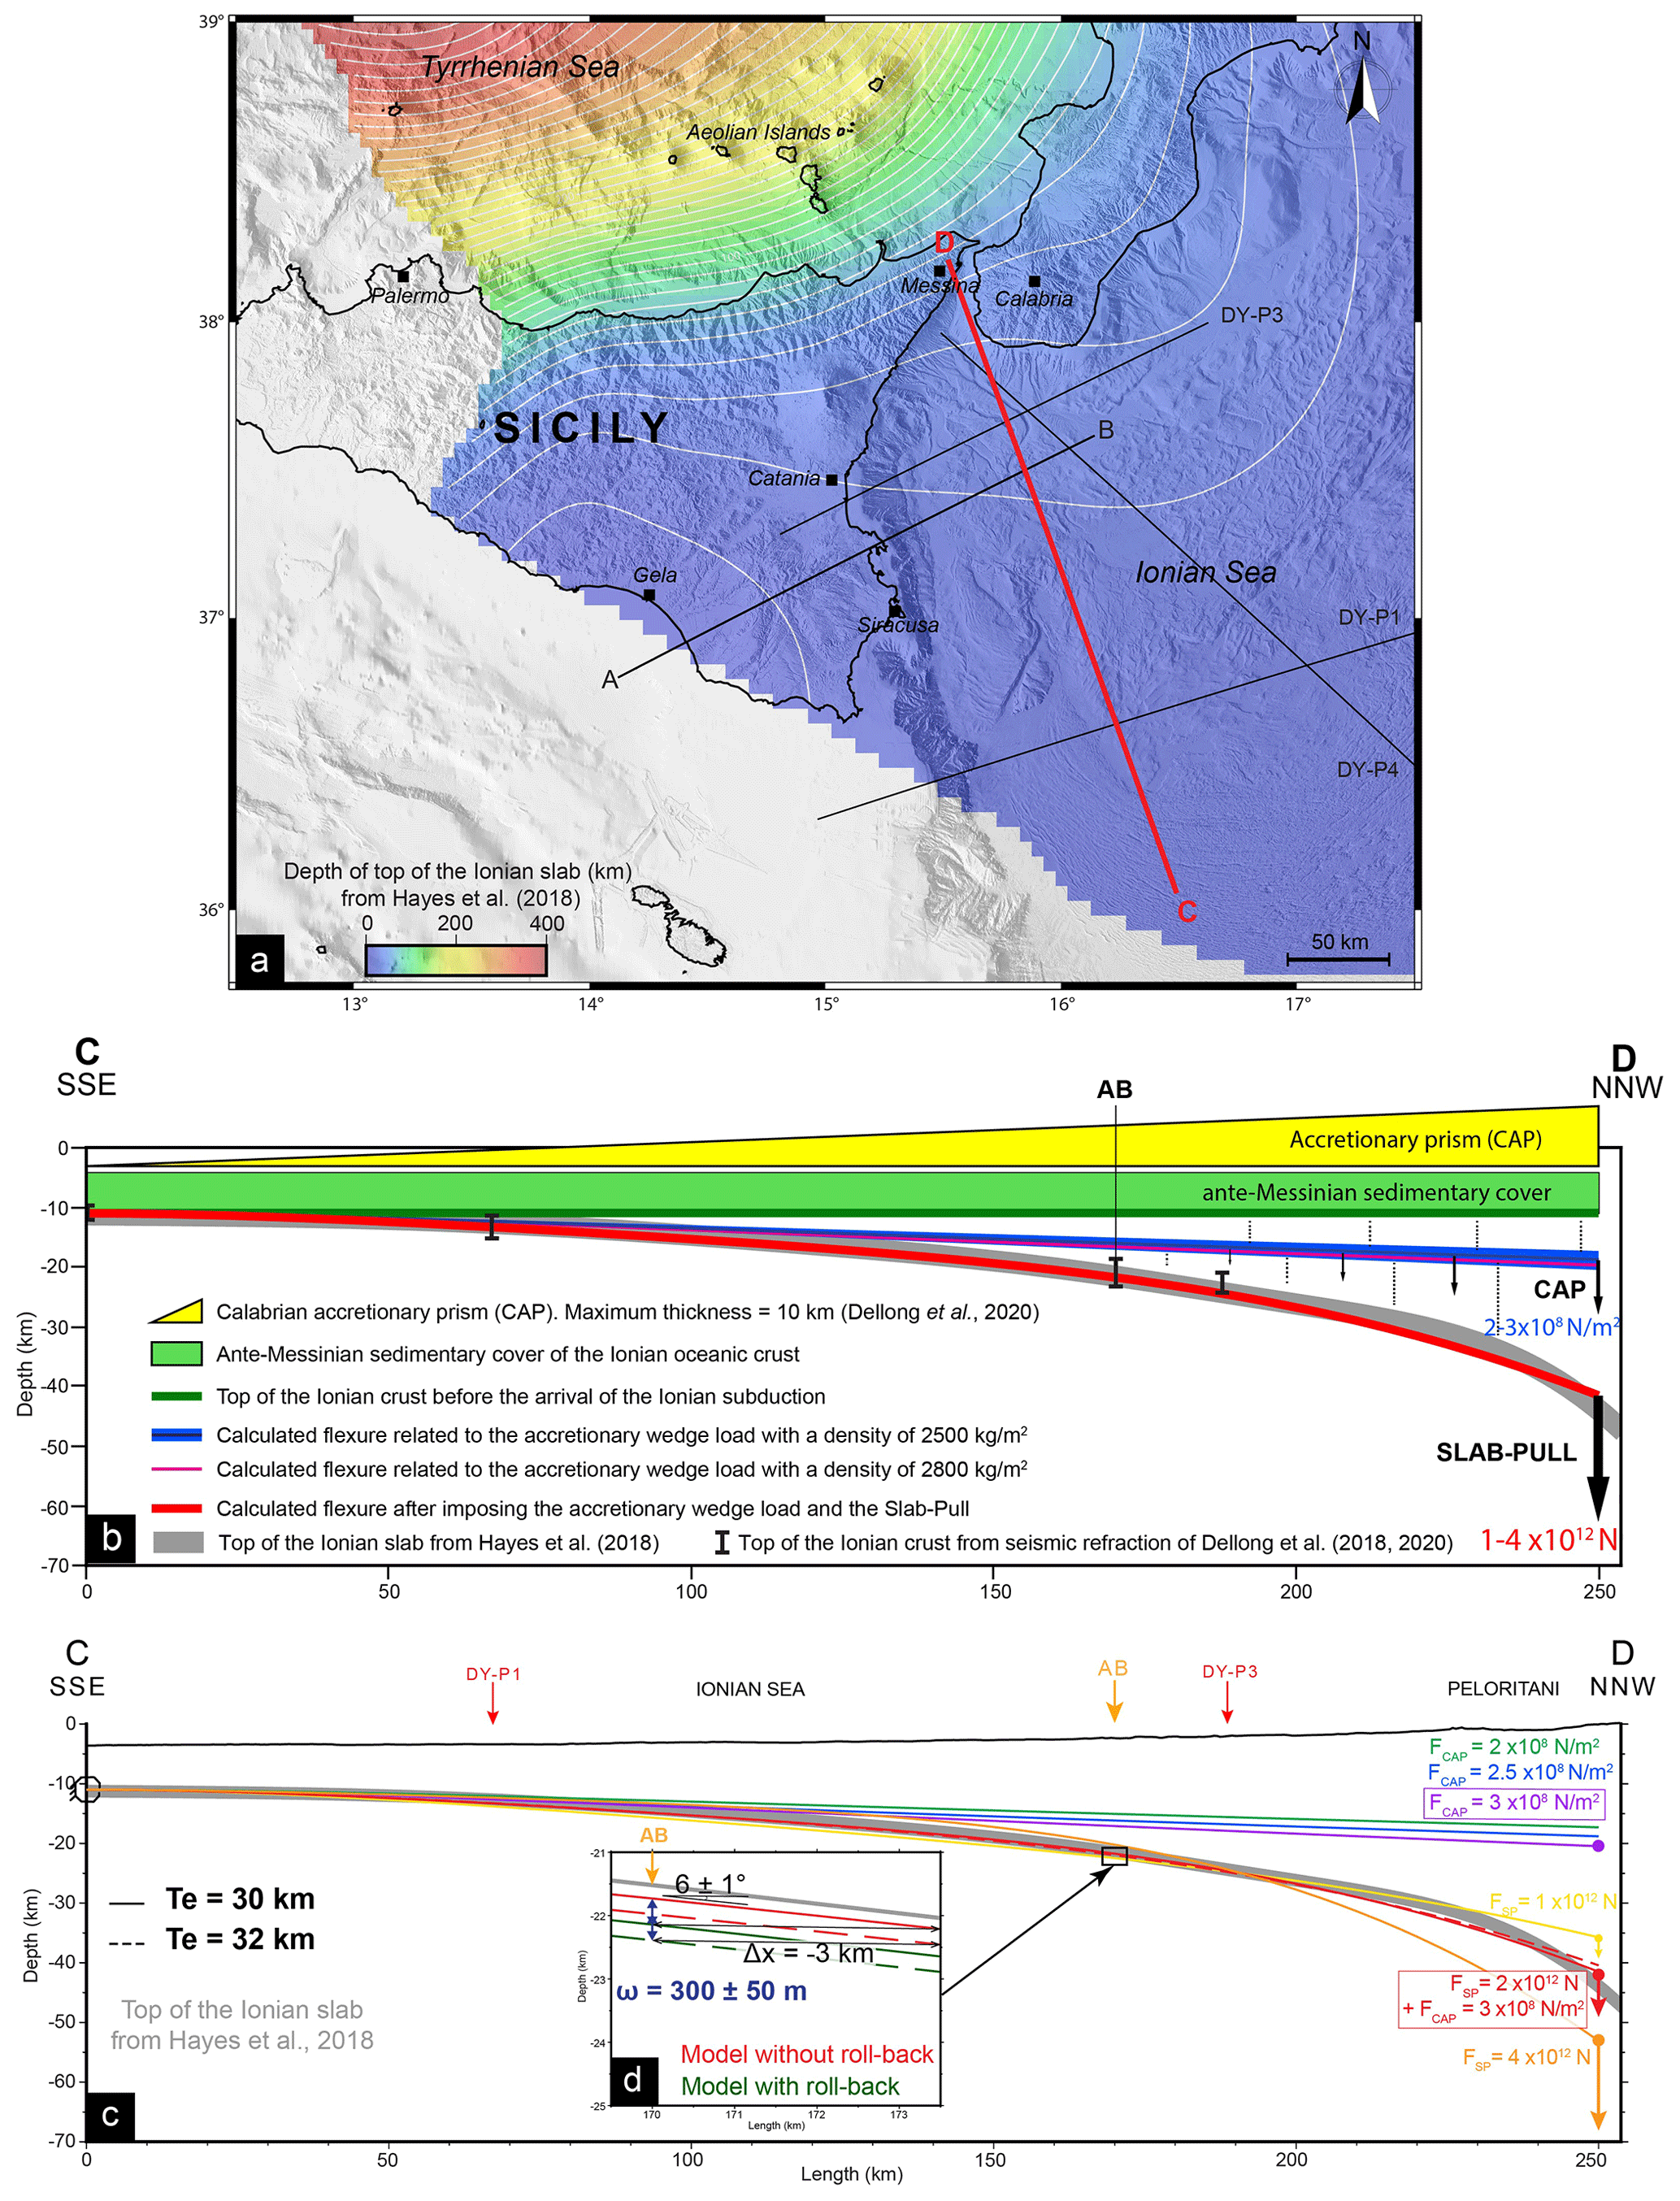
Figure 5(a) Map and isobaths of the top of the Ionian slab subducting below the Calabrian Arc (Hayes et al., 2018), with seismic refraction profiles from Dellong et al. (2018, 2020) also used to constrain the top of the Ionian oceanic crust. (b) NNW–SSE-trending CD cross section (in gray) showing the flat and ramp geometry of the Ionian slab (see the location in panel a). Interval symbols outline the top of the Ionian crust derived from seismic refraction profiles (Fig. S10). The Ionian oceanic lithosphere supports a 5 km thick homogeneous Paleogene sedimentary cover (in green). The CAP (in yellow) thickness increases northward up to ∼15 km (Dellong et al., 2020). The associated flexure (in blue) is calculated with density ranging from 2500 to 2800 kg m−2 (in dark blue and pink). The bending of the slab is controlled by the slab pull, represented as a punctual load, ranging from 1–4×10¹² N (in red). (c) The Paleogene cover and the CAP load are performed with a maximum CAP load of 2×10⁸–3×10⁸ N m−2. Flexural models are performed with effective elastic thicknesses (Te) ranging from 25 to 37 km and slab pull forces ranging from 1×10¹² to 4×10¹² N (Fig. S11). Topographic, slab, and flexural model profiles are presented without vertical exaggeration (VEx1). (d) Zoom at the intersection of the AB profile showing the depth difference between favorite models, with a CAP load of 3×10⁸ N m−2, slab pull of 2×10¹² N, and elastic thickness of 30 km (continuous line) and 32 km (dashed line), all shown without rollback (red line) and with rollback (green line). The local subsidence associated with the 3 km Myr−1 slab SE retreat is estimated to be about 300±50 m.
The lithosphere flexure models (as well as those in section 3.2) are calculated using the gFlex software (Wickert, 2016). We impose a no-displacement condition at the southern profile boundary and a broken plate with no bending moment and no shear at the northern boundary. The Ionian oceanic lithosphere is modeled assuming an effective elastic thickness (Te) ranging from 25 to 37 km (Figs. 5b and S11) that is compatible with its Triassic to Early Jurassic age (e.g., Catalano et al., 2001; Speranza et al., 2012) and consistent with other publications (e.g., Watts and Zhong, 2000; Tesauro et al., 2012; Cloetingh et al., 2015).
The flexure of the subducting slab depends on its mechanical properties and the loads induced by the sedimentary cover, the accretionary prism, and the slab pull force (Fig. 5b). According to seismic refraction profiles DY-P1 and DY-P4 (Dellong et al., 2018, 2020), the undeformed ante-Messinian sedimentary cover overlying the Ionian crust has a thickness of about 5 km. Thus, taking into account a depth of the Ionian Sea of 5–6 km, we consider that the top of the Ionian crust was lying at a uniform depth of 10–11 km before the onset of the Calabrian subduction system (Fig. 5b). This depth corresponds to the isostatic equilibrium for the Ionian crust. It determines the initial geometry of the flexural model from which we calculate the bending induced by the Calabrian accretionary prism (CAP) load.
Based on seismic refraction profiles DY-P4, DY-P1, and DY-P3 (Dellong et al., 2018, 2020), the Calabrian accretionary prism thickness increases northward from 5 to 15 km. By removing the initial 5 km thick Ionian sedimentary cover, the CAP load represents an increase in sediment thickness from 0 km at the southern end of the CD profile to 10 km at the northern end. The Calabrian backstop, made of Hercynian continental crust, is not taken into account (Fig. 5b).
The CAP load is calculated by
with a sediment density (ρ) of 2500–2800 kg m−2 (profile 2D), using Dellong et al. (2020); a gravity acceleration (g) of 9.81 m s−2; and an increase in the CAP thicknesses (h) from 0 to 10 km. We also calculated the CAP load using an end-member density of 2800 kg m−2 (Fig. 5b), which resulted in a variation in flexure amplitude of a few percent and thus not affecting the results of continental flexural models.
The CAP load (FCAP) is applied on the CD profile divided into 1 km long segments by imposing a northward linear gradient from 0 to 2.45×10⁸ N m−2 (Eq. 1) on the first 250 km of the profile (Fig. 5b and c). We perform several tests with different maximum CAP load (FCAP) and elastic thicknesses (Te) ranging from 2×10⁸ to 3×10⁸ N m−2 and 25 to 37 km, respectively. Models are tested with a constant mantle density of 3300 kg m−2 and no filling density for a mantle restoration force (Fig. 5c). The resulting flexure (∼8 km maximum), even if significant, is not sufficient to fit the Ionian slab profile (gray line in Fig. 5b and c).
The slab pull force is then added to the northern termination of the Ionian lithosphere as a point load (Fig. 5b). We tested with different slab pull forces ranging from 1×10¹² to 4×112 N, consistent with other publications reviewing slab rollback mechanical properties (e.g., Lallemand et al., 2008) and the same range of elastic thicknesses from 25 to 37 km (Figs. 5c and S11). The best fit to the Ionian slab-top profile is obtained for elastic thicknesses (Te) of 30–32 km, a maximum accretionary wedge load (FCAP) of 3×10⁸ N m−2, and a slab pull force (FSP) of 2×10¹² N (Figs. 5c and S11). It is worth noting that including the CAP load significantly reduces the amplitude of the fore bulge associated with slab bending, resulting in a flat-and-ramp geometry similar to that of the Ionian slab.
3.2 Crustal flexure along a WSW–ENE profile
The impact of the Ionian subduction roll-back on the deformation of the Hyblean Plateau is evaluated along the N30° E trending AB profile (Fig. 5a), considering the following simplifications: (1) the ongoing roll-back induces incremental changes in the slab profile that can be matched with a southward translation of the slab geometry, inducing a local deepening. (2) This results in a local incremental increase in the accretionary prism thickness. (3) Due to the mechanical coupling of the Ionian slab and Hyblean lithosphere, the slab deepening exerts an incremental downward force on the COT (Fig. 6).
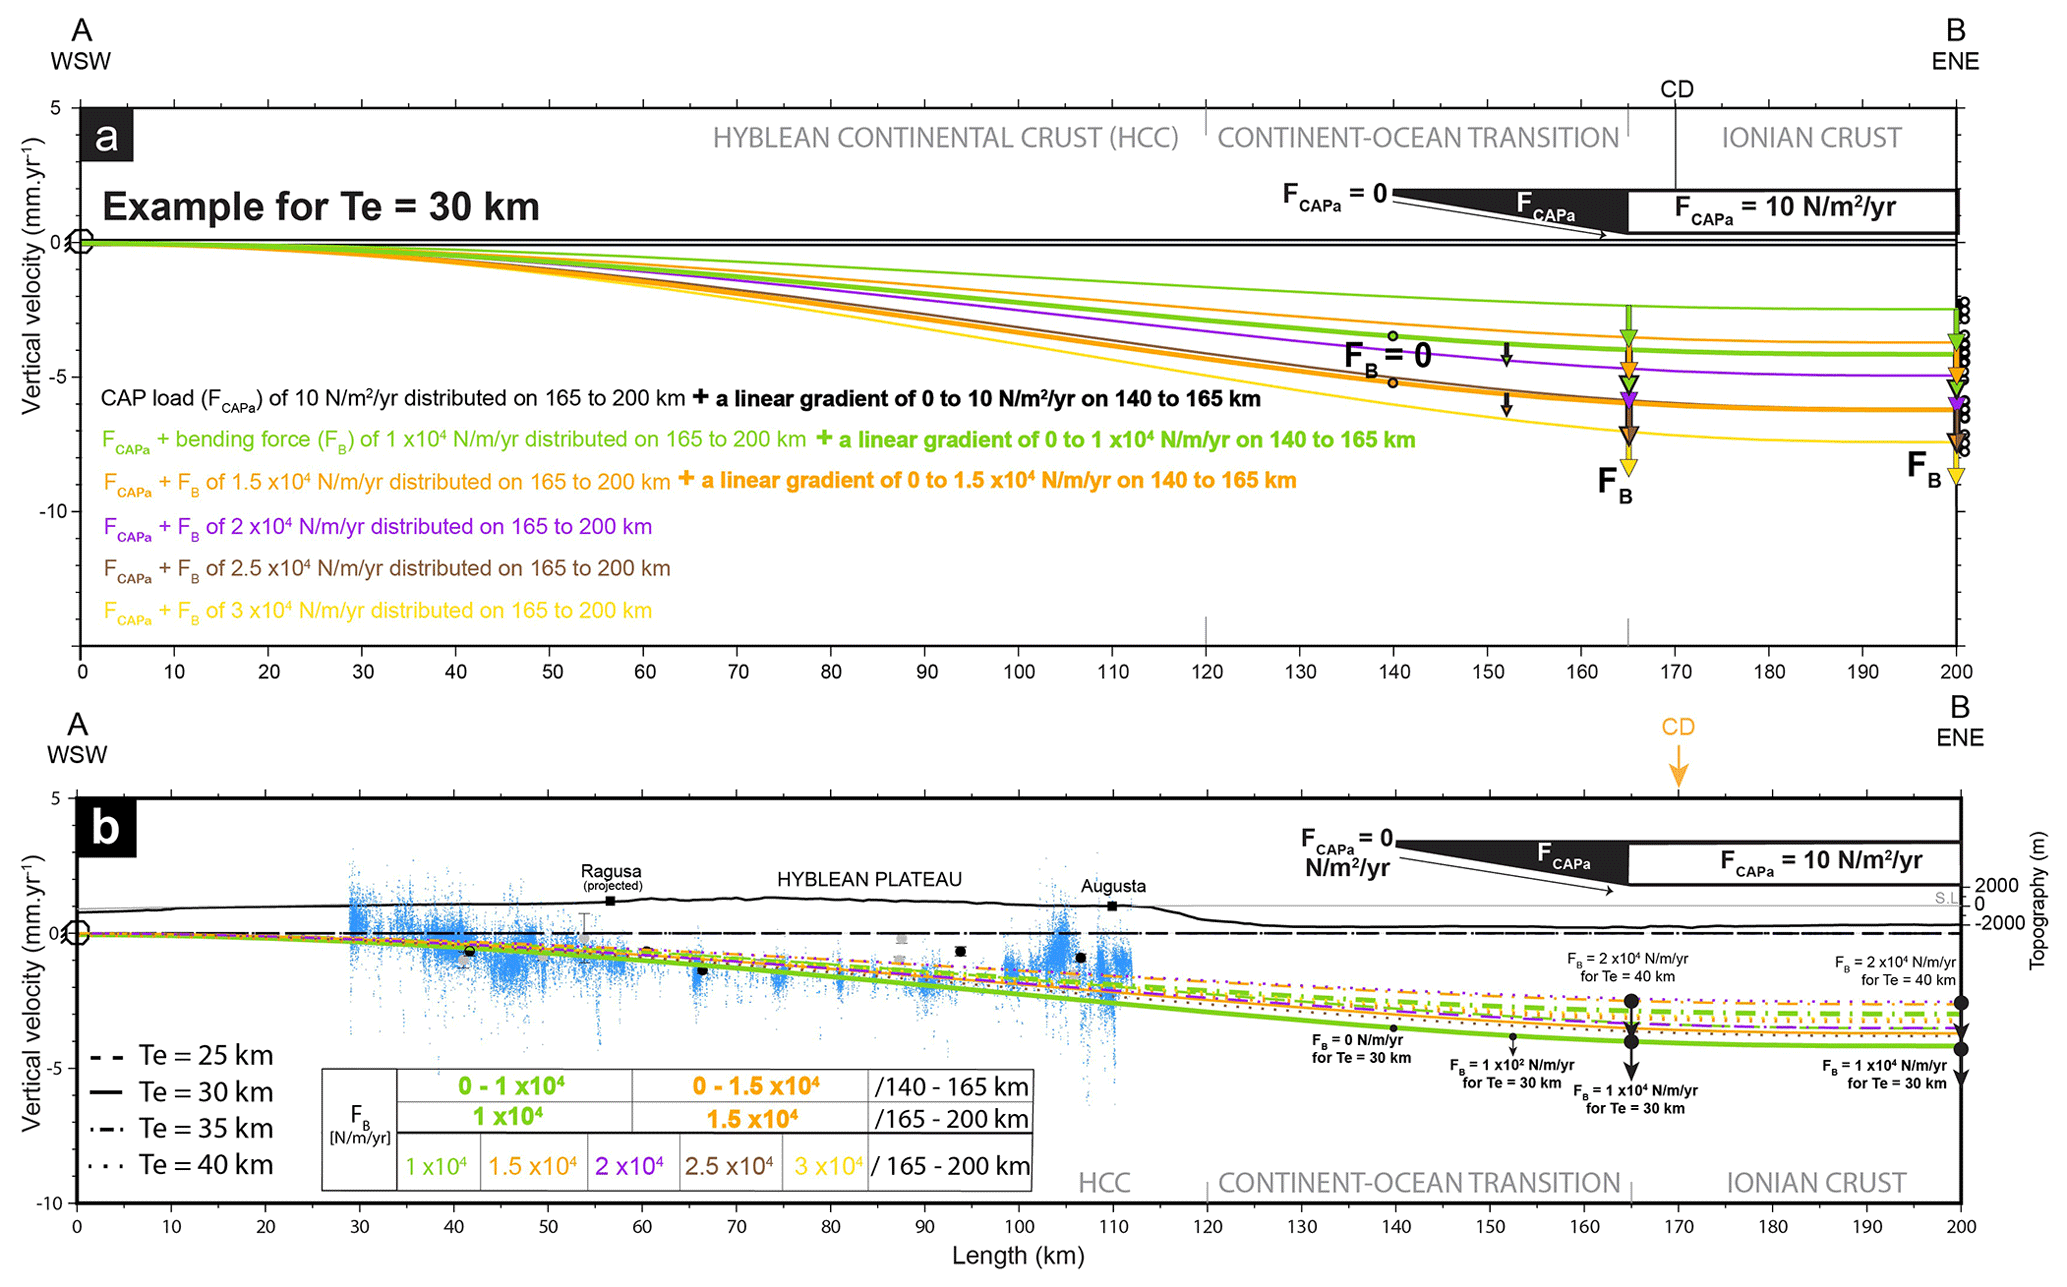
Figure 6(a) Continental crustal flexure is controlled by the southward retreat of the Ionian slab. We calculated the flexure (gFlex from Wickert, 2016) induced by the only CAP load (FCAPa) of 10 N m−2 yr−1 distributed on the continent–ocean transition (in black) and on the adjacent Ionian crust (in white). For an elastic thickness of 30 km, the best models have bending forces (FB) of 1×10⁴ N m−1 yr−1 (in green), 1.5×10⁴ N m−1 yr−1 (in orange), 2×10⁴ N m−1 yr−1 (in purple), 2.5×10⁴ N m−1 yr−1 (in brown), and 3×10⁴ N m−1 yr−1 (in yellow) distributed on the only adjacent Ionian crust or including also part of the COT (see also Fig. S12). (b) The best models (Fig. S12) are compatible with a wide range of elastic thicknesses (25–40 km). PS-InSAR vertical velocities (in blue) and GNSS vertical velocities with their uncertainties are shown. Topographic and bathymetric profiles are presented without vertical exaggeration (VEx1).
The effective elastic thickness of the Hyblean lithosphere is less constrainable than that of the Ionian lithosphere but should remain within standard values for a regular undeformed continental crust with an average geotherm. We test elastic thicknesses (Te) ranging from 25 to 40 km (Fig. 6), assuming a uniform thickness, considering that the continent–ocean transition and the oceanic lithosphere have the same elastic rigidity as the Hyblean crust. Finally, we also considered that none of the fault systems offshore SE Sicily are mature enough to significantly affect the mechanical properties of the abovementioned crustal/lithospheric blocks (e.g., Gambino et al., 2022).
We first evaluate the flexural response due solely to the local incremental increase in the CAP load induced by its southward migration, using our previous analysis of the bending of the Ionian slab. Based on the velocities of the GNSS stations situated in Calabria, we estimate the southward migration to 3 mm yr−1 compared to a fixed Hyblean Plateau (Henriquet et al., 2022). At the intersection between the AB and CD profiles, at the 170 km length mark in the CD profile, the Ionian slab dips 6±1° toward the north (Hayes et al., 2018) (Fig. 5d). Taking into account the CAP geometry, its southward motion, and the slab geometry, we calculate a local incremental thickening of the CAP of m yr−1 (equivalent to 300 m Myr−1) and a resulting load (FCAPa) of about 5–10 N m−2 yr−1 (Fig. 5d). Applying a linear load gradient starting from zero at the base of the Malta Escarpment (140 km marks of the AB profile) to 5–10 N m−2 yr−1 at the end of the continent–ocean transition (165 km marks of the AB profile) and then applying this load constantly until the end of the AB profile results in a slow onshore subsidence rate of mm yr−1 maximum, 20 000 times smaller than the PS-InSAR subsidence rate measured in the same area (∼3 mm yr−1).
We then investigate the effect of the southward Ionian slab roll-back and associated downward pull on the COT. We first calculate the flexural rigidity of the oceanic lithosphere (Turcotte and Schubert, 2014),
with a Young modulus (E) of 1×10¹¹ Pa, a Poisson's ratio (ν) of 0.25, and an effective elastic thicknesses (Te) of 30–32 km (see Sect. 3.1). We obtain a flexural rigidity (D) of the Ionian lithosphere of 2.4–2.9×10²³ Pa m−3.
To simulate the Ionian slab retreat, we translate the slab profile southward, assuming a slab retreat velocity of ∼3 mm yr−1 (D'Agostino et al., 2011) (Fig. 5d). At the intersection of profiles AB and CD, this induces an incremental deepening of the Ionian slab of about m yr−1 (equivalent to 300 m Myr−1), which defines the equivalent downward force at the same location along the CD flexure profile (Turcotte and Schubert, 2014),
with an incremental deflection (ω) of m yr−1 (Fig. 5d) and a flexural rigidity (D) of 2.4–2.9×10²³ Pa m−3. The total profile length L corresponds to the point of the Hyblean lithosphere where the deflection (ω) is null, with ∼200 km based on the PS-InSAR and structural data (Fig. 6). The distance x corresponds to the point at which the deflection (ω) is estimated (intersection with profile CD). Considering km and x=150 km, the equivalent incremental downward force is about 1–6.5×10⁴ N m−1 yr−1.
This equivalent force (FB) is then applied on the AB profile to model, with gFlex, the resulting flexure of the Hyblean crust/lithosphere. Flexural models are calculated with a no-displacement boundary condition at the southwestern end of the profile (20 km west of Gela) and a free displacement of a horizontally clamped boundary condition at its northeastern end (80 km east of the Malta Escarpment). Flexural models are run with a fill density of 2500 kg m−2 (2D profile) solely for the CAP load. The downward force (FB) and CAP load (FCAPa) are applied as constant loads (on 1 km long segments) over the 35 or 60 km long portion of the AB profile corresponding to the only adjacent Ionian crustal domain and from the base of the Malta Escarpment to the end of the COT as a linear load gradient evolving from zero to the maximum calculated load. We test different elastic thicknesses (Te) and a bending force (FB) ranging from 25 to 40 km and 1×10⁴ to 6.5×10⁴ N m−1 yr−1, respectively (Figs. 6b and S12).
To determine the best Hyblean crustal flexure models, we first filter the PS-InSAR vertical velocities (5 km stacked in the AB profile) using a 5 km width median filter with a step of 1 km. Comparing the resulting long-wavelength trend of the PS-InSAR data with all flexural models shows maximum misfits of about 12 mm yr−1. The comparison between the GNSS data (20 km stacked of the AB profile and 5 km large median filter with a step of 1 km) shows a little bit of a higher maximum misfit of about 13 mm yr−1 due to a variable spatial density and quality of GNSS stations over the Hyblean Plateau (Fig. S12c). The best models (0.5 mm yr−1 RMS PS-InSAR) have a CAP load plus a bending force ranging from 1×10⁴ to 3×10⁴ N m−1 yr−1 distributed on a 35 km long portion of the AB profile and also between 1×10⁴ to 1.5×10⁴ N m−1 yr−1 distributed on a 60 km long portion of the AB profile, with the effective elastic thicknesses ranging from 25 to 40 km (Figs. 6b and S12b, c). None of the tested continental crustal flexure models reproduce the short-wavelength deformations observed in the Gela region (slow uplift of ∼0.5 mm yr−1) or along the Augusta–Siracusa coastal area (relative uplift of 1–2 mm yr−1).
3.3 Interseismic loading and aseismic creep on coastal and offshore faults
Along the coast, from Augusta to Siracusa, PS-InSAR vertical velocities vary at a kilometer scale and appear 1–3 mm yr−1 slower than the general trend of subsidence affecting the eastern Hyblean Plateau (Figs. 2a and 6b). Interestingly, these short-wavelength signals show triangular patterns similar to those produced by shallow faulting in an elastic domain. To investigate the sources of these surface deformations, we test several scenarios involving interseismic loading and aseismic creep on coastal and offshore faults.
Offshore, several active normal faults, outcropping along the base of the Malta Escarpment, have been identified, imaged, and documented in detail by Argnani and Bonazzi (2005), Gutscher et al. (2016), and Gambino et al. (2021, 2022b). Close to the coastline, the offshore Augusta–Siracusa fault (Fig. 7) has also been considered a potentially active fault (e.g., Bianca et al., 1999; Azzaro and Barbano, 2000). We use the Coulomb 3.4 software (Toda et al., 2011) to impose different fault slip rates and geometric boundary conditions on these fault systems, assuming standard elastic properties (Poisson's ratio of 0.25; Young modulus of 80 GPa).
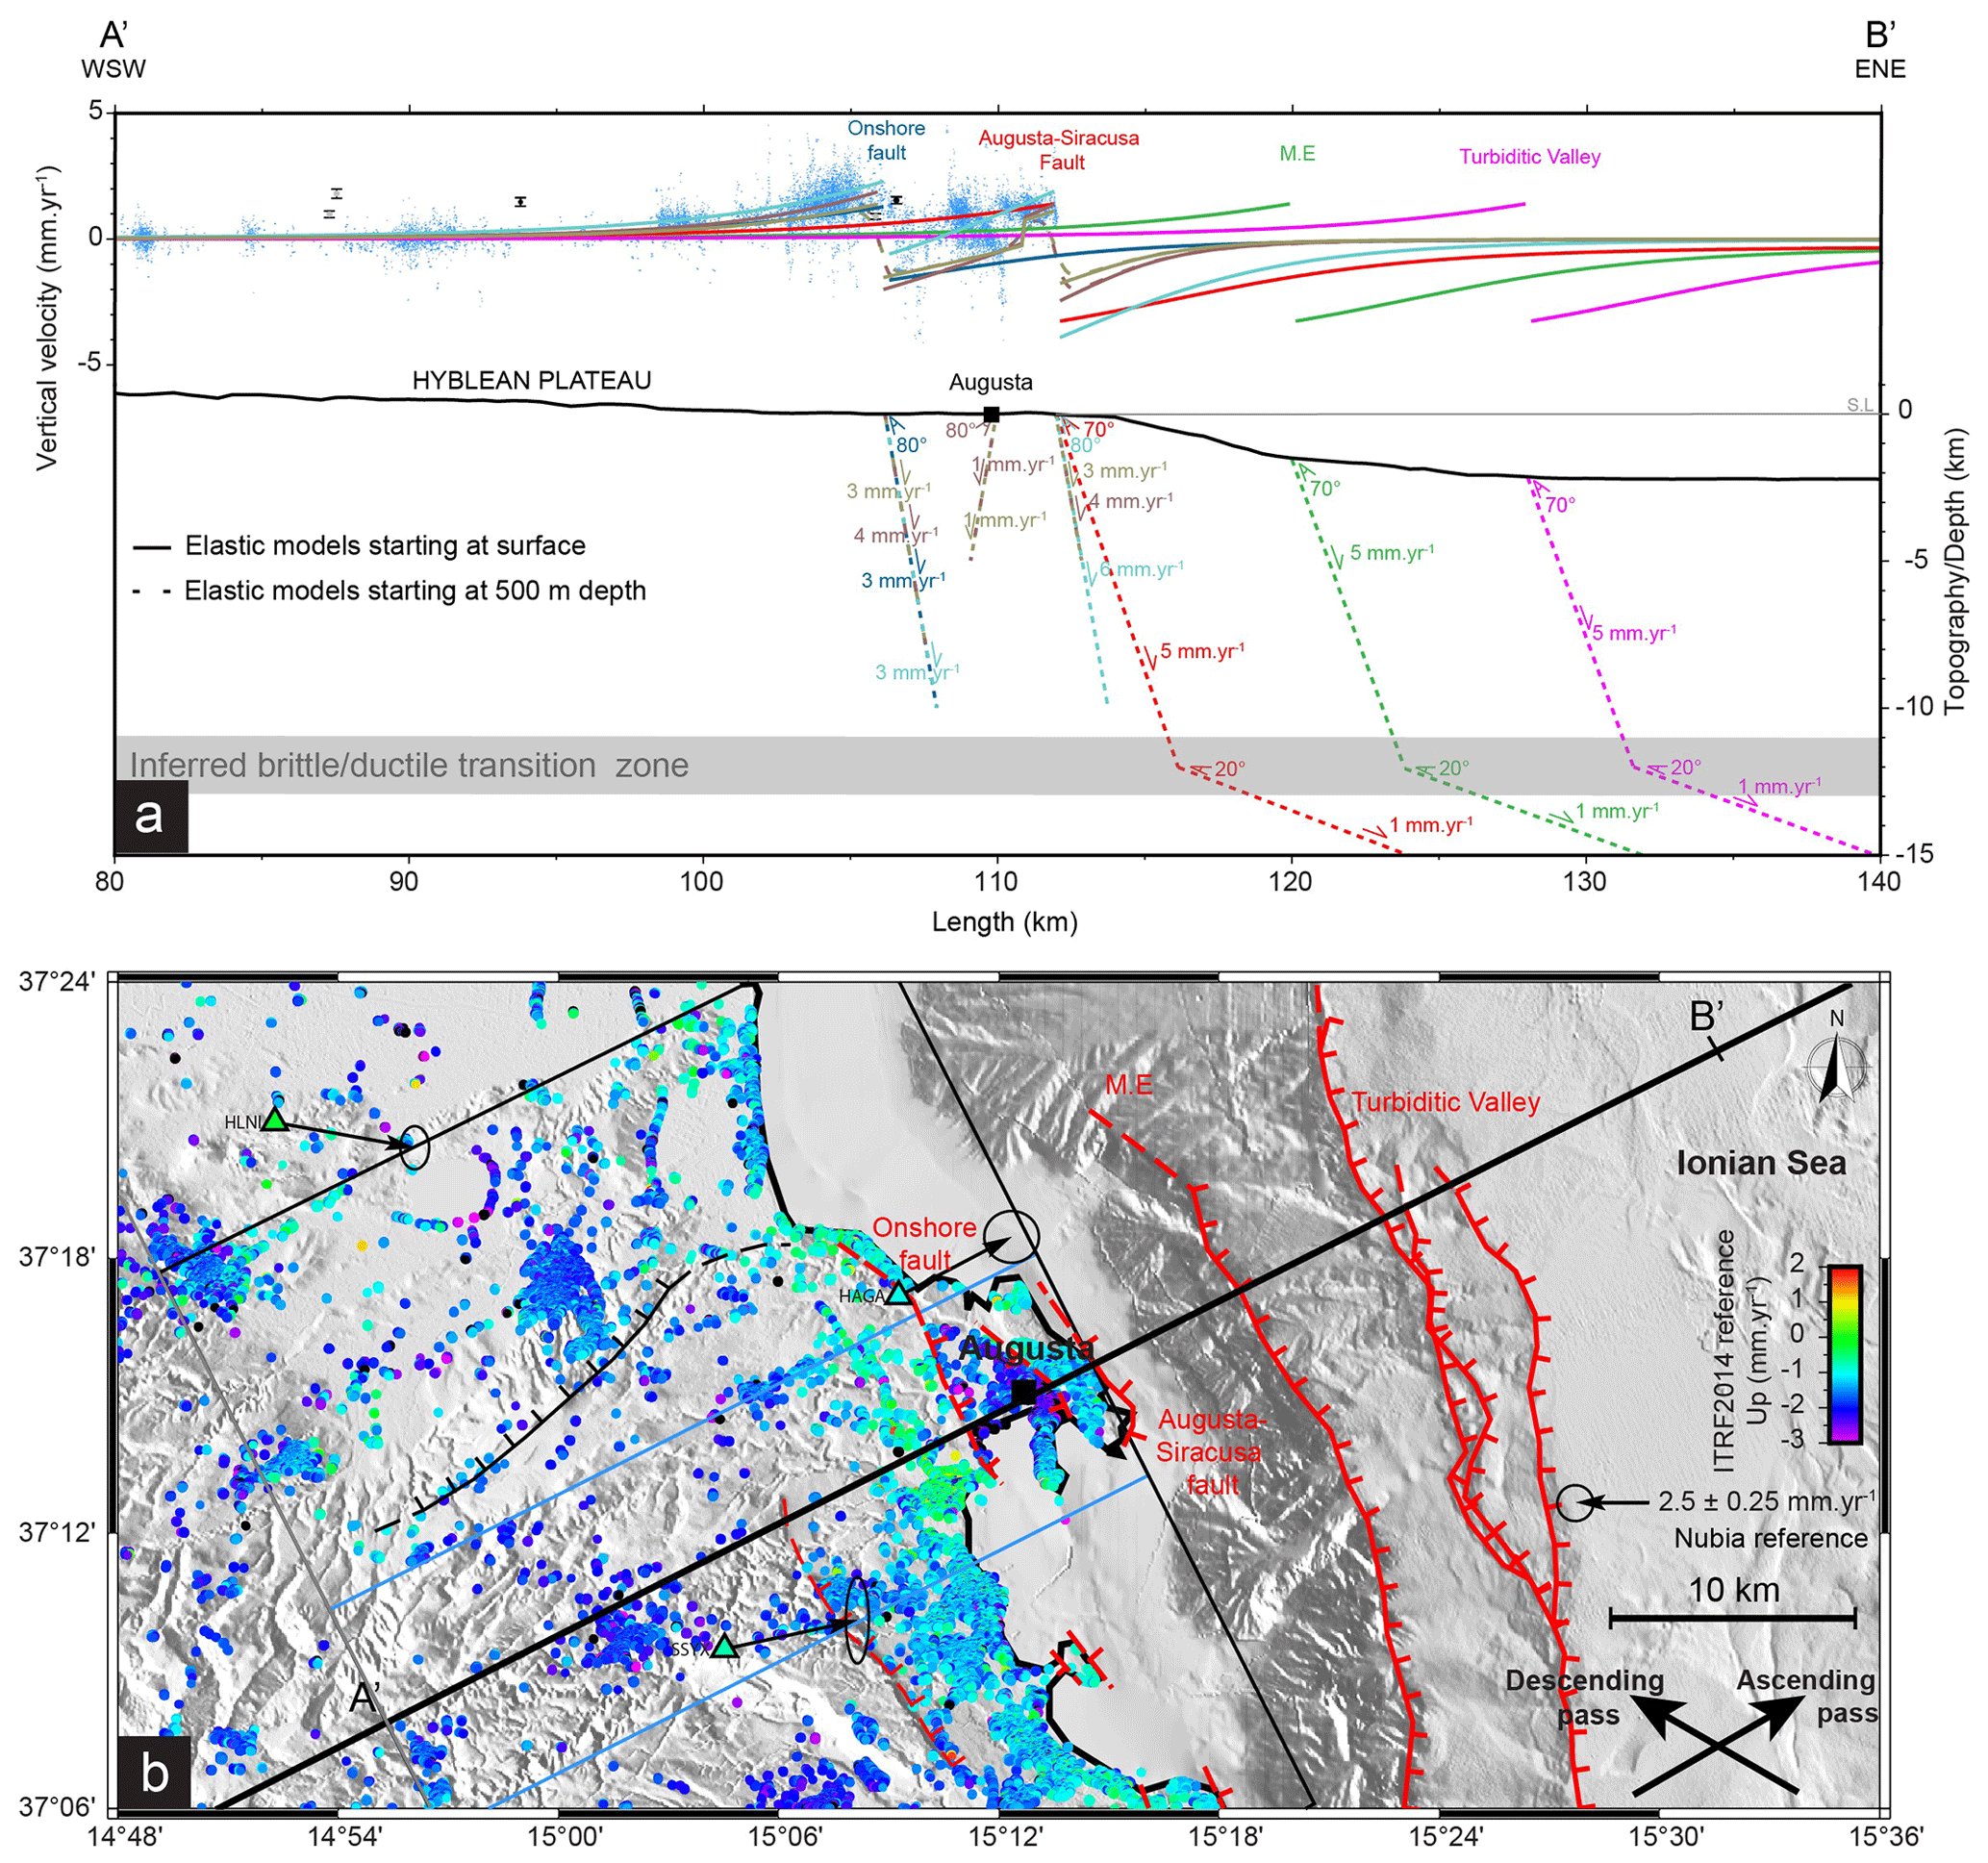
Figure 7(a) Coulomb 3.4 (Toda et al., 2011) numerical models of interseismic elastic loading on offshore and coastal inferred active faults along the eastern Hyblean Platform. PS-InSAR vertical velocities (in blue) are stacked across a 5 km width on both sides of the AB profile. Modeled interseismic deformations related to the Turbiditic Valley normal fault (in magenta), the Malta Escarpment (in green), the Augusta–Siracusa coastal fault (in red), and onshore inferred active faults in Augusta (in dark blue). Modeled elastic loading of the Augusta–Siracusa coastal fault plus onshore inferred active faults in Augusta are represented in light blue, light brown, and dark brown lines. Topography/depth are represented without vertical exaggeration (VEx1). (b) Map view of geodetic data in the northeastern part of the Hyblean Plateau. Major faults of the Hyblean Plateau containing the Augusta–Siracusa coastal fault and the inferred onshore active fault and Malta Escarpment (ME), including the Turbiditic Valley faults (red is the active fault; dashed red is the inferred active fault; black is the inferred aseismic slip.
The fault plane geometries tested (strike and dip) are based on published field-trip observations and measurements (Gambino et al., 2021). Fault locations are based on published geological/structural maps (Adam et al., 2000) and on the presence of sharp gradients in the PS-InSAR velocity pattern. The imposed fault slip velocities result from a trial-and-error empirical approach. The objective, essentially, is to evaluate if aseismic slip on known and unknown faults could generate sufficient surface deformation to explain the measured surface deformation pattern.
The model predictions are compared to the PS-InSAR short-wavelength signals (Fig. 7b) obtained by removing the mean of the best-fitting flexural models (see Sect. 3.2) from the original geodetic dataset. Two patterns of relative uplifts of about 2.5±0.5 mm yr−1, gently tapering westward, can be identified near and to the SE of Augusta with a zone of relative subsidence of about mm yr−1 in between them (Fig. 7a). We hypothesized that these surface deformations could be induced by fault slip along ENE-dipping normal fault systems (Fig. 7).
The first set of models corresponds to interseismic locking of the shallow (0 to 10–15 km depth) sections of the main normal faults identified in the study area (Fig. 7b) and elastic loading by deep (>15 km depth) creeping sections. Regardless of the deep-fault geometry or slip rates, all of these models generate generalized long-wavelength subsidence rates incompatible with the geodetic data (dotted green line; Fig. S13). Thus, we dismiss interseismic loading as a potential mechanism to explain the short-wavelength surface deformation patterns.
The second set of models corresponds to shallow aseismic slip imposed on three offshore normal faults: the Augusta–Siracusa fault (Bianca et al., 1999), the Malta Escarpment fault, and the Turbiditic Valley fault (Gutscher et al., 2016; Gambino et al., 2021, 2022b) (Figs. 7a and S13). We decided to test the Malta Escarpment fault because it lies between the Turbiditic Valley active fault and the Augusta–Siracusa fault for which evidence of activity has been documented by as-yet-unpublished sparker lines acquired in the Augusta Bay (Giovanni Barreca , Carmelo Monaco, personal communication, 2024). The modeled faults (Fig. 7a) share a similar listric geometry, with a first fault plane dipping 70° NE and extending from the surface to 12 km depth (inferred brittle/ductile transition zone) and a second one dipping 20° NE and extending from 12 to 50 km depth (to limit boundary effects). We imposed the slip rates of 5 mm yr−1 on the first fault plane, based on the Meschis et al. (2020) model (Fig. S13), and 1 mm yr−1 on the second plane to dampen the elastic deformation produced by slip on the shallow fault (Fig. 7a). Aseismic slip on these various faults produces coastal uplift rates, reaching at most ∼1 mm yr−1 for the Augusta–Siracusa fault, consistent with the PS-InSAR measurements east of Augusta (Fig. 7a). However, all the modeled offshore faults failed to reproduce the ∼2–3 mm yr−1 relative uplift rates measured west of Augusta (Fig. 7a and b).
The third set of models focuses on the surface deformation generated by aseismic creep on 70–80° ENE-dipping shallow coastal and onshore fault planes. We first simulate slip on the upper portion of the Augusta–Siracusa fault, but if this model succeeds in producing sufficient uplift east of Augusta, it fails to reproduce the relative uplift west of Augusta. Based on PS-InSAR data and structural evidence of regional onshore normal faulting (e.g., Adam et al., 2000; Gambino et al., 2021), we added to the previous Augusta–Siracusa fault model an 80° dipping onshore normal fault outcropping at the 106 km mark of the AB profile (sharp velocity gradient in the PS-InSAR data), with a slip rate of 3 mm yr−1 down to 10 km depth (light blue lines in Fig. 7a). The surface deformation generated by this dual creeping fault can explain the observed PS-InSAR relative uplift between the 103 and 106 km profile marks and 110 and 112 km. Note that imposing aseismic slip on the onshore normal fault alone fails to reproduce the subsidence east of Augusta (dark blue line in Fig. 7a).
The triangular patterns of sharp steps and associated lows in the PS-InSAR data could be also fitted by a three-fault model involving shallower aseismic creep (up to 5 to 8 km depth) and combining the onshore ENE-dipping fault (106 km mark), creeping at 3–4 mm yr−1, with an antithetic onshore WSW-dipping fault (110 km mark), creeping at 1 mm yr−1, and the Augusta–Siracusa coastal fault (112 km mark), creeping at 3–4 mm yr−1 (brown lines in Fig. 7a). We test the same configuration (two onshore faults and the Augusta–Siracusa coastal fault) with a fault plane propagating to the surface up to 500 m depth (Fig. 7a). This model, equivalent to a blind fault, induces vertical surface deformation (between the 106 and 110 km marks) about 0.2 mm yr−1 slower than the model starting to creep from the surface but remains consistent with the PS-InSAR data.
At present, however, there is no evidence of the existence of faults matching the ones used in the third set of models. All these ad hoc models illustrate that the short-wavelength geodetic signal along the eastern Hyblean Plateau coast could be explained by ongoing extension tectonics and creep on coastal normal faults.
3.4 Alternative hypothesis
To explore if other natural processes could explain part of the observed geodetic velocity patterns, we briefly investigate three alternative models.
3.4.1 Mantle flow upwelling
Seismic tomography and volcanic data identify a slab window extending along most of the northern coast of Sicily, with a slab break-off recently propagating from west to east and potentially triggering toroidal and upwelling mantle flows (Trua et al., 2003; Civello and Margheriti, 2004; Faccenna et al., 2005; Scarfì et al., 2018). This process could induce long-wavelength surface motions (so-called dynamic topography) over the whole of Sicily. However, mantle flow numerical modeling mainly predicts areas of uplift and subsidence restricted to Mount Etna and the southern Peloritani region (Faccenna et al., 2011; Gallen et al., 2023). Thus, SE Sicily appears to be situated too far from the Ionian slab edge to be affected by upwelling mantle flow. Therefore, it is unlikely that this hypothesis explains the observed vertical surface deformations.
3.4.2 Volcanic deflation
The last volcanic activity documented on the Hyblean Plateau dates back 1.4 Myr (Schmincke et al., 1997; Behncke, 2004), but post-volcanic, deep-tectonomagmatic activity, not recorded at the surface, cannot be ruled out. In such a case, volcanic material deflation located below the central Hyblean Plateau could induce local subsidence rates affecting a large region. We tested this hypothesis numerically with deflating spheres, 6 to 14 km in diameter (Mogi, 1958 model; Fig. S14) and situated at a depth of 8 km, at the top of the Paleozoic basement and a possible location of magma accumulation (Henriquet et al., 2019). Our first-order tests show that even when using extreme deflations of 50 %–75 %, the PS-InSAR subsidence rates cannot be reproduced (Fig. S14), rendering the volcanic deflation hypothesis extremely unlikely.
3.4.3 Hydrological loading
The geology of the Hyblean Platform is mainly composed of limestones and dolomites in a karstic environment. Long-term recharge or discharge of karst aquifers is known to induce transient elastic deformation that is measurable geodesically (e.g., Grillo et al., 2011; Silverii et al., 2016; D'Agostino et al., 2018). Hydrological loading/unloading cycles can have a significant impact on vertical deformation up to a few tens of millimeters on an annual cycle (White et al., 2022). The effects of hydrological variation on pluri-annual trends are more difficult to assess. Here, we consider velocities over 5 years from PS-InSAR and GNSS. The regional subsidence rate of 1–3 mm yr−1 and associated east-side-down tilt would require an average increase in the water level by ∼10–20 cm over 5 years at the scale of the whole southeastern Sicilian reservoir. This seems incompatible with the absence of similar observable effects over central and western Sicily and with the drought periods that have affected Sicily in recent decades. Hydrological loading, as a source of large-scale surface subsidence, is then unproved.
4.1 Short-term and long-term model limits
We explain the eastward tilt and subsidence rates of the Hyblean Plateau as the flexure of the Hyblean continental crust/lithosphere induced by the southward migration of the Calabrian accretionary prism (CAP) and retreat of the Ionian subducting slab (Sect. 3.1 and 3.2). This model is based on the assumption that the geodetic data (GNSS and PS-InSAR), measured over a short period (5–15 years), are representative of the kinematic evolution of the studied region at the scale of a few hundred to 1000 years. In the absence of significant seismic events during the period of geodetic data acquisition, and considering that major earthquakes (M>7) in SE Sicily probably have a return period of more than 500 years, geodetic data are mainly recording interseismic elastic deformation and, possibly, a minor permanent one (fault creep, folding, and human-related surface deformation). Flexural modeling indicated that the increasing loading of the COT, induced by the southward propagation of the CAP, is not sufficient (Fig. 6b). The increase in bending force, imposed by a ∼3 mm yr−1 southward retreat of the Ionian slab, gives interesting positive results. This process could be strong enough to pull down the eastern termination of the Hyblean crust at velocities compatible with PS-InSAR measurements. However, we obtained this result considering that the Hyblean crust/lithosphere, the continent–ocean transition (COT), and the Ionian crust/lithosphere have similar mechanical properties. The role of the nearby Alfeo–Etna Fault system (AEF) is still under debate; even though it cuts the entire lithosphere starting in recent times (probably Middle–Late Pleistocene), it has probably not reached yet the stage of a slab tear (STEP) (Polonia et al., 2016; Gambino et al., 2022). We, therefore, considered the AEF to not be mature enough offshore SE Sicily to significantly alter the mechanical properties of the abovementioned crustal/lithospheric blocks. This assumption implies that the COT has a significantly rigid and potentially too strong rheology (Fig. 8), as discussed hereafter (Sect. 4.2).
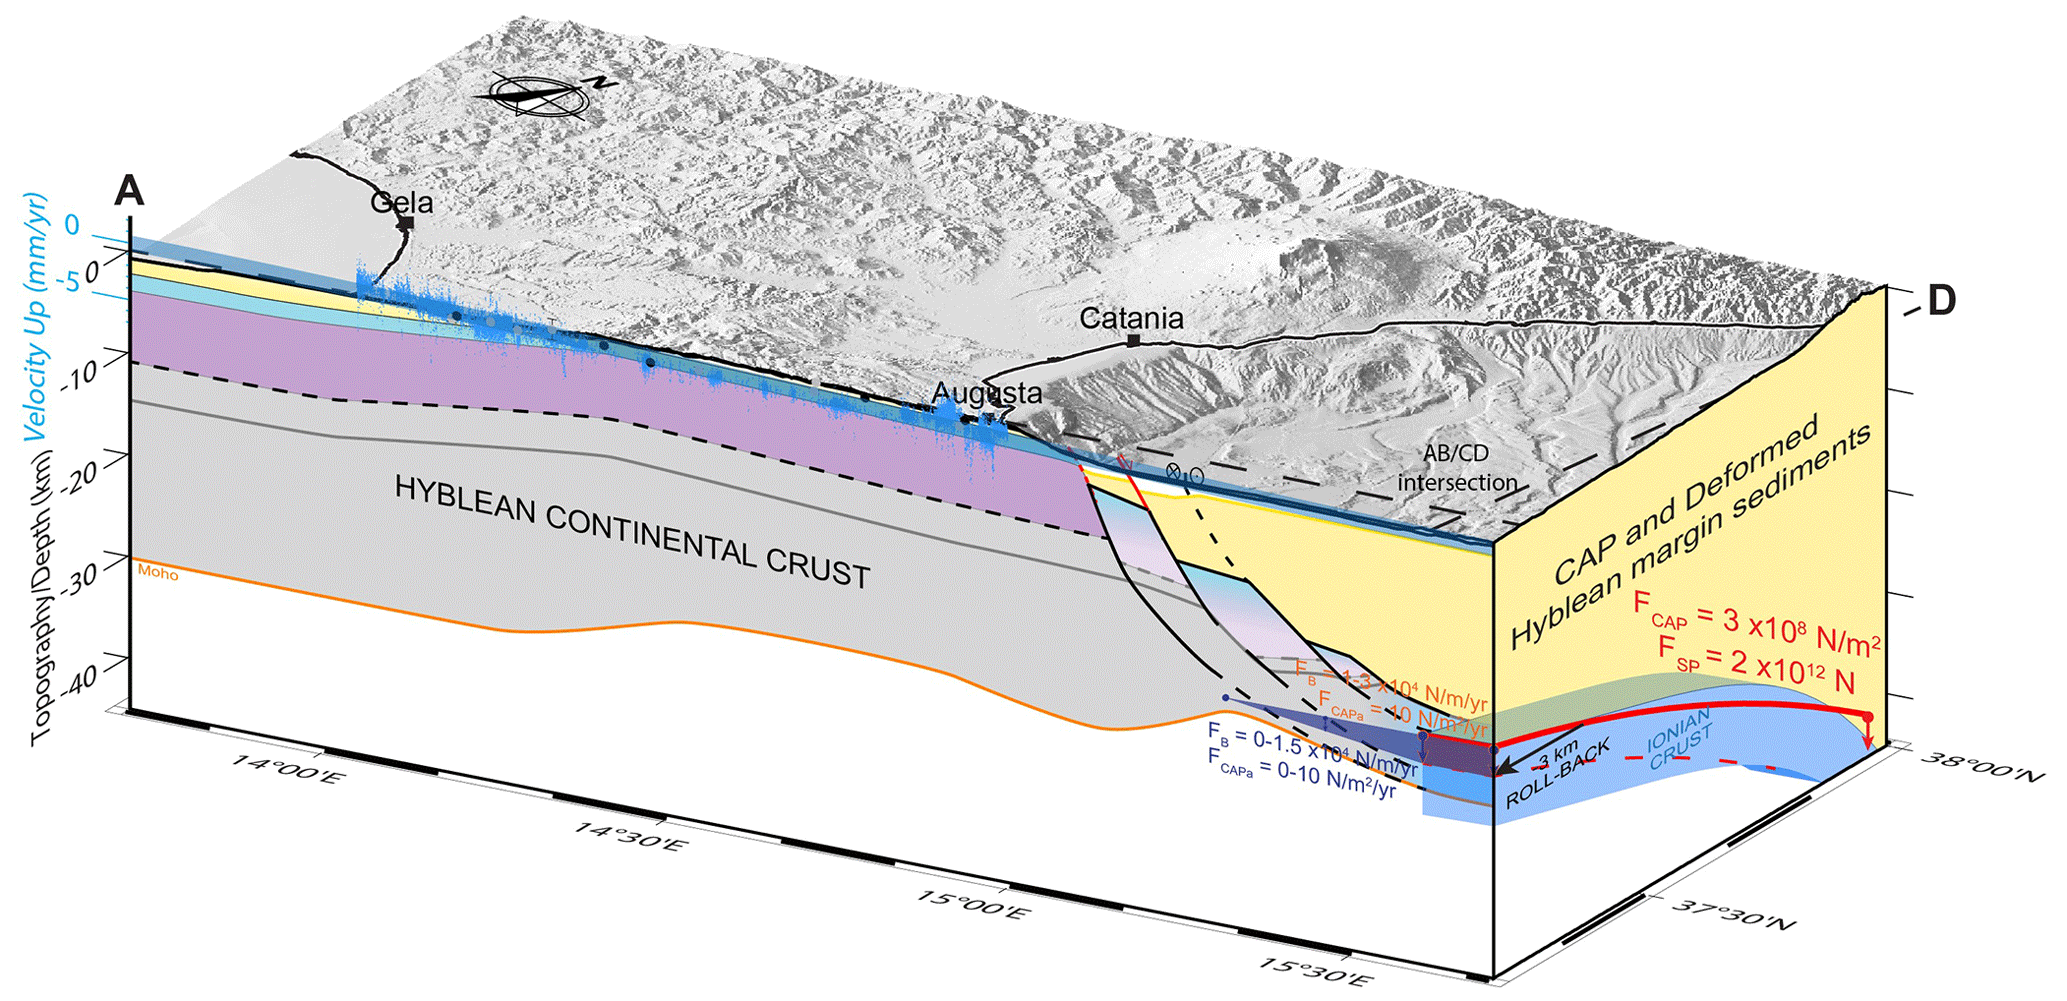
Figure 8Schematic 3D deformation model of southeastern Sicily bounded by profiles AB and CD and controlled by Ionian slab roll-back. The 3 km southward retreat of the Ionian crust flexure model (dashed red line) has a horizontal exaggeration of 6 times. The Moho of the Hyblean continental crust determined by geophysical data (Scarfì et al., 2018; Henriquet et al., 2019) is in orange. The Calabrian accretionary prism (CAP) and deformed Hyblean margin sediments are in yellow. The synthetic structural profile in the AB profile has no vertical exaggeration (VEx1).
We used simple 2D elastic models based on parameters determined through analytical modeling of the Ionian oceanic lithosphere flexure using, as a reference, the Ionian slab geometry determined by Hayes et al. (2018) and data (depth of the top of the Ionian crust) extracted from the refraction profiles published in Dellong et al. (2018). The use of more advanced numerical models (finite element model, FEM), including 3D modeling methods, would likely improve our first-order estimates. Similarly, the lateral variations in the Hyblean continental crust thickness and elastic properties are not accurately known. We used the available geophysical data (Scarfì et al., 2018; Henriquet et al., 2019), but it was not possible to constrain the Hyblean crust/lithosphere rheology with better confidence (Fig. 8). Should such parameters become available in the future, they could be used to refine our Hyblean crust/lithosphere flexure calculations.
One of the other assumptions we made concerns the rate of increase in the slab-bending force due to the southward propagation of the Ionian slab roll-back. The calculated increase in the slab-bending force east of the HP is based on the estimated rate of southward retreat of the Ionian slab defined by the mean of the GNSS N–S horizontal velocities in southwest Calabria (using Malta island as a reference). However, this estimate may be understated if the Calabrian Arc migrates southward more slowly than the Ionian slab retreat, due to lateral mechanical interactions with the Apulian and African margins.
The short-wavelength relative uplift signal, observed in the geodetic data along the southeastern Sicily coast, must be driven by more shallow deformation mechanisms than those responsible for the long-wavelength eastward flexure of the HP (Fig. 6b). Kilometer-long surface deformations are typically related to upper crustal deformation processes (e.g., Burgmann and Thatcher, 2013), so we test interseismic loading models on the inferred and identified onshore and offshore fault systems.
Slip on the Malta Escarpment and Turbiditic Valley normal fault cannot explain the observed deformation of the eastern coast of the Hyblean Plateau. Only creep on the Augusta–Siracusa coastal fault and antithetic structure (Bianca et al., 1999; Azzaro and Barbano, 2000) induces onshore vertical deformation compatible with the geodetic data near Augusta. Interseismic slip (creep) on two onshore ENE and WSW 80° dipping faults and the Augusta–Siracusa coastal fault fit with the PS-InSAR data to the east of the AB profile. These faults could re-activate inherited Permo-Triassic to Early Jurassic NW–SE extensional structures, leading to the formation of the Augusta Graben and extending up to Siracusa (e.g., Grasso and Lentini, 1982). Even if some seismic activity affects this region (e.g., Adam et al., 2000; Azzaro and Barbano, 2000), field evidence of recent (Holocene) tectonic activity has yet to be demonstrated.
Our results suggest that these faults should creep up to the surface or the near-surface (blind fault) to produce sufficient interseismic surface deformation in the footwall. In that later case, their surface expressions could correspond to gentle surface folding or to fold scarp morphologies (e.g., Chen et al., 2007; Li et al., 2015) rather than localized cumulated fault scarps.
High-precision leveling data acquired between 1970–1991 and analyzed by Spampinato et al. (2013), reveals a remarkable ∼4 mm yr−1 velocity offset between benchmarks 107 and 113, both situated near the coast 5 km west of Augusta (Fig. 9c). This sharp vertical velocity gradient is correlated with a marked topographic step trending N–S and descending toward the sea. Northwest of Augusta, the leveling dataset also shows a ∼2 mm yr−1 offset between benchmarks 119 and 120 associated with a topographic step oriented E–W and facing north (Fig. 9b and c).
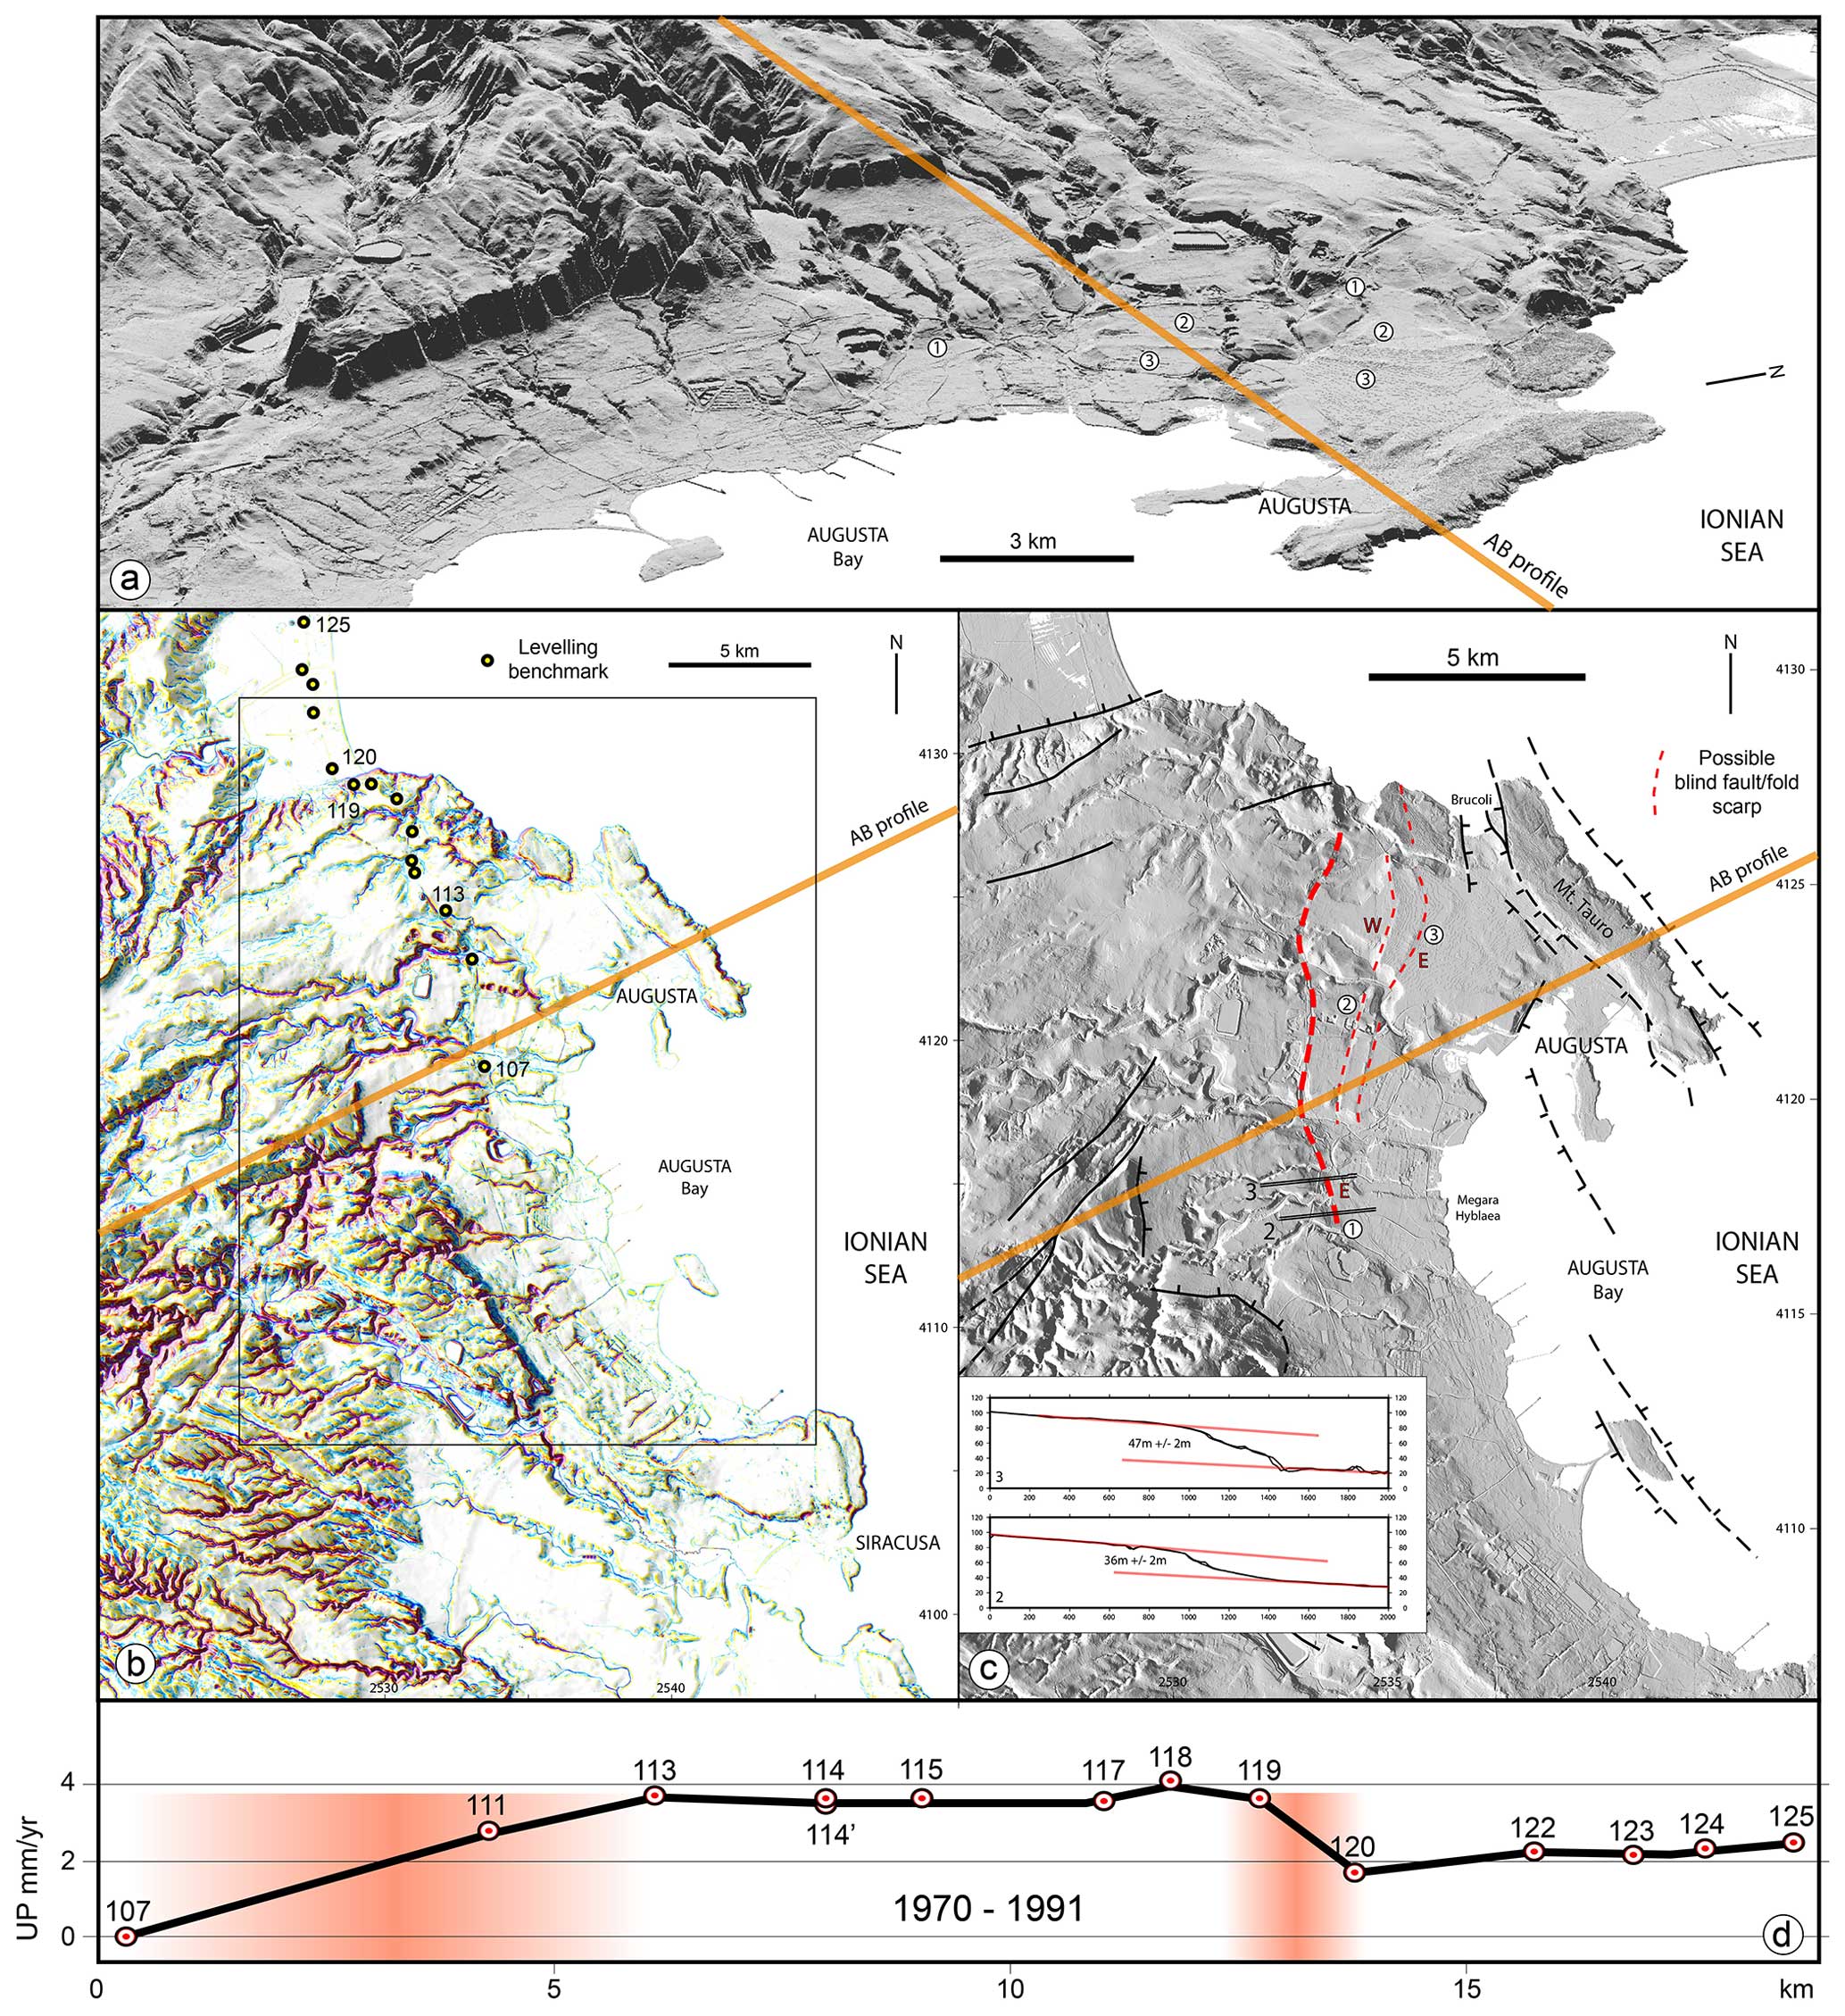
Figure 9(a) 3D view of a shaded DEM of 2 m resolution from S.I.T.R. regione Siciliana (2013) showing the morphology of the NE part of the Hyblean Plateau. (b) Morphological map of the Augusta–Siracusa region showing fluvial incision networks and morphological scarps. The location of leveling benchmarks appears in yellow circles. (c) Simplified morphostructural map highlighting the location of potential tectonic fault/fold scarps in red and the known fault in a thick dashed red line with cross sections (Fig. S15). (d) 1970–1991 leveling profile (Spampinato et al., 2013) showing a first velocity step (∼4 mm yr−1) between benchmark 107 and 113 and a second one (∼2 mm yr−1) between benchmark 119 and 120 (potential fault zone locations appear in the background in red).
A morphostructural analysis of this region, using a 2 m resolution DEM, outlines sharp drainage incision anomalies oriented perpendicular to the identified topographic steps and potentially related to tectonic surface uplift (Fig. 9b). The topographic step between benchmarks 119 and 120 (Fig. 9a and d) could correspond to the Scordia–Lentini graben border (e.g., Barreca, 2014; Cultrera et al., 2015). The topographic anomaly between benchmarks 113 and 107, extending to the north up to the Ionian Sea and to the south toward Siracusa, was not previously identified as a tectonic feature. It could correspond to the implemented creeping fault used to match the PS-InSAR data. Uplifted late Quaternary marine terraces have been evidenced in this region (Bianca et al., 1999; Monaco and Tortorici, 2000; Meschis et al., 2020), but the authors did not mention a tectonic origin for the measured coastal uplift. Finally, the measured fast surface uplift (1–2 mm yr−1) could be considered inconsistent with the low amplitude of the topographic scarp measurable in the field (a few tens of meters). This point is discussed hereafter (Sect. 4.2).
4.2 Combined long-term tectonics and seismic cycle model
The subsidence and tilt patterns observed in the geodetic data can be explained by the combination of (1) the flexure of the Hyblean continental crust induced by the bending forces generated by the Ionian subduction roll-back (slab pull) and the CAP overload, explaining the long-wavelength deformation affecting the HP, and (2) the aseismic activity of the Augusta–Siracusa fault system, potentially extending onshore an inferred tectonic structure and explaining the short-wavelength deformation signal affecting the Augusta/Siracusa region (Fig. 10). In this section, we discuss how this short-term (geodetic) model could be combined with long-term geological and tectonic observations.
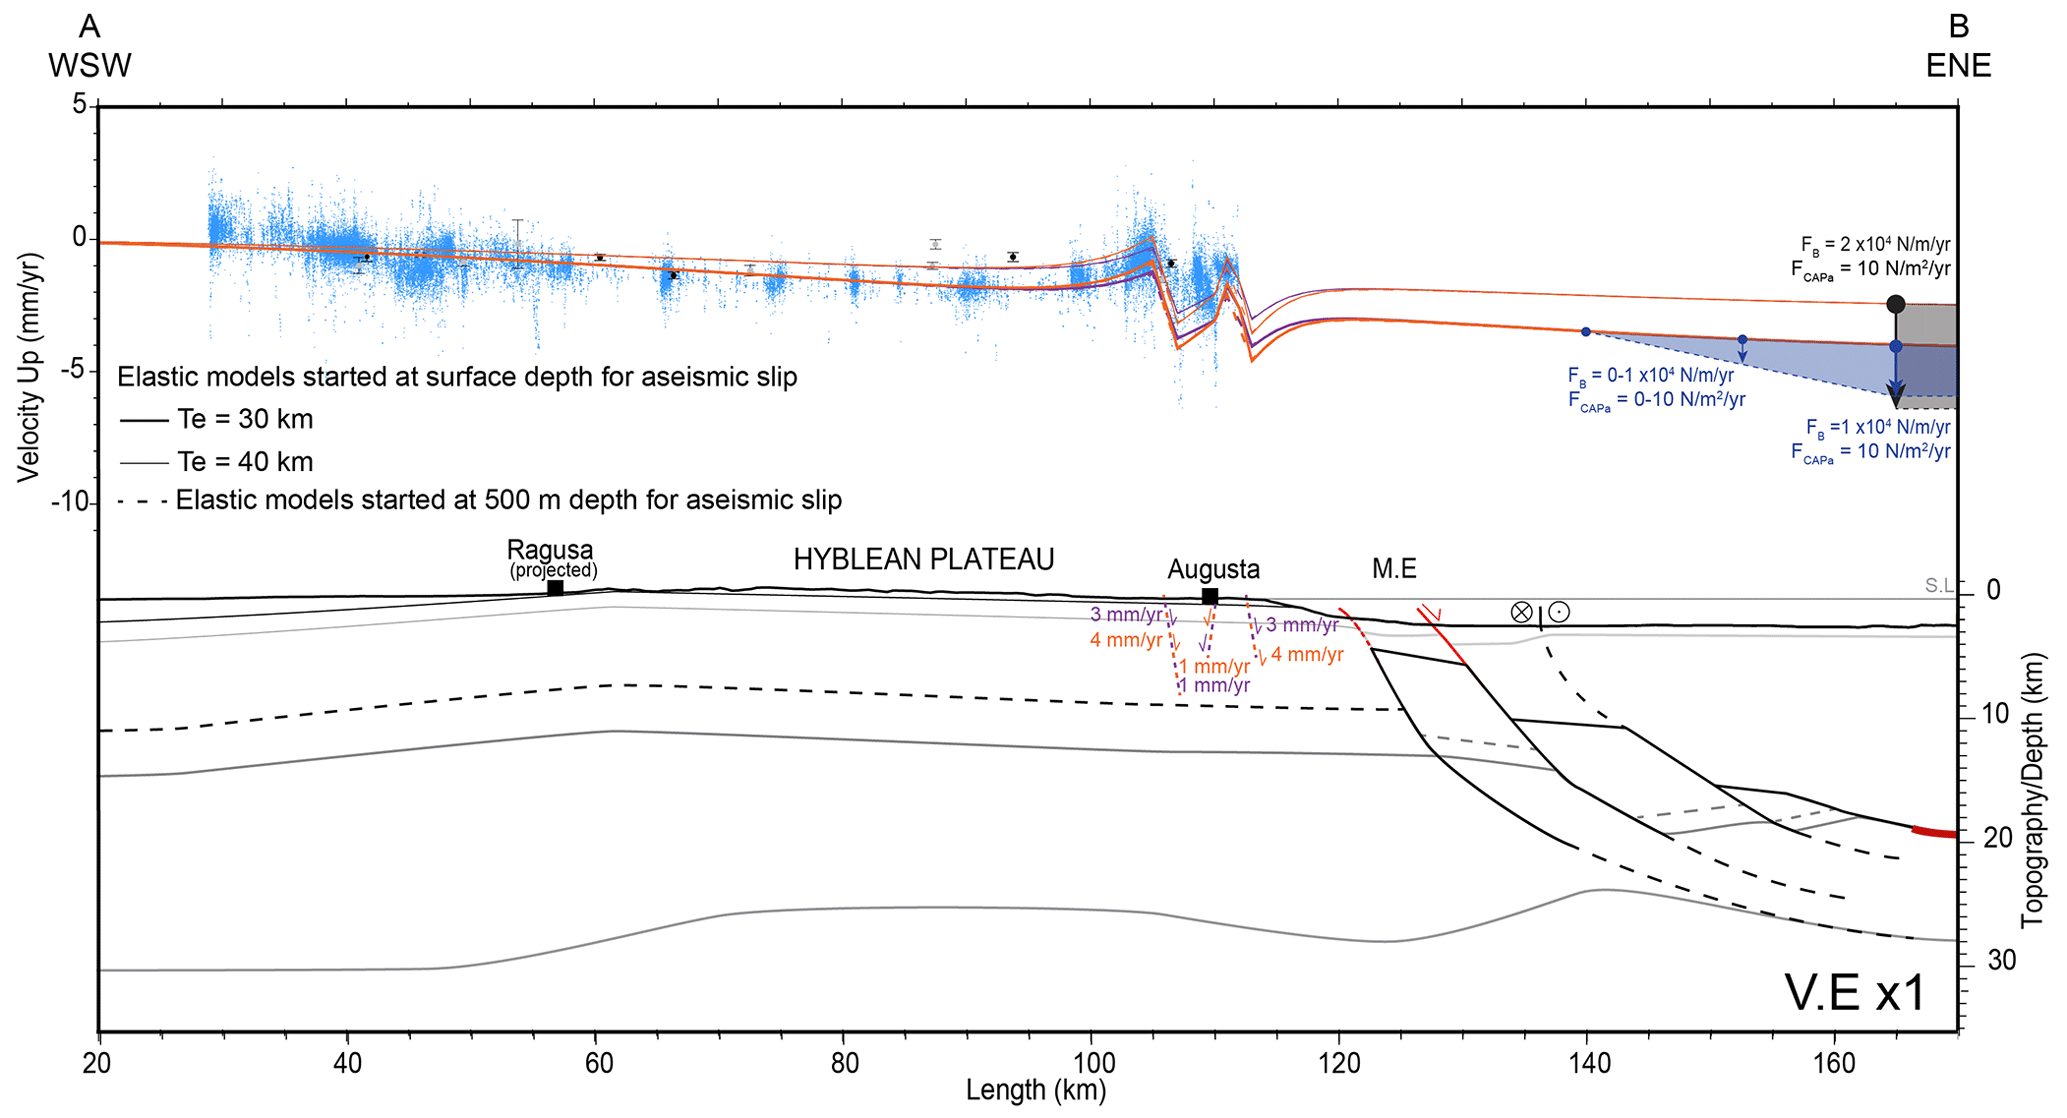
Figure 10The final model combining the possible range of the Hyblean continental crust flexural models and the surface deformation (step of 1 km) induced by fault creep (from the surface; continuous lines) or active folding in the Augusta–Siracusa coastal domain (from 500 m; dashed lines). In this model, the flexure of the Hyblean continental crust is essentially controlled by the bending force associated with the Ionian slab roll-back (FB) and, to a lesser extent, by the Calabrian accretionary prism load (FCAPa). The synthetic structural profile and topography have no vertical exaggeration (VEx1).
Interestingly, along the N30° E trending AB synthetic profile, a ∼1° generalized eastward tilting of the HP topography can be evidenced (Fig. 4a). The origin of this tilt, in apparent agreement with the geodetic data, could be linked to the Plio-Quaternary formation of the HP (Henriquet et al., 2019). Indeed, geological analyses suggest that the eastern coast of SE Sicily has been relatively stable over the last million years, with maximal subsidence and uplift amplitudes of ±0.2 mm yr−1 (Ferranti et al., 2006). More recently, dating of late Quaternary marine terraces along the Siracusa–Augusta coastal domain indicates that the eastern coast of the Hyblean Plateau has experienced a slow constant uplift during the last 500 kyr, increasing northward from 0.1 to 0.4 mm yr−1 (Meschis et al., 2020). On a shorter historical timescale based on Roman archeological site studies, Scicchitano et al. (2008) propose that the Siracusa coast has been slowly uplifting during the last 4 kyr, albeit with significant uncertainties. These long-term observations, extending from the Quaternary to historic time, point to slow regional uplift that is apparently at odds with geodetic data. However, it should be remembered that we have considered that PS-InSAR measurements primarily document the interseismic phase. At this stage, the part of the seismic cycle that generates uplift has not yet been taken into account. Previous calculations (Meschis et al., 2020) show that a Mw=7 earthquake on the active fault system at the base of the Malta Escarpment generates little coastal uplift, but early and late post-seismic deformation were not considered. In addition, a 500-year seismic cycle contains other earthquakes contributing to surface deformation than just a single M=7 event. To reconcile long- and short-timescale surface motions, we propose an original seismic cycle model driven by the southward roll-back of the Ionian oceanic slab (Fig. 11).
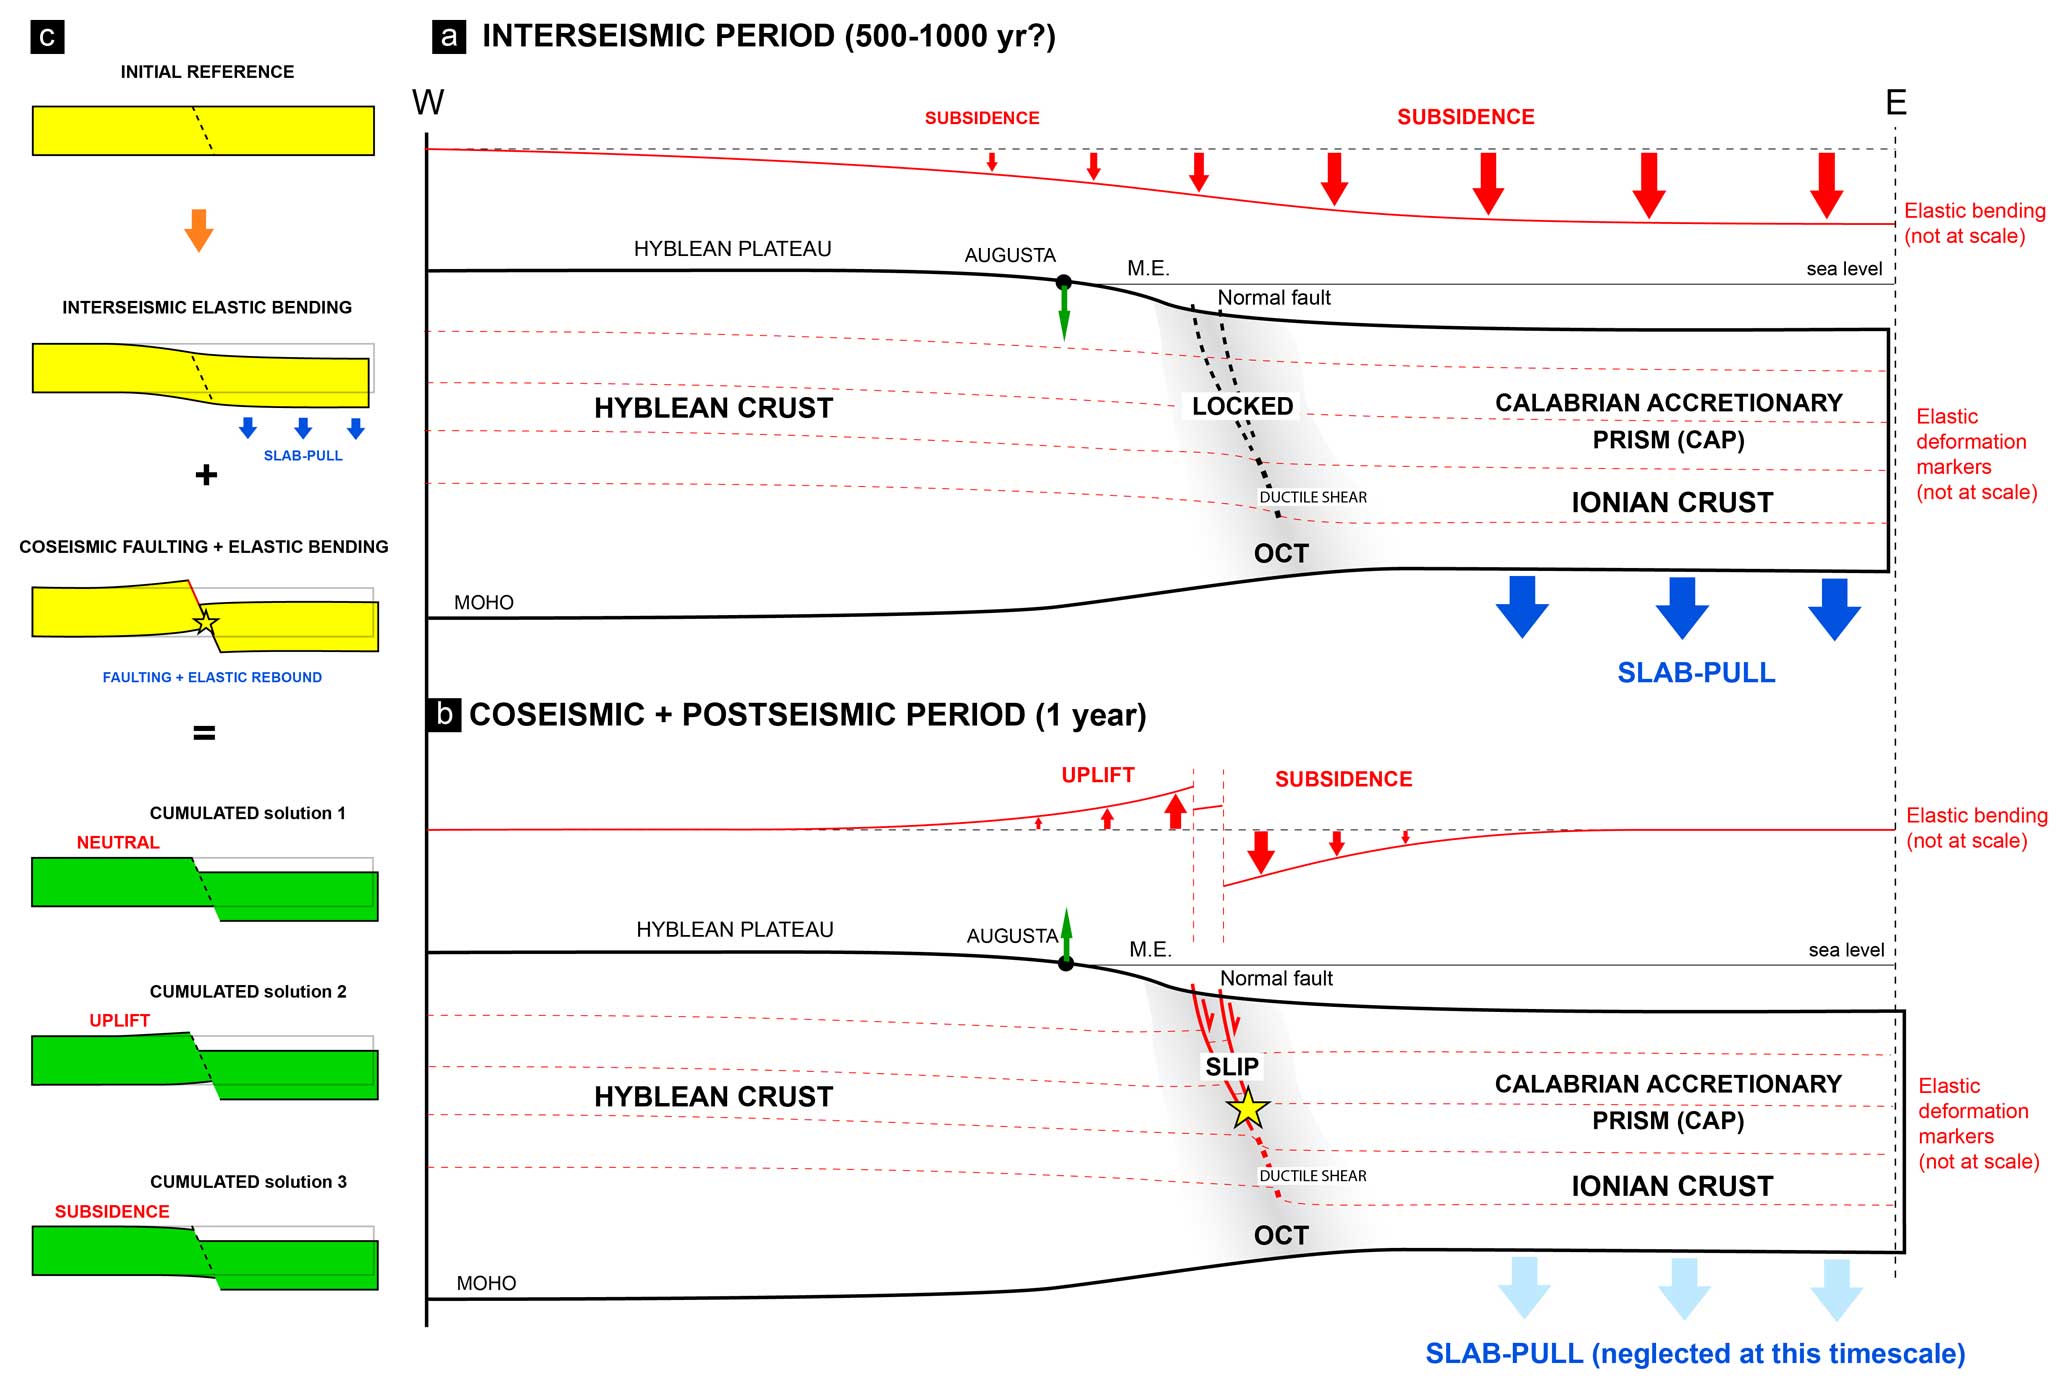
Figure 11Schematic model of the seismic cycle for southeastern Sicily, integrating crustal elastic bending and aseismic and seismic faulting controlled by slab pull. (a) Interseismic period, (b) coseismic and postseismic period, and (c) different scenarios of the cumulated interseismic, postseismic, and coseismic periods. This model could reconcile short- and long-term observations.
During the interseismic phase, the active offshore normal faults affecting the eastern HP and Malta Escarpment are locked. The Hyblean and Ionian crusts are coupled and can be compared to an elastic beam, bending eastward in response to an increasing downward vertical force, namely the slab pull induced by the Ionian slab roll-back (Fig. 11a). Considering a minimum 500-year return period for major earthquakes such as the 1693 Val di Noto event (Bianca et al., 1999; Meschis et al., 2020), and extrapolating the PS-InSAR measurements over this period, coastal subsidence along the Siracusa–Augusta region could reach 1–2 m. This subsidence could be dampened to 0.5–1 m if, at the same time, the onshore faults, potentially related to extrados deformation, creep aseismically. During the coseismic phase, the offshore fault unlocks, and the seismic slip induces (for a Mw>7 earthquake) a multi-metric subsidence of the hanging wall and an associated decimetric-to-metric uplift of the footwall (e.g., Wells and Coppersmith, 1994) (Fig. 11b).
The cumulated succession of interseismic coastal subsidence and coseismic uplift could result in three scenarios (Fig. 11c). If the coseismic coastal uplift equals the cumulated interseismic subsidence, the coastal domain remains stable in the long term. If the former is lower than the latter, as predicted by elastic modeling (Fig. 7a), the coast subsides. Conversely, long-term coastal uplift occurs if coseismic uplift surpasses interseismic subsidence. Considering that geological data suggest a slow coastal uplift, this last scenario should be preferred, but additional sources of footwall uplift should be identified (Ferranti et al., 2006; Meschis et al., 2020). At this stage, we can only evoke the following raw hypothesis:
-
The buoyancy of the flexed Hyblean crust could significantly increase post-seismic slip after major earthquakes and thus increase footwall uplift in the coastal region.
-
Further north along the coast, the Ionian slab plunges to great depths and is certainly detached from the Hyblean continental margin, owing to a tear fault propagation southward (e.g., Gutscher et al., 2016; Maesano et al., 2020), which could generate additional stress affecting the surface deformation of the studied region.
-
The inferred interseismic extrado deformation affecting the coastal domain could explain the slow long-term uplift (0.1–0.4 mm yr−1) off the eastern coast of the HP (e.g., Meschis et al., 2020). In that case, extrado deformation activity should be intermittent, alternating between aseismic fault slip/folding (as presently) and long periods of quiescence. Such a scenario remains speculative and needs to be mechanically tested.
-
Finally, the potential impact of a major subduction earthquake occurring along the Calabrian Arc on SE Sicily could also be considered (e.g., Gutscher et al., 2016; Carafa et al., 2018).
Present-day deformation of southeastern Sicily (Hyblean Plateau) reveals specific long- and short-wavelength signals indicating a generalized eastward tilting, reversing a few kilometers before reaching the eastern coast of the Hyblean Plateau.
We propose that the long-wavelength tilt and subsidence result from the flexure of the Hyblean continental crust in response to the bending force induced by the southward retreat of the Ionian subduction. Simple flexural modeling, using standard parameters (elastic thickness of 25–40 km, accretionary prism loading of 5–10 N m−2 yr−1, and a local increase in bending force of 1–3×10⁴ N m−1 yr−1 or gradually of 0 to 1–1.5×10⁴ N m−1 yr−1) support this interpretation.
We show that the short wavelength relative to the coastal uplift, measured geodetically, could be explained by shallow creep (at 1–4 mm yr−1) on ENE steeply dipping normal faults and be related to extrado deformation. Some morphologic evidence of surface deformation, correlated with leveling data indicating differential surface uplift, could corroborate this hypothesis. However, at this stage, the extrado deformation hypothesis has yet to be validated. We investigated other hypotheses, such as upwelling mantle flow, volcanic deflation, and hydrological loading, and found them much less plausible.
Finally, we propose an original seismic cycle model in which the surface deformation of southeastern Sicily is mainly controlled by a bending force induced by the Ionian slab roll-back that tilts the Hyblean Plateau eastward. During the interseismic period, the bending of the continental crust causes subsidence and aseismic extrados deformation along the eastern coast of the Hyblean Plateau. Meanwhile, the offshore normal faults of the continent–ocean transition, potentially sources of the origin of the 1693 earthquake, remain locked, and elastic strain accumulates. During a major earthquake, the coastal domain uplifts and compensates for the interseismic subsidence.
To further develop the formulated hypotheses, additional data are required, such as new high-resolution bathymetric data, onshore and offshore high-resolution seismic data (CHIRP), and on-site analysis to investigate inferred coastal active faults along the Augusta–Siracusa region. Besides, acquiring new PS-InSAR data would improve distinguishing geological processes from human activities. It will be also of interest to perform more advanced flexural models using 3D finite-element modeling techniques.
Coulomb 3.3 code is available at https://temblor.net/coulomb/ (Toda et al., 2011). gFlex code is available at https://github.com/awickert/gFlex (last access: April 2024) and https://doi.org/10.5281/zenodo.5034652 (Wickert et al., 2021). GMT code is available at https://github.com/GenericMappingTools/gmt/releases (Wessel and Smith, 1998).
Data supporting the material can be downloaded from the EaSy Data repository (https://doi.org/10.57932/e815ba97-b011-405d-8c8f-a74689941101, Dominguez and Viger, 2024).
The supplement related to this article is available online at: https://doi.org/10.5194/se-15-965-2024-supplement.
Data curation: AV and SD. Formal analysis: AV, SD, MP, SM, MH, GB, CM, and AD. Funding acquisition: SD. Resources: AV, SD, MH, GB, and CM. Software: AV, AD, MP, and SM. Visualization: AV and SD. Writing (original draft): AV and SD. Writing (review and editing): AV, SD, MP, SM, MH, GB, CM, and AD.
The contact author has declared that none of the authors has any competing interests.
Publisher's note: Copernicus Publications remains neutral with regard to jurisdictional claims made in the text, published maps, institutional affiliations, or any other geographical representation in this paper. While Copernicus Publications makes every effort to include appropriate place names, the final responsibility lies with the authors.
This study has been funded by the CNRS-INSU-Tellus programs and the University of Montpellier (UM). We would like to thank Mara Monica Tiberti and Andrea Argnani for their relevant and detailed reviews which significantly improved the submitted work. The maps and graphics presented in this study were generated using the Generic Mapping Tools (GMT) software (Wessel and Smith, 1998). We are grateful to Serge Lallemand and Nestor Cerpa for helpful discussions on subduction zone dynamics and flexural modeling.
This research has been supported by the Centre National de la Recherche Scientifique (CNRS INSU-Tellus program).
This paper was edited by Stefano Tavani and reviewed by Andrea Argnani and one anonymous referee.
Adam, J., Reuther, C. D., Grasso, M., and Torelli, L.: Active fault kinematics and crustal stresses along the Ionian margin of southeastern Sicily, Tectonophysics, 326, 217–239, https://doi.org/10.1016/S0040-1951(00)00141-4, 2000. a, b, c
Afilhado, A., Moulin, M., Aslanian, D., Schnürle, P., Klingelhoefer, F., Nouzé, H., Rabineau, M., Leroux, E., and Beslier, M.-O.: Deep crustal structure across a young passive margin from wide-angle and reflection seismic data (The SARDINIA Experiment) – II. Sardinia's margin, Bulletin de la Société Géologique de France, 186, 331–351, https://doi.org/10.2113/gssgfbull.186.4-5.331, 2015. a
Almeida, J., Riel, N., Rosas, F. M., Duarte, J. C., and Schellart, W. P.: Polarity-reversal subduction zone initiation triggered by buoyant plateau obstruction, Earth Planet. Sc. Lett., 577, 117195, https://doi.org/10.1016/j.epsl.2021.117195, 2022. a
Altamimi, Z., Rebischung, P., Métivier, L., and Collilieux, X.: ITRF2014: A new release of the International Terrestrial Reference Frame modeling nonlinear station motions, J. Geophys. Res.-Solid, 121, 6109–6131, https://doi.org/10.1002/2016JB013098, 2016. a, b
Anzidei, M., Scicchitano, G., Scardino, G., Bignami, C., Tolomei, C., Vecchio, A., Serpelloni, E., De Santis, V., Monaco, C., Milella, M., Piscitelli, A., and Mastronuzzi, G.: Relative Sea-Level Rise Scenario for 2100 along the Coast of South Eastern Sicily (Italy) by InSAR Data, Satellite Images and High-Resolution Topography, Remote Sens., 13, 1108, https://doi.org/10.3390/rs13061108, 2021. a
APAT: Carta geologica d'Italia Scala 1:1 250 000, https://www.isprambiente.gov.it/images/progetti/progetto-1250-ita.jpg (last access: 19 September 2023), 2005. a
Argnani, A.: Commentary: Deformation Pattern of the Northern Sector of the Malta Escarpment (Offshore SE Sicily, Italy): Fault Dimension, Slip Prediction, and Seismotectonic Implications, Front. Earth Sci., 9, 770364, https://doi.org/10.3389/feart.2021.770364, 2021. a
Argnani, A. and Bonazzi, C.: Malta Escarpment fault zone offshore eastern Sicily: Pliocene-Quaternary tectonic evolution based on new multichannel seismic data, Tectonics, 24, TC4009, https://doi.org/10.1029/2004TC001656, 2005. a, b, c, d, e, f, g, h
Argnani, A., Armigliato, A., Pagnoni, G., Zaniboni, F., Tinti, S., and Bonazzi, C.: Active tectonics along the submarine slope of south-eastern Sicily and the source of the 11 January 1693 earthquake and tsunami, Nat. Hazards Earth Syst. Sci., 12, 1311–1319, https://doi.org/10.5194/nhess-12-1311-2012, 2012. a, b
Azzaro, R. and Barbano, M. S.: Analysis of the seismicity of Southeastern Sicily: a proposed tectonic interpretation, https://doi.org/10.4401/ag-3628, 2000. a, b, c, d, e
Barreca, G.: Geological and geophysical evidences for mud diapirism in south-eastern Sicily (Italy) and geodynamic implications, J. Geodynam., 82, 168–177, https://doi.org/10.1016/j.jog.2014.02.003, 2014. a
Behncke, B.: Late Pliocene volcanic island growth and flood basalt-like lava emplacement in the Hyblean Mountains (SE Sicily): Late Pliocene Hyblean Volcanism, J. Geophys. Res.-Solid, 109, B09201, https://doi.org/10.1029/2003JB002937, 2004. a
Bianca, M., Monaco, C., Tortorici, L., and Cernobori, L.: Quaternary normal faulting in southeastern Sicily (Italy): a seismic source for the 1693 large earthquake, Geophys. J. Int., 139, 370–394, https://doi.org/10.1046/j.1365-246x.1999.00942.x, 1999. a, b, c, d, e, f, g, h, i, j, k
Bigi, G., Cosentino, D., Parlotto, M., and Sartori, R.: Structural model of Italy, sheet 6, National Council of Researches Roma, https://www.socgeol.it/438/structural-model-of-italy-scale-1-500-000.html, (last access: 17 July 2024), 1991. a
Blewitt, G., Hammond, W., and Kreemer, C.: Harnessing the GPS Data Explosion for Interdisciplinary Science, Eos, 99, https://doi.org/10.1029/2018eo104623, 2018. a
Burgmann, R. and Thatcher, W.: Space geodesy: A revolution in crustal deformation measurements of tectonic processes, Special Paper of the Geological Society of America, 500, 397–430, https://doi.org/10.1130/2013.2500(12), 2013. a
Canova, F., Tolomei, C., Salvi, S., Toscani, G., and Seno, S.: Land subsidence along the Ionian coast of SE Sicily (Italy), detection and analysis via Small Baseline Subset (SBAS) multitemporal differential SAR interferometry: Land Subsidence Along The Ionian Coast Of SE Silicy (Italy), Earth Surf. Proc. Land., 37, 273–286, https://doi.org/10.1002/esp.2238, 2012. a, b
Carafa, M. M. C., Kastelic, V., Bird, P., Maesano, F. E., and Valensise, G.: A “Geodetic Gap” in the Calabrian Arc: Evidence for a Locked Subduction Megathrust?, Geophys. Res. Lett., 45, 1794–1804, https://doi.org/10.1002/2017GL076554, 2018. a
Carminati, E. and Doglioni, C.: Mediterranean Tectonics, in: Encyclopedia of Geology, 135–146, https://doi.org/10.1016/B0-12-369396-9/00135-0, 2005. a
Carminati, E., Lustrino, M., and Doglioni, C.: Geodynamic evolution of the central and western Mediterranean: Tectonics vs. igneous petrology constraints, Tectonophysics, 579, 173–192, https://doi.org/10.1016/j.tecto.2012.01.026, 2012. a
Catalano, R., Doglioni, C., and Merlini, S.: On the Mesozoic Ionian Basin, Geophys. J. Int., 144, 49–64, https://doi.org/10.1046/j.0956-540X.2000.01287.x, 2001. a
Chen, Y.-G., Lai, K.-Y., Lee, Y.-H., Suppe, J., Chen, W.-S., Lin, Y.-N. N., Wang, Y., Hung, J.-H., and Kuo, Y.-T.: Coseismic fold scarps and their kinematic behavior in the 1999 Chi-Chi earthquake Taiwan, J. Geophys. Res.-Solid, 112, B03S02, https://doi.org/10.1029/2006JB004388, 2007. a
Civello, S. and Margheriti, L.: Toroidal mantle flow around the Calabrian slab (Italy) from SKS splitting: Toroidal Flow Around The Calabrian Slab, Geophys. Res. Lett., 31, L10601, https://doi.org/10.1029/2004GL019607, 2004. a
Cloetingh, S., Ziegler, P., Beekman, F., Burov, E., Garcia-Castellanos, D., and Matenco, L.: Tectonic Models for the Evolution of Sedimentary Basins, in: Treatise on Geophysics, Elsevier, 513–592, ISBN 978-0-444-53803-1, https://doi.org/10.1016/B978-0-444-53802-4.00117-2, 2015. a
Cultrera, F., Barreca, G., Scarfì, L., and Monaco, C.: Fault reactivation by stress pattern reorganization in the Hyblean foreland domain of SE Sicily (Italy) and seismotectonic implications, Tectonophysics, 661, 215–228, https://doi.org/10.1016/j.tecto.2015.08.043, 2015. a, b, c
D'Agostino, N., D'Anastasio, E., Gervasi, A., Guerra, I., Nedimović, M. R., Seeber, L., and Steckler, M.: Forearc extension and slow rollback of the Calabrian Arc from GPS measurements, Geophys. Res. Lett., 38, L17304, https://doi.org/10.1029/2011GL048270, 2011. a, b
D'Agostino, N., Silverii, F., Amoroso, O., Convertito, V., Fiorillo, F., Ventafridda, G., and Zollo, A.: Crustal Deformation and Seismicity Modulated by Groundwater Recharge of Karst Aquifers, Geophys. Res. Lett., 45, 12253–12262, https://doi.org/10.1029/2018GL079794, 2018. a
Dellong, D., Klingelhoefer, F., Kopp, H., Graindorge, D., Margheriti, L., Moretti, M., Murphy, S., and Gutscher, M.-A.: Crustal Structure of the Ionian Basin and Eastern Sicily Margin: Results From a Wide-Angle Seismic Survey, J. Geophys. Res.-Solid, 123, 2090–2114, https://doi.org/10.1002/2017JB015312, 2018. a, b, c, d, e, f, g, h, i, j, k, l
Dellong, D., Klingelhoefer, F., Dannowski, A., Kopp, H., Murphy, S., Graindorge, D., Margheriti, L., Moretti, M., Barreca, G., Scarfì, L., Polonia, A., and Gutscher, M.-A.: Geometry of the Deep Calabrian Subduction (Central Mediterranean Sea) From Wide-Angle Seismic Data and 3-D Gravity Modeling, Geochem. Geophy. Geosy., 21, 2019GC008586, https://doi.org/10.1029/2019GC008586, 2020. a, b, c, d, e, f, g, h, i, j, k
Dominguez, S. and Viger, A.: Interseismic and long-term deformation of southeastern sicily driven by the ionian slab roll-back, EaSy Data [data set], 2024. a
Faccenna, C., Becker, T. W., Lucente, F. P., Jolivet, L., and Rossetti, F.: History of subduction and back-arc extension in the Central Mediterranean, Geophys. J. Int., 145, 809–820, https://doi.org/10.1046/j.0956-540x.2001.01435.x, 2001. a
Faccenna, C., Civetta, L., D'Antonio, M., Funiciello, F., Margheriti, L., and Piromallo, C.: Constraints on mantle circulation around the deforming Calabrian slab, Geophys. Res. Lett., 32, L06311, https://doi.org/10.1029/2004GL021874, 2005. a
Faccenna, C., Molin, P., Orecchio, B., Olivetti, V., Bellier, O., Funiciello, F., Minelli, L., Piromallo, C., and Billi, A.: Topography of the Calabria subduction zone (southern Italy): Clues for the origin of Mt. Etna, Tectonics, 30, 2010TC002694, https://doi.org/10.1029/2010TC002694, 2011. a
Ferranti, L., Antonioli, F., Mauz, B., Amorosi, A., Dai Pra, G., Mastronuzzi, G., Monaco, C., Orrù, P., Pappalardo, M., Radtke, U., Renda, P., Romano, P., Sansò, P., and Verrubbi, V.: Markers of the last interglacial sea-level high stand along the coast of Italy: Tectonic implications, Quatern. Int., 145–146, 30–54, https://doi.org/10.1016/j.quaint.2005.07.009, 2006. a, b, c
Ferranti, L., Antonioli, F., Anzidei, M., Monaco, C., and Stocchi, P.: The timescale and spatial extent of recent vertical tectonic motions in Italy: insights from relative sea-level changes studies, J. Virt. Explor., 36, 23, https://doi.org/10.3809/jvirtex.2010.00255, 2010. a
Finetti, I. R., Lentini, F., Carbone, S., Del Ben, A., Di Stefano, A., Forlin, E., Guarnieri, P., Pipan, M., and Prizzon, A.: Geological outline of Sicily and lithospheric tectono-dynamics of its Tyrrhenian margin from new CROP seismic data, CROP Project: deep seismic exploration of the central Mediterranean and Italy, https://hdl.handle.net/11368/1746186, 319–375, 2005. a, b
Frizon De Lamotte, D., Raulin, C., Mouchot, N., Wrobel-Daveau, J.-C., Blanpied, C., and Ringenbach, J.-C.: The southernmost margin of the Tethys realm during the Mesozoic and Cenozoic: Initial geometry and timing of the inversion processes, Tectonics, 30, 2010TC002691, https://doi.org/10.1029/2010TC002691, 2011. a
Funiciello, R., Parotto, M., Praturlon, A., and Bigi, G.: Carta tettonica d'Italia alla scala 1:1.500.000, CNR Progetto Finalizzato Geodinamica, Publ., 269 pp. https://www.scirp.org/reference/referencespapers?referenceid=1556836 (last access: 15 April 2020), 1981. a
Gallen, S. F., Seymour, N. M., Glotzbach, C., Stockli, D. F., and O'Sullivan, P.: Calabrian forearc uplift paced by slab–mantle interactions during subduction retreat, Nat. Geosci., 16, 513–520, https://doi.org/10.1038/s41561-023-01185-4, 2023. a
Gambino, S., Barreca, G., Gross, F., Monaco, C., Krastel, S., and Gutscher, M.-A.: Deformation Pattern of the Northern Sector of the Malta Escarpment (Offshore SE Sicily, Italy): Fault Dimension, Slip Prediction, and Seismotectonic Implications, Front. Earth Sci., 8, 594176, https://doi.org/10.3389/feart.2020.594176, 2021. a, b, c, d, e, f, g, h, i, j, k
Gambino, S., Barreca, G., Bruno, V., De Guidi, G., Ferlito, C., Gross, F., Mattia, M., Scarfì, L., and Monaco, C.: Transtension at the Northern Termination of the Alfeo-Etna Fault System (Western Ionian Sea, Italy): Seismotectonic Implications and Relation with Mt. Etna Volcanism, Geosciences, 12, 128, https://doi.org/10.3390/geosciences12030128, 2022a. a, b
Gambino, S., Barreca, G., Gross, F., Monaco, C., Gutscher, M.-A., and Alsop, G. I.: Assessing the rate of crustal extension by 2D sequential restoration analysis: A case study from the active portion of the Malta Escarpment, Basin Res., 34, 321–341, https://doi.org/10.1111/bre.12621, 2022b. a, b, c, d, e, f, g
Goes, S., Giardini, D., Jenny, S., Hollenstein, C., Kahle, H. G., and Geiger, A.: A recent tectonic reorganization in the south-central Mediterranean, Earth Planet. Sc. Lett., 226, 335–345, https://doi.org/10.1016/j.epsl.2004.07.038, 2004. a
Grasso, M. t. and Lentini, F.: Sedimentary and tectonic evolution of the eastern Hyblean Plateau (southeastern Sicily) during late Cretaceous to Quaternary time, Palaeogeogr. Palaeoclim. Palaeoecol., 39, 261–280, 1982. a
Grillo, B., Braitenberg, C., Devoti, R., and Nagy, I.: The study of karstic aquifers by geodetic measurements in Bus de la Genziana station – Cansiglio plateau (Northeastern Italy), Acta Carsolog., 40, 161–173, https://doi.org/10.3986/ac.v40i1.35, 2011. a
Gueguen, E., Doglioni, C., and Fernandez, M.: On the post-25 Ma geodynamic evolution of the western Mediterranean, Tectonophysics, 298, 259–269, https://doi.org/10.1016/S0040-1951(98)00189-9, 1998. a, b
Gutscher, M.-A., Roger, J., Baptista, M.-A., Miranda, J. M., and Tinti, S.: Source of the 1693 Catania earthquake and tsunami (southern Italy): New evidence from tsunami modeling of a locked subduction fault plane, Geophys. Res. Lett., 33, L08309, https://doi.org/10.1029/2005GL025442, 2006. a
Gutscher, M.-A., Dominguez, S., de Lepinay, B. M., Pinheiro, L., Gallais, F., Babonneau, N., Cattaneo, A., Le Faou, Y., Barreca, G., Micallef, A., and Rovere, M.: Tectonic expression of an active slab tear from high-resolution seismic and bathymetric data offshore Sicily (Ionian Sea), Tectonics, 35, 39–54, https://doi.org/10.1002/2015TC003898, 2016. a, b, c, d, e, f, g, h, i
Handy, M. R., M. Schmid, S., Bousquet, R., Kissling, E., and Bernoulli, D.: Reconciling plate-tectonic reconstructions of Alpine Tethys with the geological–geophysical record of spreading and subduction in the Alps, Earth-Sci. Rev., 102, 121–158, https://doi.org/10.1016/j.earscirev.2010.06.002, 2010. a, b
Handy, M. R., Ustaszewski, K., and Kissling, E.: Reconstructing the Alps–Carpathians–Dinarides as a key to understanding switches in subduction polarity, slab gaps and surface motion, Int. J. Earth Sci., 104, 1–26, https://doi.org/10.1007/s00531-014-1060-3, 2015. a
Hayes, G. P., Moore, G. L., Portner, D. E., Hearne, M., Flamme, H., Furtney, M., and Smoczyk, G. M.: Slab2, a comprehensive subduction zone geometry model, Science, 362, 58–61, https://doi.org/10.1126/science.aat4723, 2018. a, b, c, d, e, f, g
Henriquet, M., Dominguez, S., Barreca, G., Malavieille, J., Cadio, C., and Monaco, C.: Deep Origin of the Dome-Shaped Hyblean Plateau, Southeastern Sicily: A New Tectono-Magmatic Model, Tectonics, 38, 4488–4515, https://doi.org/10.1029/2019TC005548, 2019. a, b, c, d, e, f, g
Henriquet, M., Dominguez, S., Barreca, G., Malavieille, J., and Monaco, C.: Structural and tectono-stratigraphic review of the Sicilian orogen and new insights from analogue modeling, Earth-Sci. Rev., 208, 103257, https://doi.org/10.1016/j.earscirev.2020.103257, 2020. a, b, c
Henriquet, M., Peyret, M., Dominguez, S., Barreca, G., Monaco, C., and Mazzotti, S.: Present-Day Surface Deformation of Sicily Derived From Sentinel-1 InSAR Time-Series, J. Geophys. Res.-Solid, 127, e2021JB023071, https://doi.org/10.1029/2021JB023071, 2022. a, b, c, d, e, f, g, h, i
INGV – Istituto Nazionale di Geofisica e Vulcanologia: Rete Sismica Nazionale (RSN), approx. 27 GB per day of new waveform data, approx. 415 active seismic stations, the archive totals to more than 600 distinct seismic stations, https://doi.org/10.13127/SD/X0FXNH7QFY, 2005. a
Jolivet, L.: Tethys and Apulia (Adria), 100 years of reconstructions, Comptes Rendus Géoscience, 355, 9–28, https://doi.org/10.5802/crgeos.198, 2023. a
Klingelhoefer, F., Déverchère, J., Graindorge, D., Aïdi, C., Badji, R., Bouyahiaoui, B., Leprêtre, A., Mihoubi, A., Beslier, M.-O., Charvis, P., Schnurle, P., Sage, F., Medaouri, M., Arab, M., Bracene, R., Yelles-Chaouche, A., Badsi, M., Galvé, A., and Géli, L.: Formation, segmentation and deep crustal structure variations along the Algerian margin from the SPIRAL seismic experiment, J. Afr. Earth Sci., 186, 104433, https://doi.org/10.1016/j.jafrearsci.2021.104433, 2022. a
Kreemer, C., Blewitt, G., and Klein, E. C.: A geodetic plate motion and Global Strain Rate Model, Geochem. Geophy. Geosy., 15, 3849–3889, https://doi.org/10.1002/2014GC005407, 2014. a
Lallemand, S., Heuret, A., Faccenna, C., and Funiciello, F.: Subduction dynamics as revealed by trench migration: Subduction Dynamics, Tectonics, 27, TC3014, https://doi.org/10.1029/2007TC002212, 2008. a
Lentini, F. and Carbone, S.: Geologia della Sicilia-geology of Sicily, Memorie Descr, Carta Geologica d'Italia, 95, 7–414, 2014. a, b, c
Levandowski, W., Herrmann, R. B., Briggs, R., Boyd, O., and Gold, R.: An updated stress map of the continental United States reveals heterogeneous intraplate stress, Nat. Geosci., 11, 433–437, https://doi.org/10.1038/s41561-018-0120-x, 2018. a, b
Li, T., Chen, J., Thompson, J. A., Burbank, D. W., and Yang, H.: Hinge-migrated fold-scarp model based on an analysis of bed geometry: A study from the Mingyaole anticline, southern foreland of Chinese Tian Shan, J. Geophys. Res.-Solid, 120, 6592–6613, https://doi.org/10.1002/2015JB012102, 2015. a
Lipparini, L., Chiacchieri, D., Bencini, R., and Micallef, A.: Extensive freshened groundwater resources emplaced during the Messinian sea-level drawdown in southern Sicily, Italy, Commun. Earth Environ., 4, 430, https://doi.org/10.1038/s43247-023-01077-w, 2023. a, b, c
Maesano, F. E., Tiberti, M. M., and Basili, R.: The Calabrian Arc: three-dimensional modelling of the subduction interface, Sci. Rep., 7, 8887, https://doi.org/10.1038/s41598-017-09074-8, 2017. a, b, c
Maesano, F. E., Tiberti, M. M., and Basili, R.: Deformation and fault propagation at the lateral termination of a subduction zone: the Alfeo Fault System in the Calabrian Arc, southern Italy, Front. Earth Sci., 8, 107, https://doi.org/10.3389/feart.2020.00107, 2020. a
Masson, C., Mazzotti, S., and Vernant, P.: Precision of continuous GPS velocities from statistical analysis of synthetic time series, Solid Earth, 10, 329–342, https://doi.org/10.5194/se-10-329-2019, 2019. a
Mastrolembo Ventura, B., Serpelloni, E., Argnani, A., Bonforte, A., Burgmann, R., Anzidei, M., Baldi, P., and Puglisi, G.: Fast geodetic strain-rates in eastern Sicily (southern Italy): New insights into block tectonics and seismic potential in the area of the great 1693 earthquake, Earth Planet. Sc. Lett., 404, 77–88, https://doi.org/10.1016/j.epsl.2014.07.025, 2014. a
Mattia, M., Bruno, V., Cannavò, F., and Palano, M.: Evidences of a contractional pattern along the northern rim of the Hyblean Plateau (Sicily, Italy) from GPS data, Geolog. Acta, 10, 1–8, 2012. a, b
Mazzotti, S., James, T. S., Henton, J., and Adams, J.: GPS crustal strain, postglacial rebound, and seismic hazard in eastern North America: The Saint Lawrence valley example: Crustal Strain In Saint Lawrence Valley, J. Geophys. Res.-Solid, 110, B11301, https://doi.org/10.1029/2004JB003590, 2005. a
Meschis, M., Scicchitano, G., Roberts, G. P., Robertson, J., Barreca, G., Monaco, C., Spampinato, C., Sahy, D., Antonioli, F., Mildon, Z. K., and Scardino, G.: Regional Deformation and Offshore Crustal Local Faulting as Combined Processes to Explain Uplift Through Time Constrained by Investigating Differentially Uplifted Late Quaternary Paleoshorelines: The Foreland Hyblean Plateau, SE Sicily, Tectonics, 39, e2020TC006187, https://doi.org/10.1029/2020TC006187, 2020. a, b, c, d, e, f, g, h, i
Michael, A. J.: Determination of stress from slip data: Faults and folds, J. Geophys. Res.-Solid, 89, 11517–11526, https://doi.org/10.1029/JB089iB13p11517, 1984. a
Milano, M., Kelemework, Y., La Manna, M., Fedi, M., Montanari, D., and Iorio, M.: Crustal structure of Sicily from modelling of gravity and magnetic anomalies, Sci. Rep., 10, 16019, https://doi.org/10.1038/s41598-020-72849-z, 2020. a
Minelli, L. and Faccenna, C.: Evolution of the Calabrian accretionary wedge (central Mediterranean): Calabrian Accretionary Wedge, Tectonics, 29, TC4004, https://doi.org/10.1029/2009TC002562, 2010. a
Mogi, K.: Relations between the eruptions of various volcanoes and the deformations of the ground surfaces around them, Earthquake Research Institute, 36, 99–134, 1958. a
Monaco, C. and Tortorici, L.: Active faulting in the Calabrian arc and eastern Sicily, J. Geodynam., 29, 407–424, 2000. a
Palano, M., Ferranti, L., Monaco, C., Mattia, M., Aloisi, M., Bruno, V., Cannavò, F., and Siligato, G.: GPS velocity and strain fields in Sicily and southern Calabria, Italy: Updated geodetic constraints on tectonic block interaction in the central Mediterranean, J. Geophys. Res.-Solid, 117, B07401, https://doi.org/10.1029/2012JB009254, 2012. a
Polonia, A., Torelli, L., Artoni, A., Carlini, M., Faccenna, C., Ferranti, L., Gasperini, L., Govers, R., Klaeschen, D., Monaco, C., Neri, G., Nijholt, N., Orecchio, B., and Wortel, R.: The Ionian and Alfeo–Etna fault zones: New segments of an evolving plate boundary in the central Mediterranean Sea?, Tectonophysics, 675, 69–90, https://doi.org/10.1016/j.tecto.2016.03.016, 2016. a
Prada, M., Sallarès, V., Ranero, C. R., Vendrell, M. G., Grevemeyer, I., Zitellini, N., and de Franco, R.: Seismic stucture of the Central Tyrrhenian basin: Geophysical constraints on the nature of the main crustal domains, J. Geophys. Res.-Sol. Ea., 119, 52–70, https://doi.org/10.1002/2013JB010527, 2014. a
Rosenbaum, G., Lister, G. S., and Duboz, C.: Reconstruction of the tectonic evolution of the western Mediterranean since the Oligocene, J. Virt. Explor., 8, 107–130, https://doi.org/10.3809/jvirtex.2002.00053, 2002. a
Rovida, A., Locati, M., Camassi, R., Lolli, B., Gasperini, P., and Antonucci, A.: Catalogo Parametrico dei Terremoti Italiani (CPTI15), versione 4.0, INGV, https://doi.org/10.13127/CPTI/CPTI15.4, 2022. a, b, c
Sapin, F., Ringenbach, J.-C., and Clerc, C.: Rifted margins classification and forcing parameters, Sci. Rep., 11, 8199, https://doi.org/10.1038/s41598-021-87648-3, 2021. a
Scandone, P., Patacca, E., Radoicic, R., Ryan, W. B. F., Cita, M. B., Rawson, M., Chezar, H., Miller, E., McKenzie, J., and Rossi, S.: Mesozoic and Cenozoic rocks from Malta escarpment (central Mediterranean), AAPG Bull., 65, 1299–1319, 1981. a
Scarfì, L., Barberi, G., Barreca, G., Cannavò, F., Koulakov, I., and Patanè, D.: Slab narrowing in the Central Mediterranean: the Calabro-Ionian subduction zone as imaged by high resolution seismic tomography, Sci. Rep., 8, 5178, https://doi.org/10.1038/s41598-018-23543-8, 2018. a, b, c, d, e
Schmincke, H.-U., Behncke, B., Grasso, M., and Raffi, S.: Evolution of the northwestern Iblean Mountains, Sicily: uplift, Plicocene/Pleistocene sea-level changes, paleoenvironment, and volcanism, Geol. Rundsch., 86, 637–669, 1997. a
Scicchitano, G., Antonioli, F., Berlinghieri, E. F. C., Dutton, A., and Monaco, C.: Submerged archaeological sites along the Ionian coast of southeastern Sicily (Italy) and implications for the Holocene relative sea-level change, Quatern. Res., 70, 26–39, https://doi.org/10.1016/j.yqres.2008.03.008, 2008. a, b
Scicchitano, G., Gambino, S., Scardino, G., Barreca, G., Gross, F., Mastronuzzi, G., and Monaco, C.: The enigmatic 1693 AD tsunami in the eastern Mediterranean Sea: new insights on the triggering mechanisms and propagation dynamics, Sci. Rep., 12, 9573, https://doi.org/10.1038/s41598-022-13538-x, 2022. a
Scognamiglio, L., Tinti, E., and Quintiliani, M.: Time Domain Moment Tensor (TDMT), Instituto Nazionale Di Geofisica E Vulcanologia, https://doi.org/10.13127/TDMT, 2006. a
Sgroi, T., de Nardis, R., and Lavecchia, G.: Crustal structure and seismotectonics of central Sicily (southern Italy): new constraints from instrumental seismicity, Geophys. J. Int., 189, 1237–1252, 2012. a
Silverii, F., D'Agostino, N., Métois, M., Fiorillo, F., and Ventafridda, G.: Transient deformation of karst aquifers due to seasonal and multiyear groundwater variations observed by GPS in southern Apennines (Italy), J. Geophys. Res.-Solid, 121, 8315–8337, https://doi.org/10.1002/2016JB013361, 2016. a
S.I.T.R. regione Siciliana: Scheda metadato DATASET Modello digitale del terreno (MDT) 2 m, Volo ATA 2012 2013, Regione Siciliana, S.I.T.R. Infrastruttura Dati Territoriali, https://www.sitr.regione.sicilia.it/geoportale/it/metadata/details/946 (last access: 8 April 2024), 2013. a
Spampinato, C. R., Braitenberg, C., Monaco, C., and Scicchitano, G.: Analysis of vertical movements in eastern Sicily and southern Calabria (Italy) through geodetic leveling data, J. Geodynam., 66, 1–12, https://doi.org/10.1016/j.jog.2012.12.002, 2013. a, b, c, d
Speranza, F., Minelli, L., Pignatelli, A., and Chiappini, M.: The Ionian Sea: The oldest in situ ocean fragment of the world: Magnetic Modelling Of The Ionian Sea, J. Geophys. Res.-Solid, 117, B12101, https://doi.org/10.1029/2012JB009475, 2012. a
Stampfli, G., Borel, G., Marchant, R., and Mosar, J.: Western Alps geological constraints on western Tethyan reconstructions, J. Virt. Explor., 08, 75–104, https://doi.org/10.3809/jvirtex.2002.00057, 2002. a
Stephenson, O. L., Liu, Y.-K., Yunjun, Z., Simons, M., Rosen, P., and Xu, X.: The Impact of Plate Motions on Long-Wavelength InSAR-Derived Velocity Fields, Geophys. Res. Lett., 49, e2022GL099835, https://doi.org/10.1029/2022GL099835, 2022. a
Tesauro, M., Audet, P., Kaban, M. K., Bürgmann, R., and Cloetingh, S.: The effective elastic thickness of the continental lithosphere: Comparison between rheological and inverse approaches: Te Of The Continental Litosphere, Geochem. Geophy. Geosy., 13, Q09001, https://doi.org/10.1029/2012GC004162, 2012. a
Toda, S., Stein, R. S., Sevilgen, V., and Lin, J.: Coulomb 3.3 Graphic-rich deformation and stress-change software for earthquake, tectonic, and volcano research and teaching – user guide, US Geological Survey open-file report 1060, US Geological Survey, 63 pp. https://pubs.usgs.gov/of/2011/1060/ (last access: 17 July 2024), 2011. a, b, c
Trua, T., Serri, G., and Marani, M. P.: Lateral flow of African mantle below the nearby Tyrrhenian plate: geochemical evidence, Terra Nova, 15, 433–440, https://doi.org/10.1046/j.1365-3121.2003.00509.x, 2003. a
Tugend, J., Chamot-Rooke, N., Arsenikos, S., Blanpied, C., and Frizon De Lamotte, D.: Geology of the Ionian Basin and Margins: A Key to the East Mediterranean Geodynamics, Tectonics, 38, 2668–2702, https://doi.org/10.1029/2018TC005472, 2019. a, b
Turcotte, D. L. and Schubert, G.: Geodynamics, in: 3rd Edn., Cambridge University Press, Cambridge, UK, ISBN 978-1-107-00653-9, ISBN 978-0-521-18623-0, 2014. a, b
Van Hinsbergen, D. J., Torsvik, T. H., Schmid, S. M., Maţenco, L. C., Maffione, M., Vissers, R. L., Gürer, D., and Spakman, W.: Orogenic architecture of the Mediterranean region and kinematic reconstruction of its tectonic evolution since the Triassic, Gondwana Res., 81, 79–229, https://doi.org/10.1016/j.gr.2019.07.009, 2020. a, b, c
Vavryčuk, V.: Iterative joint inversion for stress and fault orientations from focal mechanisms, Geophys. J. Int., 199, 69–77, https://doi.org/10.1093/gji/ggu224, 2014. a, b
ViDEPI: Progetto ViDEPI-Visibilità dei Dati Afferenti All Attività di Esplorazione Petrolifera in Italia, https://www.videpi.com/videpi/videpi.asp (last access: 11 March 2024), 2016. a, b
Vilardo, G., Ventura, G., Terranova, C., Matano, F., and Nardò, S.: Ground deformation due to tectonic, hydrothermal, gravity, hydrogeological, and anthropic processes in the Campania Region (Southern Italy) from Permanent Scatterers Synthetic Aperture Radar Interferometry, Remote Sens. Environ., 113, 197–212, https://doi.org/10.1016/j.rse.2008.09.007, 2009. a
Vollrath, A., Zucca, F., Bekaert, D., Bonforte, A., Guglielmino, F., Hooper, A., and Stramondo, S.: Decomposing DInSAR Time-Series into 3-D in Combination with GPS in the Case of Low Strain Rates: An Application to the Hyblean Plateau, Sicily, Italy, Remote Sens., 9, 33, https://doi.org/10.3390/rs9010033, 2017. a, b, c, d
Watts, A. B. and Zhong, S.: Observations of flexure and the rheology of oceanic lithosphere, Geophys. J. Int., 142, 855–875, https://doi.org/10.1046/j.1365-246x.2000.00189.x, 2000. a
Wells, D. L. and Coppersmith, K. J.: New empirical relationships among magnitude, rupture length, rupture width, rupture area, and surface displacement, Bull. Seismol. Soc. Am., 84, 974–1002, 1994. a
Wessel, P. and Smith, W. H. F.: New, improved version of generic mapping tools released, Eos Trans. Am. Geophys. Union, 79, 579–579, https://doi.org/10.1029/98EO00426, 1998 (code available at: https://github.com/GenericMappingTools/gmt/releases, last access: 17 July 2024). a, b
White, A. M., Gardner, W. P., Borsa, A. A., Argus, D. F., and Martens, H. R.: A Review of GNSS/GPS in Hydrogeodesy: Hydrologic Loading Applications and Their Implications for Water Resource Research, Water Resour. Res., 58, e2022WR032078, https://doi.org/10.1029/2022WR032078, 2022. a
Wickert, A. D.: Open-source modular solutions for flexural isostasy: gFlex v1.0, Geosci. Model Dev., 9, 997–1017, https://doi.org/10.5194/gmd-9-997-2016, 2016. a, b
Wickert, A., cpaola, Beucher, R., and Hutton, E.: awickert/gFlex: gFlex version 1.1.1 (v1.1.1), Zenodo [code], https://doi.org/10.5281/zenodo.5034652, 2021. a
Wortel, M. J. R. and Spakman, W.: Subduction and Slab Detachment in the Mediterranean-Carpathian Region, Science, 290, 1910–1917, https://doi.org/10.1126/science.290.5498.1910, 2000. a
Zitellini, N., Ranero, C. R., Loreto, M. F., Ligi, M., Pastore, M., D'Oriano, F., Sallares, V., Grevemeyer, I., Moeller, S., and Prada, M.: Recent inversion of the Tyrrhenian Basin, Geology, 48, 123–127, https://doi.org/10.1130/G46774.1, 2020. a