
the Creative Commons Attribution 4.0 License.
the Creative Commons Attribution 4.0 License.
 | 28 Aug 2026
Structural drivers of exhumation in compressional orogens: examples from western Nepal
Nadine McQuarrie
Claire Battistella
Delores M. Robinson
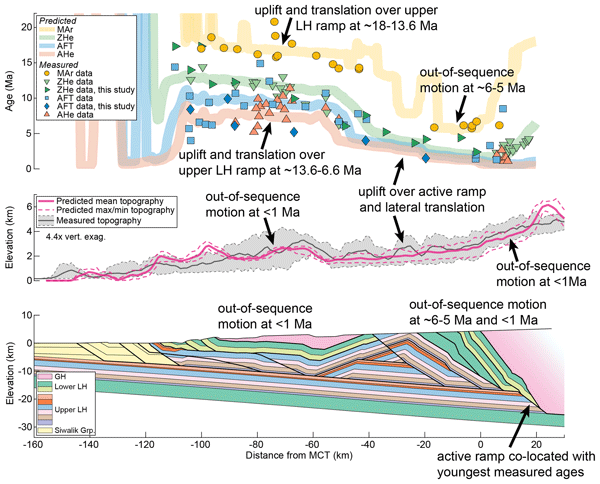
The magnitude and location of vertical uplift in fold-thrust belts is a function of the geometry, duration, and timing of faults and how they have evolved over time. Yet in the Himalaya, uncertainties persist in whether vertical uplift and exhumation are driven by sustained displacement over mid-crustal ramps in the basal décollement, pulses of more rapid exhumation during periods of out-of-sequence fault displacement, or a combination of these drivers. In western Nepal, the well-defined zone of steep slopes and high relief that marks the high Himalaya in central Nepal splits into two zones: a northern zone ∼ 10 km south of the Main Central thrust (MCT) and southern zone ∼ 80 km south of the MCT. While geomorphic metrics indicate active uplift in the southern zone, ∼ 5–10 Ma apatite fission track and ages limit the amount of young exhumation. In the northern zone, < 6 Ma muscovite ages indicate significant exhumation. We evaluate variations in ramp geometry and kinematic sequence, particularly the importance of out-of-sequence faults, necessary to reproduce the observed cooling ages, topography, and geomorphic metrics along the Simikot transect in western Nepal by integrating new and published cooling ages, basin accumulation data, and geomorphic uplift indicators with thermokinematic and landscape evolution models of three balanced cross-sections. Model results demonstrate that the northern zone of high relief and young exhumation is a combination of sustained uplift over an active ramp and recent motion on an out-of-sequence fault at ∼ 5 km south of the MCT. The southern zone of high relief is produced by active (< 0.6 Ma), but low displacement, surface breaking and subsurface faults. Thermokinematic model results emphasize the importance of a northernly ramp location, co-located with the youngest measured cooling ages at ∼ 13 km north of the MCT, and of the out-of-sequence thrusting at ∼ 6–5 and < 1 Ma.
- Article
(10513 KB) - Full-text XML
-
Supplement
(24811 KB) - BibTeX
- EndNote


The spatial and temporal signals of fault-driven uplift and associated erosional exhumation in a fold-thrust belt are contained in the across-strike pattern of thermochronologic ages and geomorphic indicators such as river steepness indices (e.g., Lock and Willett, 2008; Kirby and Whipple, 2012). The fault-driven vertical motion of rocks elevates the topographic surface, driving increased relief, river incision, and mass wasting processes (e.g., Montgomery and Brandon, 2002; Whipple and Tucker, 1999; Willett, 1999). This focusing of erosion in response to surface uplift drives steepening of rivers, exhumes rocks to the surface, and advects the closure isotherm of a given thermochronometer system upward (Ehlers and Farley, 2003; Ghoshal et al., 2020; Lock and Willett, 2008; McQuarrie and Ehlers, 2017). Yet debate persists on the location, geometry, age, and type of structures that drive uplift and facilitate exhumation, particularly in the Himalayan orogen (e.g., DeCelles et al., 2020; Ghoshal et al., 2020; Harvey and Burbank, 2024; Wobus et al., 2006a, b). Here, observations show the youngest cooling ages are located in regions of high topography and elevated geomorphic indicators like increased slope, relief, and river steepness. The vertical uplift has been attributed to continuous exhumation due to sustained motion over mid-crustal ramps in the basal décollement, pulses of more rapid exhumation during periods of out-of-sequence fault displacement, or a combination of these drivers, with shortening distributed across multiple faults (e.g., Ghoshal et al., 2020, 2023; Harvey and Burbank, 2024; Thiede et al., 2017; Wobus et al., 2006a, b).
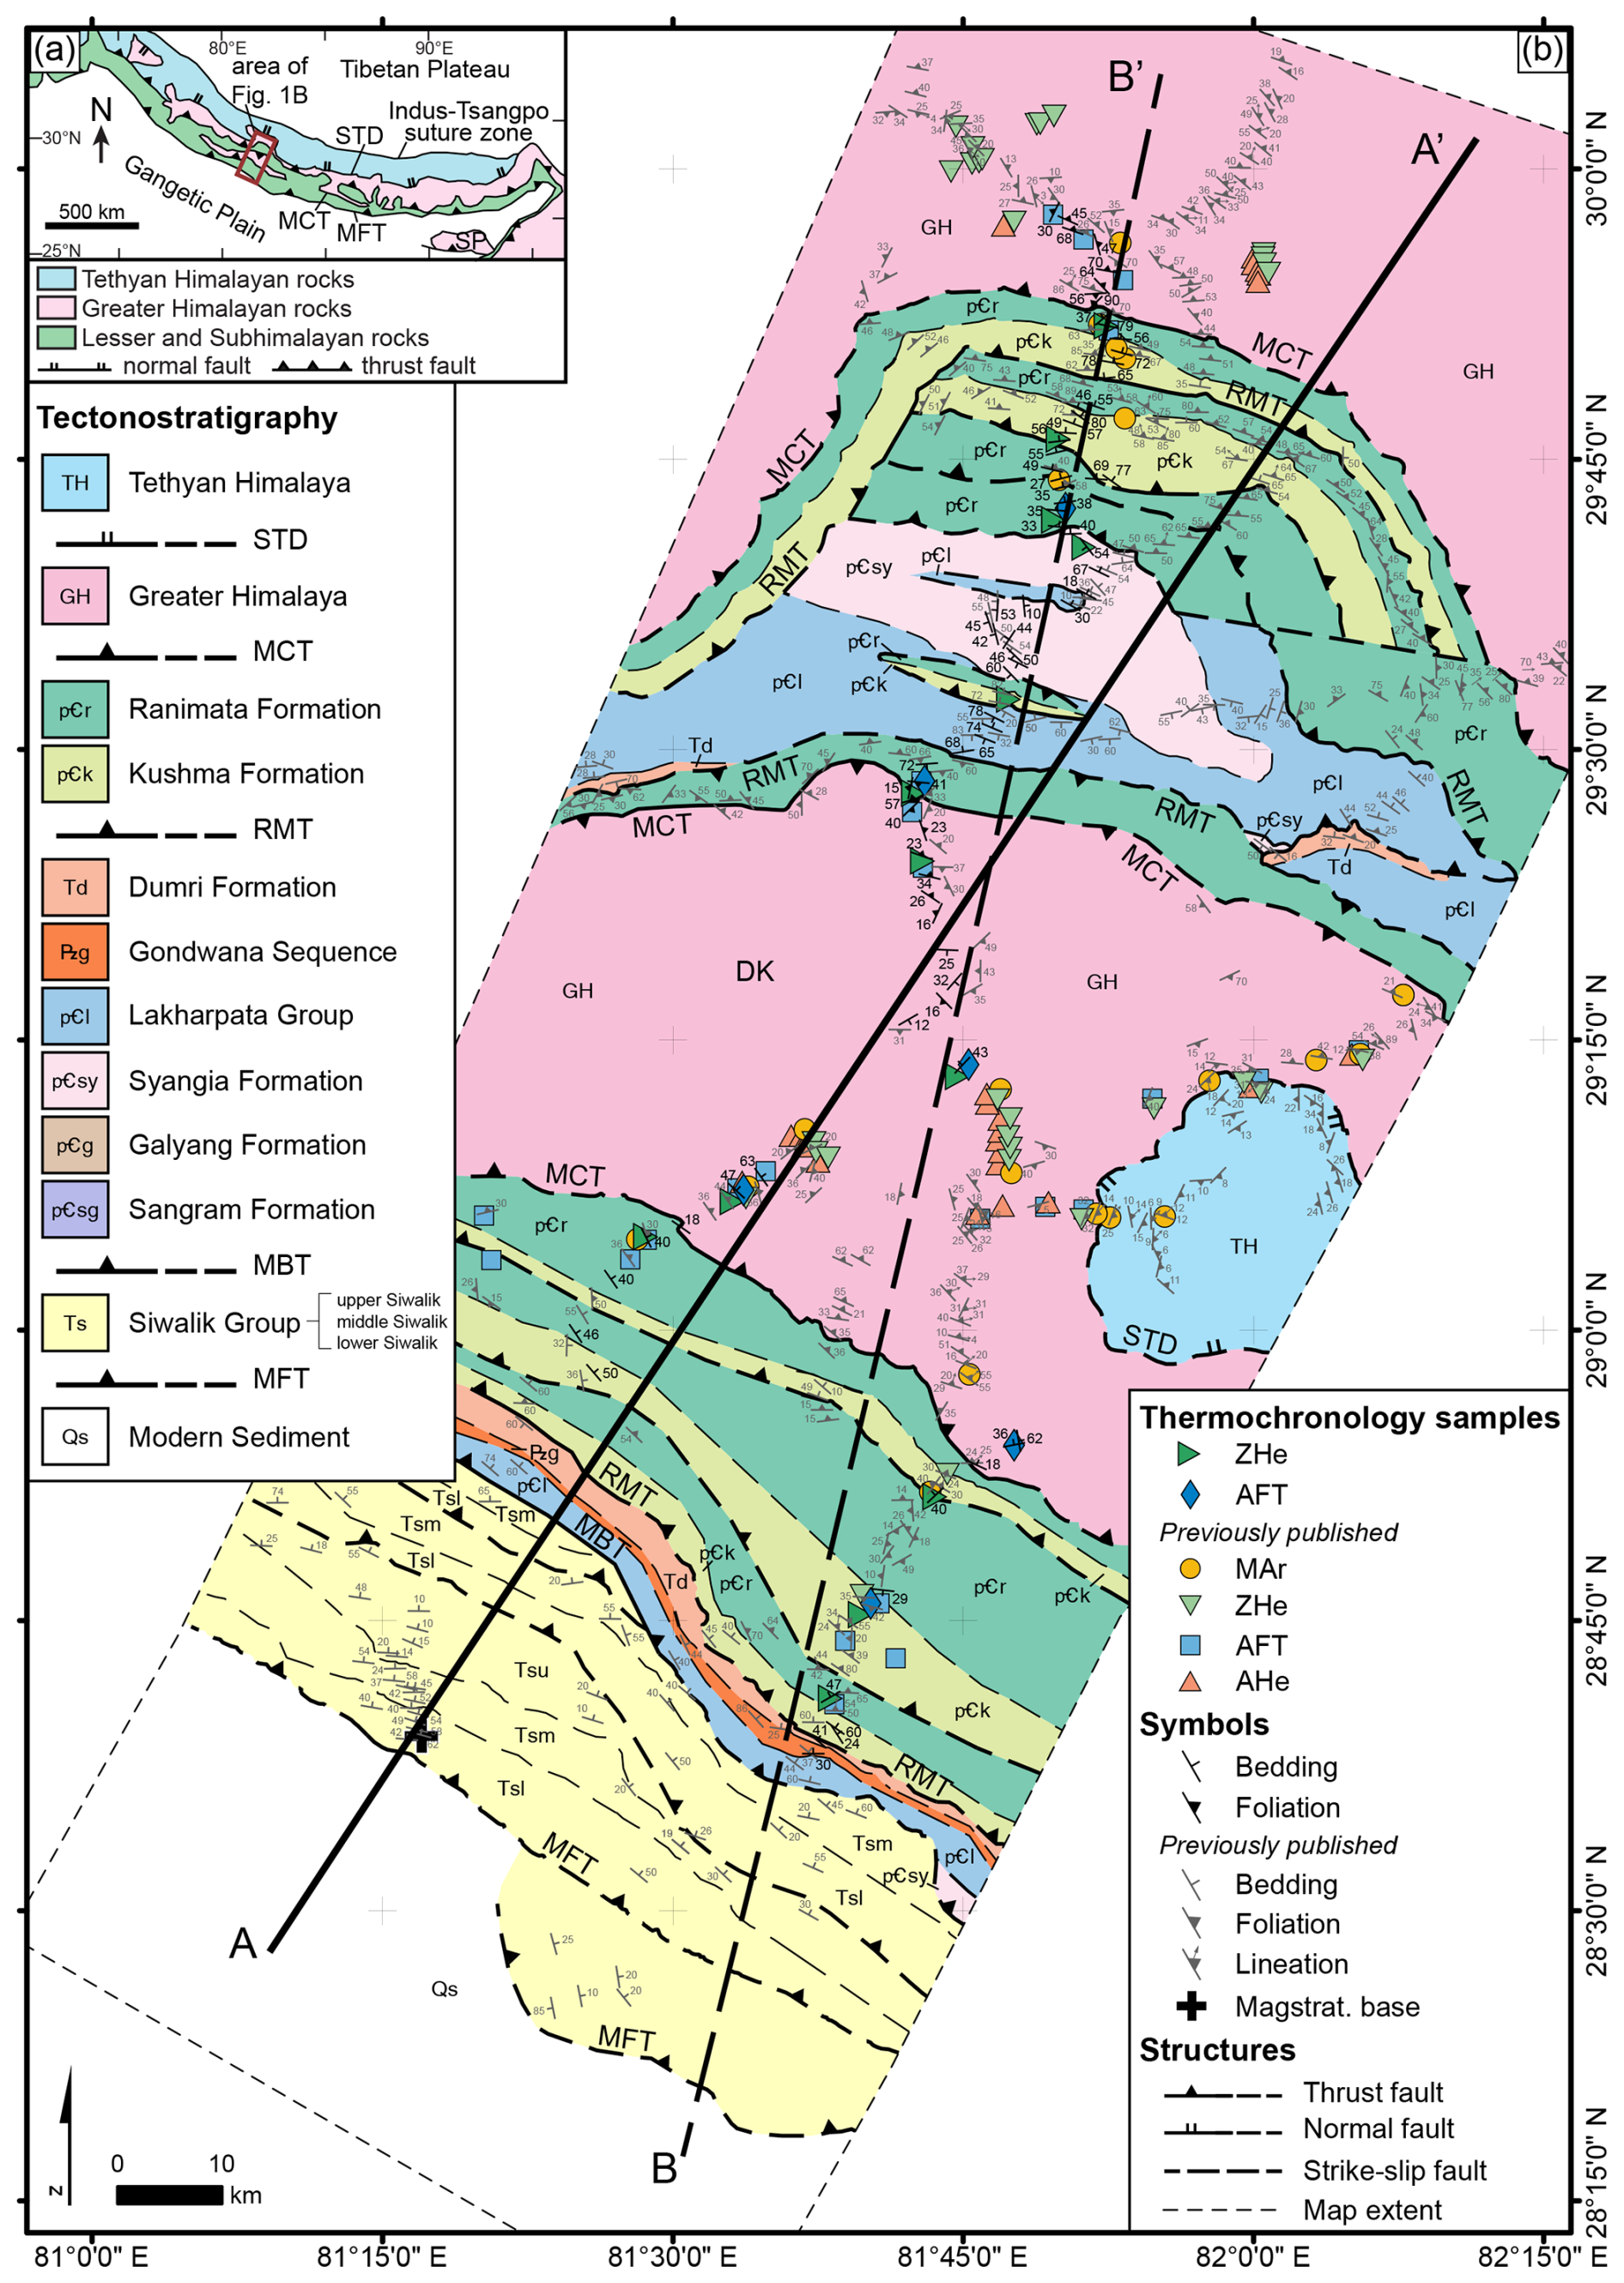
Figure 1(a) Simplified geologic map of the major tectonostratigraphic zones and structures of the Himalayan orogen. (b) Geologic map of the Simikot transect in western Nepal. Thick black lines marked A-A′ and B-B′ show the positions of the cross-sections in Figs. 3–5. Geologic mapping is based on observations and orientation measurements from this study, Robinson et al. (2006), DeCelles et al. (2020), Soucy La Roche et al. (2016, 2018), Braden et al. (2020), Montomoli et al. (2013), Yakymchuk and Godin (2012), Iaccarino et al. (2017), Mugnier et al. (1999), and Sigdel and Sakai (2016). Thermochronologic data is from this study, Braden et al. (2020), DeCelles et al. (2020), Harvey and Burbank (2024), McCallister et al. (2014), Mercier (2014), Sakai et al. (2013), Sherpa et al. (2023), Soucy La Roche et al. (2016, 2018), and van der Beek et al. (2016). DK, Dadeldhura klippe; MBT, Main Boundary thrust; MCT, Main Central thrust; MFT, Main Frontal thrust; RMT, Ramgarh-Munsiari thrust; STD, Southern Tibetan Detachment.
In western Nepal, previous studies propose active décollement ramps that range between ∼ 3 and ∼ 8.5 km tall and that are located ∼ 120 to ∼ 40 km south of the Main Central Thrust (MCT), positioned beneath the southernmost edge of the Dadeldhura klippe to beneath the northern limb of the klippe (Fig. 1) (DeCelles et al., 2020; Hoste-Colomer et al., 2018; Laporte et al., 2021; Olsen et al., 2019; Robinson et al., 2006; Subedi et al., 2018). However, these proposed ramp locations are also where the oldest apatite fission track (AFT) and (AHe) cooling ages are observed in the region (this study; DeCelles et al., 2020; Harvey and Burbank, 2024; van der Beek et al., 2016). The presence of older (∼ 5–10 Ma) AFT and AHe cooling ages suggests a limited amount of young exhumation has occurred in the klippe and brings into question the validity of a long-lived active décollement ramp in this location (e.g. Harvey and Burbank, 2024). Additionally, young (< 6 Ma) muscovite (MAr) and zircon (ZHe) ages at ∼ 20 km south to ∼ 20 km north of the MCT (this study; Braden et al., 2020; Harvey and Burbank, 2024; McCallister et al., 2014; Mercier, 2014) are present where topography is the highest in the region. Observations of young cooling ages and elevated topography require recent active uplift farther north than any of the previously proposed ramps are located. As the magnitude and location of vertical uplift and enhanced erosional exhumation are a function of the geometry, duration, and magnitude of displacement (e.g., Lock and Willett, 2008; McQuarrie and Ehlers, 2015, 2017), the proposed ramp locations and kinematic sequence must be able to replicate the distribution of elevated geomorphic indices and young cooling ages measured at the surface.
We explore the influence of the size and location of décollement ramps and magnitude of out-of-sequence motion on the distribution of cooling ages using three balanced cross-sections of different ramp geometries. The balanced cross-sections, thermochronologic ages, basin accumulation data, and locations of geomorphic uplift are integrated with thermokinematic and landscape evolution models to evaluate the potential changes in the ramp geometry and kinematic sequence necessary to reproduce the measured cooling ages and modern topography of the western Nepal Himalaya.
2.1 Tectonic setting
At ∼ 58–60 Ma, the collision of India and Asia initiated and shortening progressed southward to form the Himalayan-Tibetan orogenic system (e.g., DeCelles et al., 2014; Gansser, 1964). The Himalayan orogen is commonly divided into four tectonostratigraphic zones bounded by major faults: the Subhimalaya, Lesser Himalaya (LH), Greater Himalaya (GH), and Tethyan Himalaya (e.g. Gansser, 1964). From south to north, the Main Frontal thrust (MFT) places the Subhimalaya over the modern foreland, the Main Boundary thrust (MBT) juxtaposes LH rocks over the Subhimalaya, the Main Central thrust (MCT) places GH rocks over LH rocks, and the Southern Tibetan Detachment is the contact between GH and Tethyan Himalayan rocks (Fig. 1). The major faults sole into the Main Himalayan thrust (MHT), the basal décollement. In western Nepal, the LH is segmented into lower and upper units by an orogen-scale fault, the Ramgarh-Munsiari thrust (RMT) (Fig. 1).
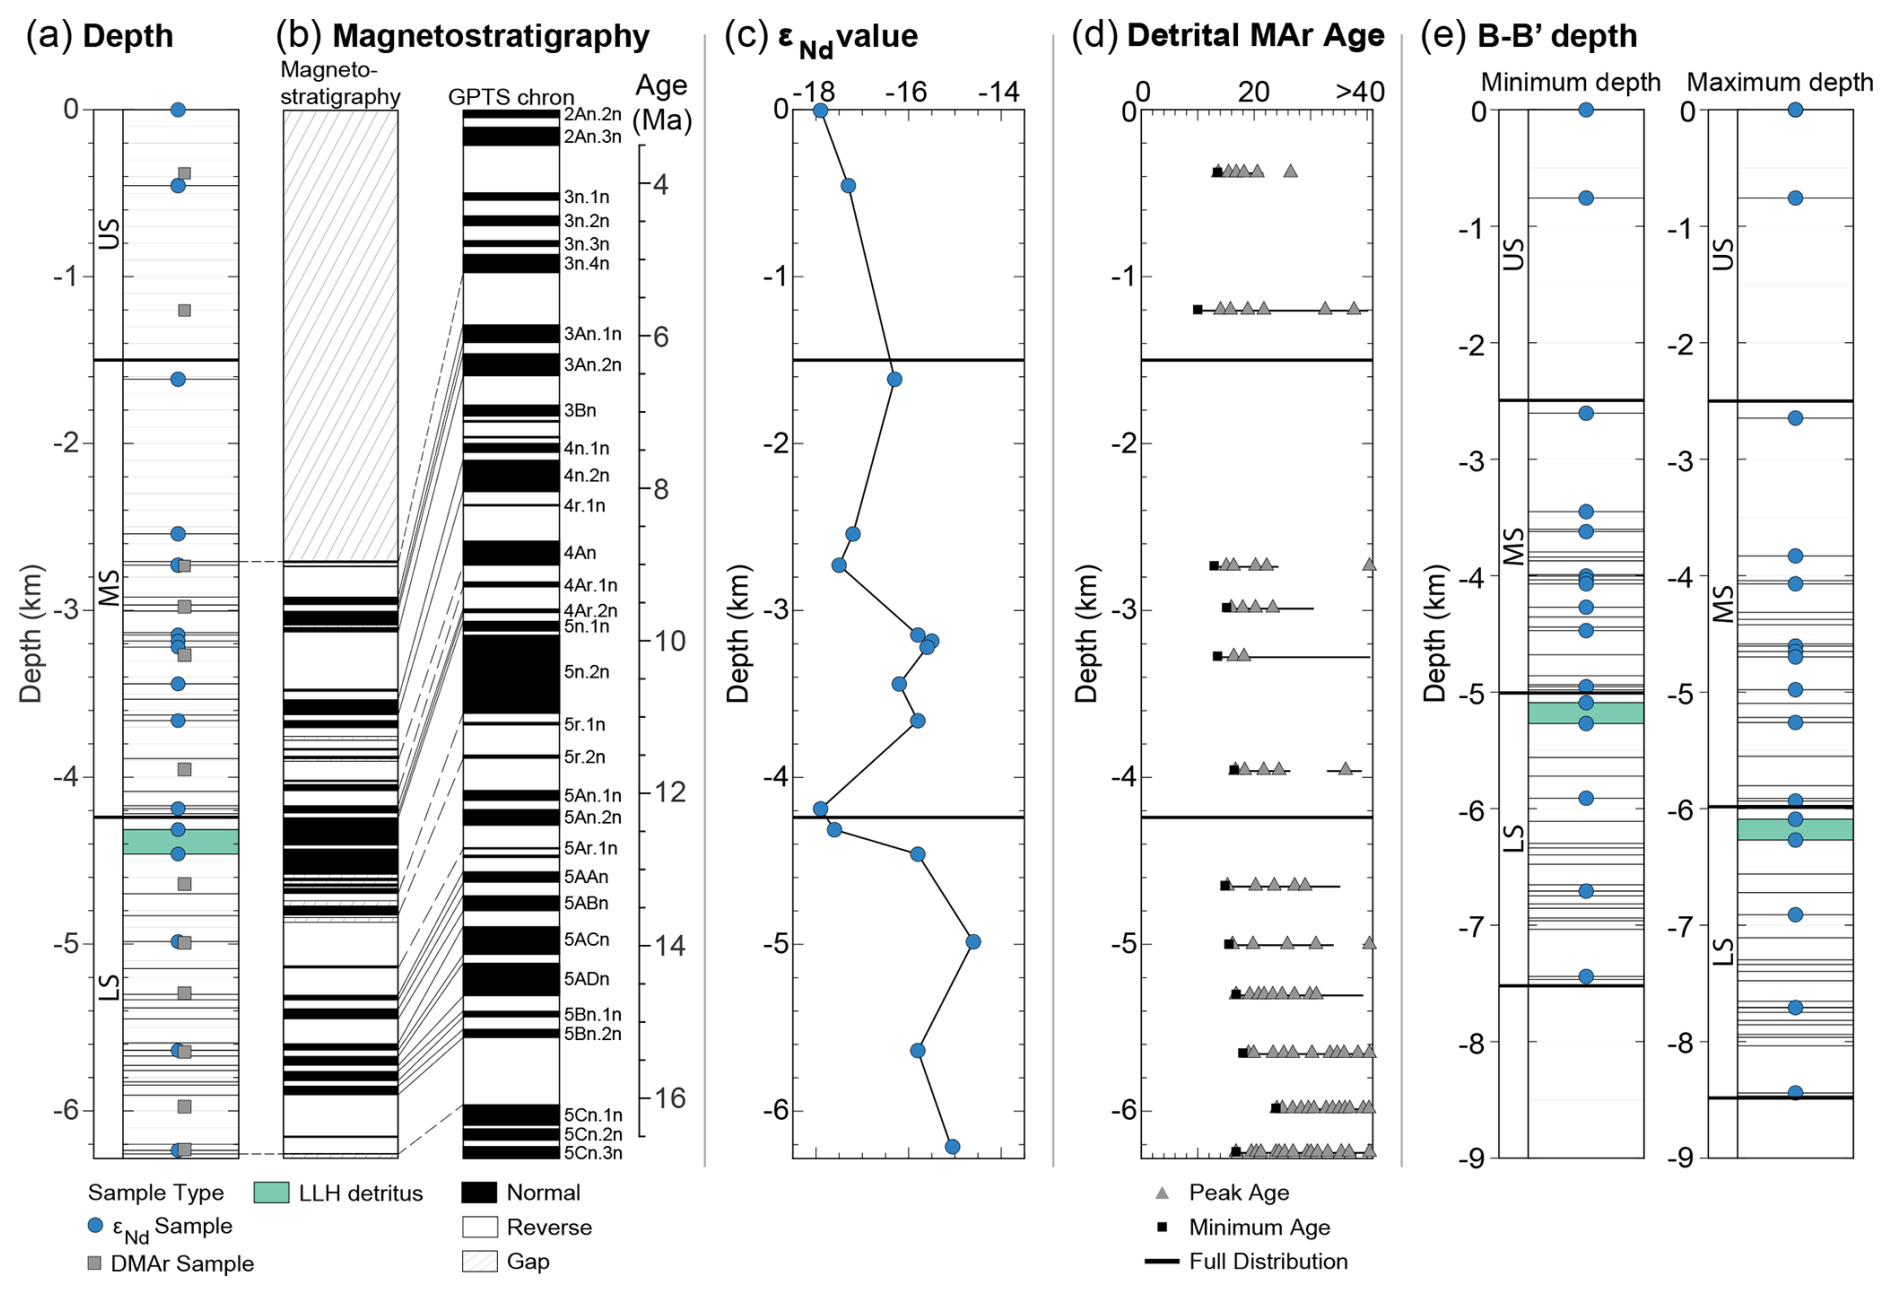
Figure 2Measured Siwalik Group and magnetostratigraphic correlation. (a) Thickness and sample depths for A-A′ (Gautam and Fujiwara, 2000; Sigdel and Sakai, 2016). Green shading highlights the depth of lower LH-derived sediments (Huyghe et al., 2001; Szulc et al., 2006). (b) Magnetostratigraphic record for A-A′ and correlation with the geomagnetic polarity time scale (GPTS) of Cande and Kent (1995) (Gautam and Fujiwara, 2000). (c) Detrital εNd values and sample depths for A-A′ (Huyghe et al., 2001; Szulc et al., 2006). (d) Detrital MAr age peaks (triangles) and sample depths (Szulc et al., 2006). Thin black lines extend from the minimum to the maximum MAr age in a continuous measured distribution. Black squares show the overall minimum age in a sample. (e) Maximum and minimum basin thicknesses for transect B-B′. Sample depths and depositional ages are projected along strike from A-A′. LLH, lower LH; LS, lower Siwalik unit; MS, middle Siwalik unit; US, upper Siwalik unit.
2.2 Basin record
Along A-A′, the Siwalik Group comprises ∼ 6.3 km of synorogenic sedimentary rocks, with ∼ 2 km in the lower unit, 2.74 km in the middle unit, and ∼ 1.5 km in the upper unit (Fig. 2) (Gautam and Fujiwara, 2000; Sigdel and Sakai, 2016). The lower Siwalik unit was deposited from ∼ 16 to ∼ 9.6 ± 1 Ma (Gautam and Fujiwara, 2000). Near the top of the lower Siwalik unit, εNd values become distinctly more negative (Fig. 2c) and indicate exhumation of lower LH rocks to the surface and initial influx of LH-derived detritus to the foreland basin at ∼ 10 Ma (Huyghe et al., 2001; Quade et al., 1997; Robinson et al., 2001, 2006; Szulc et al., 2006). The basal ∼ 1.5 km of the middle Siwalik unit accumulated from ∼ 9.6 ± 1 to ∼ 5 ± 1.5 Ma and the upper Siwalik unit was deposited after ∼ 4–5 Ma (Gautam and Fujiwara, 2000). Detrital MAr age distributions measured in the Siwalik unit generally show a prominent cluster of ages ∼ 15–30 Ma, with a distinct peak ∼ 14–16 Ma (Fig. 2d) (Szulc et al., 2006). The three deepest samples at ∼ 5.4–6.2 km basin depth show detrital MAr age distributions that extend to > 40 Ma (Fig. 2d) (Szulc et al., 2006).
To the east, estimates of the Siwalik Group thickness increase along strike as a function of map pattern width and variability in orientation measurements (Fig. 1). Along B-B′, the Siwalik Group is estimated as ∼ 7.5–8.5 km thick, with a ∼ 2.5 km thick lower unit, ∼ 3–4 km thick middle unit, and ∼ 2–2.5 km thick upper unit (Fig. 2e).
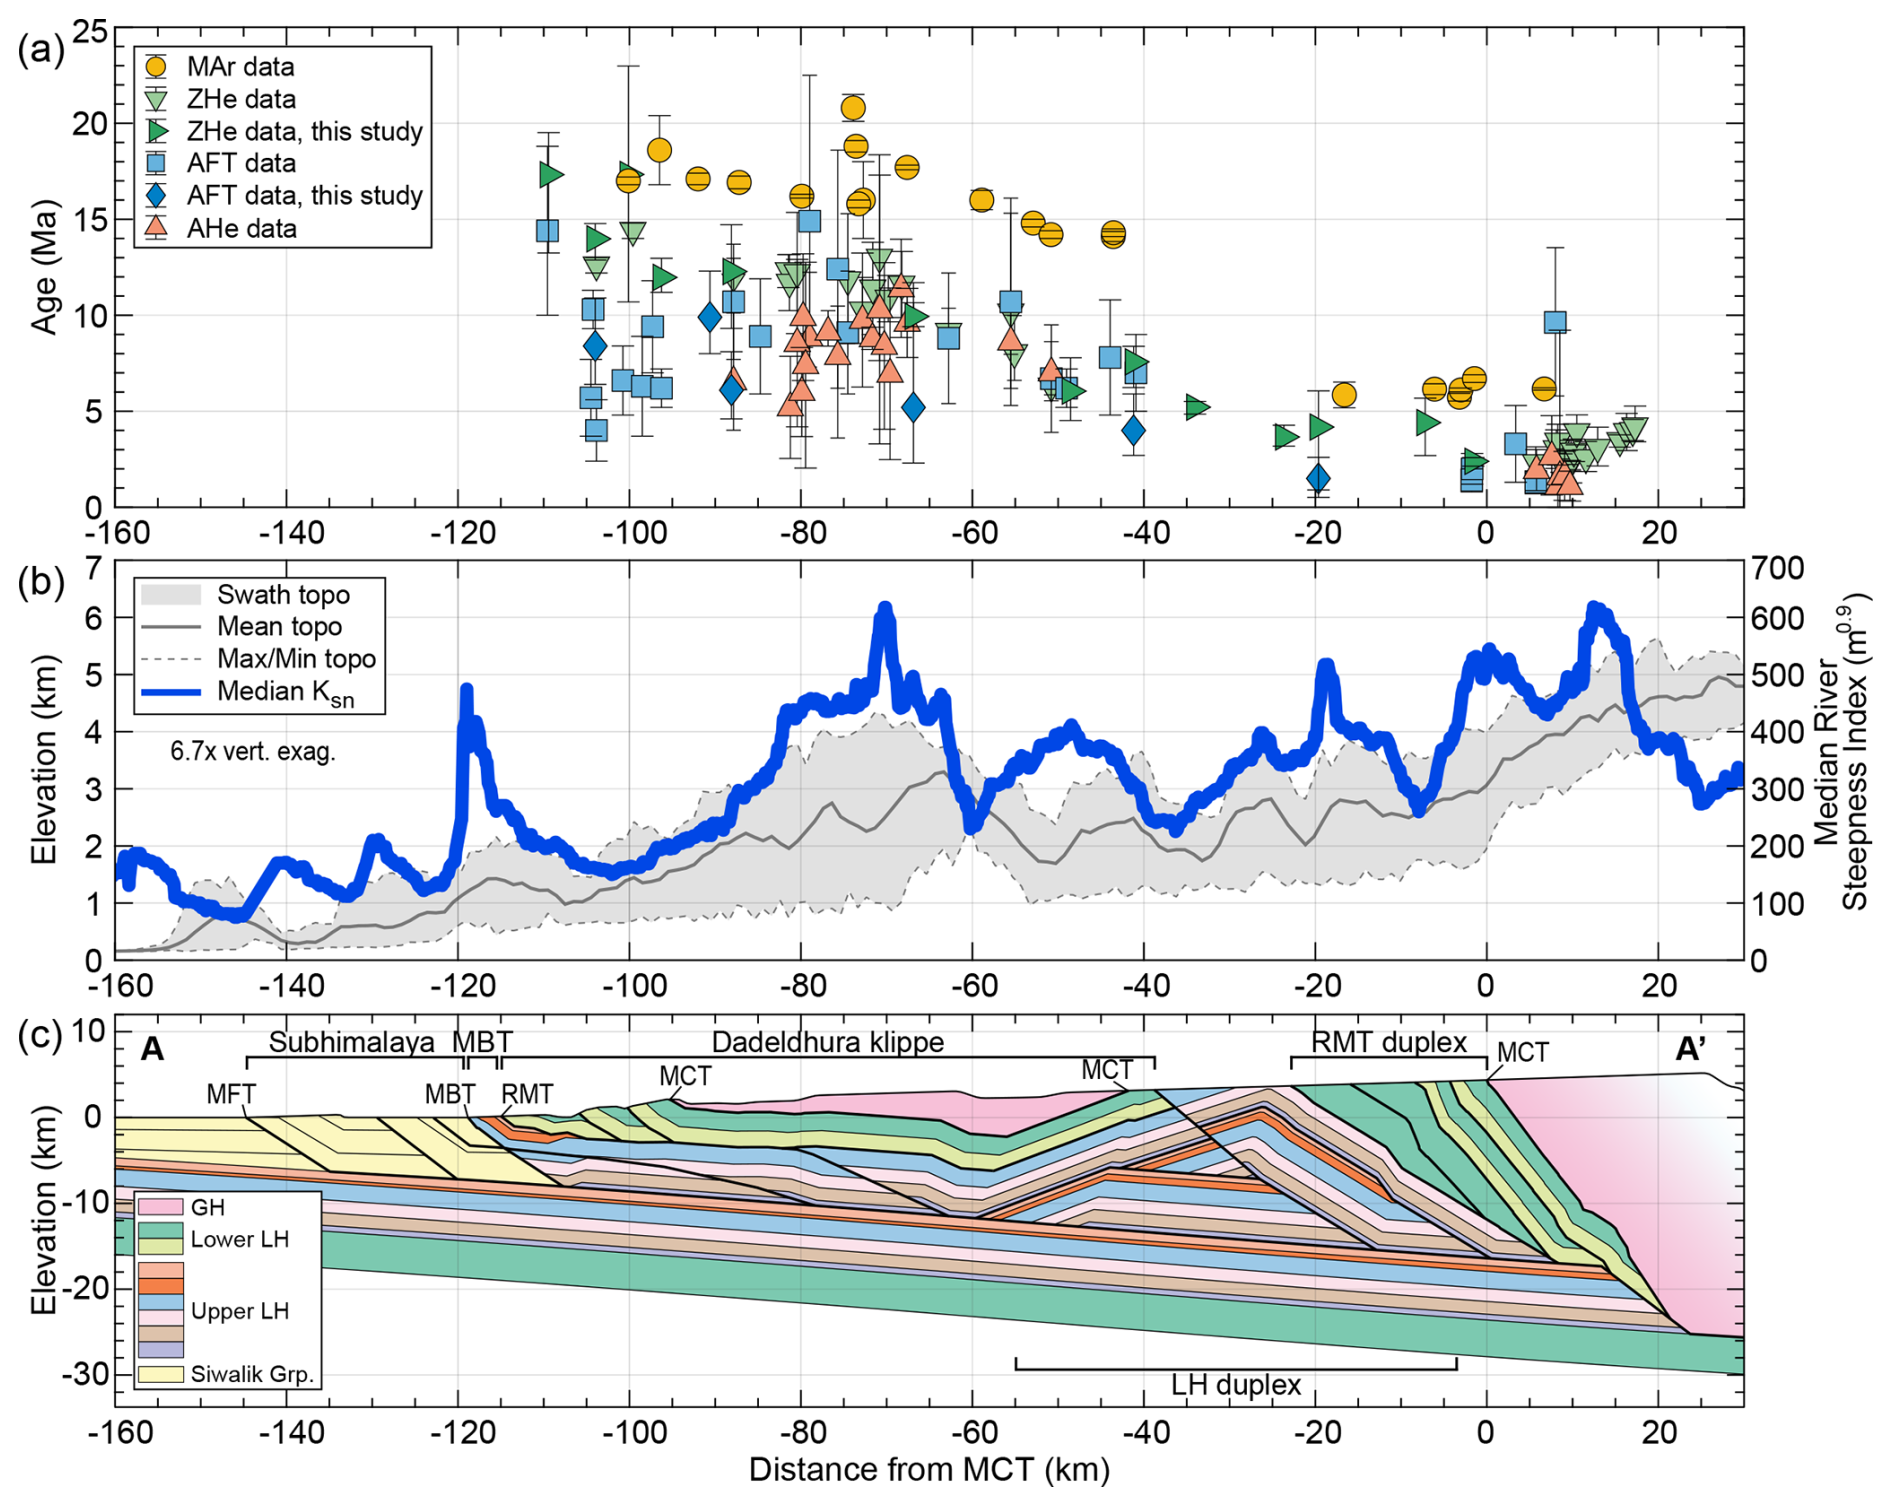
Figure 3Measured cooling ages, geomorphic indices, and cross-section geometry for the Simikot section. (a) Cooling age-distance profile, (b) topographic swath and normalized river steepness indices calculated with TopoToolBox v2 (Schwanghart and Scherler, 2014), and (c) cross-section geometry for A-A′ in western Nepal. Thermochronologic data are from this study, Braden et al. (2020), DeCelles et al. (2020), Harvey and Burbank (2024), McCallister et al. (2014), Mercier (2014), Sakai et al. (2013), Sherpa et al. (2023), Soucy La Roche et al. (2016, 2018), and van der Beek et al. (2016). See Fig. 1 for the detailed stratigraphy. MBT, Main Boundary thrust; MCT, Main Central thrust; MFT, Main Frontal thrust; RMT, Ramgarh-Munsiari thrust.
2.3 Published thermochronologic record
Published cooling ages utilized include 21 MAr ages, 31 ZHe ages, 24 AFT ages, and 24 AHe ages (Fig. 3a) (Braden et al., 2020; DeCelles et al., 2020; Harvey and Burbank, 2024; McCallister et al., 2014; Mercier, 2014; Sakai et al., 2013; Sherpa et al., 2023; Soucy La Roche et al., 2016, 2018; van der Beek et al., 2016). MAr ages include single grain and multigrain aliquots and are presented with 2σ analytical errors. ZHe and AHe ages are the mean of 2–8 single grain ages, with a two standard deviation error. AFT ages are presented as a central age of 10–50 single grains and 2σ error (Figs. 1 and 3a). The datasets have been screened for outliers and, while some age-eU relationships exist (e.g. Sherpa et al., 2023), these relationships are not always present.
3.1 Geologic mapping and cross-section construction
Geologic mapping was completed at a 1:200 000 scale using the tectonostratigraphic framework of Robinson et al. (2006). Our mapping was incorporated with observations from Robinson et al. (2006), DeCelles et al. (2020), Soucy La Roche et al. (2016, 2018), and Mugnier et al. (1999) to connect contacts along strike (Fig. 1). The updated mapping, stratigraphic thicknesses determined from the map distance and orientation, and foreland basin thickness were integrated into a balanced cross-section to describe the subsurface structures for A-A′. The transect line for A-A′ is oriented parallel to the direction of convergence determined from GPS measurements in western Nepal (e.g., Ader et al., 2012; Jouanne et al., 2004) and positioned to minimize the distance needed to project the samples and measurements in the Subhimalaya onto the section. The measured data was projected onto the transect line following the strike of the major structures and contacts. The location of décollement ramps was constrained from the distribution of young cooling ages and elevated channel steepness values (Fig. 3) (see Sects. 3.2, 3.3, 4.3 and 4.4). The cross-section was balanced and restored to its undeformed state using the line-length method (Dahlstrom, 1969). Ductile deformation, penetrative strain, or small-scale folding is not accounted for in the cross-sections. Granular distortions that have been identified largely record layer-normal flattening (Braden et al., 2020; Ghoshal et al., 2020; Yakymchuk and Godin, 2012). In other parts of the Himalaya, this flattening has been interpreted to have occurred on the prograde burial path for the LH rocks and preceding or contemporaneous with fault displacement for the GH rocks (e.g., Corrie et al., 2012; Law et al., 2013; Long et al., 2016; Long and Kohn, 2020). We do not incorporate internal deformation of units in the cross-sections and flexural-kinematic models we present here, with faults treated as discrete structures and thrust sheets as rigid bodies. Distributed ductile shearing is a required component of deformation when there is evidence of marked changes in unit thickness, temperature or pressure gradients that cannot be reproduced with models of discrete fault structures (Braza et al., 2023; Corrie et al., 2012; Long et al., 2016; Long and Kohn, 2020). The integration of the cross-section geometry and kinematics with a thermal model allows us to compare the modelled temperatures with published temperature estimates to assess our assumption that motion along discrete structures exert a first-order control on the burial and exhumation pathways of rocks in western Nepal (e.g. Braza et al., 2023).
3.2 Geomorphic expressions of uplift
To examine the spatial distribution of recent uplift, the normalized channel steepness index (ksn) was calculated from a ∼ 30 m ASTER DEM (US/Japan ASTER Science Team, 2019) using TopoToolbox v2 (Schwanghart and Scherler, 2014). The ksn values were calculated using a 0.45 reference concavity (θref) (e.g. Kirby and Whipple, 2012). Median ksn values were calculated for a 40 km wide swath bounding A-A′ and projected onto the center line. A smoothing window of 5 km was applied to the median ksn values.
3.3 Thermochronology
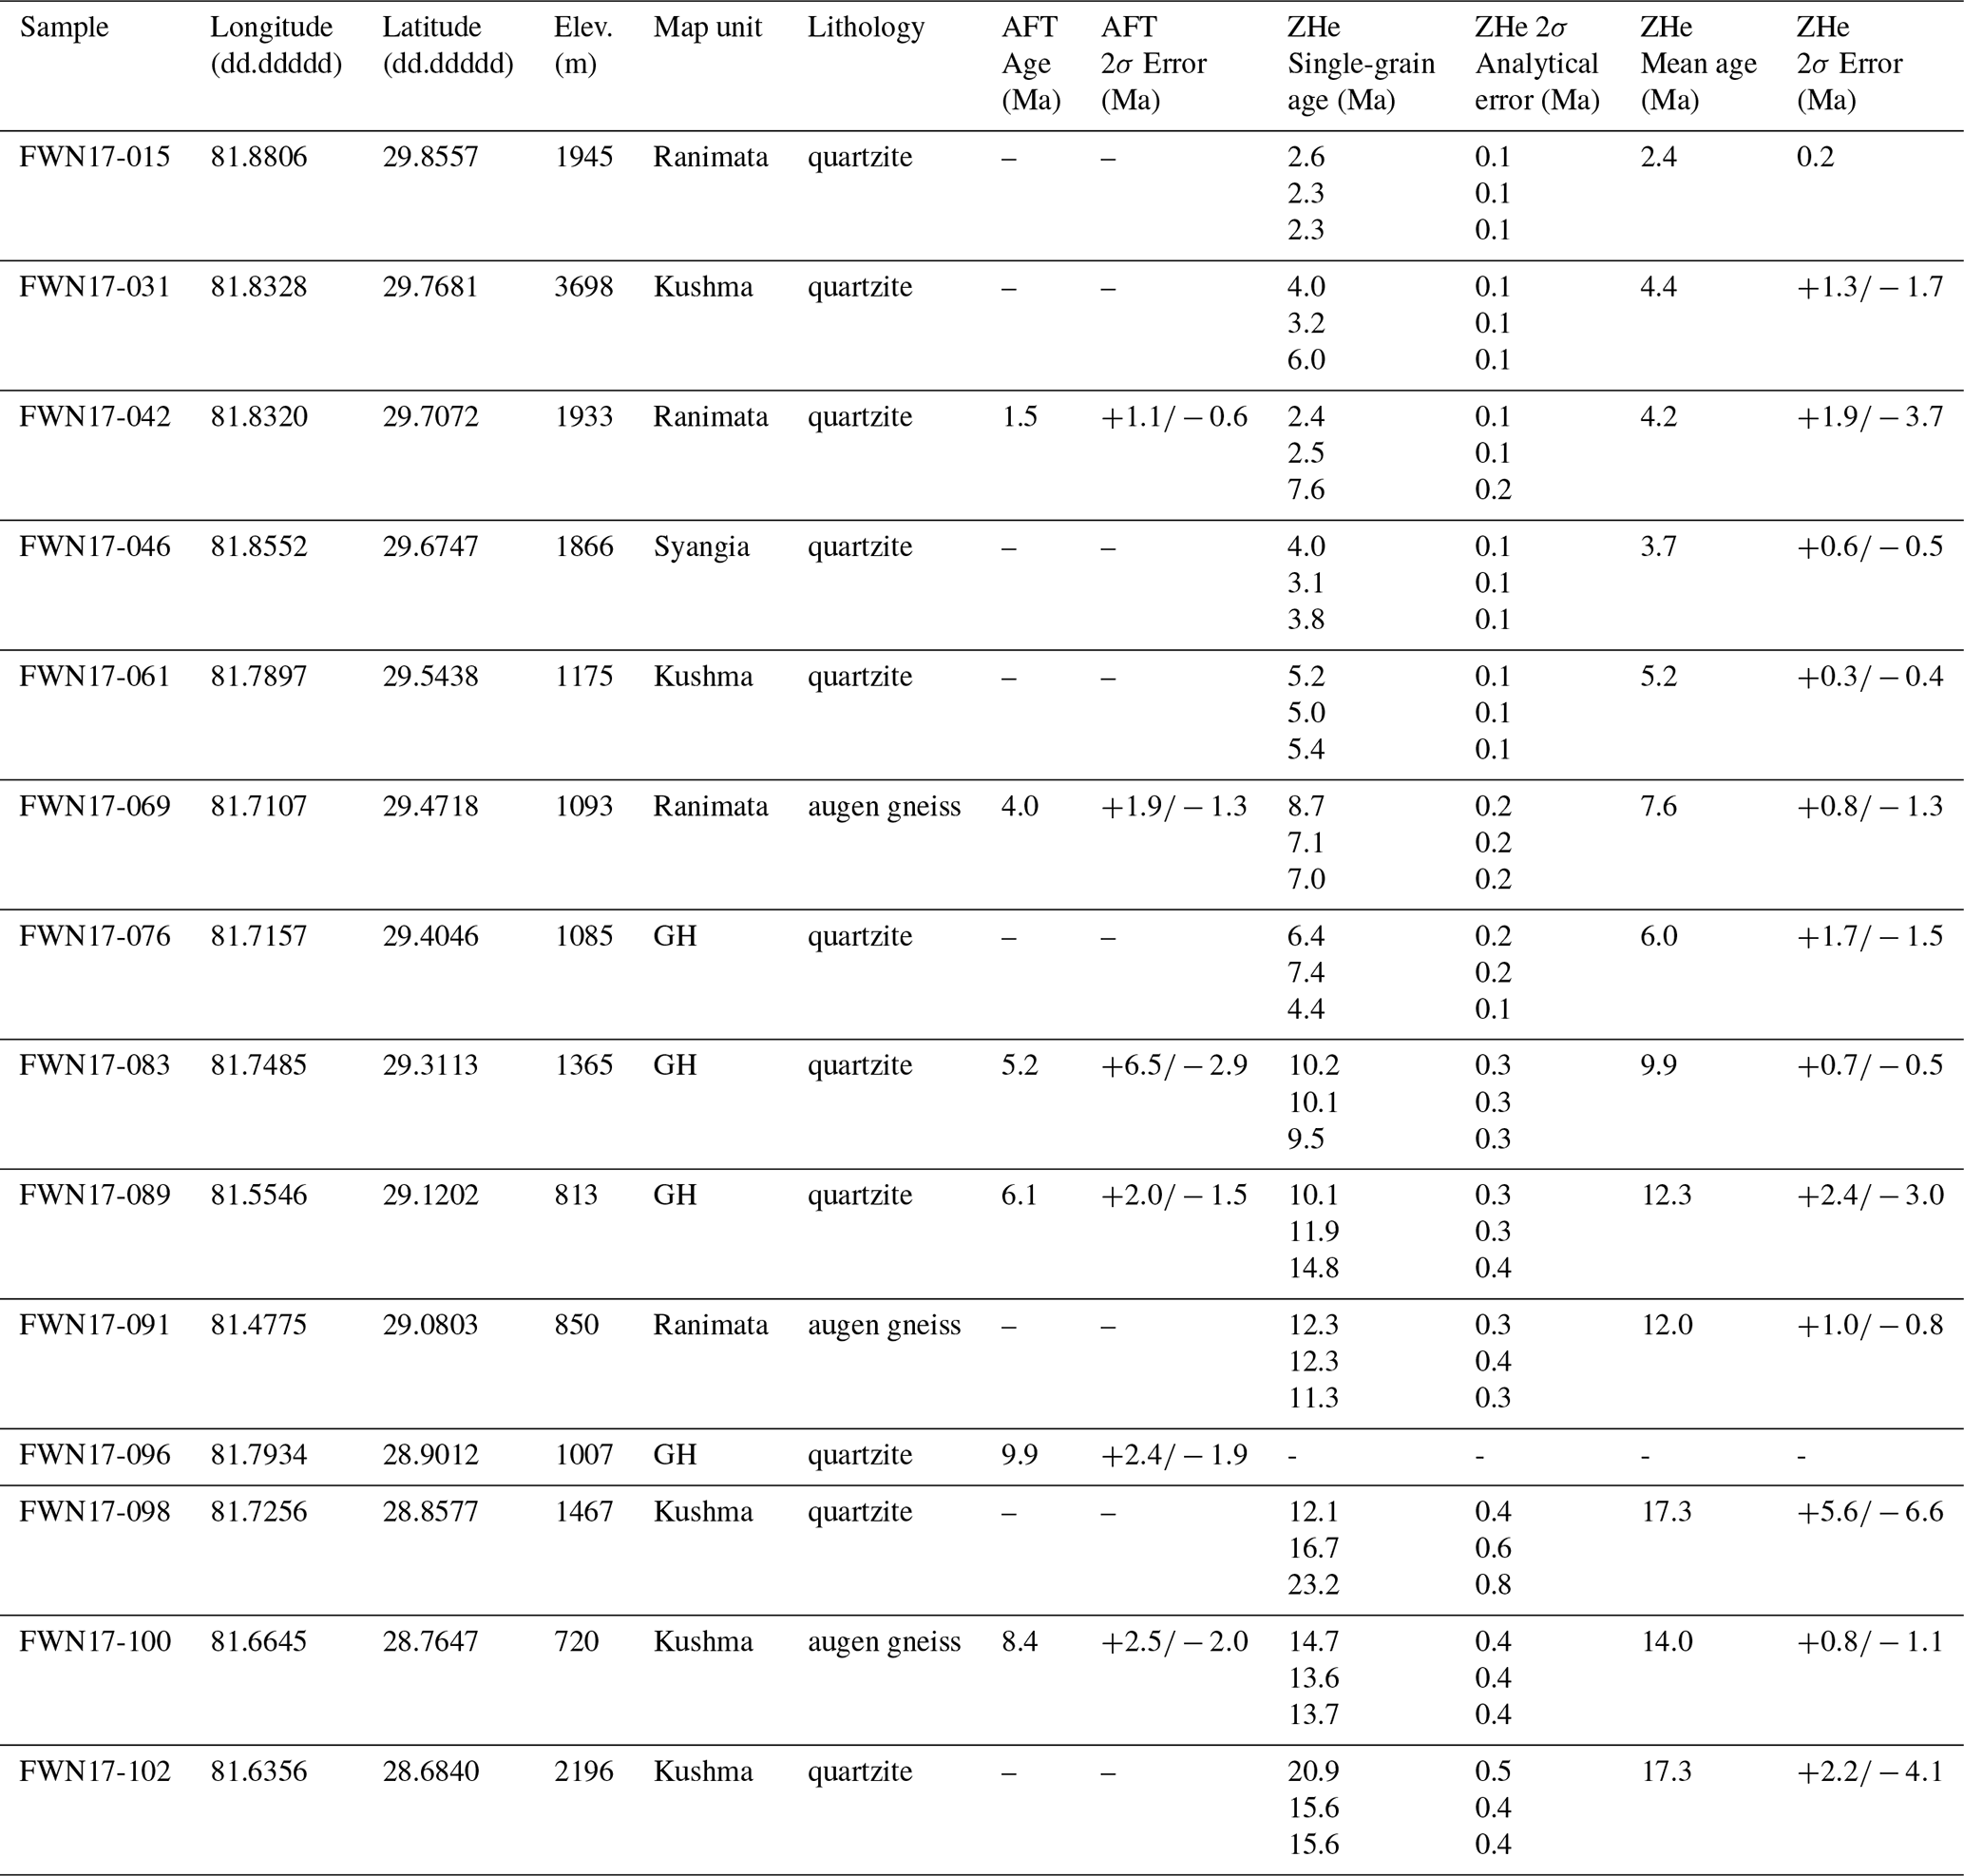
New thermochronologic data is presented for 13 ZHe and 6 AFT samples (Table 1, Fig. 1) (Braza et al., 2026a, b). Analyses were carried out at the University of Arizona Radiogenic Helium Dating Laboratory for the ZHe samples (Text S1 in the Supplement) and at Occidental College Fission Track Research Laboratory for the AFT samples (Text S2 in the Supplement).
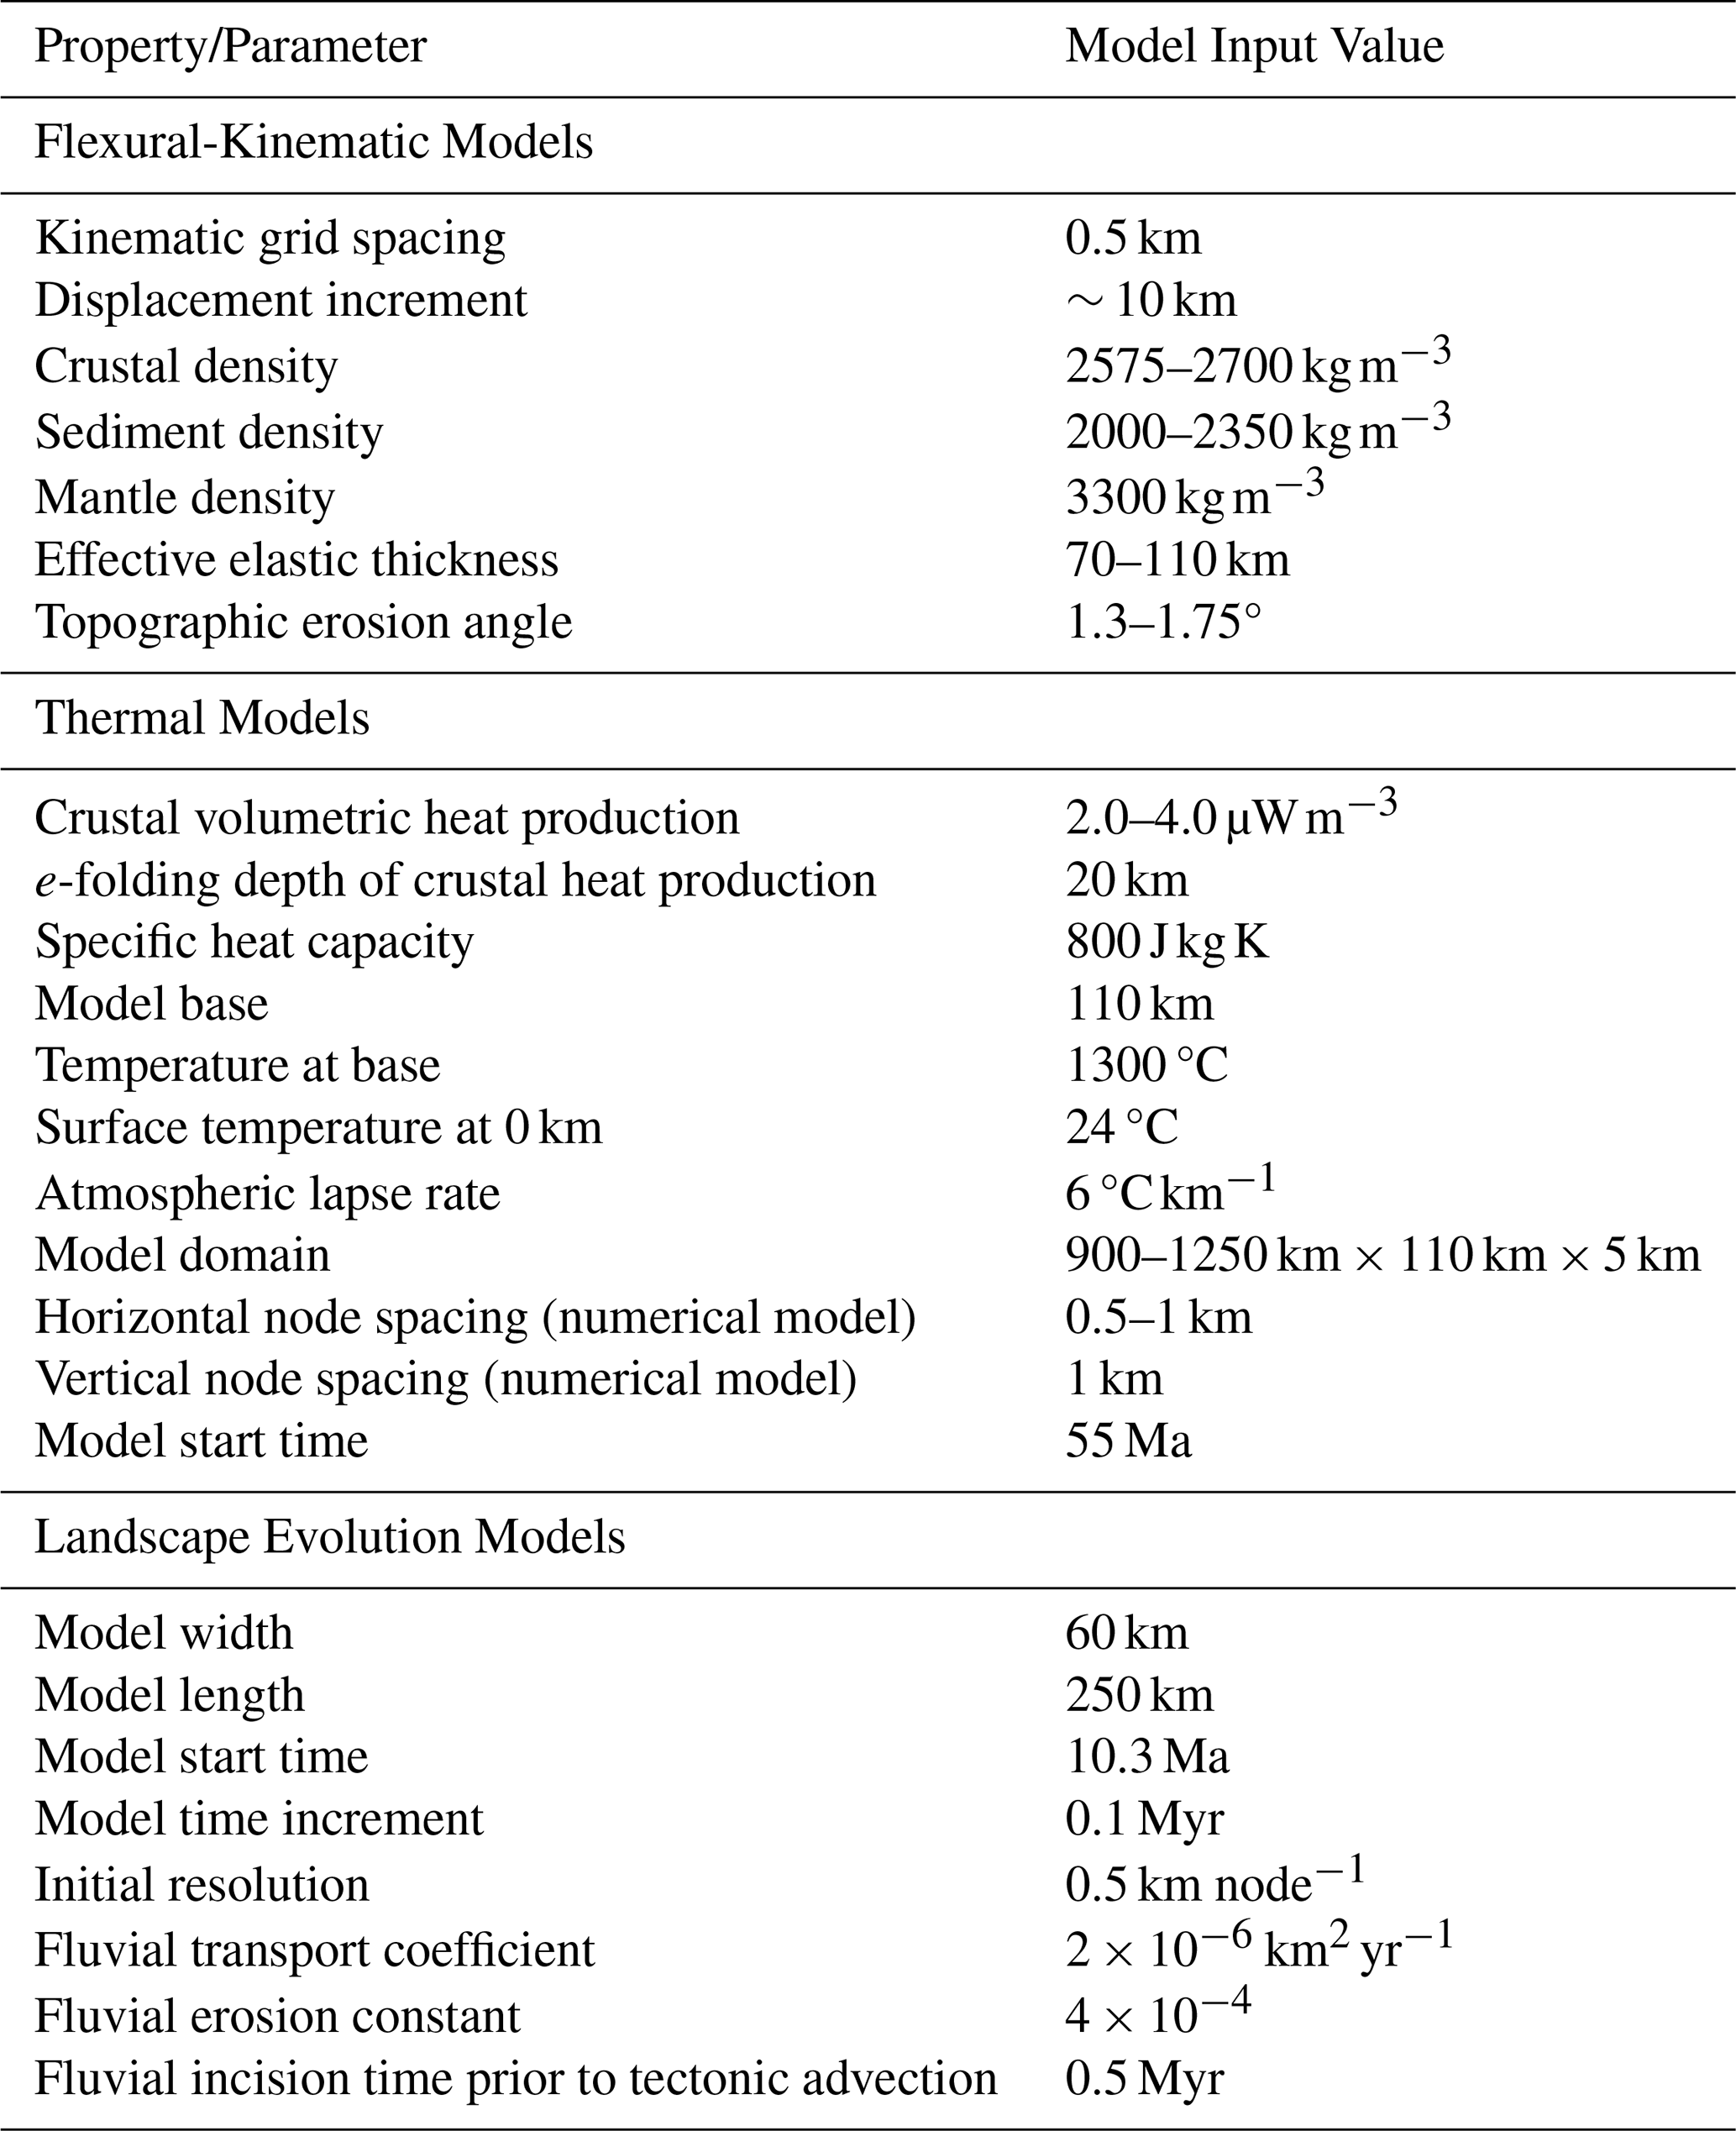
Table 2Constant parameters for flexural-kinematic models, thermal models, and landscape evolution models.
3.4 Thermokinematic forward modelling
Flexural-kinematic forward modelling of the balanced cross-sections was completed using Move (Petex), following established procedures (Braza and McQuarrie, 2022a; Ghoshal et al., 2020; McQuarrie and Ehlers, 2015, 2017) and using the parameters in Table 2 (see Text S3 in the Supplement for further details). The model initiates with the top of the Gondwana Sequence at 0 m elevation at the MFT and the topography increases at a ∼ 2° angle over ∼ 160 km distance to a maximum of 5 km elevation above the restored GH rocks. GH rocks restore to ∼ 35–45 km depth with an initial sedimentary taper of ∼ 0.5°, consistent with the published peak temperature conditions (e.g. Fig. S1 in the Supplement) (Braden et al., 2020; Soucy La Roche et al., 2018). This initial topographic profile, taper angle, and GH burial depth account for the Paleocene-Oligocene shortening in the Tethyan fold-thrust belt prior to initiation of motion on the MCT (e.g., Aikman et al., 2008; Murphy and Yin, 2003; Ratschbacher et al., 1994; Soucy La Roche et al., 2016). Cooling and decompression proposed for GH rocks that extends from initial model start times (25–30 Ma) to as young as 16 Ma was evaluated by assessing if additional cooling or thinning (e.g. Soucy La Roche et al., 2018) was needed to reproduce MAr cooling following peak temperatures. Flexural-kinematic models are required to reproduce the surface geology, basin thickness, and depth to basin provenance indicators (Braza and McQuarrie, 2022a; McQuarrie and Ehlers, 2015, 2017).
Viable flexural-kinematic models were thermally modelled using Pecube-D (see Text S4 in the Supplement for additional details) (Ehlers, 2023; McQuarrie and Ehlers, 2015; Whipp et al., 2009), a modified version of the advection-diffusion code Pecube (Braun, 2003; Braun et al., 2006). Each ∼ 10 km deformation step was assigned an age to convert the Move displacement fields to velocity fields (McQuarrie and Ehlers, 2015). Constant and variable shortening rates were tested. Constant shortening rates of 24–35 mm yr−1 were applied to initiate MCT motion at 25–30 Ma (e.g. Soucy La Roche et al., 2018). For the variable velocities, the specific shortening rates are determined from the total amount of displacement on a given fault and the increment of time that fault displacement occurs over. The timing of the structures is constrained by the distribution of cooling ages, which sets requirements for the amount and age of exhumation that occurs at a given sample location, and from the depth and depositional ages in the foreland basin (Braza and McQuarrie, 2022a, b; McQuarrie and Ehlers, 2015, 2017). The velocity fields and the specified thermal and crustal parameters (Table 2) are used by Pecube-D to solve the advection-diffusion heat equations to predict the subsurface thermal field for each Move displacement step (Braun, 2003; Braun et al., 2006; Ehlers et al., 2005; McQuarrie and Ehlers, 2015). The predicted time-temperature histories, predicted cooling rates, and prescribed mineral kinetics (Dodson, 1973; Ehlers et al., 2005; Hames and Bowring, 1994; Hodges, 2014; Ketcham et al. 2007; Reiners et al., 2004) are used by Pecube-D to calculate a suite of cooling ages for points at the surface (e.g., Braun, 2003; Braun et al., 2006; Ehlers, 2023) independent of any measured cooling age (Text S4). The measured cooling ages are then compared to and used to evaluate the predicted cooling ages output from Pecube-D. The predicted detrital MAr signal associated with each increment of displacement and basin deposition is calculated following the methods of Braza and McQuarrie (2022b). Detrital MAr age distributions are a function of source rock composition, transport, sorting, attrition, and weathering (e.g. Malusà and Fitzgerald, 2020), complexities that methods for predicting detrital cooling ages cannot account for. Because of this, our goal is to reproduce the distribution of measured detrital MAr cooling ages, rather than the magnitude or specific peak locations of the distribution.
Thermokinematic forward models are evaluated by their ability to reproduce the measured cooling ages (119 ages) and basin accumulation data (33 constraints). The predicted cooling ages and ± 0.5 Ma applied error are required to overlap with the measured age and associated ± 2σ error. A lateral error of ± 0.5 km is applied for the measured cooling data to account for uncertainty from projecting the samples along strike onto the transect line. The percent fit of the predicted cooling ages for each model is calculated by dividing the number of matched measurements by the total number of age measurements, for each chronometer (MAr, ZHe, AFT, and AHe) and the modelled cooling ages as a whole (Braza and McQuarrie, 2022a). Models are also required to match the measured basin thickness, depth of provenance indicators, and depositional ages (Braza and McQuarrie, 2022a). The modelled basin is required to have thicknesses within ± 0.5 km of the cross-section basin thickness, due to the variability in the orientations, map width, and number of faults deforming the Siwalik Group (e.g. Fig. 1), and depositional ages that fall within the measured age range at an equivalent depth (Braza and McQuarrie, 2022a). The percent fit of the basin is calculated by dividing the number of matched measurements by the total number of depth and depositional age constraints (Braza and McQuarrie, 2022a). The percent fits for the cooling ages and basin accumulation are equally weighted to determine the total model fit.
Model C is also assessed by evaluating the predicted peak temperatures against measured temperature estimates (see Text S4 in the Supplement, Fig. S1 for further details) (Braza et al., 2023). The ability to reproduce the measured peak temperature gradients with thermokinematic models that do not incorporate distributed shear transport does not preclude the presence of ductile processes, but suggests that any associated ductile flattening of the rocks occurred on the prograde burial path and synthrust shearing and/or vertical thinning is minor or secondary to the discrete fault displacements (Braza et al., 2023). While horizontal extension in response to vertical thinning may contribute additional displacement that is not quantified in the thermokinematic models, the amount of displacement imparted by transport-parallel elongation is expected to be limited if the models are able to replicate the measured peak temperatures and resulting cooling histories (e.g. Braza et al., 2023).
We present model results for three ramp geometries. We test various kinematic sequences and shortening rates for each geometry to find the best-fit to the measured datasets and identify a viable exhumation pathway. Models A and B test the cross-section geometries and kinematic sequences proposed by Robinson et al. (2006) and Olsen et al. (2019) for B-B′. Results from these models lead to the changes in the geometry, kinematic sequences, and shortening rates tested with Model C for the revised cross-section along A-A′ (Fig. 3). The final geometry, kinematics, and shortening rates presented for Model C are the product of more than 30 flexural-kinematic models and 60 thermal models that tested the influence of different ramp locations, sizes, and angles for ramps in the upper LH units, including the modern active ramp at ∼ 13 km north of the MCT; in- and out-of-sequence kinematics for the RMT fault and MCT in the north; out-of-sequence fault beneath the Dadeldhura klippe; and a suite of constant and variable velocities.
3.5 Landscape evolution modelling
Thermokinematic model versions of Model C with a total fit of > 80 % were input into a modified version of the landscape evolution model CASCADE (Braun et al., 1999; Braun and Sambridge, 1997; Yanites and Ehlers, 2016) to explore the influence of fault geometry and kinematic sequence on modelled topography and ksn values. Landscape evolution modelling followed the methods detailed in Eizenhöfer et al. (2019) and utilized the parameters in Table 2 (Text S5 in the Supplement). The modified version of CASCADE includes horizontal and vertical advection components that are derived from the input flexural-kinematic model grids (Eizenhöfer et al., 2019). Constant and variable (orographic) precipitation fields were tested (Text S5, Fig. S2 in the Supplement). The elevation profile and median ksn values were extracted for a 50 km wide swath of the modelled topographic surface using TopoToolbox v2 (Schwanghart and Scherler, 2014). The ksn values were calculated with θref = 0.5, the reference concavity inherent in CASCADE, and projected onto the center line to determine the median values. Integrating the landscape evolution and thermokinematic models is an iterative process whereby the results of the landscape models and required changes to geometry and/or location of recent uplift to better replicate the mean elevation along the section line and the across-strike pattern of ksn, are then evaluated in the thermokinematic model.
4.1 Geologic mapping
The geologic map of western Nepal is shown in Fig. 1b. Differences in the geologic mapping of this study and Robinson et al. (2006) are based on new observations and orientation measurements. The exposures of lower LH units in the southern limb of the Dadeldhura klippe are reinterpreted as repeating splays of the RMT, rather than the thick RMT package folded into an anticline-syncline pair proposed by Robinson et al. (2006). In the Dadeldhura klippe, the trace of the MCT in the southern limb is shifted ∼ 1–4 km southward from the Robinson et al. (2006) mapping, while the traces of the MCT and RMT in the northern limb are within ∼ 0.5–1 km. The northernmost RMT and MCT traces are within ∼ 0.5 km of the Robinson et al. (2006) mapping.
4.2 Geomorphic expressions of uplift
The average topographic profile along A-A′ increases in elevation at a ∼ 1–2° angle, from < 1 km at the MFT to a maximum of 5–6 km above GH rocks in the north (Figs. 3b and S3 in the Supplement). The minimum topography generally follows a 0.5° angle, aside from sharp increases in the minimum elevations at ∼ 65–55 and ∼ 1 km south of the MCT. Two abrupt increases in the slope of maximum topography occur at ∼ 95–55 km south of the MCT and from ∼ 5 km south to 20 km north of the MCT. The locations of elevated topography broadly correspond with the locations of elevated ksn values. Above the Dadeldhura klippe, ksn values increase from background values at ∼ 100 km south to a maximum at ∼ 70 km south of the MCT (Fig. 3b). In the north, ksn values gradually increase from ∼ 35 km south to ∼ 10 km north of the MCT. These bands of elevated ksn values reflect regions of active rock uplift or recent uplift that has been translated to the south (e.g., Eizenhöfer et al., 2019; Harvey et al., 2015; Wobus et al., 2006b).
4.3 Balanced cross-section
The balanced cross-section for the updated geologic mapping is shown in Fig. 3c (A-A′). The MHT in A-A′ is characterized by an average dip of ∼ 4° from beneath the MBT to the active ramp at ∼ 13 km north of the MCT, consistent with geophysical observations in western Nepal (e.g., Hoste-Colomer et al., 2018; Laporte et al., 2021; Subedi et al., 2018). We designate structural zones for the cross-section to facilitate discussion of the geometry, from south to north: the Subhimalaya, MBT, Dadeldhura klippe, LH duplex, RMT duplex, and MCT zones (Fig. 3). The Subhimalaya is characterized by three faults that deform the Siwalik Group. In the MBT zone, the upper LH units are juxtaposed above the Siwalik Group. The lower LH units (RMT), GH rocks (MCT), and Tethyan Himalayan rocks comprise the Dadeldhura klippe. The base of the Dadeldhura klippe is the RMT, which separates the lower and upper LH units. In the southern limb, the lower LH units are repeated by two imbricate faults. Below the RMT, upper LH strata are repeated in the LH duplex, with an upper LH thrust sheet forming the roof thrust. Out-of-sequence faults imbricate LH strata under the Dadeldhura klippe and offset strata in the LH duplex, as needed to reproduce the surface geology. The RMT duplex comprises four horses, with two consisting only of the Ranimata Fm. and two with both lower LH units. GH rocks comprise the MCT zone. Shortening on the MCT and RMT are the minimum amounts required to connect the northernmost GH and lower LH units with those preserved in the Dadeldhura klippe. The revised cross-section geometry is reproduced by ∼ 615 km of shortening. While differences in the cross-sections for A-A′ and B-B′ arise due to updates to the geologic mapping, the most significant alterations to the geometry depicted in Fig. 3 are to facilitate changes to the location and magnitude of the active décollement ramps, the order and magnitude of fault displacement and resulting structural uplift, and minimize the amount of shortening necessary to balance the cross-section (see Text S6 in the Supplement for additional details).
4.4 Thermokinematic models
We present thermokinematic model results for three ramp geometries: (A) Robinson et al. (2006), (B) Olsen et al. (2019), and (C) our new cross-section geometry. Results from each model lead to the changes in geometry, kinematic sequence, and shortening rates tested with the subsequent models. Model results are presented with the variable velocity that provided the highest total model fit for that section. Results for Model C with a constant shortening rate are included in Fig. S4 in the Supplement).
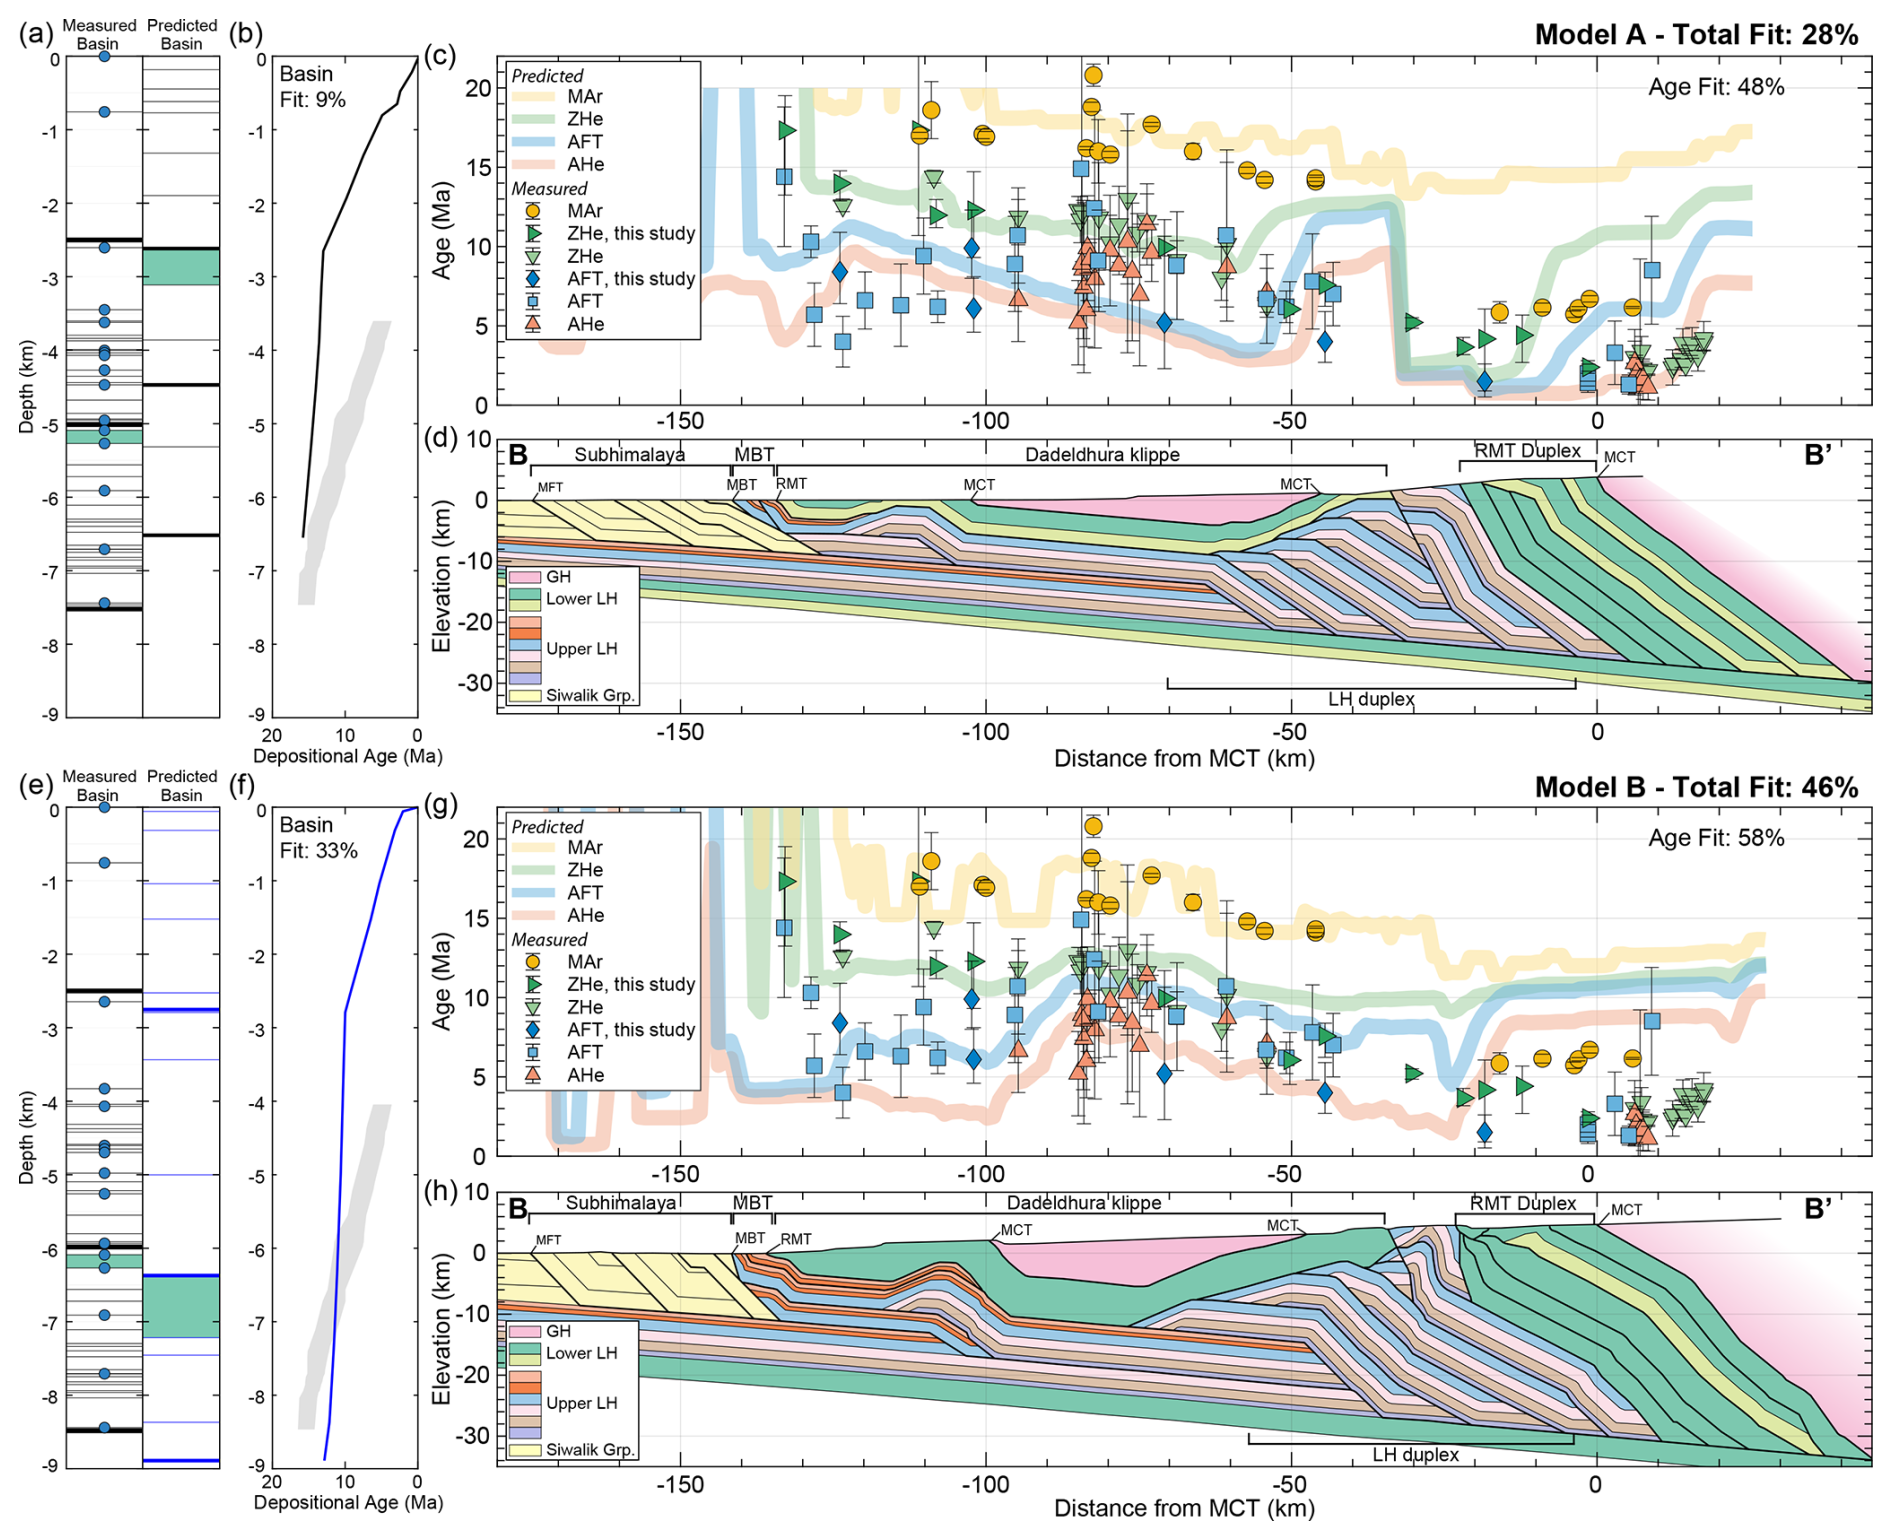
Figure 4Thermokinematic model results for Models A and B. (a, e) Measured and predicted basin thickness. Contacts between the Siwalik units are shown by the thick black and blue lines. In the left panel, thin black lines and blue dots indicate sample depths in the measured basin projected onto transect B-B′. Predicted basin increments are shown by the thin black lines in panel (a) for Model A and as thin blue lines in panel (e) for Model B. The initial input of lower LH-derived sediments in the basin is shown by the green swaths in the predicted and measured basins. (b, f) Accumulation rate for the modelled and measured basins. The measured depositional ages are projected onto transect B-B′ and indicated by grey shading. The accumulation rate for the modelled basins are shown by the black line in panel (b) for Model A and by the blue line in panel (f) for Model B. (c) Predicted MAr, ZHe, AFT, and AHe cooling ages for Model A. (d) Robinson et al. (2006) geometry for Model A. (g) Predicted MAr, ZHe, AFT, and AHe cooling ages for Model B. (h) Olsen et al. (2019) geometry for Model B.
4.4.1 Model A: Robinson et al. geometry
The MHT geometry of the Robinson et al. (2006) cross-section (B-B′) is characterized by an ∼ 7.5 km thick active ramp at ∼ 64 km south of the MCT (Fig. 4d). Out-of-sequence motion on the RMT and faults that deform the LH duplex are required to reproduce the surface geology and interpreted as the most recent component of deformation (Table S1 in the Supplement) (Robinson, 2008). Flexural-kinematic modelling of the ∼ 829 km of shortening produces a ∼ 6.5 km thick Siwalik Group, compared to the 7 km cross-section thickness (Fig. 4a). With the velocity that best reproduces the cooling ages (Table S1), the modelled lower Siwalik unit is ∼ 2.6 km thick and accumulated at ∼ 15.8–14 Ma, the ∼ 1.9 km thick middle Siwalik unit was deposited ∼ 14–13 Ma, and upper Siwalik unit is ∼ 2.6 km thick and was deposited after 13 Ma (Fig. 4b). Modelled lower LH rocks are first exhumed to the surface at ∼ 13 Ma during MBT motion and contribute to sediments preserved at ∼ 3 km basin depth (Fig. 4a). The modelled basin reproduces 9 % of the measured constraints.
The modelled reset MAr ages result from cooling and exhumation during RMT motion. Predicted MAr ages are ∼ 16–18 Ma in the Dadeldhura klippe (∼ 110–50 km south of the MCT), with the oldest age representing the initial motion on the RMT (Fig. 4c). Farther north, predicted MAr ages increase from ∼ 14 Ma above the LH duplex to ∼ 16 Ma above the MCT zone. Predicted MAr ages overlap 4 of 15 ages measured in the Dadeldhura klippe and are ∼ 8–10 Myr older than the 6 measured ages in the north. The ∼ 14–9 Ma predicted ZHe ages reflect displacement on the MBT and early motion over the active ramp (Table S1) and overlap 7 of 9 measured ages in southern limb and the cluster of ages in the center of the klippe (Fig. 4c). Predicted ZHe ages in the northern limb of the Dadeldhura klippe are ∼ 4.5–6 Myr older than the three ∼ 6–7.5 Ma measured ages. The ∼ 13 Ma predicted ZHe ages above the MCT zone are ∼ 8–10 Myr older than the measured ages.
Predicted AFT and AHe ages decrease from ∼ 9–11 to ∼ 3–4 Ma across the Dadeldhura klippe, resulting from cooling during uplift and exhumation over the active ramp at ∼ 64 km south of the MCT. Predicted ages overlap the older measured AFT ages at ∼ 130–90 km south of the MCT (7 of 13 measured ages) and the youngest AHe ages measured in the klippe (9 of 18 measured ages). The sharp increase in predicted AFT ages at ∼ 55–40 km south of the MCT overlaps 3 of 5 measured AFT ages in the north limb of the klippe. Predicted ZHe, AFT, and AHe ages steeply decrease to ∼ 1–3 Ma across the fault in the LH duplex (∼ 35–20 km south of the MCT) in response to young out-of-sequence motion, with 11 km of slip on the LH fault and 5.5 km on the RMT. The ∼ 2–5 Ma predicted ZHe ages reproduce the 4 ages measured at ∼ 31–10 km south of the MCT. Young out-of-sequence motion predicts ∼ 1–3 Ma AFT and AHe ages at ∼ 30 km south to 15 km north of the MCT, reproducing the measured AHe ages and 2 of 6 measured AFT ages.
Model A reproduces ∼ 63 % of AHe ages, ∼ 57 % of AFT ages, 52 % of ZHe ages, and 19 % of MAr ages, for a total fit of ∼ 48 % to the measured cooling age data. Combining the fit of the modelled to measured basin and cooling age data gives a total model fit of ∼ 28 %.
4.4.2 Model B: Olsen et al. geometry
Model A demonstrates the influence of a ramp that spans the entire thickness of upper LH units (∼ 7.5–8 km thick) on the ZHe, AFT, and AHe ages south of the ramp. To reduce the magnitude of young exhumation above the ramp and help preserve older ages in the Dadeldhura klippe, the MHT geometry in the Olsen et al. (2019) cross-section is characterized by a split ramp, with a ∼ 3.7 km thick ramp at ∼ 110 km south of the MCT and ∼ 4.3 km thick ramp at ∼ 47 km south of the MCT (Fig. 4h). Out-of-sequence motion on faults deforming the LH and RMT duplexes is minimized and occurs during shortening in the Subhimalaya (Table S2 in the Supplement) (Olsen et al., 2019). Flexural-kinematic modelling of the ∼ 875 km of shortening (Table S2) produces an ∼ 8.9 km thick Siwalik Group, compared to the 8.5 km cross-section thickness. The modelled lower Siwalik unit is 2.5 km thick and was deposited ∼ 12.8–11 Ma, middle Siwalik unit is 3.6 km thick and accumulated ∼ 11.1–10 Ma, and 2.8 km thick upper Siwalik unit was deposited after 10 Ma (Fig. 4e and f). Modelled lower LH rocks are first exhumed to the surface at ∼ 11.1 Ma and contribute to sediments preserved starting at ∼ 6.3 km basin depth (Fig. 4e). The modelled basin reproduces ∼ 33 % of the measured basin constraints.
Predicted MAr ages are generally ∼ 1–4 Myr younger than in Model A, due to a younger age of motion and faster velocity during RMT motion (Table S2), and reproduce 13 of 15 measured MAr ages at ∼ 110–45 km south of the MCT. Predicted MAr ages are ∼ 6–8 Myr older than the measured MAr ages in the north (Fig. 4g). Uplift of the RMT over small ramps that repeat the uppermost LH (∼ 140–100 km south of the MCT) during duplex formation results in ∼ 10–13 Ma predicted ZHe ages (Table S2). Predicted ZHe ages gradually become older above the Dadeldhura klippe where there has been limited uplift and exhumation, overlapping 16 of 24 measured ages. Predicted ZHe ages are ∼ 5–10 Myr older than the ages measured in the LH duplex, RMT duplex, and MCT zone (Fig. 4g). In the Subhimalaya, predicted AFT and AHe ages ∼ 4–5 Ma reflect uplift and exhumation over a thicker Siwalik section (∼ 8.9 km) and are ∼ 2–4 Myr younger than in Model A. The predicted AFT and AHe ages split over the Dadeldhura klippe, with AHe ages more sensitive to exhumation above the active ramp at ∼ 110 km south of the MCT. Predicted ages overlap 15 of 18 measured AHe ages and 19 of 24 measured AFT ages at ∼ 140–40 km south of the MCT. Farther north, predicted AFT ages (∼ 11–13 Ma) and AHe ages (∼ 8–11 Ma) are generally ∼ 5–9 Myr older than the measured ages. Model B reproduces ∼ 67 % of AHe ages, ∼ 67 % of AFT ages, ∼ 36 % of ZHe ages, and 62 % of MAr ages, for a total fit of ∼ 58 % to the measured cooling ages. Model B has a total fit of ∼ 46 % to the measured basin and cooling age data.
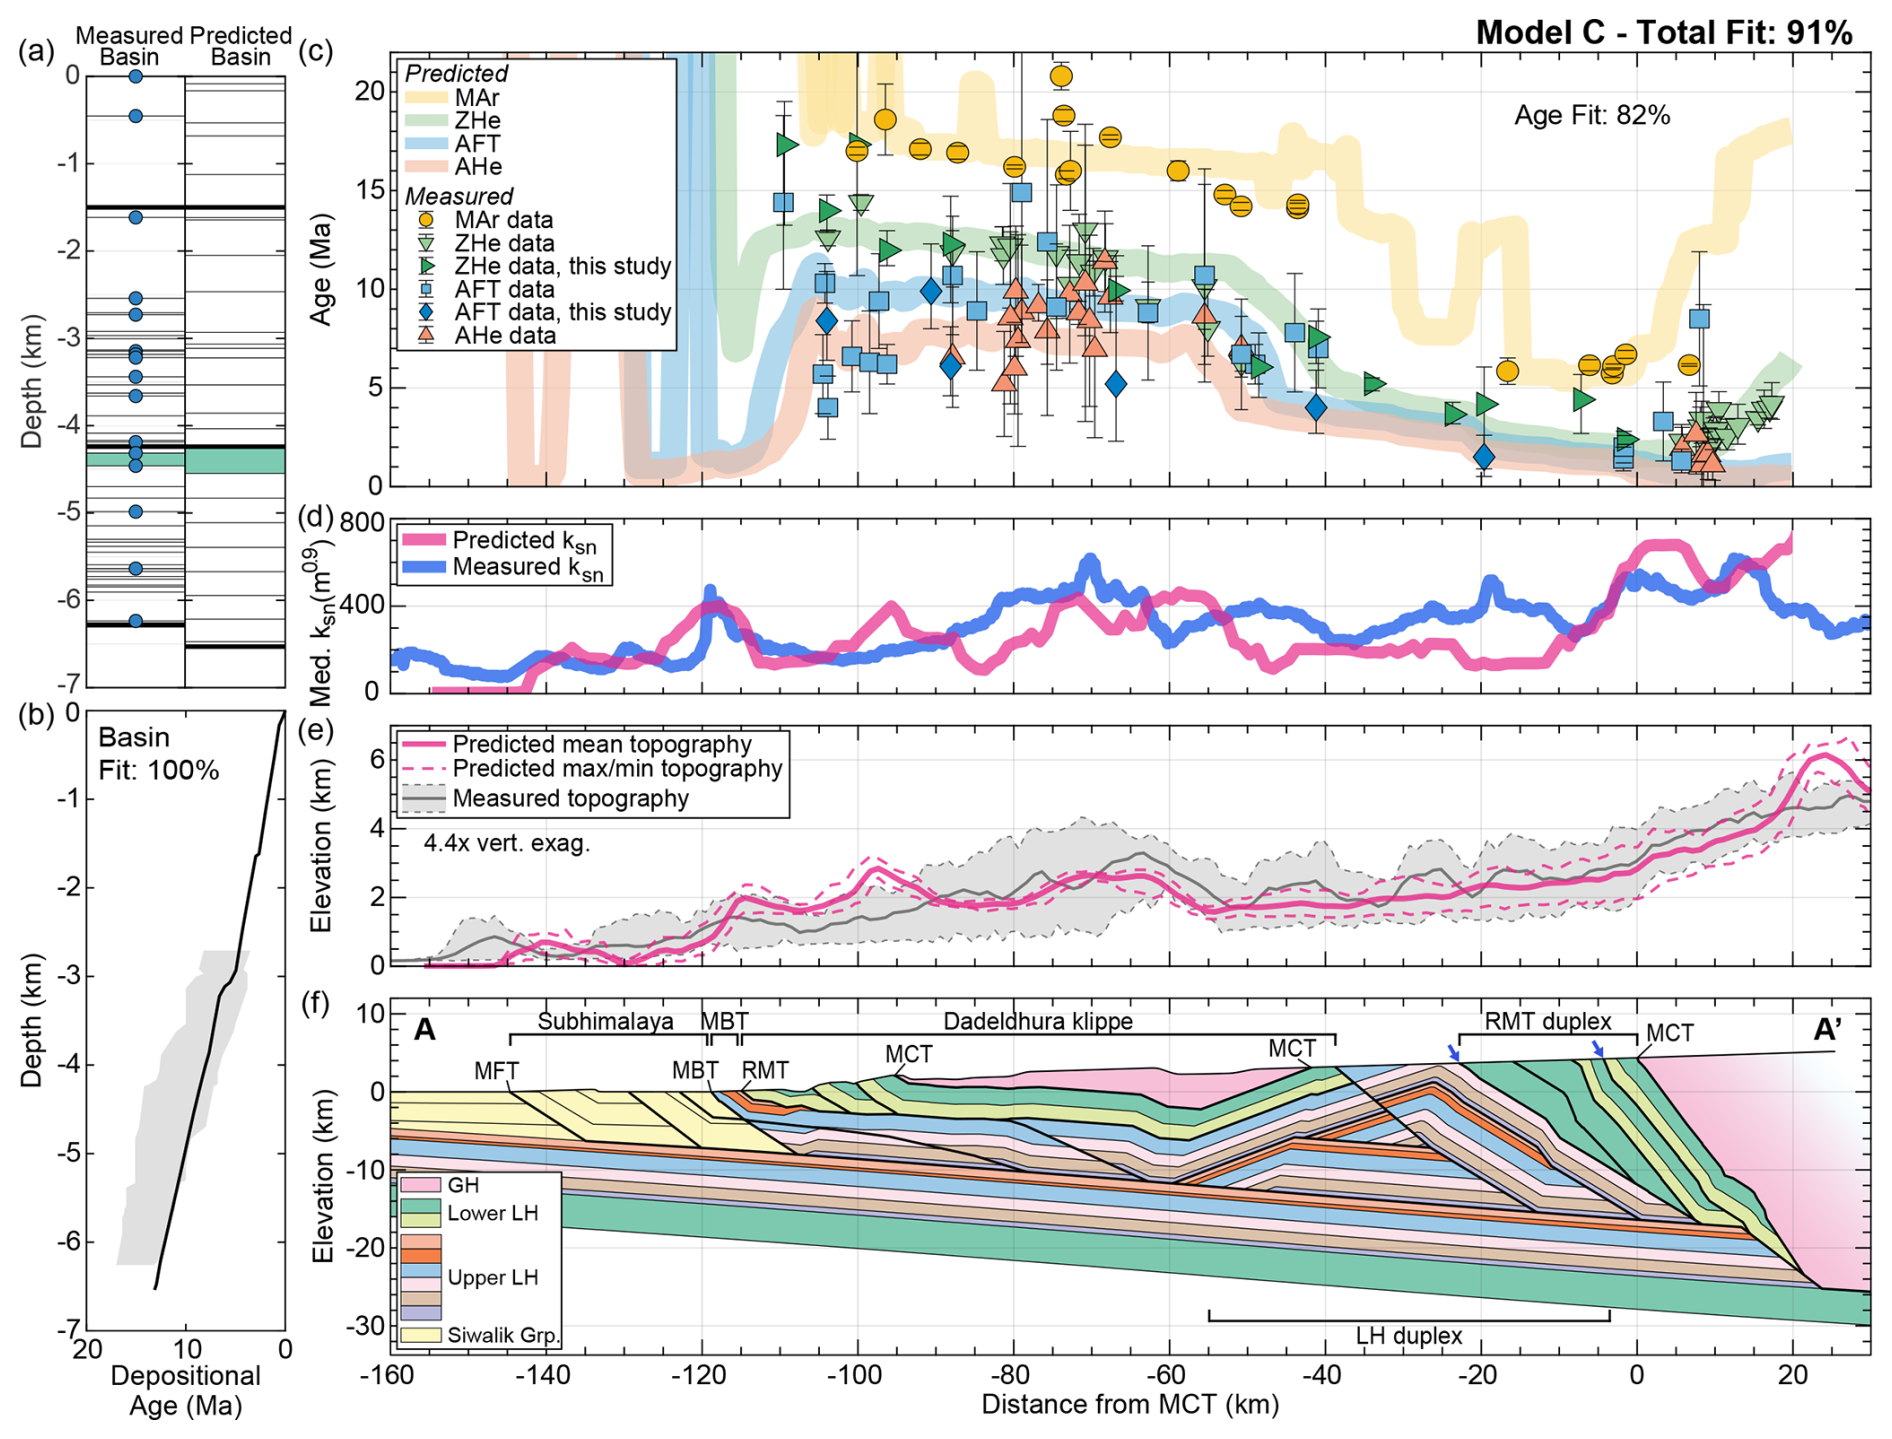
Figure 5Results for Model C of the revised geometry. (a) Thickness of the measured and predicted basins. Contacts between the Siwalik units are shown by the thick black lines. Thin black lines show sample depths in the measured basin and modelled increments of deposition in the predicted basin. The depth of lower LH-derived sediments is shown by the green swaths. (b) Accumulation rate of the modelled and measured basins. Grey shading denotes the range of measured depositional ages and the black line shows the modelled accumulation rate. Predicted (c) MAr, ZHe, AFT, and AHe cooling ages, (d) median ksn values, and (e) topographic profile are shown above the associated (f) structures. Blue arrows in panel (f) highlight the RMT faults with out-of-sequence displacement.
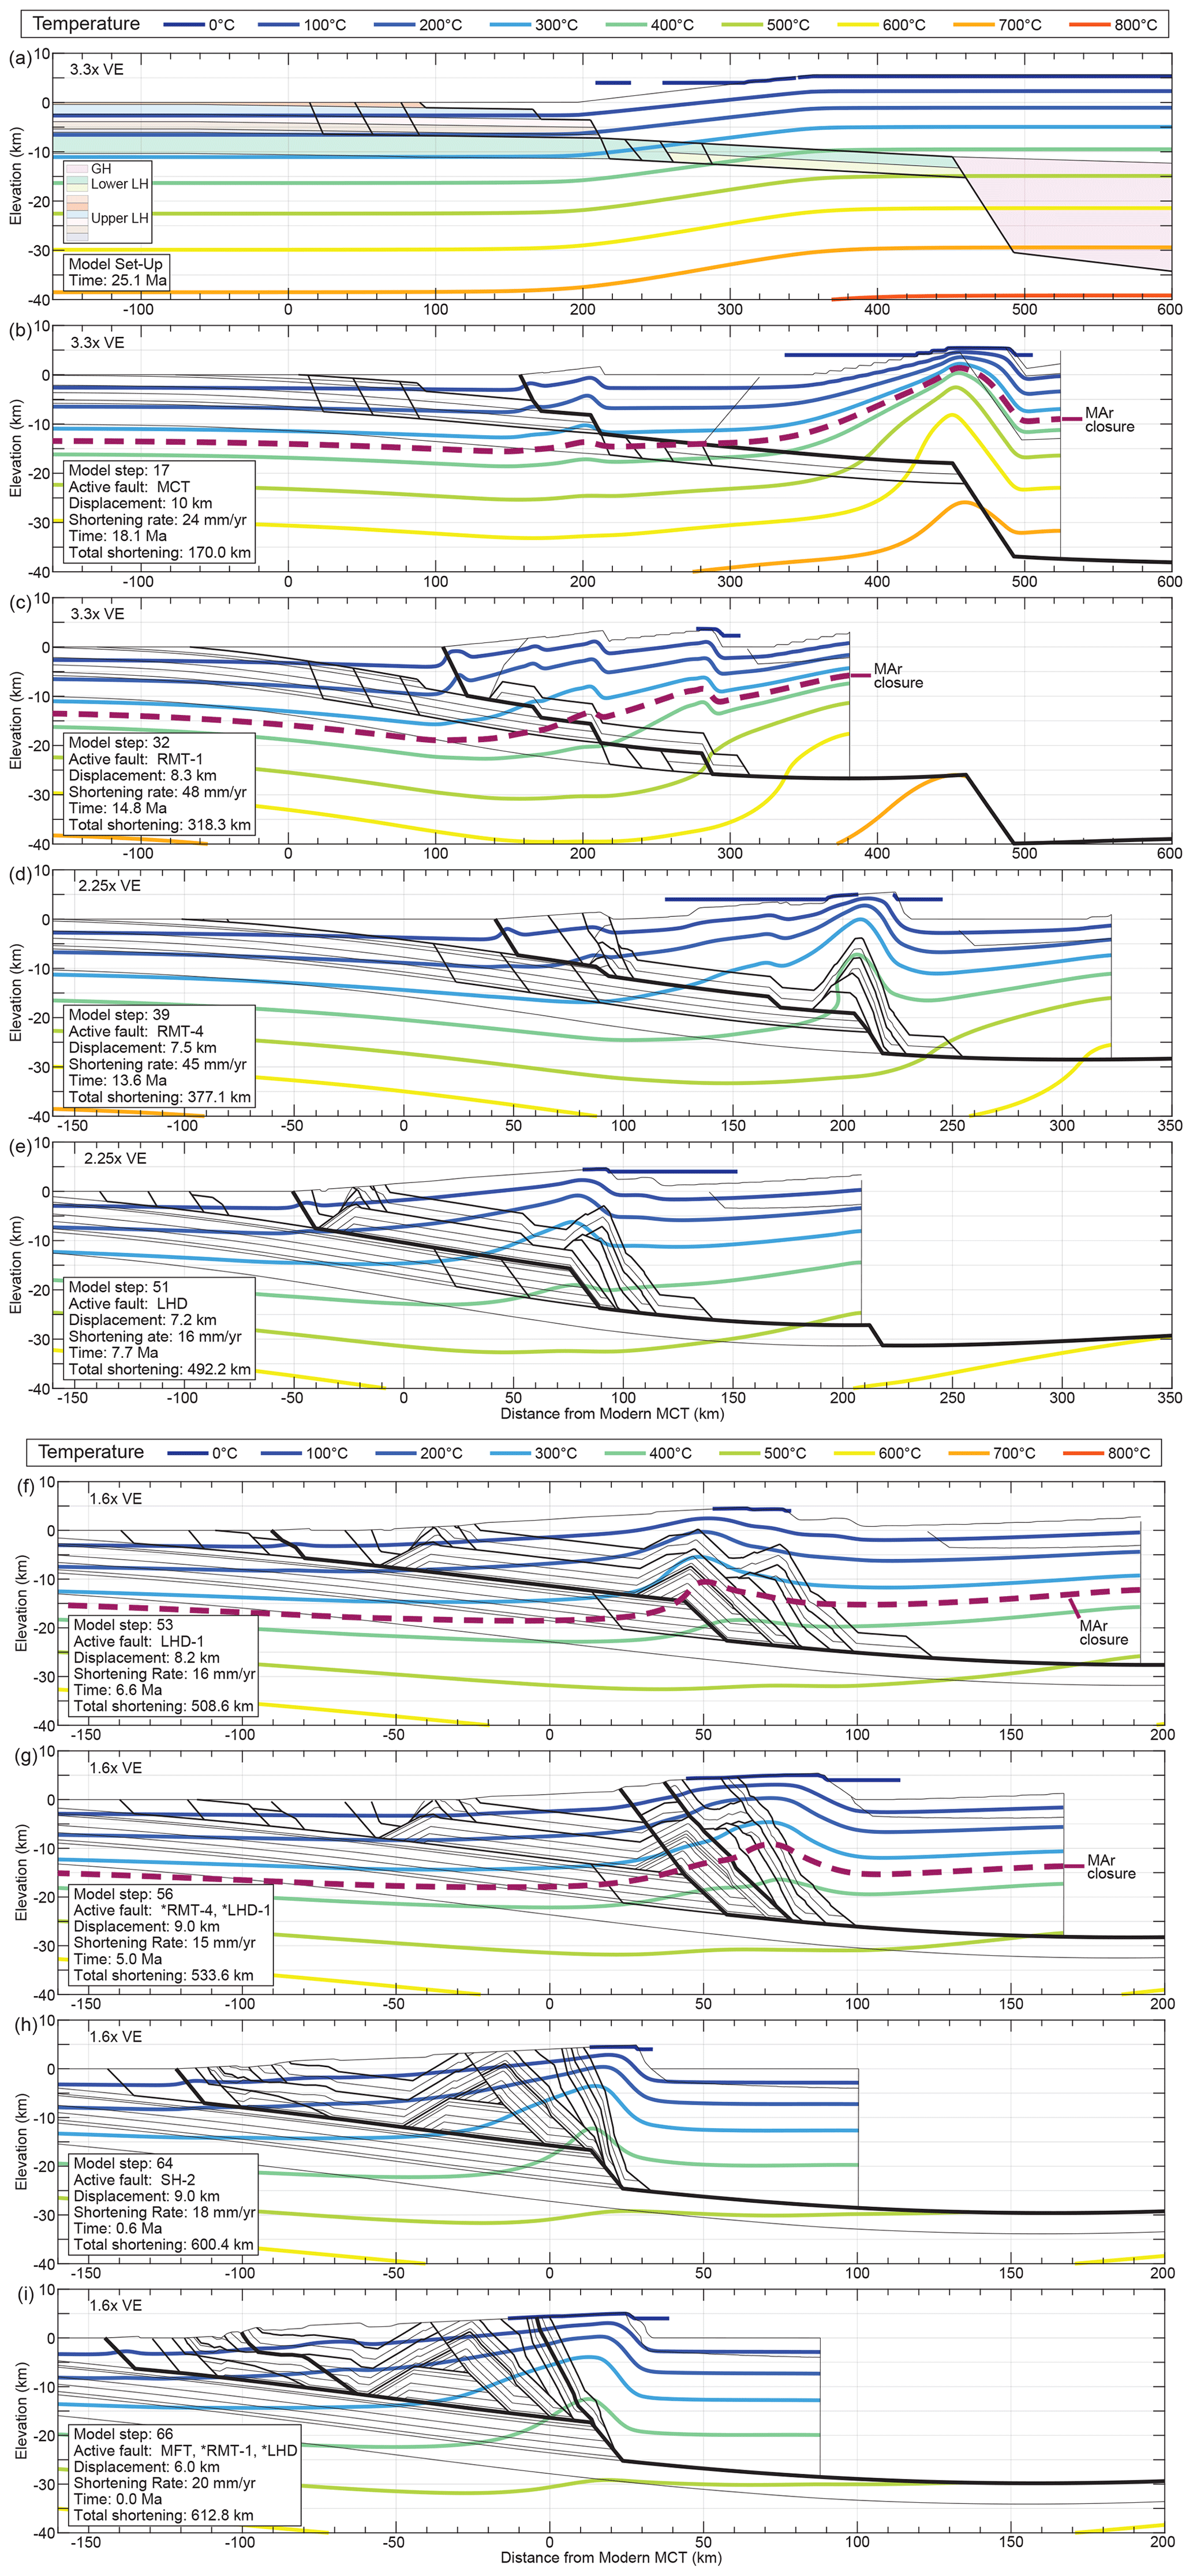
Figure 6Sequential deformation and resulting thermal field for Model C. (a) Initial model configuration. (b–i) Cross-section reconstruction and predicted thermal profiles for select model timesteps. The thick black lines indicate the active fault, medium black lines indicate inactive past and future faults, and thin black lines indicate unit contacts and the topographic surface. The displacement is the amount of shortening between this model step and the one prior. The shortening rate is calculated by dividing this shortening by the time difference between the two model steps. Asterisks highlight names of active faults with out-of-sequence displacement.
4.4.3 Model C: Revised geometry
While the Robinson et al. (2006) and Olsen et al. (2019) cross-sections are balanced and reproduce the surface geology, the results and misfits for Models A and B highlight the changes to the geometry, kinematic sequence, and fault shortening rates necessary to reproduce the cooling ages and basin depositional ages. The influence of an active ramp located beneath the Dadeldhura klippe on the predicted cooling ages, even with the split ramp geometry in Model B, emphasizes limited fault uplift in this region. The main décollement ramp in A-A′ is ∼ 8 km thick and located ∼ 13 km north of the MCT, below the youngest cooling ages along the transect (Fig. 5). To facilitate earlier cooling in the Dadeldhura klippe and preservation of older ZHe, AFT, and AHe ages, we created a new cross section geometry (Fig. 3) that shows an alternate LH duplex geometry with an upper LH thrust sheet as the roof thrust, beneath the RMT (Table S3 in the Supplement, Figs. 3, 5f and 6). The kinematic sequence is also modified to adjust when specific structures move (Table S3, Fig. 6, Video S1 in the Supplement). The inability of the previous models to reproduce the young MAr, ZHe, and AFT north of the RMT, even Model A with ∼ 16.5 km of out-of-sequence motion, indicates a significant pulse of young uplift and exhumation is required. We incorporate out-of-sequence motion at 5–6 and ∼ 3 Ma, with 12 km slip on the RMT fault at ∼ 20 km south and 16 km slip on the RMT splay at ∼ 3 km south of the MCT (Table S3, Fig. 5f, Video S1). Out-of-sequence faulting in the south includes 3.4 km in the MBT zone, as required to reproduce the surface geology, and 3.75 km of displacement at ∼ 90 km south of the MCT, to produce elevated topography and ksn values in the Dadeldhura klippe (see Sect. 4.4). Results for Model C with a constant shortening rate are included in Fig. S4 and results with the best-fit variable velocity are discussed below.
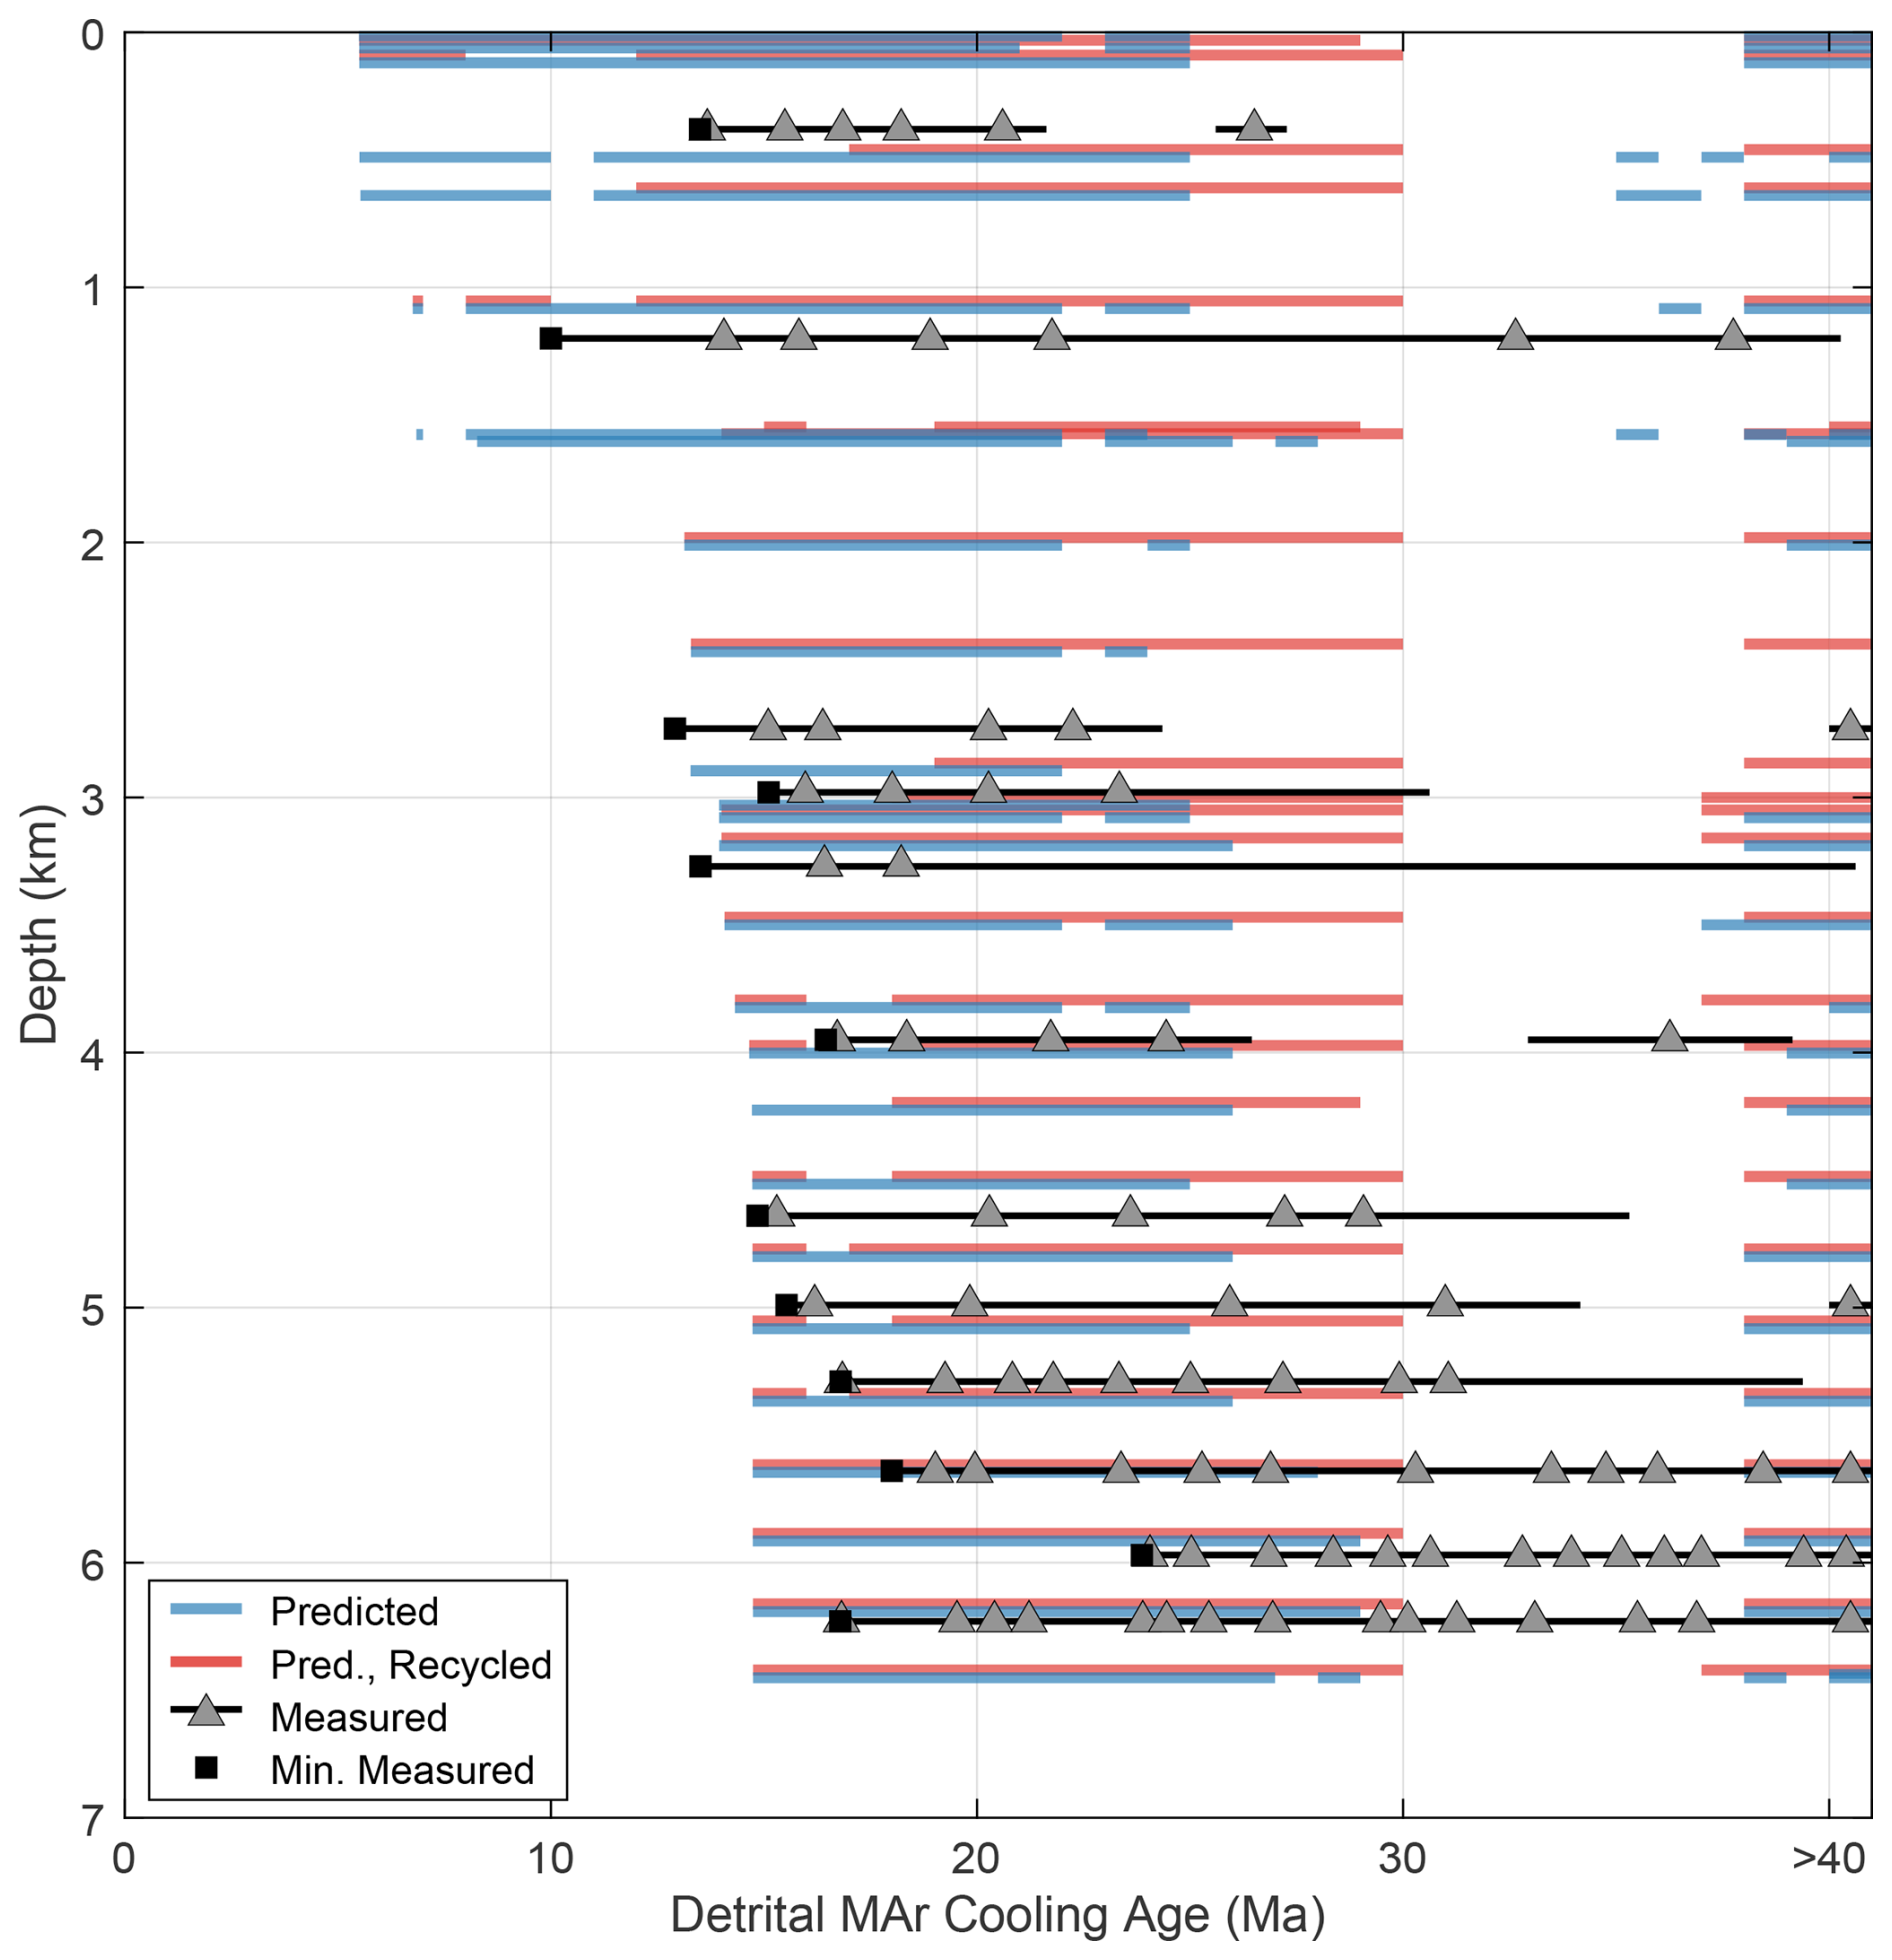
Figure 7Depth versus detrital MAr cooling age predicted by Model C. Measured detrital cooling age peaks (triangles) from Szulc et al. (2006). The horizontal black lines extend from the minimum to maximum MAr age in a continuous distribution of the measured data. Black squares show the overall minimum age in a sample. Blue and orange horizontal bars represent the distribution of predicted detrital cooling ages produced by each deformation step in the kinematic sequence.
Flexural-kinematic modelling of the revised geometry and kinematic sequence produces an ∼ 6.5 km thick Siwalik Group (Fig. 5a). The modelled lower Siwalik unit is ∼ 2.3 km thick and accumulated ∼ 13.3–9.9 Ma, the middle Siwalik unit is 2.74 km thick and was deposited ∼ 9.9–3.2 Ma, and the upper Siwalik unit is 1.5 km thick and was deposited ∼ 3.2 Ma (Fig. 5b). Modelled lower LH rocks are first exhumed to the surface at ∼ 10 Ma and add to sediments preserved at ∼ 4.5–4.8 km basin depth (Fig. 5a). The predicted basin fully reproduces the measured constraints. The predicted detrital cooling ages for the MAr system are shown in Fig. 7. The predicted detrital MAr ages are generally distributed between ∼ 15 and ∼ 30 Ma throughout the basin, fully overlapping the measured age distributions. The predicted detrital MAr distribution is characterized by a young static peak at ∼ 15 Ma generated from both erosion of the bedrock MAr ages (Fig. 6b and c) and recycling of older detrital MAr ages via erosion of the earlier foreland strata (Fig. 7). A distinct shift in the minimum age of the predicted detrital distribution occurs at ∼ 1.6 km basin depth, with a population of detrital MAr ages ∼ 5.5–10 Ma. Older ages that are unreset by Himalayan orogenesis also persist throughout the basin, with the population of predicted detrital MAr ages ∼ 25–30 Ma predominantly produced from recycling of earlier foreland deposits and the > 40 Ma ages produced from a combination of bedrock erosion and recycling of the foreland.
Predicted bedrock MAr ages decrease from 19 to 16 Ma across the Dadeldhura klippe and are set by the initiation age and shortening rate of RMT motion (Table S3). Out-of-sequence motion on the RMT faults produces ∼ 5–8 Ma MAr ages between ∼ 30 km south and ∼ 5 km north of the MCT (Fig. 5c). Predicted bedrock MAr ages overlap 10 of 15 ages measured in the Dadeldhura klippe and 5 of 6 ages north of the RMT. The oldest predicted ZHe, AFT, and AHe ages are in the southern limb of the Dadeldhura klippe (∼ 110–50 km south of the MCT) and young by ∼ 2–3 Myr across the klippe (Fig. 5c) in response to motion over the upper LH ramp and subsequent southward translation during formation of the LH duplex. Predicted ZHe and AFT ages sharply decrease to ∼ 4–5 Ma across the LH fault at ∼ 40 km south of the MCT due to out-of-sequence motion. Above the LH duplex, RMT duplex, and MCT zone, predicted ZHe, AFT, and AHe ages gradually young to ∼ 1–2 Ma at ∼ 5–20 km north of the MCT in response to displacement over the modern active ramp and subsequent southward translation on the MHT flat. North of the modern active ramp and region uplifted by the young out-of-sequence faults, predicted ZHe, AFT and AHe ages become older (∼ 5–15 km north of the MCT).
Model C reproduces ∼ 92 % of AHe ages, ∼ 77 % of AFT ages, 86 % of ZHe ages, and ∼ 71 % of MAr ages, for an overall fit of ∼ 82 % to the measured cooling ages. Model C provides a total fit of 91 % to the measured basin and cooling age data.
4.5 Landscape model: Model C
The topographic profile and ksn values predicted by the landscape evolution model for Model C are shown in Figs. 5d, e and S5 in the Supplement and Video S2 in the Supplement. The average topographic profile increases in elevation from < 1 km at the MFT to ∼ 6.5 km above the GH zone at a ∼ 1° angle (Fig. 5e). The average slope and elevation sharply increase between ∼ 110–65 km south and ∼ 0–30 km north of the MCT, in response to out-of-sequence faults active since ∼ 1.3 Ma and motion over the active ramp at ∼ 13 km north of the MCT (Fig. 5e, Video S2). While the modelled relief is notably less than measured (0.5–1 km vs 2–3 km), the modelled mean elevation is within 0.5–1 km of measured topography. Modelled relief is the most similar in scale (∼ 2 km) north of the MCT. The median predicted ksn values sharply increase across ∼ 15 km wide windows above the MBT and Dadeldhura klippe zones, in response to out-of-sequence motion uplifting rocks over the ramp at ∼ 80–65 km south of the MCT, feeding slip to surface faults at the MBT, and within the RMT at ∼ 125–115 km south of the MCT (Fig. 5d, Video S2). In the north, predicted median ksn values sharply increase from ∼ 5 km south to ∼ 30 km north of the MCT in response to out-of-sequence motion on the RMT at ∼ 5 km south of the MCT. The highest predicted ksn values along the section are at ∼ 15–30 km north of the MCT, above the modern active ramp.
5.1 Harmonizing the bedrock and basin constraints
Bedrock cooling ages and basin accumulation rates are both complimentary indicators of exhumation in a fold-thrust belt. In-situ thermochronologic ages preserve the timing and location of uplift, cooling, and exhumation over a décollement ramp (e.g., Lock and Willett, 2008; McQuarrie and Ehlers, 2017). Uplift and erosion in the hinterland of a fold-thrust belt is intrinsically linked to the associated foreland basin. The isostatic response to each increment of displacement creates space in the foreland basin that is filled with hinterland-derived synorogenic sediments (e.g., DeCelles and Giles, 1996; Naylor and Sinclair, 2008). Thus the magnitude, location, and rate of uplift and exhumation in the hinterland has a direct influence on the magnitude and rate of accumulation in the foreland basin and on any detrital provenance and/or detrital cooling age signals present in the basin (e.g., Bernet and Garver, 2005; Braza and McQuarrie, 2022a, b; Malusà and Fitzgerald, 2020; Reiners and Brandon, 2006). Accounting for the basin accumulation is important, as changes to fault timing and shortening rates that may not alter bedrock cooling ages can impact the basin depositional ages (Braza and McQuarrie, 2022a). For example, the hinterland unroofing signal of lower LH rocks at ∼ 10 Ma is well-documented in the western Nepal foreland by a distinct shift in εNd values starting at ∼ 4.4 km basin depth (Huyghe et al., 2001; Robinson et al., 2001, 2006; Szulc et al., 2006). This signal requires LH rocks to be exposed in the hinterland at the time these sediments are being deposited at ∼ 4.4 km depth in the modern foreland; models must be able to reproduce this relationship, timing, and basin depth. As the bedrock and basin exhumation records are linked, any model of tectonic deformation must be able to reproduce both records to be considered valid.
With the one ramp geometry of Model A, the youngest measured AHe ages at ∼ 90–70 km south of the MCT are replicated with motion on the MBT at ∼ 13 Ma and shortening rates of 7 mm yr−1. The ∼ 14–19 Ma MAr ages set by RMT motion and the ∼ 9–14 Ma ZHe ages set by motion over the northernmost upper LH ramp require fast rates (∼ 45–63 mm yr−1) from the model start to 13 Ma. These thrust kinematics and the resulting bipolar (45 mm yr−1 vs 7 mm yr−1) rates produce a basin age of ∼ 15.8–13.5 Ma over the same depth that the measured data record sedimentation from ∼ 13.5–6 Ma (Fig. 4b). The predicted lower LH provenance signal is ∼ 2 km shallower than the measured depth and the depositional age is ∼ 3 Myr older than the ∼ 10 Ma measured age.
The two-ramp geometry depicted in Model B is ideal for reproducing the overlapping swath of ZHe and AHe ages measured at ∼ 90–70 km south of the MCT (Fig. 4g) that indicate significant exhumation at 12–9 Ma and minimal exhumation since. Similar to Model A, fast rates (70–75 mm yr−1) between 18–10 Ma are necessary to reproduce the ∼ 14–19 Ma MAr ages set by RMT motion and ∼ 9–14 Ma ZHe ages set by motion over the northernmost upper LH ramp, and are followed by slow rates of 7 mm yr−1. The extreme rates produce a basin age ∼ 13–11.5 Ma over the depth of the measured ∼ 16–12 Ma lower Siwalik unit and ∼ 10.4–9.8 Ma over the depth of the measured ∼ 8–6 Ma middle Siwalik unit (Fig. 4f). For Models A and B, the unrealistic rates and clear disconnect between the measured and modelled basin accumulation ages argue against these MHT geometries.
Model C, with the ramp located north of the MCT, is able to reproduce the significant exhumation required by the older measured ZHe (∼ 12–15 Ma) and AFT (∼ 10–15 Ma) ages without the extremes in shortening rate. Like the other models, the ZHe ages above the Dadeldhura klippe are set during cooling and uplift over the upper LH ramp (Figs. 6 and S6 in the Supplement, Video S1) and thus initial shortening on the MBT needs to initiate at ∼ 13–15 Ma. In marked contrast to the previous models, the ∼ 130 km distance from the ramp to the modern MBT means shortening rates from ∼ 14 Ma to present may range from 15–35 mm yr−1 (Table S3, Video S1). Motion on the upper LH thrust at ∼ 14 Ma in Model C deposits sediments beginning at ∼ 6.5 km basin depth, matching the measured depositional ages. The modelled exposure of lower LH rocks begins ∼ 10 Ma and is preserved at ∼ 4.8–4.5 km basin depth (Fig. 5). Model C is also able to fully reproduce the measured distribution of detrital MAr cooling ages (Fig. 7).
While the fit of modelled to measured cooling ages do not strongly differ in the frontal portion of the system (MBT to Dadeldhura klippe) between Models A (61 %), B (79 %), and C (76 %), the divergence in the resulting shortening rates, basin depositional ages, and basin accumulation rate is profound. The ability of a model to replicate the basin age and provenance is critical for assessing the validity of modelled geometries and exhumation pathways.
5.2 MHT geometry in western Nepal
The MHT geometry is defined by the size and location of the active décollement ramps. In Model C, the active ramp is ∼ 8 km thick and located ∼ 13 km north of the MCT. AHe, AFT and ZHe ages that overlap in age between ∼ 5–15 km north of the MCT requires ∼ 10 km of active uplift and exhumation in this area. ZHe ages increase to the north from 2 to 5 Ma over 5–20 km north of the MCT, consistent with the expected pattern of increasing ages on the hinterland side of an active ramp (Figs. 4 and 5) (McQuarrie and Ehlers, 2017). Similarly, the gradual increase in age of all three systems (AHe, AFT, and ZHe) from 1–2 Ma in the north to 5–7 Ma in the south (40–50 km south of the MCT) is the expected age signal in the direction of transport following uplift and exhumation over a ramp (Figs. 4 and 5, Video S1). These across strike patterns in cooling ages support the active MHT ramp location at ∼ 10–20 km north of the MCT (Figs. 3 and 5).
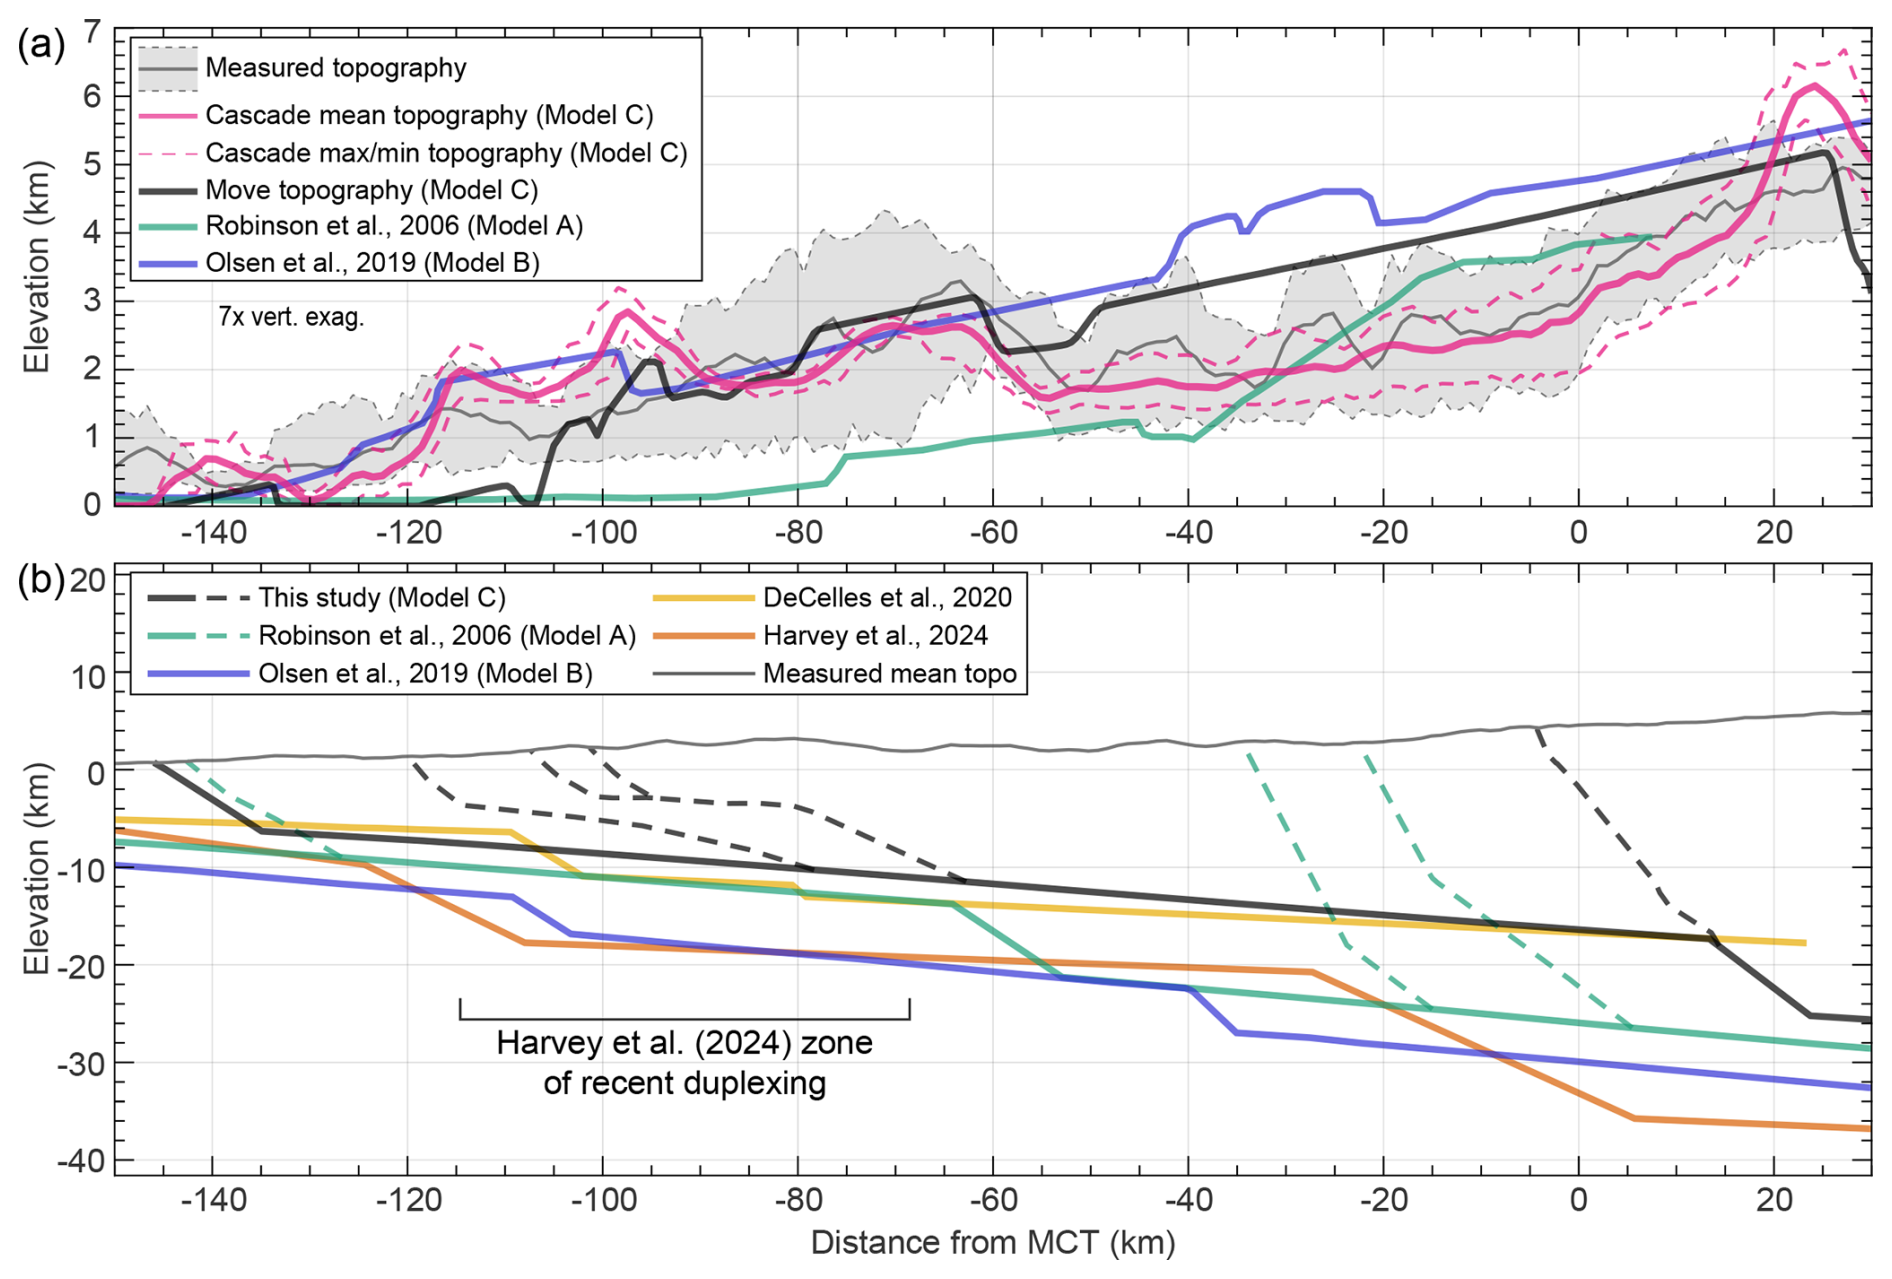
Figure 8Models of the Simikot transect in western Nepal. (a) Topographic swath (grey) and predicted topographies generated by the different models. (b) Comparison between proposed geometries of the MHT. Dashed lines show the young (< 1 Ma) out-of-sequence faults of Models A and C.
Previous estimates of MHT geometry in western Nepal generally propose active décollement ramps at ∼ 120–40 km south of the MCT (Fig. 8) (e.g., DeCelles et al., 2020; Harvey and Burbank, 2024; Hoste-Colomer et al., 2018; Laporte et al., 2021; Olsen et al., 2019; Robinson et al., 2006). The size and location of these ramps are similar to those tested in Models A and B, allowing us to infer the influence of these proposed ramps on the distribution of young cooling ages and locations of active uplift. The youngest predicted cooling ages will always be co-located with active ramps (Lock and Willett, 2008; McQuarrie and Ehlers, 2015, 2017; Ghoshal et al., 2020, 2023); this is seen in all three modelled sections (Figs. 4 and 5). In western Nepal, ∼ 5–10 Ma AHe cooling ages and resulting slow exhumation argue against a long-lived MHT ramp between 60–90 km south of the MCT (e.g. Harvey and Burbank, 2024). As shown in Models A and B, adjacent ramps to the north or south of this region (120–100 km south and 60–30 km south of the MCT) (Fig. 8) necessitate markedly slow fault shortening rates (∼ 7 mm yr−1) from at least 10 Ma, and potentially from 14 Ma, to present to replicate the measured cooling ages.
Without a décollement ramp in the MHT at ∼ 100–60 km south of the MCT, cross-section geometries lack a mechanism to drive uplift to produce the region of raised topography and elevated ksn values in the Dadeldhura klippe (Figs. 3b and 7) (Harvey et al., 2015; Harvey and Burbank, 2024). As steepened river profiles are a transient response to uplift, elevated ksn values indicate recent uplift. The ksn values in the Dadeldhura klippe are elevated across a narrow window (Fig. 3), indicating limited amounts of lateral translation of the elevated values (e.g. Eizenhöfer et al., 2019) and arguing against a long-lived MHT ramp in this region. Similar to Harvey and Burbank (2024), we argue that low exhumation magnitudes and low relief surfaces suggest very recent and minor uplift across this region. To accommodate this, we incorporate 3.75 km of displacement on a fault splay that cuts through the upper LH units at ∼ 80–60 km south of the MCT and feeds slips to the RMT splays in the southern limb of the Dadeldhura klippe (∼ 105–100 km south of the MCT) (Fig. 8), co-aligned with a region of active microseismicity (Text S6) (e.g. Laporte et al., 2021).
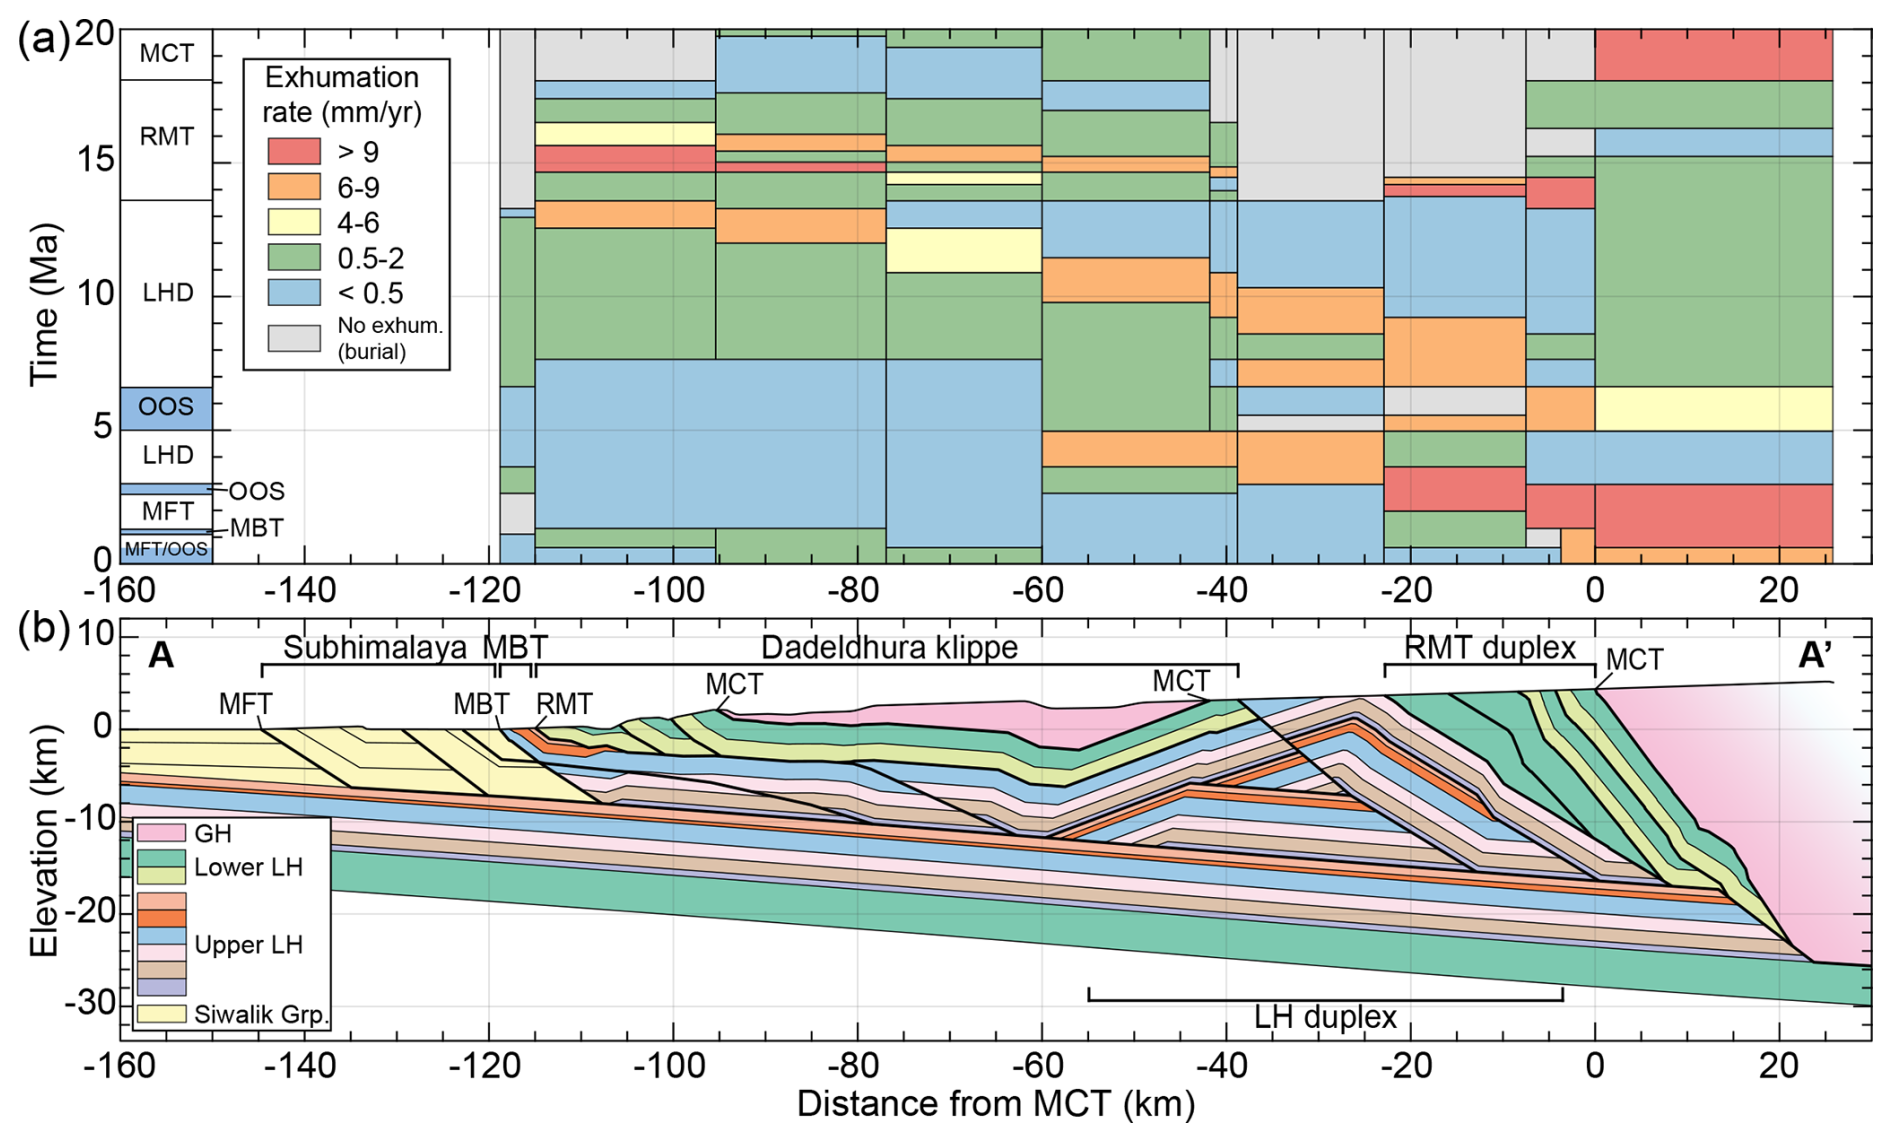
Figure 9(a) Exhumation rates for rocks at the modern surface along A-A′ are shown above the (b) structures. The timing of structures is indicated in the left panel in (a), with periods of out-of-sequence (OOS) displacement highlighted in blue.
An alternative explanation for the region of raised topography and elevated ksn values in the Dadeldhura klippe is river incision of a high elevation, low relief surface (Sherpa et al., 2023). In this framework, the high elevations preserved in the Dadeldhura klippe formed during emplacement of the RMT from 14–11 Ma (Sherpa et al., 2023). River incision into this surface by the Karnali and Tila rivers (Fig. S3) from ∼ 11 to 6 Ma is argued to drive exhumation and cooling of rocks to set the broadly northward younging pattern of AFT ages between 110 to 50 km south of the MCT (Fig. 5) and elevated ksn values at the edges of the low-relief surface (Sherpa et al., 2023). We argue that the rapid cooling illustrated by their inverse modelling from > 200 °C and initiating by ∼ 14–8 Ma (depending on location) is the expected response of exhumation over a ramp. This ∼ 8 km of northward younging exhumation and resulting cooling in our model is a function of motion on an upper LH thrust from ∼ 14–7 Ma (Fig. 6c–f, Video S1). The associated cooling allows us to produce modelled ZHe, AFT and AHe ages at ∼ 13–11, 10–8, and 7 Ma respectively, replicating 76 % of the cooling ages in this region (Fig. 5), and is reflected in the northward younging pulse of ∼ 6 mm yr−1 of exhumation highlighted in Fig. 9 from 14–7 Ma. In addition, both our flexural kinematic model and landscape evolution model highlight the difficulty in maintaining ∼ 4 km of elevation across a thrust sheet in absence of other forms of uplift. For example, the flexurally modelled topography that increases northward from 2.3–5.1 km in elevation (Fig. 6f, 6.6 Ma) between 50 km south and 20 km north of the MCT was initially uplifted and exhumed over the ramp at 50 km south. Following this exhumation, topography is simply translated southward and gradually subsides due to thrust loading at 90 km south and at the ramp at 50 km north of the MCT. The landscape evolution models for Model C also illustrate this and show how high topography is generated from vertical motion at the active fault ramp and then is translated southward. This is most apparent between 10.3–7.8 Ma and from 4.6 Ma to present (Video S2). These translated interfluves gradually decrease in elevation to the south due to both flexural subsidence and erosion and provide support for an uplift mechanism to produce the high topography and elevated ksn values in the region of the Dadeldhura klippe (Fig. 5).
The ability of the modelled geometry, kinematics, and rates to replicate, to a first order, the topography of western Nepal provides an additional level of validity to the MHT geometry presented here. While ∼ 1.4 km of uplift accompanied by ∼ 0.6 km of erosion from 0.6 Ma to present is required to replicate the uplifted mean topography of the Dadeldhura klippe (Fig. 5, Video S2), intermittent fault motion on this structure over the last million years may facilitate the needed river incision to propagate through the uplifted topography (e.g. the Karnali and Tila rivers) during fault inactivity. This river incision is required to replicate the topographic relief missing from the modelled landscape.
5.3 Exhumation drivers in the western Nepal high Himalaya
The ability of Model C to sufficiently reproduce the various bedrock and basin datasets indicates that the geometry, kinematics, and shortening rates represent a viable exhumation pathway for the rocks presently at the surface and we can use these results to evaluate the dominant structural drivers of exhumation in western Nepal. The location and magnitude of erosion determined from the difference in the deformed, uplifted topography and the newly eroded topography predicted in each ∼ 10 km displacement step in the flexural-kinematic model combined with the increment of time this erosion occurred over provide an exhumation rate for each model step (Fig. 9).
Fold-thrust belts have a characteristic ramp-flat décollement geometry that results in periods of active exhumation during vertical motion above the ramp and associated focusing of erosion of the raised topography that alternate with periods of slower, very limited exhumation in the absence of uplift where rocks are laterally translated along décollement flats. Cooling during lateral translation occurs as rocks pass through tilted isotherms (Fig. 6) (e.g., Braza et al., 2023; Coutand et al., 2014; Lock and Willett, 2008; McQuarrie and Ehlers, 2015, 2017; Robert et al., 2011).
RMT motion over the ramp at the northern edge of upper LH units (∼ 216 km north of the modern MCT) sets the MAr cooling ages for rocks preserved in the Dadeldhura klippe (Fig. 6c, Video S1) and displacement is thus required to initiate by ∼ 18 Ma to set the MAr age in the southern limb of the klippe. Fast shortening rates (45–48 mm yr−1) are required to predict MAr ages ∼ 16 Ma in northern limb of the klippe and to allow for the full shortening in the RMT duplex to occur prior to ∼ 14 Ma. The signal of motion over the ramp is visible in the bedrock exhumation history as a pulse of fast (4 to > 9 mm yr−1) exhumation at ∼ 16.5–14.6 Ma for rocks presently exposed at ∼ 115–95 km south of the MCT, while the continued southward translation shifts the location of rapid exhumation northward with time, with the rocks at ∼ 80–60 km south of the MCT experiencing the faster rates of ∼ 4–9 mm yr−1 at ∼ 15.7–14.2 (Fig. 9). This significant pulse of exhumation is also present in the predicted and measured detrital MAr ages (Fig. 7), with a ∼ 15 Ma static peak that is persistent throughout the basin. The population of ∼ 14–18 Ma bedrock MAr ages in the Dadeldhura klippe provides a clear source for the ∼ 15 Ma age peak in the detrital distribution. The fine resolution of the predicted detrital Mar record also highlights that the persistence of this ∼ 15 Ma static peak through the entire basin record is from both erosion of the bedrock and recycling of the earlier foreland deposits (Braza and McQuarrie, 2022b).
The ZHe ages in the Dadeldhura klippe were set during formation of the LH duplex and motion over an upper LH ramp (∼ 86 km north of the modern MCT) (Fig. 6e). As shown by the thermokinematic models, motion over the ramp that sets these ages needs be as old as possible (∼ 14 Ma) to reproduce the ZHe ages in the southern limb of the Dadeldhura klippe. Early exhumation of these rocks over the ramp in the upper LH rocks is facilitated by adjusting the shortening rates in Models A and B, but this provides a poor fit the measured basin depositional ages (Fig. 4). To balance the bedrock requirement for older exhumation with the need for deposition of the basal portion of the lower Siwalik unit to be ∼ 13–17 Ma, the new geometry in Model C presents a modified LH duplex, where the rocks in the immediate MBT hanging wall extend to the north becoming the roof thrust of the duplex (Figs. 3 and 5, Video S1). This geometry facilitates earlier exhumation over a ramp that is further north than the modern active ramp and allows for more reasonable shortening rates. This signal is apparent in the pulses of rapid exhumation (∼ 4–9 mm yr−1) that initiates at ∼ 13.6 Ma at ∼ 115–95 km south of the MCT and gradually shifts northward with time to ∼ 7.7 Ma at 20 km south of the MCT. While shortening rates slow during LHD motion from 35 mm yr−1 at ∼ 13.3 Ma to 18 mm yr−1 at ∼ 12 Ma to 16 mm yr−1 at ∼ 8.6 Ma, exhumation rates remain similar to those during RMT motion (∼ 4–9 mm yr−1) due to the large size (∼ 8 km) of the upper LH ramp.
Uplift over ramps that extend through the full 8 km of upper LH stratigraphy drives significant pulses of exhumation, notably during RMT motion, motion on the first upper LH fault, duplex formation and motion over the modern active ramp at ∼ 13 km north of the MCT (Fig. 6, Video S1). While the thermokinematic model results demonstrate that the modern active ramp is required to be co-located with the youngest cooling ages along the section (Figs. 4 and 5), the locations of the upper LH ramps (∼ 216 and ∼ 86 km north of the modern MCT) during RMT and LHD motion are less unique. The size of these ramps is constrained by the stratigraphic thickness of units comprising the ramp and the location constrained by the restored length of the upper LH units in the LH duplex in the geometry for Model C. It is the timing and magnitude of exhumation that is important for motion over upper LH ramps while the RMT and LHD are active, not the specific location of the ramp. However, the modern ramp location is unique and is required to be co-located with the youngest cooling ages along the section at ∼ 13 km north of the MCT.
While motion over the ∼ 8 km thick modern active ramp produces ∼ 10 km of exhumation and ∼ 150–200 °C of cooling (Figs. 6 and S6), this is still insufficient to expose rocks at the surface with a predicted MAr age younger than the age of RMT motion (Video S1). Thus, an additional mechanism is required to drive young (< 6 Ma) uplift and exhumation to replicate ∼ 6 Ma MAr ages above and to the north of the RMT duplex (Fig. 3). In Model A, 11 km of out-of-sequence displacement on faults deforming the LH duplex (∼ 15–33 km south of the MCT) has a significant effect on the predicted ZHe ages but does not produce young reset MAr ages (Fig. 4c); this provides the minimum amount of young slip required on a RMT fault. The 6 Ma MAr ages are reproduced with 12 km of out-of-sequence motion on a RMT fault at ∼ 20 km south of the MCT and 16 km on a RMT fault at ∼ 3 km south of the MCT between 6–3 Ma (Fig. 5f, Video S1). Motion on these faults cools rocks through the ∼ 350 °C MAr closure temperature (Figs. 6g and S6) and predicts a continuous swath of 5–6 Ma MAr ages from ∼ 20 km south to ∼ 10 km north of the MCT, where the measured data are located. This out-of-sequence motion is also reflected in the predicted detrital MAr distribution by a younging of the minimum age, near the middle-upper Siwalik contact (Fig. 7). Although not present in the youngest measured detrital peak ages, this age population may be reflected in the youngest measured ages (∼ 10 Ma) at 1.2 km depth (Fig. 7). Both the age (< 6 Ma) and location (∼ 3 km south of the MCT) of faulting is similar to that proposed by Braden et al. (2018) to account for 7 Ma U-Pb monazite and 6 Ma MAr ages, while the location and displacement magnitude is similar to that proposed for out-of-sequence motion on the faults adjacent to the MCT in central Nepal (e.g. Ghoshal et al., 2023; Wobus et al., 2006a). Out-of-sequence motion on the northern RMT faults in far western Nepal have a similar timing to that in the Simikot section but a lower magnitude of displacement, only influencing the ZHe and AFT ages in the RMT and MCT hanging walls (Braza et al., 2023).
Although there has been continuous exhumation of the high Himalaya in western Nepal since 7–8 Ma (e.g. Harvey and Burbank, 2024), Model C demonstrates this is partitioned into fast rates during periods of out-of-sequence faulting and growth of the LH duplex that alternate with periods of slower, passive exhumation in the absence of active fault-driven uplift (Fig. 9). While exhumation rates may exceed 9 mm yr−1, these fast rates are only sustained for very short ∼ 0.4–2 Myr time windows. Averaging the fast and slow rates over the past ∼ 8 Ma supports long-term rates ∼ 3 mm yr−1, similar to a proposed ∼ 2 mm yr−1 exhumation rate derived from inverting measured AHe, ZHe, and MAr cooling ages in the high Himalayas (∼ 5–10 km north of MCT, Figs. 5 and 9) (Harvey and Burbank, 2024). Exhumation rates determined from detrital MAr age lag times in the Siwalik unit and a 1D thermal model supports ∼ 9 km of erosion since ∼ 16 Ma and rates of 2.6 mm yr−1 until 10 Ma (Szulc et al., 2006), also similar to the long-term average rate in Model C.
While exhumation rates are most strongly related to the size of the active ramp driving uplift rather than shortening rates, a marked change in shortening rate such as from fast rates of shortening (45–48 mm yr−1) during RMT motion from 18.1–13.6 Ma to slower shortening rates (15–18 mm yr−1) from 12.6–0.6 Ma requires a change in how India-Asia convergence is partitioned along faults and throughout the Himalayan-Tibet orogen (e.g., Murphy et al., 2014; Taylor et al., 2003; Yuan et al., 2013). In Model C, early fast rates that accommodate almost all of India-Asia convergence may be the result of hot (> 375 °C) and thus weak, low angle and high displacement faults (Braza et al., 2023). A marked slow-down in shortening velocity occurs at ∼ 13 Ma, very similar to the best-fit model for the Api section in far western Nepal (∼ 100 km to the west) which slows from ∼ 25–40 to ∼ 10–15 mm yr−1 at ∼ 12 Ma (Braza et al., 2023). The slowing of shortening to the west (Braza et al., 2023) was attributed to a combination of slowing convergence rates between India and Asia (Molnar and Stock, 2009) and a partitioning of convergence between the Himalayan faults and with faults to the north in Tibet or possibly the Western Nepal Fault System (e.g., Murphy et al., 2014; Silver et al., 2015; Sundell et al., 2013; Yuan et al., 2013).
Ramps control the location and magnitude of vertical uplift in compressional orogens and result in regions of high erosion, steep slopes, and landslides. To the first order, they segment the décollement and thus may directly impact earthquake nucleation and propagation. Proposed décollement geometries are used to assess both seismic rupture extent and seismic risks. Consequently, the proposed location of ramps should be supported by all available data. The thermokinematic model results for Models A–C provide insight into the location and size of MHT ramps and the kinematic sequence of faulting that are essential for reproducing the cooling ages, basin accumulation data, surface geology, topography and locations of elevated ksn values in western Nepal. The modern active décollement ramp must be placed north of the ∼ 5–10 Ma AFT and AHe ages measured in the Dadeldhura klippe and LH duplex, and co-align with the youngest AHe, AFT, and ZHe ages at ∼ 13 km north of the MCT. The revised geometry of Model C places an ∼ 8 km thick ramp at this location and reproduces ∼ 91 % of the measured thermochronometric and basin data. It utilizes an LH duplex geometry where an upper LH thrust sheet extends from the MBT zone to the upper LH units in the footwall of the RMT duplex, forming the duplex roof. This geometry facilitates the early, ∼ 14 Ma cooling of the leading edge of this structure. Movement of the LH duplex over the modern active ramp, ∼ 2 km out-of-sequence motion in the RMT duplex, and ∼ 4 km of displacement beneath the Dadeldhura klippe over the last 0.6 Ma reproduces the pattern of cooling ages and topography.
Previously published data used in this study may be found in Braden et al. (2020), DeCelles et al. (2020), Gautam and Fujiwara (2000), Harvey and Burbank (2024), McCallister et al. (2014), Mercier (2014), Sakai et al. (2013), Szulc et al. (2006), Sherpa et al. (2023), Soucy La Roche et al. (2016, 2018), and van der Beek et al. (2016). The new ZHe and AFT data presented in this manuscript may be found in the PANGAEA archives (Felden et al., 2023): https://doi.org/10.1594/PANGAEA.992676 (Braza et al., 2026a), https://doi.org/10.1594/PANGAEA.992630 (Braza et al., 2026b). The modified version of Pecube used is available from Ehlers (2023).
The supplement related to this article is available online at https://doi.org/10.5194/se-17-1011-2026-supplement.
M. Braza: Conceptualization, Formal analysis, Investigation, Validation, Visualization, Writing – original draft, Writing – review and editing; N. McQuarrie: Conceptualization, Formal analysis, Funding acquisition, Investigation, Methodology, Project administration, Resources, Supervision, Validation, Writing – original draft, Writing – review and editing; C. Battistella: Formal analysis, Investigation; D. Robinson: Conceptualization, Funding acquisition, Investigation, Supervision, Writing – review and editing.
The contact author has declared that none of the authors has any competing interests.
Publisher's note: Copernicus Publications remains neutral with regard to jurisdictional claims made in the text, published maps, institutional affiliations, or any other geographical representation in this paper. The authors bear the ultimate responsibility for providing appropriate place names. Views expressed in the text are those of the authors and do not necessarily reflect the views of the publisher.
This work was supported in part by the University of Pittsburgh Center for Research Computing and Data, RRID:SCR_022735, through the resources provided. Specifically, this work used the H2P cluster, supported by NSF award number OAC-2117681. We acknowledge Petex for support and use of the program Move. Todd Ehlers and Willi Kappler (University of Tübingen) are thanked for support conducting early modelling simulations and providing the modified version of Pecube-D and Cascade. Suryodoy Ghoshal and Spencer Patrick are thanked for assistance with geologic mapping and sample collection.
This research has been supported by the National Science Foundation, Directorate for Geosciences (grant nos. EAR-1524277 and EAR-1524320).
This paper was edited by Christoph von Hagke and reviewed by Rasmus Thiede and one anonymous referee.
Ader, T., Avouac, J.-P., Liu-Zeng, J., Lyon-Caen, H., Bollinger, L., Galetzka, J., Genrich, J., Thomas, M., Chanard, K., Sapkota, S. N., Rajaure, S., Shrestha, P., Ding, L., and Flouzat, M.: Convergence rate across the Nepal Himalaya and interseismic coupling on the Main Himalayan Thrust: Implications for seismic hazard, J. Geophys. Res.-Sol. Ea., 117, 4403, https://doi.org/10.1029/2011JB009071, 2012.
Aikman, A. B., Harrison, T. M., and Lin, D.: Evidence for early (> 44 Ma) Himalayan crustal thickening, Tethyan Himalaya, southeastern Tibet, Earth Pl. Sc. Lett., 274, 14–23, https://doi.org/10.1016/j.epsl.2008.06.038, 2008.
Bernet, M. and Garver, J. I.: Fission-track analysis of detrital zircon, Rev. Mineral. Geochem., 58, 205–238, https://doi.org/10.2138/rmg.2005.58.8, 2005.
Braden, Z., Godin, L., Cottle, J., and Yakymchuk, C.: Renewed late Miocene (< 8 Ma) hinterland ductile thrusting, western Nepal Himalaya, Geology, 46, 503–506, https://doi.org/10.1130/G40097.1, 2018.
Braden, Z., Godin, L., Kellett, D. A., and Yakymchuk, C.: Spatio-temporal challenges in dating orogen-scale shear zones: The case of the Himalayan Main Central thrust, Tectonophysics, 774, 228246, https://doi.org/10.1016/J.TECTO.2019.228246, 2020.
Braun, J.: Pecube: A new finite-element code to solve the 3D heat transport equation including the effects of a time-varying, finite amplitude surface topography, Comput. Geosci., 29, 787–794, https://doi.org/10.1016/S0098-3004(03)00052-9, 2003.
Braun, J. and Sambridge, M.: Modelling landscape evolution on geological time scales: A new method based on irregular spatial discretization, Basin Res., 9, 27–52, https://doi.org/10.1046/j.1365-2117.1997.00030.x, 1997.
Braun, J., Zwartz, D., and Tomkin, J. H.: A new surface-processes model combining glacial and fluvial erosion, Ann. Glaciol., 28, 282–290, https://doi.org/10.3189/172756499781821797, 1999.
Braun, J., van der Beek, P., and Batt, G. E.: Quantitative thermochronology, Cambridge University Press, ISBN 9780521830577, 2006.
Braza, M. and McQuarrie, N.: Determining the tempo of exhumation in the eastern Himalaya: Part 1. Geometry, kinematics and predicted cooling ages, Basin Res., 34, 141–169, https://doi.org/10.1111/BRE.12615, 2022a.
Braza, M. and McQuarrie, N.: Determining the tempo of exhumation in the eastern Himalaya: Part 2. Integrating bedrock and detrital cooling ages through thermokinematic modelling, Basin Res., 34, 170–189, https://doi.org/10.1111/BRE.12614, 2022b.
Braza, M., McQuarrie, N., Robinson, D. M., and Webb, L. E.: Temperature, deformation, and mass transfer in a hot orogen: Insights from thermokinematic forward models for far western Nepal, Tectonics, 42, e2023TC007912, https://doi.org/10.1029/2023TC007912, 2023.
Braza, M., McQuarrie, N., Battistella, C., and Robinson, D. M.: Fission track ages from apatites collected in the western Nepal Himalaya, PANGAEA [data set], https://doi.org/10.1594/PANGAEA.992676, 2026a.
Braza, M., McQuarrie, N., Battistella, C., and Robinson, D. M.: ages from zircons collected in the western Nepal Himalaya, PANGAEA [data set], https://doi.org/10.1594/PANGAEA.992630, 2026b.
Cande, S. C. and Kent, D. V.: Revised calibration of the geomagnetic polarity timescale for the Late Cretaceous and Cenozoic, J. Geophys. Res.-Sol. Ea., 100, 6093–6095, https://doi.org/10.1029/94JB03098, 1995.
Corrie, S. L., Kohn, M. J., McQuarrie, N., and Long, S. P.: Flattening the Bhutan Himalaya, Earth Pl. Sc. Lett., 349–350, 67–74, https://doi.org/10.1016/j.epsl.2012.07.001, 2012.
Coutand, I., Whipp, D. M., Grujic, D., Bernet, M., Fellin, M. G., Bookhagen, B., Landry, K. R., Ghalley, S. K., and Duncan, C.: Geometry and kinematics of the Main Himalayan Thrust and Neogene crustal exhumation in the Bhutanese Himalaya derived from inversion of multithermochronologic data, J. Geophys. Res.-Sol. Ea., 119, 1446–1481, https://doi.org/10.1002/2013JB010891, 2014.
Dahlstrom, C. D. A.: Balanced cross sections, Can. J. Earth Sci., 6, 743–757, https://doi.org/10.1139/e69-069, 1969.
DeCelles, P. G. and Giles, K. A.: Foreland basin systems, Basin Res., 8, 105–123, https://doi.org/10.1046/j.1365-2117.1996.01491.x, 1996.
DeCelles, P. G., Kapp, P., Gehrels, G. E., and Ding, L.: Paleocene-Eocene foreland basin evolution in the Himalaya of southern Tibet and Nepal: Implications for the age of initial India-Asia collision, Tectonics, 33, 824–849, https://doi.org/10.1002/2014TC003522, 2014.
DeCelles, P. G., Carrapa, B., Ojha, T. P., Gehrels, G. E., and Collins, D.: Structural and Thermal Evolution of the Himalayan Thrust Belt in Midwestern Nepal, Geol. Soc. Am. Spec. Pap., 547, https://doi.org/10.1130/SPE547, 2020.
Dodson, M. H.: Closure temperature in cooling geochronological and petrological systems, Contrib. Mineral. Petrol., 40, 259–274, https://doi.org/10.1007/BF00373790, 1973.
Ehlers, T. A.: Pecube-D: Thermokinematic and Erosion Modeling Software for problems in Tectonics and Surface Processes (1.0 (stable)), Zenodo [code], https://doi.org/10.5281/zenodo.7785668, 2023.
Ehlers, T. A. and Farley, K. A.: Apatite thermochronometry: Methods and applications to problems in tectonic and surface processes, Earth Pl. Sc. Lett., 206, 1–14, https://doi.org/10.1016/S0012-821X(02)01069-5, 2003.
Ehlers, T. A., Chaudhri, T., Kumar, S., Fuller, C. W., Willett, S. D., Ketcham, R. A., Brandon, M. T., Belton, D. X., Kohn, B. P., Gleadow, A. J. W., Dunai, T. J., and Fu, F. Q.: Computational Tools for Low-Temperature Thermochronometer Interpretation, Rev. Mineral. Geochem., 58, 589–622, https://doi.org/10.2138/rmg.2005.58.22, 2005.
Eizenhöfer, P. R., McQuarrie, N., Shelef, E., and Ehlers, T. A.: Landscape Response to Lateral Advection in Convergent Orogens Over Geologic Time Scales, J. Geophys. Res.-Earth, 124, 2056–2078, https://doi.org/10.1029/2019JF005100, 2019.
Felden, J., Möller, L., Schindler, U., Huber, R., Schumacher, S., Koppe, R., Diepenbroek, M., Glöckner, FO.: PANGAEA – Data Publisher for Earth and Environmental Science, Sci. Data, 10, 347, https://doi.org/10.1038/s41597-023-02269-x, 2023.
Gansser, A.: Geology of the Himalayas, Wiley InterScience, ISBN 9780470290552, 1964.
Gautam, P. and Fujiwara, Y.: Magnetic polarity stratigraphy of Siwalik Group sediments of Karnali River section in western Nepal, Geophys. J. Int., 142, 812–824, https://doi.org/10.1046/j.1365-246x.2000.00185.x, 2000.
Ghoshal, S., McQuarrie, N., Robinson, D. M., Adhikari, D. P., Morgan, L. E., and Ehlers, T. A.: Constraining Central Himalayan (Nepal) Fault Geometry Through Integrated Thermochronology and Thermokinematic Modeling, Tectonics, 39, https://doi.org/10.1029/2020TC006399, 2020.
Ghoshal, S., McQuarrie, N., Huntington, K. W., Robinson, D. M., and Ehlers, T. A.: Testing erosional and kinematic drivers of exhumation in the central Himalaya, Earth Pl. Sc. Lett., 609, 118087, https://doi.org/10.1016/J.EPSL.2023.118087, 2023.
Hames, W. E. and Bowring, S. A.: An empirical evaluation of the argon diffusion geometry in muscovite, Earth Pl. Sc. Lett., 124, 161–169, https://doi.org/10.1016/0012-821X(94)00079-4, 1994.
Harvey, J. E. and Burbank, D. W.: Late Cenozoic Tectonic Evolution of the Western Nepal Himalaya: Insights from Low-Temperature Thermochronology, Lithosphere (Special 14), https://doi.org/10.2113/2023/lithosphere_2023_265, 2024.
Harvey, J. E., Burbank, D. W., and Bookhagen, B.: Along-strike changes in Himalayan thrust geometry: Topographic and tectonic discontinuities in western Nepal, Lithosphere, 7, 511–518, https://doi.org/10.1130/L444.1, 2015.
Hodges, K. V.: Thermochronology in orogenic systems, in: Treatise on Geochemistry, Second Edition, edited by: Holland, H. D. and Turekian, K. K., Elsevier, 281–308, https://doi.org/10.1016/B978-0-08-095975-7.00308-9, 2014.
Hoste-Colomer, R., Bollinger, L., Lyon-Caen, H., Adhikari, L. B., Baillard, C., Benoit, A., Bhattarai, M., Gupta, R. M., Jacques, E., Kandel, T., Koirala, B. P., Letort, J., Maharjan, K., Matrau, R., Pandey, R., and Timsina, C.: Lateral variations of the midcrustal seismicity in western Nepal: Seismotectonic implications, Earth Pl. Sc. Lett., 504, 115–125, https://doi.org/10.1016/J.EPSL.2018.09.041, 2018.
Huyghe, P., Galy, A., Mugnier, J.-L., and France-Lanord, C.: Propagation of the thrust system and erosion in the Lesser Himalaya: Geochemical and sedimentological evidence, Geology, 29, 1007–1010, https://doi.org/10.1130/0091-7613(2001)029<1007:POTTSA>2.0.CO;2, 2001.
Iaccarino, S., Montomoli, C., Carosi, R., Massonne, H. J., and Visonà, D.: Geology and tectono-metamorphic evolution of the Himalayan metamorphic core: insights from the Mugu Karnali transect, Western Nepal (Central Himalaya), J. Metamorph. Geol., 35, 301–325. https://doi.org/10.1111/JMG.12233, 2017.
Jouanne, F., Mugnier, J.-L., Gamond, J. F., Le Fort, P., Pandey, M. R., Bollinger, L., Flouzat, M., and Avouac, J.-P.: Current shortening across the Himalayas of Nepal, Geophys. J. Int., 157, 1–14, https://doi.org/10.1111/j.1365-246X.2004.02180.x, 2004.
Ketcham, R. A., Carter, A., Donelick, R. A., Barbarand, J., and Hurford, A. J.: Improved modeling of fission-track annealing in apatite, Am. Mineral., 92, 799–810, https://doi.org/10.2138/am.2007.2281, 2007.
Kirby, E. and Whipple, K. X.: Expression of active tectonics in erosional landscapes, J. Struct. Geol., 44, 54–75, https://doi.org/10.1016/J.JSG.2012.07.009, 2012.
Laporte, M., Bollinger, L., Lyon-Caen, H., Hoste-Colomer, R., Duverger, C., Letort, J., Riesner, M., Koirala, B. P., Bhattarai, M., Kandel, T., Timsina, C., and Adhikari, L. B.: Seismicity in far western Nepal reveals flats and ramps along the Main Himalayan Thrust, Geophys. J. Int., 226, 1747–1763, https://doi.org/10.1093/GJI/GGAB159, 2021.
Law, R. D., Stahr, D. W., Francsis, M. K., Ashley, K. T., Grasemann, B., and Ahmad, T.: Deformation temperatures and flow vorticities near the base of the Greater Himalayan Series, Sutlej Valley and Shimla Klippe, NW India, J. Struct. Geol., 54, 21–53, https://doi.org/10.1016/j.jsg.2013.05.009, 2013.
Lock, J. and Willett, S.: Low-temperature thermochronometric ages in fold-and-thrust belts, Tectonophysics, 456, 147–162, https://doi.org/10.1016/j.tecto.2008.03.007, 2008.
Long, S. P. and Kohn, M. J.: Distributed ductile thinning during thrust emplacement: A commonly overlooked exhumation mechanism, Geology, 48, 368–373, https://doi.org/10.1130/G47022.1, 2020.
Long, S. P., Gordon, S. M., Young, J. P., and Soignard, E.: Temperature and strain gradients through Lesser Himalayan rocks and across the Main Central thrust, south central Bhutan: Implications for transport-parallel stretching and inverted metamorphism, Tectonics, 35, 1863–1891, https://doi.org/10.1002/2016TC004242, 2016.
Malusà, M. G. and Fitzgerald, P. G.: The geologic interpretation of the detrital thermochronology record within a stratigraphic framework, with examples from the European Alps, Taiwan and the Himalayas, Earth Sci. Rev., 201, https://doi.org/10.1016/j.earscirev.2019.103074, 2020.
McCallister, A. T., Taylor, M. H., Murphy, M. A., Styron, R. H., and Stockli, D. F.: Thermochronologic constraints on the late Cenozoic exhumation history of the Gurla Mandhata metamorphic core complex, Southwestern Tibet, Tectonics, 33, 27–52, https://doi.org/10.1002/2013TC003302, 2014.
McQuarrie, N. and Ehlers, T. A.: Influence of thrust belt geometry and shortening rate on thermochronometer cooling ages: Insights from thermokinematic and erosion modeling of the Bhutan Himalaya, Tectonics, 34, 1055–1079, https://doi.org/10.1002/2014TC003783, 2015.
McQuarrie, N. and Ehlers, T. A.: Techniques for understanding fold-and-thrust belt kinematics and thermal evolution, in: Linkages and Feedbacks in Orogenic Systems: Geological Society of America Memoir 213, edited by: Law, R. D., Thigpen, J. R., Merschat, A. J., and Stowell, H. H., Geological Society of America, 1–30, https://doi.org/10.1130/2017.1213(02), 2017.
Mercier, J.: Structure and evolution of orogenic wedges: A multidisciplinary study on the Himalayan case, PhD, Université de Grenoble, https://theses.hal.science/tel-01548995v1 (last access: 17 March 2026), 2014.
Molnar, P., and Stock, J. M.: Slowing of India's convergence with Eurasia since 20 Ma and its implications for Tibetan mantle dynamics, Tectonics, 28, https://doi.org/10.1029/2008TC002271, 2009.
Montgomery, D. R. and Brandon, M. T.: Topographic controls on erosion rates in tectonically active mountain ranges, Earth Pl. Sc. Lett., 201, 481–489, https://doi.org/10.1016/S0012-821X(02)00725-2, 2002.
Montomoli, C., Iaccarino, S., Carosi, R., Langone, A., and Visonà, D.: Tectonometamorphic discontinuities within the Greater Himalayan Sequence in Western Nepal (Central Himalaya): Insights on the exhumation of crystalline rocks, Tectonophysics, 608, 1349–1370, https://doi.org/10.1016/j.tecto.2013.06.006, 2013.
Mugnier, J.-L., Leturmy, P., Mascle, G., Huyghe, P., Chalaron, E., Vidal, G., Husson, L., and Delcaillou, B.: The Siwaliks of western Nepal: I. Geometry and kinematics, J. Asian Earth Sci., 17, 629–642, https://doi.org/10.1016/S1367-9120(99)00038-3, 1999.
Murphy, M. A. and Yin, A.: Structural evolution and sequence of thrusting in the Tethyan fold-thrust belt and Indus-Yalu suture zone, southwest Tibet, Geol. Soc. Am. Bull., 115, 21–34, https://doi.org/10.1130/0016-7606(2003)115<0021:SEASOT>2.0.CO;2, 2003.
Murphy, M. A., Taylor, M. H., Gosse, J., Silver, C. R. P., Whipp, D. M., and Beaumont, C.: Limit of strain partitioning in the Himalaya marked by large earthquakes in western Nepal, Nat. Geosci., 7, 38–42, https://doi.org/10.1038/ngeo2017, 2014.
Naylor, M. and Sinclair, H. D.: Pro- vs. retro-foreland basins, Basin Res., 20, 285–303, https://doi.org/10.1111/j.1365-2117.2008.00366.x, 2008.
Olsen, J. E. S., McQuarrie, N., and Robinson, D. M.: Determining kinematic order and relative age of faulting via flexural-kinematic restoration: A case study in far western Nepal, Basin Res., 31, 1153–1177, https://doi.org/10.1111/bre.12362, 2019.
Quade, J., Roe, L., DeCelles, P. G., and Ojha, T. P.: The Late Neogene 87Sr/86Sr record of lowland Himalayan rivers, Science, 276, 1828–1831, https://doi.org/10.1126/SCIENCE.276.5320.1828, 1997.
Ratschbacher, L., Frisch, W., Liu, G., and Chen, C.: Distributed deformation in southern and western Tibet during and after the India-Asia collision, J. Geophys. Res., 99, 917–936, https://doi.org/10.1029/94jb00932, 1994.
Reiners, P. W. and Brandon, M. T.: Using thermochronology to understand orogenic erosion, Annu. Rev. Earth Pl. Sc., 34, 419–466, https://doi.org/10.1146/annurev.earth.34.031405.125202, 2006.
Reiners, P. W., Spell, T. L., Nicolescu, S., and Zanetti, K. A.: Zircon thermochronometry: He diffusion and comparisons with dating, Geochim. Cosmochim. Ac., 68, 1857–1887, https://doi.org/10.1016/j.gca.2003.10.021, 2004.
Robert, X., van der Beek, P., Braun, J., Perry, C., and Mugnier, J. L.: Control of detachment geometry on lateral variations in exhumation rates in the Himalaya: Insights from low-temperature thermochronology and numerical modeling, J. Geophys. Res.-Sol. Ea., 116, 5202, https://doi.org/10.1029/2010JB007893, 2011.
Robinson, D. M.: Forward modeling the kinematic sequence of the central Himalayan thrust belt, western Nepal, Geosphere, 4, 785–801, https://doi.org/10.1130/GES00163.1, 2008.
Robinson, D. M, DeCelles, P. G., Patchett, P. J., and Garzione, C. N.: The kinematic evolution of the Nepalese Himalaya interpreted from Nd isotopes, Earth Pl. Sc. Lett., 192, 507–521, https://doi.org/10.1016/S0012-821X(01)00451-4, 2001.
Robinson, D. M., DeCelles, P. G., and Copeland, P.: Tectonic evolution of the Himalayan thrust belt in western Nepal: Implications for channel flow models, Geol. Soc. Am. Bull., 118, 865–885, https://doi.org/10.1130/B25911.1, 2006.
Sakai, H., Iwano, H., Danhara, T., Hirata, T., and Takigami, Y.: Emplacement of hot Lesser Himalayan nappes from 15 to 10 Ma in the Jumla-Surkhet region, western Nepal, and their thermal imprint on the underlying early Miocene fluvial Dumri Formation, Isl. Arc, 22, 361–381, https://doi.org/10.1111/iar.12030, 2013.
Schwanghart, W. and Scherler, D.: Short Communication: TopoToolbox 2 – MATLAB-based software for topographic analysis and modeling in Earth surface sciences, Earth Surf. Dynam., 2, 1–7, https://doi.org/10.5194/esurf-2-1-2014, 2014.
Sherpa, T. Z. L, DeCelles, P. G., Carrapa, B., Schoenbohm, L. M., and Wolpert, J.: Bhumichula plateau: A remnant high-elevation low-relief surface in the Himalayan thrust belt of western Nepal, Geol. Soc. Am. Bull., 135, 2121–2140, https://doi.org/10.1130/B36481.1, 2023.
Sigdel, A. and Sakai, T.: Sedimentary facies analysis of the fluvial systems in the Siwalik Group, Karnali River section, Nepal Himalaya, and their significance for understanding the paleoclimate and Himalayan tectonics, J. Nepal Geol. Soc., 51, 11–26, https://doi.org/10.3126/jngs.v51i0.24084, 2016.
Silver, C. R. P., Murphy, M. A., Taylor, M. H., Gosse, J., and Baltz, T.: Neotectonics of the Western Nepal Fault System: Implications for Himalayan strain partitioning, Tectonics, 34, 2494–2513, https://doi.org/10.1002/2014TC003730, 2015.
Soucy La Roche, R., Godin, L., Cottle, J. M., and Kellett, D. A.: Direct shear fabric dating constrains early Oligocene onset of the South Tibetan detachment in the western Nepal Himalaya, Geology, 44, 403–406, https://doi.org/10.1130/G37754.1, 2016.
Soucy La Roche, R., Godin, L., Cottle, J. M., and Kellett, D. A.: Preservation of the Early Evolution of the Himalayan Middle Crust in Foreland Klippen: Insights from the Karnali Klippe, West Nepal, Tectonics, 37, 1161–1193. https://doi.org/10.1002/2017TC004847, 2018.
Subedi, S., Hetényi, G., Vergne, J., Bollinger, L., Lyon-Caen, H., Farra, V., Adhikari, L. B., and Gupta, R. M.: Imaging the Moho and the Main Himalayan Thrust in Western Nepal With Receiver Functions, Geophys. Res. Lett., 45, 13222–13230, https://doi.org/10.1029/2018GL080911, 2018.
Sundell, K. E., Taylor, M. H., Styron, R. H., Stockli, D. F., Kapp, P., Hager, C., Liu, D., and Ding, L.: Evidence for constriction and Pliocene acceleration of east-west extension in the North Lunggar rift region of west central Tibet, Tectonics, 32, 1454–1479, https://doi.org/10.1002/TECT.20086, 2013.
Szulc, A. G., Najman, Y., Sinclair, H. D., Pringle, M., Bickle, M., Chapman, H., Garzanti, E., Andò, S., Huyghe, P., Mugnier, J.-L., Ojha, T., and DeCelles, P.: Tectonic evolution of the Himalaya constrained by detrital 40Ar-39Ar, Sm-Nd and petrographic data from the Siwalik foreland basin succession, SW Nepal, Basin Res., 18, 375–391, https://doi.org/10.1111/j.1365-2117.2006.00307.x, 2006.
Taylor, M., Yin, A., Ryerson, F. J., Kapp, P., and Ding, L.: Conjugate strike-slip faulting along the Bangong-Nujiang suture zone accommodates coeval east-west extension and north-south shortening in the interior of the Tibetan Plateau, Tectonics, 22, https://doi.org/10.1029/2002TC001361, 2003.
Thiede, R., Robert, X., Stübner, K., Dey, S., and Faruhn, J.: Sustained out-of-sequence shortening along a tectonically active segment of the Main Boundary thrust: The Dhauladhar Range in the northwestern Himalaya, Lithosphere, 9, 715–725, https://doi.org/10.1130/L630.1, 2017.
US/Japan ASTER Science Team: ASTER Global Digital Elevation Model V003, NASA EOSDIS Land Processes Distributed Active Archive Center [data set], https://doi.org/10.5067/ASTER/ASTGTM.003, 2019.
van der Beek, P., Litty, C., Baudin, M., Mercier, J., Robert, X., and Hardwick, E.: Contrasting tectonically driven exhumation and incision patterns, western versus central Nepal Himalaya, Geology, 44, 327–330, https://doi.org/10.1130/G37579.1, 2016.
Whipp, D. M., Ehlers, T. A., Braun, J., and Spath, C. D.: Effects of exhumation kinematics and topographic evolution on detrital thermochronometer data, J. Geophys. Res., 114, F04021, https://doi.org/10.1029/2008JF001195, 2009.
Whipple, K. X. and Tucker, G. E.: Dynamics of the stream-power river incision model: Implications for height limits of mountain ranges, landscape response timescales, and research needs, J. Geophys. Res.-Sol. Ea., 104, 17661–17674, https://doi.org/10.1029/1999jb900120, 1999.
Willett, S. D.: Orogeny and orography: The effects of erosion on the structure of mountain belts, J. Geophys. Res.-Sol. Ea., 104, 28957–28981, https://doi.org/10.1029/1999JB900248, 1999.
Wobus, C. W., Whipple, K. X., and Hodges, K. V.: Neotectonics of the central Nepalese Himalaya: Constraints from geomorphology, detrital thermochronology, and thermal modeling, Tectonics, 25, TC4011, https://doi.org/10.1029/2005TC001935, 2006a.
Wobus, C. W., Whipple, K. X., Kirby, E., Snyder, N., Johnson, J., Spyropolou, K., Crosby, B., and Sheehan, D.: Tectonics from topography: Procedures, promise, and pitfalls, in: Tectonics, Climate, and Landscape Evolution: Geological Society of America Special Paper 398, edited by: Willett, S. D., Hovius, N., Brandon, M. T., and Fisher, D. M., Geological Society of America, 55–74, https://doi.org/10.1130/2006.2398(04), 2006b.
Yakymchuk, C. and Godin, L.: Coupled role of deformation and metamorphism in the construction of inverted metamorphic sequences: An example from far-northwest Nepal, J. Metamorph. Geol., 30, 513–535, https://doi.org/10.1111/j.1525-1314.2012.00979.x, 2012.
Yanites, B. J. and Ehlers, T. A.: Intermittent glacial sliding velocities explain variations in long- timescale denudation, SW British Columbia, Earth Pl. Sc. Lett., 450, 52–61, https://doi.org/10.1016/j.epsl.2016.06.022, 2016.
Yuan, D. Y., Ge, W. P., Chen, Z. W., Li, C. Y., Wang, Z. C., Zhang, H. P., Zhang, P.-Z., Zheng, D.-W., Zheng, W.-J., Craddock, W. H., Dayem, K. E., Duvall, A. R., Hough, B. G., Lease, R. O., Champagnac, J.-D., Burbank, D. W., Clark, M. K., Farley, K. A., Garzione, C. N., Kirby, E., Molnar, P., and Roe, G. H.: The growth of northeastern Tibet and its relevance to large-scale continental geodynamics: A review of recent studies, Tectonics, 32, 1358–1370, https://doi.org/10.1002/TECT.20081, 2013.