
the Creative Commons Attribution 4.0 License.
the Creative Commons Attribution 4.0 License.
 | 20 Oct 2026
Improved recovery of sub-ice shelf bathymetry from gravity data using an isostatic correction: a case study from the Dotson and Crosson ice shelves, West Antarctica

Karen J. Heywood
Anna Wåhlin
Rob A. Hall
Atsuhiro Muto
Pierre Dutrieux
Kelly Hogan
James Girton
Karen E. Alley
Erin Pettit
Bathymetry (ocean-bottom topography) beneath ice shelves is challenging to observe yet is vitally important for modelling how ice sheets will evolve into the future. An alternative to direct observation of bathymetry is to invert airborne gravity data for the bathymetric signal. Appropriate gravity data can be collected via remote sensing above the ice shelf and be used to provide an initial estimate of sub-ice shelf bathymetry, typically at wavelengths of ∼5 km and above. However, lateral variations in density associated with the underlying geology can distort the gravity field biassing the results. We show that techniques which tie inversion results to known bathymetry and topography, although solving some of these issues, may be insufficient in the case of large and deep basins lacking centrally located tie points. Using new direct bathymetry observations of the Dotson and Crosson ice shelves as a case study, we show that gravity inversion for bathymetry can be improved by considering and removing a model of the gravity field due to crustal isostatic compensation prior to inversion. We finally present our updated and improved bathymetric model for the Dotson-Crosson and Thwaites Glacier Ice Shelf system and discuss where our method can be best applied in future.
- Article
(11077 KB) - Full-text XML
-
Supplement
(1021 KB) - BibTeX
- EndNote


Bathymetry beneath ice shelves around Antarctica is one of the most important boundary conditions for models of these systems. It provides a first-order control on where and how, relatively warm and salty ocean water can access and melt the grounded ice sheet, through bathymetric steering of ocean currents and through provision of deep troughs through which the dense warm water can penetrate. The bathymetric roughness also determines the turbulence in the water influencing heat transfer within the cavity (Richter et al., 2025). However, due to the challenges of accessing the ice shelf cavities, direct observations of bathymetry are rare. Inversion of gravity data measured from aircraft flying above the ice shelf has therefore become an important tool for interpreting sub iceshelf bathymetry away from the sparse direct observational data points (Millan et al., 2017; Cochran et al., 2014; Muto et al., 2016; An et al., 2019; Tankersley et al., 2025; Charrassin et al., 2025).
Inverting bathymetry from gravity data works since variations in the free-air gravity anomaly are typically dominated by the signal of local bathymetric variations, reflecting the large density contrast between water and underlying rock. Geological features including lateral gradients in crustal thickness and the presence of rocks with different densities at shallower crustal levels can confound such inversions. The impact of such geological features can be minimised by tying the output of the gravity inversion to known observations of the bedrock elevation (Jordan et al., 2020; An et al., 2019; Tankersley et al., 2025; Charrassin et al., 2025; Cochran et al., 2014).
When working to recover bathymetry along individual 2D profiles gravity models are constructed explicitly constraining the topography/bathymetry where it is known (Cochran et al., 2014). Long wavelength differences between observed and calculated gravity anomalies along the profile can be removed either by assuming a linear trend, and/or adjusting rock density, to fit the anomalies at the points where elevation is known. The residual anomalies are then modelled by adjusting the bathymetry away from direct constraints. When working in 3D, removing regional geological trends becomes more complex, but can also be addressed using control points in one of two ways: By adjusting the observed gravity field so it matches the gravity field generated by a model including the known topography/bathymetry prior to inversion (An et al., 2019). The gravity correction field implicitly accounts for un-modelled geological factors. The residual gravity anomalies are then minimised by adjusting bathymetry away from the known control data. Alternatively, the free-air gravity anomaly can be inverted for a topographic/bathymetric interface with no a-priori consideration of known values, with the recovered topographic/bathymetric surface subsequently adjusted based on the interpolated difference between the elevation of the recovered surface and the elevation at known control points (Jordan et al., 2020). In this case the interpolated elevation adjustment surface accounts for the unknown geological factors. The gravity adjustment method has been applied more often, as it allows relatively simple inclusion of lateral density variations, but it relies on a realistic initial topographic/bathymetric model. The topography adjustment method makes no assumptions about the elevation of the topographic/bathymetric surface away from the observed tie points, relying solely on observed gravity data. Both methods are effectively equivalent as unknown geological factors are accounted for by a spatially varying correction field.
Previous gravity inversion and new observations in the Dotson/Crosson region
The topographic adjustment method was previously applied to the Thwaites and Dotson/Crosson ice shelves in the Amundsen Sea Embayment (Jordan et al., 2020). New bathymetric data collected in the Dotson/Crosson ice shelf area by autonomous underwater vehicles, oceanographic profiling floats which were released to drift beneath the ice shelf, and seismic observations from the ice shelf surface, allow for re-evaluation of the original gravity-derived bathymetric data product. Here we consider the likely causes of errors revealed in the previous gravity-derived bathymetry, and create a new bathymetric model for the Thwaites, Dotson and Crosson region using an extension of the original topography adjustment method (Jordan et al., 2020).
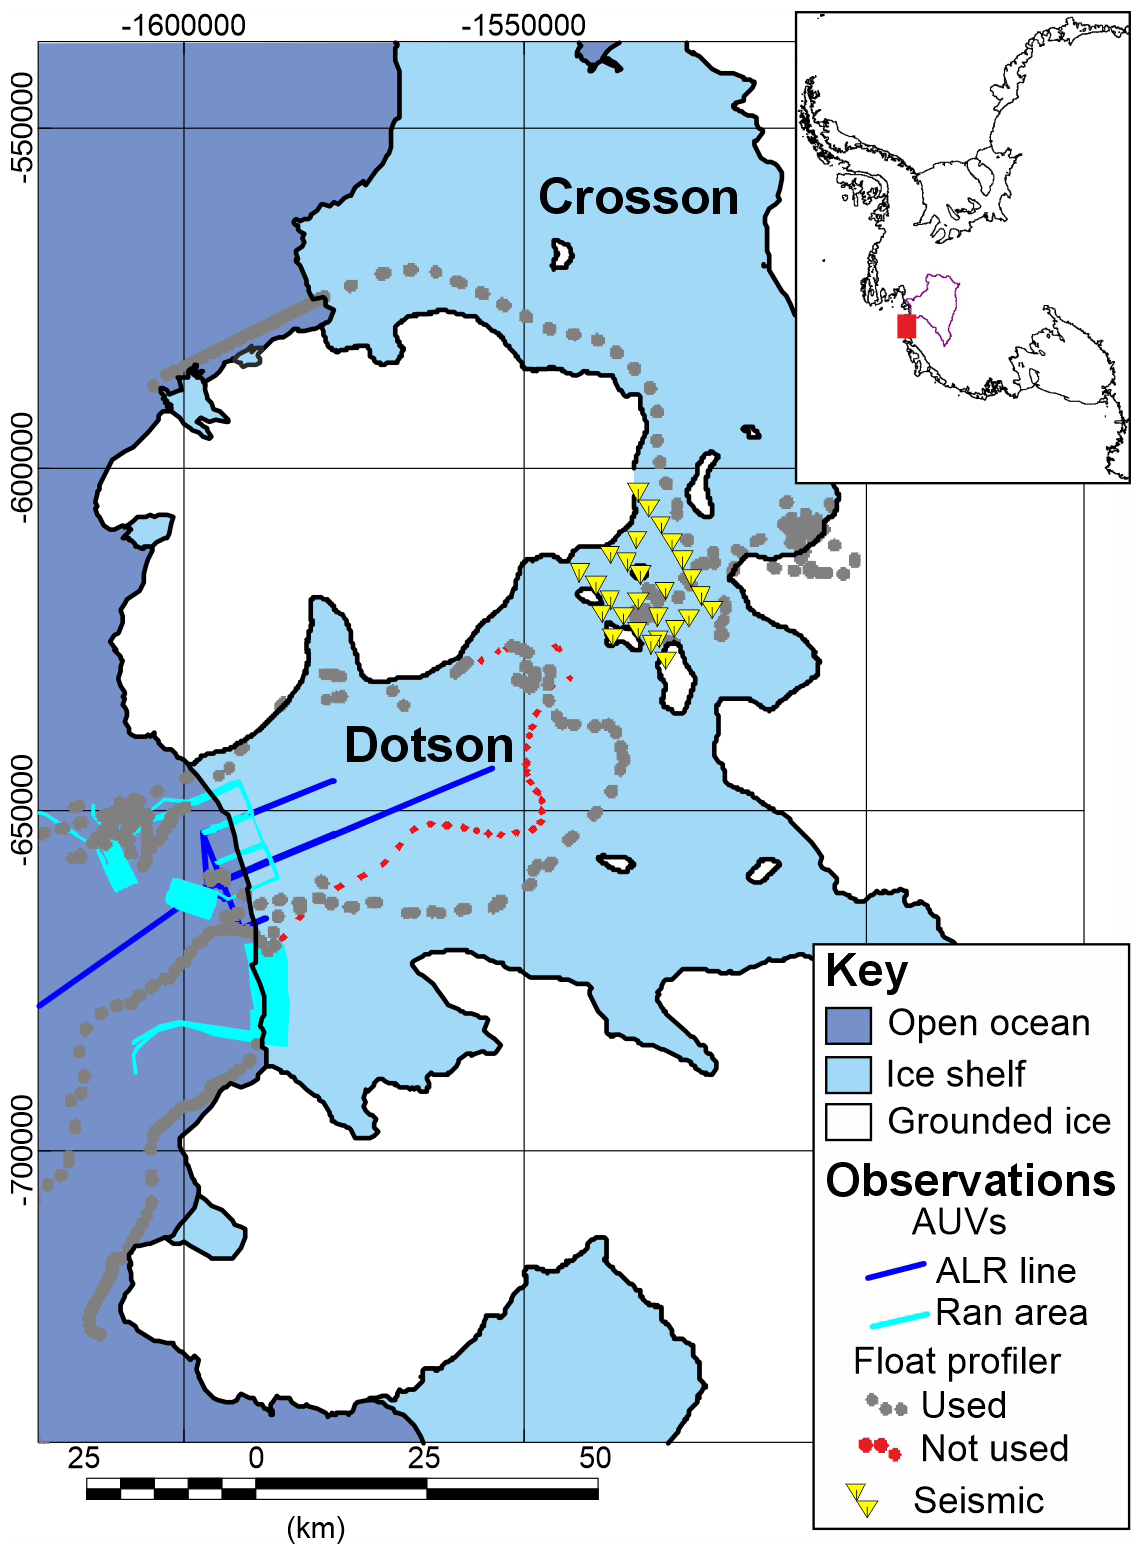
Figure 1Location of new bathymetric data beneath the Dotson and Cosson ice shelves. Coloured lines denote data from Autonomous Underwater Vehicles (AUVs) Ran (Wåhlin et al., 2024) and Autosub Long Range (ALR) (Richter et al., 2025). Profiling float (Girton et al., 2019) and seismic data (Muto et al., 2024) are shown as points. Note profiling floats in areas of grounded ice reflect areas of known ice shelf grounding line retreat (Rignot et al., 2014). Inset show's location (red box) relative to wider Thwaites Glacier region (purple) in Antarctica. Projected map coordinates Polar Stereographic (m), true scale 71° S.
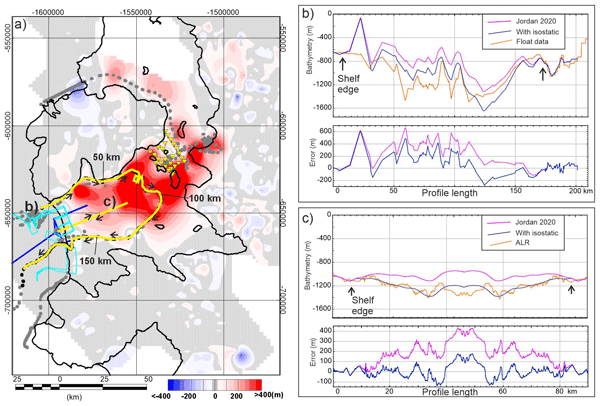
Comparing the previous gravity-derived estimate of bathymetry (Jordan et al., 2020) with the new observational data shows that the bathymetry beneath the Dotson Ice shelf was underestimated in places by at least 400 m (Fig. 2a). Although the observational data are subject to uncertainties associated with navigation and processing assumptions discussed below (Sect. 2.1), there are clear long wavelength (>30 km) differences between the observed bathymetry and the previous gravity-derived estimates which consistently underestimate the depth. Despite the long wavelength differences, the pattern of bathymetric variation indicated by the previous gravity inversion at intermediate wavelengths (10–30 km) is confirmed along individual profiles (Fig. 2b). At the shortest wavelengths (<10 km), differences are present and expected as such features are below the resolution of the existing airborne gravity data, which are filtered at 5 km wavelength and collected with a line spacing of 7.5 to 10 km.
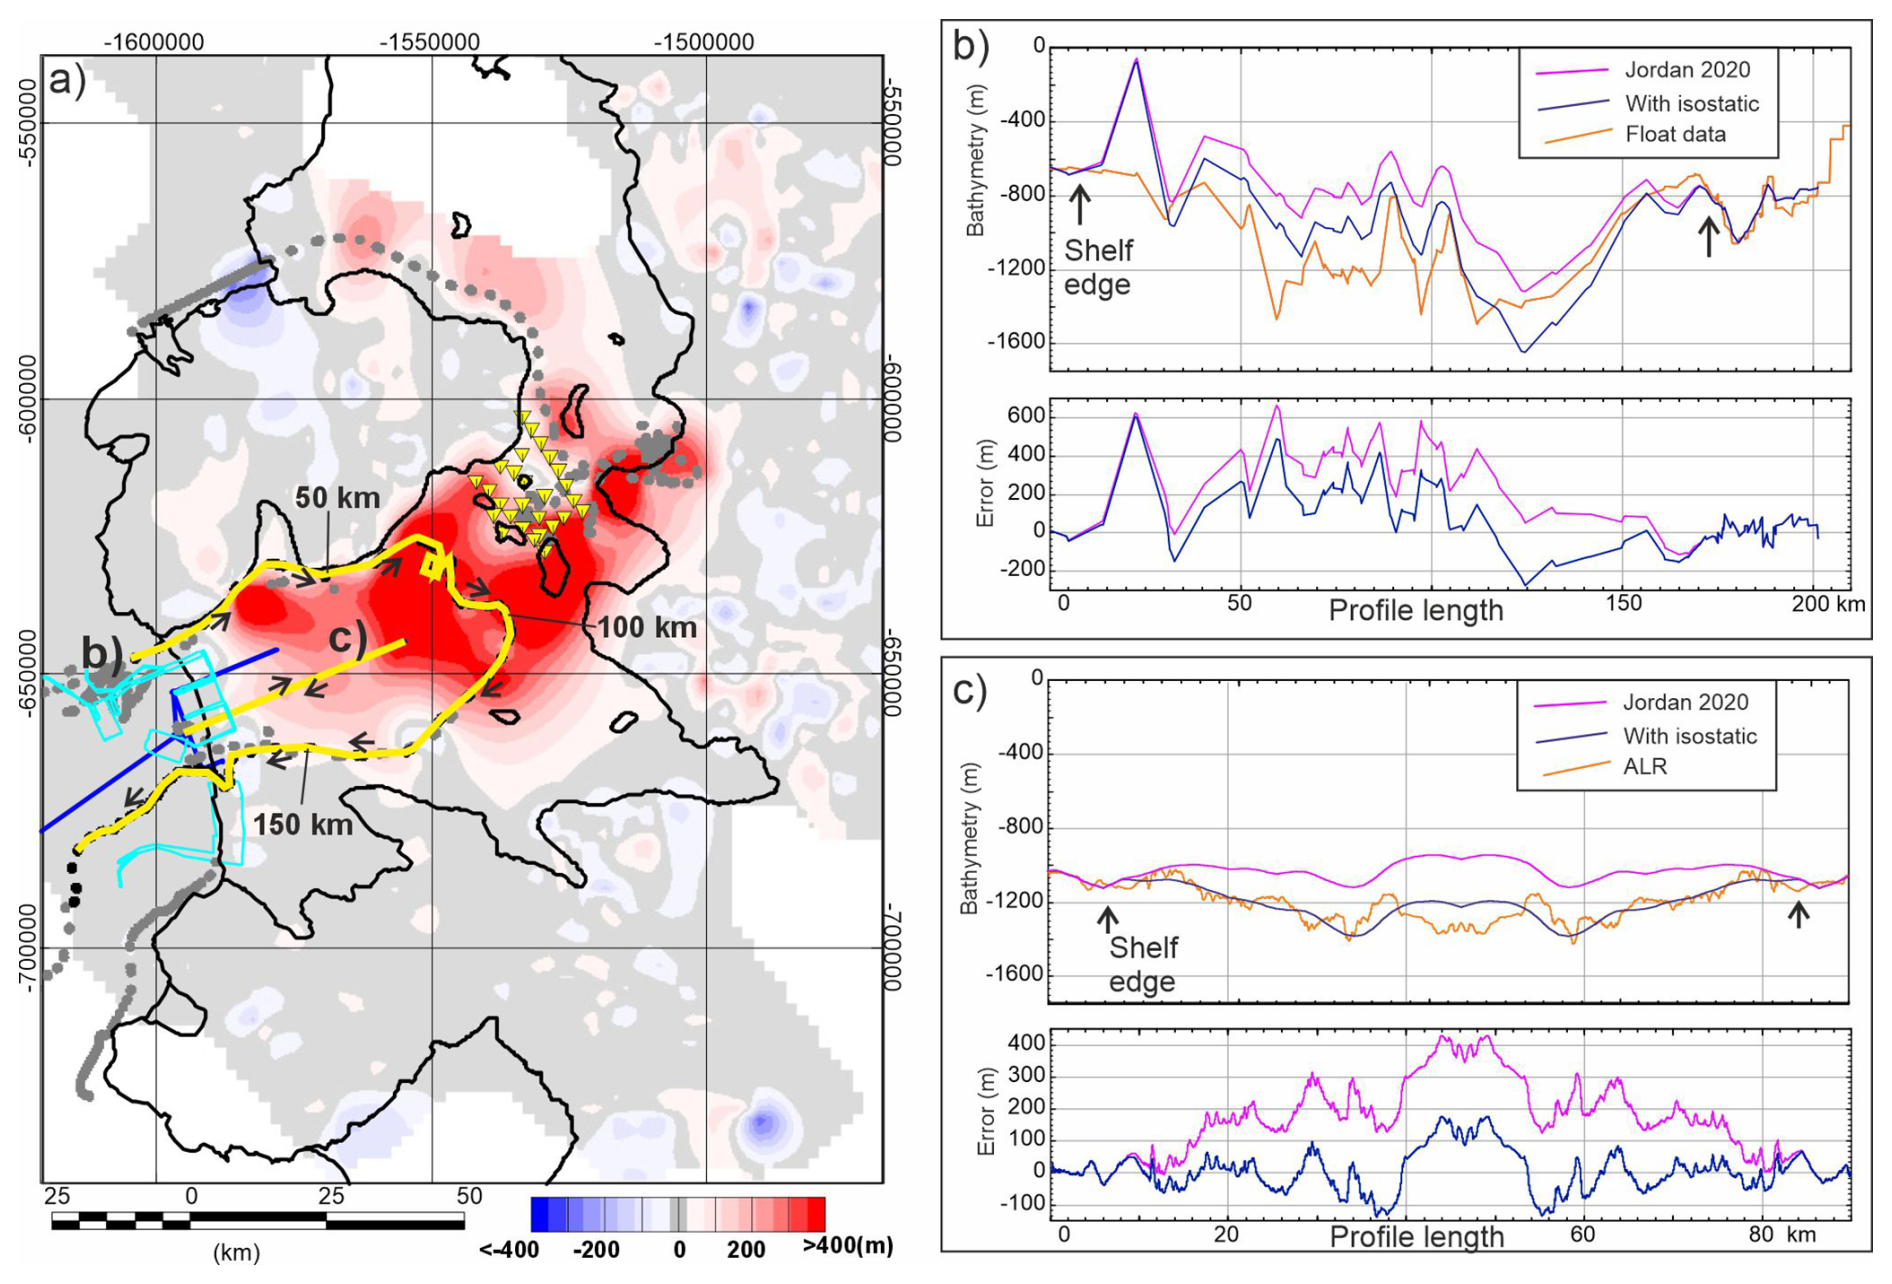
Figure 2Comparison of new sub ice shelf observations and gravity-derived bathymetry. (a) Map of the error between previous gravity-derived bathymetry (Jordan et al., 2020) and new interpolation of all direct elevation observations (gravity derived topography/bathymetry minus interpolated direct observations). Positive values show where gravity-derived model is too shallow. Yellow lines locate profiles in (b) and (c). Arrows show direction along cross section profile, other features as in Fig. 1. (b) Profile comparing float observations, gravity derived bathymetry from Jordan et al. (2020) and a new gravity inversion incorporating isostatic correction. Note in both inversions no sub ice shelf data were used to constrain the results. (c) Same as (b) but comparing Autosub Long Range (ALR) data with results of gravity inversions. Note symmetry of topography along in-bound and out-bound leg reflecting consistent and relatively high-quality ALR navigation.
The presence of long wavelength differences between the previous estimate from gravity data and new direct bathymetric observations suggests that there is a systematic bias in the gravity method as originally applied (Jordan et al., 2020). Such a bias is likely due to an unconsidered geological/tectonic feature beneath the ice shelf, which is providing a component of the observed gravity signal, which is not corrected for or constrained by the topographic and bathymetric observations in the adjacent regions. The underestimate of the bathymetry suggests that the expected negative free-air gravity anomaly associated with deep bathymetry is being offset by something causing a positive gravity anomaly. This can be explained by a broad excess of dense material beneath the ice shelf region, which would generate a relative positive anomaly, masking the amplitude of the negative bathymetric gravity anomaly. Alternatively, if rocks surrounding the ice shelf region had a significantly lower density of ∼2.20 g cm−3, typically expected for unconsolidated sediments, the same reduction in amplitude of the observed anomaly would be seen. Such a major discrepancy in the density of the rocks surrounding the cavity is unlikely given that the main outcropping rock types include granodiorite and gneiss metamorphic basement (Cox et al., 2023), both consistent with typical crustal rock densities of ∼2.67 g cm−3.
One mechanism by which additional dense material can be present directly beneath a deep and relatively large basin is isostatic compensation of the topography. This process is akin to that where a floating iceberg has a keel proportional to its height, but in this case the low-density continental crust is floating on the denser underlying mantle. As the basin was formed, most likely by glacial erosion, the reduction in mass would have led to an upwarp of the Moho, the boundary separating the dense mantle and less dense crust, isostatically compensating (balancing) the mass removed at the surface. This up-warping of the Moho brings dense material towards the surface directly beneath the deepest part of the basin, cancelling out part of the negative gravity anomaly due to the lower density water replacing rock within the eroded basin.
In this study we present a revised bathymetric model for the Dotson/Crosson ice shelf area and show that use of an isostatic assumption improves the recovery of bathymetry in regions where there are fewer constraining data. We first describe the existing and newly available observational datasets. Subsequently we describe our new method and test it against the new sub-ice shelf data, before finally presenting a new bathymetric model including all observational constraints and the updated gravity inversion.
2.1 Input data
Free-air gravity anomalies used to constrain the sub-ice shelf bathymetry come from Operation Ice Bridge and a dedicated aerogeophysical survey conducted as part of the International Thwaites Glacier Collaboration (ITGC), together with marine gravity data from cruise NBP19-02. As airborne data was the dominant survey type, anomalies (strictly disturbances) are referenced to the ellipsoid. Line spacing of the surveys was between 10 and 7.5 km over the ice shelves, but does not follow a well-defined mesh pattern (Fig. 3a). Flight altitudes over the ice shelves were between 350 and 500 m. Line data from these surveys was integrated into a single database, statistically levelled and gridded as reported for the previous assessment of sub iceshelf bathymetry in this region (Fig. 3a) (Jordan et al., 2020). We assign a conservative error of 1.67 mGal to this combined dataset, based on the reported errors in the included Operation Ice Bridge data (Tinto et al., 2010, updated 2019). Regional sub-ice sheet topography from airborne radar data as well as offshore bathymetry data used in the previous study provided the initial constraint on topographic/bathymetric elevation. Additional new data on the water depth beneath the Dotson and Crosson ice shelves comes from autonomous underwater vehicles Autosub Long Range (ALR) (Richter et al., 2025) and Ran (Wåhlin et al., 2024), as well as sub-ice shelf profiling oceanographic floats (Girton et al., 2019) and seismic observations from the ice shelf surface (Muto et al., 2024) (Fig. 1).
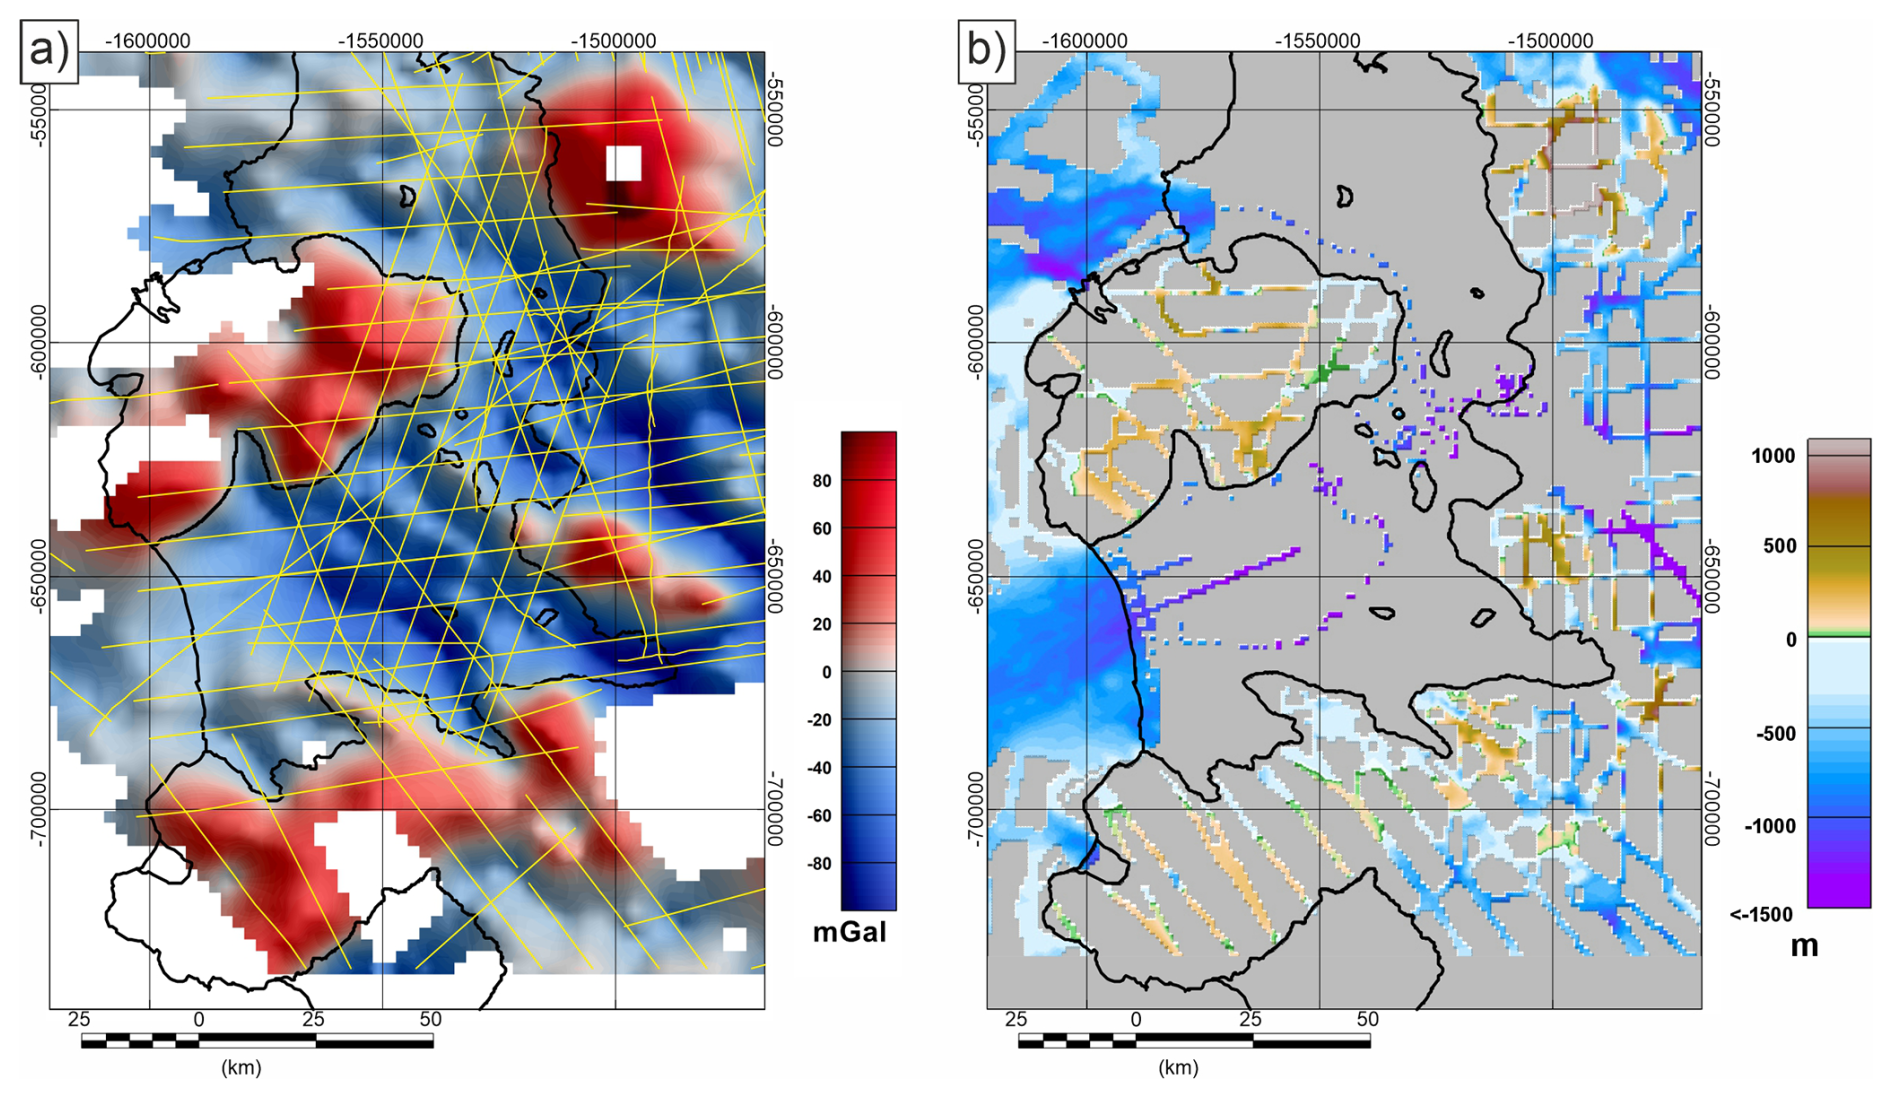
Figure 3Input data local to the Dotson/Crosson Ice shelves. (a) Free-air gravity compilation. Yellow lines show airborne gravity flight lines. (b) Topographic/bathymetric compilation including new sub ice shelf information.
The autonomous underwater vehicles ALR and Ran collected numerous bathymetric profiles from the ocean-facing front of the Dotson Ice shelf during the ITGC field campaign on the RV Nathaniel B. Palmer in January–March 2022 (NBP22-02). The Ran system targeted the ice shelf marginal zone with detailed survey grids extending 3 to 4 km beneath the ice shelf margin (Wåhlin et al., 2024). Ran measured bathymetry using a Kongsberg EM2040 multibeam system, and sub ice shelf positioning was based on a Doppler velocity log (DVL) aided inertial navigation system. Analysis of the resulting swath data indicates that horizontal positional accuracy of this system is high (<40 m absolute error from comparison with ship-borne swath data, and relative error <10 m from comparison between Ran swaths). The ALR platform collected data along three sub ice shelf profiles, extending 2, 16, and 39 km inboard from the ice shelf margin (Richter et al., 2025). Sub ice shelf bathymetry was measured using a single beam depth sounder giving a local profile of depth accurate to <1 m. The horizontal sub ice shelf location of the ALR was calculated using acoustic 300 kHz Doppler current profiler (ADCP) aided dead-reckoning, coupled with tracking the seabed. The accuracy of the reported horizontal position is not well defined; however, the close agreement between the observed bathymetry along the inbound and outbound sub ice shelf profiles suggests the horizontal navigational accuracy is relatively high (<1 km) compared with the spatial resolution of the gravity data (>5 km).
Assessment of bathymetry beneath more remote parts of the Dotson-Crosson cavity were made using three EM-APEX profiling floats (Girton et al., 2019). This type of buoyancy-driven float moves up and down within the water column, carried laterally by the prevailing currents. The float turned from descending to ascending, and from ascending to descending through contact with the seafloor and the overlying ice shelf, with internal state changes and piston movements triggered by a lack of change in pressure measurements. These inflection points in the depth profiles were taken as a measurement of sea floor and base ice shelf depth. The primary method of locating the floats beneath the cavity was based on an acoustic navigation array deployed at the ice shelf margin, with an estimated horizontal accuracy of ∼1 km. Where contact with the navigational array was lost, dead-reckoning and comparison between ice shelf draft measured by the floats and calculated from surface elevation was used to estimate the float position. In this latter case there is significantly less confidence in the true location of any bathymetric observation. We therefore cross-checked the float bathymetry against the original gravity derived model and observational data from ALR. Where the broad pattern of variation was generally consistent, as in Fig. 2b, we considered the float data as valid. Where the float observations showed discrepancies in depth of hundreds of meters and no consistency in pattern compared to the gravity model, or ALR data, we suggest that the float dead-reckoning navigation algorithm had most likely gotten lost and therefore exclude these data from further calculation (Fig. 1).
Data from an array of 27 active seismic shot points (Muto et al., 2024) provided the final new constraint for the revised estimate of sub ice shelf bathymetry. These data provided information close to the critical boundary between the Dotson and Crosson sectors of the ice shelf where numerous pinning points may be helping to stabilise the ice shelf. An explosive seismic source was used, and data recorded on a 24-channel geophone array extending 480 m from the shot point. Depth of the sub ice shelf cavity was determined from the inversion of the recorded two-way travel time of the seismic waves, with correction for compressional-wave velocity changes in the ice shelf based on a seismic refraction survey conducted during the same season. The compressional-wave velocity of the seawater was assumed to be the same as the average value under nearby Thwaites Eastern Ice Shelf that was determined from temperature, pressure and conductivity measurements of a CTD cast through a borehole (Wild et al., 2025), then converted to the compressional-wave velocity. The uncertainty in the depth estimate is assessed to be 37.2 m, based on comparison with direct measurements of sea floor depth made through boreholes during CTD casts. Horizontal position was precisely determined using differentially corrected GNSS data.
A new reference elevation model was created by combining the 1 km resolution raster of radar- and swath-derived elevation data used in the previous study (Jordan et al., 2020) with the new sub ice shelf point data described above. This was done by converting the original reference model raster into an array of points with a value at the centre of each valid grid point and adding the new point observations. A new reference elevation raster defining onshore sub ice topography and offshore bathymetry was created from the point dataset where the elevation was the weighted mean of all points within the area of each 1 km grid cell calculated using the GMT function blockmean (Wessel et al., 2013). The existing 1 km spaced array of data points derived from swath and airborne radar were given a weight of 0.9, while new sub ice shelf data were given a weight of 0.1, to minimise the impact of potentially less accurate data from sub ice shelf floats on the better constrained results outside the ice shelf. Where no data were available within a 1 km cell, the reference elevation raster was filled with dummy values (Fig. 3b).
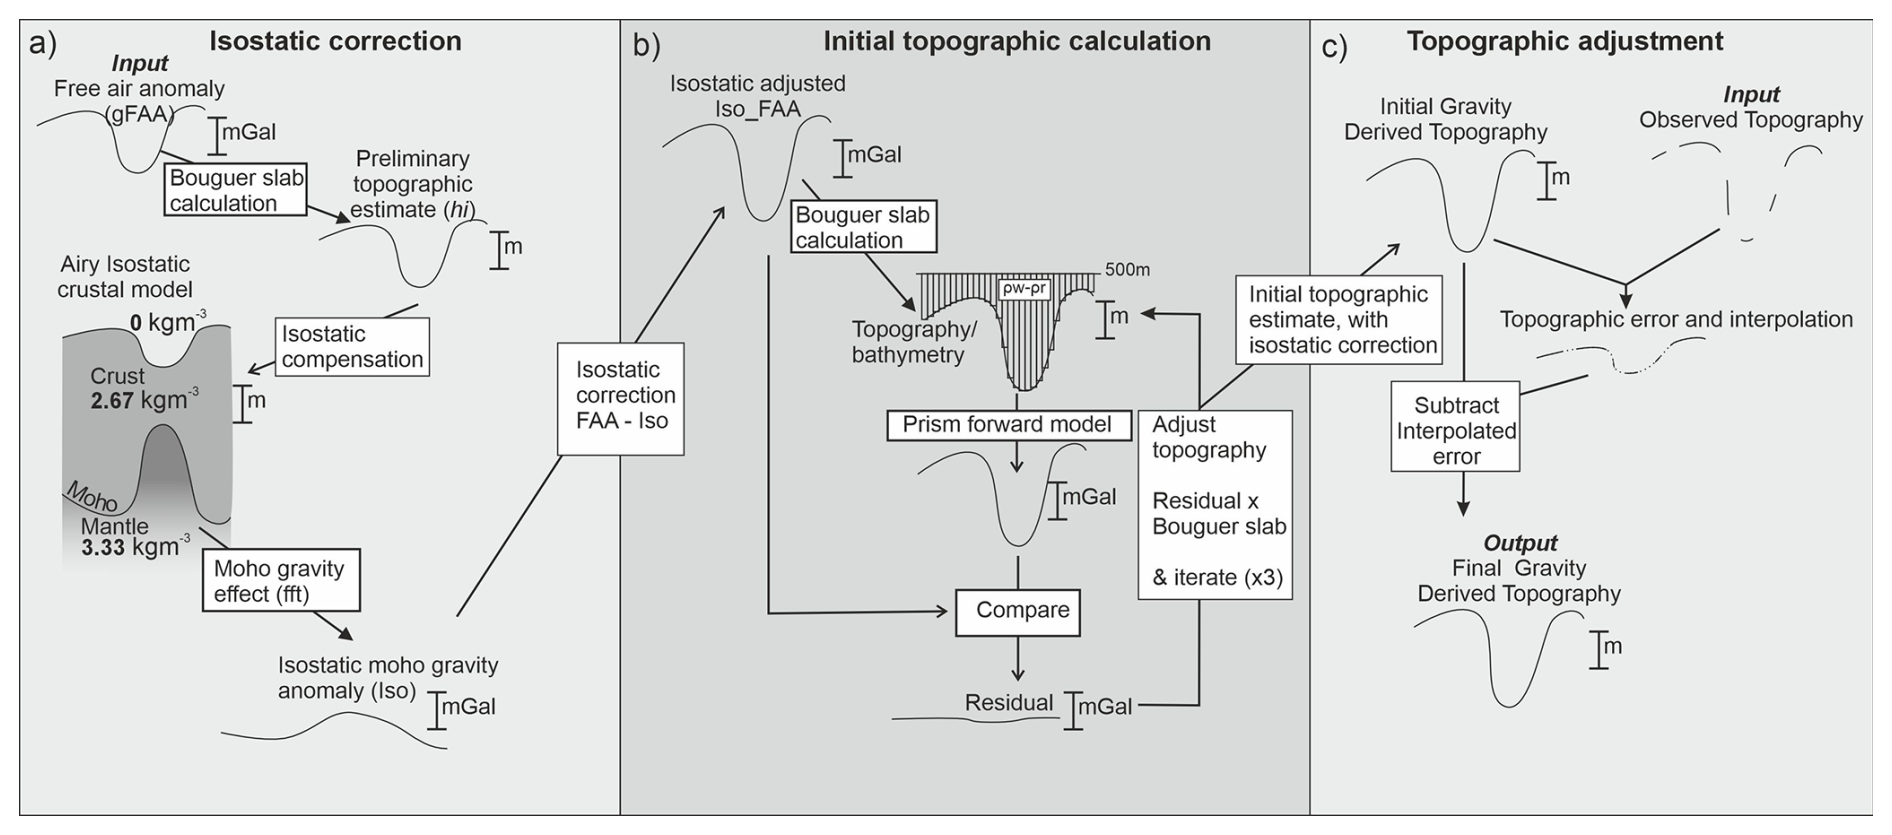
Figure 4Flow diagram showing revised method for recovering topography from gravity data. (a) Isostatic correction based on preliminary topographic estimate. (b) Gravity anomaly after removal of isostatic gravity effect inverted for effective topography. (c) Topography adjusted to match observational constraints.
2.2 Recovery of a new bathymetry including isostatic considerations
The new method for recovering bathymetry from gravity data constrained by sparse observations is laid out in Fig. 4. As noted previously, the inversion without subglacial constraint (Jordan et al., 2020) showed systematic errors (Fig. 2), which we attribute to the Moho gravity effect of isostatic compensation of the eroded sub-ice shelf cavity. The gravity effect of isostatic compensation of any hidden basin must therefore be removed from the free-air anomaly prior to inversion for the final bathymetry (Figs. 4a, S1 in the Supplement).
The impact of isostatic compensation on the gravity field is a function of the strength of the crust, the size of the eroded topographic depression, the density of the crust and mantle, and the depth of the Moho. We assumed that the crust had no lateral strength (Airy isostatic assumption), which is likely valid in this region as it lies on a rifted margin, in the region of the Marie Byrd Land hotspot, both factors which reduce the rigidity of the crust and underlying mantle. Previous studies have also suggested low crustal rigidity in this region (Jordan et al., 2010). Use of an Airy isostatic model does not imply that we believe that it is a robust model for the Moho in this region, rather we think it is a reasonable model of the gravity effect generated by all forces acting to isostatically compensate the surface topography. An Airy isostatic model, relative to a model with significant crustal rigidity, generates the maximum local deflection of the Moho, and hence the largest correction to the free air anomaly. Assuming a more rigid crust would decrease the amplitude of the modelled Moho deflection and hence the isostatic correction, leading to recovery of a shallower basin from the gravity data.
A Moho depth of 30 km for reference crust with topography at sea level, and crustal and mantle densities of 2670 and 3330 kg m−3 respectively, were assumed. This Moho depth is deeper than generally estimated from local seismic models (O' Donnell et al., 2019), but is a reasonable global average which may be more appropriate given the uncertainty in the crust and upper mantle density structure in this region. The crustal density was also used for the rock density in all subsequent gravity calculations. This density for the upper crustal rocks is reasonable as the rocks exposed adjacent to the Dotson/Crosson area are dominated by granodiorite and gneiss metamorphic basement (Cox et al., 2023). Both these rock types are consistent with typical crustal rock densities of ∼2670 kg m−3.
The initial estimate of topography (hi) input into the isostatic calculation (Fig. S1b) was derived from the free-air gravity anomaly (gFAA). We use the free air anomaly as the starting point for our isostatic calculation because it contains the signature of the hidden bathymetry, hence the pattern of the recovered isostatic correction will reflect the pattern of the real bathymetry. Our correction should be considered a pseudo-isostatic correction, as it relies on gravity data as the primary input, rather than observed topography as used in a true isostatic correction. To convert the free air anomaly to an initial estimate of topography we used a simple re-arrangement of the Bouguer slab formula:
Assuming that the underlying rocks have a density of 2670 kg m−3 (ρr) and are displacing water with a density of 1028 kg m−3 (ρw). This simplifying assumption ignores the fact that where ice is grounded the density contrast should be that of rock against ice, and there will be an anomaly associated with the contrast between rock and air. However, the focus of our study is on the sub-ice shelf basin where the simplifying assumption will be correct. This simple approximation gives an initial bathymetric estimate similar to the previous bathymetry calculated by Jordan et al. (2020). However, we know that this is an underestimate of the true amplitude of the bathymetry (Fig. 2). The resulting isostatic compensation and associated gravity anomaly (Fig. S1c and d) were therefore calculated assuming that the topography was displacing air rather than water. This change in the assumed displaced material from water to air amplifies the calculated Moho topography by 1.6 times, increasing the amplitude of the isostatic correction and compensating for the initial underestimate of the bathymetry. This amplification was chosen as it resulted in a good fit between the modelled and observed bathymetry beneath the ice shelf. The gravity anomaly associated with the compensating Moho surface, i.e. the isostatic Moho gravity effect (gmoho), was calculated using a fast Fourier transform method (Parker, 1973) implemented in the open-source software package GMT with the gravfft command (Wessel et al., 2013). The isostatically adjusted gravity anomaly (gadjust) (Fig. S1e) was then calculated as:
This corrected gravity value (gadjust) was then used as an input, in place of the free-air anomaly, for recovery of the bathymetry following the topographic adjustment method used previously (Jordan et al., 2020) (Fig. 4b and c). This method initially converts the gravity field (Fig. S1e) into a topographic surface using the re-arranged Bouguer slab formula above (Eq. 1). The gravity field associated with the calculated surface is then modelled using a prism based method (von Frese et al., 1981). The top surface of the prism layer was fixed at +500 m, with topography above truncated, while the lower bound of the prisms followed the recovered surface. The density of each prism was fixed as the contrast between rock and water (−1.642 g cm−3), as this is the assumed dominant density contrast in our study area. The topography was subsequently updated based on the amplitude of the residual between the prism model output and gadjust. The prism based forward model and update of the topographic surface was iterated two further times until the residual between gadjust and the calculated anomaly was less than ±1 mGal across most of the survey area (Fig. 4b).
The output initial topographic estimate with isostatic correction (Fig. S1f) was compared to the observed topography/bathymetry dataset (Figs. 4c, S1g). The calculated difference was interpolated to create a correction field (Fig. S1h). This correction field was subtracted from the initial topographic estimate with isostatic correction (Fig. S1f) to give the final gravity derived topography (Fig. S1i). This topography matches direct observations where present and follows the shape of the gravity inversion away from these points. This final topography is masked in regions with no gravity data constraint.
To test if including isostatic compensation in the inversion improved the recovered bathymetry, we first exclude the new constraining sub ice shelf data from our inversion and use it as a reference dataset. The bathymetric model including isostatic compensation, but excluding sub ice shelf control points, predicts the basin beneath the Dotson Ice Shelf to be ∼300 m deeper than the previous gravity derived model (Jordan et al., 2020) (Fig. 5a and b). Comparison with the float data (Fig. 2b) shows a reduction in the mean error beneath the shelf from 313 to 135 m, although the standard deviation of the error remains 187 m in both cases. Comparison with the longest Autosub section (Fig. 2c) shows a reduction in the mean sub ice shelf error from 195 to 3.2 m, and a reduction in the standard deviation from 105 to 70 m. The smaller reduction in the mean error and consistently high standard deviation when compared with the float data may be due to two complicating factors. First the floats appear to have followed the coast of Bear Island which has elevated onshore coastal topography (∼300 m), while the depths recorded by the floats immediately adjacent are m. Such a significant topographic step of ∼1 km is not recoverable using gravity data, which is limited to >5 km wavelength due to processing. Secondly the navigation of the floats has relatively large horizontal uncertainty (estimated to be 1 km or more) so the depth measured by the floats may be somewhat mislocated, adding apparent noise to the calculated error. In contrast the ALR profile lies close to the centre of the basin, likely away from steep fjord walls, and the consistency of the topography on the in-bound and out-bound leg points to higher navigational accuracy. The error against the ALR profile therefore provides a better estimate of the quality of the method under ideal conditions.
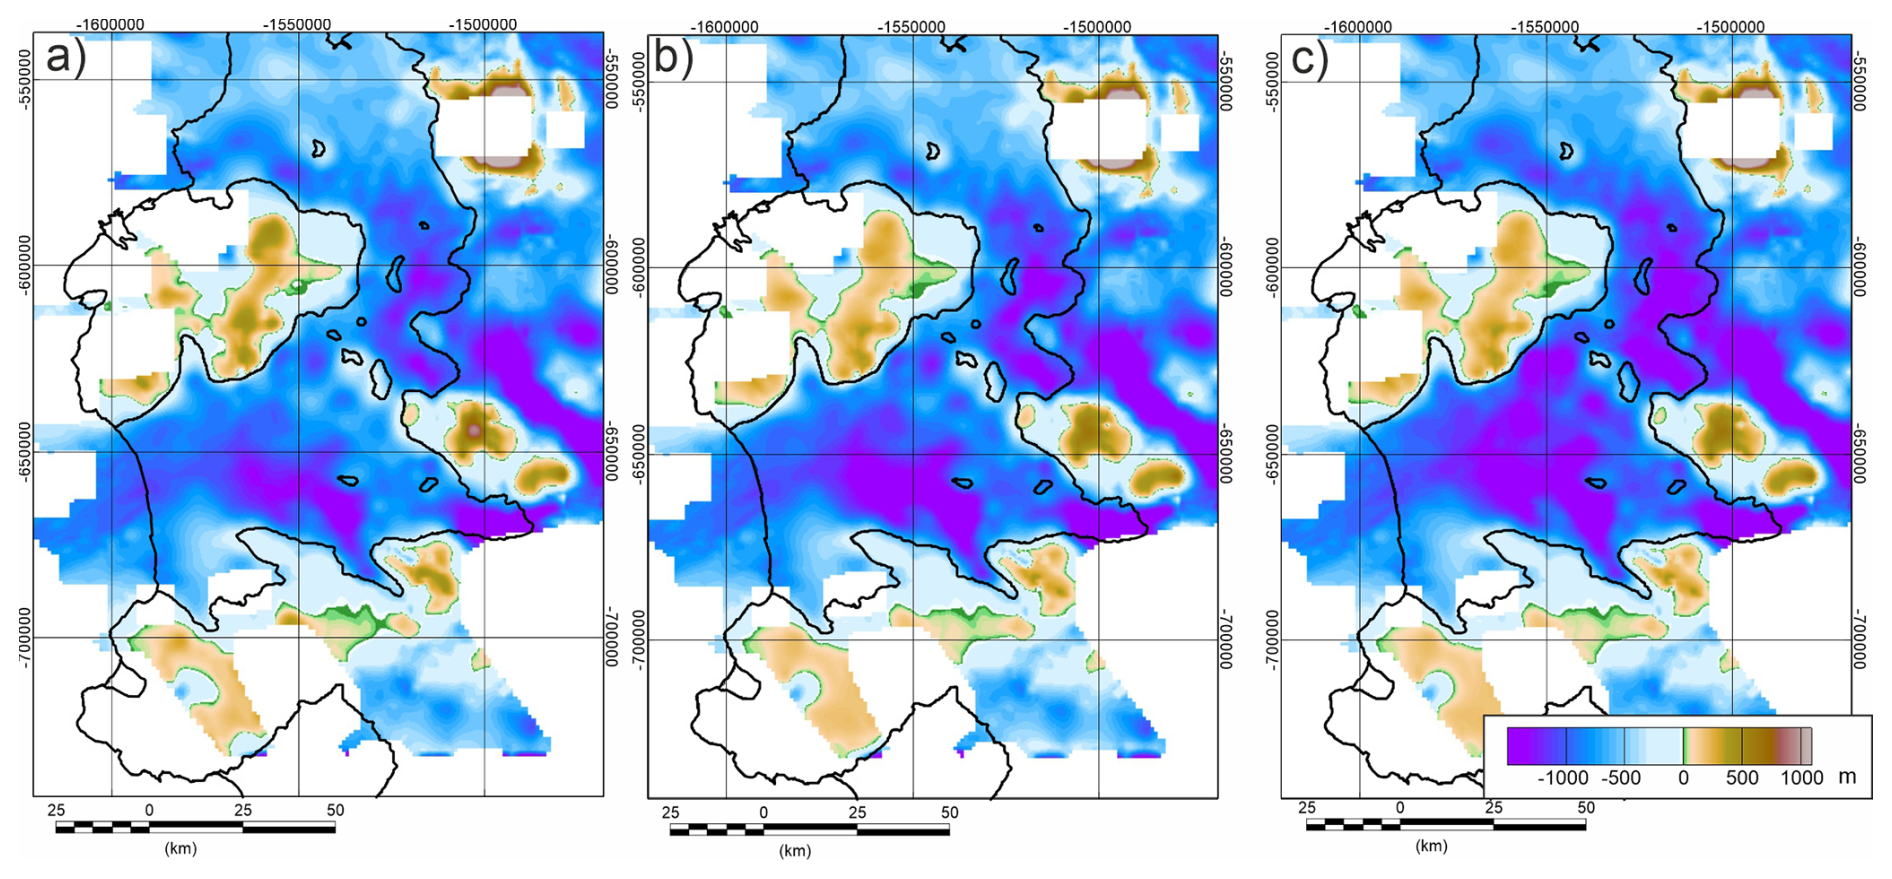
Figure 5Gravity-derived models of sub ice shelf bathymetry, with radar and swath derived elevations in surrounding regions. Note results only shown where gravity data is present. (a) Model from Jordan et al. (2020). (b) Revised model incorporating isostatic correction. (c) Final bathymetric model incorporating isostatic correction and new sub-ice shelf observational tie points.
A grid of the errors between the gravity-derived topography with an isostatic correction and observational points shows a reduction in error across all regions (Fig. 6a), compared with the errors associated with the model without isostatic compensation (Fig. 2a). We attribute these residual errors to a combination of unmodelled geological factors, short wavelength topography which could not be resolved from the gravity dataset, and navigational errors in the observational dataset. The reduction in errors and the improved visual fit to the new bathymetric data profiles (Fig. 2b and c), indicates that inclusion of the isostatic correction improves the recovery of bathymetry from gravity data. This is likely to be especially relevant where broad (10s of km) topographic lows are present, as such regions will likely be isostatically compensated at the Moho leading to an underestimate of the bathymetry without isostatic correction, or use of intermediate tie points.
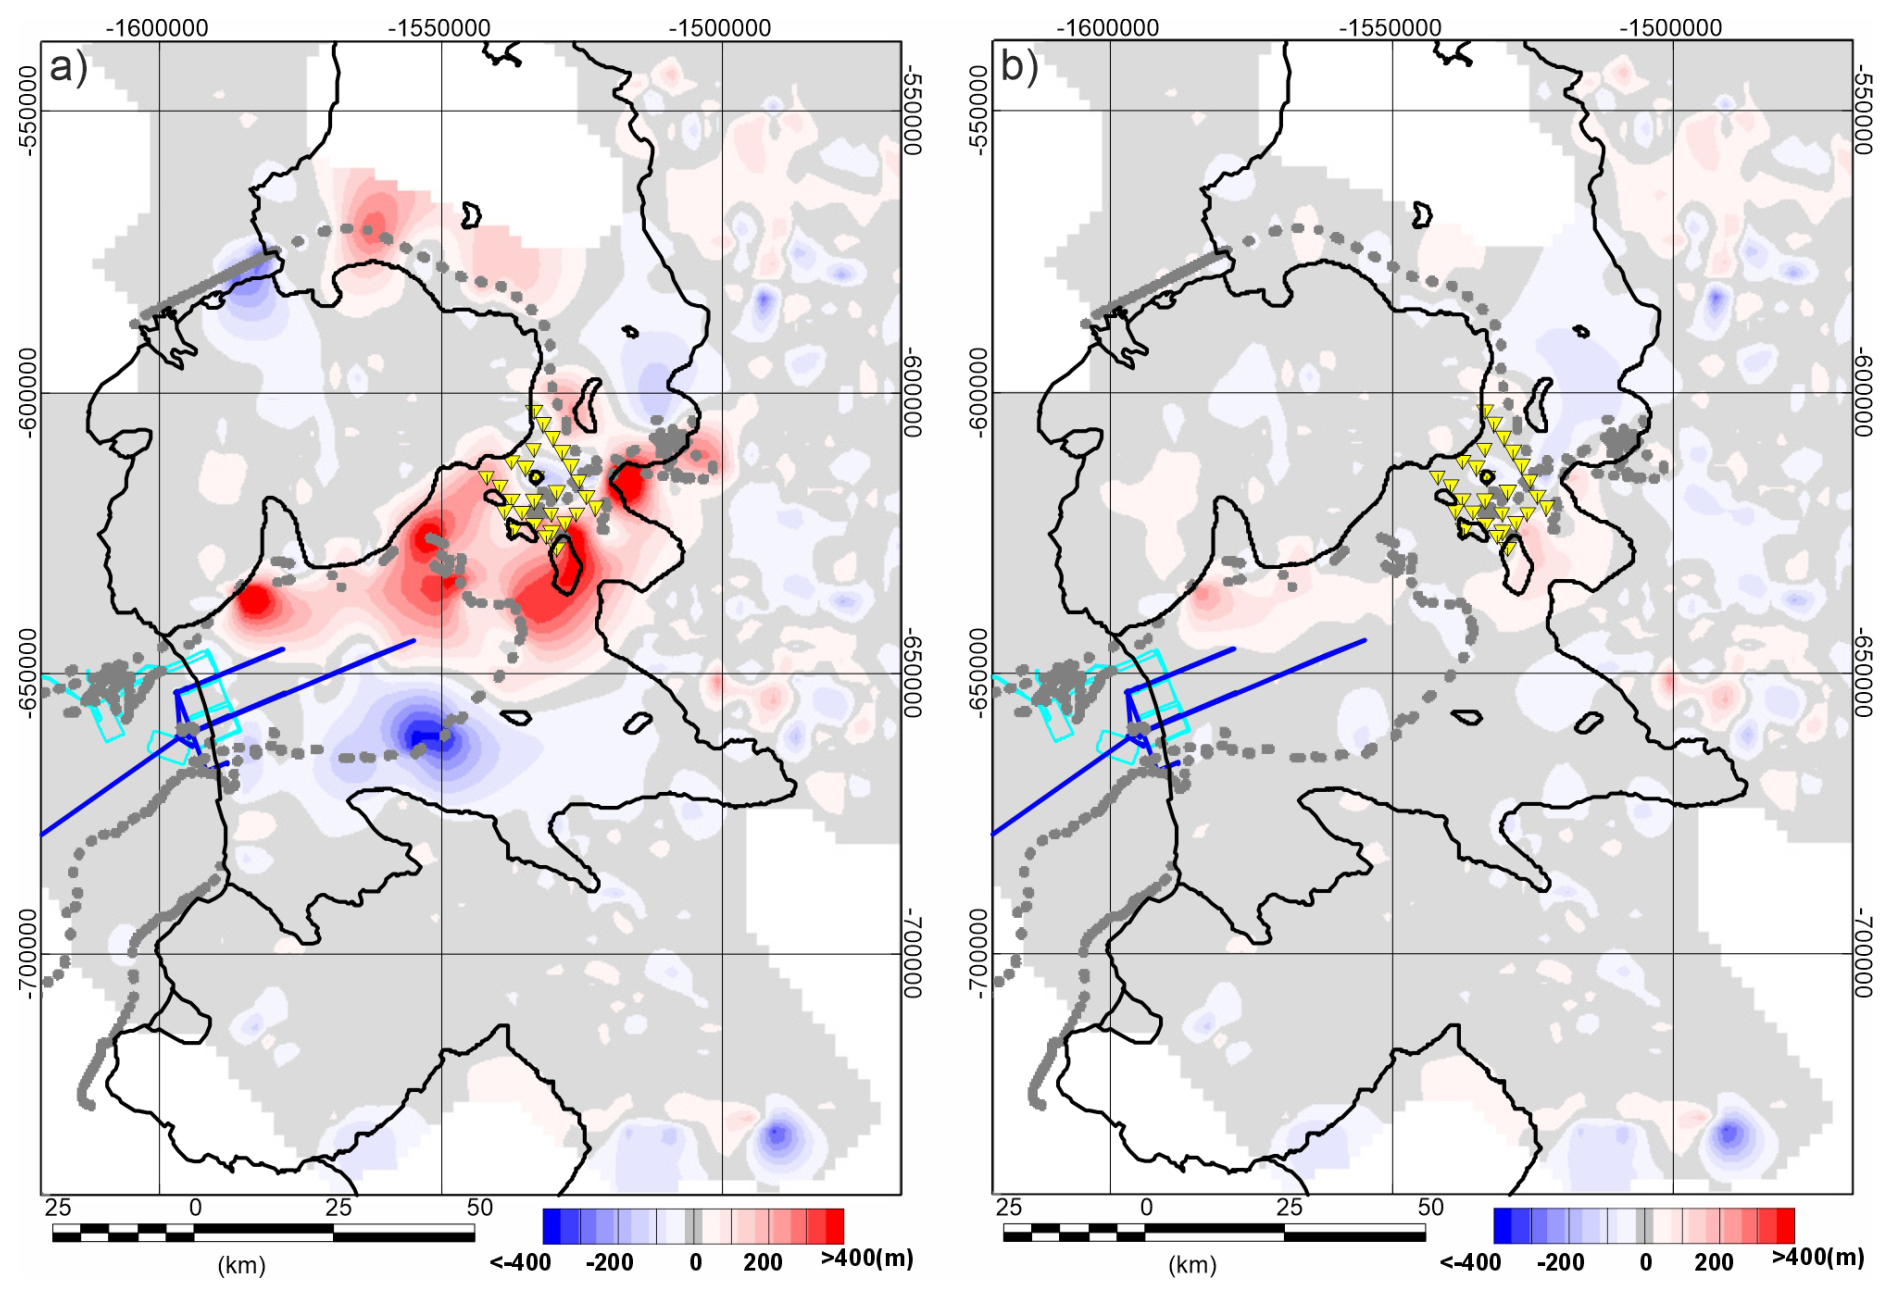
Figure 6Error calculated as gravity-derived bathymetric estimate minus direct observations. Symbols as in Fig. 1. (a) Isostatically corrected gravity-derived topography without sub ice shelf observations. (b) Isostatically corrected gravity-derived topography with sub ice shelf control. Note minimal sub ice shelf error due to use of observational data as a control.
A final revised model of the sub-ice shelf bathymetry was created by including the new bathymetric observations in the inversion. This used the full improved reference topography which was input into the inversion scheme shown in Fig. 4c in place of the previous observational topography. The output revised topography (Fig. 5c) is like that derived just using the isostatically corrected gravity data (Fig. 5b) but is slightly deeper in places. As expected, comparing the final grid with the input control data (Fig. 6b) shows lower error than the unconstrained isostatic model (Fig. 6a).
Several models for the bathymetry Dotson/Crosson ice-shelf area now exist, with new observational data allowing us to validate them (Fig. 7a). The oldest bathymetric estimate for the region is BEDMAP2, which is over 600 m too shallow along the ALR observational track (Fig. 7a). This reflects use of ice shelf draft and an enforced minimum 100 m flotation depth away from any depth constraints as a proxy for depth (Fretwell et al., 2013). Bedmachine Antarctica V1 (Morlighem et al., 2020) uses a gravity inversion to provide a bathymetric estimate for the region (Millan et al., 2017). Like the bathymetry from Jordan et al. (2020) the Bedmachine Antarctica V1 product is systematically shallower than the direct observations from ALR, pointing towards a lack of consideration of isostatic processes biassing the results to shallower returns. Later bathymetric estimates in this region including Bedmachine Antarctica V3, V4, Charrassin et al. (2025), and BEDMAP 3 all return the same values along the ALR observational track, indicating they are derived from a single source (Fig. 7). These depth estimates are an improvement on Bedmachine Antarctica V1, but are generally shallower than the observations close to the shelf (∼20 and ∼75 km), and deeper towards the centre of the basin (35 to 65 km) (Fig. 7b). The user guide for Bedmachine Antarctica V3 suggests that bathymetry from the Amundsen Sea is augmented by Jordan et al. (2020), however, the pattern of bathymetric undulations sugests an adjusted version of the Millan et al. (2017) data was used in this reigon, although the adjustment method is not clear. Our new inversion method, without the sub ice shelf observational constraints, provides a closer match to observational data (Fig. 7b), consistent with the inclusion of more gravity data than Millan et al. (2017), as well as use of a process driven isostatic model. Our final data product, which includes control on depth from the direct observations, will provide the best possible bathymetric dataset for the area given available data.
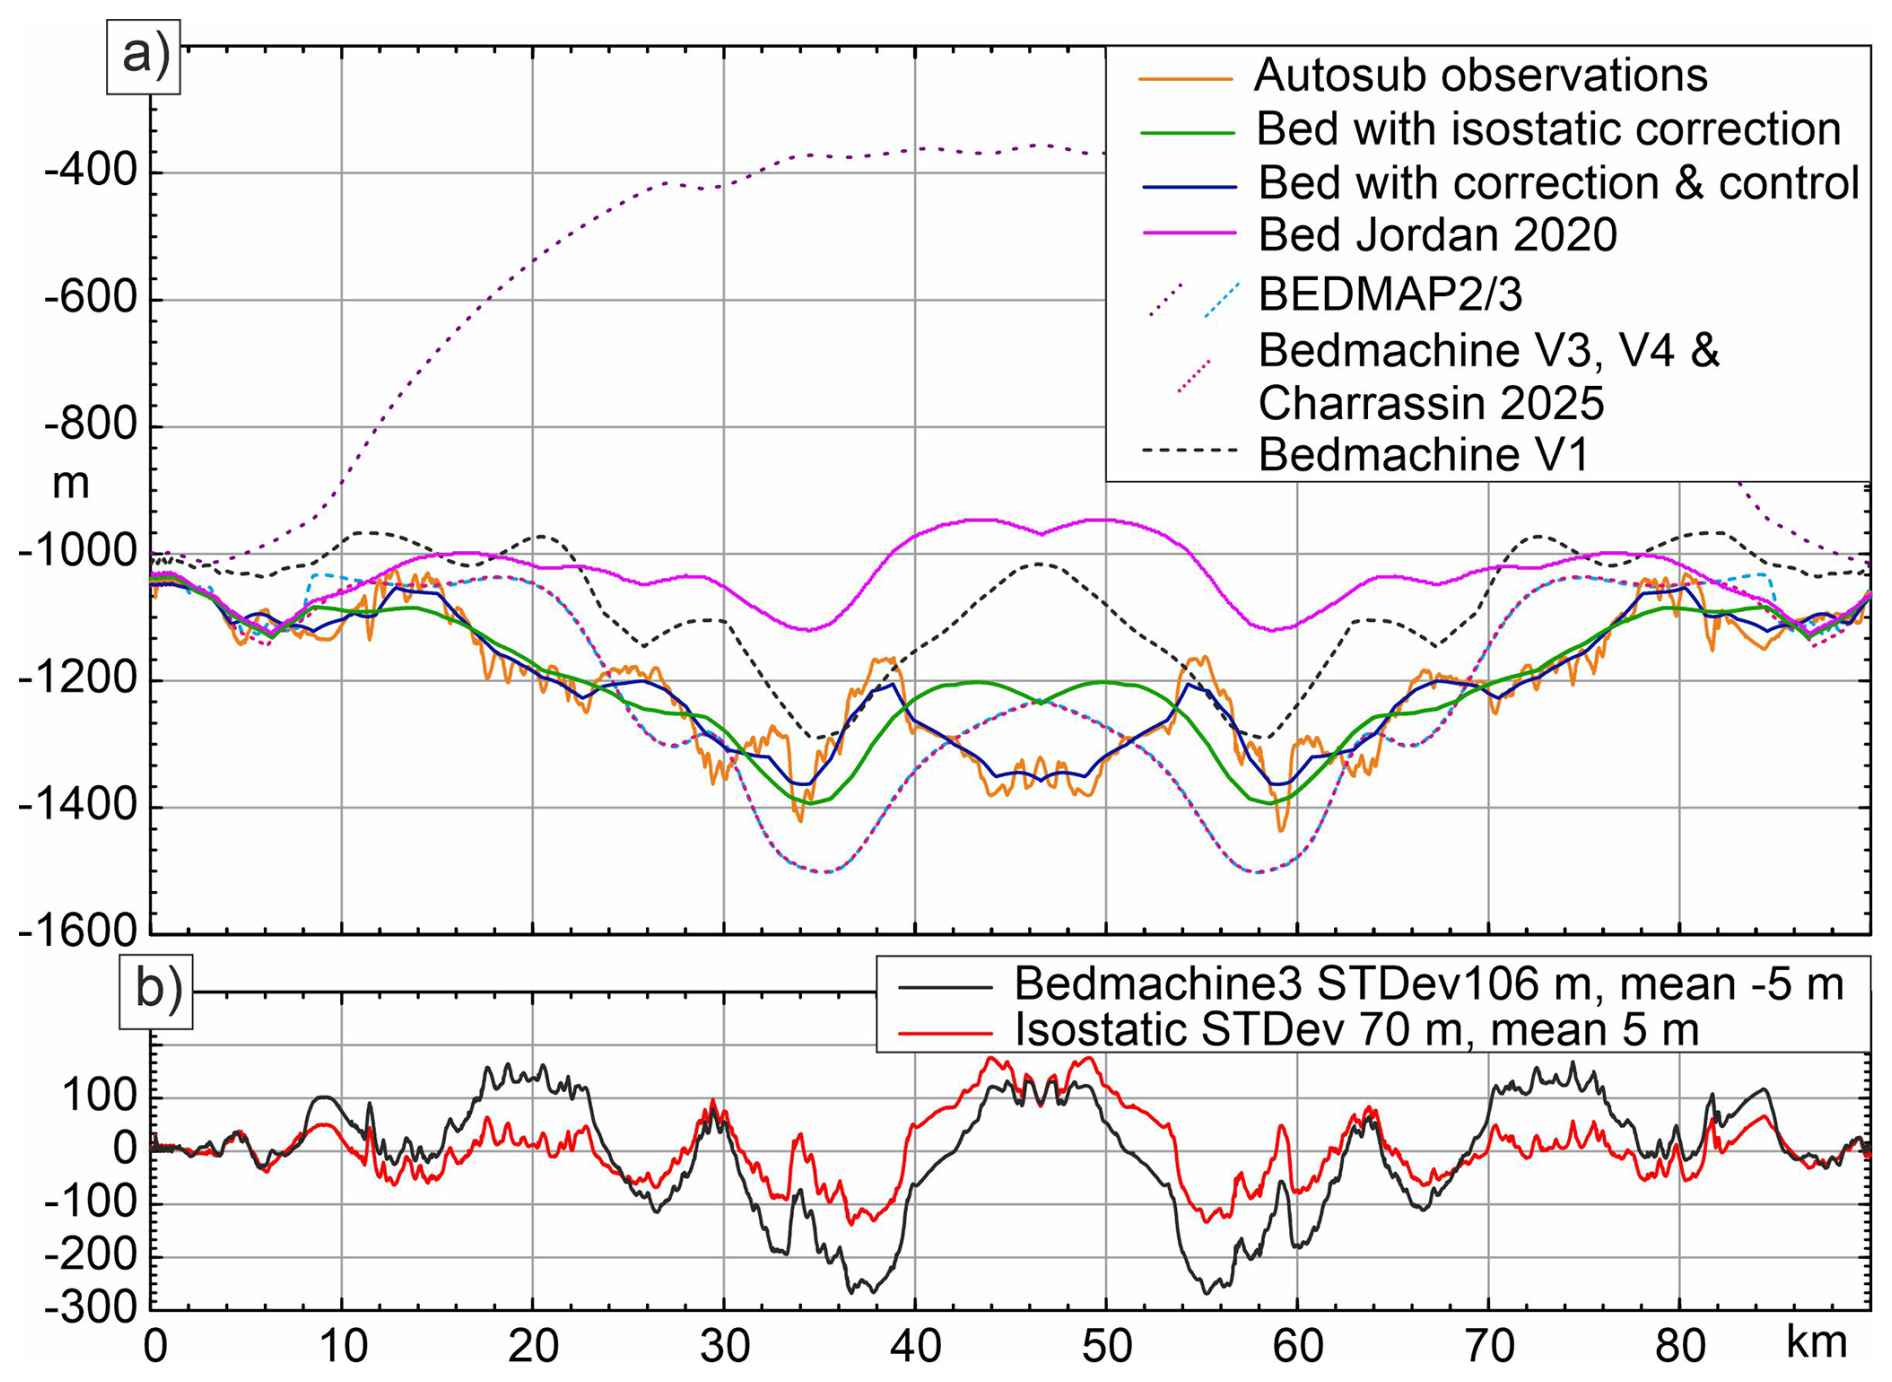
Figure 7Bathymetry beneath the Dotson/Crosson ice-shelf along the main ALR profile located on Fig. 2a. (a) Bathymetric profiles. Solid lines from this study and Jordan et al (2020). Dotted lines from BEDMAP2 and BEDMAP3, Bedmachine Antarctica V1, V3 and V4, and Charrassin et al. (2025).
The shallow bias in the bathymetric model produced by Jordan et al. (2020) in the Dotson ice-shelf and also to a lesser extent in the Crosson ice-shelf area means that models of sub ice shelf circulation (e.g. Goldberg and Holland, 2022) may have underestimated the volume of warm water flowing beneath the shelf, as such flow is restricted by shallow sills. This issue highlights the need for caution when using gravity derived bathymetry. Such bathymetry provides the best estimate in regions lacking other data, but geological processes can give rise to relatively large and difficult to quantify errors. Models using such data may therefore need re-evaluation in light of new observations. The impact of some geological factors, such as lateral density variations in the upper crust, can only be resolved by tying bathymetric models to direct observations. However, here we have shown that by considering the process of isostatic balance, which creates a long-wavelength distortion of the gravity field and hence recovered bathymetry, predictions can be improved, removing consistent regional scale errors in depth on the order of 200 to 400 m.
We show that the error between our new recovered bathymetry and direct observations has a standard deviation of 70 m along the main ALR profile (Fig. 2c) which lies away from extremely high amplitude and short wavelength bathymetric features. This error incorporates the impact of unresolved short wave-length topography, errors in the gravity observations, and local variability in subsurface geology. Errors in gravity data are estimated to be ∼1.67 mGal, equating to ∼25 m error in elevation. This highlights the fact that the accuracy of topography recovered by gravity inversion also depends critically on the geology and spatial frequency of the topography. As such our error estimate is location specific and may not be a valid estimate for the error associated with this method in other regions. Our work confirms the theoretical analysis of Tankersley et al. (2025), who showed that adding selected data points can significantly improve the accuracy of the recovered bathymetry compared to where none are present. However, our real-world errors are an order of magnitude higher than predicted in the theoretical study which used a conceptually similar method. Use of improved inversion techniques may reduce the error (Tankersley et al., 2025), but unknown geological complexity will remain a hard to quantify factor impacting the quality of bathymetry recovered from gravity data.
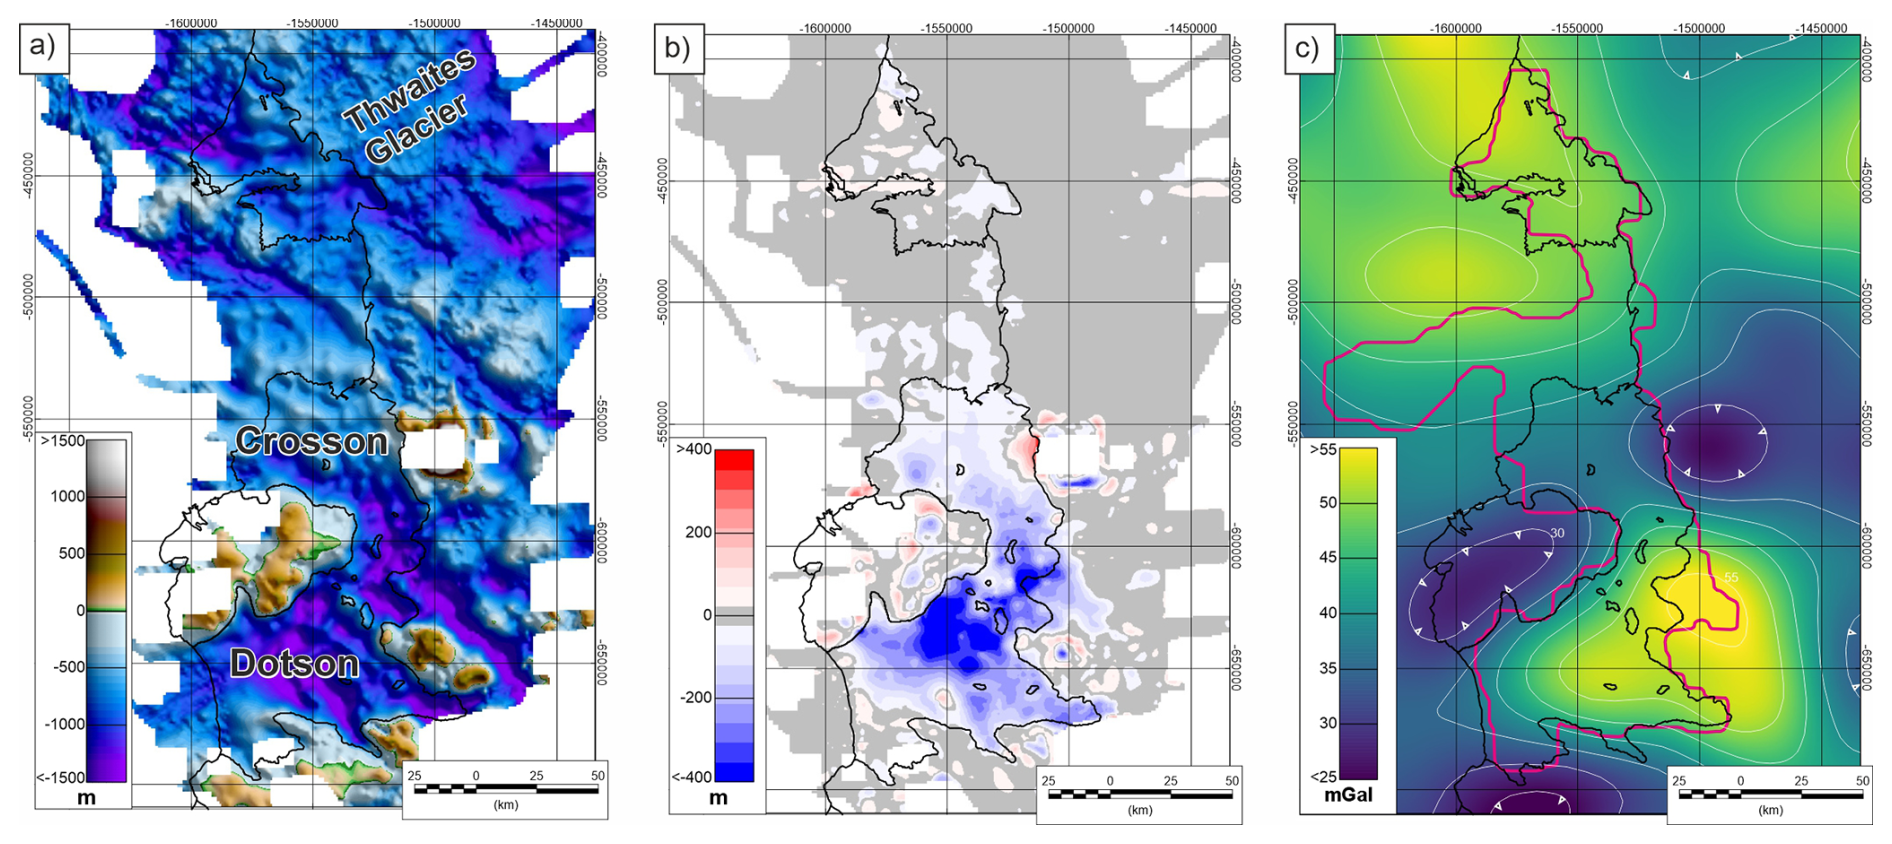
Figure 8Bathymetry of the wider Dotson, Crosson and Thwaites area. (a) New regional bathymetry from gravity data, including an isostatic correction. (b) Change in bathymetry/topography from Jordan et al. (2020), to a model including isostatic correction to gravity data. Blue colours show regions where the new model is deeper. Note that the impact of the isostatic correction is minimal away from the deep basin beneath the Dotson and Crosson ice shelves. (c) Isostatic Moho gravity effect based on an isostatic model with 5 mGal contour. Note more complex form in the Dotson/Crosson ice shelf area relative to the ice shelf adjacent to Thwaites Glacier. Pink line outlines area with no direct bathymetric constraints prior to this study.
One key factor our method does not consider is the presence of thick layers of sediment within the basin. Such low density material would typically create a local additional negative gravity anomaly meaning the depth of the basin was overestimated rather than underestimated. It is not possible to disregard this situation without observations. However, in the Dottson/Crosson region the maximum isostatic correction, i.e. an Airy model, allows the bathymetry recovered from gravity to fit the direct observations well. This suggests that sediments creating a negative gravity anomaly leading to an overestimate of depth are limited or not present. In addition, the glacial erosion which sculpted the basin likely removed much of the low-density sediment, and the few thousand years (typically <10 ka) since the ice sheet retreated from its LGM position has not provided enough time for significant deposition (Lindow et al., 2014). This lack of very significant deposition is evidenced by the bedrock exposed in many of the inboard parts of the wider Amundsen Sea Embayment (Hogan et al., 2020).
To assess if the wider bathymetric model of the Thwaites/Dotson and Crosson sub ice shelf area produced by Jordan et al. (2020) requires revision and the applicability of this method in other regions, we consider the new inversion, including all topographic constraints, applied across the wider region (Fig. 8a). It is apparent that the largest changes from the model of Jordan et al. (2020) are restricted to the region beneath the Dotson and Crosson ice shelves (Fig. 8b). The gap in direct bathymetric observations around the Dotson and Crosson ice shelves in the Jordan et al. (2020) study is only slightly larger than the data gap beneath the Thwaites Glacier ice shelves (Fig. 8c). This could suggest that similar significant and systematic errors in recovered bathymetry associated with isostatic compensation are present adjacent to Thwaites Glacier. However, comparison of the inversion results with and without isostatic correction show little change in the Thwaites Glacier area. We attribute this difference to the pattern of isostatic compensation in the two areas. The gravity field derived from the isostatic compensation at the Moho shows the isostatic correction across the data gap adjacent to Thwaites Glacier has a low amplitude and approximately linear gradient (Fig. 8c). In contrast the Dotson and Crosson area shows a correction with higher amplitude and more variable gradient within the original gap in data coverage (Fig. 8c). In the case where the gradient of the isostatic correction is low and approximately constant, tying the recovered bathymetry to observed data either side of the data gap, with no consideration of isostatic compensation, will produce a reasonable result. In contrast, where the isostatic correction predicts a highly variable field, as in the Crosson and Dotson case, errors created by not considering the isostatic correction are likely to be more significant, as they will not be removed by interpolating the error between the observed topographic controls.
Our study shows that isostatic compensation is an important process that can result in long wavelength errors of several hundred meters in bathymetry derived from gravity data. Such errors have the potential to significantly change the outputs of simulations testing the vulnerability of the Antarctic ice sheet to warming oceans as they raise the seabed above important thresholds, artificially blocking the influx of warm water. As isostatic compensation has most impact on recovery of bathymetry where deep basins are entirely unconstrained by direct observations, it is likely that this consideration has most impact for smaller and less explored ice shelves, rather than over the major Ross, or Ronne-Filchner ice shelves. Such ice shelves have been identified for example by Tankersley et al. (2025). Although small relative to the Ross or Ronne-Filchner many of these ice shelf systems are many 10s of km wide, and are likely to have been erosionally overdeepened by flowing ice, meaning isostatic compensation is likely to distort the gravity signal due to the local bathymetry. Consideration of isostatic compensation, in addition to direct observations, is therefore required to provide the best bathymetric estimate for many ice shelves around Antarctica.
Including an isostatic correction, based on an initial topographic estimate from the free-air gravity anomaly, provides a better estimate of the sub ice shelf bathymetry than simply inverting the free-air gravity anomaly with no isostatic correction. However, in some situations, such as adjacent to Thwaites Glacier, where the predicted isostatic correction has a low and generally uniform gradient, inclusion of the isostatic correction will be less important. Our study highlights the need to consider both the shallow geology, and the deeper, more regional impacts of isostatic compensation when recovering bathymetry from gravity data, especially where constraint by direct observations are lacking.
Data and results presented in this manuscript can be accessed at the NERC UK Polar Data Centre (https://doi.org/10.5285/baef2e88-300f-42bc-8ccb-bfdff147a492, Jordan et al., 2025).
The supplement related to this article is available online at https://doi.org/10.5194/se-17-1187-2026-supplement.
TJ devised and caried out the revised gravity inversion and prepared initial manuscript. KH, EP and RH devised the ship-borne study, collected and provided Autosub data, AW collected and provided Ran data, AM and KA collected and provided seismic data, PD and JG collected and provided profiling float data, KH assisted with manuscript initiation. All authors contributed to the manuscript through the drafting process.
The contact author has declared that none of the authors has any competing interests.
Publisher's note: Copernicus Publications remains neutral with regard to jurisdictional claims made in the text, published maps, institutional affiliations, or any other geographical representation in this paper. The authors bear the ultimate responsibility for providing appropriate place names. Views expressed in the text are those of the authors and do not necessarily reflect the views of the publisher.
We thank NSF-U.S. Antarctic Program and NERC-British Antarctic Survey for their logistical support of the International Thwaites Glacier Collaboration (ITGC). This work is ITGC contribution No. ITGC-182.
This research has been supported by the NERC/NSF ITGC project, specifically deployments of ALR and Ran during RN Nathaniel B. Palmer cruise NBP22-02, through support of the Thwaites-Amundsen Regional Survey and Network Integrating Atmosphere-Ice-Ocean Processes (TARSAN) project, from National Science Foundation (NSF: grant no. 1929991) and Natural Environment Research Council (NERC: grant no. NE/S006419/1). PD, JG and the float profiler observations were funded by the Paul G Allen Family Foundation through the Robotic Network for Exploration Under Ice Shelves grant no. 12310. TJ acknowledges support from the NERC NC-SS and PRECIENT projects.
This paper was edited by Susanne Buiter and reviewed by Matthew Tankersley, Jörg Ebbing, and Mirko Scheinert.
An, L., Rignot, E., Millan, R., Tinto, K., and Willis, J.: Bathymetry of Northwest Greenland Using “Ocean Melting Greenland” (OMG) High-Resolution Airborne Gravity and Other Data, Remote Sens., 11, https://doi.org/10.3390/rs11020131 2019.
Charrassin, R., Millan, R., Rignot, E., and Scheinert, M.: Bathymetry of the Antarctic continental shelf and ice shelf cavities from circumpolar gravity anomalies and other data, Sci. Rep,, 15, 1214, https://doi.org/10.1038/s41598-024-81599-1, 2025.
Cochran, J. R., Jacobs, S. S., Tinto, K. J., and Bell, R. E.: Bathymetric and oceanic controls on Abbot Ice Shelf thickness and stability, The Cryosphere, 8, 877–889, https://doi.org/10.5194/tc-8-877-2014, 2014.
Cox, S. C., Smith Lyttle, B., Elkind, S., Smith Siddoway, C. S., Morin, P., Capponi, G., Abu-Alam, T., Ballinger, M., Bamber, L., Kitchener, B., Lelli, L., Mawson, J. F., Millikin, A., Dal Seno, N., Whitburn, L., White, T., Burton-Johnson, A., Crispini, L., Elliot, D., Elvevold, S., Goodge, J. W., Halpin, J. A., Jacobs, J., Mikhalsky, E., Martin, A. P., Morgan, F., Smellie, J., Scadden, P., and Wilson, G. S.: The GeoMAP (v.2022-08) continent-wide detailed geological dataset of Antarctica, PANGAEA [data set], https://doi.org/10.1594/PANGAEA.951482, 2023.
Fretwell, P., Pritchard, H. D., Vaughan, D. G., Bamber, J. L., Barrand, N. E., Bell, R., Bianchi, C., Bingham, R. G., Blankenship, D. D., Casassa, G., Catania, G., Callens, D., Conway, H., Cook, A. J., Corr, H. F. J., Damaske, D., Damm, V., Ferraccioli, F., Forsberg, R., Fujita, S., Gim, Y., Gogineni, P., Griggs, J. A., Hindmarsh, R. C. A., Holmlund, P., Holt, J. W., Jacobel, R. W., Jenkins, A., Jokat, W., Jordan, T., King, E. C., Kohler, J., Krabill, W., Riger-Kusk, M., Langley, K. A., Leitchenkov, G., Leuschen, C., Luyendyk, B. P., Matsuoka, K., Mouginot, J., Nitsche, F. O., Nogi, Y., Nost, O. A., Popov, S. V., Rignot, E., Rippin, D. M., Rivera, A., Roberts, J., Ross, N., Siegert, M. J., Smith, A. M., Steinhage, D., Studinger, M., Sun, B., Tinto, B. K., Welch, B. C., Wilson, D., Young, D. A., Xiangbin, C., and Zirizzotti, A.: Bedmap2: improved ice bed, surface and thickness datasets for Antarctica, The Cryosphere, 7, 375–393, https://doi.org/10.5194/tc-7-375-2013, 2013.
Girton, J. B., Christianson, K., Dunlap, J., Dutrieux, P., Gobat, J., Lee, C., and Rainville, L.: Buoyancy-adjusting Profiling Floats for Exploration of Heat Transport, Melt Rates, and Mixing in the Ocean Cavities Under Floating Ice Shelves, OCEANS 2019 MTS/IEEE SEATTLE, 1–6, https://doi.org/10.23919/OCEANS40490.2019.8962744, 27–31 October 2019.
Goldberg, D. N. and Holland, P. R.: The relative impacts of initialization and climate forcing in coupled ice sheet-ocean modeling: Application to Pope, Smith, and Kohler glaciers, J. Geophys. Res.-Earth Surf., 127, e2021JF006570, https://doi.org/10.1029/2021JF006570, 2022.
Hogan, K. A., Larter, R. D., Graham, A. G. C., Arthern, R., Kirkham, J. D., Totten, R. L., Jordan, T. A., Clark, R., Fitzgerald, V., Wåhlin, A. K., Anderson, J. B., Hillenbrand, C.-D., Nitsche, F. O., Simkins, L., Smith, J. A., Gohl, K., Arndt, J. E., Hong, J., and Wellner, J.: Revealing the former bed of Thwaites Glacier using sea-floor bathymetry: implications for warm-water routing and bed controls on ice flow and buttressing, The Cryosphere, 14, 2883–2908, https://doi.org/10.5194/tc-14-2883-2020, 2020.
Jordan, T. A., Ferraccioli, F., Vaughan, D. G., Holt, J. W., Corr, H., Blankenship, D. D., and Diehl, T. M.: Aerogravity evidence for major crustal thinning under the Pine Island Glacier region (West Antarctica), Geol. Soc. Am. B., 122, 714–726, https://doi.org/10.1130/B26417.1, 2010.
Jordan, T. A., Porter, D., Tinto, K., Millan, R., Muto, A., Hogan, K., Larter, R. D., Graham, A. G. C., and Paden, J. D.: New gravity-derived bathymetry for the Thwaites, Crosson, and Dotson ice shelves revealing two ice shelf populations, The Cryosphere, 14, 2869–2882, https://doi.org/10.5194/tc-14-2869-2020, 2020.
Jordan, T., Heywood, K., Wahlin, A., Hall, R., Muto, A., Dutrieux, P., Hogan, K., Girton, J., Alley, K., and Pettit, E.: Updated gravity-derived bathymetry for the Thwaites, Crosson and Dotson ice shelves (2009–2022) (Version 1.0), NERC EDS UK Polar Data Centre [data set], https://doi.org/10.5285/baef2e88-300f-42bc-8ccb-bfdff147a492, 2025.
Lindow, J., Castex, M., Wittmann, H., Johnson, J. S., Lisker, F., Gohl, K., and Spiegel, C.: Glacial retreat in the Amundsen Sea sector, West Antarctica – first cosmogenic evidence from central Pine Island Bay and the Kohler Range, Quaternary Sci. Rev., 98, 166–173, https://doi.org/10.1016/j.quascirev.2014.05.010, 2014.
Millan, R., Rignot, E., Bernier, V., Morlighem, M., and Dutrieux, P.: Bathymetry of the Amundsen Sea Embayment sector of West Antarctica from Operation IceBridge gravity and other data, Geophys. Res. Lett., 44, 1360–1368, https://doi.org/10.1002/2016GL072071, 2017.
Morlighem, M., Rignot, E., Binder, T., Blankenship, D., Drews, R., Eagles, G., Eisen, O., Ferraccioli, F., Forsberg, R., Fretwell, P., Goel, V., Greenbaum, J. S., Gudmundsson, H., Guo, J., Helm, V., Hofstede, C., Howat, I., Humbert, A., Jokat, W., Karlsson, N. B., Lee, W. S., Matsuoka, K., Millan, R., Mouginot, J., Paden, J., Pattyn, F., Roberts, J., Rosier, S., Ruppel, A., Seroussi, H., Smith, E. C., Steinhage, D., Sun, B., Broeke, M. R. v. d., Ommen, T. D. v., Wessem, M. v., and Young, D. A.: Deep glacial troughs and stabilizing ridges unveiled beneath the margins of the Antarctic ice sheet, Nat. Geosci., 13, 132–137, https://doi.org/10.1038/s41561-019-0510-8, 2020.
Muto, A., Peters, L. E., Gohl, K., Sasgen, I., Alley, R. B., Anandakrishnan, S., and Riverman, K. L.: Subglacial bathymetry and sediment distribution beneath Pine Island Glacier ice shelf modeled using aerogravity and in situ geophysical data: New results, Earth Planet. Sc. Lett., 433, 63–75, https://doi.org/10.1016/j.epsl.2015.10.037, 2016.
Muto, A., Alley, K., Pettit, E. C., Pomraning, D., Roccaro, A., and Scambos, T., Truffer, M., Wild, C., and Wallin, B.: Sub-ice-shelf seafloor elevation derived from point-source active-seismic data on Thwaites Eastern Ice Shelf and Dotson Ice Shelf, December 2019 and January 2020, U.S. Antarctic Program (USAP) Data Center [data set], https://doi.org/10.15784/601827, 2024.
O' Donnell, J. P., Stuart, G. W., Brisbourne, A. M., Selway, K., Yang, Y., Nield, G. A., Whitehouse, P. L., Nyblade, A. A., Wiens, D. A., Aster, R. C., Anandakrishnan, S., Huerta, A. D., Wilson, T., and Winberry, J. P.: The uppermost mantle seismic velocity structure of West Antarctica from Rayleigh wave tomography: Insights into tectonic structure and geothermal heat flow, Earth Planet. Sc. Lett., 522, 219–233, https://doi.org/10.1016/j.epsl.2019.06.024, 2019.
Parker, R. L.: The rapid calculation of potential anomalies, Geophys. J. Int., 31, 447–455, 1973.
Richter, M. E., Heywood, K. J., Hall, R. A., and Davis, P. E. D.: Observations of turbulent mixing in the Dotson Ice Shelf cavity, Ocean Sci., 21, 3341–3359, https://doi.org/10.5194/os-21-3341-2025, 2025.
Rignot, E., Mouginot, J., Morlighem, M., Seroussi, H., and Scheuchl, B.: Widespread, rapid grounding line retreat of Pine Island, Thwaites, Smith, and Kohler glaciers,West Antarctica, from 1992 to 2011, Geophys. Res. Lett., 41, 3502–3409, https://doi.org/10.1002/2014GL060140, 2014.
Tankersley, M. D., Horgan, H., Caratori Tontini, F., and Tinto, K.: Gravity inversion for sub-ice shelf bathymetry: strengths, limitations, and insights from synthetic modeling, The Cryosphere, 19, 6827–6864, https://doi.org/10.5194/tc-19-6827-2025, 2025.
Tinto, K., Bell, R., and Cochran, J. R.: IceBridge Sander AIRGrav L1B Geolocated Free Air Gravity Anomalies, Version 1, NASA National Snow and Ice Data Center Distributed Active Archive Center [data set], https://doi.org/10.5067/R1RQ6NRIJV89, 2010, updated 2019.
von Frese, R. R. B., Hinze, W. J., Braile, L. W., and Luca, A. J.: Spherical earth gravity and magnetic anomaly modeling by Gauss- Legendre quadrature integration, J. Geophys., 49, 234–242, 1981.
Wåhlin, A., Alley, K. E., Begeman, C., Hegrenæs, Ø., Yuan, X., Graham, A. G. C., Hogan, K., Davis, P. E. D., Dotto, T. S., Eayrs, C., Hall, R. A., Holland, D. M., Kim, T. W., Larter, R. D., Ling, L., Muto, A., Pettit, E. C., Schmidt, B. E., Snow, T., Stedt, F., Washam, P. M., Wahlgren, S., Wild, C., Wellner, J., Zheng, Y., and Heywood, K. J.: Swirls and scoops: Ice base melt revealed by multibeam imagery of an Antarctic ice shelf, Sci. Adv., 10, eadn9188, https://doi.org/10.1126/sciadv.adn9188, 2024.
Wessel, P., Smith, W. H. F., Scharroo, R., Luis, J., and Wobbe, F.: Generic Mapping Tools: Improved Version Released, Eos, Transactions American Geophysical Union, 94, 409–410, https://doi.org/10.1002/2013EO450001, 2013.
Wild, C. T., Snow, T., Dotto, T. S., Davis, P. E. D., Tyler, S., Scambos, T. A., Pettit, E. C., and Heywood, K. J.: Thwaites Eastern Ice Shelf cavity observations reveal multiyear sea ice dynamics and deepwater warming in Pine Island Bay, West Antarctica, Ocean Sci., 21, 2605–2629, https://doi.org/10.5194/os-21-2605-2025, 2025.