the Creative Commons Attribution 4.0 License.
the Creative Commons Attribution 4.0 License.
 | 12 Feb 2026
Near-surface characterization and delineation of water preferential flow-pathways at South Deep Gold Mine, South Africa
Sikelela Gomo
Farbod Khosro Anjom
Chiara Colombero
Mohammadkarim Karimpour
Bibi Ayesha Jogee
Musa S. D. Manzi
Laura V. Socco
Velocity models of the shallow subsurface (a few hundred meters) are important in near-surface characterization, improving seismic mapping resolution at depth, and constraining deeper geological models. It is therefore interesting to retrieve them from deep seismic exploration data. We compute the near-surface shear wave velocity model in the vicinity of South Deep Gold Mine, using surface waves present in the small-offset 2D and 3D seismic reflection data acquired between 2022 and 2023 at the mine for research, mine planning, and development purposes. The obtained near-surface model is then used to (1) characterize the near-surface, and (2) better constrain the interpretation of possible water preferential flow-pathways (faults, fracture zones, and dykes) mapped at mining levels, that enable the migration of water from overlying aquifer systems (< 0.5 km depth) to the mining levels (∼ 3 km depth). The analysis is carried-out on reflection seismic data acquired for deep mineral exploration, where the acquisition parameters were not optimized for surface wave techniques and the reciprocity principle is used to improve the data density, coverage, and near-surface mapping resolution. The lithostructural information retrieved from the produced pseudo-2D and 3D shear wave velocity models is consistent with information obtained from available surface borehole data and published records in the study area. To investigate the structural linkage between the deep mining levels and shallow groundwater aquifers, we integrated the near-surface shear wave velocity model produced from the small-offset 2D and 3D reflection seismic data with the large-offset 2003 3D reflection seismic data, and geological structures derived from underground mapping, and exploration drilling. The shear wave velocity models help define the faults, fractures, and dykes that compartmentalize the near-surface groundwater aquifer systems. The large-offset legacy 2003 3D seismic data, underground mapping, and exploration drilling provide a better definition of the orebody and its offsets (e.g., faults) at the mining level. The integrated data show that several geological structures (e.g., faults and dykes), defined by legacy seismic data, underground drilling, and mapping, cross-cut the mining levels at ∼ 3 km depth and intersect the near-surface aquifers, thus making these structures possible preferential flow-pathways for water migration to the deep mining levels. The results of the interpretation illustrate the advantages of integrating shallow and deep subsurface information to constrain the timing of geological events and mitigate the risks associated with water ingress to the mining levels. The final model produced can be used for future mine development, improving safety and production, and for the extension of the Life of Mine (LoM).
- Article
(21600 KB) - Full-text XML
- BibTeX
- EndNote


The Mesoarchean-aged Witwatersrand basin hosts the largest known gold deposit in the world and has produced more gold than any other ore province globally (Frimmel, 2019). Seismic techniques have been used extensively in the exploration of the Witwatersrand basin, mainly for mapping and evaluating gold-bearing quartz pebble conglomerates (locally termed “reefs”), for mining purposes (i.e., planning, production, and risk mitigation), and for imaging geological structures (faults and dykes). Seismic imaging of faults and dykes, in particular, is important in deep underground gold mines as these structures might (1) act as possible preferential flow-pathways for water and methane migration into the mining levels, (2) cross-cut the orebody and make it impractical to mine (Campbell and Crotty, 1988; Pretorius et al., 1989; Gibson, 2005; Manzi et al., 2012a), and (3) cause damaging seismic events (Masethe et al., 2023). The first 3D application of seismic techniques in hard-rock mining environments, particularly for mineral exploration, trace back to the surveys conducted by Campbell and Crotty (1988, 1990) at South Deep Gold Mine in 1986 in the Witwatersrand basin. Campbell and Crotty (1990) applied active-source surface 3D seismic surveys to image the gold-bearing horizons and geological structures at depths down to 3.5 km below ground surface. This pilot study investigated and demonstrated the potential that the 3D seismic technique has in hard-rock environment for mineral exploration. In 2003, Gold Fields commissioned one of the largest 3D seismic surveys in the Witwatersrand basin to map the deep-seated gold deposits (e.g., Ventersdorp Contact Reef, VCR) and subsurface geological structures (e.g., faults and dykes) across its Kloof and South Deep gold mines for mine planning purposes (Manzi et al., 2012a). The legacy 2003 Kloof-South Deep Gold Mine data have been the subject of several studies over the past 20 years, given the size of the survey area and the unique nature of the data, particularly the strong seismic reflections associated with deep-seated gold-bearing horizons and the delineation of complex geological structures that cross-cut the gold deposits (Manzi et al., 2012a, b; Manzi et al., 2013a, b). The data have also been used by Manzi et al. (2012b) to map potential conduits of water and methane at deep mining levels of the Kloof Gold Mine. They have been used to constrain Neoarchaean tectonic history and the ore genetic models in the Witwatersrand basin (Manzi et al., 2013b; Malehmir et al., 2014).
Between 2022 and 2023, high-resolution 2D and 3D deep seismic reflection (DSR) surveys were conducted at South Deep Gold Mine as part of the ERA-MIN3 Future project (Rapetsoa et al., 2025). The work mainly focused on testing the modern seismic technologies to image the deep (∼ 3 km) gold-bearing horizons such as the Ventersdorp Contact Reef (VCR), Upper Elsburg Reefs (UER), and complex geological structures (e.g., faults and dykes) that cross-cut the orebodies. The seismic surveys used a seismic nodal system incorporating one vertical and three component recorders connected to 5 Hz geophones, broadband micro-electromechanical system (MEMS) accelerometers, distributed acoustic sensing technology, and a 6 t broadband (2–200 Hz) seismic vibrator operating with sweep lengths between 24 and 48 s (Rapetsoa et al., 2025). In this work, we utilize the surface waves (SWs) present in the DSR survey data acquired at the mine to estimate the near-surface shear-wave (S-wave) velocity model in the vicinity of the mine, which is used to better understand the near-surface stratigraphic (lithological) and structural (e.g., faults and dykes) geological variations in the study area. We then integrate the near-surface S-wave velocity model with the 2003 legacy seismic data and mine geological structures to investigate the structural linkage between shallow geology (aquifers) and deep mining levels, where the orebody is located, to constrain the timing of structural activities and determine potential preferential flow-pathways for water ingress into the mining levels.
The near-surface is a geologically complex environment, often consisting of heterogeneous structures characterized by highly weathered and diverse materials, i.e., that may vary from loose, fractured, to solid rocks, which have the potential to significantly obscure the ability to resolve deeper lying seismic targets (Sheriff, 2002; Zhou et al., 2010; Strong, 2018). Near-surface characterization is an essential process in exploration, mining, engineering, and environmental studies as it can provide information that can be used to improve the imaging of deeper lying geological structures, conduct risk assessments, efficiently plan projects, and design and construct safer and better-performing mining, environmental, and civil engineering infrastructures (Laake et al., 2008; Zhu et al., 2008; Socco et al., 2010; Pegah and Liu, 2016; Papadopoulou et al., 2020). The application of seismic surface wave (SW) analysis to determine near-surface velocity models at hard-rock sites is limited due to the challenge of obtaining good-quality data (Socco et al., 2019; Papadopoulou et al., 2020; Wilczynski et al., 2025). The quality of SW data at hard-rock mining sites can be severely affected by (1) the presence of lateral heterogeneities (e.g., dykes, fractures, and faults) which can generate scattering and back reflections (Pileggi et al., 2011; Malehmir et al., 2015); (2) noise generated by mining activity (e.g., blasting, excavations, drilling, crushing, moving heavy machinery, and mining operations) (Urosevic et al., 2007; Górszczyk et al., 2015); and (3) variable and extreme near-surface conditions caused by the presence of hard and rugged topography, roads, areas of outcropping hard rocks, and the presence of swampy soils or dense vegetation (Saunders et al., 1991; Eaton et al., 2003; Heinonen et al., 2011; Malehmir et al., 2017). However, the dominance of SWs in seismic records, their high sensitivity to near-surface properties, their ability to resolve low-velocity zones or soft layers bounded by high-velocity materials, and their ability to avoid the water-masking effect in saturated media, make them a powerful tool for near-surface imaging (Foti et al., 2002; Socco and Strobbia, 2004).
This paper presents the application, potential, and benefits of conducting SW analysis to reflection seismic data mainly acquired for deep targeting in a mining environment. Multichannel analysis of surface wave (MASW) and the Laterally Constrained Inversion (LCI) are applied to high-resolution 2D and 3D seismic data to estimate the near-surface S-wave velocity model within the top ∼ 300 m in the vicinity of South Deep Gold Mine. Since the deep exploration data acquired at the mine are not optimized for SW analysis (i.e., characterized by coarse spatial sampling) and are therefore not ideal for SW analysis, we utilize the reciprocity theorem to extract all the possible information in the data, and increase the data coverage by providing a grid of orthogonal sets of dispersion curves along receiver and source lines. Comparison with available borehole data in the vicinity of the mine indicates that the conducted analysis is sensitive to stratigraphic and structural variations beneath the acquired DSR surveys and resolves them adequately with depth. Lastly, we integrate the obtained near-surface S-wave velocity model with existing and available legacy 2003 active-source P-wave seismic reflection data, mine mapping, and drilling information to investigate the structural continuity and connectivity between the shallow aquifers (< 0.5 km) and deep mining levels (∼ 3 km). These mine-mapped structures are well known in the Witwatersrand gold mines (e.g., South Deep Gold Mine and Kloof Gold Mine) to be associated with mining-induced seismicity, water migration, and methane gas pockets (Manzi et al., 2012b; Masethe et al., 2023). The existing large-offset legacy 2003 3D seismic data provide high-resolution imaging of subsurface geological structures from 0.5 up to 6 km below the ground surface. The integration of the near-surface S-wave model with the large-offset legacy 3D seismic data, underground mapping, and drilling information enabled the tracking (vertically) of these structures through the thick 3 km strata from their known positions at the mining levels to the near-surface. Thus, these different methods and datasets were integrated to overcome their inherent limitations and leverage their strengths.
In this paper, we (1) describe the mining site and its geological setting, (2) present the seismic data acquisition parameters and the characteristics of the data, and outline the processing and inversion strategy, and (3) discuss the obtained velocity models in connection with surface borehole data, underground mine-mapped structures, and legacy deep seismic data.
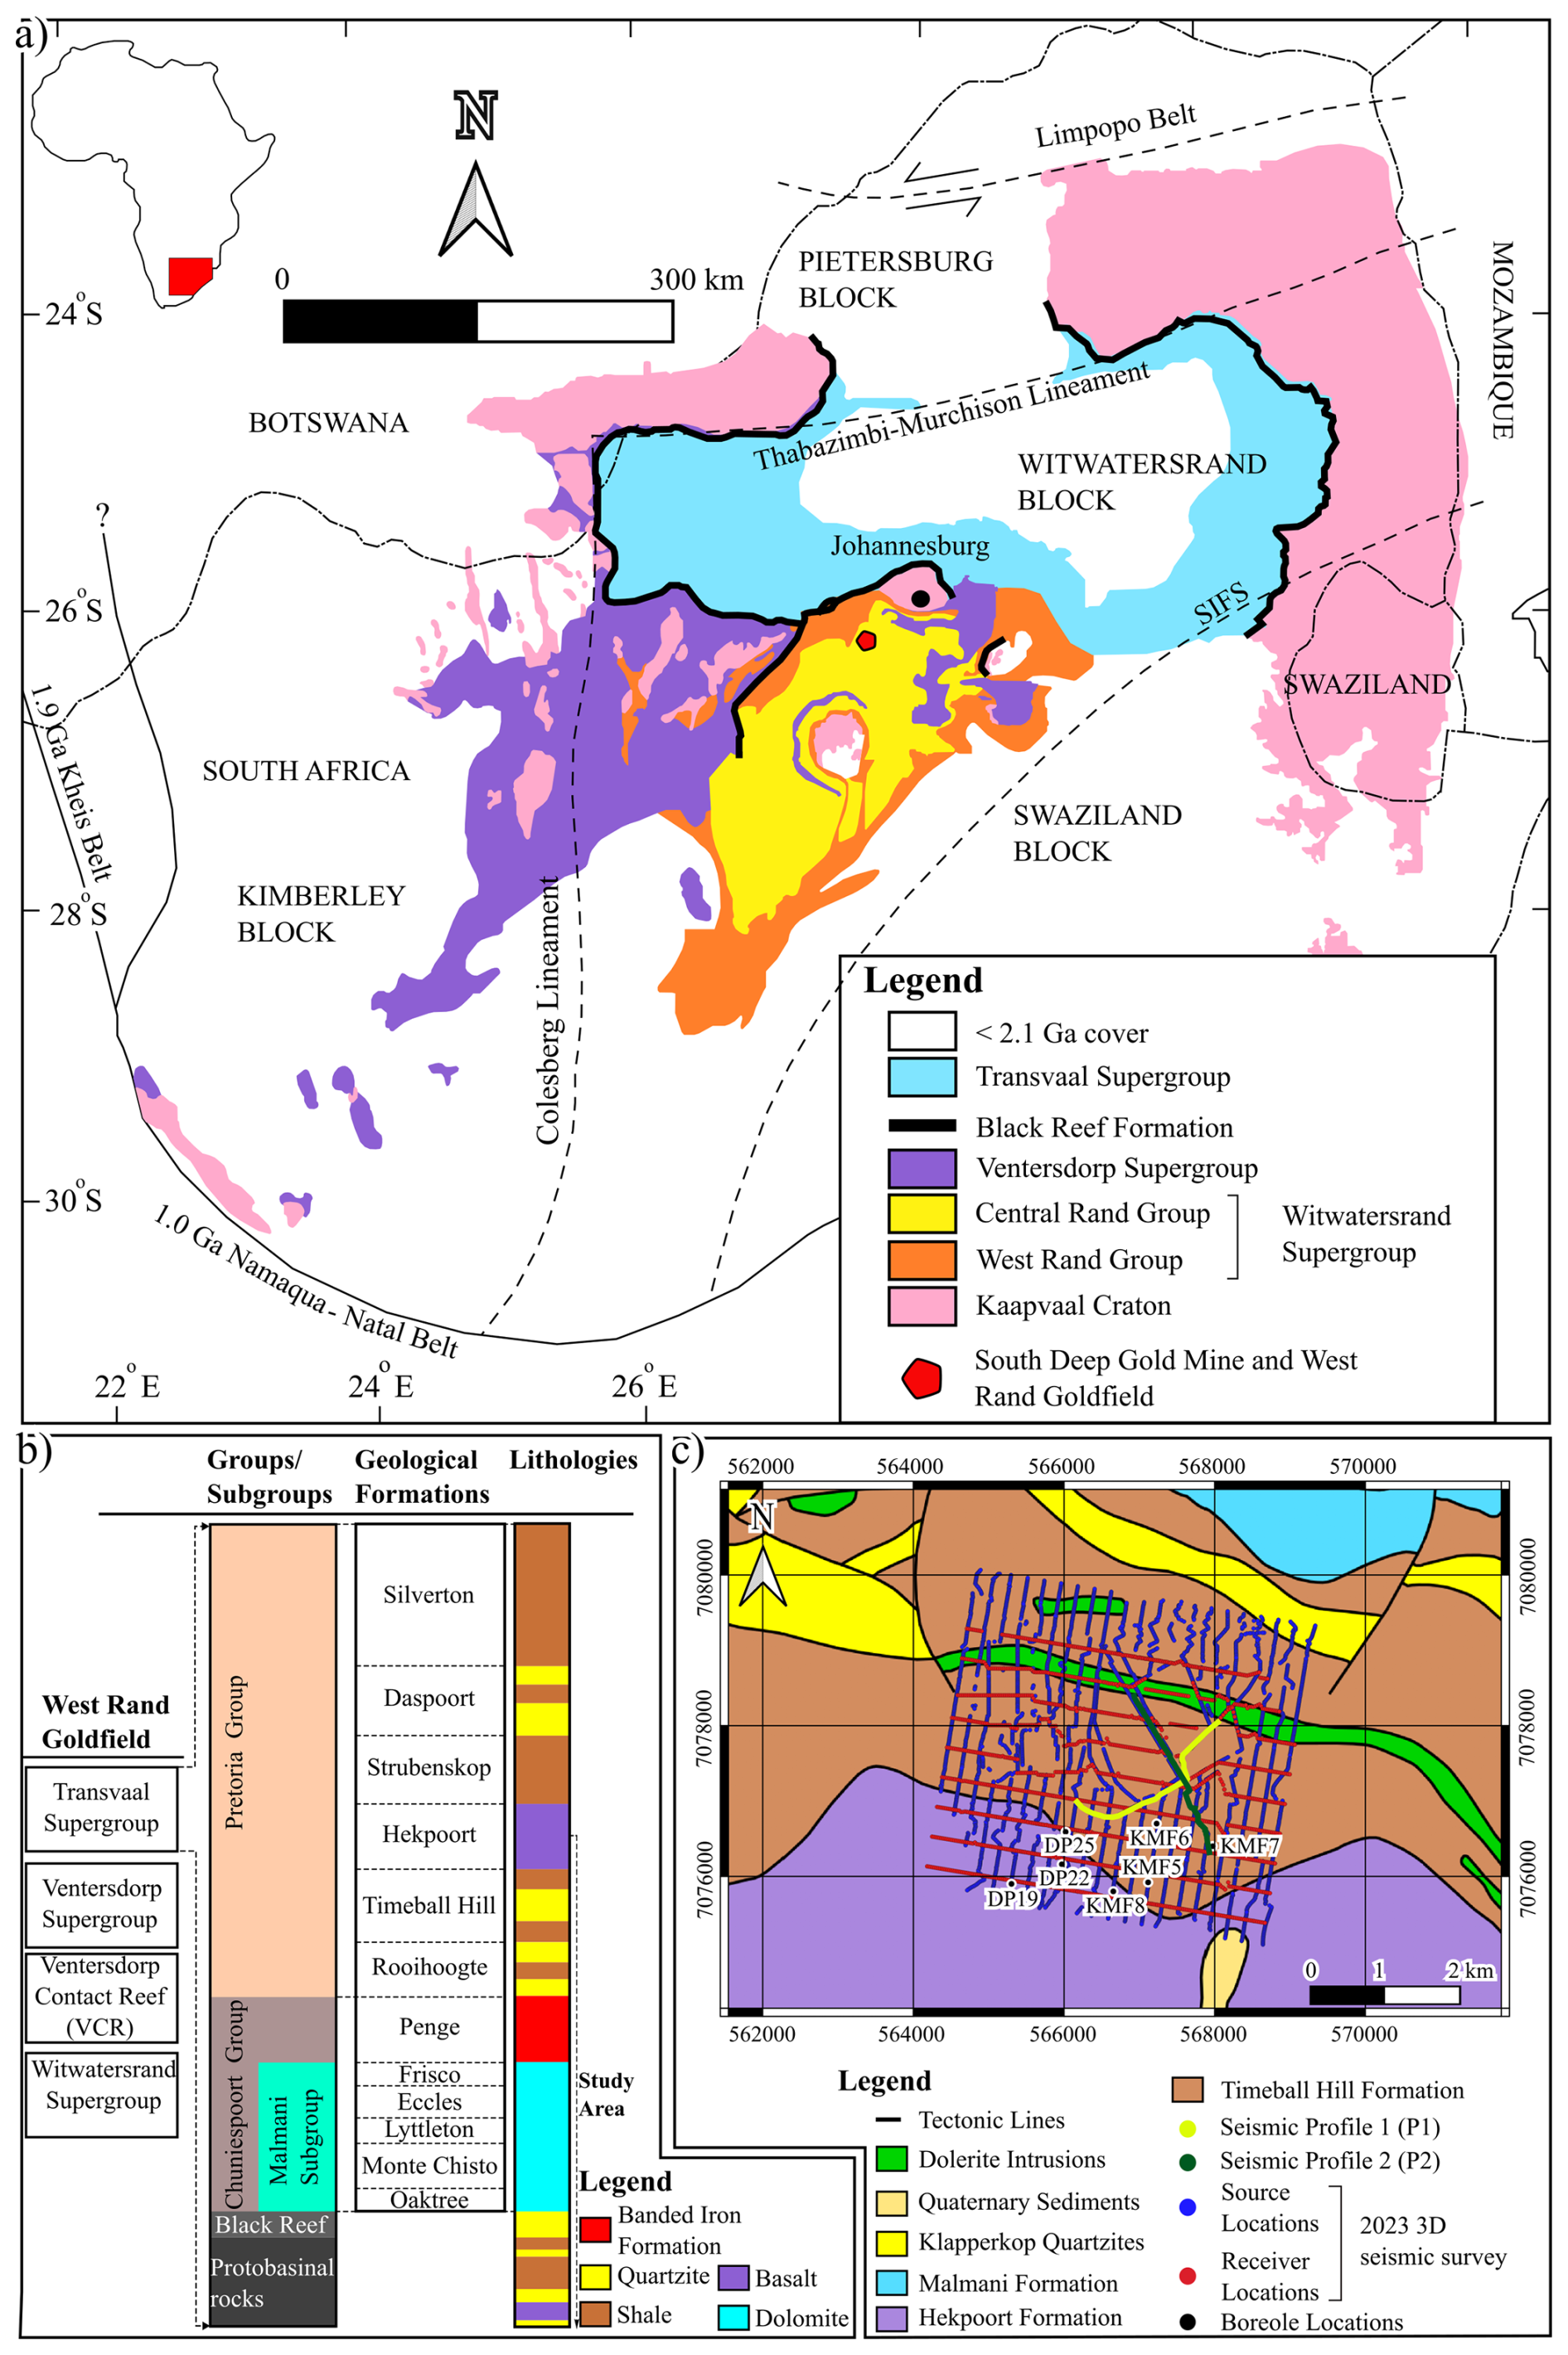
Figure 1(a) Simplified geological map showing both surface and subsurface distribution of the main Archaean stratigraphic units of the Kaapvaal Craton. The map shows the distributions of the Witwatersrand (comprising the West Rand and Central Rand groups), Ventersdorp, and the Transvaal supergroups (modified after Frimmel, 2014). (b) Generalized stratigraphic column of the uppermost rocks in the Transvaal Supergroup, indicating the uppermost rock units outcropping in the study area. (c) A simplified geological map of the study area showing the locations of the high-resolution 2D profiles (P1 – dark green and P2 – yellow), and the receiver (red) and source (dark blue) lines of the 2023 3D seismic survey acquired in the vicinity of the mine. The map is plotted using the WGS 1984 UTM Zone 35S coordinate system. SIFS stands for the Saddleback-Inyoka Fault System.
South Deep Gold Mine is situated southwest of the city of Johannesburg, in the southern portion of the West Rand Goldfield and on the northern margin of the Witwatersrand basin (Fig. 1a). The general geological setting of the West Rand Goldfield is formed by, from oldest to youngest, the Witwatersrand, Ventersdorp, and Transvaal supergroups (Kositcin and Krapež, 2004). The rocks of the Ventersdorp Supergroup are unconformably overlain by the Black Reef quartzite formation of the Chuniespoort Group belonging to the late Archean to early Proterozoic Transvaal Supergroup (Fig. 1b; Martin et al., 1998). The Transvaal Supergroup is a thick succession of chemical sedimentary rocks, including carbonates and banded iron formations, and clastic sedimentary rocks, hosting well-preserved interbedded and glaciogenic units (Eriksson et al., 1993b; Bekker et al., 2014) and world-class iron (Fe) and manganese (Mn) ores (Bekker et al., 2014; Smith and Beukes, 2016; Franchi, 2018) and comprises the lower Chuniespoort and upper Pretoria groups (Martin et al., 1998). The Chuniespoort Group dolomites consist of karst systems rich in water, which is primarily responsible for water inflow and inrush into mine shafts and mining levels (Van Niekerk and Van Der Walt, 2006).
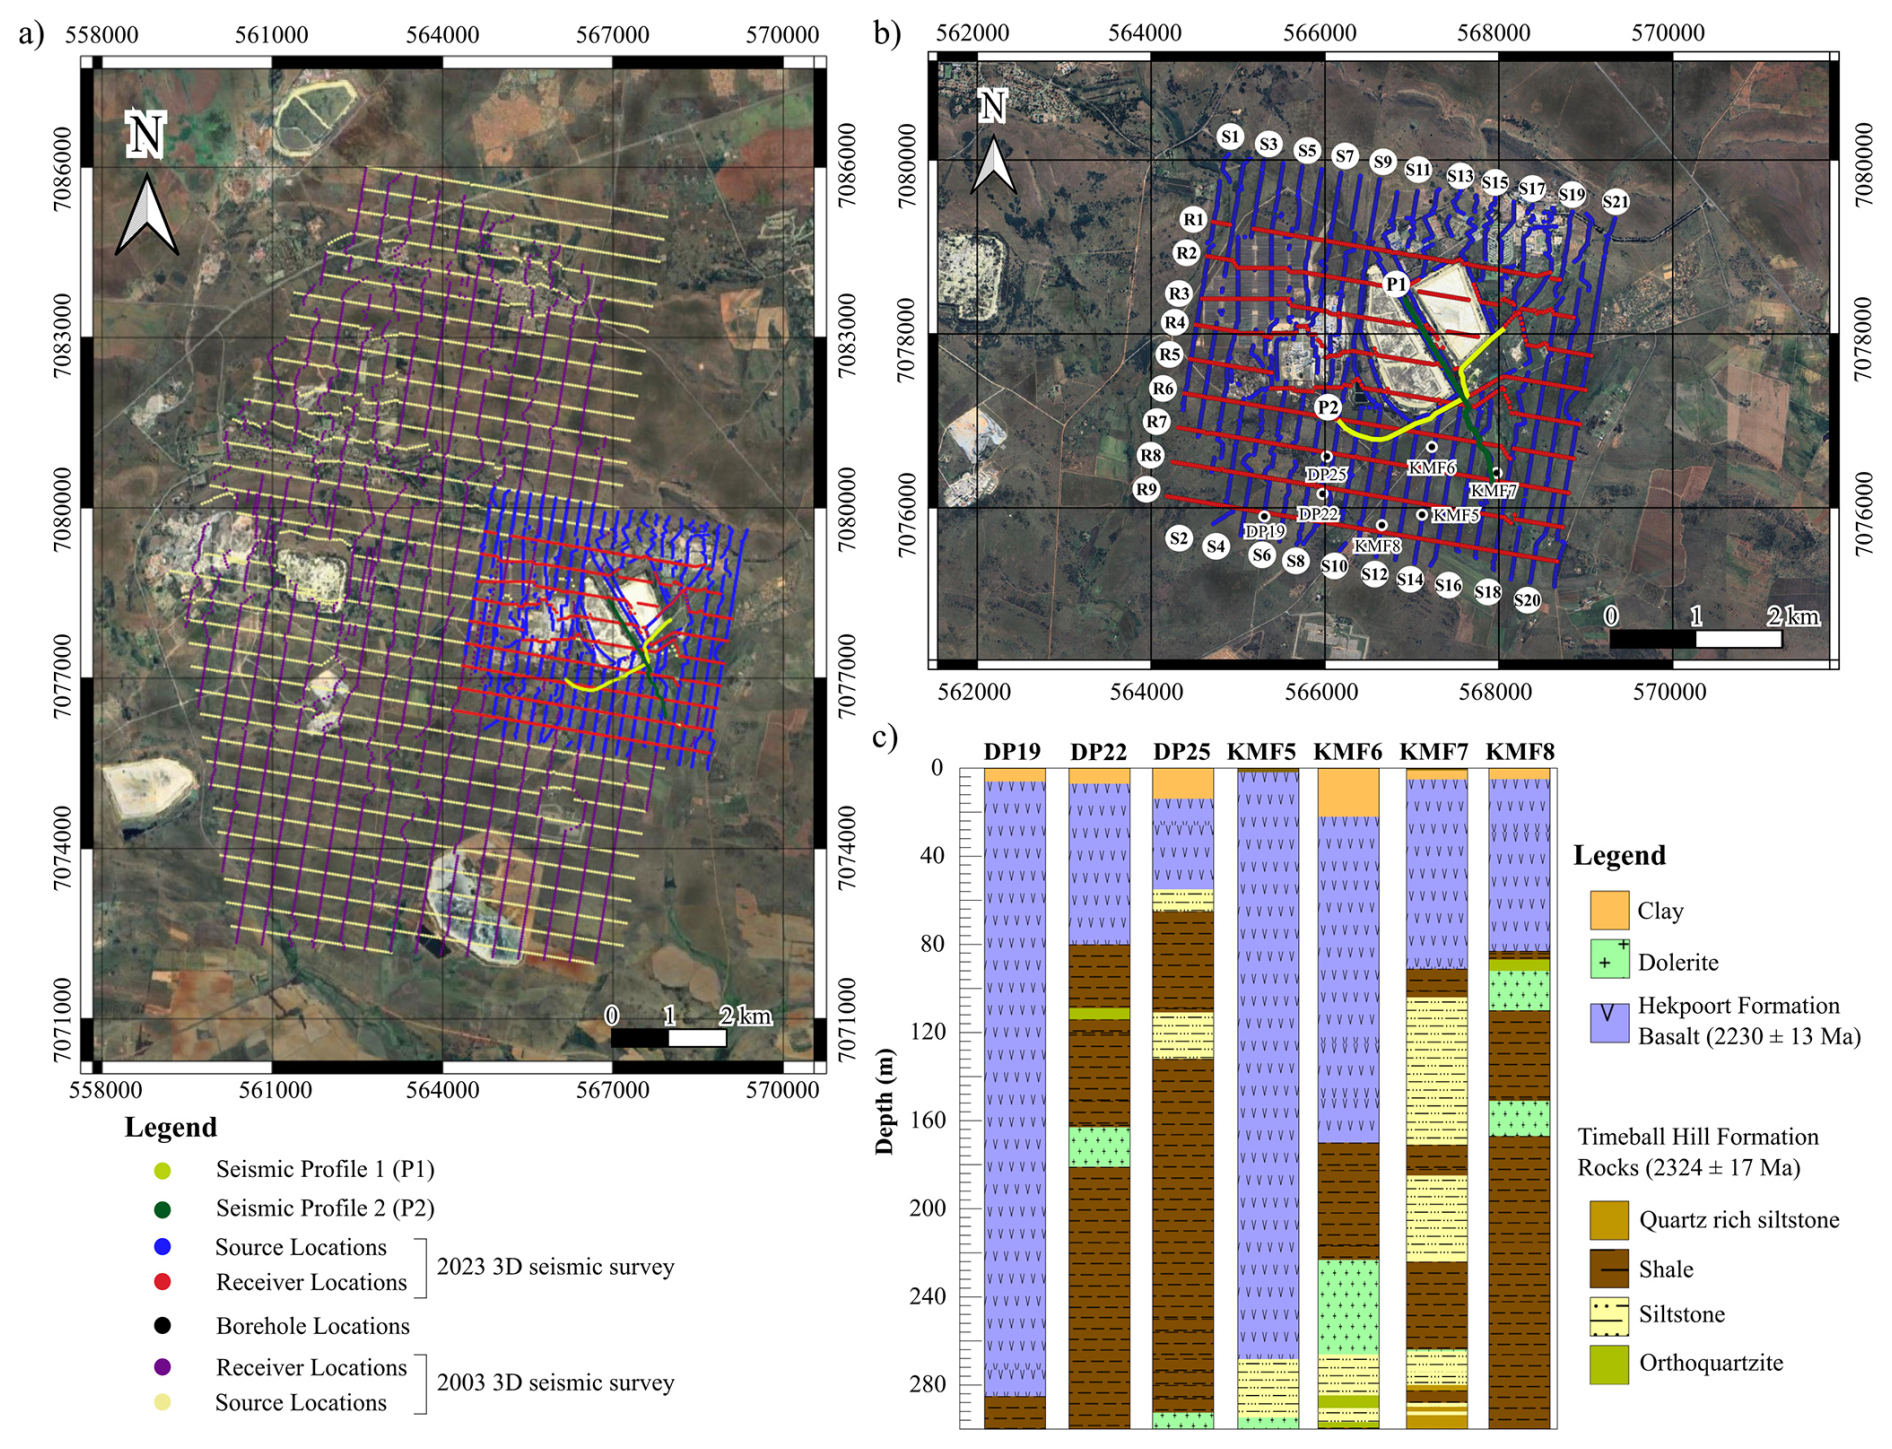
Figure 2(a) Satellite map showing the legacy 2003 3D Kloof-South Deep and the 2022–2023 3D South Deep Gold Mine seismic surveys. (b) Zoomed in satellite map of the 2023 South Deep seismic survey. Both satellite maps are plotted using the WGS 1984 UTM Zone 35S coordinate system. (c) Representative borehole logs located within the study area and showing the dominant rock types of the top 300 m.
Predominantly outcropping in the vicinity of South Deep Gold Mine are the rocks of the Pretoria Group (2350–2250 Ma; Walraven et al., 1990; Martin et al., 1998). The Pretoria Group forms the upper part of the Transvaal Supergroup and primarily consists of a succession of shales, quartzose and arkosic sandstones, and significantly interbedded basaltic-andesitic volcanic rocks, and subordinate conglomerates, diamictites, and carbonate rocks (Killick, 1992; McCarthy, 2006). In the northern portion of the South Deep Gold Mine, rocks of the Malmani Subgroup, Timeball Hill Formation, and Klapperkop Quartzites are present, while south of the mine, outcrops of basaltic lava and tuff of the Hekpoort Formation exist (Fig. 1c; Osburn et al., 2014). Figure 2a and b shows the locations of the legacy, large-offset 2003 and 2022–2023 2D and 3D seismic surveys. In Fig. 2c, we show the borehole logs drilled in proximity to the 2D and 3D seismic surveys acquired in the study area between 2022 and 2023 (see Figs. 1c and 2b for borehole location). The logs include the lithological variation within the top 300 m of the study area and are later used to constrain the interpretation of the SW results. The borehole logs illustrate that, south of the mine, the 2230 ± 13 Ma (Burger and Coertze, 1973) Hekpoort Formation basalts constitute the uppermost rocks and are underlain by the 2324 ± 17 Ma (Dorland, 2004) metasedimentary rocks of the Timeball Hill Formation (Fig. 2c). Tectonically, the Transvaal Supergroup is structurally complex and has undergone several episodes of deformation (Veevers, 1981; Vermaakt et al., 1994; Coward, 1995; Manzi et al., 2013a, b; Nwaila et al., 2022). In particular, the rocks of the Pretoria Group are displaced by post-Pretoria Group extensional and thrust faults that displace both the Pretoria Group rocks and the base of the Transvaal Supergroup (Cousins, 1962). The post-Pretoria Group tectonic events likely led to the reactivation of pre-Transvaal Supergroup faults, which are imaged in the 2003 legacy 3D seismic data and confirmed by underground drilling and mapping (Manzi et al., 2013a, b; Nwaila et al., 2020). Movement along faults inevitably resulted in the creation of numerous fracture systems, which can be observed underground (if exposed). The study area is also characterised by numerous sills and dykes that intruded at different geological ages and have been subjected to several investigations. The sills and dykes are of various ages, such as known post-Karoo dykes of pre-Cretaceous and Cretaceous age (145–66 Ma), Karoo (150 Ma), Pilanesberg (1.30 Ga), Vredefort meteorite impact event (2.05 Ga), the Bushveld Igneous Complex magmatism (2.03 Ga), Transvaal (2.20 Ga), and Ventersdorp (2.60 Ga) (Frimmel, 2014; Frimmel and Nwaila, 2020). Current mining activities can also reactivate faults and dykes, causing large seismic events, and promoting water infiltration, movement, and circulation (Masethe et al., 2023). The intersection of water conduits during mining often negatively affects the productivity of the mine and increases the safety risk to mine personnel and infrastructure. Thus, their delineation is important in ensuring mine safety, longevity, and increased productivity.
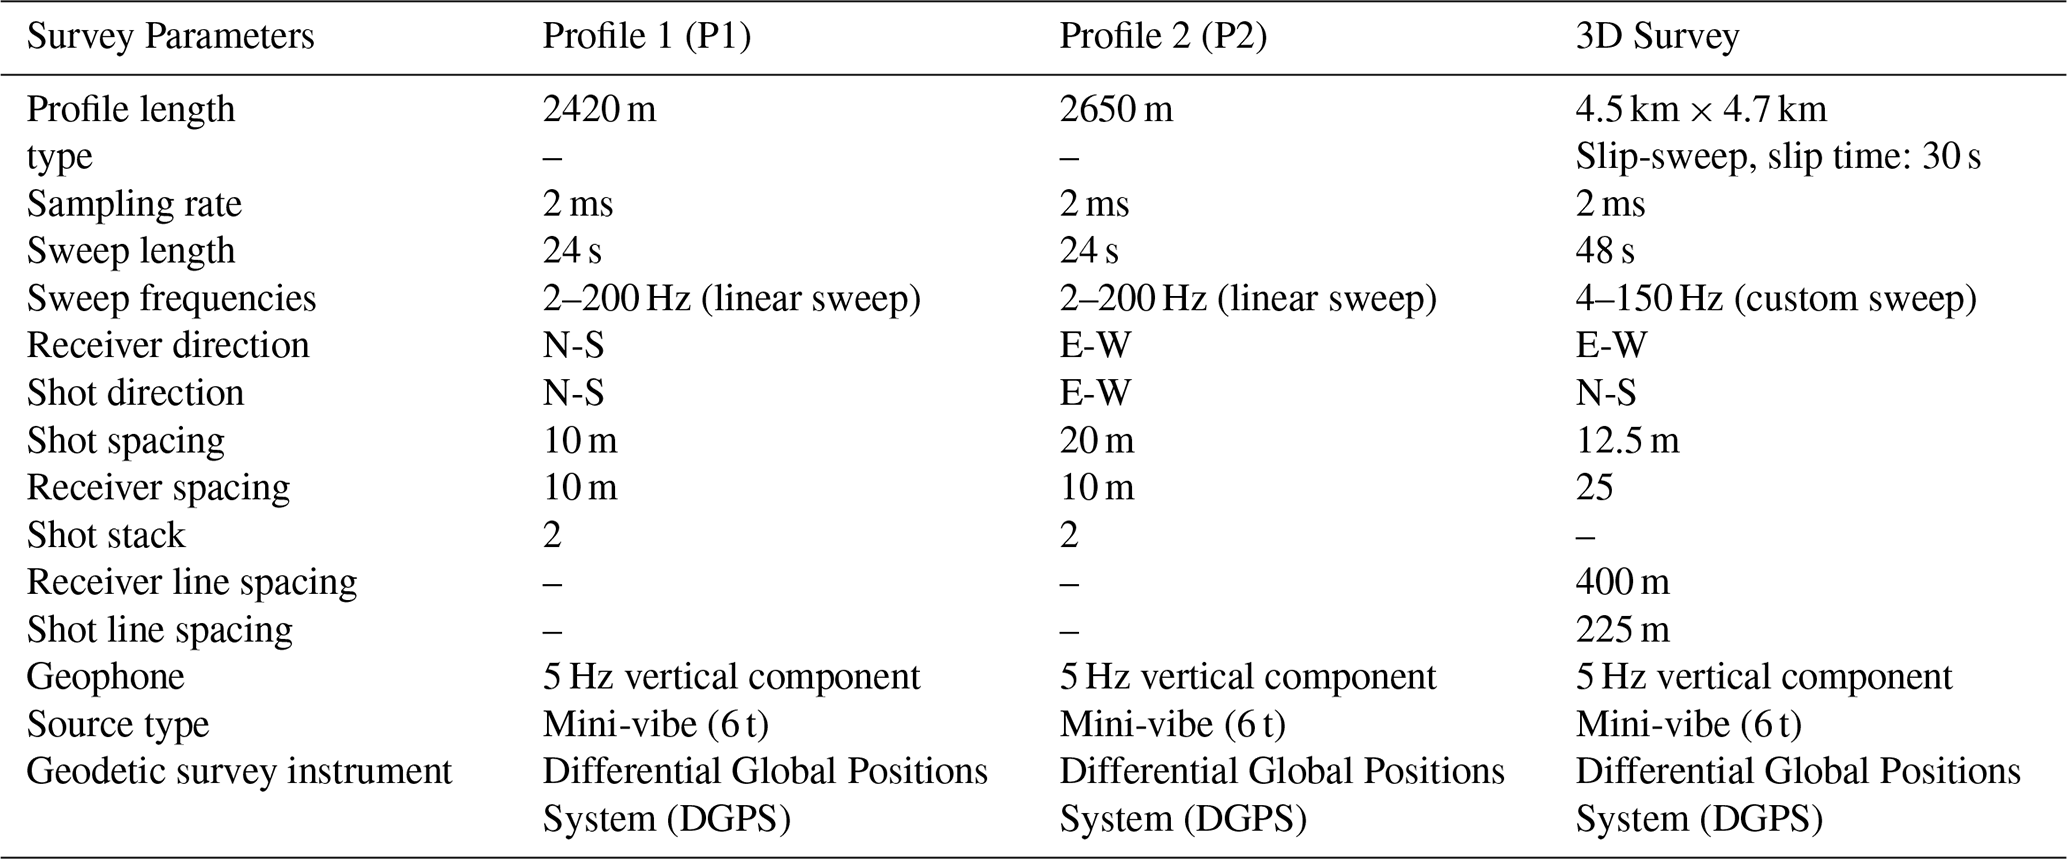
Table 1Acquisition parameters of the 2D and 3D surveys conducted at South Deep Gold Mine in 2022–2023.
3.1 Seismic data acquisition
Active-source surface 2D and 3D seismic data were acquired between 2022 and 2023 within the framework of the ERA-MIN3 Future Project, aimed at imaging the subsurface geology and the orebody at South Deep Gold Mine. The acquired two 2D high-resolution seismic lines (P1 and P2, Figs. 1c and 2a, b) were positioned such that they traversed the surface zone directly above the mine tunnels, located at a depth of ∼ 3.5 km. The 3D seismic survey covers a wider area of approximately 4.4 km by 4.7 km, with the mine tunnels located at the centre of the survey area. The acquisition parameters are summarized in Table 1. The 2D profiles were acquired using a 6 t seismic vibrator (mini-vibe) employing a linear sweep of 24 s and a sweep frequency ranging from 2–200 Hz. P1 is north-south orientated and has a profile length of 2420 m, while P2 is east-west orientated and has a profile length of 2650 m. The two profiles were acquired using 243 and 266 wireless remote acquisition units spaced 10 m apart and connected to 5 Hz vertical component geophones, respectively. Two sweeps were generated at every receiver and every second receiver location for P1 and P2, respectively.
The 3D seismic survey was acquired using two broadband mini-vibes employing a slip-sweep acquisition technique with a slip time of 30 s, a single linear sweep of 48 s, and a frequency ranging from 4 to 150 Hz. The grid consisted of 9 receiver lines (north-south orientated and 400 m apart), with a receiver spacing of 25 m, and 21 source lines (east-west orientated and 225 m apart), and with a source spacing increment of 12.5 m, forming an orthogonal acquisition patch. The data were recorded using a total of 1605 wireless remote acquisition units connected to 5 Hz vertical component geophones and consisted of 3725 shot points.
The units used to record both the 2D and 3D surveys were programmed to switch on at 08:00 a.m. and off at 17:00 p.m., South African time, during which the seismic data were recorded in continuous mode, at a 2 ms sampling rate. After the completion of the survey acquisition stage, all the separate sweeps were later isolated and 6 s of the records were extracted from the recording units using the GPS time tagged for each sweep. The layouts of the surveys, however, were distorted by natural (river and swamps) and man-made features (mining infrastructure, two large tailings dams, roads, and nearby settlements) present in the vicinity of the mine, thus, sharp turns and gaps were introduced in the data (crooked profiles; Figs. 1c and 2b). The study area is characterized by a significant but gentle E-W elevation variation of approximately 100 m in the southern portion, a gentle 10 m E-W elevation variation in the northern section, and a 20 m N-S elevation variation in the middle section of the study area. Throughout the study area, the bedrock is largely covered by residual soil. The 2023 South Deep Gold Mine seismic survey was designed to overlap with the 2003 Kloof-South Deep survey, which was designed to image the deep-seated Ventersdorp Contact (VCR) orebody and major geological structures to assist with mine planning and development (Fig. 2a, Manzi et al., 2012a). The acquisition parameters and processing sequence of the 2003 3D seismic survey are summarized by Manzi et al. (2012a, b). In summary, the survey was acquired using 2 vibroseis trucks (sweep: linear, 16 s, 12–96 Hz) over an area of approximately 96 km2 with the receiver spacing of 50 m, receiver line spacing of 400 m, shot spacing of 50 m, and shot line spacing of 450 m.
3.2 Data processing
The data were subdivided into three datasets: the two 2D lines (P1 and P2); nine E-W oriented receiver lines (R1–R9) from the 3D grid; and twenty-one S-N oriented source (shot) lines (S1–S21) from the 3D grid (Fig. 2b). The source line dataset was generated from the receiver line dataset by using the reciprocity principle to generate common receiver gathers (CRGs) along the source lines. The reciprocity principle states that a wavefield measured at point A generated by a point source located at point B is equal to the wavefield measured at point B generated by a point source located at point A (Knopoff and Gangi, 1959; Claerbout and Green, 2008; Katou et al., 2017). In seismic investigations, it illustrates that the same seismogram will be recorded if seismic source and receiver locations are interchanged, irrespective of the geometrical subsurface complexity, as long as the geometry of obstacles and other bodies in the vicinity of the source and receiver are fixed (Claerbout and Green, 2008). The implementation of the reciprocity theorem was achieved by selecting receivers situated along and near source lines and using them to generate CRGs by projecting waveforms recorded at the receivers to their respective shot locations.
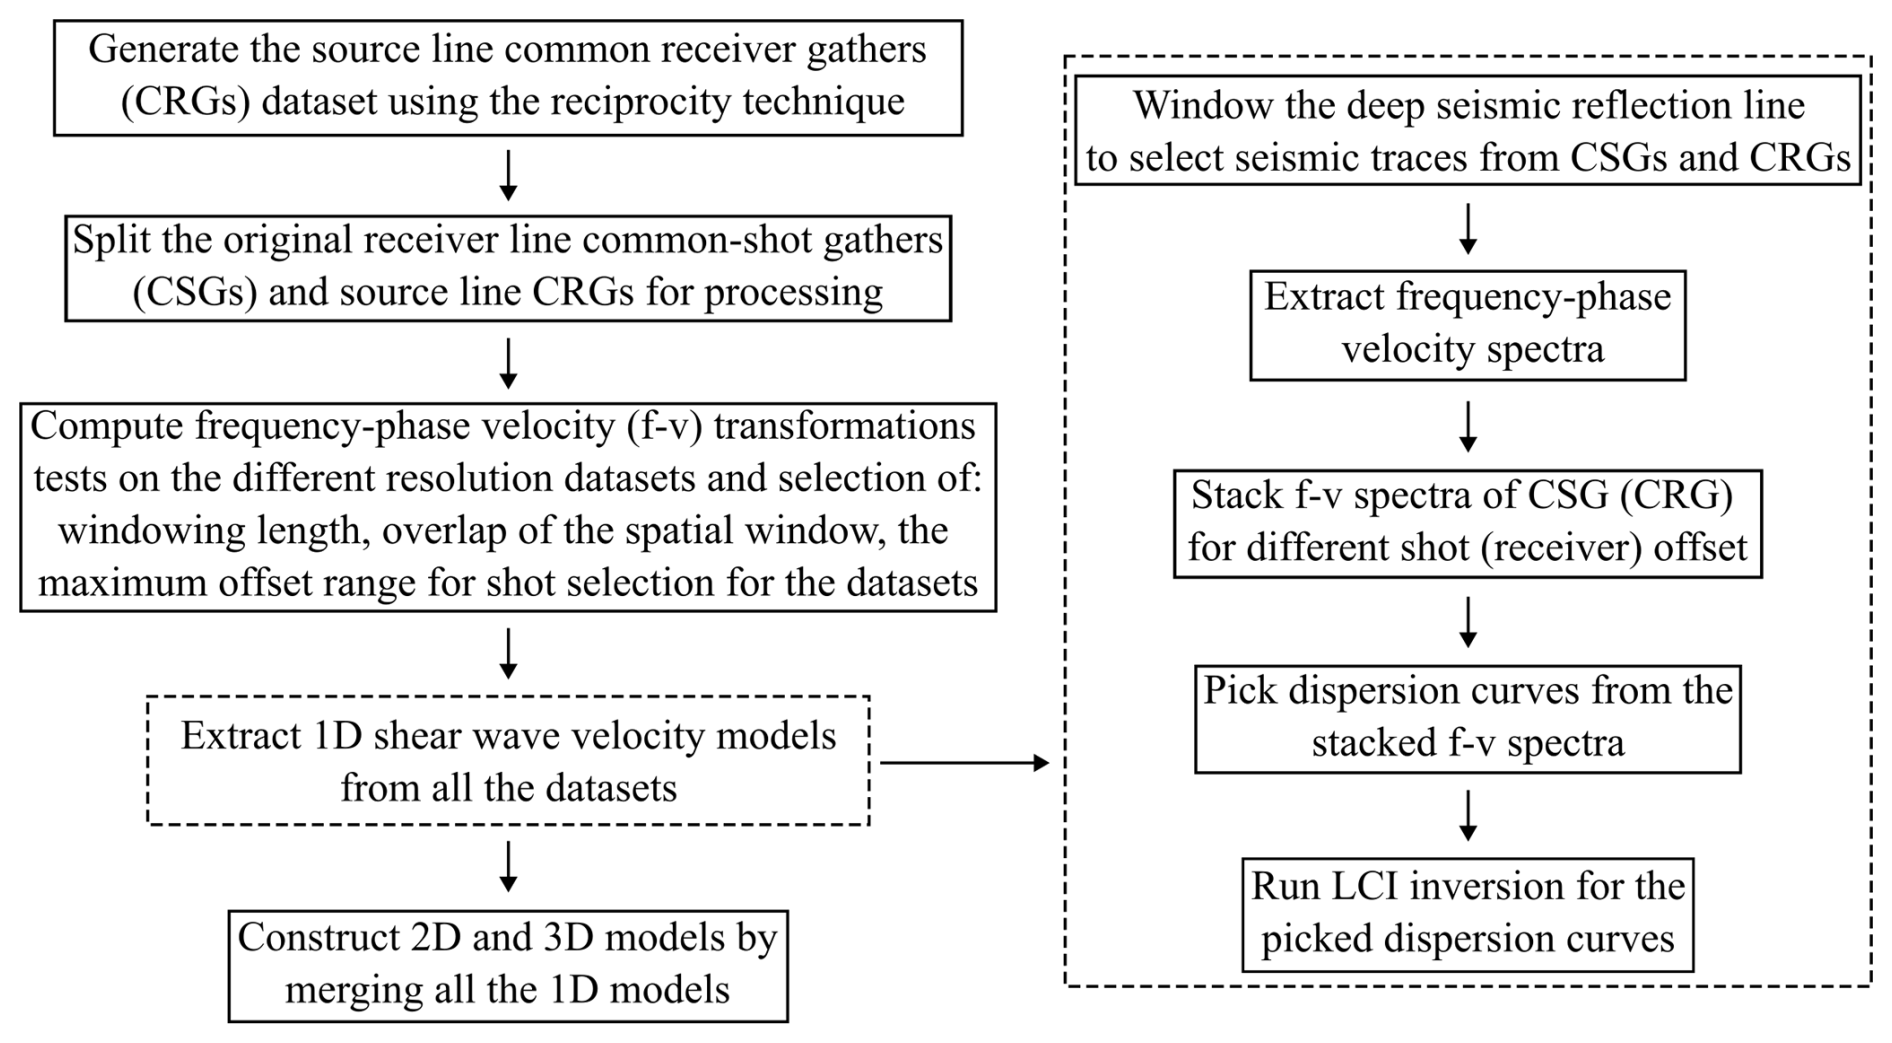
Table 2Windowing parameters used for the optimal dispersion curve extraction.
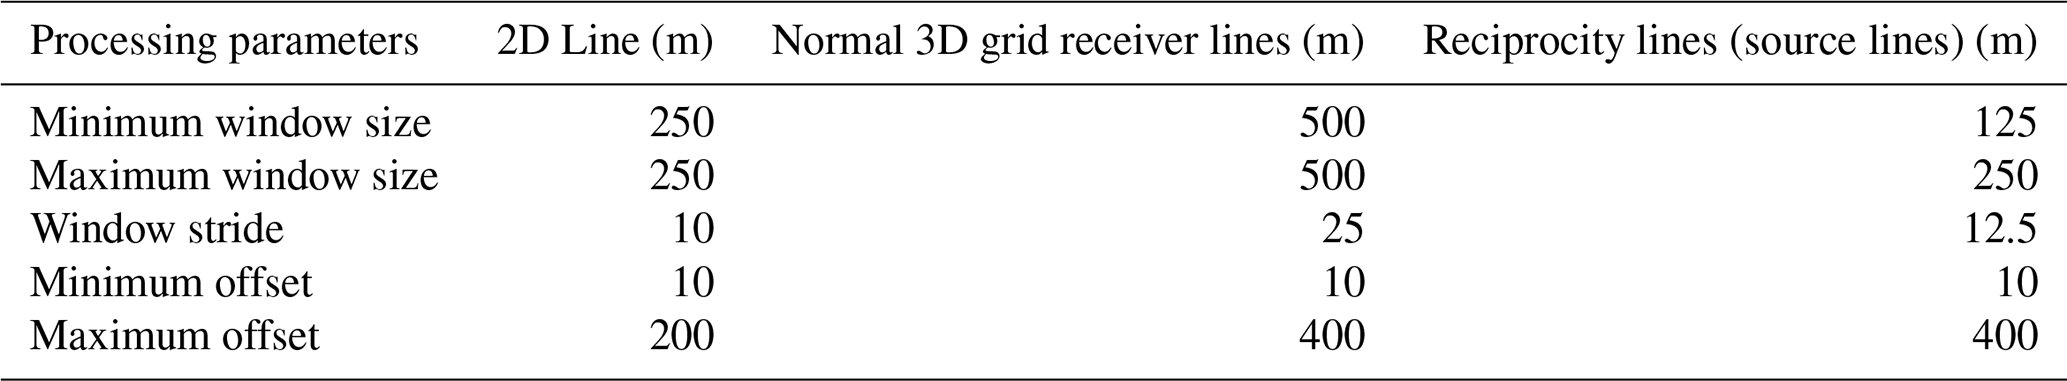
The MASW technique was applied to the three seismic datasets described above using a workflow based on the method by Socco et al. (2009), where a moving spatial window is used along the seismic lines to retrieve a set of local SW dispersion curves (DCs). Figure 3 gives a schematic summary of the entire processing workflow. Generally, the raw data undergo a data preconditioning that consists of splitting the profiles characterized by severe sharp turns into separate segments close to straight lines, as severe profile crookedness distorts the phase shift variation between neighboring traces and results in spurious velocities (Lin et al., 2017). The optimal MASW processing parameters, i.e., spatial window length, overlap of the moving spatial window, and the maximum offset range for shot selection, were defined to obtain a good compromise between spectral and spatial resolution, and the optimal signal-to-noise ratio for the dispersion curve analysis by doing some tests (Socco et al., 2009). The spatial window needs to be long enough to ensure the recording of longer wavelengths of interest (i.e., the target depth) and small enough not to violate the homogeneous media assumption assumed underneath the receiver spread. Meanwhile, the minimum and maximum offset ranges are chosen such that they minimize near-and far-field effects and improve the signal-to-noise ratio. For each window position, the spectra resulting from different shots falling within the selected offset ranges were computed using the phase shift method (Park et al., 1998) and stacked to improve the signal-to-noise ratio of the dispersion image (Grandjean and Bitri, 2006; Neducza, 2007). From the stacked spectra, the maximum spectral amplitude at each frequency, deemed to correspond with the energy of the SW fundamental mode, was automatically searched to obtain the local DCs. The DCs were picked through an automatic maxima search and manually cleaned to ensure high-quality DC picks. The positions of the DCs were assigned as the center of the windows for which the dispersion spectrum was computed.
In our case, the three datasets have different spatial sampling characteristics that lead to different processing parameter choices (Table 2). Due to the receiver spacing, which is 25 m for receiver lines, 12.5 m for shot lines, and 10 m for the 2D lines, the spatial windows used to process the data sets are large with respect to usual near-surface SW surveys. Typically, for near-surface investigations, data that are acquired on purpose for SW analysis would use receiver spacing of 2–5 m. In this case, we use the 3D seismic data acquired for deep exploration and the survey design is not optimized for SW. This imposes the use of processing windows larger than those generally used in traditional SW surveys, which could result in more local anomalies being suppressed. The spatial sampling is also critical, since a large spatial sampling can generate aliasing. In the present dataset, given the high velocities and the limit on high-frequency content, we do not extract wavelengths smaller than the spatial sampling. Moreover, surface wave DCs can be extracted at wavenumbers beyond the Nyquist wavenumber (see Socco and Strobbia, 2004, for details), hence we do not consider spatial aliasing a critical aspect for the processing. The 2D lines (P1 and P2) are those with the denser spatial sampling (10 m receiver spacing) and shot layout (10–20 m shot spacing). The utilization of a dense spatial sampling and shot layout allowed the attainment of high signal-to-noise spectra and broad band DCs on 250 m windows and a 200 m max offset range. While for the larger 2023 3D seismic survey profiles (i.e., receiver lines R1–R9) the shortest window size that provided good quality DCs was 500 m. The shift of the moving window position was set equal to the receiver spacing and this led to different densities of DCs along the lines for the three datasets. For the two datasets extracted from the 3D grid, the most critical aspect was related to the small number of available sources in line with the receivers (or the opposite for the Common Receiver Gathers, CRGs). The shot spacing along receiver lines is 225 m (distance between shot lines), while for the CRGs the “shot” spacing is 400 m (distance between receiver lines) leading to very limited stacking of the spectra.

Figure 4(a) Shot gather from the seismic profile P2, showing the window position (red dashed rectangle) that is later transformed into the frequency-phase velocity domain. A zoomed in window showing the surface wave trend visible in the record is shown, and its location is indicated using a dashed black rectangle. (b) Frequency-phase velocity spectrum from P2 obtained after transforming the highlighted data in (a), where the black dots depict the picked dispersion curve. (c) Picked surface wave dispersion curves for profiles P1 (dark blue) and P2 (red), plotted as a function of frequency and phase-velocity. In (d) and (e), surface wave dispersion curves for profiles P1 and P2 are plotted as a function of wavelength depth and spatial location.
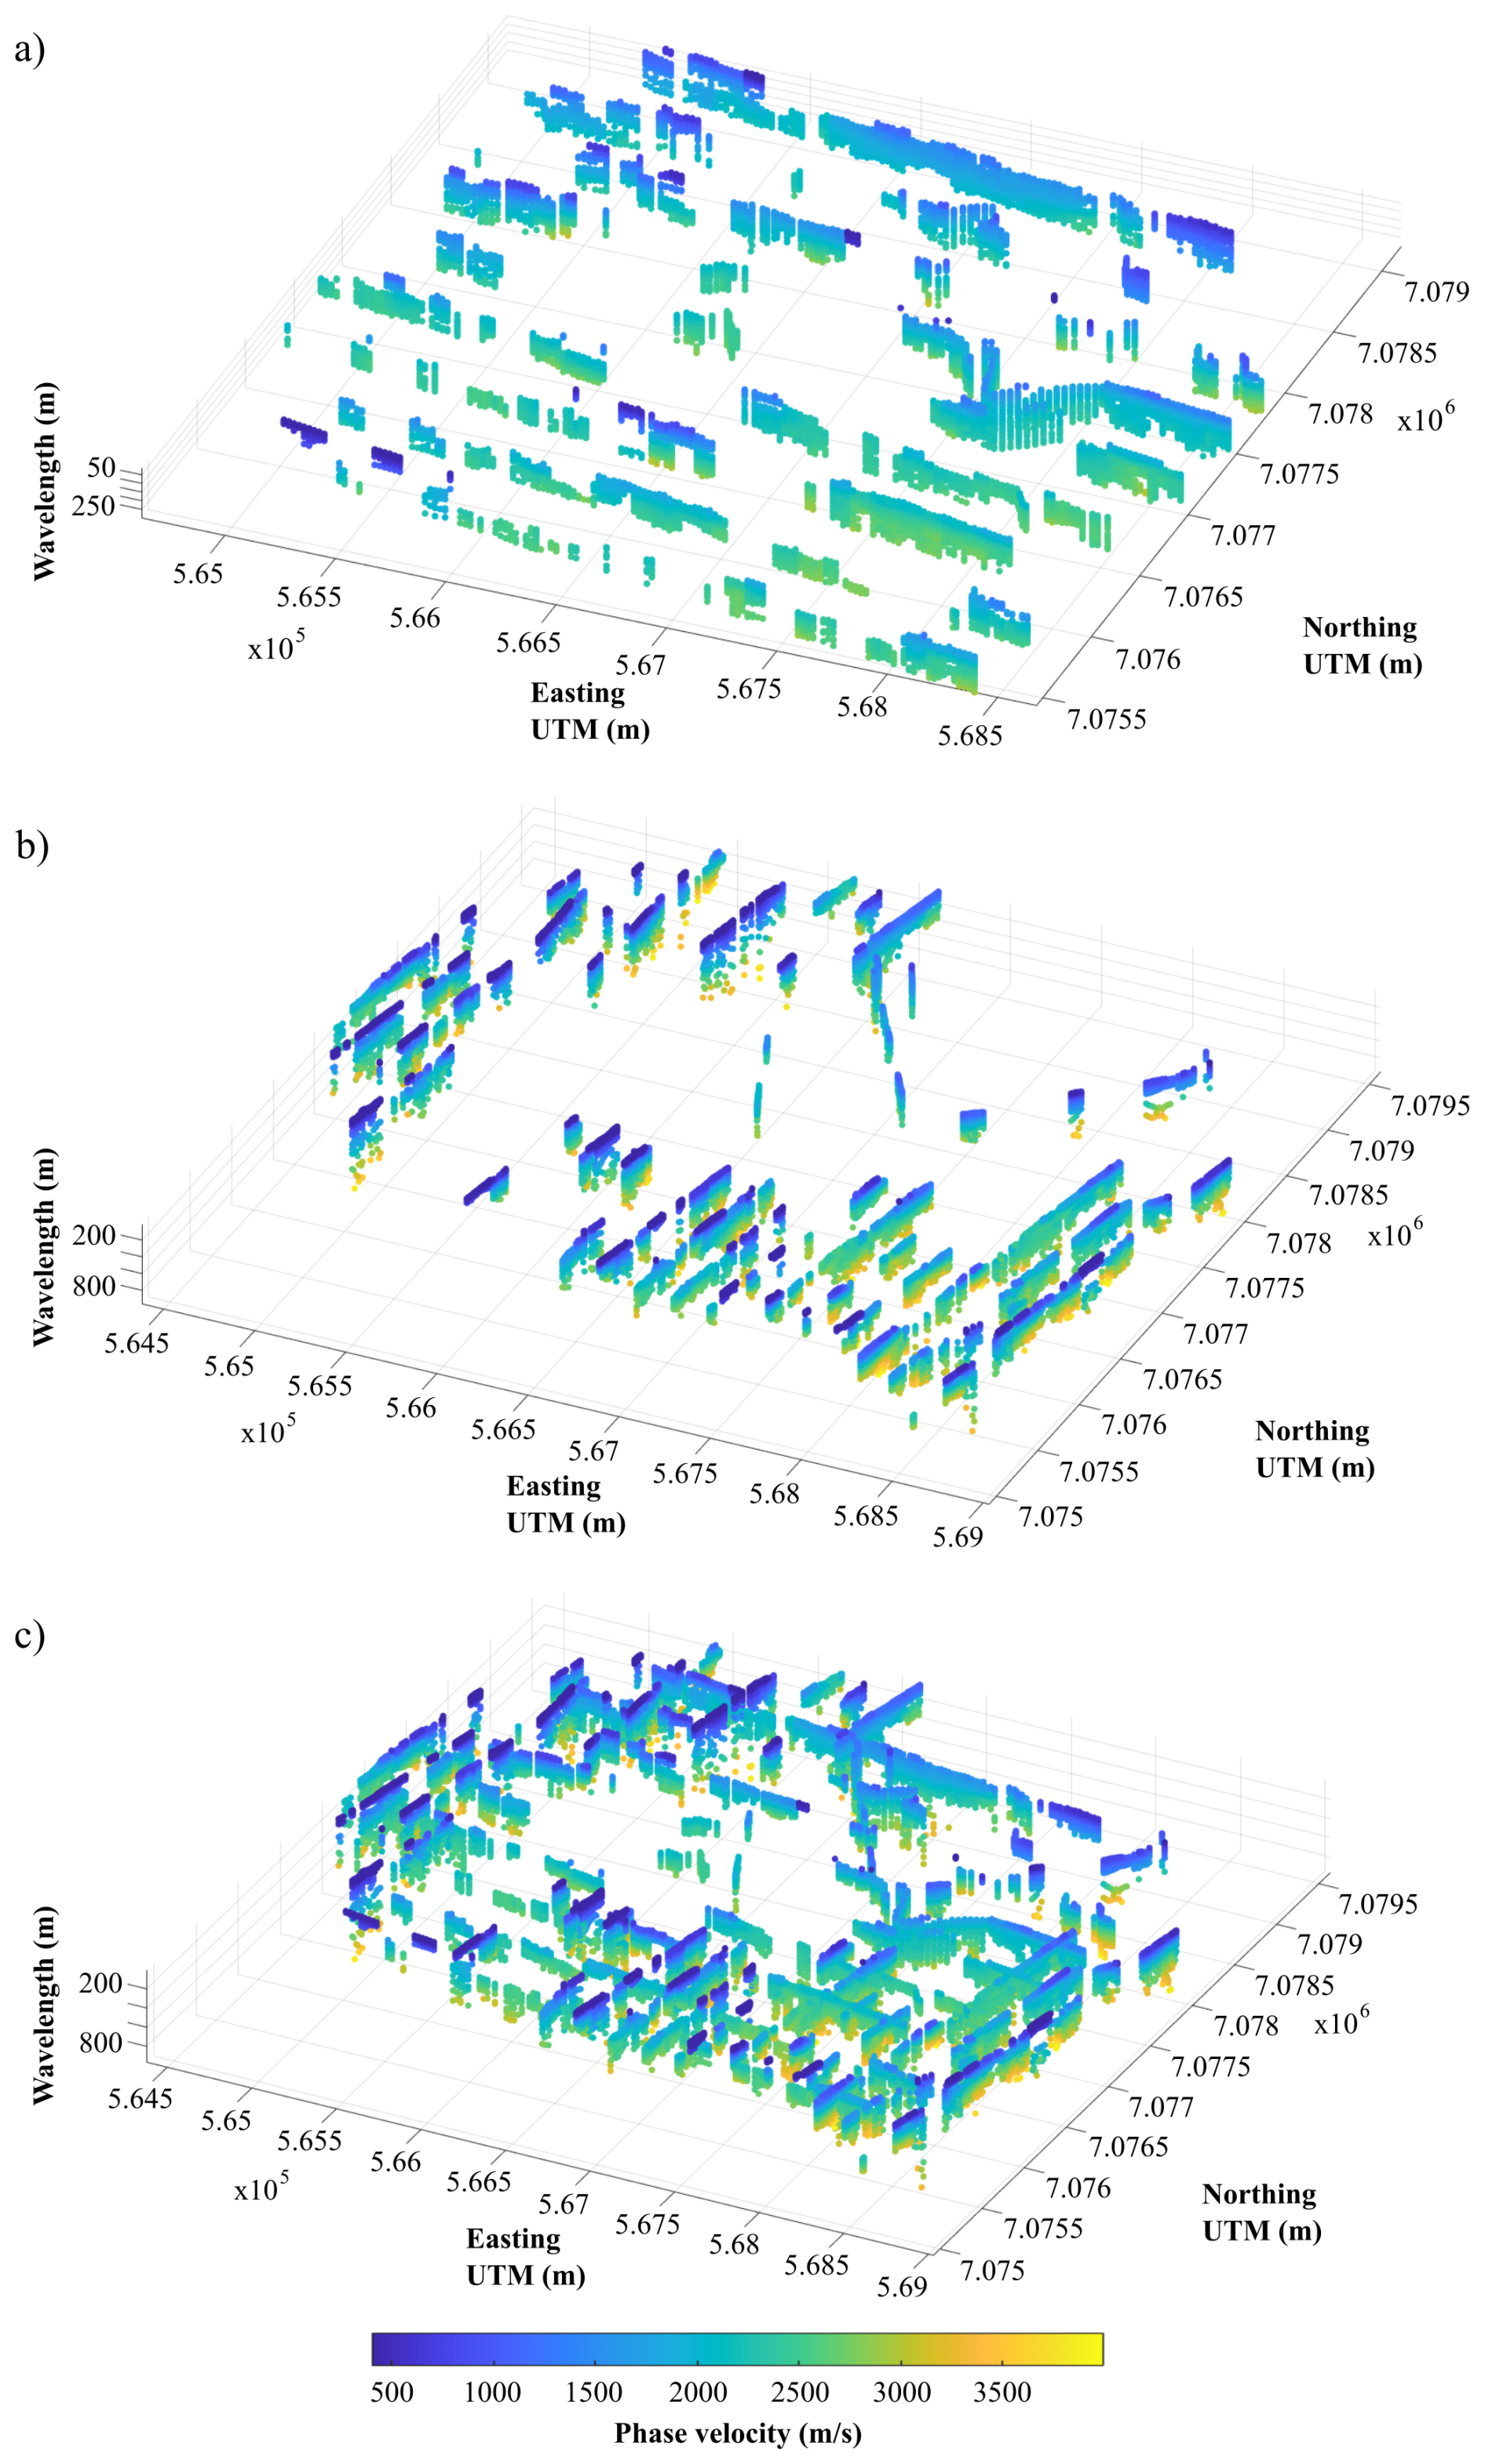
Figure 5Dispersion curves picked along the (a) receiver and (b) source lines. (c) Combined receiver and source line dispersion curves. The dispersion curves are plotted as a function of wavelength and spatial location.
Figure 4a shows an example of a shot gather obtained in the study area, along profile P2. The seismic record in Fig. 4a contains a broad band ground roll that is visible at near-offset traces. Figure 4b gives the frequency-phase velocity spectrum obtained after transforming within the red dashed rectangle. The spectrum was obtained after stacking spectra from 5 different shots within the set offset range, where the DC (fundamental mode) is picked as the spectral maxima. Figure 4c shows all the picked DCs for P1 and P2, while Fig. 4d and e display them as a function of wavelength at their spatial location along the lines. In Fig. 4d and e, it is remarkable that long wavelengths, i.e., high investigation depths, are achieved thanks to the high velocities prevalent at the site. Figure 5a–c show the DCs that were picked along the 3D grid receiver lines, source lines, and receiver and source lines combined, respectively.
A total number of 2557 DCs were picked along the 3D grid; 767 of the DCs were extracted along receiver lines, while 1790 (more than twice) were extracted along source lines. The application of the reciprocity principle enabled the DC density to be increased by ∼ 230 % rounding-off. In the retrieved DC datasets, gaps are present in areas: (1) where the stacked spectra did not show a clear fundamental mode, thus no DC could be picked, which is possibly due to the presence of sharp lateral variations within the subsurface, (2) where data could not be acquired due to the presence of mining infrastructure (e.g., tailings dams, solar panels, satellites, roads, etc.), and (3) where source and receiver lines are distorted by mining infrastructure.

Figure 6(a) Example of a common receiver gather obtained along source line S19. (b) Receiver and source line f-v spectra obtained at intersection locations I–VI.
Figure 6a gives an example of a CRG obtained for line S19. To validate the dispersion curves obtained from the CRG processing, we compared the spectra located at the crossing point for source and receiver lines (Fig. 6b). The comparison needs to be evaluated taking into consideration that the spectra are computed along two orthogonal directions and therefore the considered wavefields sample different portions of the subsurface that, given the large window length, can lead to different phase velocities. We therefore do not expect the spectra to be necessarily equal. In general, there is a relatively good agreement between the spectra of the two orthogonal lines and spectra computed from CRGs are broader band than those computed along receiver lines. This is attributed to the traces in CRGs having a smaller spacing (Table 1). Meanwhile, the spectra from the receiver lines have greater spectral resolution due to the spectra along these lines being computed using larger spatial windows.
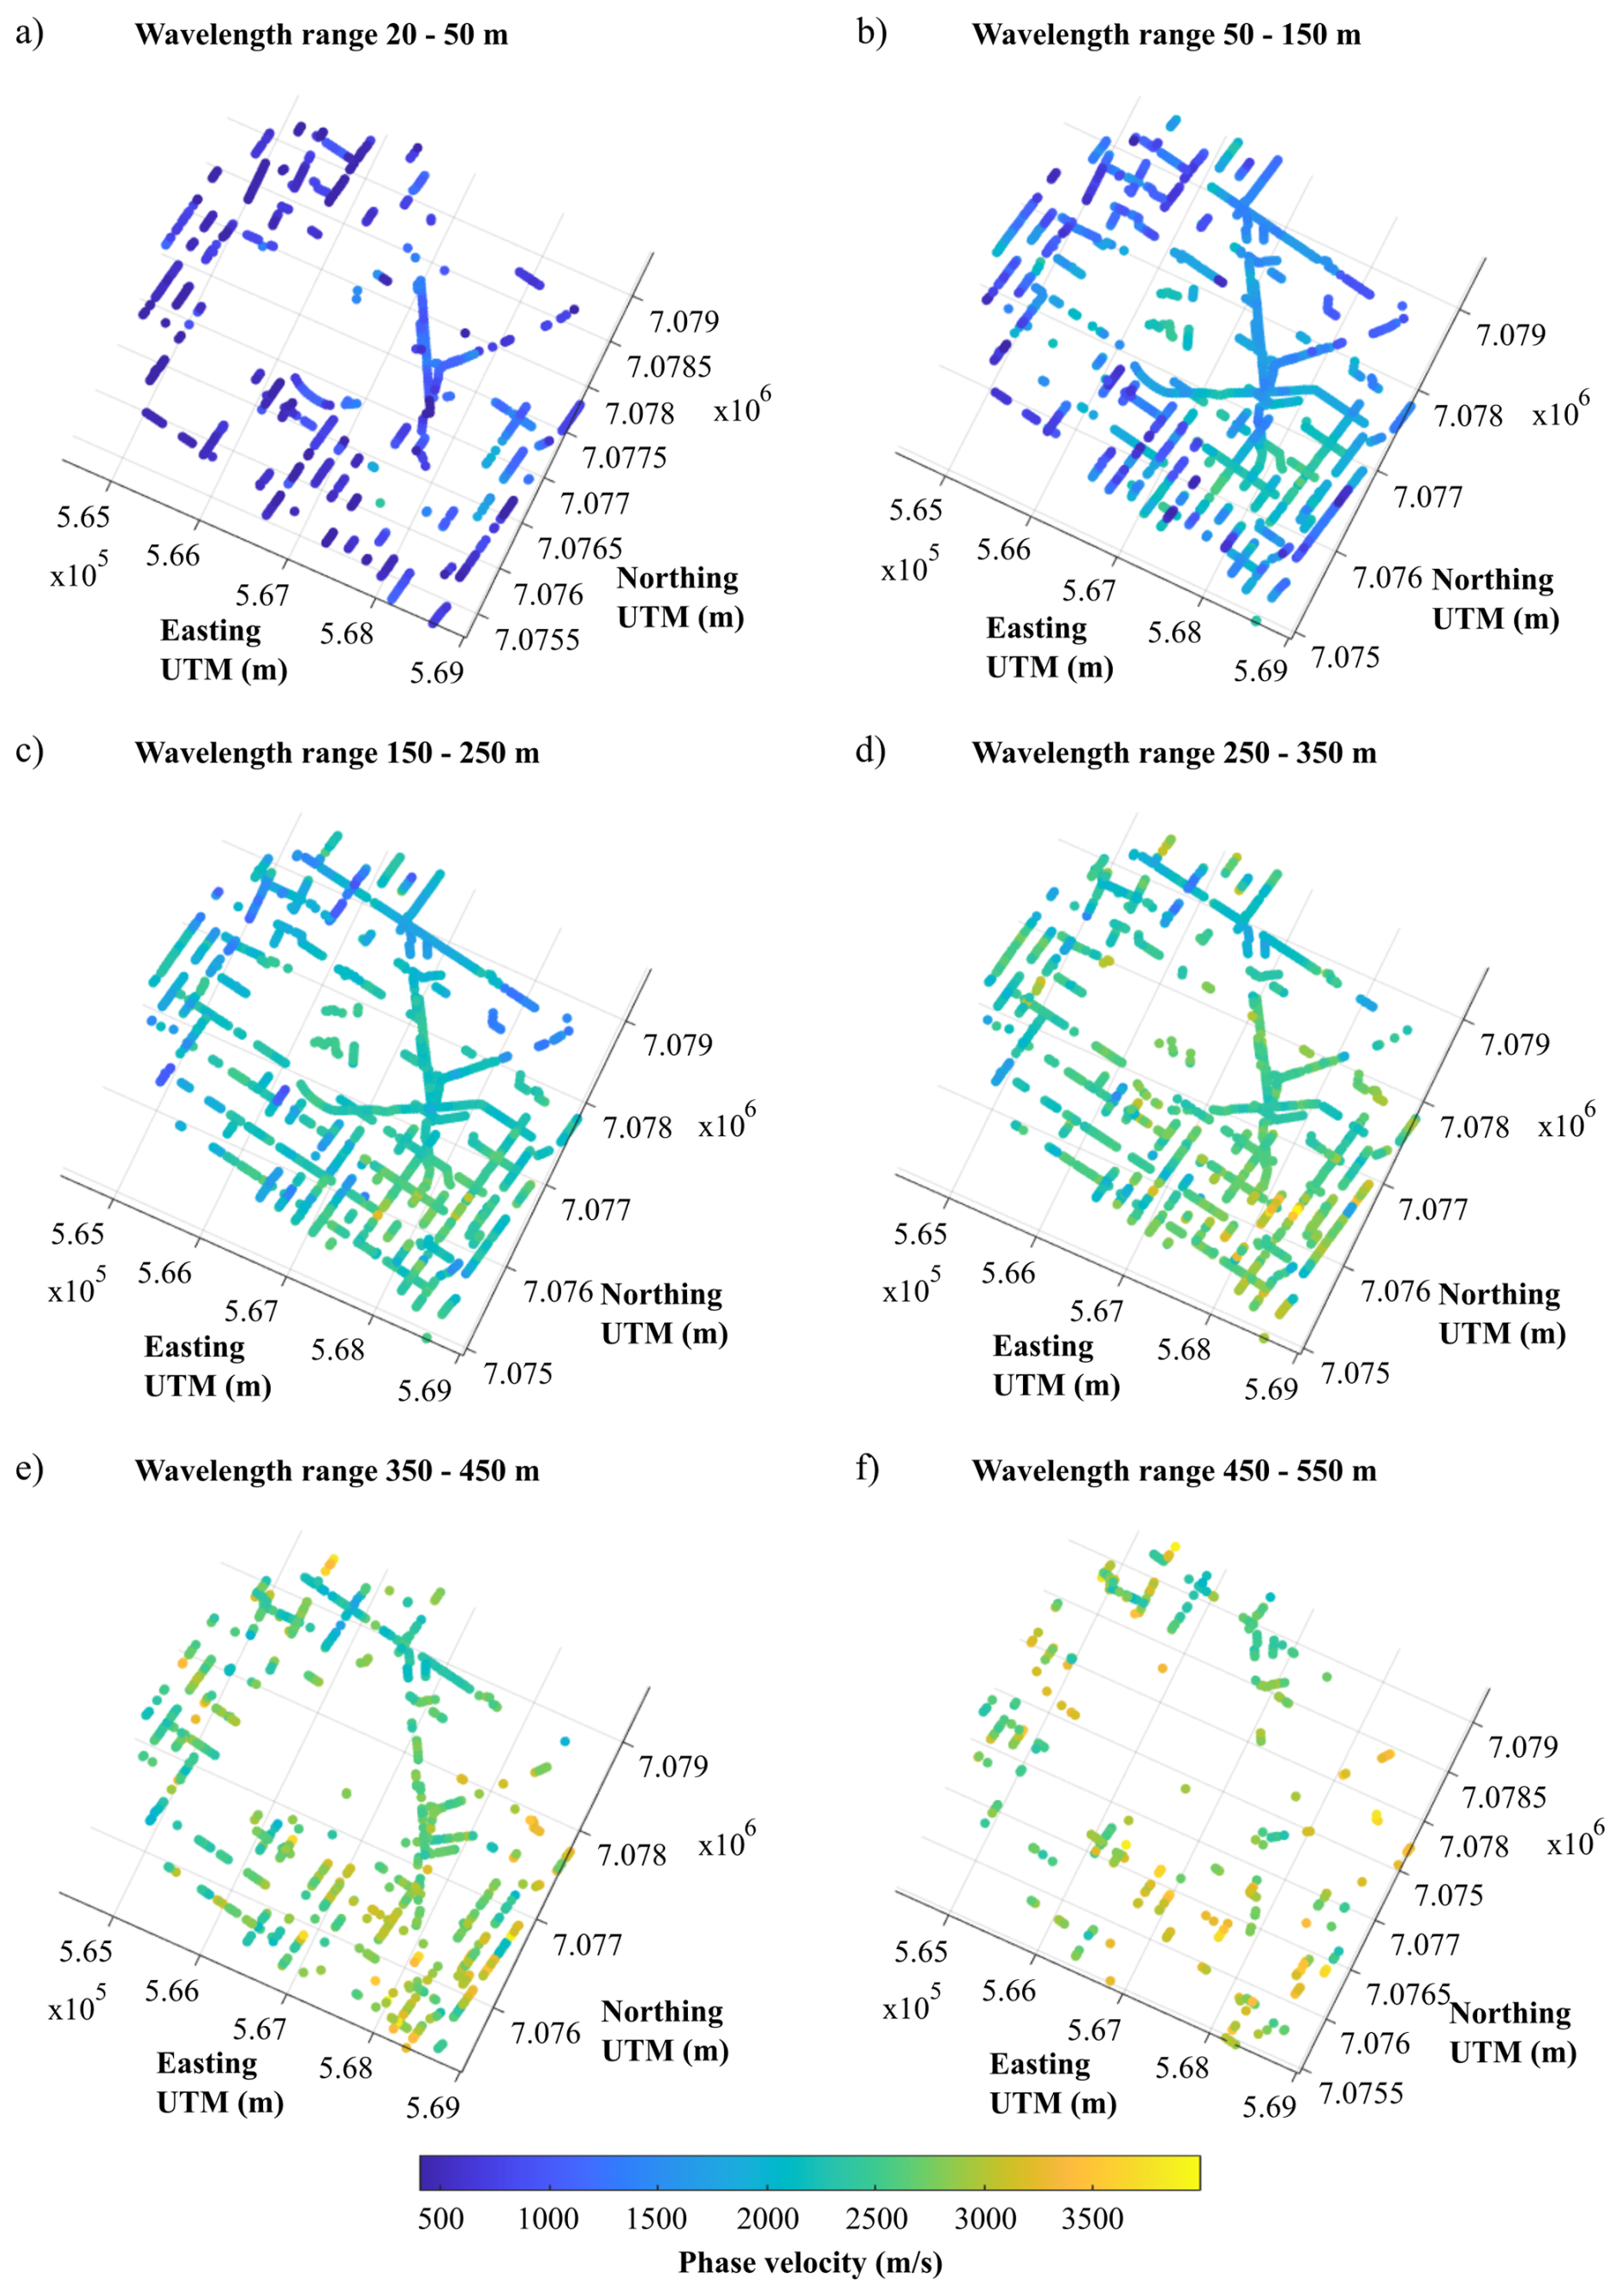
Figure 7Pseudo-slices of the estimated dispersion curves from the site shown using wavelength ranges of (a) 20–50 m, (b) 50–150 m, (c) 150–250 m, (d) 250–350 m, (e) 350–450 m, and (f) 450–550 m.
In Fig. 7a–f, we show the wavelength coverage of the estimated DCs for the 3D grid as pseudo-slices within different wavelength ranges, i.e. for progressively higher investigation depths. The highest coverage is achieved for wavelengths between 50 and 350 m, but it is still significant up to 550 m over wide areas of the grid.
3.3 Laterally constrained inversion (LCI)
To invert the picked DCs for S-wave velocities, we adopted the LCI scheme. The LCI was first proposed by Auken and Christiansen (2004) for inverting resistivity data using a pseudo-2D layered parameterization. The LCI is a deterministic inversion based on local 1D models connected through lateral constraints. A lateral constraint is a parameter that defines the variance permitted for parameters of neighbouring models (Wisén and Christiansen, 2005; Socco et al., 2009). The constraints represent a spatial regularization that avoids overfitting the final model. The smaller the expected variance in the area, the stronger the lateral constraints (Wisén and Christiansen, 2005; Socco et al., 2009). The optimization of the lateral constraints can be done by running a set of inversions starting from unconstrained and rising gradually the level of constraints until the fitting between model and data starts to decrease (Boiero and Socco, 2010). The inputs are the DCs and the initial model at the locations of the DCs. The initial model parameters of the LCI inversion scheme are the layer thicknesses, Poisson's ratio, density, and S-wave velocities. The technique simultaneously inverts all the picked DCs by minimizing a common objective function, which incorporates the fitting of data with the model, a priori information, and constraints. The LCI uses a damped least-squares inversion scheme to update the model iteratively. The initial S-wave velocities and layer thickness are updated after each iteration, while layer densities and Poisson's ratio are kept fixed (Khosro Anjom et al., 2024). The final result of the LCI is a S-wave pseudo-2D/3D velocity model.
Table 3Initial model parameters used to invert the picked dispersion curves.
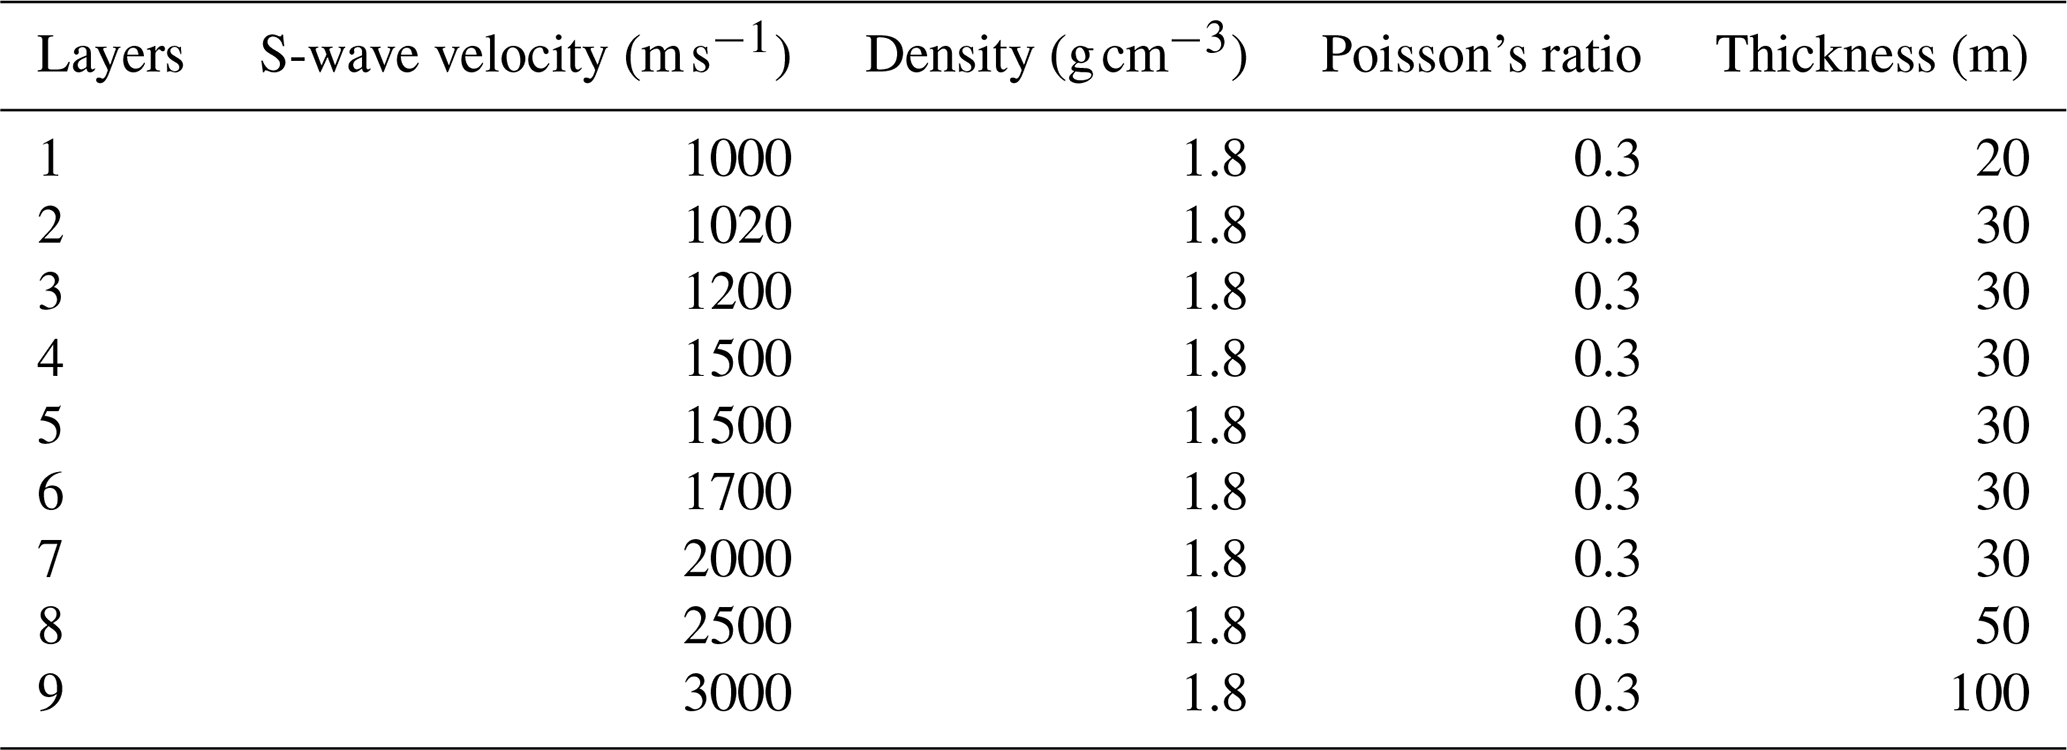
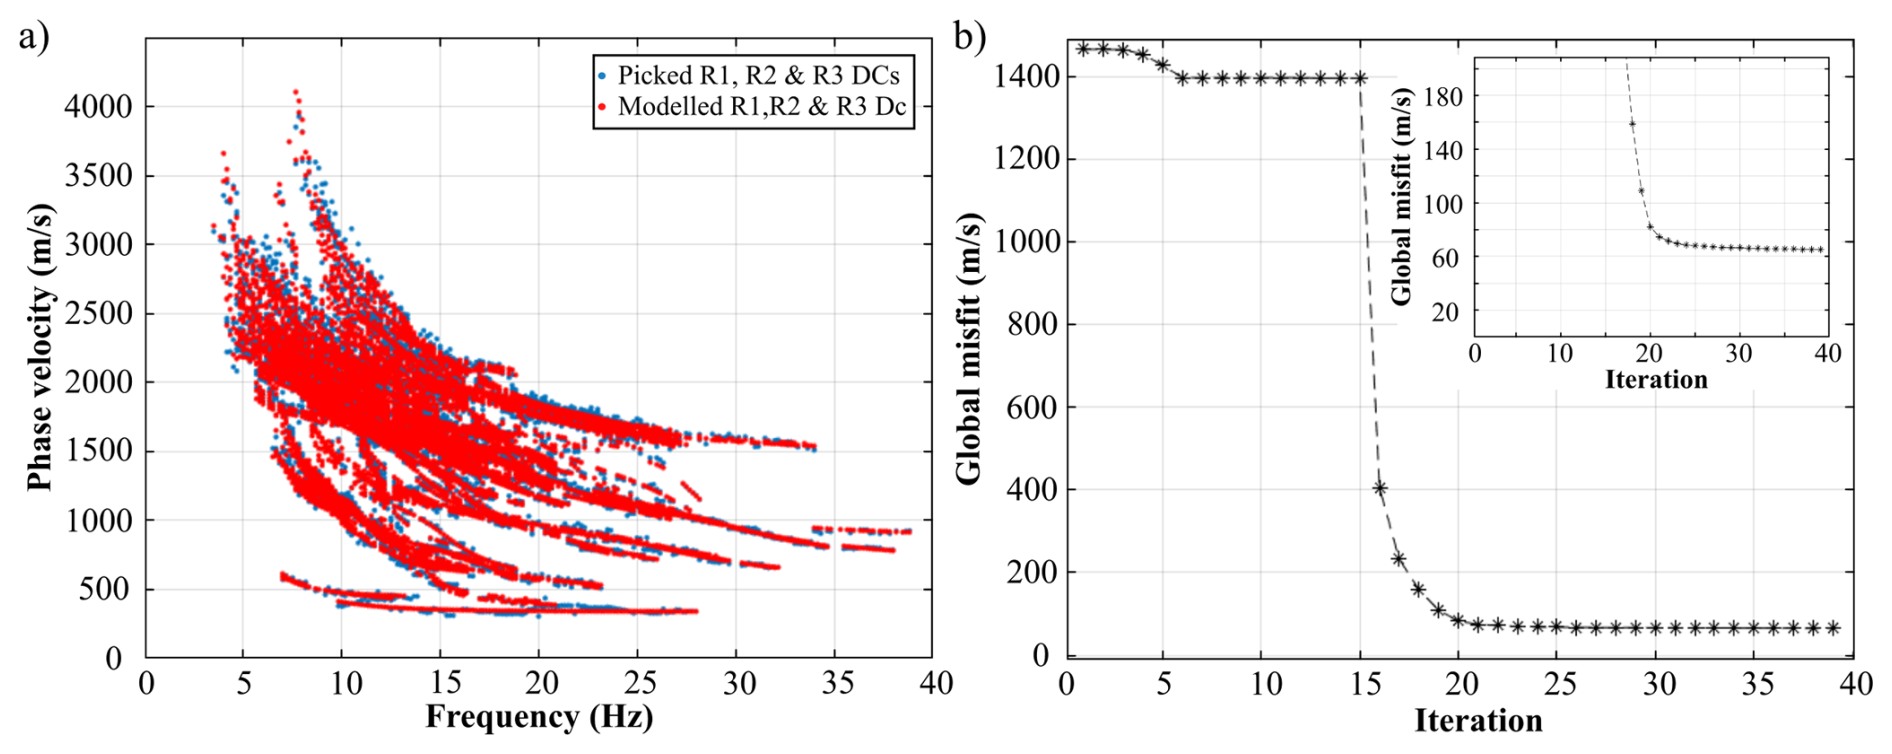
Figure 8(a) Fitting between picked and modelled (from last iteration) R1, R2, and R3 dispersion curves. (b) Global misfit between the picked and modelled dispersion curves in (a). The inset in (b) shows a zoomed section of the global misfit.
In this study, the parameterization of the initial model is laterally invariant, Table 3, and is based on the obtained SW information and expected geological properties of the site: The initial S-wave velocity model was created from the picked DCs, while Poisson's ratio and density measurements were estimated based on the materials expected in the study area (i.e., mainly the partially metamorphosed sedimentary rocks of the Timeball Hill Formation). The maximum depth of the initial model was set on the basis of a sensitivity analysis with Montecarlo inversion and a wavelength–depth analysis (Socco et al., 2017) carried out on some sample curves (not shown here). The analysis computed the relationship between wavelength and investigation depth of the selected DC and showed that DCs with large wavelengths (Fig. 8e and f) have a large investigation depth that goes beyond 300 m. After some inversion tests, we used a lateral constraint of 700 m s−1, which was the maximum level of constraint that could invert the data without overfitting the picked DCs (Fig. 8a). Figure 8 illustrates an example of the fitting obtained between picked and modelled DCs for lines R1, R2, and R3 (Fig. 8a), along with the global misfit calculated between the computed and experimental DCs for each iteration (Fig. 8b). The lowest global misfit obtained after 39 iterations is 65 m s−1.
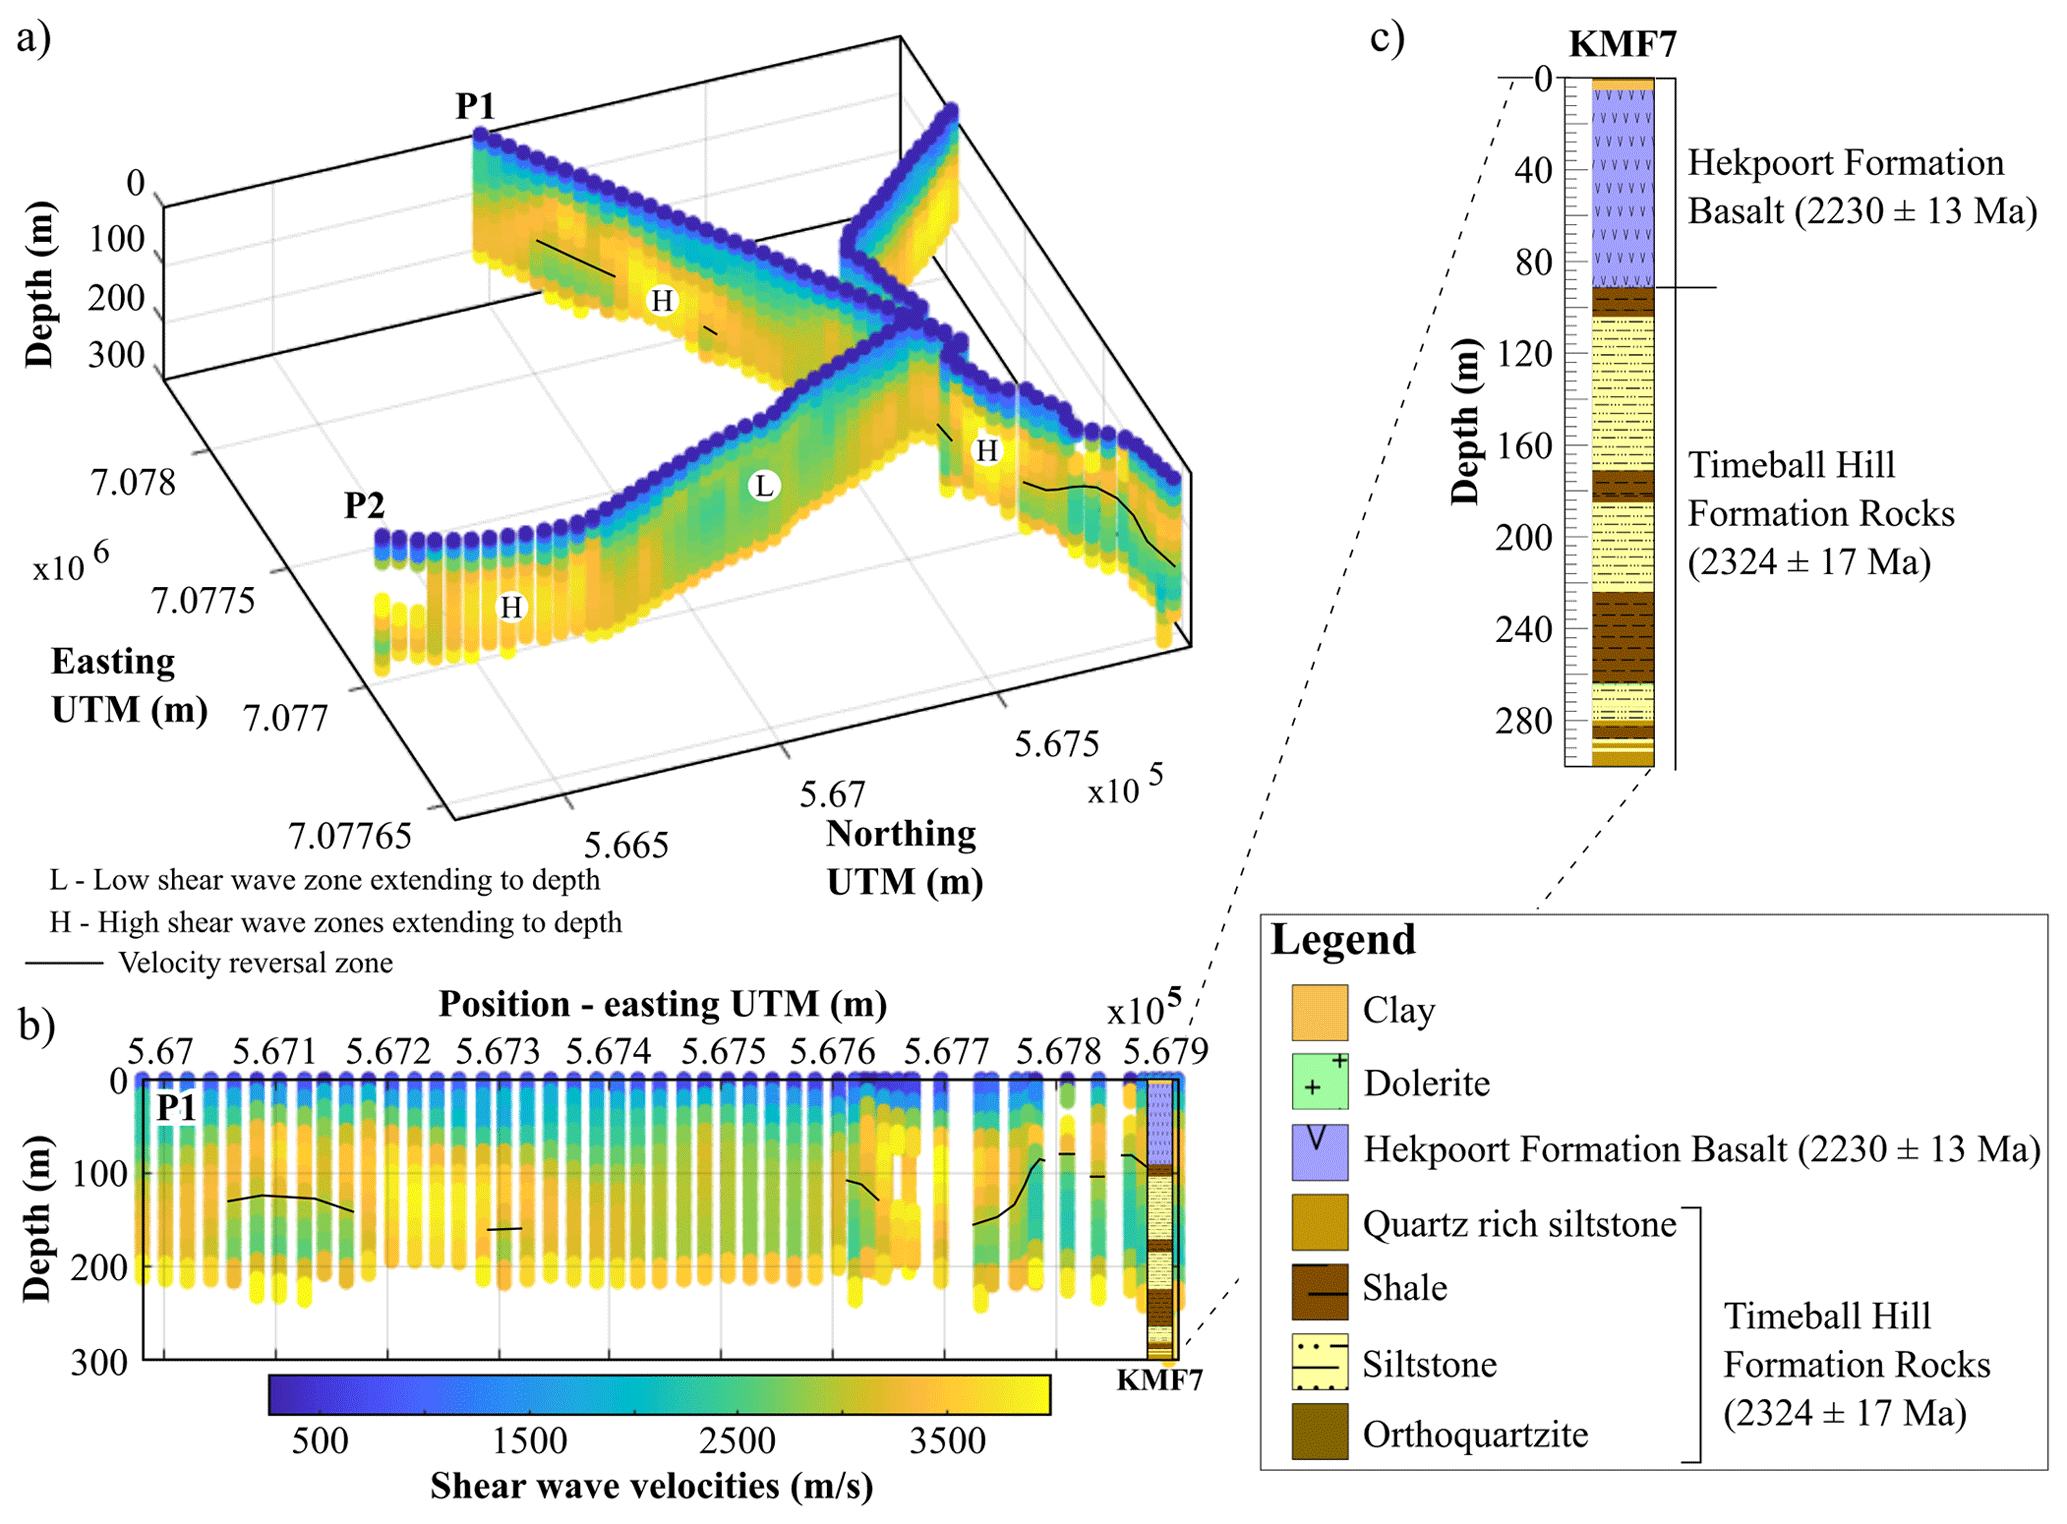
Figure 9(a) 3D plot of the high-resolution 2D shear-wave velocity models (i.e., P1 and P2). (b) P1 pseudo-2D S-wave velocity model shown along with the borehole (i.e., KMF7) located along the line. (c) Zoomed image of the borehole KMF7 showing the depth scale, formations, and rock types located in the area.
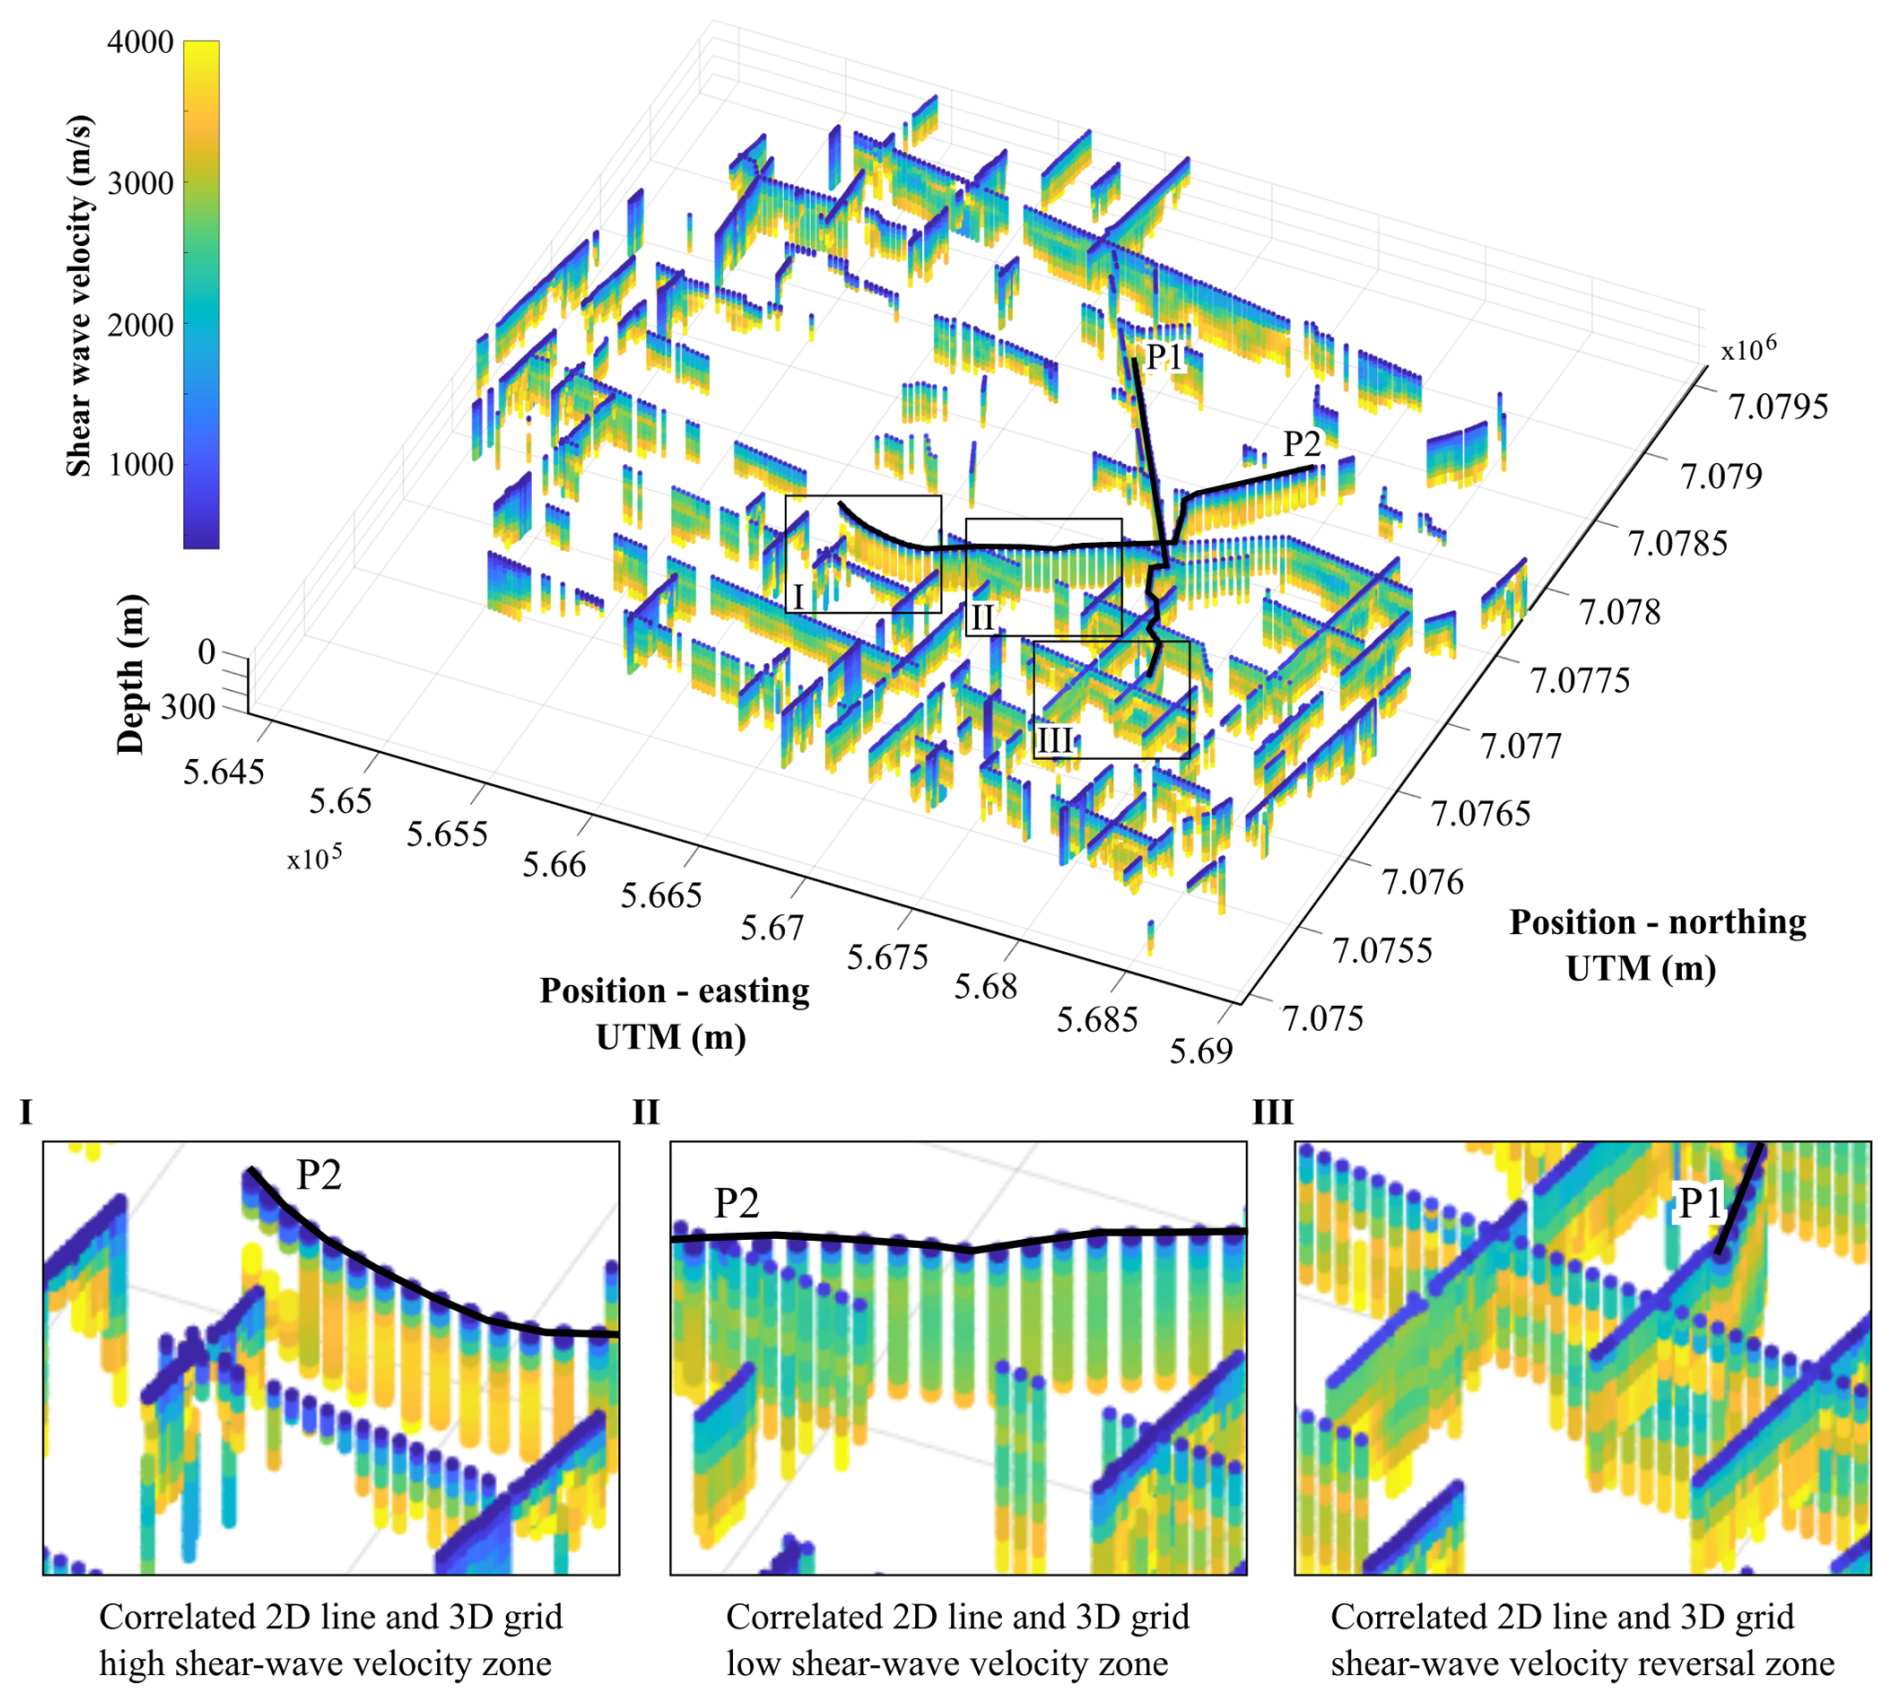
Figure 10South Deep Gold Mine 2D and 3D grid data plot. The rectangles I, II, and III indicate correlating high, low, and velocity reversal zones between the obtained 2D and 3D S-wave velocity models, respectively.
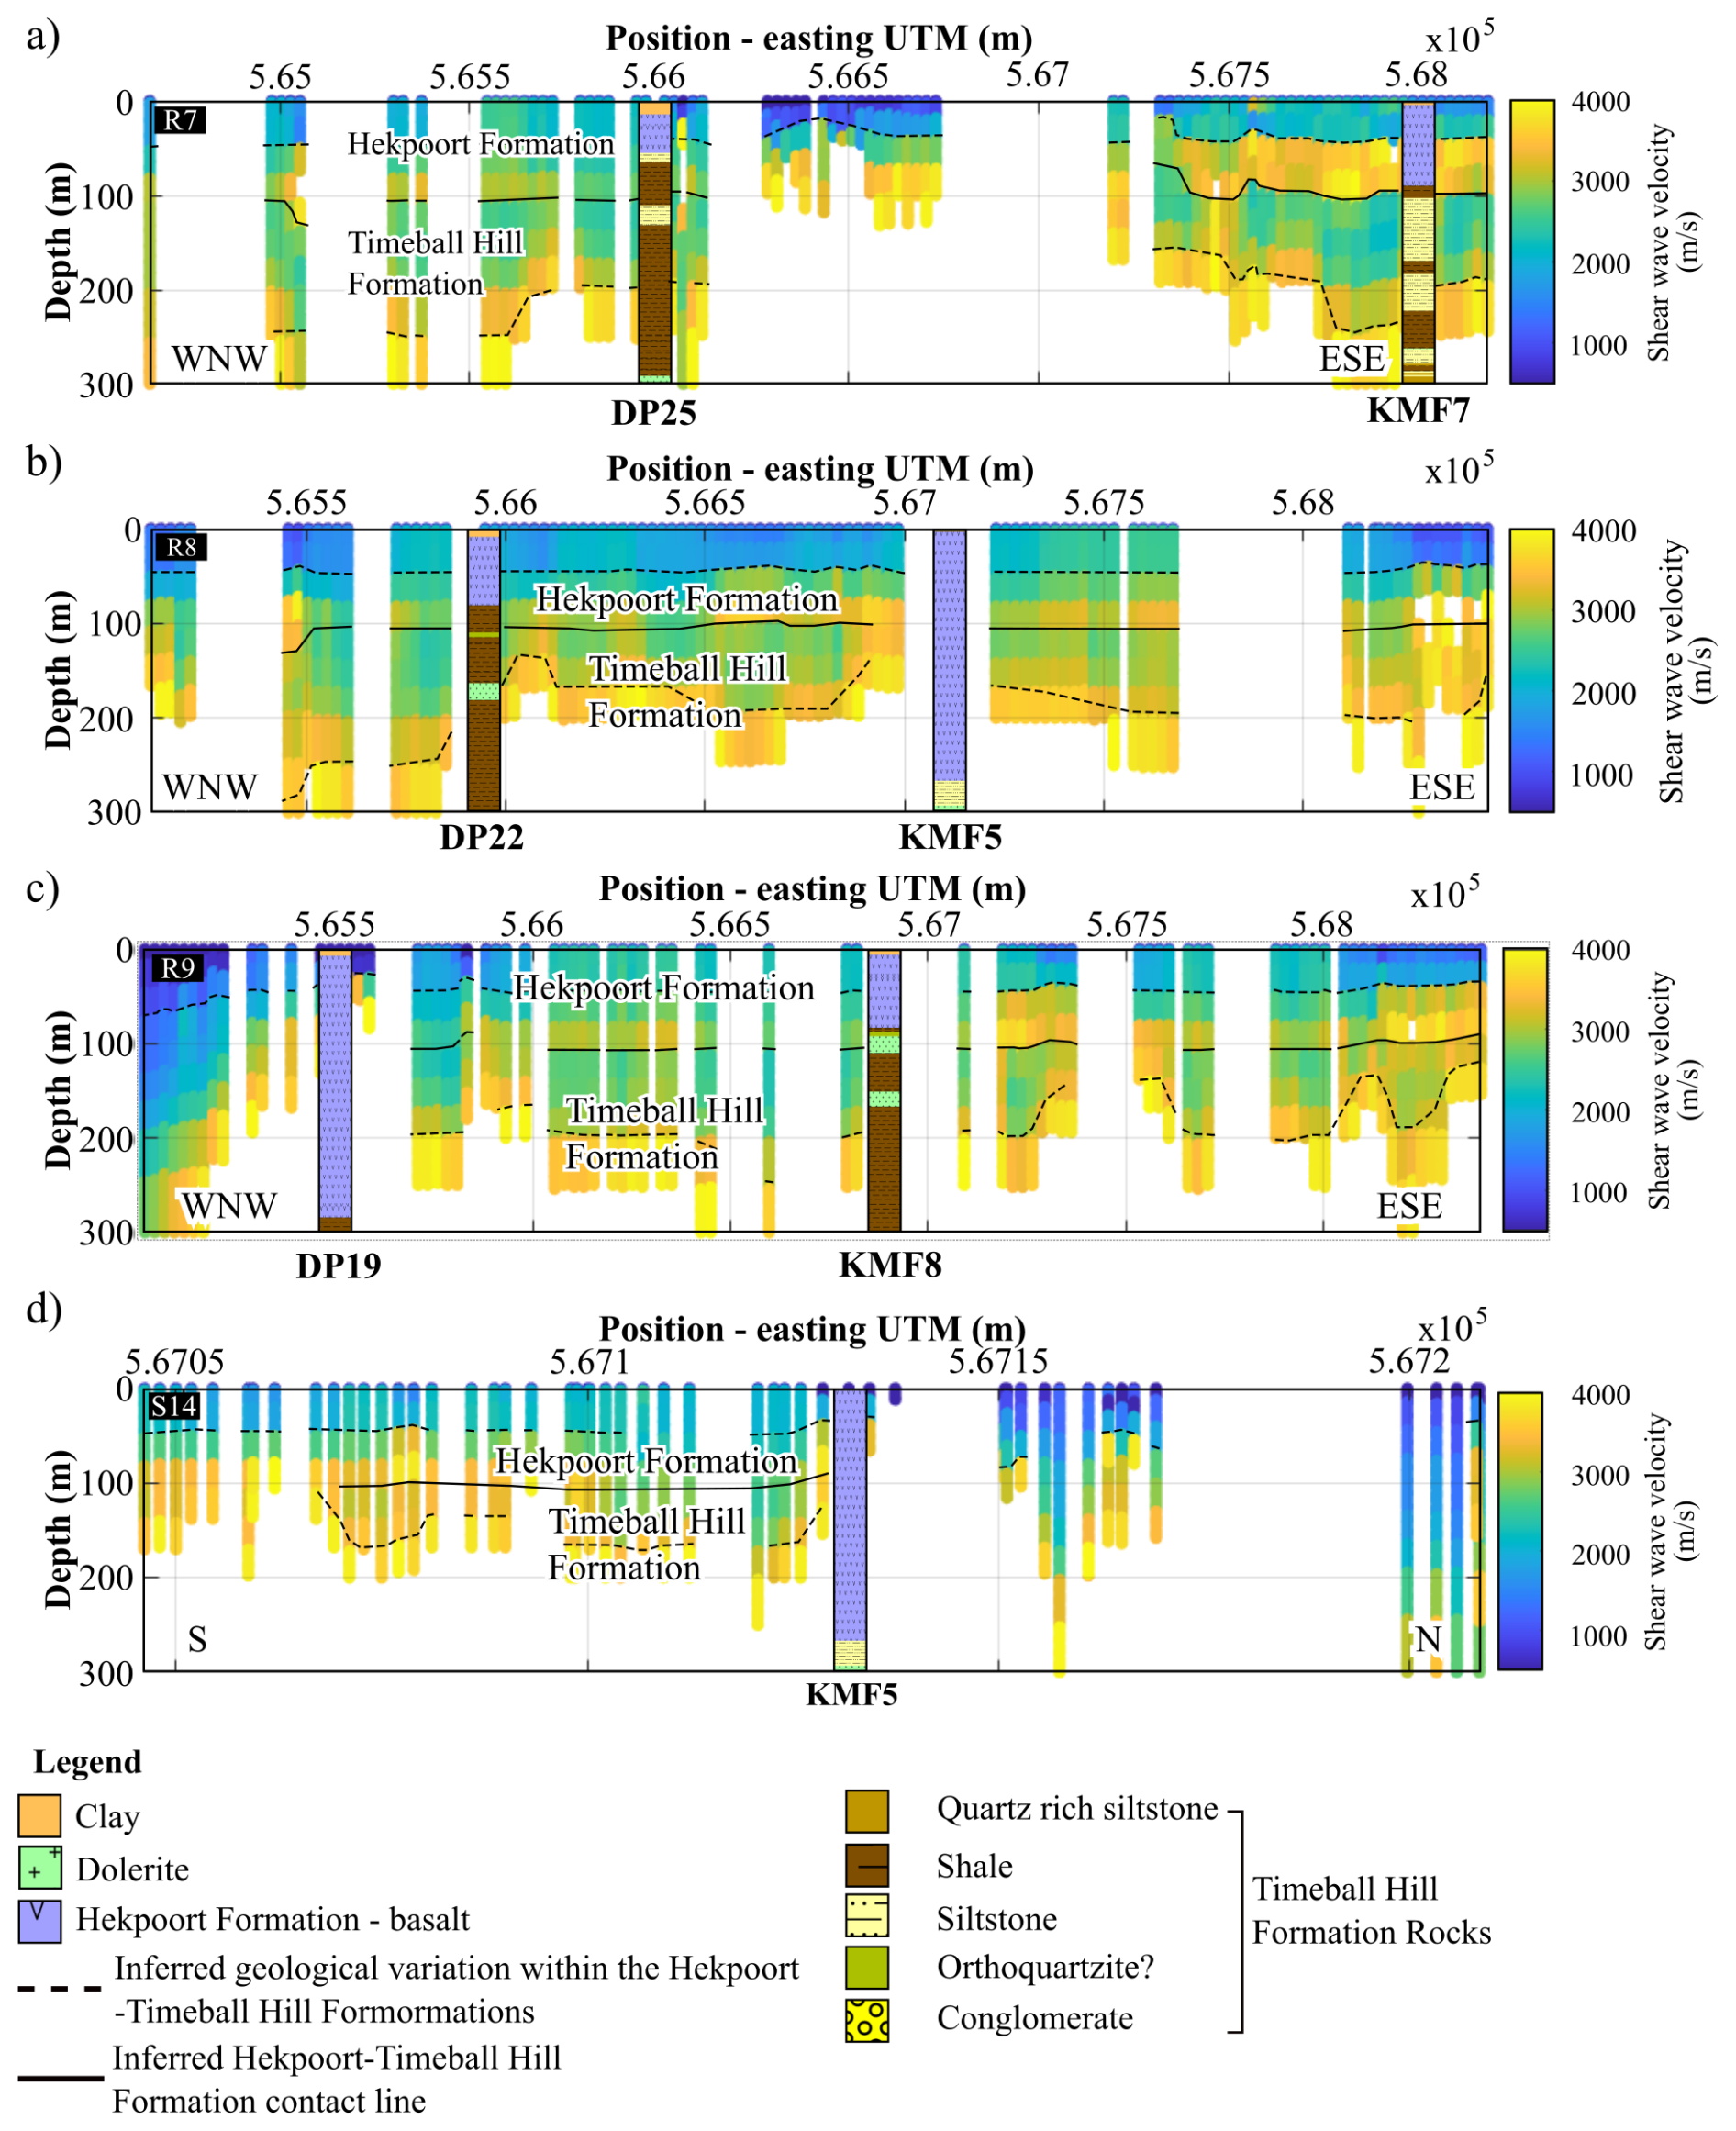
Figure 11Representative boreholes of the study area projected on pseudo-2D S-wave velocity models constituting the 3D grid that are closest to them. Pseudo-2D S-wave velocity models of lines: (a) R7, (b) R8, (c) R9, and (d) S14.
Figures 9 and 10 show the near-surface S-wave velocity models obtained through the LCI of the picked DCs along the 2D lines (P1 and P2) and 3D grid, i.e., along the receiver and source lines, respectively. In Figs. 9–11, both vertical and lateral velocity geological variations in the study area are resolved.
The results of the inversion showed a significant update with respect to the initial model, as confirmation of the sensitivity of the data to model parameters. Velocity reversal zones with spatial consistency appeared in several zones of the final 2D/3D models. Since the initial model does not contain any velocity reversal, we consider them a reliable feature in the final models. The spatial consistency of the velocity of the layers is not due to the introduction of the lateral constraints since the low velocity zones were present also in the unconstrained inversion we carried out as a benchmark to define the optimum level of constraints. As far as the investigation depth is concerned, we tested the sensitivity through the wavelength–depth analysis and, in certain zones of the final velocity models, we saw significant updates with respect to the initial model, down to a depth greater than 300 m. In other zones, instead, a lower penetration depth was reached. We hence plotted the final models using a variable depth, based on the penetration depth of the DCs. The estimated velocities are in line with the expected values for the formations. The expected vertical resolution is ∼ 20 m in the upper part of the model and ∼ 40 m in the deeper part of the model, consistent with the selected initial model. The lateral resolution is related to the DC density along the line (from 10 to 25 m) but is also affected by the smoothing effect of the processing windows (125–500 m) (Table 2).
4.1 Lithological layering, faults, and intrusions
From the obtained high-resolution 2D S-wave velocity models, for P1 and P2 (Fig. 9), notable is that the site is characterized by a prominent (1) velocity reversal zone (indicated with a black solid line) due to lithological changes (Fig. 9b and c) and (2) low- and high-velocity zones that extend from the surface to great depths (i.e., > 150 m). Evident in Fig. 10 is that the S-wave high (I), low (II), and reversal (III) velocity anomalies are also resolved in the 3D grid S-wave velocity model. A good anomaly spatial location and velocity correlation is observed between the 2D and 3D models within the high-velocity, low-velocity, and velocity reversal zones (Fig. 10). In the 3D S-wave velocity model, the velocity reversal zone is overlain by a high-velocity zone with a sheet-like geometry (i.e., near-horizontal and planar-orientated, Fig. 10).
Figure 11 illustrates the correlation between available surface borehole logs in the study area and the S-wave velocity profiles closest to them. Apparent in Figs. 9b, c and 11a is that the identified velocity reversal zone (indicated by a solid black line) marks the boundary/contact between the overlying basalts of the Hekpoort Formation and the underlying shales and siltstones of the Timeball Hill Formation. Also notable in Figs. 9b and 11a, b is that where the depth extent of the uppermost Hekpoort Formation rocks is greater than ∼ 50 m and less than ∼ 200 m, the contact between the Hekpoort and Timeball Hill formations is mapped relatively well; while in areas where the thickness of the Hekpoort Formation is greater than ∼ 200 m (Fig. 11b and c), the Hekpoort-Timeball Hill Formation contact cannot be resolved. Indicated by the black dashed lines are the significant lateral variations present within the rocks of the Hekpoort and Timeball Hill formations, which are elaborated more in the following section. This comparison of S-wave velocity profiles and proximal borehole information illustrates that the obtained S-wave velocities are sensitive to the lithological variation characteristic of the site and are reasonable and reliable.
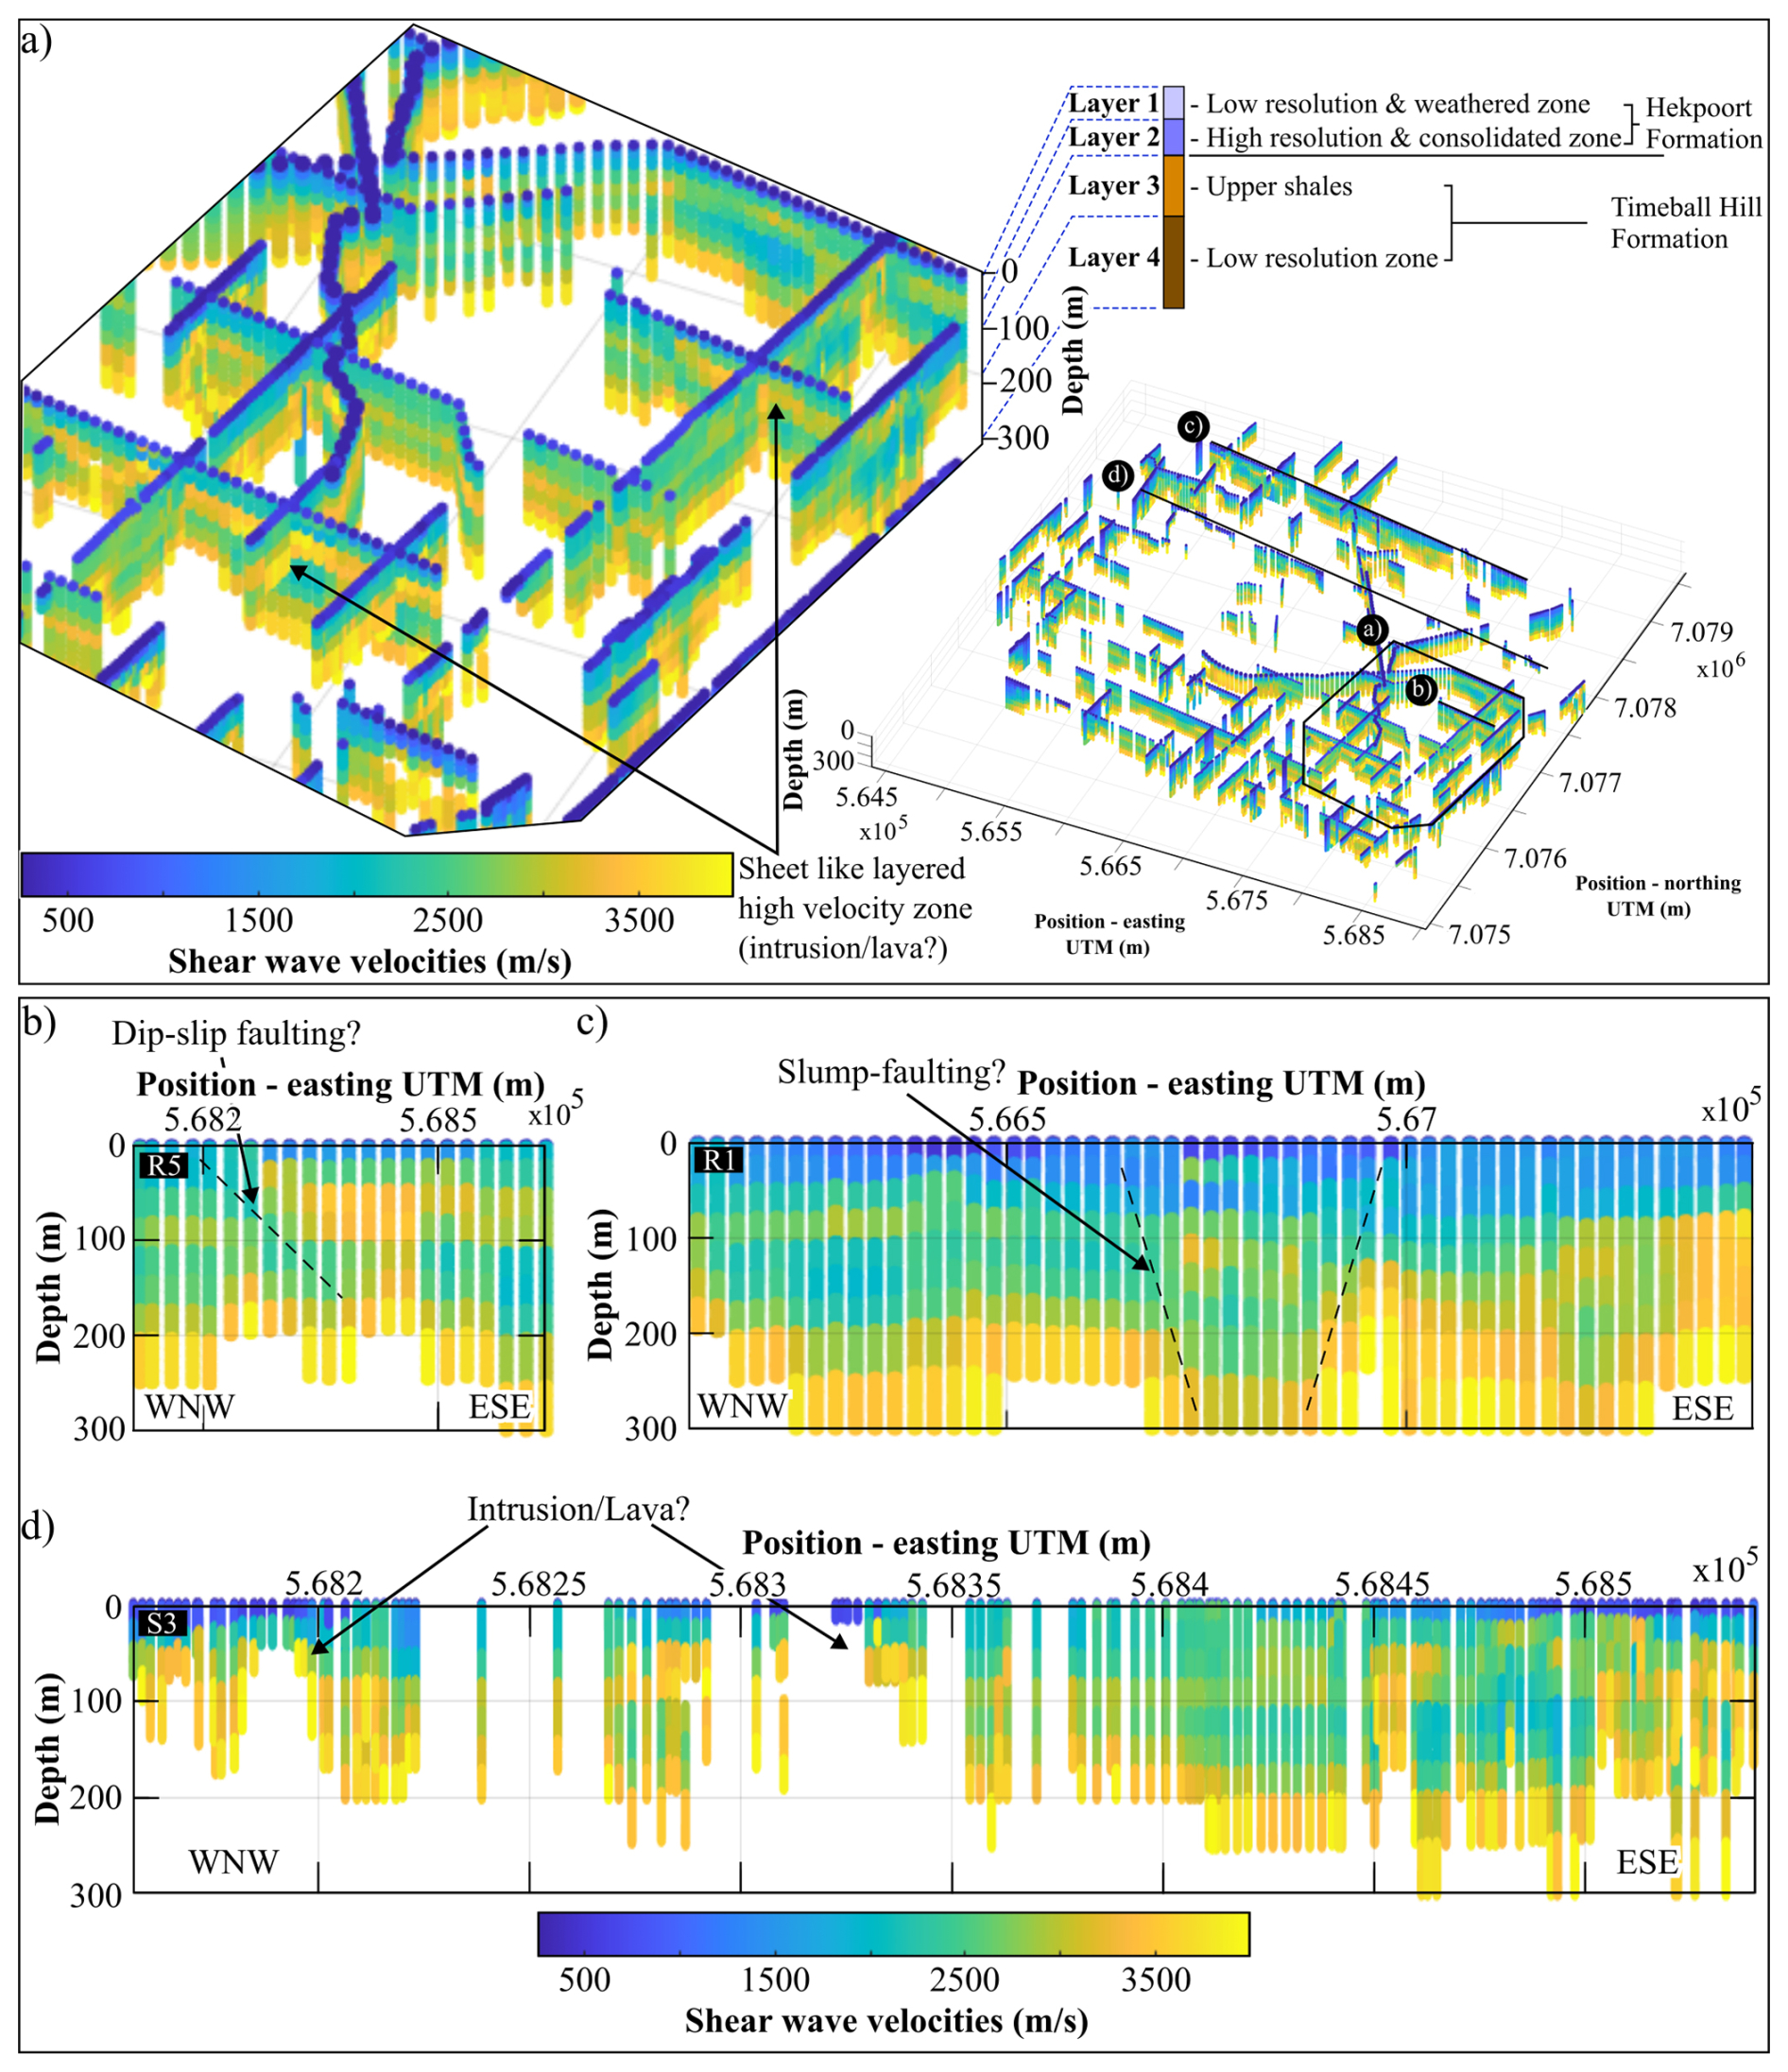
Figure 12Local features observed at the site. (a) Sheet-like layering; (b) dip-slip faulting; (c) slump-faulting; and (d) intrusions/lavas. Shown in the 3D grid in (a) are the locations of the zoomed in 3D grid displayed in (a) and the locations of the S-wave velocity sections in (b–d), respectively.
In general, within the top 300 m of depth, the overall S-wave velocity is interpreted to show four sheet-like subsurface layers (Fig. 12a). The first layer roughly extends from the surface to a depth of ∼ 40 m and has S-wave velocity ranging from < 500 to ∼ 2500 m s−1. The second layer shows higher velocities (∼ 2500 to ∼ 3500 m s−1) and extends from ∼ 40 to 120 m below the surface. A third layer, with S-wave velocities similar to the first one, extends from ∼ 120 to 200 m. The last resolvable layer is a high-velocity zone (> ∼ 3500 m s−1), extending from ∼ 200 m of depth (Fig. 12a). The first two identified layers belong to the Hekpoort Formation and are interpreted to constitute the weathered and least weathered zones of the Hekpoort Formation rocks, respectively. The last two layers belong to the upper shales of the Timeball Hill Formation; the high velocities in the second layer of the Timeball Hill Formation are attributed to the presence of sills intruded at those depths, see Fig. 2c. During the emplacement of mafic rocks, the shale- and quartzite-dominated formations of the Transvaal Supergroup (i.e., Timeball Hill, Boshoek, and Daspoort formations) formed preferential sill emplacement locations as compared to the carbonate and volcanic formations of the Supergroup. The shales and quartzite formations, being preferential emplacement locations, are linked to the abundant parting surfaces within shales (i.e., fissility) and the prevalent upper and lower contacts between the thick quartzites with under- and overlying-shales (Button and Cawthorn, 2015). The transition from the basaltic Hekpoort Formation rocks (high seismic velocity rocks) to the metasedimentary rocks of the Timeball Hill Formation (low seismic velocity rocks) results in the velocity reversal zone observed between the second and third layers, indicated by a solid black line in Figs. 9 and 11. Considered, however, is that the presence of a velocity reversal results in a reduction in the reliability of S-wave velocities of layers located below the reversal zone. Velocity reversal zones reduce the penetration of large wavelengths into the underlying layers since the wavefield energy is trapped into the low velocity layer, thus reducing the mapping resolution and velocity reliability at depth (Groves et al., 2011). Additionally, SW analysis suffers from a reduction in resolution with depth and, due to this, not much interpretation is drawn on the exact S-wave velocities observed within the last layer. The prevalence of the velocity reversal zone throughout the study area suggests that the Hekpoort Formation is present throughout the vicinity of South Deep Gold Mine, contrary to what is observed in the local geological map (Fig. 1c). This is supported by the presence of Hekpoort Formation basalts in areas where Timeball Hill Formation rocks are reported to be outcropping (see boreholes KMF5, KMF6, and KMF7 in Fig. 1c). However, the confirmation of this interpretation is hampered by the lack of available borehole data around the center and northern area of the mine. The depth, thickness, and S-wave velocities of the imaged lithologies and corresponding layers are variable, and in some areas, are disturbed by low and high-velocity zones that extend from the near-surface to depths beyond that resolved by the survey (Fig. 12b–d). These high- and low-velocity zones are discussed in the following section.
The low-velocity zones are interpreted to be associated with dip-slip (Fig. 12b) and slump-faulting (Fig. 12c). The reduction in S-wave velocities within fault zones is attributed to increased fracturing, porosity, and fluid content, which lead to the physical breakdown (weathering and alteration) of the primary minerals in the in-situ rock into less dense secondary phases. This transformation reduces the rock's elastic moduli, ultimately lowering seismic velocities. According to Mutshafa et al. (2023), weathering of the rocks in the study area is highly variable and can extend to depths greater than 500 m, which is consistent with the presented findings. The interpreted dip-slip faulting in Fig. 12b shows relative vertical displacement between the rocks above and below the fault plane. Meanwhile, the slump-faults, Fig. 12c, are largely characterized by wide near-surface footprints that taper down with depth, i.e., they progressively get narrower with depth. In the slump zone, the layers (including the overlaying volcanic rock layers) are observed to be sunken. The identified faulting and possible intrusions are characteristic of the study area and consistent with the findings of Cousins (1962) and Parsons and killick (1990). Cousins (1962) documents that the rocks of the Pretoria Group are displaced by post-Pretoria Group faults that displace both the Pretoria Group rocks and the base of the Transvaal Supergroup, and slump-faulting, which only affects the formations within the Transvaal Supergroup, but not the base of the Transvaal Supergroup. Cousins (1962) interpreted these faults as slump-faulting originating from the subsidence of the dolomitic units of the Transvaal Supergroup, situated within a formation underlying the Pretoria Group formations.
High-velocity zones, extending from the near-surface to depth or terminating within the upper subsurface, are observed in Figs. 9a, 10, and 11b–d. In Fig. 11b–d, these zones correlate with thick basaltic lava flows of the Hekpoort Formation. The termination of S-wave velocities at depth reflects the penetration depth and the influence of complex structural features and abrupt lithological heterogeneities.
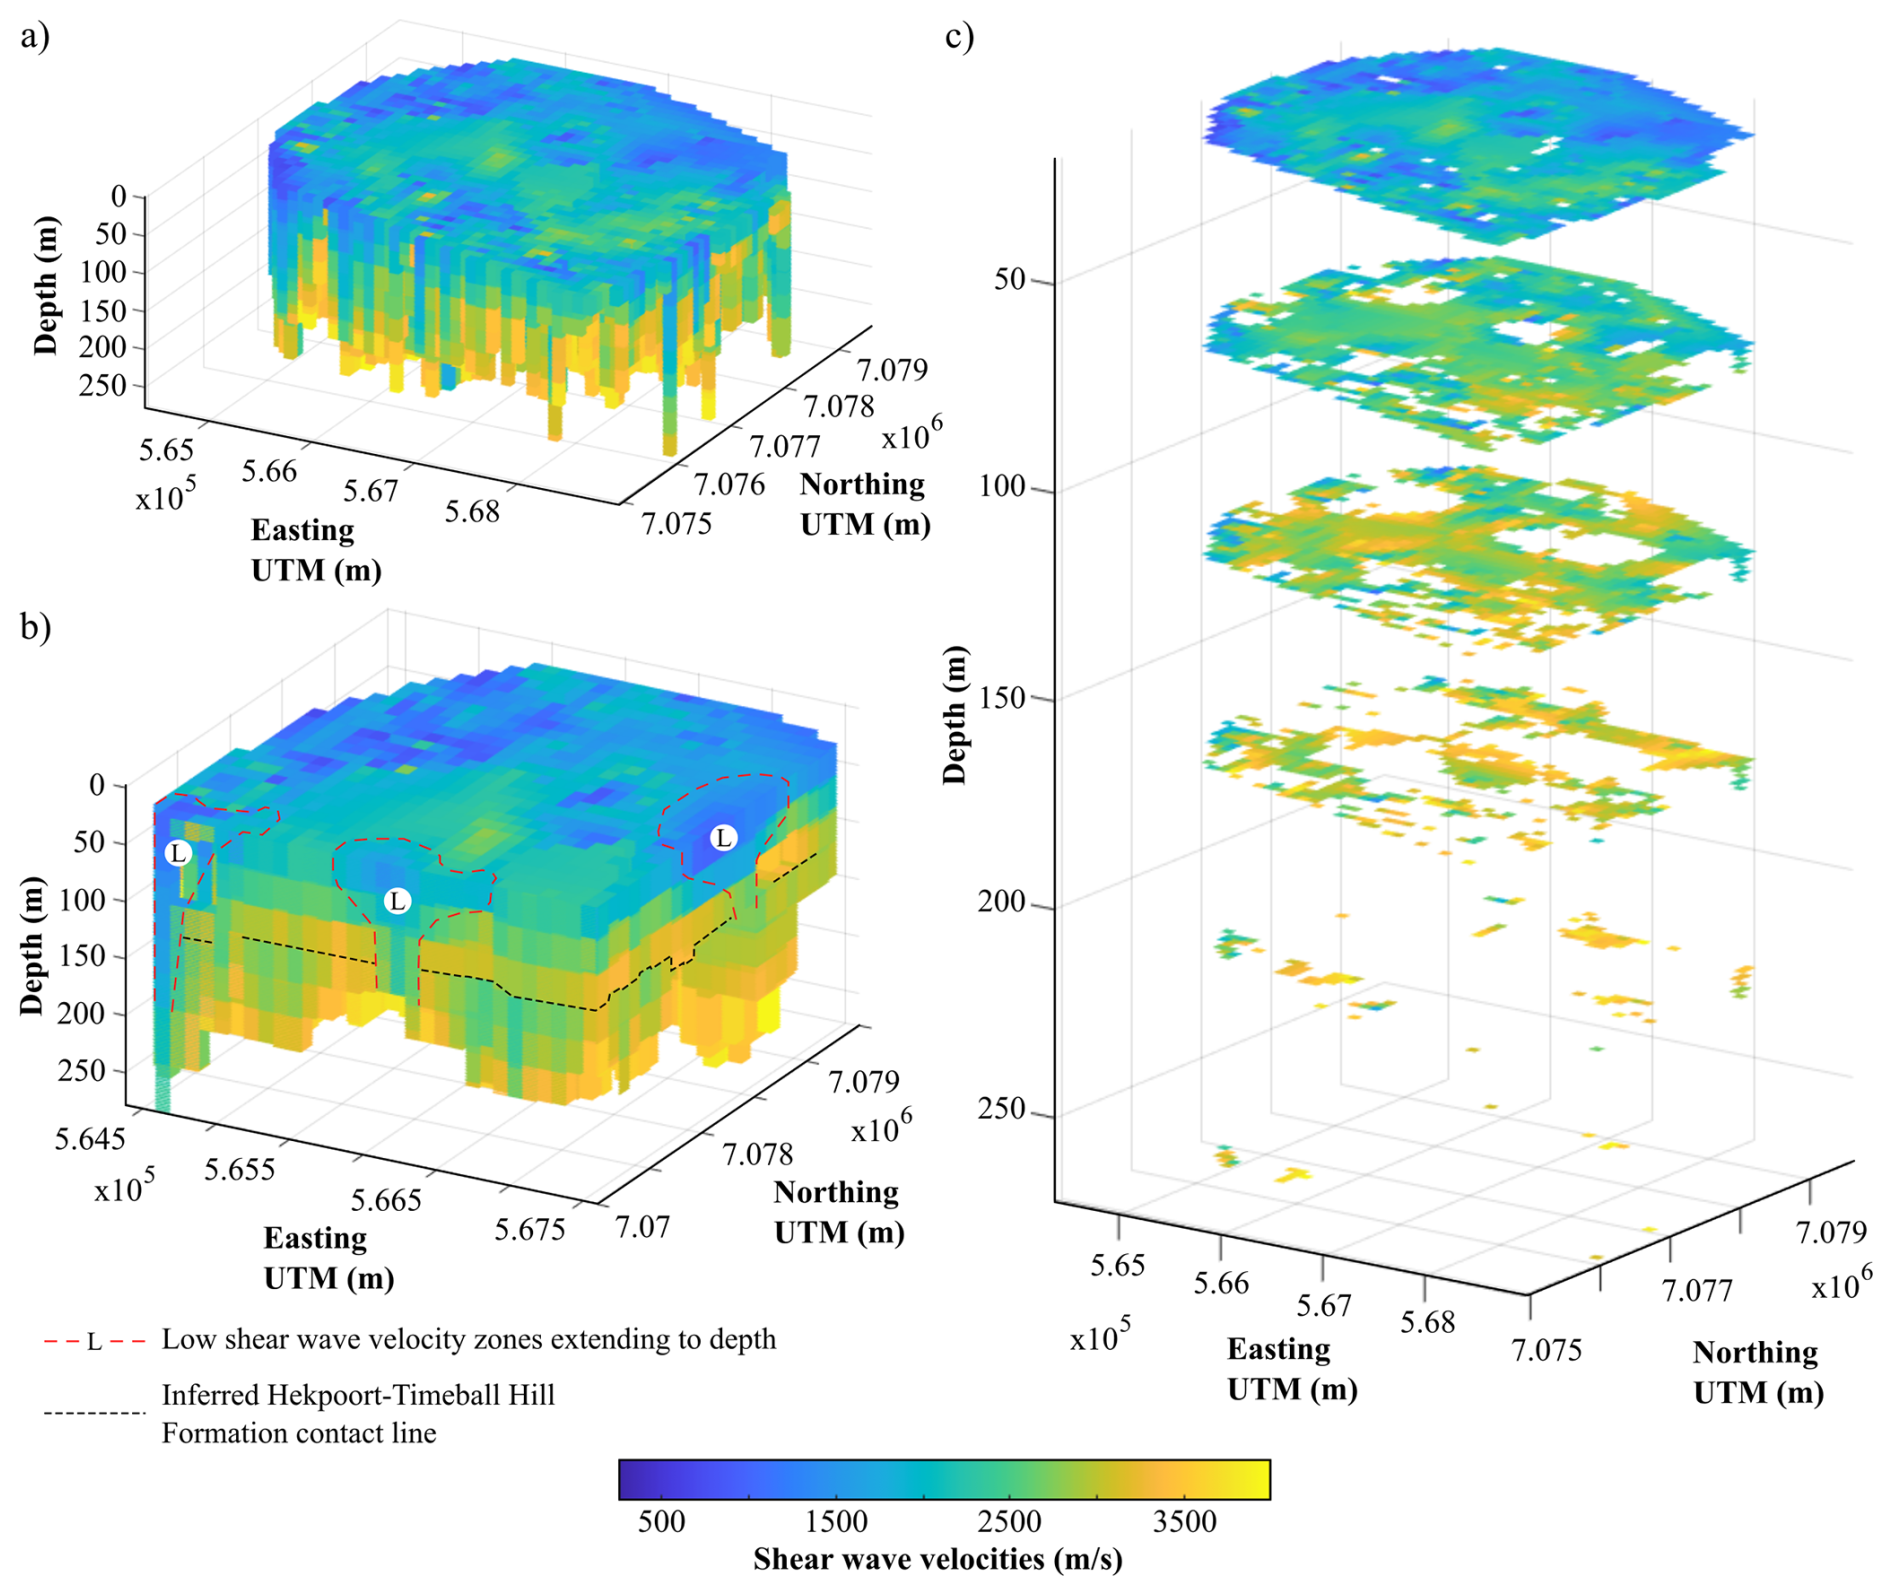
Figure 13(a) 3D S-wave velocity model of the study area. (b) Cropped 3D S-wave velocity model showing the velocity reversal zone (indicated by the black dotted lines) and low velocity zones that extend from the surface to greater depths (indicated by the red dotted lines). (c) 3D S-wave velocity model depth slices illustrating the general variation of S-wave velocities with depth.
Figure 13a–c illustrates the interpolated 3D model view of the grid acquired at the mine and depth slices (i.e., velocity maps) extracted from the 3D model. Figure 13a displays the velocity model of the survey area in 3D. The zones marked by dashed red lines in the vertically sliced 3D model, Fig. 13b, illustrate the coherency and depth extent of the low-velocity zones in the area and their interaction with the reversal zone (shown using a black dashed line and situated at a depth of ∼ 120 m). The velocity maps in Fig. 13c better illustrate the increase of velocities with depth and the presence of low-velocity zones that extend from the near-surface to greater depths.
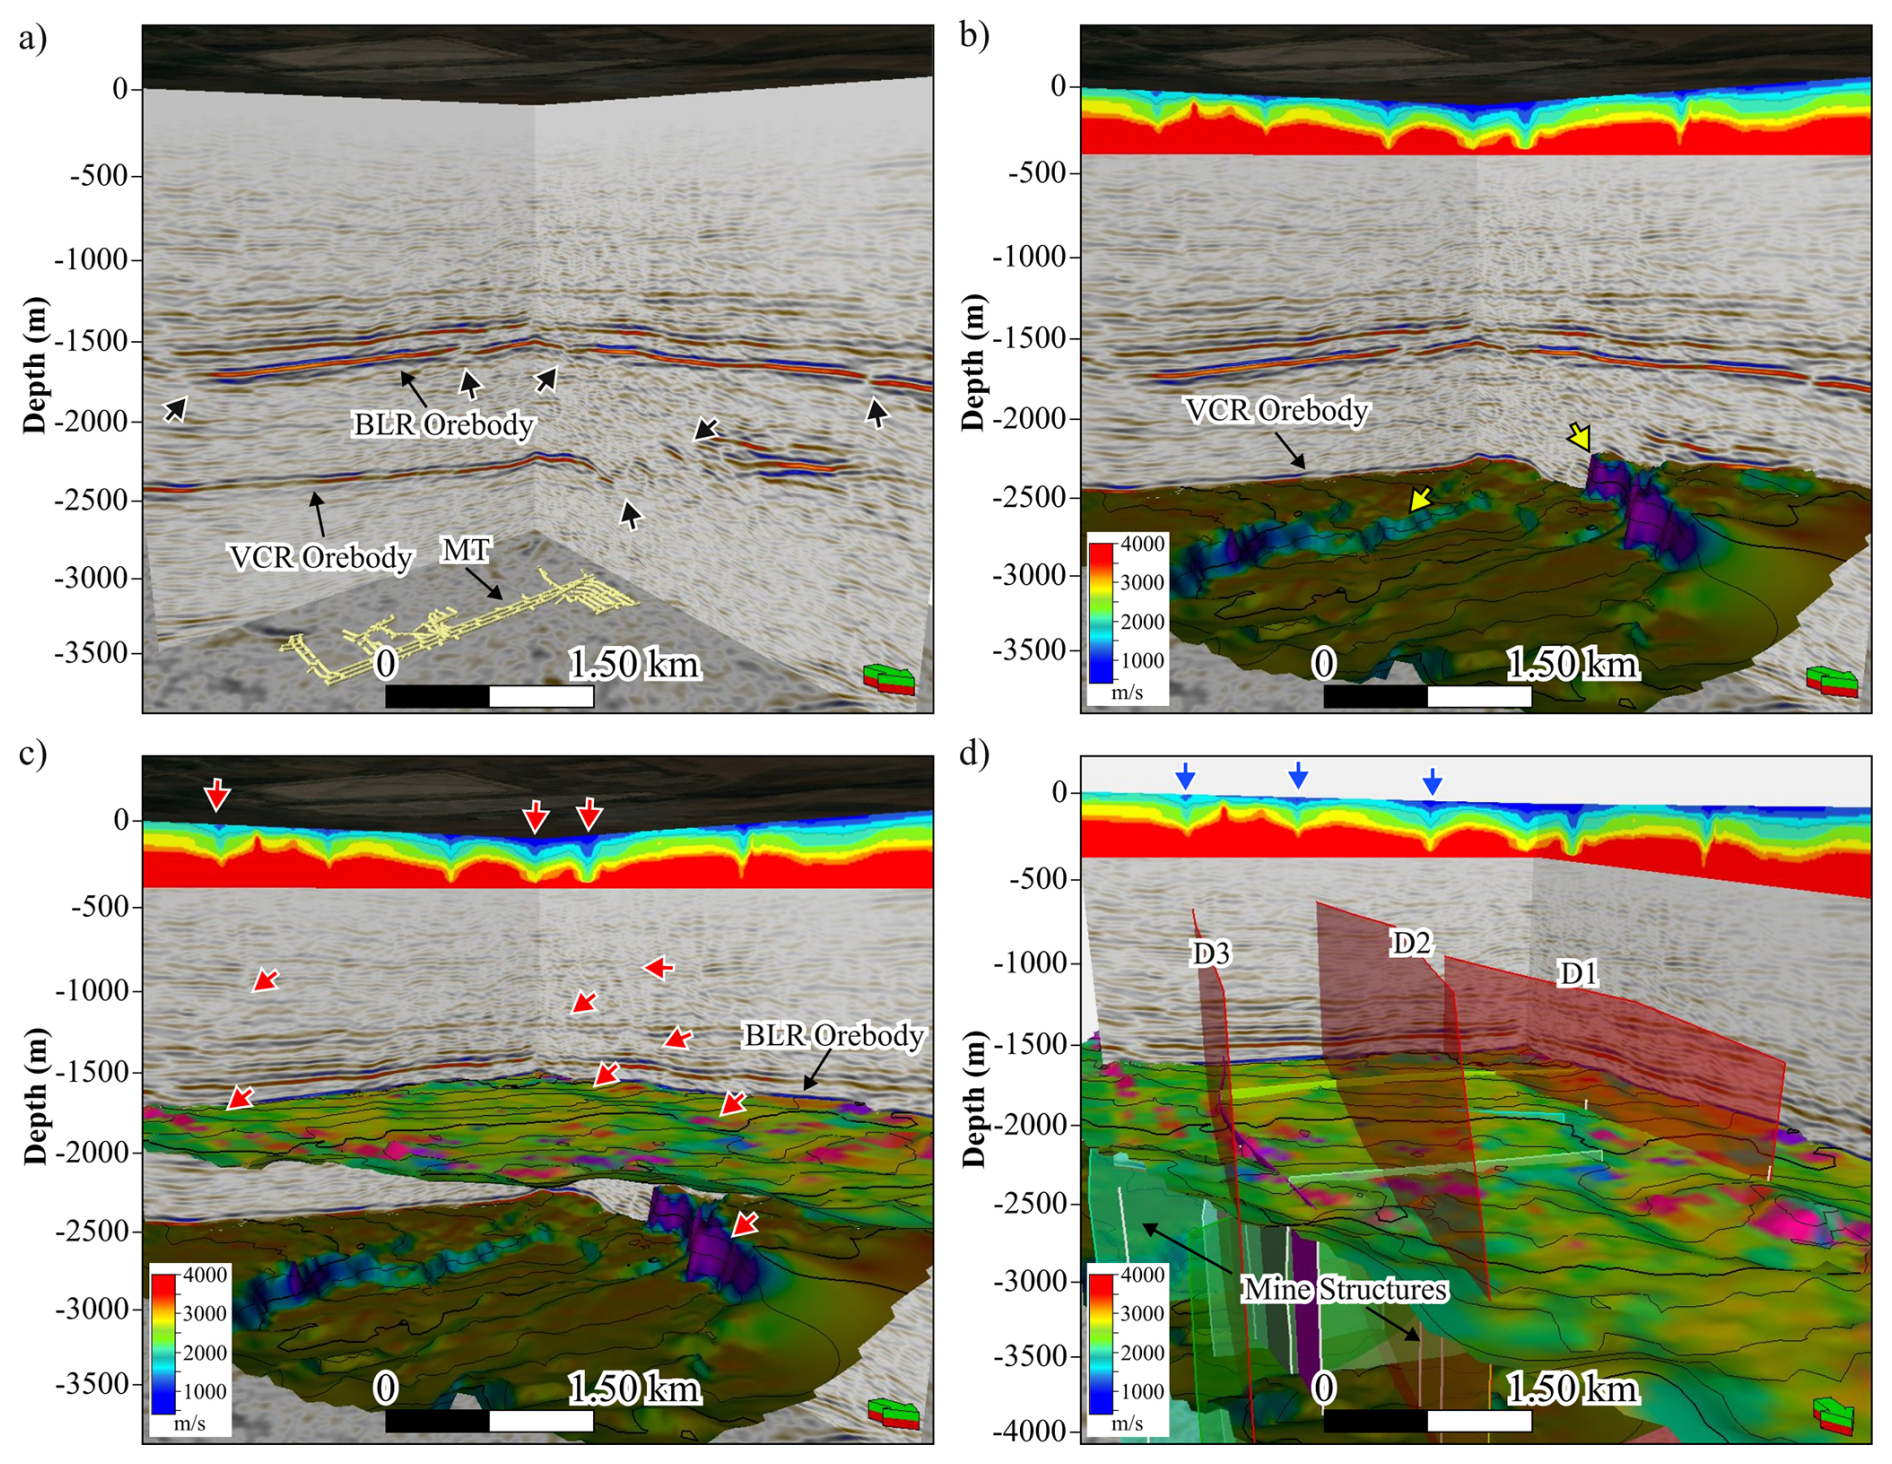
Figure 14Integration of the P-wave reflection seismic data and S-wave velocity models. (a) Pre-stack time migrated seismic section (depth converted) extracted from the 2003 legacy 3D South Deep Gold Mine seismic data. The reflection seismic data show strong and continuous reflections related to the Black Reef (BLR) unconformity, and Ventersdorp Contact Reef (VCR) orebody, and the location of the mining tunnels (MT). The black arrows point to faults that displace the BLR and VCR unconformities. (b) P-wave reflection seismic sections with the near-surface S-wave velocity model and VCR dip attribute map. The yellow arrows point to large-scale faults displacing the VCR orebody. (c) P-wave reflection sections with the BLR dip-azimuth attribute map and VCR dip attribute map. The red arrows point to small-scale faults that seem to cross-cut the entire stratigraphy. (d) Integrated 2003 depth-converted pre-stack time migrated seismic data, near-surface S-wave velocity model, and mine geological structures (faults and dykes; D-1, D-2, and D-3). The blue arrows indicate surface zones that appear to exhibit potential linkages with the geological structures (faults and dykes) observed at the mining level and imaged by the legacy 2003 3D reflection seismic data.
4.2 Structural linkage between shallow aquifers and deep mining levels
To investigate the structural geology linkage between shallow aquifers and deep mining levels, we integrated our shallow 3D Vs model with the legacy 2003 3D reflection seismic data acquired for deep gold exploration, mine planning, and development (Fig. 14a–d). The legacy 3D seismic survey covers both the South Deep Gold Mine and Kloof Gold Mine and was primarily acquired to map the VCR orebody and major fault systems (Manzi et al., 2012a). The base of the 2.65–2.05 Ga Neoarchean–Paleoproterozoic Supergroup horizon (Black Reef, ∼ 0.5 km below ground surface) and the mine orebody (VCR, ∼ 3 km below ground surface) are well-defined by the legacy 3D seismic data (Fig. 14a–d). Both the VCR orebody and the base of the Transvaal Supergroup (i.e., BLR orebody) are cross-cut by several faults with variable throws and orientations (indicated by black and red arrows in Fig. 14a). Large-scale faults mainly cross-cut the VCR orebody and underlying strata (indicated using yellow arrows, Fig. 14b). In contrast, several small-scale faults and dykes cross-cut the entire stratigraphy (e.g., VCR and BLR orebodies, and the Transvaal Supergroup rocks) as indicated by red arrows in Fig. 14c. Manzi et al. (2012b) spatially correlated the geological structures (faults and dykes) defined by the 2003 legacy seismic data at the VCR mining level with groundwater intersected through underground drilling data. The integrated data showed a good spatial correlation between water and geological structures. Manzi et al. (2012b) hypothesized that the water found at the mining level originates from the overlying near-surface fractured aquifer systems of the Transvaal Supergroup and travels through faults and dykes to the mining levels. However, due to the low resolution of the large-offset 2003 legacy 3D seismic data in the near-surface, the continuity of these faults and dykes into the overlying aquifer systems was never fully investigated (see Fig. 14a and b). This study attempts to provide some seismic constraints on the near-surface geology and previous interpretations using the SW analysis of the 2023 3D seismic data. Figure 14d shows the integration of 2003 depth-converted pre-stack time migrated seismic data, pseudo-2D S-wave sections extracted from 2023 3D seismic data, mine infrastructure (e.g., mining tunnel – MT), and mine geological structures (faults and dykes). Smoothing, by increasing the gridding bin size, was applied to the presented S-wave section to suppress the more local variations (i.e., subtle variations such as layering) and enhance the visibility of larger (regional) scale trends present in the S-wave data. As stated already, Fig. 14 shows that the P-wave seismic section lacks reflectivity in the near-surface (top ∼ 0.5 km); however, it exhibits strong reflectivity at deeper depths, i.e., between depth intervals of ∼ 0.5 to 3.5 km (Fig. 14a). Overlying the S-wave velocity model on the P-wave section enables near-surface variations and structural complexity resolved by the S-wave velocity model, to be viewed with respect to deeper structures well resolved by the P-wave seismic reflection method, including known water-bearing structures at the mining levels (Fig. 14c and d). The mine modelled and confirmed water-bearing geological structures at the mining levels include the three north-south trending dykes (here referred to as D-1, D-2 and D-3) that cross-cut the gold orebodies (VCR and Upper Elsburg Reef package) at depths between 3 and 3.5 km below the ground surface (Fig. 14d). The source of the water found at the mining level, along these dykes, is unknown. Furthermore, the continuity of these structures above the mining levels is not known since they are not well-defined on the current legacy seismic data. In determining the linkage of these dykes with the overlying aquifers, we analysed the near-surface S-wave velocity zones and investigated their spatial correlation with these dykes. The assumption is that, if the targeted structures intersect the aquifers, then they have the potential to transport water from the overlying Chuniespoort Group dolomite aquifers to the underground workings (Manzi et al., 2012b).
Figure 14d shows near-surface low-velocity zones (indicated by blue arrows, and with velocities varying from ∼ 500 to 4000 m s−1) that may correspond to known major dykes (D-1, D-2, and D-3) and fault zones present in the vicinity of the mine and is confirmed by underground mapping and drilling. The locations of the low-velocity zones on the S-wave section correlate well with the locations of the apparent fault zones and dykes imaged at the VCR mining level. The S-wave low-velocity zones are possibly structurally weak zones (e.g., fault zones) that allowed for dyke emplacement or are the weathered tops of the dykes. The dykes are mafic in composition and less competent in the near-surface compared to silicate rocks, and therefore break down easily than the surrounding rocks, resulting in lower seismic velocities relative to the surrounding rocks (Evans et al., 1998). Noted on the seismic sections is that the reflector disturbances associated with these faults and/or dykes are not well-defined within the upper units of the Transvaal Supergroup (i.e., above the BLR orebody). This could be because (1), in the case of faults, their throws are not large enough to be resolved by the seismic data, and (2), in the case of the dykes, they are near-vertical with a thickness less than the resolution limit of the legacy seismic reflection data. These dykes and linked near-surface low-velocity zones are possible water source preferential flow-pathways that act as pathways for water migration from the Chuniespoort Group dolomites into the VCR and UER mining levels. Several similar dykes and faults that displace both the BLR and VCR orebodies in the area were detected through seismic attributes, and are reported by Manzi et al. (2012b).

Figure 15Generalized geological model illustrating the sequence of geological and deformation events identified within the study area: (a) deposition of the Central Rand Group and subsequent emplacement of the Ventersdorp Supergroup, followed by a pre-Transvaal deformation event, and thereafter, the deposition of the Transvaal Supergroup (Chuniespoort and Pretoria groups); (b) faulting associated with a post-Transvaal deformation event occurs reactivating pre-existing faults and displaces the entire stratigraphic sequence; (c) the intrusion of doleritic dykes and sills along planes of weaknesses such as faults and bedding planes (pre-, syn-, and post- Bushveld in age); (d) slump-faulting associated with the dissolution of dolomites results in the displacement of the overlying Chuniespoort and Pretoria groups (post-Bushveld deformation). The dolomites of the Chuniespoort Group act as water sources (aquifers) and are displaced by faults and dykes that link them to the Upper Elsburg Reef package (underground mine workings) and thus, act as pathways for water migration from the near-surface to underground workings (water preferential flow-pathways).
5.1 Subsurface conceptual geological model drawn from the integrated datasets
Overall, the S-wave velocity results attained in this study iterate the advantages and advances that can be made from computing SW analysis on deep reflection seismic profiles. Comparing the geological information interpreted from the S-wave velocity models with proximal borehole data and known geological characteristics of the area illustrates that the subsurface information inferred from the S-wave velocity models is in agreement with a priori information. In Fig. 15, we provide a geological model and constrain the tectonic history of a portion of the Witwatersrand basin, focusing on the deeper pre-Transvaal Supergroup and post-Bushveld tectonic events within the South Deep Gold Mine. The geological model focuses on the combined near-surface and deeper P-wave reflection seismic, mine mapping, and drilling information. The geological model commences with the deposition of the Central Rand Group of the Witwatersrand Supergroup and the subsequent emplacement of the basaltic lavas of the Ventersdorp Supergroup (Fig. 15a). This is followed by a pre-Transvaal deformation event that displaces the stratigraphy of both the Central Rand Group and Ventersdorp Supergroup, respectively (Fig. 15a). Subsequently, the Chuniespoort and Pretoria groups of the Transvaal Supergroup are deposited (Fig. 15a). A post-Transvaal deformation event occurs thereafter, reactivating pre-existing faults, forming faults that displace the entire stratigraphic sequence including the Transvaal Supergroup and consists of associated splay faults (Fig. 15b). The faults act as planes of weaknesses and serve as a pathway for preferential emplacement of intrusions (doleritic dykes) during pre-, syn-, and post-Bushveld event (Fig. 15c). Doleritic sills are emplaced at an angle to the doleritic dykes along bedding planes of the Pretoria Group rocks (Fig. 15c). Lastly, slump faulting (post-Bushveld deformation) occurs due to the dissolution of dolomites of the Chuniespoort Group and displaces the overlying Chuniespoort and Pretoria groups (Fig. 15d).
5.2 Delineating water preferential flow-pathways using shallow and deeper velocity models along with mine mapping and drilling information
Gold-bearing strata of the West Rand Goldfield are overlain by an approximately 1 km thick Chuniespoort Group dolomite sequence, which is associated with karst systems that host considerable volumes of water (Fig. 15d, Wolmarans, 1984; Van Niekerk and Van der Walt, 2006). The dolomitic aquifers are compartmentalized by several fracture zones, fault zones, and dykes that link them to the underground workings and act as pathways for water migration from the near-surface to underground workings (water preferential flow-pathways) (Fig. 15d, Manzi et al., 2012b). Thus, water inflow in mining districts and water inrush are some of the serious and difficult-to-predict challenges that affect mining processes and efficiency at the mine. Mining engineers have developed several ways of reducing water inflow in mine workings, however, creating a reduction procedure is difficult without knowing the exact locations of water pathways into the mining levels. In this study, we combine a near-surface S-wave velocity model of the area, computed from the SW present in the high-resolution 2D and 3D seismic surveys, with legacy 3D reflection seismic data, and information obtained from underground mine mapping and drilling to (1) characterize and better understand near-surface lithological variations, and (2) enhance the imaging and delineation of faults and dykes that extend from the near-surface to the deeper mining levels, which may act as water preferential flow-pathways (Fig. 15d). Generally, it is difficult to exactly determine which faults and dykes act as water preferential flow-pathways, however the dykes integrated in this study have been confirmed through underground mapping to be water-bearing. The results obtained in Fig. 14 demonstrate that incorporating a near-surface S-wave velocity model along with deeper P-wave seismic reflection models, mining level mapping, and drilling information enables a more comprehensive, accurate, and reliable understanding of the subsurface environment to be drawn. In the case of South Deep Gold Mine, it allowed for possible water preferential flow-pathways linking the Chuniespoort Group dolomites with the deeper situated mining level to be delineated with more certainty. From the tectonic point of view, the near-surface S-wave velocity models show that these dykes possibly cross-cut the entire stratigraphy including the Transvaal Supergroup, indicating that these dykes were active post the deposition of the supergroup. The observation indicates that these dykes are associated with pre-, syn-, and post-Bushveld deformation events and are likely associated with intrusion events such as the Bushveld Complex, Pilanesberg Complex, and Umkondo Large Igneous Province (Hartzer, 1989; Du Plessis and Walraven, 1990; Hartzer, 1995).
Surface wave analysis, conducted on DSR surveys using MASW, was used to investigate the near-surface (top 300 m) in the vicinity of South Deep Gold Mine (South Africa) and investigate the effectiveness of integrating a near-surface S-wave velocity model with a deep reflection seismic reflection data, mine mapping, and drilling information to aid in delineating possible water preferential flow-pathways. To improve the robustness and spectral resolution of the dispersion images and thus of the S-wave velocity imaging, we were compelled to use large spatial windows to process the data. Additionally, to improve the data coverage and subsurface mapping in the study area, we utilize the reciprocity principle to increase the data density in areas where no receiver locations, but source locations, were present.
The attained near-surface S-wave velocity models revealed the occurrence of sheet-like layering, and the presence of a S-wave velocity reversal zone, marking the contact between the Hekpoort and Timeball Hill formations constituting the upper formations in the study area, respectively. The S-wave velocity analysis also revealed the occurrence of intrusive dykes, dip- and slump-faulting, which are all geological features characteristic of the West Rand Goldfield. As the mine is to be extended in the near future, the near-surface results obtained in this research reveal the need for more detailed near-surface investigations to be conducted to avoid placing future mining infrastructure in areas where it may be compromised by prevalent geological features in the area, such as fractures, joints, and faults.
Integrating a near-surface velocity model with deeper P-wave seismic reflection data, mine mapping, and drilling information introduces a novel approach to delineating possible water preferential flow-pathways to deep mining levels and has proved to possess great potential for delineating water preferential flow-pathways and possible structures that may pose a risk for deep mining. Of significance is that the results obtained in the study reveal that there is value in conducting SW analysis on DSR exploration survey data. They show that complexities that cannot be resolved by single techniques due to intrinsic limitations such as investigation depth, subsurface complexity, and velocity inversion ambiguities can be better handled by integrating shallow and deep subsurface velocity models and ground truth data.
The codes used to conduct the surface wave analysis were developed by the Politecnico di Torino researchers (co-authors in this work) as part of prior projects and are the intellectual property of the University. Therefore, they may be accessed only by contacting the co-authors from the Politecnico di Torino.
Data are not publicly accessible as they they belong to the Wits Seismic Research Centre and South Deep Gold Mine. However, requests for access to data may be directed to the co-author, Musa Manzi (musa.manzi@wits.ac.za) of the University of the Witwatersrand.
MSDM came up with the study idea, obtained funding, co-designed the seismic surveys, and guided the manuscript preparation and write-up. LVS co-developed the manuscript concept, provided guidance on data processing, and manuscript preparation. FKA designed the layered model used for surface wave processing, processed the 2D surface wave profiles, and reviewed the manuscript. CC conducted the data preparation for processing and provided valuable input in the data processing workflow. MK initiated the 3D processing and reviewed the manuscript. BAJ assisted with the manuscript preparation (discussion write-up) and interpretation. SG carried out the 3D processing, data integration, and manuscript writing. MSDM, LVS, and BAJ contributed significantly to the overall data integration, interpretation, and processing.
The contact author has declared that none of the authors has any competing interests.
Publisher's note: Copernicus Publications remains neutral with regard to jurisdictional claims made in the text, published maps, institutional affiliations, or any other geographical representation in this paper. The authors bear the ultimate responsibility for providing appropriate place names. Views expressed in the text are those of the authors and do not necessarily reflect the views of the publisher.
This article is part of the special issue “Seismic imaging from the lithosphere to the near surface”. It is not associated with a conference.
This research was funded by the FUTURE project (Fiber-optic sensing and UAV-platform techniques for innovative mineral exploration) of the ERA-NET Cofound on Raw Materials (ERA-MIN3), Advanced Orebody Knowledge (AOK), Vinnova (Sweden), Ministry of Universities and Research (Italy), National Agency for Research (France), and DSI-NRF Centre of Excellence (CoE) for Integrated Mineral and Energy Resource Analysis (CIMERA). Much gratitude goes to the Department of Science and Innovation (DSI) for funding the South African partners in the FUTURE project. We would like to extend our gratitude to South Deep Gold Mine of Gold Fields Ltd. for granting us access to their mine, permission to conduct research and publish the outcome of the research. We also wish to extend our gratitude to Smart Seismic Solutions (S3) for their assistance in the acquisition of the 2023 2D and 3D reflection seismic data. Researchers and postgraduate students from the Wits Seismic Research Centre at the University of the Witwatersrand, Politecnico di Torino, Uppsala University, and Venda University are also greatly acknowledged for their contributions to the success of the ERA-MIN3- FUTURE project.
The research was funded by the Ministry of Universities and Research (Italy) and the Department of Science and Innovation (DSI, South Africa) through the FUTURE Project (Fiber Sensing and UAV-Platform Techniques for Innovative Mineral Exploration) under the the ERA-NET Cofound on Raw Materials (ERA-MIN3).
This paper was edited by Ayse Kaslilar and reviewed by Samuel Zappalá, Milovan Urosevic, and one anonymous referee.
Auken, E. and Christiansen, A. V.: Layered and laterally constrained 2D inversion of resistivity data, Geophysics, 69, 752–61, https://doi.org/10.1190/1.1759461, 2004.
Bekker, A., Planavsky, N., Rasmussen, B., Krapez, B., Hofmann, A., Slack, J., Rouxel, O., and Konhauser, K.: Iron formations: Their origins and implications for ancient seawater chemistry, in: Treatise on geochemistry, Elsevier, 12, 561–628, https://doi.org/10.1016/B978-0-08-095975-7.00719-1, 2014.
Boiero, D. and L. V. Socco.: Retrieving lateral variations from surface wave dispersion curve analysis, Geophysical Prospecting, 58, 977–996, https://doi.org/10.1111/j.1365-2478.2010.00877.x, 2010.
Burger, A. J. and Coertze, F. J.: Radiometric age determinations on rocks from southern Africa up to the end of 1971, Bulletin Geological Society South Africa, 58, 1–46, 1973.
Button, A. and Cawthorn, R. G.: Distribution of mafic sills in the Transvaal Supergroup, northeastern South Africa, Journal of the Geological Society, 172, 357–367, https://doi.org/10.1144/jgs2014-101, 2015.
Campbell, G. and Crotty, J. H.: The application of 3-D seismic surveys to mine planning, South African Chamber of Mines MINTEK, Seminar, 1988.
Campbell, G. and Crotty, J. H.: 3-D seismic mapping for mine planning purposes at the South Deep prospect, in: Proceedings International Deep Mining Conference, edited by: Ross-Watt, D. A. J. and Robinson, P. D. K., SAIMM Symposium Series, S10, 2, 569–597, 1990.
Claerbout, J. F. and Green, I.: Basic earth imaging, Stanford University, Stanford, 2008.
Cousins, C. A.: The stratigraphy, structure and igneous rocks of the Transvaal System at the Western Areas Gold Mine, South African Journal of Geology, 65, 13–40, 1962.
Coward, M.: Structural and tectonic setting of the Permo-Triassic basins of northwest Europe, Geological Society, London, Special Publications, 91, 7–39, https://doi.org/10.1144/GSL.SP.1995.091.01.02, 1995.
Dorland, H. C.: Provenance ages and timing of sedimentation of selected neoarchean and paleoproterozoic successions on the Kaapvaal Craton, PhD thesis, Rand Afrikaans University, Johannesburg, South Africa, 326, 2004.
Du Plessis, C. P. and Walraven, F.: The tectonic setting of the Bushveld complex in Southern Africa, part 1: structural deformation and distribution, Tectonophysics, 179, 305–319, https://doi.org/10.1016/0040-1951(90)90296-K, 1990.
Eaton, D. W., Milkereit, B., and Salisbury, M. H.: Hardrock seismic exploration, Society of Exploration Geophysicists, 1–6, 2003.
Eriksson, P. G., Schweitzer, J. K., Bosch, P. J. A., Schereiber, U. M., Van Deventer, J. L., and Hatton, C. J.: The Transvaal sequence: an overview, Journal of African Earth Sciences (and the Middle East), 16, 25–51, https://doi.org/10.1016/0899-5362(93)90160-R, 1993b.
Evans, B. J., Urosevic, M., and Cocker, J.: The use of seismic methods for the detection of dykes, in: Proceedings of the 1998 Coal Operators' Conference, Mining Engineering, edited by: Aziz, N. and Kininmonth, B., University of Wollongong, 1998.
Foti, S., Lai, C. G., and Lancellotta, R.: Porosity of fluid-saturated porous media from measured seismic wave velocities, Géotechnique, 52, 359–373, https://doi.org/10.1680/geot.2002.52.5.359, 2002.
Franchi, F.: Petrographic and geochemical characterization of the Lower Transvaal Supergroup stromatolitic dolostones (Kanye Basin, Botswana), Precambrian Research, 310, 93–113, https://doi.org/10.1016/j.precamres.2018.02.018, 2018.
Frimmel, H. E.: A giant Mesoarchean crustal gold-enrichment episode.: Possible causes and consequences for exploration, in: Building Exploration Capability for the 21st Century edited by: Kelley, K. and Golden, H. C., Society of Economic Geologists, Special Publication, 209–234, https://doi.org/10.5382/SP.18.10, 2014.
Frimmel, H. E.: The Witwatersrand Basin and Its Gold Deposits, in: The Archaean Geology of the Kaapvaal Craton, Southern Africa, Regional Geology Reviews, edited by: Kröner, A. and Hofmann, A., Springer, https://doi.org/10.1007/978-3-319-78652-0, 2019.
Frimmel, H. E. and Nwaila, G. T.: Geologic evidence of syngenetic gold in the Witwatersrand Goldfields, South Africa, https://doi.org/10.5382/SP.23.31, 2020.
Gibson, M. A. S.: Interpretation of the 2003 South Deep 3D seismic survey, internal report to Gold Fields Mining, 62, 2005.
Górszczyk, A., Malinowski, M., and Bellefleur, G.: Enhancing 3D post‐stack seismic data acquired in hardrock environment using 2D curvelet transform, Geophysical Prospecting, 63(4-Hard Rock Seismic imaging), 903–918, https://doi.org/10.1111/1365-2478.12234, 2015.
Grandjean, G. and Bitri, A.: 2M-SASW: Multifold multichannel seismic inversion of local dispersion of Rayleigh waves in laterally heterogeneous subsurfaces: application to the Super-Sauze earthflow, France, Near Surface Geophysics, 4, 367–375, https://doi.org/10.3997/1873-0604.2006010, 2006.
Groves, P., Cascante, G., Dundas, D., and Chatterji, P. K.: Use of geophysical methods for soil profile evaluation, Canadian Geotechnical Journal, 48, 1364–1377, https://doi.org/10.1139/t11-044, 2011.
Hartzer, F. J.: Stratigraphy, structure, and tectonic evolution of the crocodile river fragment, South African Journal of Geology, 92, 110–124, 1989.
Hartzer, F. J.: Transvaal Supergroup inliers: geology, tectonic development and relationship with the Bushveld complex, South Africa, Journal of African Earth Sciences, 21, 521–547, https://doi.org/10.1016/0899-5362(95)00108-5, 1995.
Heinonen S., Kukkonen I., Heikkinen P., and Schmitt D.: High resolution reflection seismics integrated with deep drill hole data in Outokumpu, Finland, Geological Survey of Finland, Special Paper, 51, 105–118, ISBN 978-952-217-152-8, 2011.
Katou, M., Abe, S., Saito H., and Sato, H.: Reciprocal data acquisition and subsequent waveform matching for integrated onshore-offshore seismic profiling, Geophysical Journal International, 212, 509–521, https://doi.org/10.1093/gji/ggx374, 2017.
Khosro Anjom, F., Adler, F., and Socco, L. V.: Comparison of surface-wave techniques to estimate S- and P-wave velocity models from active seismic data, Solid Earth, 15, 367–386, https://doi.org/10.5194/se-15-367-2024, 2024.
Killick, A. M.: Pseudotachylites of the West Rand Goldfield, Witwatersrand Basin, South Africa, Doctor of Philosophy Thesis, Rand Afrikaans University, Johannesburg South Africa, 18, 1992.
Knopoff, L. and Gangi, A. F.: Seismic reciprocity, Geophysics, 24, 681–691, https://doi.org/10.1190/1.1438647, 1959.
Kositcin, N. and Krapež, B.: Relationship between detrital zircon age-spectra and the tectonic evolution of the Late Archaean Witwatersrand Basin, South Africa, Precambrian Research, 129, 141–168, https://doi.org/10.1016/j.precamres.2003.10.011, 2004.
Laake, A., Strobbia, C., and Cutts, A.: Integrated approach to 3D near surface characterization in desert regions, First Break, 26, https://doi.org/10.3997/1365-2397.26.1293.28614, 2008.
Lin, C. P., Lin, C. H., and Chien, C. J.: Dispersion analysis of surface wave testing–SASW vs. MASW, Journal of Applied Geophysics, 143, 223–230, https://doi.org/10.1016/j.jappgeo.2017.05.008, 2017.
Malehmir, A., Koivisto, E., Manzi, M., Cheraghi, S., Durrheim, R. J., Bellefleur, G., Wijns, C., Hein, K. A., and King, N.: A review of reflection seismic investigations in three major metallogenic regions: The Kevitsa Ni–Cu–PGE district (Finland), Witwatersrand goldfields (South Africa), and the Bathurst Mining Camp (Canada), Ore Geology Reviews, 56, 423–441, https://doi.org/10.1016/j.oregeorev.2013.01.003, 2014.
Malehmir, A., Wang, S., Lamminen, J., Brodic, B., Bastani, M., Vaittinen, K., Juhlin, C., and Place, J.: Delineating structures controlling sandstone-hosted base-metal deposits using high-resolution multicomponent seismic and radio-magnetotelluric methods: a case study from Northern Sweden, Geophysical Prospecting, 63, 774–797, https://doi.org/10.1111/1365-2478.12238, 2015.
Malehmir, A., Maries, G., Bäckström, E., Schön, M., and Marsden, P.: Developing cost-effective seismic mineral exploration methods using a landstreamer and a drophammer, Scientific Reports, 7, 10325, https://doi.org/10.1038/s41598-017-10451-6, 2017.
Manzi, M. S., Durrheim, R. J., Hein, K. A., and King, N.: 3D edge detection seismic attributes used to map potential conduits for water and methane in deep gold mines in the Witwatersrand basin, South Africa, Geophysics, 77, WC133–WC147, https://doi.org/10.1190/geo2012-0135.1, 2012a.
Manzi, M. S., Gibson, M. A., Hein, K. A., King, N., and Durrheim, R. J.: Application of 3D seismic techniques to evaluate ore resources in the West Wits Line goldfield and portions of the West Rand goldfield, South Africa, Geophysics, 77, WC163–WC171, https://doi.org/10.1190/geo2012-0133.1, 2012b.
Manzi, M. S., Hein, K. A., King, N., and Durrheim, R. J.: Neoarchaean tectonic history of the Witwatersrand Basin and Ventersdorp Supergroup: New constraints from high-resolution 3D seismic reflection data, Tectonophysics, 590, 94–105, https://doi.org/10.1016/j.tecto.2013.01.014, 2013a.
Manzi, M. S., Hein, K. A. A., Durrheim, R., and King, N.: Seismic attribute analysis to enhance detection of thin gold-bearing reefs: South Deep gold mine, Witwatersrand basin, South Africa, Journal of Applied Geophysics, 98, 212–228, https://doi.org/10.1016/j.jappgeo.2013.08.017, 2013b.
Martin, D. M., Clendenin, C. W., Krapez, B., and McNaughton, N. J.: Tectonic and geochronological constraints on late Archaean and Palaeoproterozoic stratigraphic correlation within and between the Kaapvaal and Pilbara Cratons, Journal of the Geological Society, 155, 311–322, https://doi.org/10.1144/gsjgs.155.2.0311, 1998.
Masethe, R. T., Manzi, M. S., and Durrheim, R. J.: Using legacy 3D seismic data and source parameters of mining-induced earthquakes to mitigate the risk of rockbursting in Kloof Gold Mine, South Africa, Geophysical Prospecting, 71, 1281–1311, https://doi.org/10.1111/1365-2478.13319, 2023.
McCarthy, T. S.: The Witwatersrand Supergroup. The Geology of South Africa, Geological Society of South Africa, ISBN 1-919908-77-3978-1-919908-77-9, 2006.
Mutshafa, N., Manzi, M. S., Westgate, M., James, I., Brodic, B., Bourdeau, J. E., Durrheim, R. J., and Linzer, L.: Seismic imaging of the gold deposit and geological structures through reprocessing of legacy seismic profiles near Kloof–Driefontein Complex East Mine, South Africa, Geophysical Prospecting, 71, 1181–1196, https://doi.org/10.1111/1365-2478.13283, 2023.
Neducza, B.: Stacking of surface waves, Geophysics, 72, V51–V58, https://doi.org/10.1190/1.2431635, 2007.
Nwaila, G. T., Frimmel, H. E., Zhang, S. E., Bourdeau, J. E., Tolmay, L. C., Durrheim, R. J., and Ghorbani, Y.: The minerals industry in the era of digital transition: An energy-efficient and environmentally conscious approach, Resources Policy, 78, 102851, https://doi.org/10.1016/j.resourpol.2022.102851, 2022.
Nwaila, G. T., Ghorbani, Y., Becker, M., Frimmel, H. E., Petersen, J., and Zhang, S.: Geometallurgical approach for implications of ore blending on cyanide leaching and adsorption behavior of Witwatersrand gold ores, South Africa, Natural Resources Research, 29, 1007–1030, https://doi.org/10.1007/s11053-019-09522-4, 2020.
Osburn, K., Pretorius, H., Kock, D., King, N., Pillaye, R., and Hlangwane, M.: Enhanced geological modelling of the Upper Elsburg reefs and VCR to optimize mechanized mine planning at South Deep Gold Mine, Journal of the Southern African Institute of Mining and Metallurgy, 114, 265–273, 2014.
Papadopoulou, M., Da Col, F., Mi, B., Bäckström, E., Marsden, P., Brodic, B., Malehmir, A., and Socco, L. V.: Surface-wave analysis for static corrections in mineral exploration: A case study from central Sweden, Geophysical Prospecting, 68, 214–231, https://doi.org/10.1111/1365-2478.12895, 2020.
Park, C. B., Miller, R. D., and Xia, J.: Imaging dispersion curves of surface waves on multi-channel record, Society of Exploration Geophysicists Technical Program Expanded Abstracts, 1377–1380, https://doi.org/10.1190/1.1820161, 1998.
Parsons, C. F. and Killick, A. M.: A reassessment of the structure of the dolomite inliers southeast of Westonaria, South African Journal of Geology, 93, 438–442, 1990.
Pegah, E. and Liu, H.: Application of near-surface seismic refraction tomography and multichannel analysis of surface waves for geotechnical site characterizations: A case study, Engineering Geology, 208, 100–113, https://doi.org/10.1016/j.enggeo.2016.04.021, 2016.
Pileggi, D., Rossi, D., Lunedei, E., and Albarello, D.: Seismic characterization of rigid sites in the ITACA database by ambient vibration monitoring and geological surveys, Bulletin of Earthquake Engineering, 9, 1839–1854, https://doi.org/10.1007/s10518-011-9292-0, 2011.
Pretorius, C. C., Jamison, A. A., and Irons, C.: Seismic exploration in the Witwatersrand Basin, Republic of South Africa, in: Proceedings of Exploration '87, edited by: Garland, G. D., Ontario Geological Survey, 3, 241–253, 1989.
Rapetsoa, M. K., Manzi, M. S. D., Sihoyiya, M., Malehmir, A., James, I., Socco, L. V., Lepine, J., Colombero, C., Valeshin, O., and Durrheim, R. J.: Advanced seismic acquisition techniques in South African mines: Insights from the FUTURE project, Journal of the Southern African Institute of Mining and Metallurgy, 125, 25–32, https://doi.org/10.17159/2411-9717/3432/2025, 2025.
Saunders S., Lamb P., and Sweeney D.: High resolution seismic for resolving coal seam structure in difficult terrain, Geophysics, 22, 325–332, https://doi.org/10.1071/EG991325, 1991.
Sheriff, R. E.: Encyclopedic dictionary of applied geophysics, 4th Edn., Society of Exploration Geophysicists, Tulsa, https://doi.org/10.1190/1.3490392, 2002.
Smith, A. J. and Beukes, N. J.: Palaeoproterozoic Banded Iron formationhosted High-Grade Hematite Iron Ore Deposits of the Transvaal Supergroup, South Africa, Episodes, 39, 269–284, https://doi.org/10.18814/epiiugs/2016/v39i2/95778, 2016.
Socco, L. V. and Strobbia, C.: Surface-wave method for near-surface characterization: A tutorial, Near Surface Geophysics, 2, 165–185, https://doi.org/10.3997/1873-0604.2004015, 2004.
Socco, L. V., Boiero, D., Foti, S., and Wisén, R.: Laterally constrained inversion of ground roll from seismic reflection records, Geophysics, 74, G35–G45, https://doi.org/10.1190/1.3223636, 2009.
Socco, L. V., Foti, S., and Boiero, D.: Surface-wave analysis for building near-surface velocity models – Established approaches and new perspectives, Geophysics, 75, 75A83–75A102, https://doi.org/10.1190/1.3479491, 2010.
Socco L. V., Comina, C., and Khosro Anjom, F.: Time-average velocity estimation through surface-wave analysis: Part 1 – S-wave velocity, Geophysics, 82, U49–U59, https://doi.org/10.1190/geo2016-0367.1, 2017.
Socco, L. V., Papadopoulou, M., Federico, D. C., Chiara, C., Emma, B., Paul, M., and Alireza, M.: Surface wave dispersion analysis in hard rock sites: challenges and opportunities, Geophysical Research Abstracts, 21, 2019EGUGA..2118283V, 2019.
Strong, S.: Modelling complex near-surface features to improve shallow seismic exploration, ASEG Extended Abstracts, 2018, 1–4, https://doi.org/10.1071/ASEG2018abW10_2A, 2018.
Urosevic, M., Sherlock, D., Kepic, A., and Dodds, K.: Land seismic acquisition repeatability for time-lapse monitoring of CO2 sequestration, ASEG Extended Abstracts, 2007, https://doi.org/10.1071/ASEG2007ab131, 2007.
Van Niekerk, H. J. and Van der Walt, I. J.: Dewatering of the Far West Rand dolomitic area by gold mining activities and subsequent ground instability, Land Degradation & Development, 17, 441–452, https://doi.org/10.1002/ldr.749, 2006.
Veevers, J. J.: Morphotectonics of rifted continental margins in embryo (East Africa), youth (Africa-Arabia), and maturity (Australia), Journal of Geology, 89, 57–82, https://doi.org/10.1086/628564, 1981.
Vermaakt, D. T., Chunnet, I. E., and Anhaeusser, C. R.: Tectono-sedimentary processes which controlled the deposition of the Ventersdorp Contact Reef within the West Wits Line, in: Proceedings of the 15th Congress of the Council for Mining and Metallurgical Institutions, South African Institute of Mining and Metallurgy, 117–130, 1994.
Walraven, F., Armstrong, R. A., and Kruger, F. J.: A chronostratigraphic framework for the north-central Kaapvaal craton, the Bushveld Complex and the Vredefort structure, Tectonophysics, 171, 23–48, https://doi.org/10.1016/0040-1951(90)90088-P, 1990.
Wilczynski, Z., Kaslilar, A., Malehmir, A., Manzi, M., Vivin, L., Lepine, J., Valishin, O., and Högdahl, K.: Ambient noise surface-wave imaging in a hardrock environment: implications for mineral exploration, Geophysical Journal International, 240, 571–590, https://doi.org/10.1093/gji/ggae392, 2025.
Wisén, R. and Christiansen, A. V.: Laterally and mutually constrained inversion of surface wave seismic data and resistivity data, Journal of Environmental & Engineering Geophysics, 10, 251–262, https://doi.org/10.2113/JEEG10.3.251, 2005.
Wolmarans, J. F.: Ontwatering van die dolomietgebied aan die verre Wes-Rand: gebeure in perspektief, University of Pretoria (South Africa), 1984.
Zhou, B., Hatherly, P., Peters, T., and Sun, W.: Experience with the issue of seismic surveying over basalts, ASEG Extended Abstracts, 1–5, https://doi.org/10.1081/22020586.2010.12041919, 2010.
Zhu, X., Valasek, P., Roy, B., Shaw, S., Howell, J., Whitney, S., Whitmore, N. D., and Anno, P.: Recent applications of turning-ray tomography, Geophysics, 73, VE243–VE254, https://doi.org/10.1190/1.2957894, 2008.