the Creative Commons Attribution 4.0 License.
the Creative Commons Attribution 4.0 License.
 | 03 Mar 2026
Unveiling tectonic deformation in El Salvador through GNSS and InSAR kinematic modelling
Juan Portela
Alejandra Staller
Cécile Lasserre
Beatriz Cosenza-Muralles
José Antonio Álvarez-Gómez
José Jesús Martínez-Díaz
The El Salvador Fault Zone (ESFZ) accommodates most of the differential motion between the Central America Volcanic Forearc and the Chortís block in Central America. By combining recent Global Navigation Satellite System (GNSS) and Interferometric Synthetic Aperture Radar (InSAR) observations, we develop the first kinematic block model for El Salvador that jointly inverts both data types. The model refines previous regional studies by resolving slip partitioning within the ESFZ and its continuations in Guatemala and the Gulf of Fonseca. Our preferred model predicts total slip rates of about 14 mm yr−1 across the central ESFZ, distributed between a northern branch (5–8 mm yr−1 dextral, 3–7 mm yr−1 normal) and a southern branch (2–6 mm yr−1 dextral). Dextral motion decreases toward the Jalpatagua Fault in Guatemala and toward the San Miguel Fault in eastern El Salvador, increasing again along the Marrabios Fault in Nicaragua. Subduction coupling beneath El Salvador appears weak (Φ≈0.2) and confined to shallow depths, strengthening westward into Guatemala. These results highlight a strongly coupled volcanic arc and a weakly coupled subduction interface. Future seafloor geodetic measurements and new radar satellite missions could improve constraints on slab coupling and crustal deformation processes in this seismically active region.
- Article
(16681 KB) - Full-text XML
-
Supplement
(12894 KB) - BibTeX
- EndNote


The Republic of El Salvador is located on the Pacific coast of Central America. The country's seismic activity is very high due to its situation close to the convergent margin of the Cocos and Caribbean plates. The Cocos Plate subducts beneath the Chortís Block (a stable, continental block within the Caribbean Plate) in the Middle America Trench (MAT in Fig. 1) at a rate of 70–80 mm yr−1 (DeMets et al., 2010), generating volcanism along the Central American Volcanic Arc (CAVA), which extends across El Salvador in a WNW-ESE direction. Despite the weak coupling estimated in the subduction slab by previous geodetic studies (e.g., Alvarado et al., 2011; Correa-Mora et al., 2009), significant seismic activity occurs in the subduction zone, either due to thrusting along the shallow interface or normal faulting at greater depths. The latter type of events present high destructive potential due to their proximity to land, as shown by the Mw 7.6 earthquake of January 2001 (Bommer et al., 2002).
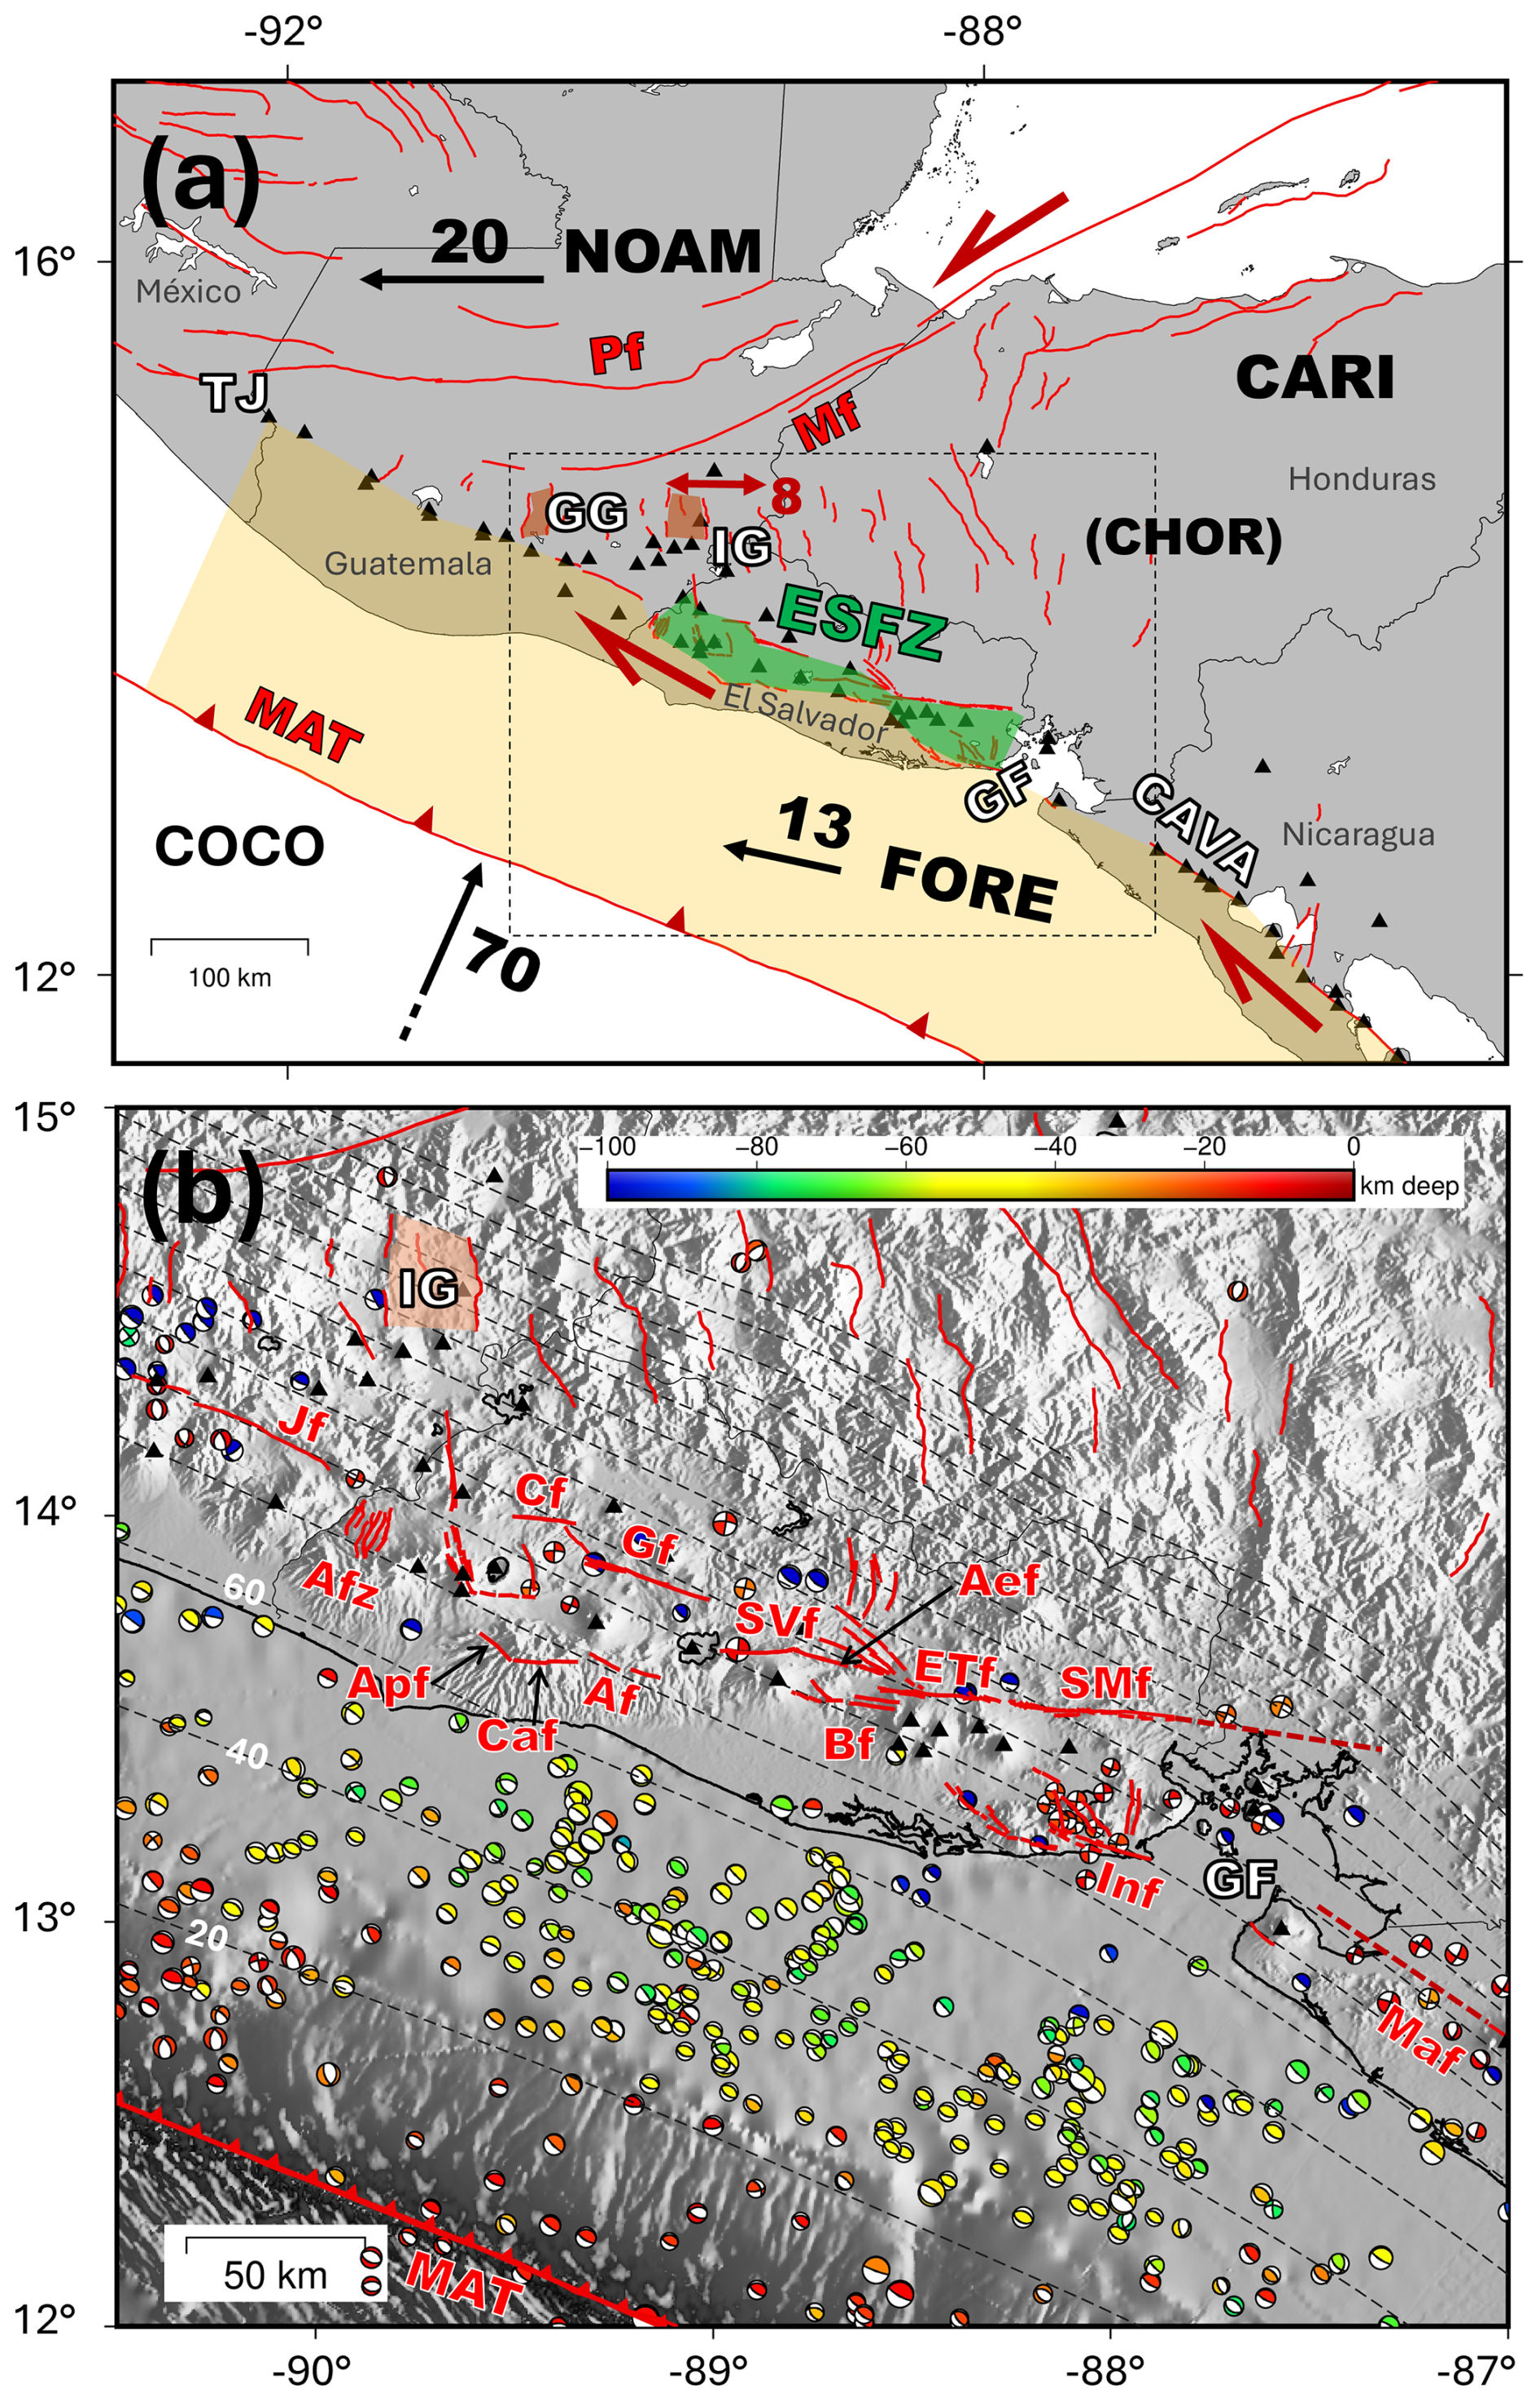
Figure 1Tectonic setting in El Salvador and adjacent areas. (a) Regional tectonic context, naming the main tectonic plates and blocks in black (COCO – Cocos plate, CARI – Caribbean plate, NOAM – North American plate, CHOR – Chortís block, FORE – Forearc Block). The approximate extent of the latter is shown as a shaded orange area. Their approximate motions with respect to CHOR are shown as black vectors (labels in mm yr−1). The extension of the El Salvador Fault Zone (ESFZ) is highlighted in green. Other geological and geographical features are named in white: CAVA – Central America Volcanic Arc, GF – Gulf of Fonseca, GG – Guatemala Graben, IG – Ipala Graben, TJ – Triple Junction. Faults are represented as red lines and retrieved from Martínez-Díaz et al. (2021) and CCARA-GEM (Styron et al., 2020). Their general kinematics are shown as red vectors. Volcanoes are depicted as black triangles. (b) Tectonic context in El Salvador. Subduction slab depth contours (every 20 km) from Hayes et al. (2018) are shown as dashed black lines. Focal mechanisms of earthquakes with Mw ≥ 5 and Depth ≤ 120 km are retrieved from NEIC, ISC (2023). Shaded bathymetry from GEBCO Compilation Group (2020). Shaded topography from the 1 arcsec resolution SRTM30 (Farr et al., 2007). Fault abbreviations (in red): Af – Ayagualo-Panchimalco fault, Aef – Apastepeque fault, Afz – Ahuachapán fault zone, Apf – Apaneca fault, Bf – Berlín fault, Cf – Comecayo fault, Caf – Comasagua fault, ETf – El Triunfo fault, Gf – Guaycume fault, Inf – Intipuca fault, Jf – Jalpatagua fault, Mf – Motagua fault, Maf – Marrabios fault, MAT – Middle America Trench, Pf – Polochic fault, SMf – San Miguel fault, SVf – San Vicente fault. We also show the continuation of the Maf and SMf proposed by Portela et al. (2024) as dashed red lines.
The forearc block (FORE in Fig. 1), located between the MAT and the CAVA, moves toward the northwest at a rate of approximately 12–14 mm yr−1 relative to the Chortís block (Álvarez-Gómez et al., 2019). The motion of the forearc is attributed to one of the following factors: (1) a pushing effect due to the subduction of the Cocos Ridge and higher coupling in Costa Rica (Kobayashi et al., 2014; LaFemina et al., 2009); (2) a dragging effect from the North American plate in Guatemala (Álvarez-Gómez et al., 2008; Rodríguez et al., 2009); or (3) a combination of both (Álvarez-Gómez et al., 2019). To the west, the forearc gradually integrates into the North American plate, causing its movement to shift from NW-ward to W-ward and leading to increased coupling along the subduction interface in western Guatemala (e.g., Álvarez-Gómez et al., 2019). This happens in the vicinity of the triple junction of the Caribbean, Cocos and North American plates (TJ in Fig. 1). The Chortís block experiences an eastward escape with respect to the North American plate and the forearc (e.g., Plafker, 1976; Authemayou et al., 2011), causing extension in eastern Guatemala and southern Honduras, which is translated into the existence of grabens, such as the Ipala graben (IG in Fig. 1) and the Guatemala City graben (GG).
The relative motion of the forearc with respect to the Chortís block is accommodated in El Salvador by the El Salvador Fault Zone (ESFZ, Fig. 1), a system of dextral strike-slip faults and minor N–S to NNW–SSE normal faults, extending along the CAVA (Martínez-Díaz et al., 2004). The faults of the ESFZ are capable of generating destructive earthquakes, as they originate at shallow depths and are located near urban centers (Legrand et al., 2020). Such was the case with the February 2001 Mw 6.5 earthquake, associated with the San Vicente fault (Canora et al., 2010).
Geodetic techniques, such as the Global Navigation Satellite System (GNSS) and Interferometric Synthetic Aperture Radar (InSAR), play a key role in monitoring surface deformation and assessing seismic hazard (Elliott et al., 2016). The integration of both techniques has become increasingly common for measuring interseismic deformation worldwide (e.g., Huang et al., 2022; Lemrabet et al., 2023; Marconato et al., 2024; Maubant et al., 2022; Wang et al., 2019; Watson et al., 2024). Elastic block models are widely used to estimate the kinematics of faults and tectonic blocks (e.g., Ellis et al., 2019; Portela et al., 2025; Zhang et al., 2025). By inverting geodetic data, these models help quantify fault slip rates, coupling and block rotations. In the past decades, geodetic block models were based primarily on the inversion of GNSS data. More recently, the joint inversion of GNSS and InSAR data has resulted in improved spatial resolution and has revealed increasing complexity throughout the seismic cycle of crustal faults and subduction zones (e.g., Fang et al., 2024; Woods et al., 2024; Wu et al., 2024; Xu et al., 2025).
Numerous tectonic studies incorporating GNSS data have been carried out in El Salvador, especially after the 2001 devastating earthquakes (Canora et al., 2014; Garibaldi et al., 2016; Legrand et al., 2020; Portela et al., 2024; Staller et al., 2016). Past regional kinematic block models in Central America (Ellis et al., 2019; Franco et al., 2012; Garnier et al., 2022), simplify the ESFZ as a single E–W fault, and are based on GNSS observations (among other data). Staller (2014) developed a more local model for the ESFZ, but the number of available GNSS stations (and the time span of their observations) was scarce. Since those studies were published, new continuous and episodic GNSS stations have been installed and observed.
To date, no kinematic block models in the region have integrated GNSS and InSAR data. Moreover, few studies have used InSAR in El Salvador, and they focus on non-tectonic applications at small scales, such as deformations in San Salvador (e.g., Chavez Hernandez et al., 2020; Kowalski et al., 2017) or volcanic deformation (Ebmeier et al., 2013; Pritchard et al., 2018; Schiek et al., 2008), with the latter not detecting significant deformation. Cosenza-Muralles et al. (2022) presented a velocity field for Guatemala and Honduras based on Sentinel-1 and GNSS data, without including El Salvador. Recently, Portela et al. (2024) produced the first continuous velocity field for El Salvador, combining GNSS and InSAR data from ALOS PALSAR.
In this study, we update previous kinematic models, aiming to develop a more local, ESFZ-focused block model while also incorporating its terminations in Guatemala and the Gulf of Fonseca. We use the updated GNSS and InSAR velocity field of the region from Portela et al. (2024). This approach allows for a more localised and precise kinematic characterization of the ESFZ faults and its western and eastern terminations.
2.1 Geodetic data
We use GNSS and InSAR data acquired over El Salvador to model and analyse tectonic deformation in the country and surrounding regions. In particular, we make use of the recently published GNSS and ALOS velocities from Portela et al. (2024). Details on data acquisition, processing, and analysis are provided in the publication; nonetheless, we briefly describe the dataset here.
Portela et al. (2024) process GNSS observations (in the period 2000–2022) from 171 continuous and episodic stations across El Salvador and the Caribbean. Using Bernese 5.2 software (Dach et al., 2015), they conduct a static, relative processing, tying their solution to the ITRF2014 reference frame (Altamimi et al., 2016). They obtain the ITRF2014 interseismic velocities by modelling the GNSS time series, accounting for seasonal, coseismic and postseismic signals. We show their Caribbean-fixed horizontal velocities in Fig. 2a.
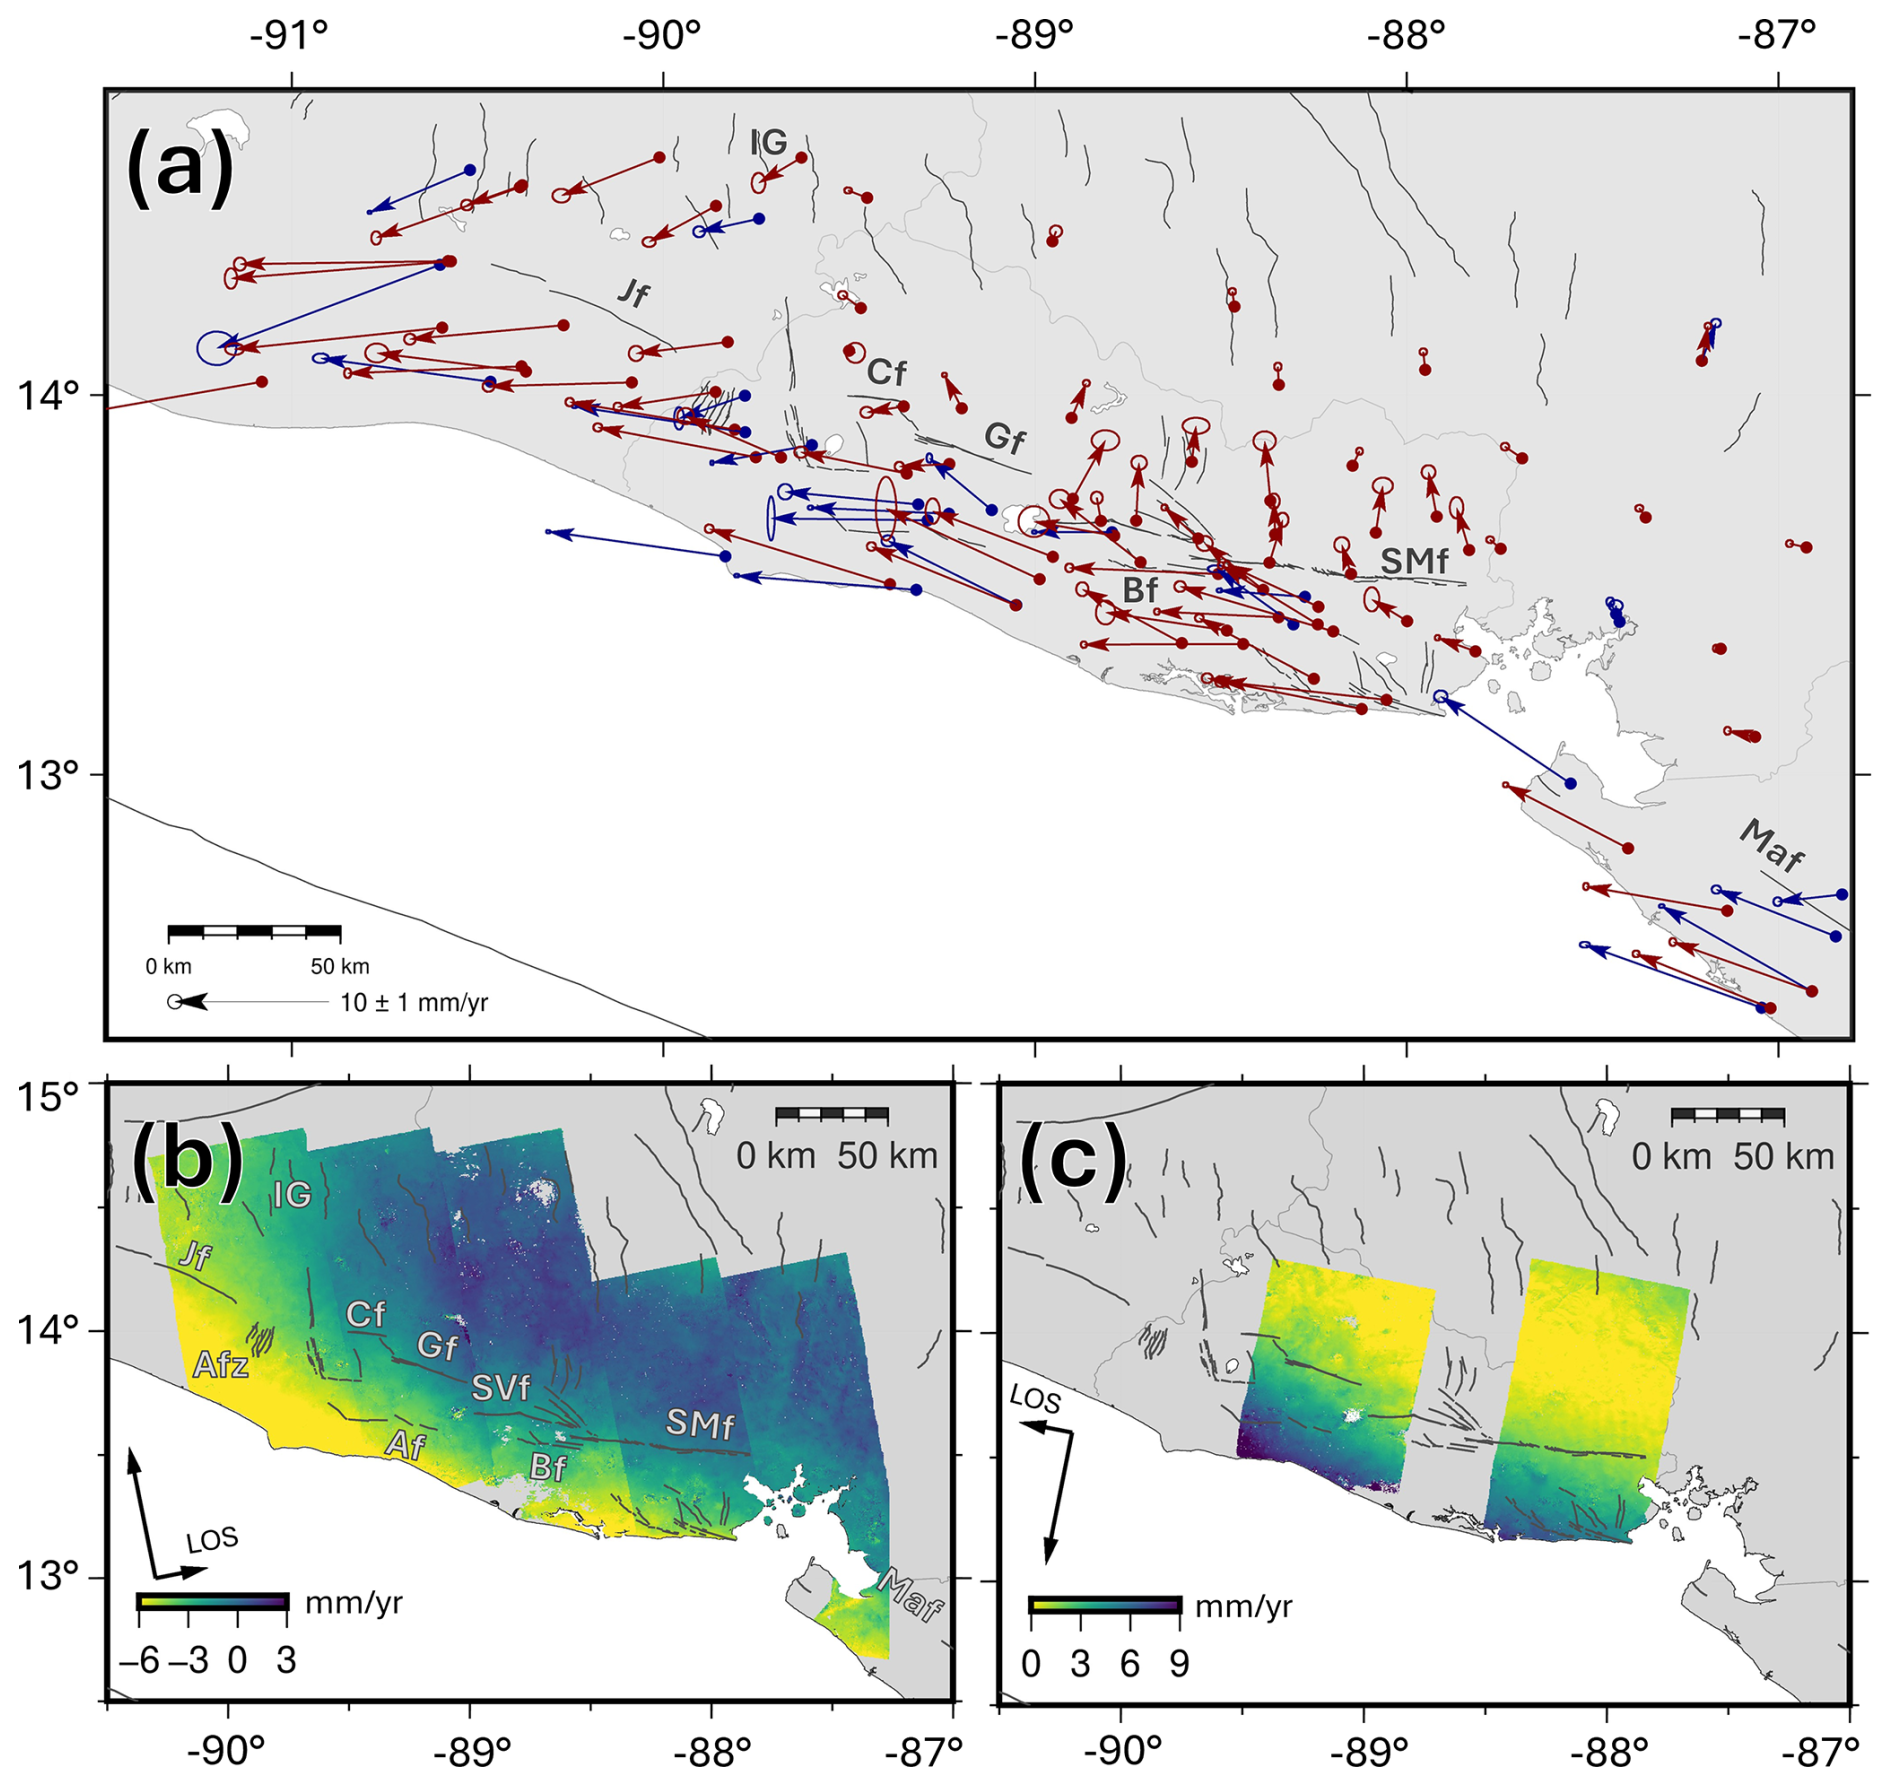
Figure 2Geodetic data used as input for the models (Portela et al., 2024). (a) GNSS Caribbean-fixed horizontal velocities for continuous (blue vectors) and episodic (red vectors) stations, and their 2σ uncertainties (error ellipses). (b) Ascending LOS velocities tied to the Caribbean plate. (c) Descending LOS velocities tied to the Caribbean plate. Negative velocities indicate movement towards the satellite. Black vectors show the LOS observing geometry. Faults are shown as dark grey lines (some of them are labelled following Fig. 1).
In parallel, they employ a small-baseline approach to form interferograms from ALOS PALSAR images (in the period 2006–2011) using the ISCE software (https://github.com/isce-framework/isce2, last access: February 2026), providing full coverage of El Salvador in ascending orbit and partial coverage in descending orbit (Fig. 2b, c). They determine line-of-sight (LOS) time series and average velocities with the Π-Rate software (Wang et al., 2012), tying the LOS velocities to ITRF2014, and later to the Caribbean plate (Fig. 2b, c) through the GNSS velocities.
The horizontal Caribbean-fixed GNSS velocities in El Salvador (Fig. 2a) show ∼ 12 mm yr−1 of westward motion in the stations south of the ESFZ, and 2–3 mm yr−1 of northward motion north of the fault zone (i.e., those located on the Chortís block). However, north of the Jalpatagua fault (Jf), in the graben area of eastern Guatemala, the velocities show a distinctive motion towards the W–SW. The interseismic motion is predominantly horizontal, with vertical displacement being less relevant except in a few specific stations (Fig. S1 in the Supplement). For this reason, we exclude the GNSS vertical velocities from our models.
The ALOS LOS velocities, referenced to the Caribbean plate, are presented in ascending (Fig. 2b) and descending (Fig. 2c) geometries. They show good agreement with the GNSS velocities (see Portela et al., 2024 for more details), with ∼ 7 mm yr−1 of LOS motion toward the satellite south of the ESFZ in the ascending geometry and ∼ 6 mm yr−1 of LOS motion away from the satellite in the descending geometry. The velocities also suggest that west of the ESFZ, deformation is not fully transferred to the Jf but is instead distributed between the Jf and the grabens in eastern Guatemala.
In this study, we use the horizontal ITRF2014 GNSS velocities (Fig. S2) from stations located in El Salvador and adjacent areas, as the Euler rotation poles are calculated with respect to the ITRF2014 reference frame. Consequently, we also use the ALOS LOS velocities (from ascending and descending orbits) referenced to ITRF2014.
2.2 Strain rate field
The determination of the strain rate field from geodetic velocities provides additional insight into crustal deformation, aiding in the interpretation of results and the definition of blocks in kinematic models. For calculating the strain rate field in El Salvador, we follow the method of Shen et al. (2015) to estimate strain rates on a grid using discrete horizontal GNSS velocities. The software StrainTool (https://dsolab.github.io/StrainTool, last access: February 2026; Anastasiou et al., 2024) was used to derive a horizontal strain rate field for El Salvador and surrounding regions.
Currently, InSAR data is excluded from the strain estimation due to its incomplete coverage of the study area in both geometries. The calculations are limited to regions with the highest density of GNSS stations: El Salvador, eastern Guatemala, southern Honduras, and northwestern Nicaragua, excluding stations located further away. GNSS stations near the San Miguel volcano (SMv in Fig. 4) are excluded, as well as other stations showing anomalous behaviour (AGLA, ICHA, SSIA) and the campaign station SSAS, which caused artifacts due to its proximity to the continuous station AIES.
We compute the strain rates on a 0.15° × 0.15° grid. An optimal smoothing parameter D (Shen et al., 2007) is estimated for each grid point, with a search range of D from 1 to 500 km (approximately the NW–SE extent of the calculation area) and a step size of 1 km. Several values for Wt (the threshold for total data reweighting coefficients) were tested, ranging from 0 to 15. Ultimately, Wt = 7 is adopted, as this threshold appears to mark a turning point where higher Wt values provide little additional benefit in reducing the standard deviation of strain field parameters, while effectively limiting over-smoothing.
2.3 Kinematic modelling
Kinematic block models simulate lithospheric deformation as the movement of rigid blocks rotating at specific angular velocities (ωx, ωy, ωz), with elastic deformation accumulating along their boundaries (faults). We use the TDEFNODE software (McCaffrey, 2009) to build kinematic models of the Earth's lithosphere that help assess the tectonic deformation in El Salvador, by obtaining the slip rates and coupling ratio of the main faults, as well as the angular velocities of the defined blocks. Our models are fed by the geodetic measurements (GNSS and InSAR) of surface displacement described in Sect. 2.1 and Portela et al. (2024).
Fault coupling (Φ) refers here to the fraction of relative plate motion that is not accommodated by aseismic slip, instead accumulating elastic strain along fault boundaries (McCaffrey, 2002). We use the term slip rate (S) as the fraction of the total differential motion between blocks (V) accommodated in the fault; i.e., taking the coupling ratio into account (S=ΦV).
2.3.1 Geometry definition
In TDEFNODE, tectonic blocks are modelled as polygons bounded by faults or free boundaries (McCaffrey, 2002; Meade et al., 2002). The faults are discretised in nodes along strike and depth, in which the defined parameters (Φ,V) are determined in the inversion.
The geometry of the blocks and faults is based on the following factors: (1) the mapped faults in El Salvador (Martínez-Díaz et al., 2021) and the surrounding region (Styron et al., 2020), as well as previous segmentations of fault zones (e.g., Canora et al., 2014); (2) the three-dimensional Slab-2 geometry of the Cocos plate subducting slab, provided by the USGS (Hayes et al., 2018); (3) the distribution of seismicity and tectonic studies in El Salvador; (4) the geometries of previously published block models in the area (Ellis et al., 2019; Garnier et al., 2022; Staller, 2014); (5) recent geodetic results (Portela et al., 2024) and the derived strain rate field (Sect. 3); and (6), at advanced modelling stages, the residuals in GNSS and LOS velocities from the generated inverse.
Based on these factors and the progressive inversion tests, we select our preferred geometry, as shown in Fig. 3. We define the Middle America Trench (MAT) based on the Slab-2 model with nodes along azimuth every ∼ 50 km intervals, replicating them every 20 km along depth down to 100 km. The crustal fault nodes, including the ESFZ segments, are defined each ∼ 10 km along strike and every ∼ 5 km along depth down to 15 km. We assume the latter to be vertical or close to vertical (dip = 80°). The nodes are later grouped in the inversion to reduce the parameters to be adjusted, based on data resolution tests (see Sect. 5.3.1) and following previous fault segmentations in the ESFZ (Canora et al., 2014). We avoid modelling faults in the areas where our data are scarce, letting them to slip freely in such cases (see Fig. 3).
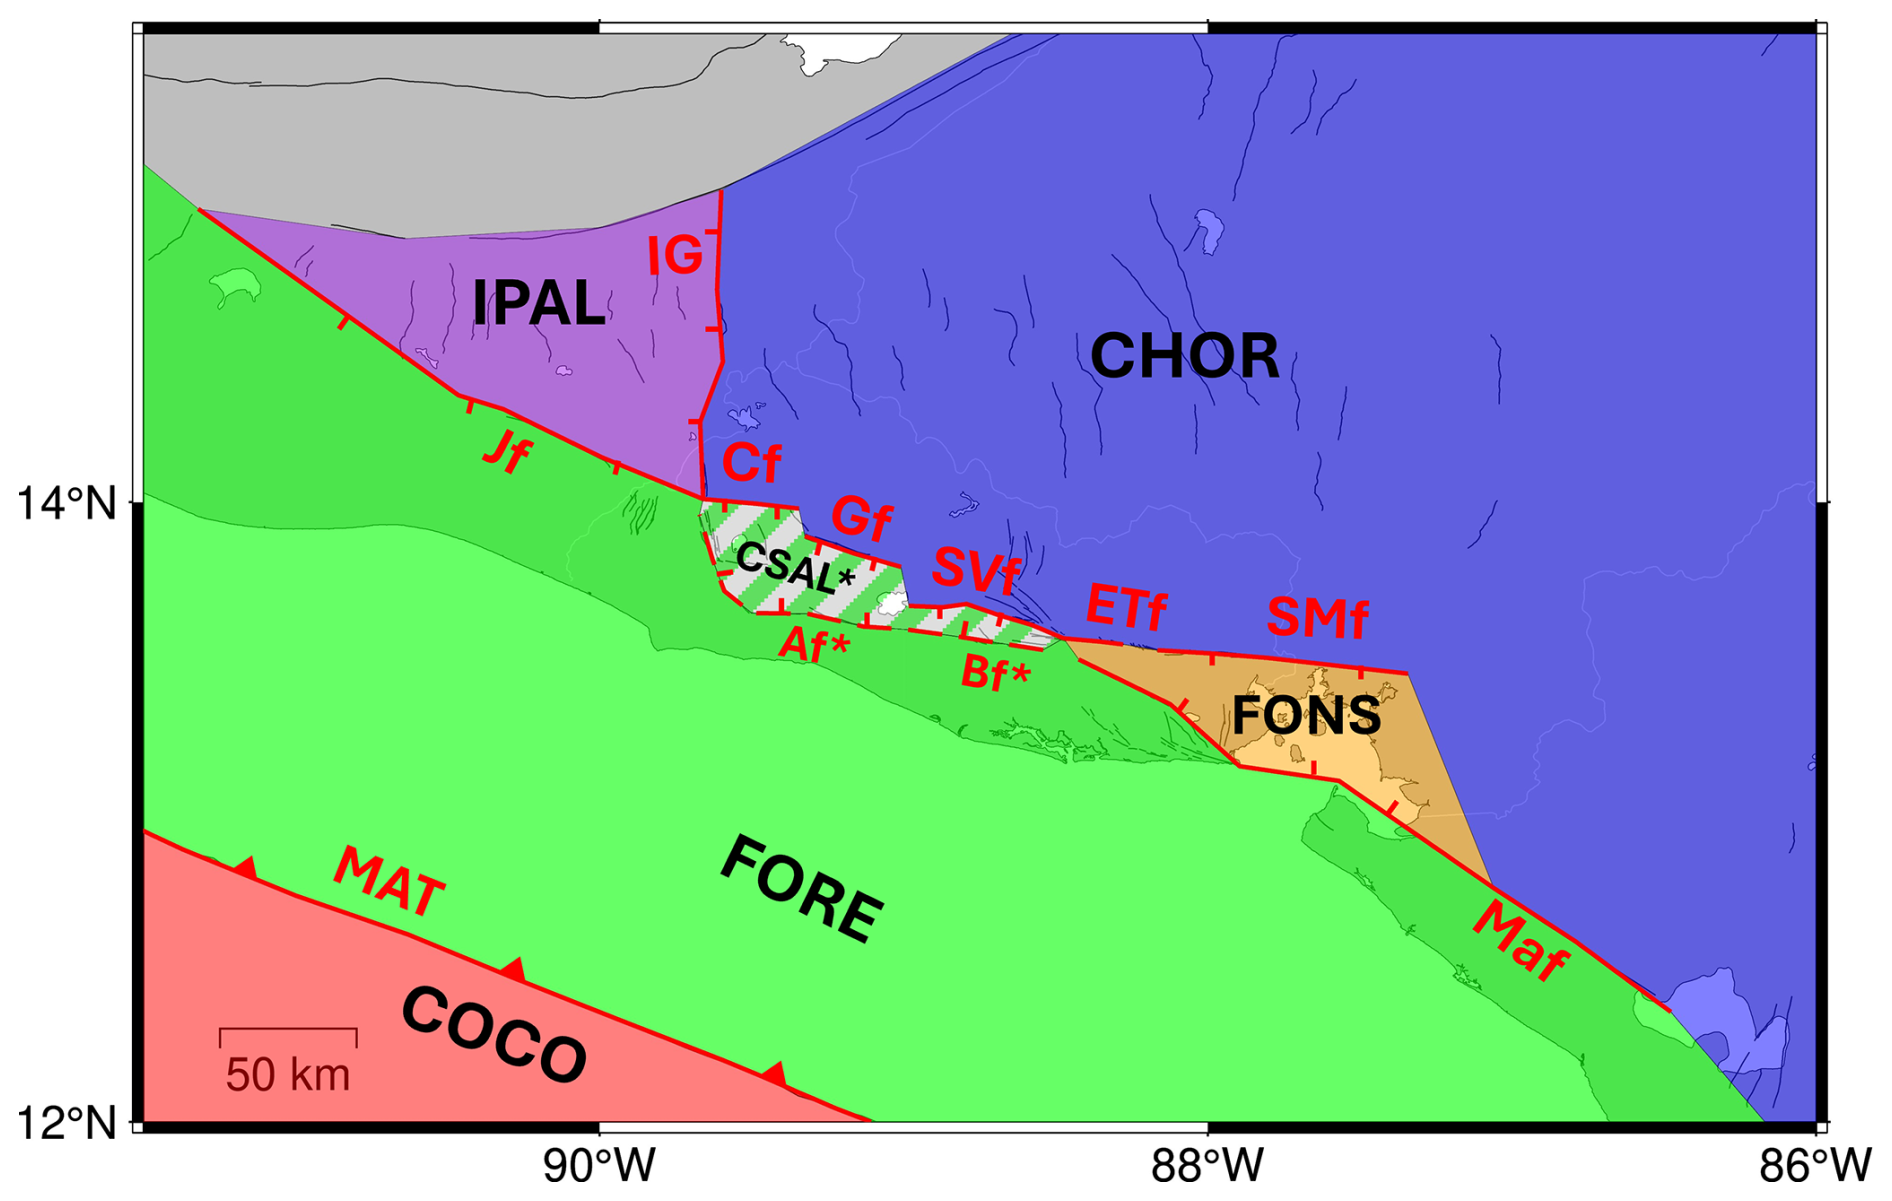
Figure 3Block geometry defined for the kinematic models. Inverted block limits are shown as red lines (and labelled following faults and structures in Fig. 1). The CSAL block and the Af and Bf faults are marked with an asterisk, indicating that we also present models in which the CSAL block is tied to the FORE block and, consequently, these faults are not inverted.
The preferred geometry includes six blocks: FORE (comprising the volcanic forearc between the MAT and the volcanic arc faults), CHOR (comprising the western part of the Caribbean plate, including the Chortís block), COCO (covering the subducting Cocos plate), CSAL (located between the central faults of the ESFZ), FONS (trying to delimit the deformation zone around the Gulf of Fonseca) and IPAL (comprising the Ipala and Guatemala graben area). Additionally, a virtual ITRF2014 block is created as reference, thus calculating the motion of the other blocks relative to ITRF2014.
Because the modelled data (Fig. 2) do not extend into western Guatemala, we did not model the boundary between the FORE and IPAL blocks all the way to the triple junction. Recent studies suggest that this junction may be located near the Tacaná volcano on the Mexico–Guatemala border (Legrand et al., 2025), approximately where TJ is shown in Fig. 1. Consequently, we simplified the western termination of the IPAL–FORE block boundary (Fig. 3) as a westward continuation of the Jalpatagua fault.
2.3.2 Inversion strategy
As the input data for the inversion, we use the GNSS (horizontal) and InSAR (LOS) velocities relative to ITRF2014 described in Sect. 2.1. Incorporating ALOS data (∼ 8500 data points originally) introduces a significant imbalance compared to the ∼ 100 GNSS stations in the modelling area. To prevent overrepresentation of the InSAR data, we first apply a decimation factor of 3 (retaining 1 in every 4 points), resulting in a grid with points spaced ∼ 0.1°. This decision is based on a noise analysis of spatially correlated LOS velocities. Using GBIS software (Bagnardi and Hooper, 2018), we fit a semivariogram to the LOS velocities in a stable area (far from the MAT and the ESFZ), estimating correlation distances for the ALOS tracks between 7 and 13 km. Based on this, we opted for the ∼ 10 km (∼ 0.1°) resolution for the InSAR data, improving inversion efficiency. Additionally, we underweight (W = F−2) the decimated ALOS data in the inversion, following Lemrabet (2022), using a factor Fi computed as in Eq. (1), where Ii is the number of InSAR data points per track i and Gi is the number of GNSS stations in the corresponding track (Table S1 in the Supplement):
As the necessary approximate initial values for the motion of tectonic blocks, we use (1) the Caribbean plate Euler pole determined by Portela et al. (2024) for the CHOR block, (2) the Cocos plate pole from NNR-Morvel (Argus et al., 2011) for the COCO block, and (3) the pole determined for the FORE block by Staller (2014). The motion of the COCO block is fixed (not inverted) due to the lack of GNSS stations to constrain its rotation. The FORE block pole is initially inverted but later fixed in subsequent inversions due to a trade-off with slab coupling (see Sect. 5.3.2).
As initial coupling values, we use Φ=0.8 for the crustal faults, based on the assumption that the ESFZ is predominantly coupled (Ellis et al., 2019; Staller, 2014), and Φ=0.3 in the MAT, according to its estimated low coupling (Alvarado et al., 2011; Correa-Mora et al., 2009; Ellis et al., 2019). Based on our inversion tests, we limit coupling in the MAT to the uppermost ∼ 40 km of the subducting slab, forcing it to creep at greater depths. Further details are provided in Sect. 5.
The inversion strategy focuses on optimising the geometry and parameters to minimise the reduced χ2 statistic of the data residuals (i.e., their weighted least-squares misfit, adjusted by the degrees of freedom), the weighted root mean square (wrms) error, and the uncertainties of the estimated parameters (block rotations and fault coupling ratio). At the same time, we ensure that the results align with the tectonic and kinematic setting of the region. We began with a simple three-block geometry (FORE, CARI, and COCO), divided by the MAT and the volcanic arc faults. This geometry was iteratively refined based on the outlined criteria, culminating in the final six-block configuration (Fig. 3), and the additional ITRF2014 reference block. It is worth noting that the CSAL block was the final addition to the geometry and, in previous cases, was inverted along with the FORE block. This is further discussed in Sect. 5.1.1.
The deformation rate field derived from horizontal GNSS velocities represents a useful tool for understanding the tectonic deformation in El Salvador. We summarise the strain rate field through the horizontal strain rate tensors and the maximum shear strain rate (Fig. 4).
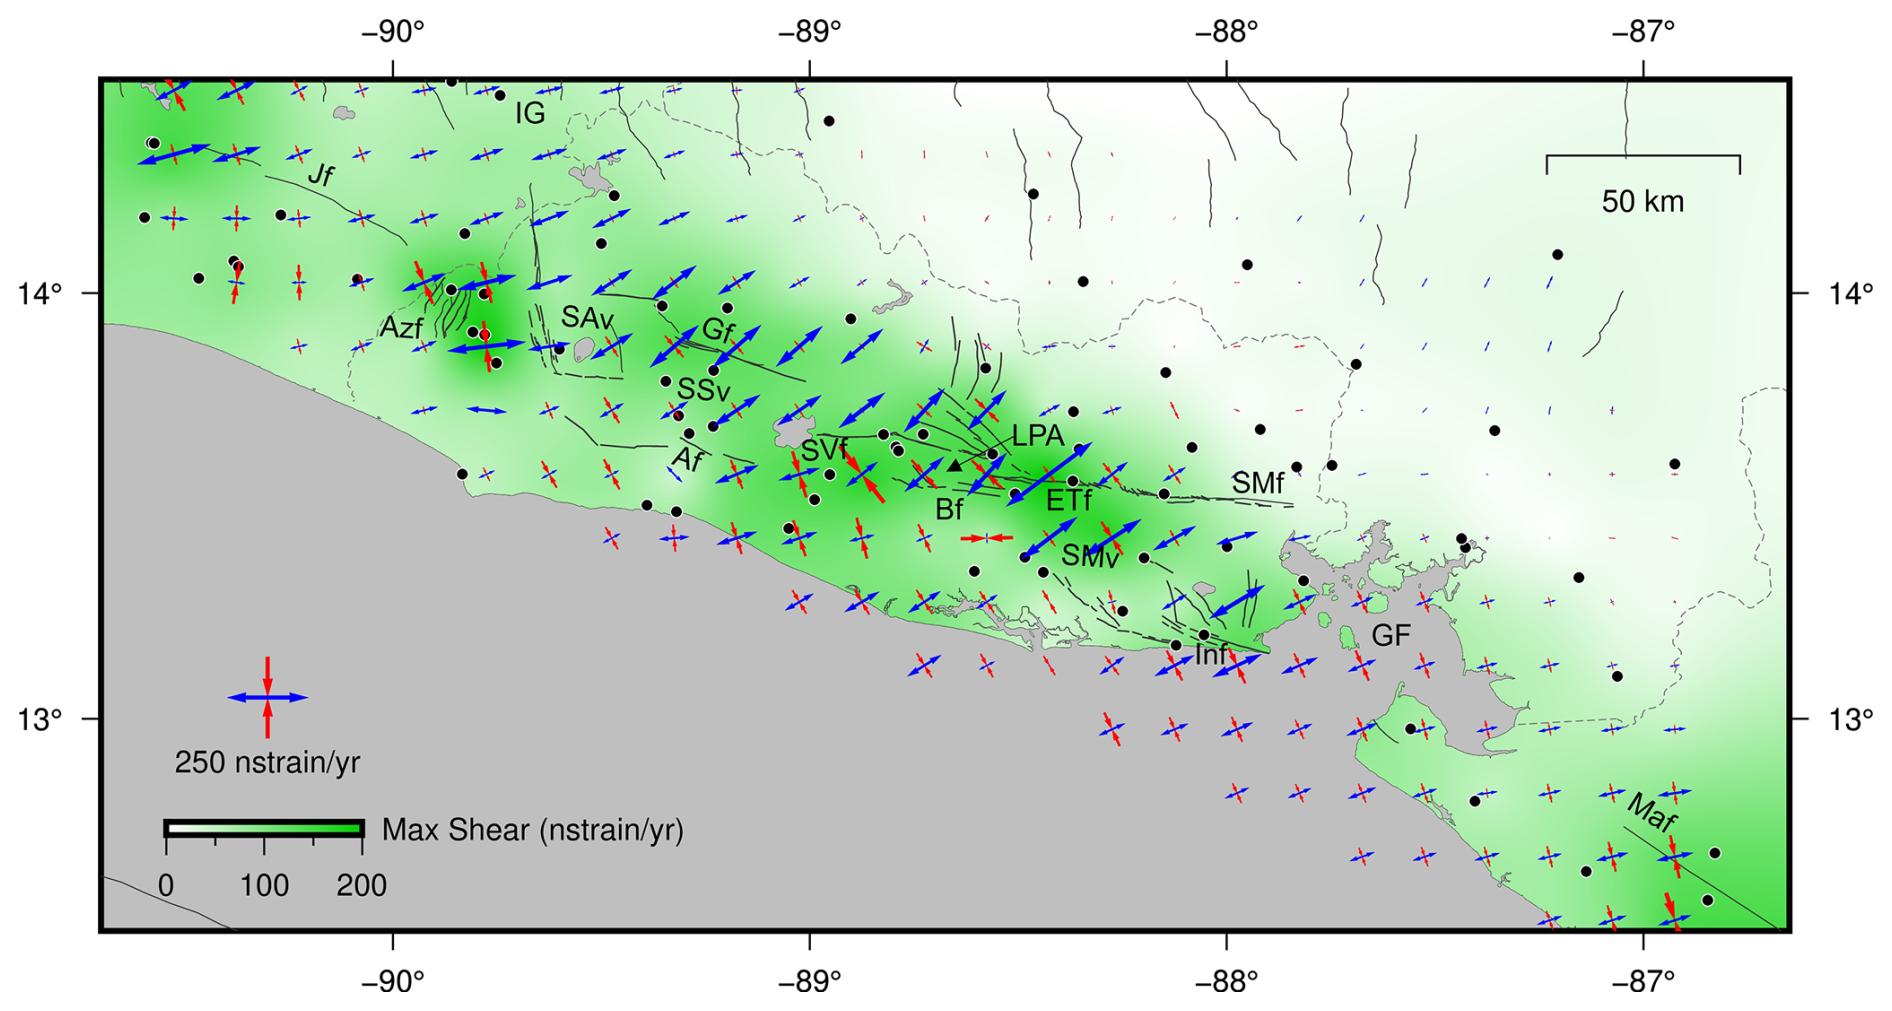
Figure 4Strain rate tensors (crosses) and maximum shear strain rates. Main faults (black lines) are labelled following Fig. 1. The dots represent the location of the GNSS stations used for the strain determination.
The horizontal strain rate tensors are larger along the strike-slip faults of the ESFZ (Fig. 4), particularly in its central sector, which also exhibits the largest shear strain rates. The maximum shear strain rates occur near the San Vicente Fault (SVf, 172 ± 101 nstrain yr−1) and the El Triunfo Fault (ETf, 197 ± 49 nstrain yr−1). Elevated rates are also observed near the Guaycume Fault (Gf, 143 ± 21 nstrain yr−1). Interestingly, the Ahuachapán fault zone (Afz) also shows large shear strain rates (>100 nstrain yr−1). Towards the terminations of the ESFZ, shear strain weakens but remains elevated near the Jalpatagua Fault (Jf) in Guatemala and the Marrabios Fault (Maf) in Nicaragua. In Honduras, both horizontal strain rate tensors and shear strain rates decrease to noise levels. We also observe a predominance of NE–SW extension around the ESFZ, especially east of the Lempa pull-apart basin (LPA), consistent with Staller (2014). The extensional direction tends to rotate to E–W, both to the northwest of the ESFZ (the graben area) and the southeast (the Gulf of Fonseca, GF).
The results of our preferred model are shown in Fig. 5, Tables 1, S2 and S3. Unless otherwise specified, positive slip rates indicate dextral (fault-parallel) and normal (fault-orthogonal) motion. Negative rates correspond to sinistral or reverse slip, respectively. We obtain reduced χ2 of the data residuals of 0.7, and a wrms of 1.3 and 2.2 mm yr−1 for the GNSS and ALOS datasets, respectively.
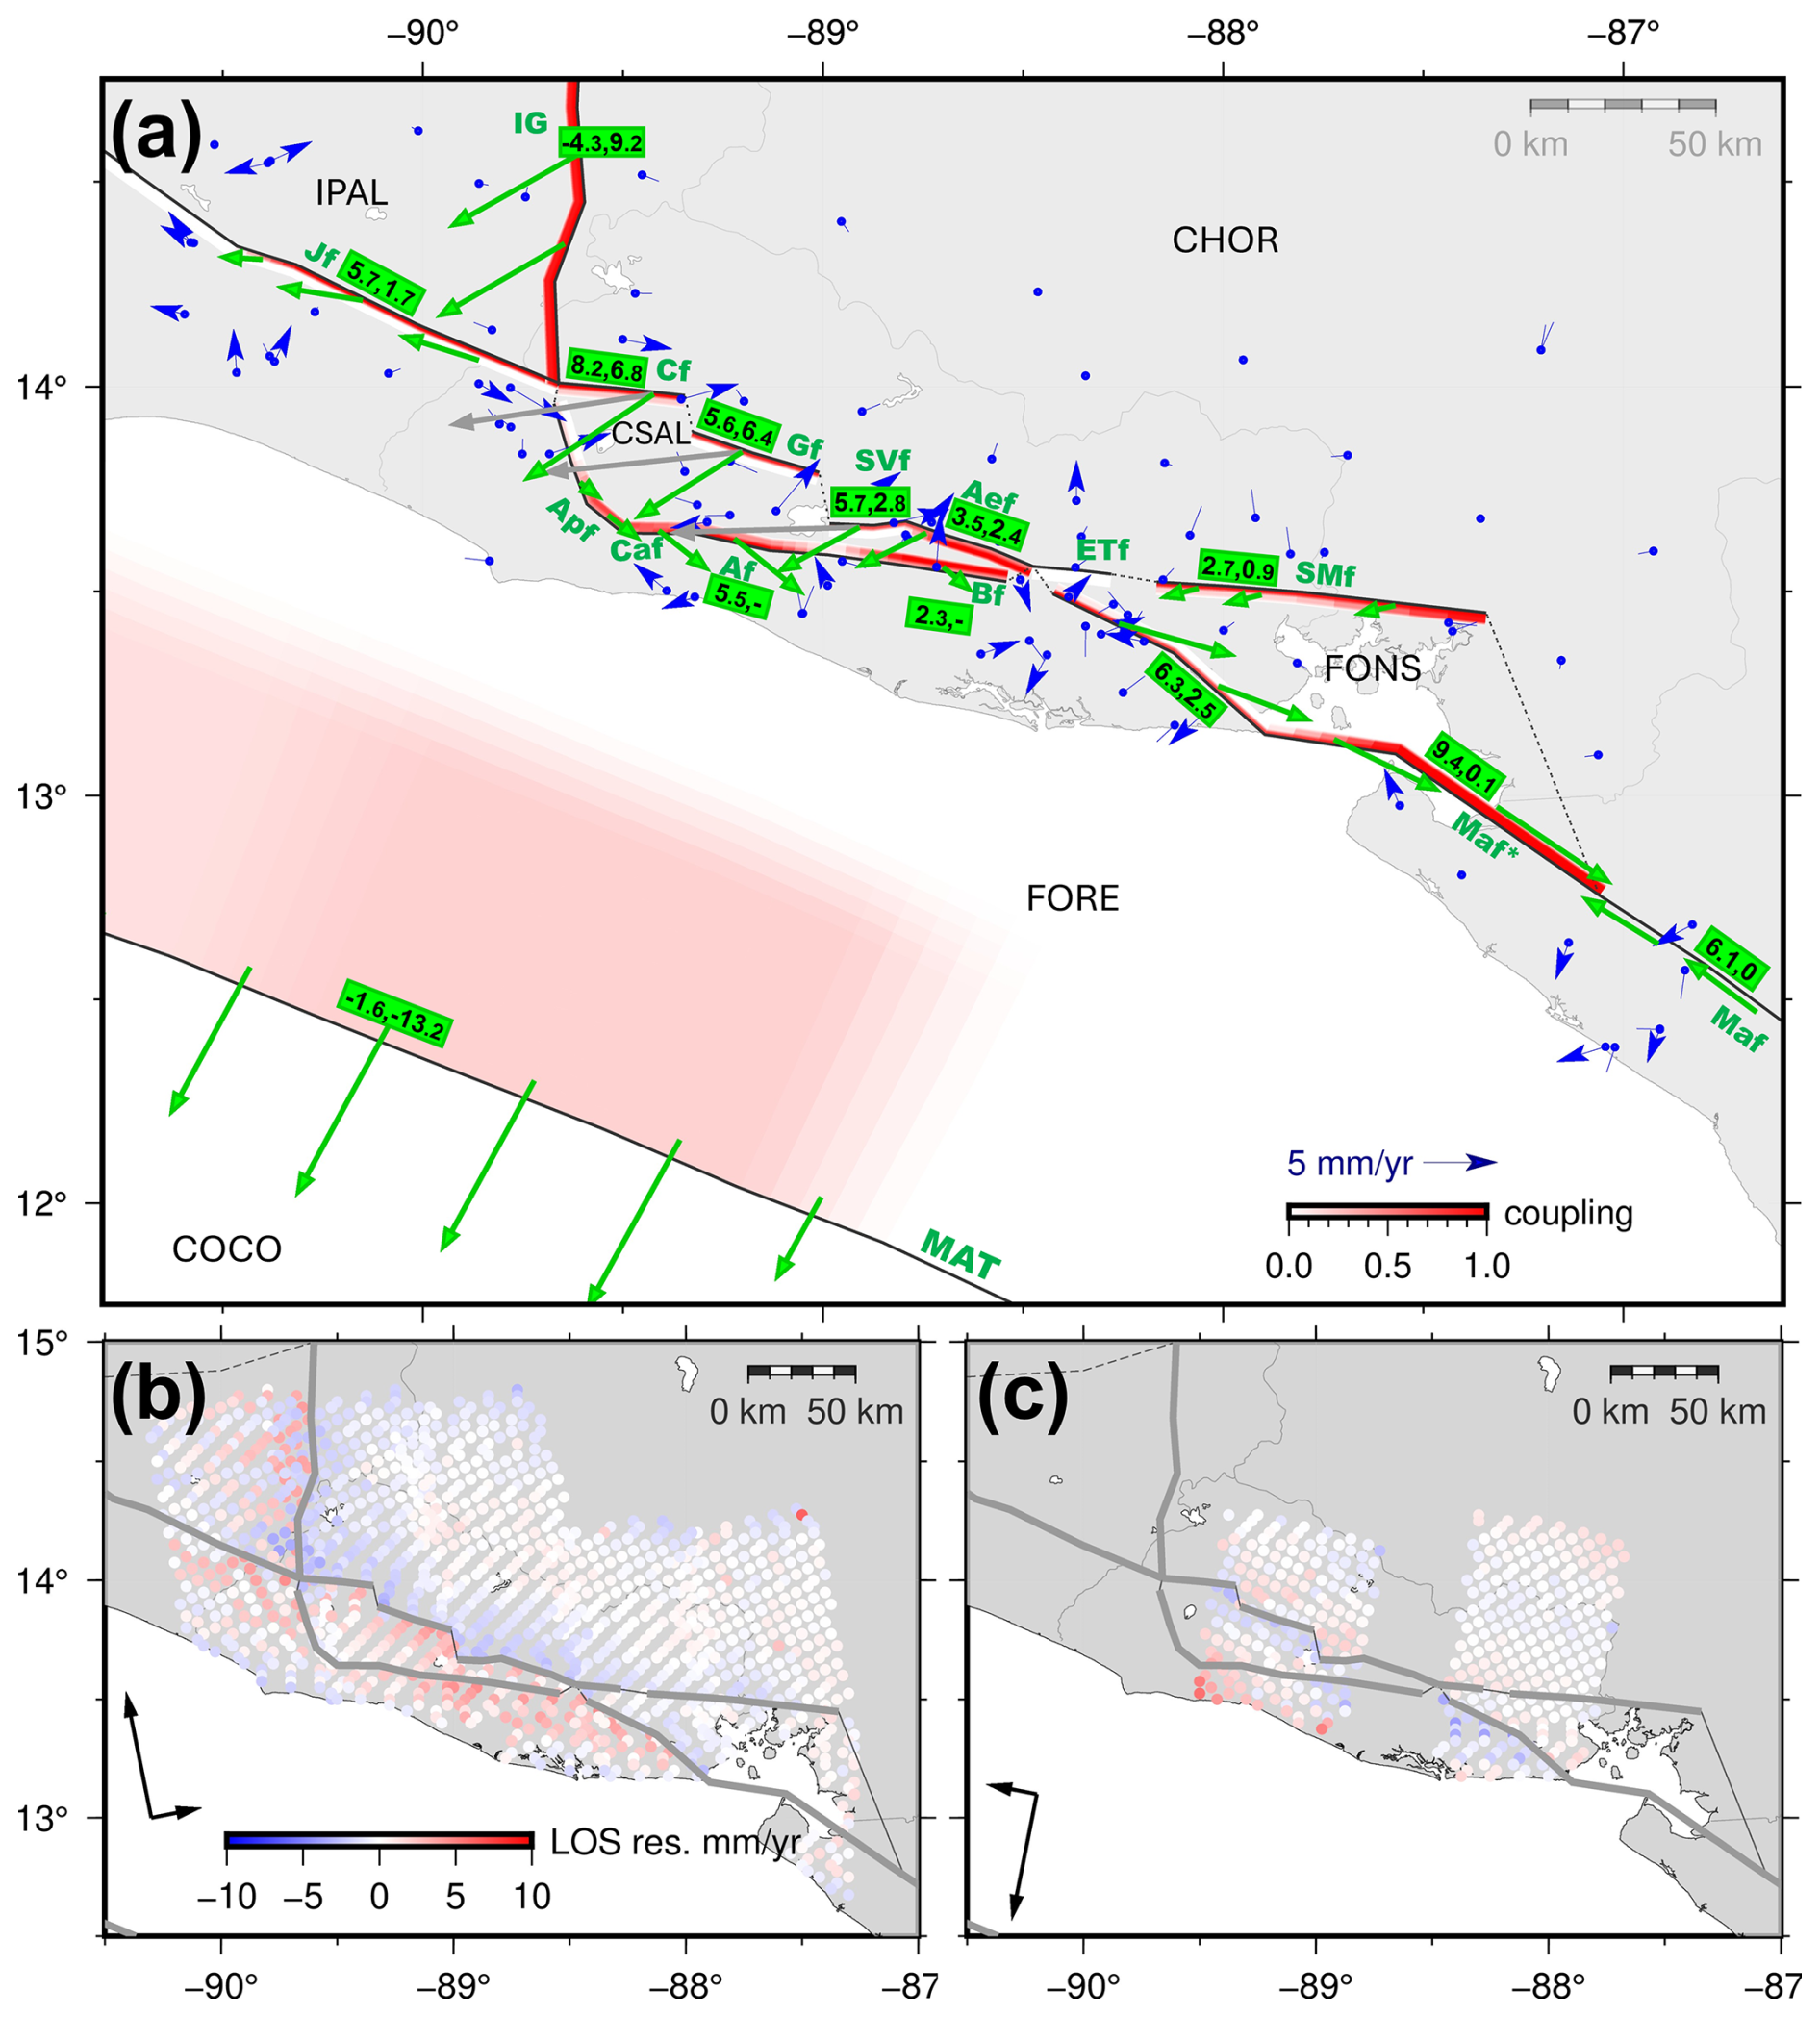
Figure 5Preferred kinematic model results for the ESFZ. (a) GNSS residuals (blue vectors) and resulting slip rates for each fault or segment, represented as green arrows (located on the hanging walls and slightly displaced from the center of each segment) and with the fault-parallel and fault-normal slip rates in green rectangles, in mm yr−1 (negative values for sinistral and reverse slip rates). Faults are represented as planes, coloured by their predicted coupling ratio. The grey dashed lines represent the block boundaries that were not inverted (i.e., they were forced to creep). The blocks are named in black (Fig. 3). We also show the ALOS LOS ascending (b) and descending (c) residuals of the model.
Table 1Slip rates (S) and their uncertainties, estimated in our preferred model for the main faults with consistent results. The slip rates shown in brackets correspond to the model without the CSAL block. Positive values indicate dextral (fault-parallel) and normal (fault-normal) motion. The Ipala Graben eastern boundary values, marked with an asterisk (*), may be showing the net motion difference between two blocks, rather than a single slip rate for a fault.
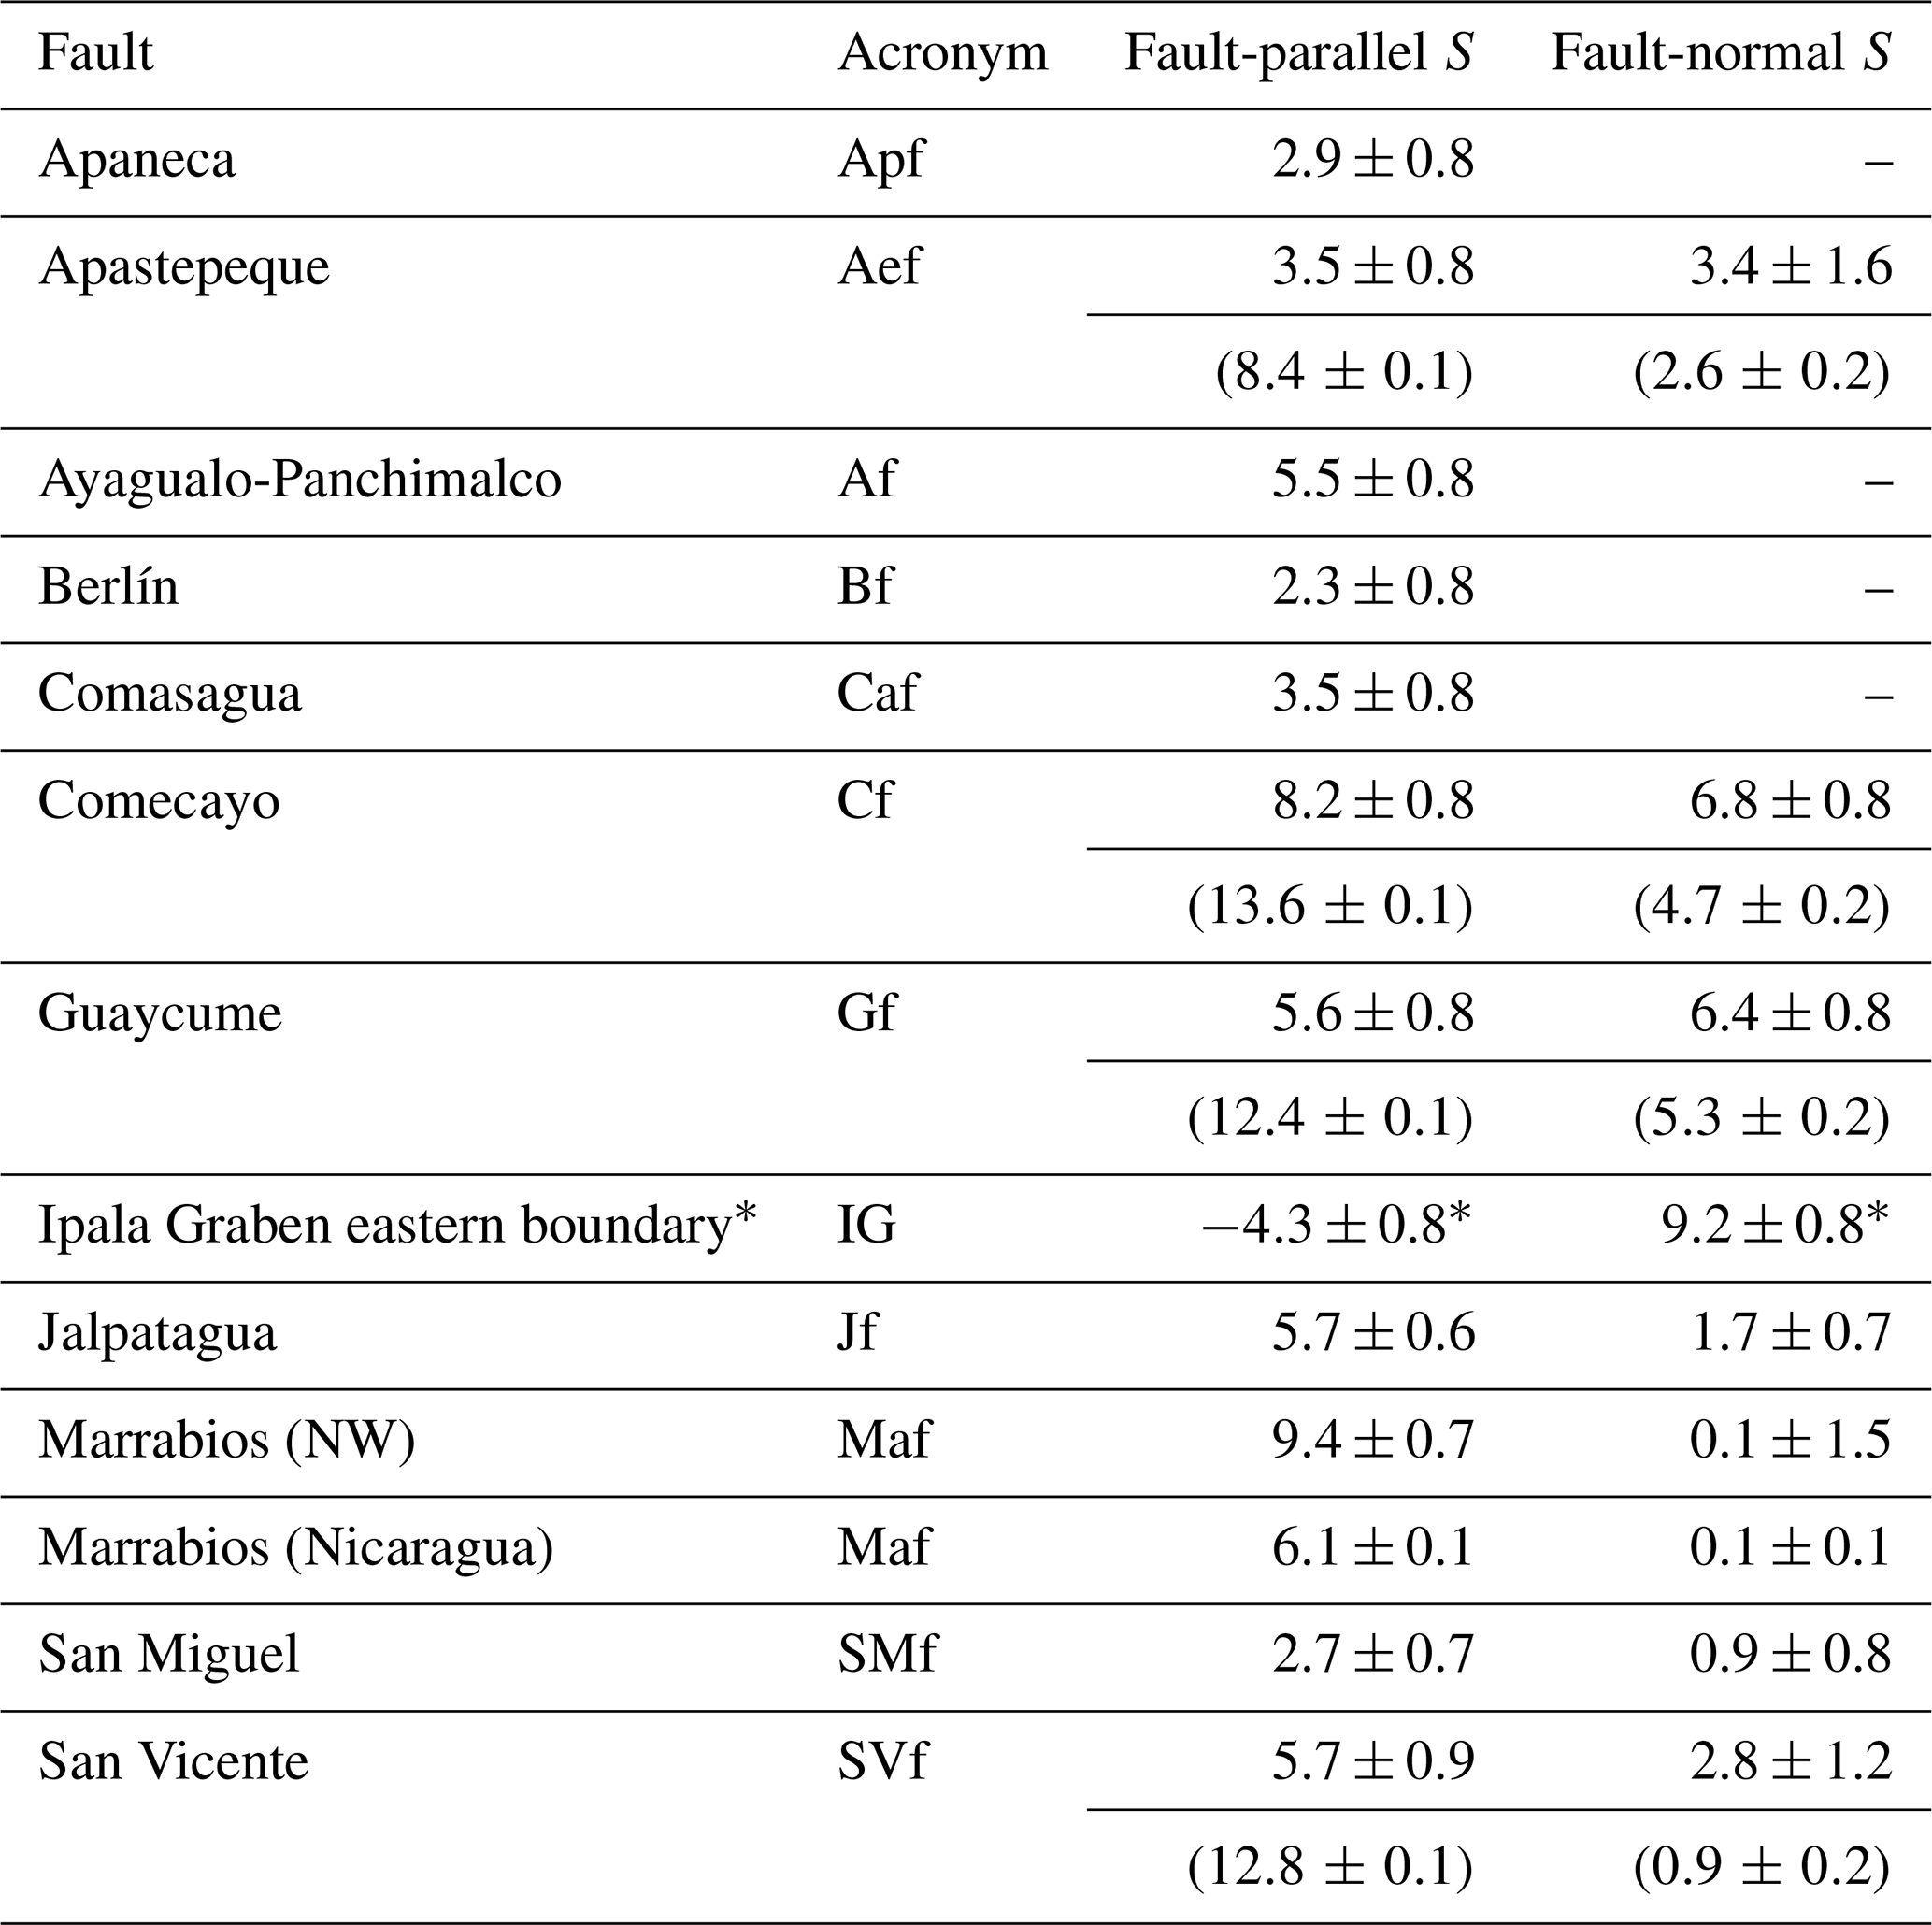
In the preferred model, we invert the coupling at the subduction interface within the first ∼ 40 km depth from the trench, forcing zero coupling at greater depths. The model (Fig. 5) predicts weak coupling in western El Salvador (Φ ∼ 0.2), increasing toward western Guatemala and Mexico (Φ ∼ 0.5). A slight intermediate decrease is observed in eastern Guatemala, but it is not significant. In eastern El Salvador, the Gulf of Fonseca, and northern Nicaragua, the subduction zone appears decoupled. In contrast, the volcanic arc faults tend to be almost fully coupled (Φ→1), at least within the uppermost 7.5 km, with coupling decreasing at depth in many cases. Some faults on the southern boundary of the CSAL block exhibit lower coupling (Φ<0.5) at shallow depths.
The predicted slip rates (green vectors in Fig. 5) are primarily dextral and normal in the crustal faults of the EFSZ. In central El Salvador, the FORE relative motion with respect to CHOR is accommodated between the faults at the northern (Gf, SVf) and southern (Af, Bf) boundaries of the CSAL block. The northern faults (Gf and SVf) show a dextral slip rate of ∼ 6 mm yr−1 and a normal slip rate of 3–7 mm yr−1. Conversely, the southern faults exhibit dextral slip rates of 5.5 mm yr−1 (Af) and 2.3 mm yr−1 (Bf), whereas their fault-normal slip rates are small and estimated with large uncertainties comparable in magnitude to the slip rate; therefore, we exclude them from the analysis (although they can be found in Table S3).
To the west (Fig. 5), our preferred model predicts a slip rate for the Jf fault of 5.7 ± 0.6 mm yr−1 (dextral) and 1.7 ± 0.7 mm yr−1 (normal). At the Ipala Graben boundary (If), we obtain a normal slip rate of 9.2 ± 0.8 mm yr−1, and a dextral slip rate of −4.3 ± 0.8 mm yr−1. To the east, the San Miguel Fault (SMf) shows a slip rate of 2.7 ± 0.7 mm yr−1 (dextral) and 0.9 ± 0.8 mm yr−1 (normal). The western boundary of the FONS block seems to accommodate 6.3 ± 0.7 mm yr−1 of dextral slip and a 2.5 ± 0.7 mm yr−1 of normal slip. Along the proposed continuation of the Marrabios Fault (Maf) into the Fonseca Gulf by Portela et al. (2024), we estimate a nearly pure dextral slip rate of 9.4 ± 0.7 mm yr−1.
We obtain low residuals in the geodetic velocities in our preferred model (Fig. 5), both for GNSS (wrms = 1.3 mm yr−1) and ALOS (wrms = 2.2 mm yr−1). Moreover, our results are compatible with other block models in the region (Ellis et al., 2019; Franco et al., 2012; Garnier et al., 2022; Staller, 2014) and previous tectonic studies in El Salvador (e.g., Canora et al., 2014; Martínez-Díaz et al., 2021). We generally obtain lower uncertainties for the slip rates of faults in the ESFZ and the surrounding regions, though some local discrepancies remain compared to previous models. We discuss the kinematic results for the crustal faults in Sect. 5.1 and for the subducting slab in Sect. 5.2.
However, we deem it convenient to clarify the main limiting factors of our model, both inherent to the methodology and due to the available data. Therefore, we also discuss the limitations of the proposed model (Sect. 5.3), including the resolution due to the geodetic data distribution (Sect. 5.3.1) and the detected trade-offs between parameters (Sect. 5.3.2).
5.1 The crustal faults
5.1.1 The ESFZ
In general, our preferred model (Fig. 5, Table 1) predicts dextral and normal slip rates in the faults within the ESFZ, coherent with the transtensional tectonic regime predominant in El Salvador (e.g., Alonso-Henar et al., 2014; Martínez-Díaz et al., 2021).
We obtain good agreement with geological studies in El Salvador. The slip rate obtained for the San Vicente fault (5.7 ± 0.9 mm yr−1 dextral and 2.8 ± 1.2 mm yr−1 normal) is consistent with the 4.1–5 mm yr−1 slip rates derived from paleoseismology (Canora et al., 2012) and channel offsets (Canora et al., 2014).
However, introducing the CSAL block in central El Salvador produces the largest deviations from previous geodetic results along the main faults of the ESFZ, since the relative forearc motion is accommodated by both the northern (Gf, SVf) and southern (Af, Bf) fault branches of the ESFZ, rather than along a single fault. Only Staller (2014) modelled a similar block, partitioning the deformation in the two branches, although their results show almost-pure dextral ∼ 10.3 ± 2.1 mm yr−1 slip rates in the northern branch faults (Cf, Gf), and ∼ 3.9 ± 2 mm yr−1 dextral-extensional slip rates in the southern branch (Af, Apf).
Our model predicts a total slip rate of approximately 14.7 mm yr−1 accumulated between the northern (Gf) and southern (Af) branches near San Salvador, which is slightly higher than previous estimates. Specifically, we obtain a dextral slip rate of 5.6 ± 0.8 mm yr−1 and a normal slip rate of 6.4 ± 0.8 mm yr−1 for the Guaycume fault (Gf), resulting in a total slip rate of 8.5 mm yr−1. This agrees more closely with the observations of Portela et al. (2024), who proposed that the Gf alone cannot accommodate the 12–13 mm yr−1 of forearc escape motion. Instead, the deformation is partitioned with the southern branch faults, such as the Ayagualo and Panchimalco faults (Af), which accumulate a dextral slip rate of 5.5 ± 0.8 mm yr−1. The relatively high 6.4–6.8 mm yr−1 extension observed in the northern faults (Cf, Gf) appears to be balanced by a minor reverse slip in the southern faults (Af, Bf, Caf), which is likely an artificial effect compensating for the excess extension in the North.
Related to this issue, it is worth noting that the CSAL block rotation pole (Table S2) has been obtained with great uncertainty, as well as the coupling ratio in its bounding faults. In many cases, these uncertainties are of the same order of magnitude as the estimated coupling values. Consequently, the kinematics of this block do not appear to be robustly constrained. Therefore, we also show the results of an alternative model tying the CSAL to the FORE block (grey slip vectors in Fig. 5 and slip rates in brackets in Table 1). The changes are only significant in the northern bounding faults of the discarded CSAL block, such as the Cf, Gf and SVf, since they accommodate in this case the whole forearc (FORE) movement. They show predominant dextral (12.4–13.6 mm yr−1) and normal (0.9–5.3 mm yr−1) slip rates. These results are coherent with the results from simple dislocations of past publications (Staller et al., 2016; Portela et al., 2024) and previous kinematic block model results that only consider a single fault for the ESFZ (Ellis et al., 2019; Garnier et al., 2022).
The coupling depths estimated in the ESFZ in our preferred model show that the faults are almost fully locked (Φ∼1) in the shallowest 7–8 km, with the coupling ratio gradually decreasing to zero at greater depths. These results are consistent with the shallow depths predicted for the ESFZ in previous block models (2.5–5 km by Ellis et al., 2019, and Garnier et al., 2022, who force Φ=1 in the crustal faults), as well as the 5–9 km depth from simple dislocation models by Staller et al. (2016) and Portela et al. (2024). Overall, these results align with the expected coupling depths of <20 km for the regional crustal faults (Correa-Mora et al., 2009; White, 1991). However, in some individual faults, such as the El Triunfo fault (ETf), our model predicts creep, but with high uncertainty (Φ = 0 ± 0.5).
Since no detailed geophysical studies have been performed, the structure of the ESFZ at depth is largely unknown (Martínez-Díaz et al., 2021, and references therein). However, the faults in the CAVA are commonly assumed to dip nearly vertically. Staller (2014) models these faults as almost vertical (with dips of 80 to 85°), while Ellis et al. (2019) consider them purely vertical (90° dip). We use an average dip of 80° for faults within the ESFZ in our model. We set the faults within the northern branches of the CSAL and FONS blocks dipping to the south, while the faults in the southern branches are set to dip northwards.
We also evaluate the impact of introducing a 10° change in dip (from 80 to 90°) in the CAVA faults (Fig. S3). This dip change generates very small residuals in horizontal GNSS velocities (<1 mm yr−1) and ALOS velocities (<2 mm yr−1 of movement towards – ascending orbit – and away – descending orbit – the satellite). Moreover, these variations occur only in the immediate vicinity of the faults. The InSAR residuals in our model (Fig. 5b, c) appear to be predominantly random in space, but they show some persistence (with a small magnitude <2 mm yr−1) close to the faults, which could be related to errors in the modelled dip geometry (among other causes).
5.1.2 Eastern Guatemala
To the west of the ESFZ, the Jalpatagua fault (Jf) may be accumulating up to 1.7 ± 0.7 mm yr−1 of normal slip and 5.7 ± 0.6 mm yr−1 of dextral slip. The latter is comparable to the 5.5 ± 1 mm yr−1 fault-parallel slip rate determined by Portela et al. (2024) but is notably lower than the 7.6 ± 2.1 mm yr−1 estimated in the model by Ellis et al. (2019), which was later refined by Garnier et al. (2022) to 7.1 mm yr−1, bringing it slightly closer to our results.
The transition between the ESFZ and the Jf is unclear. Garnier et al. (2020) suggest the existence of a transtensional pull-apart basin connecting both structures. In this area, we simplify the boundary between the FORE and IPAL blocks by extending the Jf eastward, connecting it to the Comecayo Fault (CCf in Fig. 5). Our model predicts a fault-parallel slip rate of 5.7 ± 0.7 mm yr−1 along this boundary and an insignificant fault-normal motion of 0.5 ± 0.9 mm yr−1. This net slip between blocks could be accommodated either by a strike-slip structure oriented similarly to the Jf (such as the one modelled) or by the NE–SW faults in the Ahuachapán extensional field (Martínez-Díaz et al., 2021), in the form of fault-normal slip. The strain results suggest a predominant E–W extension in the Ahuachapán extensional field (Afz in Fig. 4) but also show high shear strain values in the region.
Further north, the IPAL block is separated from the CHOR block by a limit following the eastern edge of the Ipala Graben (IG). Therefore, this single limit accounts for the whole deformation accommodated across the grabens in northern Honduras and eastern Guatemala (see Fig. 1). We obtain a predominant extension of 9.2 ± 0.8 mm yr−1, which is consistent with the ∼ 10 mm yr−1 of extension described by Garnier et al. (2022) across the Guatemala and Ipala grabens. We also obtain a significant sinistral slip rate of 4.3 ± 0.8 mm yr−1 in this block limit. This could be reflecting that the distributed deformation in the area is not only accommodated by the E-W extension in the grabens, which seems consistent with the existence of strike-slip focal mechanisms in the area (Garnier et al., 2022).
5.1.3 The Gulf of Fonseca
East of the Berlín fault (Bf), the strike-slip rates of the ESFZ decrease in magnitude, giving way to an area of distributed deformation that continues across the Gulf of Fonseca. In this area, there is evidence of extensional deformation (Staller et al., 2016; Ellis et al., 2019), although most of the focal mechanisms indicate strike-slip earthquakes (Martínez-Díaz et al., 2021).
We integrate this region in the FONS block (Fig. 3). In areas without a clearly dominant fault accumulating deformation, it is necessary to define relatively arbitrary boundaries. The Gulf of Fonseca and its surroundings provide a clear example in El Salvador of a region with diffuse deformation (Martínez-Díaz et al., 2021; Portela et al., 2024). Past models (Staller, 2014; Ellis et al., 2019; Garnier et al., 2022) agree on using the San Miguel fault (SMf) as the northern limit of the block. However, in the western sector of the block, several NW–SE and N–S faults exist (see Inf in Fig. 6). This makes it challenging to select boundaries for block models, so we tested several geometries for the FONS block based on the inversion of GNSS horizontal velocities (Fig. 6 and Table S4).
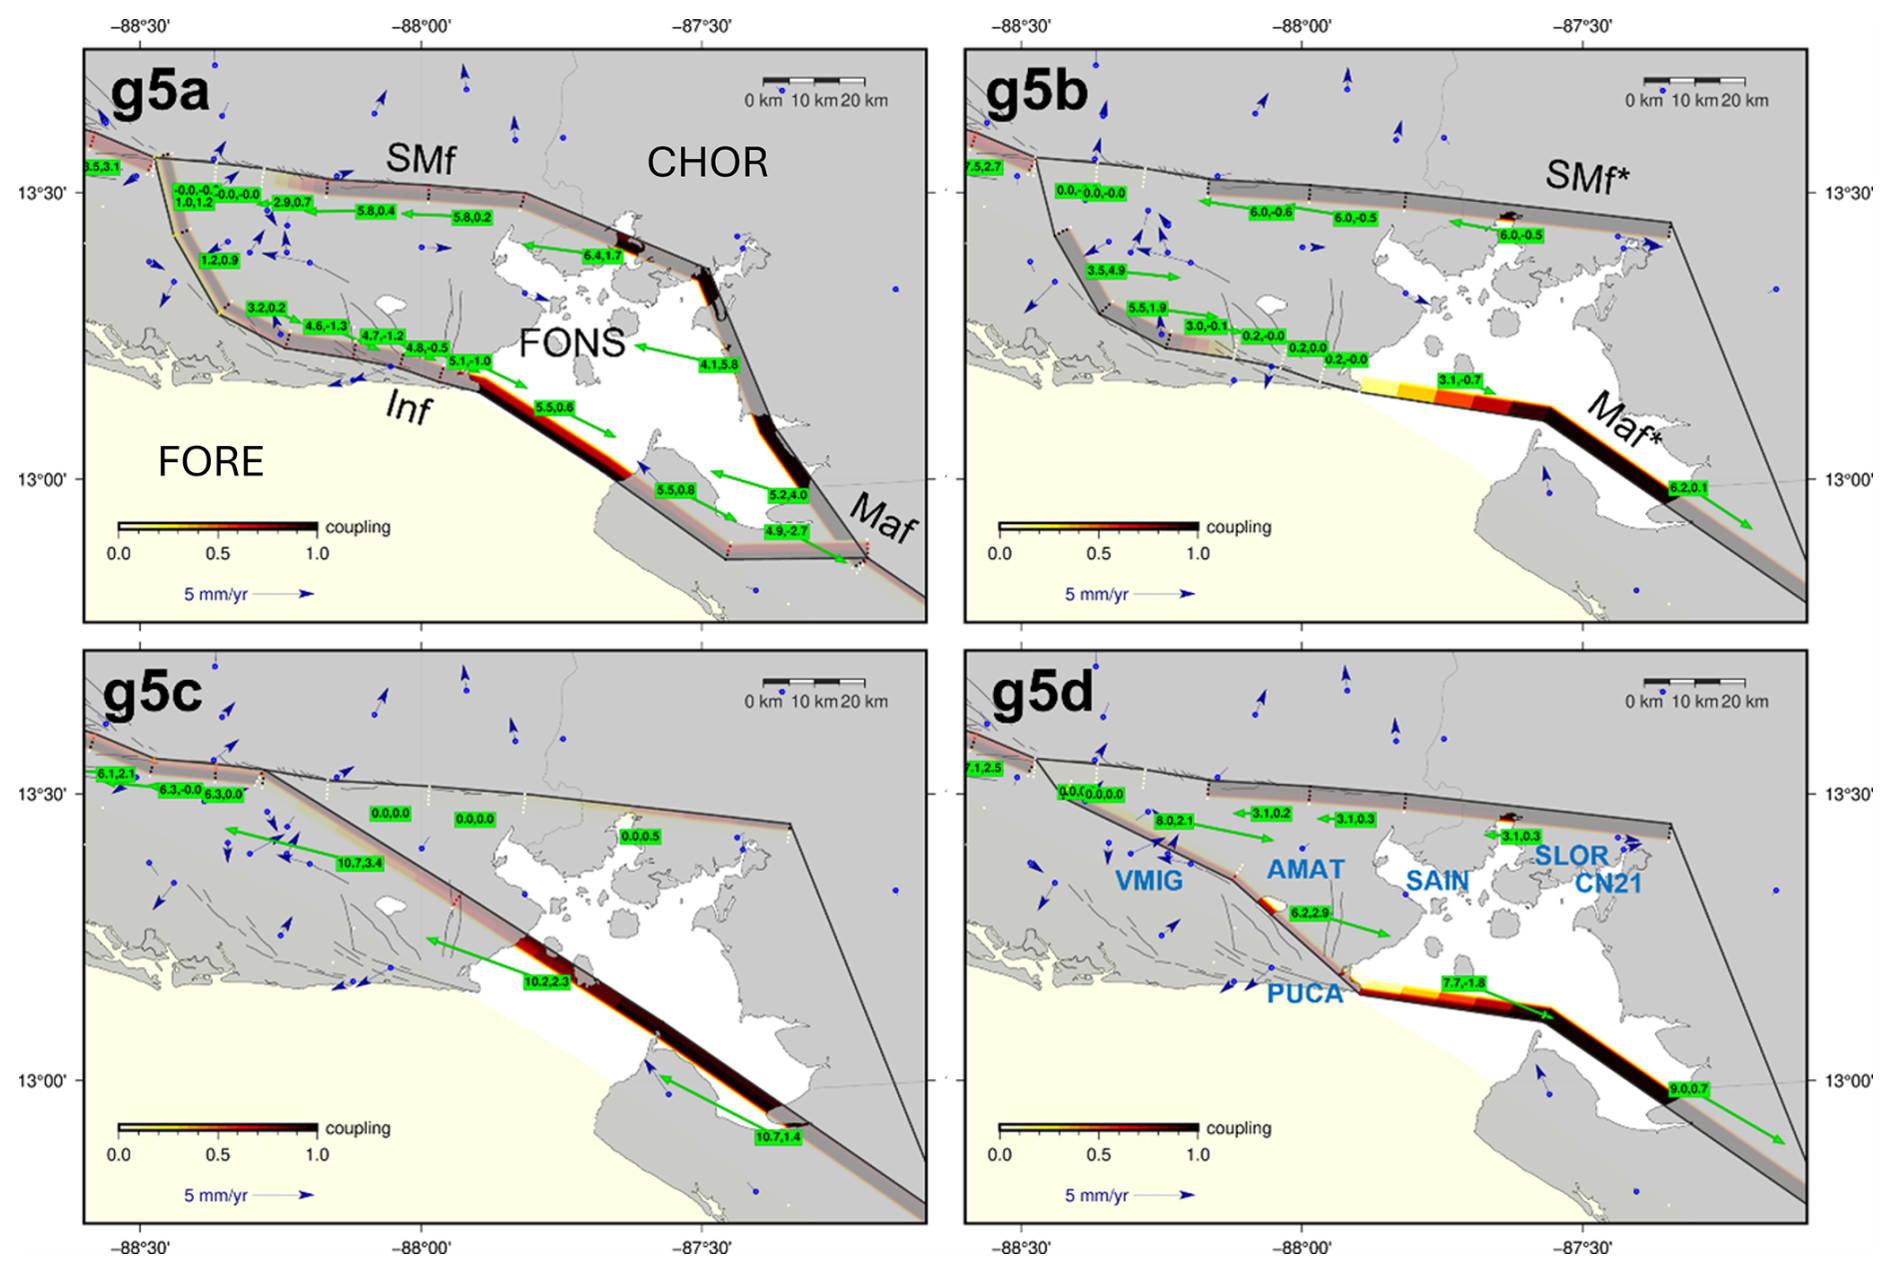
Figure 6Different geometries tested for the Fonseca block (FONS) in the inversions. Slip rates are shown as green vectors, labelled with their respective slip rates (fault-parallel, fault-orthogonal). Negative values (–) indicate sinistral and reverse slip rates, respectively. The inverted coupling ratio at the nodes and along the faults is also displayed. The residuals (observed minus calculated velocities in the model) of the GNSS horizontal velocities are represented as blue vectors, with some relevant stations labelled in g5d. In g5a, the blocks (in uppercase) and the main faults are labelled, while in g5b, the proposed fault continuations from Portela et al. (2024) are indicated. Model g5a is based on the geometry of Staller (2014), while the rest of the models are original. Note that g5d is not the preferred model of this study, but a previous test.
First, the geometry proposed by Staller (2014) was modelled (Fig. 6 – g5a). Later, this geometry was modified (Fig. 6 – g5b) following the ALOS results of Portela et al. (2024), which suggest a possible continuation of the San Miguel Fault (SMf) extending to the east through the northern shores of the gulf, and a continuation of the Marrabios Fault (Maf) into the southeastern part of the Gulf of Fonseca. The eastern boundary of the block was excluded from the inversions due to insufficient GNSS data (as well as ALOS data) to constrain its kinematics robustly. This model (g5b), while improving the determination of the rotation pole for the FONS block (reducing the uncertainty in the determined rotation by nearly 50 %), does not help in reducing the residuals of the GNSS velocities. Additionally, these residuals still display a certain pattern along the coasts of the Gulf of Fonseca, with a common eastward direction. Testing a very simple model, where the ESFZ is directly connected to a continuation of the Maf (g5c), resulted in improved statistical metrics. However, due to the small number of observations, the block definition may be unreliable.
Finally, we adopted an intermediate south-western boundary for the FONS block (Fig. 6 – g5d), following the Maf through the Gulf of Fonseca, connecting it with the Inf in El Salvador, and then connecting it directly through the San Miguel volcano and the El Triunfo fault (ETf). This model (g5d) appears to offer the most robust results, with a good balance in reducing GNSS residuals and determining the rotation pole (Table S4). Moreover, this limit seems to cross the areas with greater strain rates in the region, which lie north of the Inf and close to the San Miguel volcano (Fig. 4). It is worth noting that although models g5c and g5d seem to improve the internal residuals of the block (AMAT, SAIN, SLOR, CN21 in Fig. 6 – g5d), they do not help explain the velocity of PUCA, located near the Intipuca Fault (Inf). Furthermore, the area around the San Miguel volcano (VMIG) exhibits significant complexity, possibly due to volcano-tectonic interactions. This highlights the limitations of using rigid block models (without internal deformation) in areas where distributed deformation is expected across multiple structures, such as the Gulf of Fonseca region.
The results of our model with the described geometry align well with previous studies. For the San Miguel fault (SMf), we obtain a dextral slip rate of 2.7 ± 0.7 mm yr−1 (and a small extension of 0.9 ± 0.7 mm yr−1), comparable to the 4.3 mm yr−1 of Ellis et al. (2019) and the 3 ± 2.6 mm yr−1 of Staller (2014). Similarly, the determined almost-pure dextral 9.4 ± 0.7 mm yr−1 slip rate for the continuation of the Marrabios fault (Maf* in Fig. 6), is compatible with the 10.4 mm yr−1 determined by Ellis et al. (2019) in their kinematic model, and by Portela et al. (2024) from inverting GNSS and ALOS data with a simple dislocation model for a strike-slip fault. The western boundary of the FONS block shows a dextral strike-slip rate of 6.3 ± 0.7 mm yr−1 and an extension rate of 2.5 ± 0.7 mm yr−1. However, since this is an artificial boundary, we believe this deformation is distributed among the surrounding faults. The strain rates in this area show predominant extension (see Fig. 4).
5.2 The subducting slab
Our model predicts weak coupling (Φ∼0.2) at the shallowest depths (∼ 40 km) of the subduction slab off the coast of El Salvador, increasing westward toward Guatemala (Φ∼0.5). The slab creeps at greater depths, as we constrain it to do so. The coupling pattern and magnitude are consistent with previous block models that invert for coupling (Ellis et al., 2019; Franco et al., 2012) and with the occurrence of thrust earthquakes in the subduction zone (e.g., Ellis et al., 2018). Staller (2014) does not invert for slab coupling in their models due to resolution limitations; instead, they impose creep (Φ=0). In our model, the uncertainties in determining subduction coupling are very small (<0.1), but the robustness of these results is questionable, as discussed below, and particularly due to data resolution limitations (Sect. 5.3.1) and the existence of trade-offs between model parameters (Sect. 5.3.2).
Alvarado et al. (2011) suggests that, due to the estimated weak coupling, the interface does not exert sufficient traction to influence the motion of GNSS stations on land. However, given the availability of more data, we decided to analyse the influence of subduction coupling through forward models. This analysis was performed prior to our inversions, so we generate forward models using the motion poles of the COCO plate relative to the Caribbean plate (NNR-Morvel, Argus et al., 2011) and the FORE block pole by Staller (2014). It is important to note that minor discrepancies may arise due to the rotation poles used.
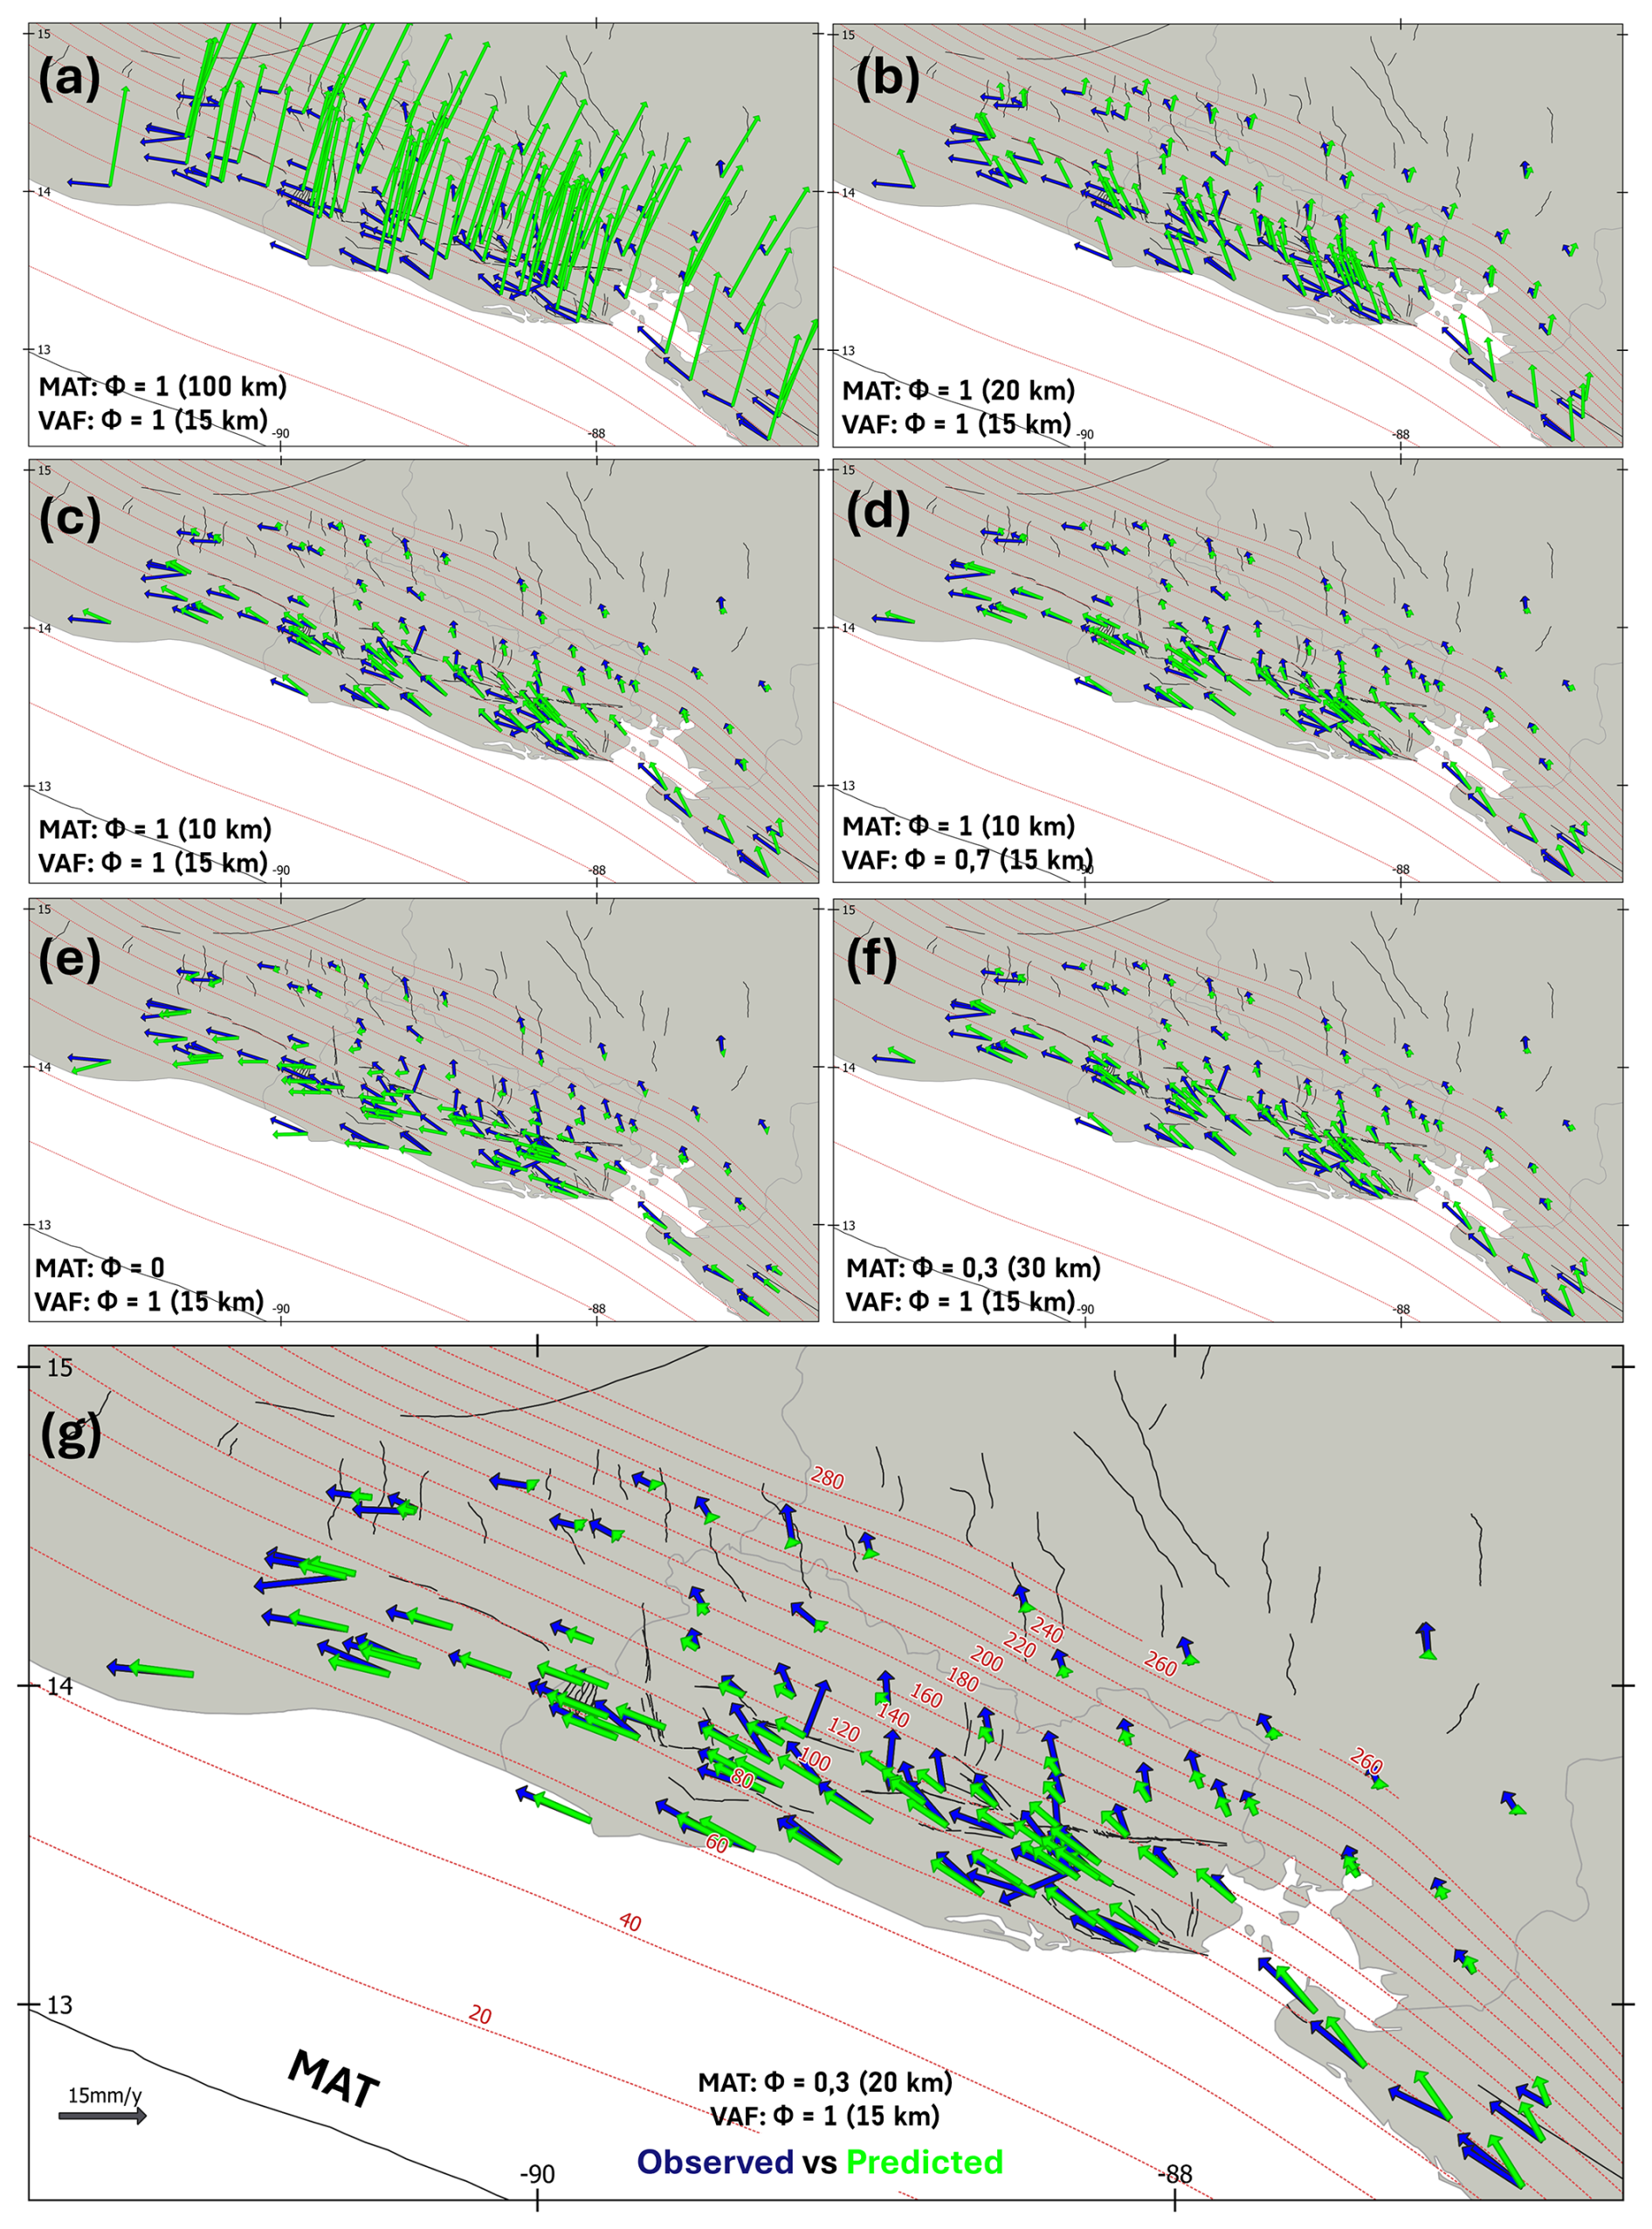
Figure 7Observed horizontal GNSS velocities (blue vectors) vs. predicted horizontal velocities (green vectors) in several forward models with different parameters. Faults are represented as black lines. Red lines show the subduction slab contours (with the depth in km labelled in red).
The forward models generated (Fig. 7) clearly show that the observed GNSS velocities are not consistent with strong subduction coupling. A fully coupled scenario (Φ=1) down to 100 km depth (Fig. 7a), an extreme case, predicts trench-normal velocities with a pattern and magnitude significantly different from the observations. When full coupling is limited to 20 km depth (Fig. 7b), the predicted velocity magnitudes match the observed ones better, though they still exhibit a greater northward (trench-normal) component. With full coupling down to 10 km (Fig. 7c), the fit is significantly improved. Modeling the subduction as fully decoupled (Fig. 7e) also produces a velocity pattern consistent with observations.
Additionally, coherent velocity patterns (Fig. 7f) can be obtained with greater coupling depths (20–30 km) by reducing the coupling degree (Φ=0.3). This highlights a clear trade-off in the kinematic models between the depth and degree of subduction coupling, as similar surface velocity patterns can be produced by different combinations of these parameters. Small variations in the coupling of the ESFZ (Fig. 7d), where both our results and previous studies suggest strong coupling, also generate compatible velocity patterns, indicating another potential trade-off in determining coupling in both the slab and the ESFZ. This is further discussed in Sect. 5.3.2.
Another potential source of error is the modelled subduction geometry. Previous kinematic studies have used the Slab-1 geometry (Hayes et al., 2012) to model the subduction slab, while our model follows the updated Slab-2 geometry (Hayes et al., 2018). We conducted a sensitivity analysis (Figs. S4 and S5) to evaluate how changes between the Slab-1 and Slab-2 models affect our data. The results suggest that if subduction coupling is restricted to the shallowest portion of the slab (Fig. S4), the impact of these changes would be minimal (<2 mm yr−1). However, if strong coupling extends to greater depths (80 km), geometric variations could have a more significant effect (>5 mm yr−1), particularly on the GNSS vertical component and ALOS LOS velocities (Fig. S5). As previously stated, GNSS vertical velocities in El Salvador do not show a clear spatial pattern or significant magnitudes (Fig. S1). However, half of these stations are within 10 km of active volcanoes (Portela et al., 2024), and more than half are based on episodic observations, which makes it especially challenging to derive robust vertical velocities related to tectonics. Past block models similarly ignore GNSS vertical velocities (Ellis et al., 2019; Franco et al., 2012; Garnier et al., 2022; Staller, 2014). We are somehow including them through the ALOS LOS velocities, although the vertical velocities decomposed from the ascending and descending geometries (Fig. S6) seem to be small (<2 mm yr−1).
In conclusion, the modelled subduction geometry can influence the results, and we do not have the resolution to resolve this issue using geodetic measurements. Recently, Gamboa-Canté et al. (2024), based on seismicity distribution, suggested that the actual subduction dip in El Salvador is steeper than that proposed by Hayes et al. (2018).
5.3 Limitations of the model
Here, we discuss some limitations identified in the kinematic models built with TDEFNODE, particularly regarding the resolution for constraining model parameters based on the distribution and density (resolution) of our data (Sect. 5.3.1) and the presence of trade-offs between the parameters in the inversions (Sect. 5.3.2). However, the models also present additional limitations that have been previously discussed, such as the simplification of tectonic boundaries in areas of distributed deformation (Sect. 5.1.2 and 5.1.3).
5.3.1 Data resolution
Our GNSS and ALOS data are concentrated in El Salvador, with their density decreasing towards Guatemala and Nicaragua (Fig. 2). As it is evident, these data are available only onshore. However, the MAT lies more than 100 km offshore from El Salvador. Therefore, it is necessary to evaluate the robustness of inverting these data to predict the subduction slab coupling ratio and kinematics. To address this, we perform multiple resolution tests to estimate the spatial resolution at which we can distinguish variations in coupling within the subduction slab. Specifically, we define (virtual) coupling patterns in the subduction slab and use forward models to predict the geodetic velocities these patterns would generate at our GNSS stations and ALOS data points. We then invert the predicted velocities to assess whether we can accurately reconstruct the original coupling ratio pattern. To focus solely on data resolution, we fix the block rotation poles and exclude other faults from the analysis.
The tests indicate that, with the available data, it is not possible to accurately reconstruct the original coupling pattern in bands parallel to the trench, alternating Φ=0 and Φ=1 every 20 km along-depth. Only the bands closest to the coast appear to be reproduced with some fidelity, particularly when ALOS data are incorporated (Fig. S7). This suggests that there is insufficient resolution to estimate variations along-depth in the subduction coupling ratio, except for the deep zone beneath El Salvador. However, this zone does not appear to be coupled (see Sect. 5.2).
Regarding coupling variations along-strike (in ∼ 50 km bands perpendicular to the trench, see Fig. S8), the models appear to better reconstruct the coupling pattern, even in areas near the trench, particularly when InSAR data are included. When testing a checkerboard pattern (Fig. S8), the results confirm that there is no resolution to predict coupling ratio variations along-depth.
Additionally, we test the limitations of the distribution of our data to changes along strike and depth of the coupling ratio and slip rates of the crustal faults. The crustal faults were modelled down to 15 km deep, with nodes every 5 km along-depth and approximately one node every 15 km along-strike at the surface. Two checkerboard patterns are tested: (1) a pattern of rectangles of ∼ 30 km along-strike and 7.5 km along-depth, extending down to 15 km deep; and (2) a pattern of rectangles of ∼ 15 km wide along the VAf and 3.75 km deep, extending down to 7.5 km (Fig. S9). The results indicate that, ideally, coupling variations of ∼ 15 km along-strike could be detected with both ALOS and GNSS data, reducing it to ∼ 30 km along-strike with GNSS data alone. The data appear to provide sufficient resolution to detect depth variations of ∼ 7.5 km, especially with the inclusion of ALOS data, though resolution is more limited for variations of 3.75 km.
Based on these findings, we allowed coupling variations every 7.5 km along-depth in the crustal faults. For along-strike variations, we followed tectonic and segmentation criteria in the ESFZ, ensuring that these segments were at least 15–30 km long. Additionally, in our inversions, we permitted only ∼ 50 km along-strike variations in the subduction slab.
Despite the density of ALOS velocities, we are still unable to close the gap identified in previous studies (e.g., Franco et al., 2012; Ellis et al., 2019) when solving for coupling variations along-depth in the slab. This limitation is primarily due to the large distance between the MAT and the shores of El Salvador. Since deformation can accumulate far offshore, geophysical or seafloor geodetic observations (e.g., Bürgmann and Chadwell, 2014) could be crucial for assessing the coupling degree of the Cocos subduction.
5.3.2 Trade-offs between parameters
Another limiting factor in our models is the existence of trade-offs between different parameters, which prevent their simultaneous inversion. This results in a greater constraint on the models, requiring certain parameters to be fixed, as they cannot be estimated during the inversion. Given the available data and defined geometry, we have identified several trade-offs between inversion parameters.
First, we detected a trade-off between the depth and degree of coupling allowed in the slab (T1), based on the forward models for the subduction slab (Sect. 5.2). This arises from the necessity of setting a fixed depth in the slab, assuming uniform coupling above that depth (see previous section). To assess the impact of this decision, we performed inversions using our final geometry, fixing different coupling depths and inverting for a homogeneous Φ up to that depth (while allowing for lateral variations). For simplicity, these tests only considered GNSS velocities. The results show that the inverted coupling is inversely proportional to the assumed coupling depth (Fig. 8).
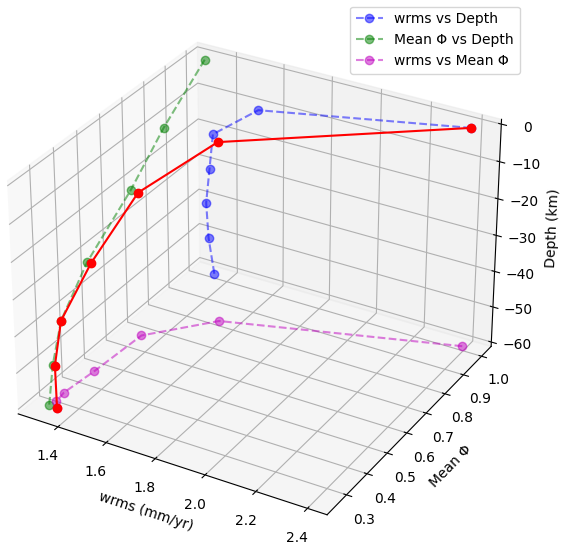
Figure 8Detected trade-offs between several parameters of the model: the maximum depth at which we let the slab to be coupled, the wrms of the geodetic data, and the mean predicted coupling (Φ) in the slab in the model. The red line shows the combined relationship.
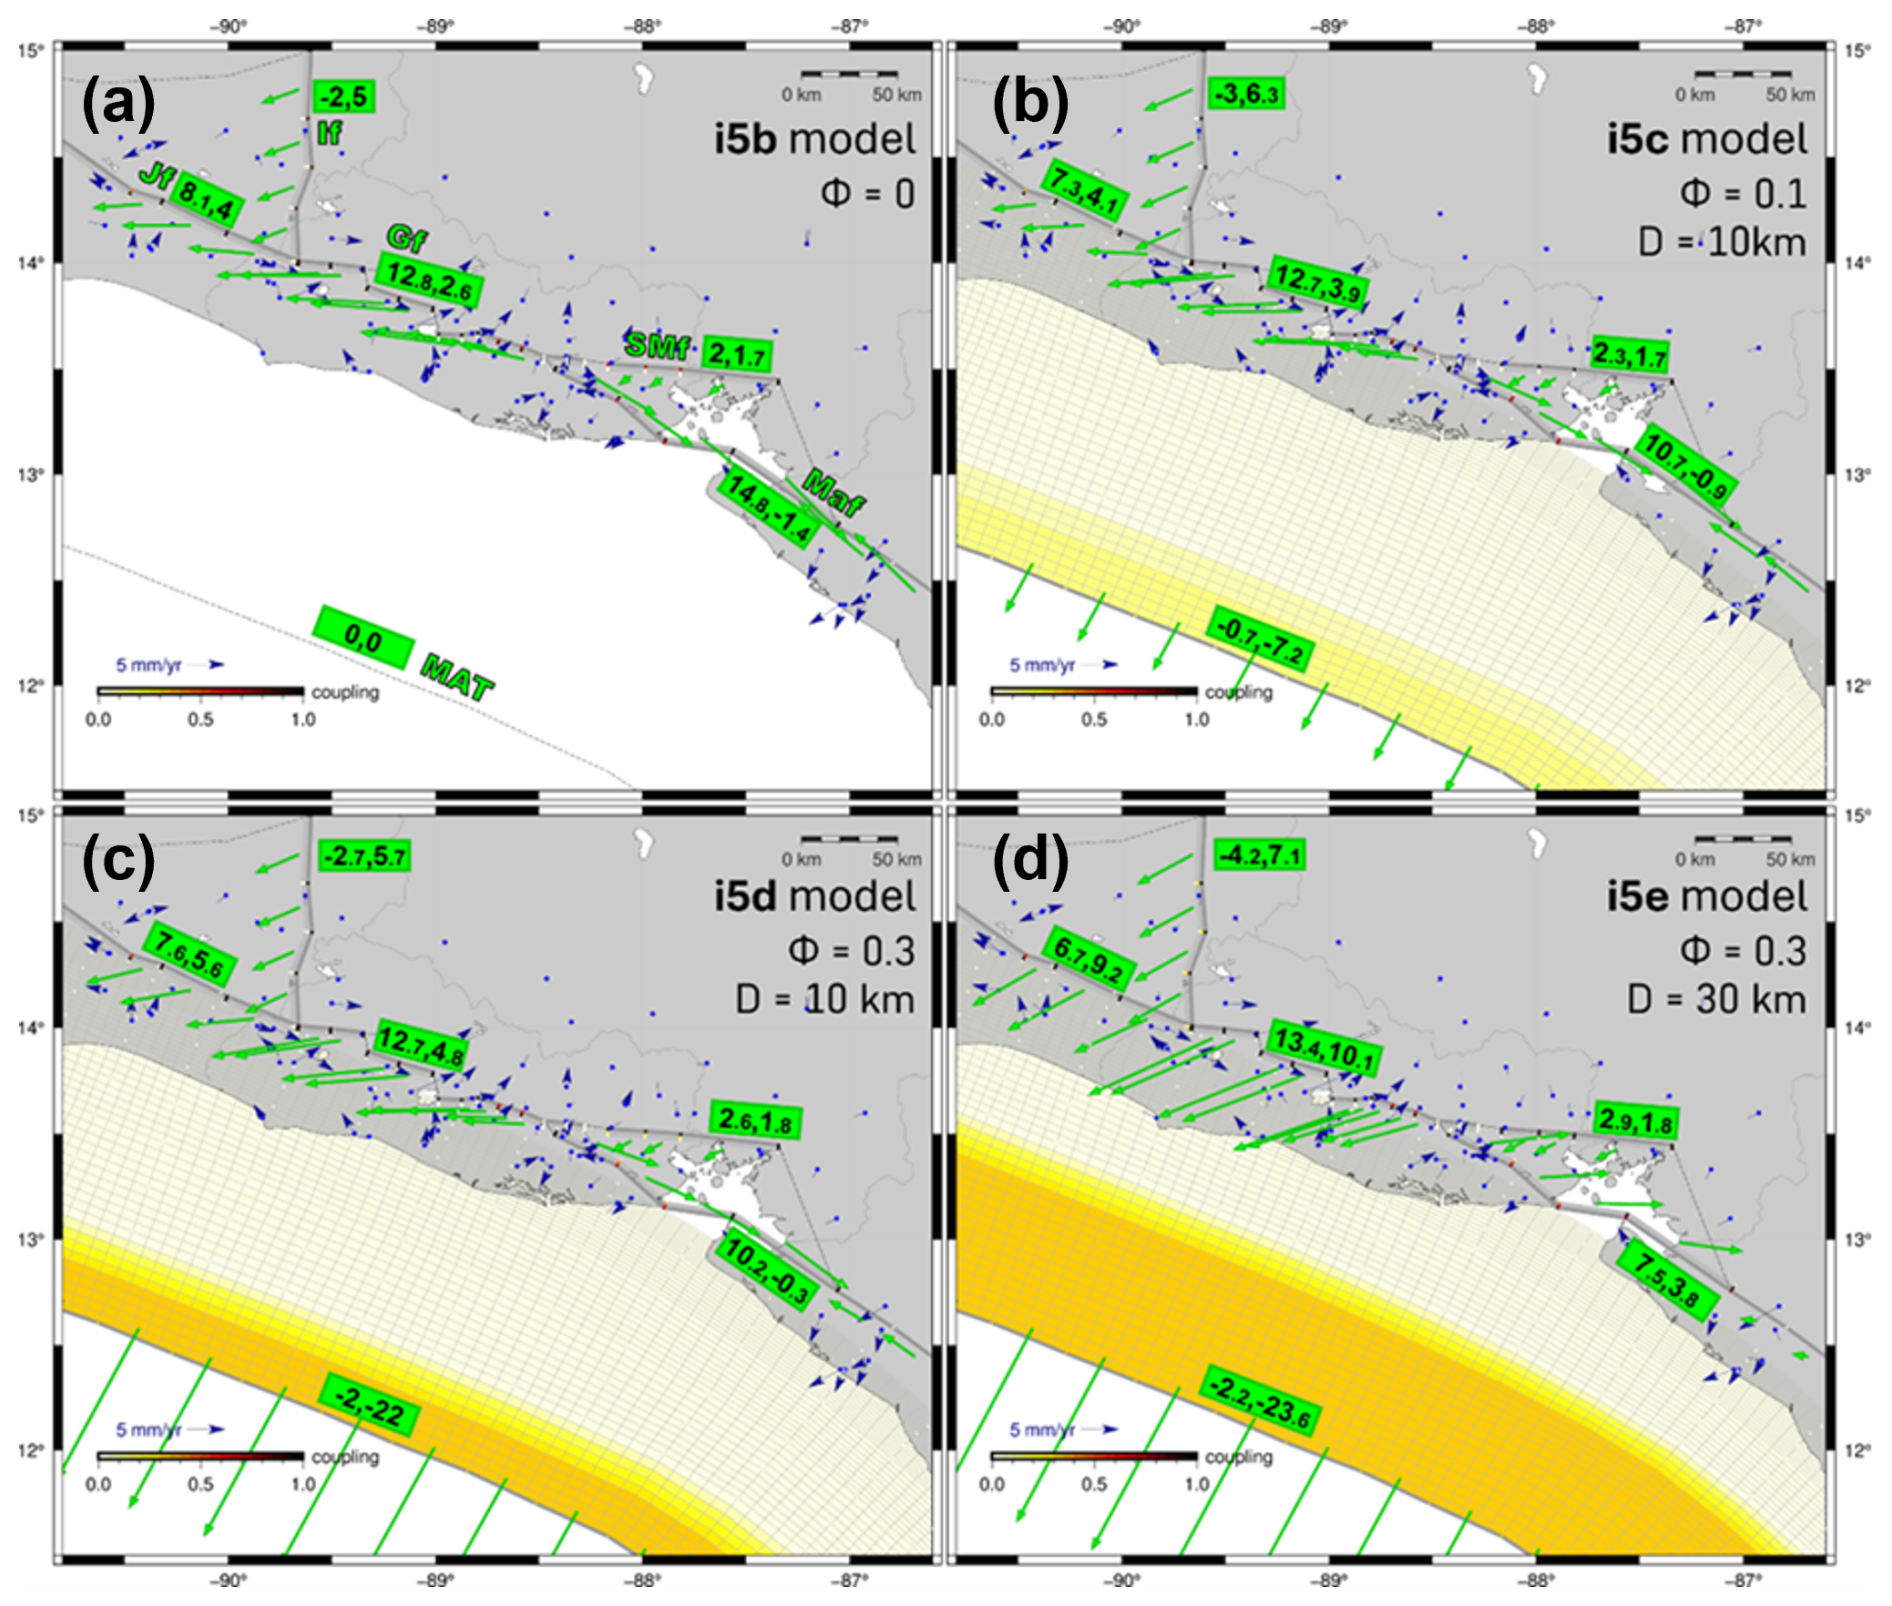
Figure 9Results of the inversions for different degrees and depths of fixed coupling in the subduction. The inverted slip rates are shown as green vectors, with some segments labeled (fault-parallel rate, fault-orthogonal rate). Negative values indicate left-lateral strike-slip and compression, respectively. The inverted coupling degree at the nodes is also displayed. The residuals (observed minus calculated velocities in the model) of the GNSS horizontal velocities are shown as blue vectors.
Additionally, when small coupling depths (<10 km) are set, the largest residuals in the inversions are observed (Fig. 8), and the slab presents a very high coupling value (Φ→1). The average slab coupling stabilizes around Φ∼0.3 at depths greater than 40 km. Moreover, beyond 20 km depth, no significant improvement in residuals (wrms) is observed when increasing the allowed coupling depth. Based on these findings, we decided to set the maximum coupling depth at approximately 40 km.
To perform the previous analysis (T1), we had to fix the rotation pole of the FORE block in the inversions due to the existence of another trade-off (T2) when simultaneously inverting (1) the FORE pole and (2) the degree of coupling in both the subduction zone and the ESFZ. Specifically, when these parameters are inverted together (Fig. S10), our models predict unrealistically high slip rates in the ESFZ, with significantly larger magnitudes, particularly in the fault-normal component. For instance, in this model, the San Vicente Fault exhibits a slip rate of 17.9 ± 0.8 mm yr−1 in the fault-parallel component and 15.0 ± 1.2 mm yr−1 in the fault-normal component. These results are inconsistent with geodetic observations (Portela et al., 2024; Staller et al., 2016), as the magnitude is unrealistically high. However, by fixing the FORE block pole, the values fall within expected ranges.
By setting different coupling depths (with homogeneous Φ), we observe (Fig. 9) that slip rates in the ESFZ increase in both magnitude and fault-normal components in direct proportion to the coupling depth in the slab. Additionally, in the forward models (Sect. 5.2), we also identified another trade-off (T3) between (1) the degree and depth of coupling in the slab (discussed earlier) and (2) the degree of coupling in the crustal faults of the ESFZ. These trade-offs are similar to those identified by Franco et al. (2012) and prevent us from simultaneously inverting the FORE block pole along with the slab and ESFZ coupling. Given that the slab coupling is less constrained, we decided to fix the FORE block pole using the values (, , ωz=0.419° Myr−1) obtained in an initial three-block inversion (CHOR, COCO, and FORE).
The recently published GNSS and InSAR geodetic data in El Salvador allows for a more detailed understanding of the regional fault kinematics through the construction of kinematic block models.
In our preferred model, the relative motion between the volcanic forearc and the Chortís block in El Salvador results in slip rates distributed between a northern ESFZ branch (following the Comecayo, Guaycume, and San Vicente faults) with 5.6–8.2 mm yr−1 of dextral strike-slip and 2.8–6.8 mm yr−1 of extension, and a southern branch (Berlin and Ayagualo faults) with 2.3–5.5 mm yr−1 of dextral strike-slip rates. Alternatively, considering a simpler model in the central ESFZ that includes only the northern fault branch -more robust but potentially less realistic- the model predicts 12–13 mm yr−1 of dextral strike-slip and 0.9–5.7 mm yr−1 of extensional slip along the northern ESFZ.
Dextral slip rates decrease westward (5.7 ± 0.6 mm yr−1 along the Jalpatagua fault) and eastward, where deformation is distributed between the San Miguel fault (2.7 ± 0.7 mm yr−1) and faults in southeastern El Salvador. The dextral slip rates increase again in Nicaragua, reaching 9.4 ± 0.7 mm yr−1 along the Marrabios fault. The model also predicts ∼ 9.2 ± 0.8 mm yr−1 of net extension across the graben system in eastern Guatemala and southern Honduras.
Our results suggest that volcanic arc faults are strongly coupled (Φ→1) within the uppermost ∼ 7.5 km of the crust. However, the models show trade-offs and resolution limitations when estimating the coupling ratio along the Cocos plate subduction slab. Nevertheless, the results indicate that coupling is weak and confined to the shallowest part of the slab offshore El Salvador (Φ≈0.2), increases westward toward Guatemala (Φ≈0.5), and decreases again to the east, approaching zero off the Gulf of Fonseca. Future seafloor geodetic observations (e.g., Evans et al., 2022) could provide valuable additional constraints.
Despite limitations arising from the sparse GNSS coverage in some areas and the short temporal span of available ALOS data, our models provide new quantitative constraints on the kinematics of the ESFZ and its boundaries. The ongoing densification of GNSS networks, along with current (Sentinel-1, ALOS-2, SAOCOM) and forthcoming (NISAR, ROSE-L) SAR missions, will improve future assessments of the spatial variability of interseismic deformation across El Salvador.
The strain rate calculations were performed using the open-source software StrainTool (https://doi.org/10.5281/zenodo.13142493, Anastasiou et al., 2024), available at: https://dsolab.github.io/StrainTool (last access: February 2026).
The kinematic block models were generated using the TDEFNODE software (McCaffrey, 2009), available at: https://robmccaffrey.github.io/TDEFNODE/TDEFNODE.html (last access: February 2026).
Figures were produced using the open-source Generic Mapping Tools (GMT) software package (Wessel et al., 2019; https://www.generic-mapping-tools.org/, last access: February 2026), the QGIS Geographic Information System (https://qgis.org/, last access: February 2026), and Python (https://www.python.org/, last access: February 2026).
All software used in this study is publicly available third-party software.
The GNSS and InSAR geodetic data used in this study were previously published in Portela et al. (2024). No new raw geodetic data were generated for this study. The fault geometries used to define the kinematic blocks are based on the mapped active faults in El Salvador from Martínez-Díaz et al. (2021) and the global active fault database of Styron et al. (2020). Readers are referred to the respective publications for detailed information on data processing and access. The subduction slab geometry corresponds to the Slab2 model (Hayes et al., 2018), which is publicly accessible at: https://www.sciencebase.gov/catalog/item/5aa1b00ee4b0b1c392e86467 (last access: February 2026).
The supplement related to this article is available online at https://doi.org/10.5194/se-17-369-2026-supplement.
JP, MBP, AS and CL planned the research; JP, MBP, AS, CL and BCM built and tested the models; JP, MBP, AS, CL, BCM, JAAG and JJMD analysed and discussed the results; JP wrote the manuscript draft; JP, MBP, AS, CL, BCM, JAAG and JJMD reviewed and edited the manuscript.
The contact author has declared that none of the authors has any competing interests.
Publisher's note: Copernicus Publications remains neutral with regard to jurisdictional claims made in the text, published maps, institutional affiliations, or any other geographical representation in this paper. The authors bear the ultimate responsibility for providing appropriate place names. Views expressed in the text are those of the authors and do not necessarily reflect the views of the publisher.
We want to express our gratitude to our colleagues at the Observatorio Ambiental del Ministerio de Medio Ambiente y Recursos Naturales de El Salvador (DGOA-MARN), and especially to Manuel Díaz, Douglas Hernández and Cecilia Polio. We thank the anonymous reviewers and the editorial team for their time and constructive feedback.
This research is part of the PhD thesis of J.P., supported by Grant FPU19/03929, funded by MCIN/AEI/10.13039/501100011033 and by “FSE invests in your future”; as well as by the (GeoActiva) Project CGL2017-83931-C3-3-P, funded by MCIN/AEI/10.13039/501100011033 and by “ERDF A way of making Europe”; as well as by project SARAI(PID2020-116540RB-C22) and the Project Twin-ER: Earthquake Risk Pilot Digital Twin (PID2023-149468NB-I00) with funding reference MCIU/AEI/10.13039/501100011033/FEDER, UE.
The article processing charges for this open-access publication were covered by the CSIC Open Access Publication Support Initiative through its Unit of Information Resources for Research (URICI).
This paper was edited by Stefano Tavani and reviewed by two anonymous referees.
Alonso-Henar, J., Álvarez-Gómez, J. A., and Martínez-Díaz, J. J.: Constraints for the recent tectonics of the El Salvador Fault Zone, Central America Volcanic Arc, from morphotectonic analysis, Tectonophysics, 623, 1–13, https://doi.org/10.1016/j.tecto.2014.03.012, 2014.
Altamimi, Z., Rebischung, P., Métivier, L., and Collilieux, X.: ITRF2014: A new release of the International Terrestrial Reference Frame modeling nonlinear station motions, Journal of Geophysical Research: Solid Earth, 121, 6109–6131, https://doi.org/10.1002/2016JB013098, 2016.
Alvarado, D., DeMets, C., Tikoff, B., Hernández, D., Wawrzyniec, T. F., Pullinger, C., Mattioli, G., Turner, H. L., Rodriguez, M., and Correa-Mora, F.: Forearc motion and deformation between El Salvador and Nicaragua: GPS, seismic, structural, and paleomagnetic observations, Lithosphere, 3, 3–21, https://doi.org/10.1130/L108.1, 2011.
Álvarez-Gómez, J. A., Meijer, P. T., Martínez-Díaz, J. J., and Capote, R.: Constraints from finite element modeling on the active tectonics of northern Central America and the Middle America Trench, Tectonics, 27, https://doi.org/10.1029/2007TC002162, 2008.
Álvarez-Gómez, J. A., Staller, A., Martínez-Díaz, J., Canora, C., Alonso-Henar, J., Insua-Arévalo, J., and Bejar, M.: Push-pull driving of the Central America Forearc in the context of the Cocos-Caribbean-North America triple junction, Scientific Reports, 9, https://doi.org/10.1038/s41598-019-47617-3, 2019.
Argus, D. F., Gordon, R. G., and DeMets, C.: Geologically current motion of 56 plates relative to the no-net-rotation reference frame, Geochemistry, Geophysics, Geosystems, 12, https://doi.org/10.1029/2011GC003751, 2011.
Anastasiou, D. G., Papanikolaou, X., Ganas, A., and Paradissis, D.: StrainTool: A software package to estimate strain tensor parameters, Zenodo [code], https://doi.org/10.5281/zenodo.13142493, 2024.
Authemayou, C., Brocard, G., Teyssier, C., Simon-Labric, T., Guttiérrez, A., Chiquín, E. N., and Morán, S.: The Caribbean–North America–Cocos Triple Junction and the dynamics of the Polochic–Motagua fault systems: Pull-up and zipper models, Tectonics, 30, https://doi.org/10.1029/2010TC002814, 2011.
Bagnardi, M. and Hooper, A.: Inversion of Surface Deformation Data for Rapid Estimates of Source Parameters and Uncertainties: A Bayesian Approach, Geochemistry, Geophysics, Geosystems, 19, 2194–2211, https://doi.org/10.1029/2018GC007585, 2018.
Bommer, J. J., Benito, M. B., Ciudad-Real, M., Lemoine, A., López-Menjívar, M. A., Madariaga, R., Mankelow, J., Méndez de Hasbun, P., Murphy, W., Nieto-Lovo, M., Rodríguez-Pineda, C. E., and Rosa, H.: The El Salvador earthquakes of January and February 2001: context, characteristics and implications for seismic risk, Soil Dynamics and Earthquake Engineering, 22, 389–418, https://doi.org/10.1016/S0267-7261(02)00024-6, 2002.
Bürgmann, R. and Chadwell, D.: Seafloor Geodesy, Annual Review of Earth and Planetary Sciences, 42, 509–534, https://doi.org/10.1146/annurev-earth-060313-054953, 2014.
Canora, C., Martínez-Díaz, J. J., Villamor, P., Berryman, K., Álvarez-Gómez, J. A., Pullinger, C., and Capote, R.: Geological and Seismological Analysis of the 13 February 2001 Mw 6.6 El Salvador Earthquake: Evidence for Surface Rupture and Implications for Seismic Hazard, Bulletin of the Seismological Society of America, 100, 2873–2890, https://doi.org/10.1785/0120090377, 2010.
Canora, C., Villamor, P., Martinez-Diaz, J., Berryman, K., Álvarez-Gómez, J., Capote, R., and Hernández, W.: Paleoseismic analysis of the San Vicente segment of the El Salvador Fault Zone, El Salvador, Central America, Geologica Acta, 10, 103–123, https://doi.org/10.1344/105.000001700, 2012.
Canora, C., Martinez-Diaz, J., Villamor, P., Staller, A., Berryman, K., Álvarez-Gómez, J., Capote, R., and Diaz, M.: Structural evolution of the El Salvador Fault Zone: An evolving fault system within a volcanic arc, Journal of Iberian Geology, 40, 471–488, https://doi.org/10.5209/rev_JIGE.2014.v40.n3.43559, 2014.
Chavez Hernandez, J. A., Lazecký, M., Šebesta, J., and Bakoň, M.: Relation between surface dynamics and remote sensor InSAR results over the Metropolitan Area of San Salvador, Natural Hazards, 103, 3661–3682, https://doi.org/10.1007/s11069-020-04150-1, 2020.
Correa-Mora, F., DeMets, C., Alvarado, D., Turner, H. L., Mattioli, G., Hernandez, D., Pullinger, C., Rodriguez, M., and Tenorio, C.: GPS-derived coupling estimates for the Central America subduction zone and volcanic arc faults: El Salvador, Honduras and Nicaragua, Geophysical Journal International, 179, 1279–1291, https://doi.org/10.1111/j.1365-246X.2009.04371.x, 2009.
Cosenza-Muralles, A. B., Lasserre, C., DeMets, C., Zan, F. D., Shau, R., Ansari, H., Lyon-Caen, H., Feigl, K., and Parizzi, A.: Large Scale Observations and Modeling of Strain Partitioning in Guatemala from SAR Interferometry, ESS Open Archive, https://doi.org/10.1002/essoar.10510185.1, 2022.
Dach, R., Andritsch, F., Arnold, D., Bertone, S., Fridez, P., Jäggi, A., Jean, Y., Maier, A., Mervart, L., Meyer, U., Orliac, E., Geist, E., Prange, L., Scaramuzza, S., Schaer, S., Sidorov, D., Susnik, A., Villiger, A., Walser, P., and Thaller, D.: Bernese GNSS Software Version 5.2, Boris Portal, https://doi.org/10.7892/boris.72297, 2015.
DeMets, C., Gordon, R. G., and Argus, D. F.: Geologically current plate motions, Geophysical Journal International, 181, 1–80, https://doi.org/10.1111/j.1365-246X.2009.04491.x, 2010.
Ebmeier, S. K., Biggs, J., Mather, T. A., and Amelung, F.: On the lack of InSAR observations of magmatic deformation at Central American volcanoes, Journal of Geophysical Research: Solid Earth, 118, 2571–2585, https://doi.org/10.1002/jgrb.50195, 2013.
Elliott, J. R., Walters, R. J., and Wright, T. J.: The role of space-based observation in understanding and responding to active tectonics and earthquakes, Nature Communications, 7, 13844, https://doi.org/10.1038/ncomms13844, 2016.
Ellis, A., DeMets, C., Briole, P., Cosenza, B., Flores, O., Graham, S. E., Guzmán-Speziale, M., Hernández, D., Kostoglodov, V., LaFemina, P., Lord, N., Lasserre, C., Lyon-Caen, H., Rodriguez Maradiaga, M., McCaffrey, R., Molina, E., Rivera, J., Rogers, R., and Staller, A.: GPS constraints on deformation in northern Central America from 1999 to 2017, Part 1 – Time-dependent modelling of large regional earthquakes and their post-seismic effects, Geophysical Journal International, 214, 2177–2194, https://doi.org/10.1093/gji/ggy249, 2018.
Ellis, A., DeMets, C., McCaffrey, R., Briole, P., Cosenza Muralles, B., Flores, O., Guzmán-Speziale, M., Hernández, D., Kostoglodov, V., LaFemina, P., Lord, N., Lasserre, C., Lyon-Caen, H., Rodriguez Maradiaga, M., Molina, E., Rivera, J., Rogers, R., Staller, A., and Tikoff, B.: GPS constraints on deformation in northern Central America from 1999 to 2017, Part 2: Block rotations and fault slip rates, fault locking and distributed deformation, Geophysical Journal International, 218, 729–754, https://doi.org/10.1093/gji/ggz173, 2019.
Evans, E. L., Minson, S. E., and Chadwell, C. D.: Imaging the next Cascadia earthquake: optimal design for a seafloor GNSS-A network, Geophysical Journal International, 228, 944–957, https://doi.org/10.1093/gji/ggab360, 2022.
Fang, J., Wright, T. J., Johnson, K. M., Ou, Q., Styron, R., Craig, T. J., Elliott, J. R., Hooper, A., and Zheng, G.: Strain Partitioning in the Southeastern Tibetan Plateau From Kinematic Modeling of High-Resolution Sentinel-1 InSAR and GNSS, Geophysical Research Letters, 51, e2024GL111199, https://doi.org/10.1029/2024GL111199, 2024
Farr, T. G., Rosen, P. A., Caro, E., Crippen, R., Duren, R., Hensley, S., Kobrick, M., Paller, M., Rodriguez, E., Roth, L., Seal, D., Shaffer, S., Shimada, J., Umland, J., Werner, M., Oskin, M., Burbank, D., and Alsdorf, D.: The Shuttle Radar Topography Mission, Reviews of Geophysics, 45, https://doi.org/10.1029/2005RG000183, 2007.
Franco, A., Lasserre, C., Lyon-Caen, H., Kostoglodov, V., Molina, E., Guzman-Speziale, M., Monterosso, D., Robles, V., Figueroa, C., Amaya, W., Barrier, E., Chiquin, L., Moran, S., Flores, O., Romero, J., Santiago, J. A., Manea, M., and Manea, V. C.: Fault kinematics in northern Central America and coupling along the subduction interface of the Cocos Plate, from GPS data in Chiapas (Mexico), Guatemala and El Salvador, Geophysical Journal International, 189, 1223–1236, https://doi.org/10.1111/j.1365-246X.2012.05390.x, 2012.
Gamboa-Canté, C., Arroyo-Solórzano, M., Benito, B., Aguilar, J., Arroyo, I. G., Camacho-Astigarrabia, E., Castro, D., Flores, O., Linkimer, L., Marroquin, M. G., Mixco-Durán, L., Strauch, W., Talavera, E., Valle, G., and Yani-Quiyuch, R.: Seismicity in Central America (1520–2020) and Earthquake catalog compilation for seismic hazard assessments, Bulletin of Earthquake Engineering, 22, 7201–7234, https://doi.org/10.1007/s10518-024-02059-9, 2024.
Garibaldi, N., Tikoff, B., and Hernández, W.: Neotectonic deformation within an extensional stepover in El Salvador magmatic arc, Central America: Implication for the interaction of arc magmatism and deformation, Tectonophysics, 693, 327–339, https://doi.org/10.1016/j.tecto.2016.05.015, 2016.
Garnier, B., Tikoff, B., Flores, O., Jicha, B., DeMets, C., Cosenza-Muralles, B., Hernandez, D., Marroquin, G., Mixco, L., and Hernandez, W.: An integrated structural and GPS study of the Jalpatagua fault, southeastern Guatemala, Geosphere, 17, 201–225, https://doi.org/10.1130/GES02243.1, 2020.
Garnier, B., Tikoff, B., Flores, O., Jicha, B., DeMets, C., Cosenza-Muralles, B., Hernandez, W., and Greene, D.: Deformation in Western Guatemala Associated With the NAFCA (North America-Central American Forearc-Caribbean) Triple Junction: Neotectonic Strain Localization Into the Guatemala City Graben, Tectonics, 41, e2021TC006739, https://doi.org/10.1029/2021TC006739, 2022.
GEBCO Compilation Group: GEBCO 2020 Grid, British Oceanographic Data Centre, National Oceanography Centre, NERC, UK, https://doi.org/10.5285/a29c5465-b138-234d-e053-6c86abc040b9, 2020.
Hayes, G. P., Wald, D. J., and Johnson, R. L.: Slab1.0: A three-dimensional model of global subduction zone geometries, Journal of Geophysical Research: Solid Earth, 117, https://doi.org/10.1029/2011JB008524, 2012.
Hayes, H., Moore, M., Portner, P., Hearne, H., Flamme, F., Furtney, F., and Smoczyk, S.: Slab2, a comprehensive subduction zone geometry model, Science, 362, 58–61, https://doi.org/10.1126/science.aat4723, 2018.
Huang, Z., Zhou, Y., Qiao, X., Zhang, P., and Cheng, X.: Kinematics of the ∼ 1000 km Haiyuan fault system in northeastern Tibet from high-resolution Sentinel-1 InSAR velocities: Fault architecture, slip rates, and partitioning, Earth and Planetary Science Letters, 583, 117450, https://doi.org/10.1016/j.epsl.2022.117450, 2022.
ISC: International Seismological Centre, ISC Bulletin, https://doi.org/10.31905/D808B830, 2023.
Kobayashi, D., LaFemina, P., Geirsson, H., Chichaco, E., Abrego, A. A., Mora, H., and Camacho, E.: Kinematics of the western Caribbean: Collision of the Cocos Ridge and upper plate deformation, Geochemistry, Geophysics, Geosystems, 15, 1671–1683, https://doi.org/10.1002/2014GC005234, 2014.
Kowalski, Z., Graniczny, M., Przyłucka, M., Šebesta, J., and Chavez, A.: Vertical ground motions of the San Salvador metropolitan area (AMSS) seen at the ALOS InSAR data, https://fringe2017.esa.int/page_session238.php (last access: 2024), 2017.
LaFemina, P., Dixon, T. H., Govers, R., Norabuena, E., Turner, H., Saballos, A., Mattioli, G., Protti, M., and Strauch, W.: Fore-arc motion and Cocos Ridge collision in Central America, Geochemistry, Geophysics, Geosystems, 10, https://doi.org/10.1029/2008GC002181, 2009.
Legrand, D., Marroquín, G., DeMets, C., Mixco, L., García, A., Villalobos, M., Ferrés, D., Gutiérrez, E., Escobar, D., Torres, R., and Hernández, D.: Active deformation in the San Salvador extensional stepover, El Salvador from an analysis of the April–May 2017 earthquake sequence and GPS data, Journal of South American Earth Sciences, 104, 102854, https://doi.org/10.1016/j.jsames.2020.102854, 2020.
Legrand, D., Perton, M., Spica, Z., Jon, J., Alatorre-Ibargüengoitia, M., Peiffer, L., Campion, R., Valdés, C., Caballero-Jiménez, G., Vargas-Zamudio, K., Espíndola, J. M., and De la Cruz-Reyna, S.: The Magma plumbing system and seismo-tectonics of the Guatemala–Mexico triple junction as revealed by the seismicity of the Tacaná volcano before and after the 2017 Mw8.2 Chiapas earthquake, Geophysical Journal International, 242, ggaf167, https://doi.org/10.1093/gji/ggaf167, 2025.
Lemrabet, L.: Apport et spécificités des mesures d'interférométrie radar à l'échelle continentale: cas d'étude des déformations actuelles du plateau tibétain oriental, Université Claude Bernard, https://theses.hal.science/tel-04390093v1 (last access: 23 February 2026), 2022.
Lemrabet, L., Doin, M.-P., Lasserre, C., and Durand, P.: Referencing of Continental-Scale InSAR-Derived Velocity Fields: Case Study of the Eastern Tibetan Plateau, Journal of Geophysical Research: Solid Earth, 128, e2022JB026251, https://doi.org/10.1029/2022JB026251, 2023.
Marconato, L., Audin, L., Doin, M.-P., Nocquet, J.-M., Jarrin, P., Rolandone, F., Harrichhausen, N., Mothes, P., Mora-Páez, H., and Cisneros, D.: Internal deformation of the North Andean Sliver in Ecuador and southern Colombia observed by InSAR, Geophysical Journal International, 239, 1557–1575, https://doi.org/10.1093/gji/ggae338, 2024.
Martínez-Díaz, J., Álvarez-Gómez, J., Benito, B., and Hernandez, D.: Triggering of destructive earthquakes in El Salvador, Geology, 32, 65–68, https://doi.org/10.1130/G20089.1, 2004.
Martínez-Díaz, J. J., Álvarez-Gómez, J. A., Staller, A., Alonso-Henar, J., Canora, C., Insúa-Arévalo, J. M., Tsige, M., Villamor, P., Herrero-Barbero, P., Hernández-Moreno, C., Hernández, W., Hernández, D., Marroquín, G., and Mixco, L.: Active faults of El Salvador, Journal of South American Earth Sciences, 105, 103038, https://doi.org/10.1016/j.jsames.2020.103038, 2021.
Maubant, L., Radiguet, M., Pathier, E., Doin, M.-P., Cotte, N., Kazachkina, E., and Kostoglodov, V.: Interseismic coupling along the Mexican subduction zone seen by InSAR and GNSS, Earth and Planetary Science Letters, 586, 117534, https://doi.org/10.1016/j.epsl.2022.117534, 2022.
McCaffrey, R.: Crustal Block Rotations and Plate Coupling, in: Plate Boundary Zones, edited by: Stein, S. and Freymueller, J. T., American Geophysical Union, 22 pp., https://doi.org/10.1029/GD030p0101, 2002.
McCaffrey, R.: Time-dependent inversion of three-component continuous GPS for steady and transient sources in northern Cascadia, Geophysical Research Letters, 36, https://doi.org/10.1029/2008GL036784, 2009.
Meade, B. J., Hager, B. H., McClusky, S. C., Reilinger, R. E., Ergintav, S., Lenk, O., Barka, A., and Özener, H.: Estimates of Seismic Potential in the Marmara Sea Region from Block Models of Secular Deformation Constrained by Global Positioning System Measurements, Bulletin of the Seismological Society of America, 92, 208–215, https://doi.org/10.1785/0120000837, 2002.
Plafker, G.: Tectonic aspects of the guatemala earthquake of 4 february 1976, Science, 193, 1201–1208, https://doi.org/10.1126/science.193.4259.1201, 1976.
Portela, J., Staller, A., Béjar-Pizarro, M., Hamling, I. J., and Hernández, D.: Tectonic deformation in El Salvador from combined InSAR and GNSS data, Tectonophysics, 230364, https://doi.org/10.1016/j.tecto.2024.230364, 2024.
Portela, J., Staller, A., Béjar-Pizarro, M., Martínez-Díaz, J. J., Álvarez-Gómez, J. A., and Khazaradze, G.: New Insights on the Crustal Deformation in the Eastern Betics From Densified GNSS Data, Tectonics, 44, e2024TC008381, https://doi.org/10.1029/2024TC008381, 2025.
Pritchard, M. E., Biggs, J., Wauthier, C., Sansosti, E., Arnold, D. W. D., Delgado, F., Ebmeier, S. K., Henderson, S. T., Stephens, K., Cooper, C., Wnuk, K., Amelung, F., Aguilar, V., Mothes, P., Macedo, O., Lara, L. E., Poland, M. P., and Zoffoli, S.: Towards coordinated regional multi-satellite InSAR volcano observations: results from the Latin America pilot project, Journal of Applied Volcanology, 7, 5, https://doi.org/10.1186/s13617-018-0074-0, 2018.
Rodríguez, M., DeMets, C., Rogers, R., Tenorio, C., and Hernandez, D.: A GPS and modelling study of deformation in northern Central America, Geophysical Journal International, 178, 1733–1754, https://doi.org/10.1111/j.1365-246X.2009.04251.x, 2009.
Schiek, C. G., Hurtado, J. M., Velasco, A. A., Buckley, S. M., and Escobar, D.: Determining Volcanic Deformation at San Miguel Volcano, El Salvador by Integrating Radar Interferometry and Seismic Analyses, American Geophysical Union, Fall Meeting 2008, abstract id. U51A-0018, 2008.
Shen, Z.-K., Jackson, D. D., and Kagan, Y. Y.: Implications of Geodetic Strain Rate for Future Earthquakes, with a Five-Year Forecast of M5 Earthquakes in Southern California, Seismological Research Letters, 78, 116–120, https://doi.org/10.1785/gssrl.78.1.116, 2007.
Shen, Z.-K., Wang, M., Zeng, Y., and Wang, F.: Optimal Interpolation of Spatially Discretized Geodetic Data, Bulletin of the Seismological Society of America, 105, 2117–2127, https://doi.org/10.1785/0120140247, 2015.
Staller, A.: Modelización de las deformaciones corticales en El Salvador (Centroamérica) mediante la integración de datos geodésicos (GPS), geológicos y sismológicos, Archivo Digital UPM, https://doi.org/10.20868/UPM.thesis.29172, 2014.
Staller, A., Martínez-Díaz, J. J., Benito, B., Alonso-Henar, J., Hernández, D., Hernández-Rey, R., and Díaz, M.: Present-day crustal deformation along the El Salvador Fault Zone from ZFESNet GPS network, Tectonophysics, 670, 66–81, https://doi.org/10.1016/j.tecto.2015.12.017, 2016.
Styron, R., García-Pelaez, J., and Pagani, M.: CCAF-DB: the Caribbean and Central American active fault database, Natural Hazards and Earth System Sciences, 20, 831–857, https://doi.org/10.5194/nhess-20-831-2020, 2020.
Wang, H., Wright, T. J., Yu, Y., Lin, H., Jiang, L., Li, C., and Qiu, G.: InSAR reveals coastal subsidence in the Pearl River Delta, China, Geophysical Journal International, 191, 1119–1128, https://doi.org/10.1111/j.1365-246X.2012.05687.x, 2012.
Wang, H., Wright, T. J., Liu-Zeng, J., and Peng, L.: Strain Rate Distribution in South-Central Tibet From Two Decades of InSAR and GPS, Geophysical Research Letters, 46, 5170–5179, https://doi.org/10.1029/2019GL081916, 2019.
Watson, A. R., Elliott, J. R., Lazecký, M., Maghsoudi, Y., McGrath, J. D., and Walters, R. J.: An InSAR-GNSS Velocity Field for Iran, Geophysical Research Letters, 51, e2024GL108440, https://doi.org/10.1029/2024GL108440, 2024.
Wessel, P., Luis, J. F., Uieda, L., Scharroo, R., Wobbe, F., Smith, W. H. F., and Tian, D.: The Generic Mapping Tools Version 6, Geochemistry, Geophysics, Geosystems, 20, 5556–5564, https://doi.org/10.1029/2019GC008515, 2019.
White, R. A.: Tectonic implications of upper-crustal seismicity in Central America, edited by: Slemmons, D. B., Engdahl, E. R., Zoback, M. D., and Blackwell, D. D., Geological Society of America, https://doi.org/10.1130/DNAG-CSMS-NEO.323, 1991.
Woods, K., Wallace, L. M., Williams, C. A., Hamling, I. J., Webb, S. C., Ito, Y., Palmer, N., Hino, R., Suzuki, S., Savage, M. K., Warren-Smith, E., and Mochizuki, K.: Spatiotemporal Evolution of Slow Slip Events at the Offshore Hikurangi Subduction Zone in 2019 Using GNSS, InSAR, and Seafloor Geodetic Data, Journal of Geophysical Research: Solid Earth, 129, e2024JB029068, https://doi.org/10.1029/2024JB029068, 2024.
Wu, D.-L., Ge, W.-P., Liu, S.-Z., Yuan, D.-Y., Zhang, B., and Wei, C.-M.: Present-Day 3D Crustal Deformation of the Northeastern Tibetan Plateau From Space Geodesy, Geophysical Research Letters, 51, e2023GL106143, https://doi.org/10.1029/2023GL106143, 2024.
Xu, J., Gao, Z., Liu, J., Yan, W., Guo, H., Liu, R., Yi, C., and Xu, D.: InSAR observations reveal interactions between seismic and aseismic slip during and after the 2016 Mw 6.6 Muji earthquake, Scientific Reports, 15, 15116, https://doi.org/10.1038/s41598-025-98880-6, 2025.
Zhang, Y.-P., Wang, Y., Wang, W.-T., Shao, Z.-G., Xu, B.-B., He, X.-H., Feng, W.-P., Yao, Q., Yang, Y.-Q., Ma, H.-S., and Zhang, P.-Z.: Active Block Tectonics and Intracontinental Deformation Within the India-Eurasia Oblique Convergence Zone, Tectonics, 44, e2025TC009029, https://doi.org/10.1029/2025TC009029, 2025.